Multi-Sensor InSAR Analysis of Progressive Land Subsidence over the Coastal City of Urayasu, Japan


Department of Urban Environment Systems, Chiba University, Chiba 263-8522, Japan
*
Author to whom correspondence should be addressed.
Remote Sens. 2018, 10(8), 1304; https://0-doi-org.brum.beds.ac.uk/10.3390/rs10081304
Submission received: 7 July 2018
/
Revised: 10 August 2018
/
Accepted: 16 August 2018
/
Published: 18 August 2018
(This article belongs to the Special Issue Urban Deformation Monitoring using Persistent Scatterer Interferometry and SAR tomography)
Abstract
:In earthquake-prone areas, identifying patterns of ground deformation is important before they become latent risk factors. As one of the severely damaged areas due to the 2011 Tohoku earthquake in Japan, Urayasu City in Chiba Prefecture has been suffering from land subsidence as a part of its land was built by a massive land-fill project. To investigate the long-term land deformation patterns in Urayasu City, three sets of synthetic aperture radar (SAR) data acquired during 1993–2006 from European Remote Sensing satellites (ERS-1/-2 (C-band)), during 2006–2010 from the Phased Array L-band Synthetic Aperture Radar onboard the Advanced Land Observation Satellite (ALOS PALSAR (L-band)) and from 2014–2017 from the ALOS-2 PALSAR-2 (L-band) were processed by using multitemporal interferometric SAR (InSAR) techniques. Leveling survey data were also used to verify the accuracy of the InSAR-derived results. The results from the ERS-1/-2, ALOS PALSAR and ALOS-2 PALSAR-2 data processing showed continuing subsidence in several reclaimed areas of Urayasu City due to the integrated effects of numerous natural and anthropogenic processes. The maximum subsidence rate of the period from 1993 to 2006 was approximately 27 mm/year, while the periods from 2006 to 2010 and from 2014 to 2017 were approximately 30 and 18 mm/year, respectively. The quantitative validation results of the InSAR-derived deformation trend during the three observation periods are consistent with the leveling survey data measured from 1993 to 2017. Our results further demonstrate the advantages of InSAR measurements as an alternative to ground-based measurements for land subsidence monitoring in coastal reclaimed areas.
1. Introduction
Land subsidence is one of the most serious environmental problems in many urban areas around the world [1]. In particular, coastal areas, which contain young and compressible deposits, are often vulnerable to subsidence caused by either anthropogenic or natural factors [2,3]. This phenomenon is evident in the coastal city of New Orleans, LA in the USA [4], Jakarta in Indonesia [5,6], Ho Chi Minh in Vietnam [7], Bangkok in Thailand [8], Shanghai and Shenzhen in China [9,10], Venice in Italy [11] and in the western Netherlands [12]. Continuous land subsidence causes remarkable economic losses in the form of building damages leading to high maintenance costs [13]. Thus, identifying land deformation trends is a crucial task to maintain the sustainability of coastal urban areas [14].
Over the past two decades, land subsidence monitoring has been significantly improved by the use of interferometric synthetic aperture radar (InSAR) techniques [15]. Although the traditional methods (i.e., global positioning system (GPS) and leveling) can also provide precise measurements, they cannot acquire dense ground displacement measurements with a large-scale coverage in a short time and at a low cost [16]. The advanced time-series InSAR techniques, such as persistent scatterers interferometry (PSI) and the small baseline subset (SBAS) technique, can achieve results in better spatial and temporal resolutions with higher precision [17,18,19,20]. Furthermore, the increase in the available synthetic aperture radar (SAR) satellites with different temporal and spatial resolutions has provided a great opportunity for researchers to perform long-term geohazard monitoring by combining observations from those satellites [21].
Urayasu City is located in the Tokyo Bay area, where more than 70% of the area was reclaimed from 1964 to 1980 [22,23]. The reclamation was performed using the sand and soil dredged from the seabed off the coast of Urayasu [24]. In addition, Urayasu City is located in an earthquake-prone area, which increases the risk of land subsidence due to the combined effects of seismicity and the natural consolidation of soil [25,26]. On 11 March 2011, a devastating earthquake of moment magnitude Mw 9.0 occurred off the coast of Tohoku, Japan, which caused severe damage to buildings and infrastructures and created large ground settlements of up to 60 cm in the reclaimed areas [27,28]. This catastrophic event has attracted a great deal of attention from researchers and organizations. The Geospatial Information Authority of Japan (GSI) carried out a leveling survey, comparing the results with light detection and ranging (LiDAR) survey data, and concluded that the surface subsidence was not caused only by the soil liquefaction but also by pro-earthquake consolidation [29]. Konagai et al. [30] mapped the soil subsidence using LiDAR data taken before and after the earthquake. Pasquali et al. [31] measured the land subsidence during 2006–2010 using both the Environment Satellite Advanced Sythetic Aperture Radar (ENVISAT ASAR) and the Advanced Land Observation Satellite Phased Array L-band Synthetic Aperture Radar ALOS PALSAR data. ElGharbawi and Tamura [32] estimated the liquefaction induced deformation using ALOS PALSAR images spanning from August 2006 to April 2011. Nigorikawa and Asaka [24] conducted a leveling survey from April 2011 to April 2013 and found accelerated land settlement only in the reclaimed land areas rather than in the natural alluvial low land and pointed out the settlement may still be ongoing. However, the previous studies mainly focused on the soil liquefaction-induced subsidence during the earthquake, and the long-term spatiotemporal evolution of land subsidence before and after the earthquake has not yet been clearly identified.
In this study, we used three different SAR datasets, the European Remote Sensing satellites (ERS-1/-2) and ALOS PALSAR & ALOS-2 PALSAR-2 to identify the trends of land subsidence dynamics in Urayasu City over a period of 24 years by using multitemporal InSAR techniques. Moreover, the InSAR results were compared with leveling survey data. The observed results may provide useful information for identifying and understanding the behavior of the slow subsidence phenomenon over a long-time period, which plays an important role in future risk mitigation strategies.
2. Study Area
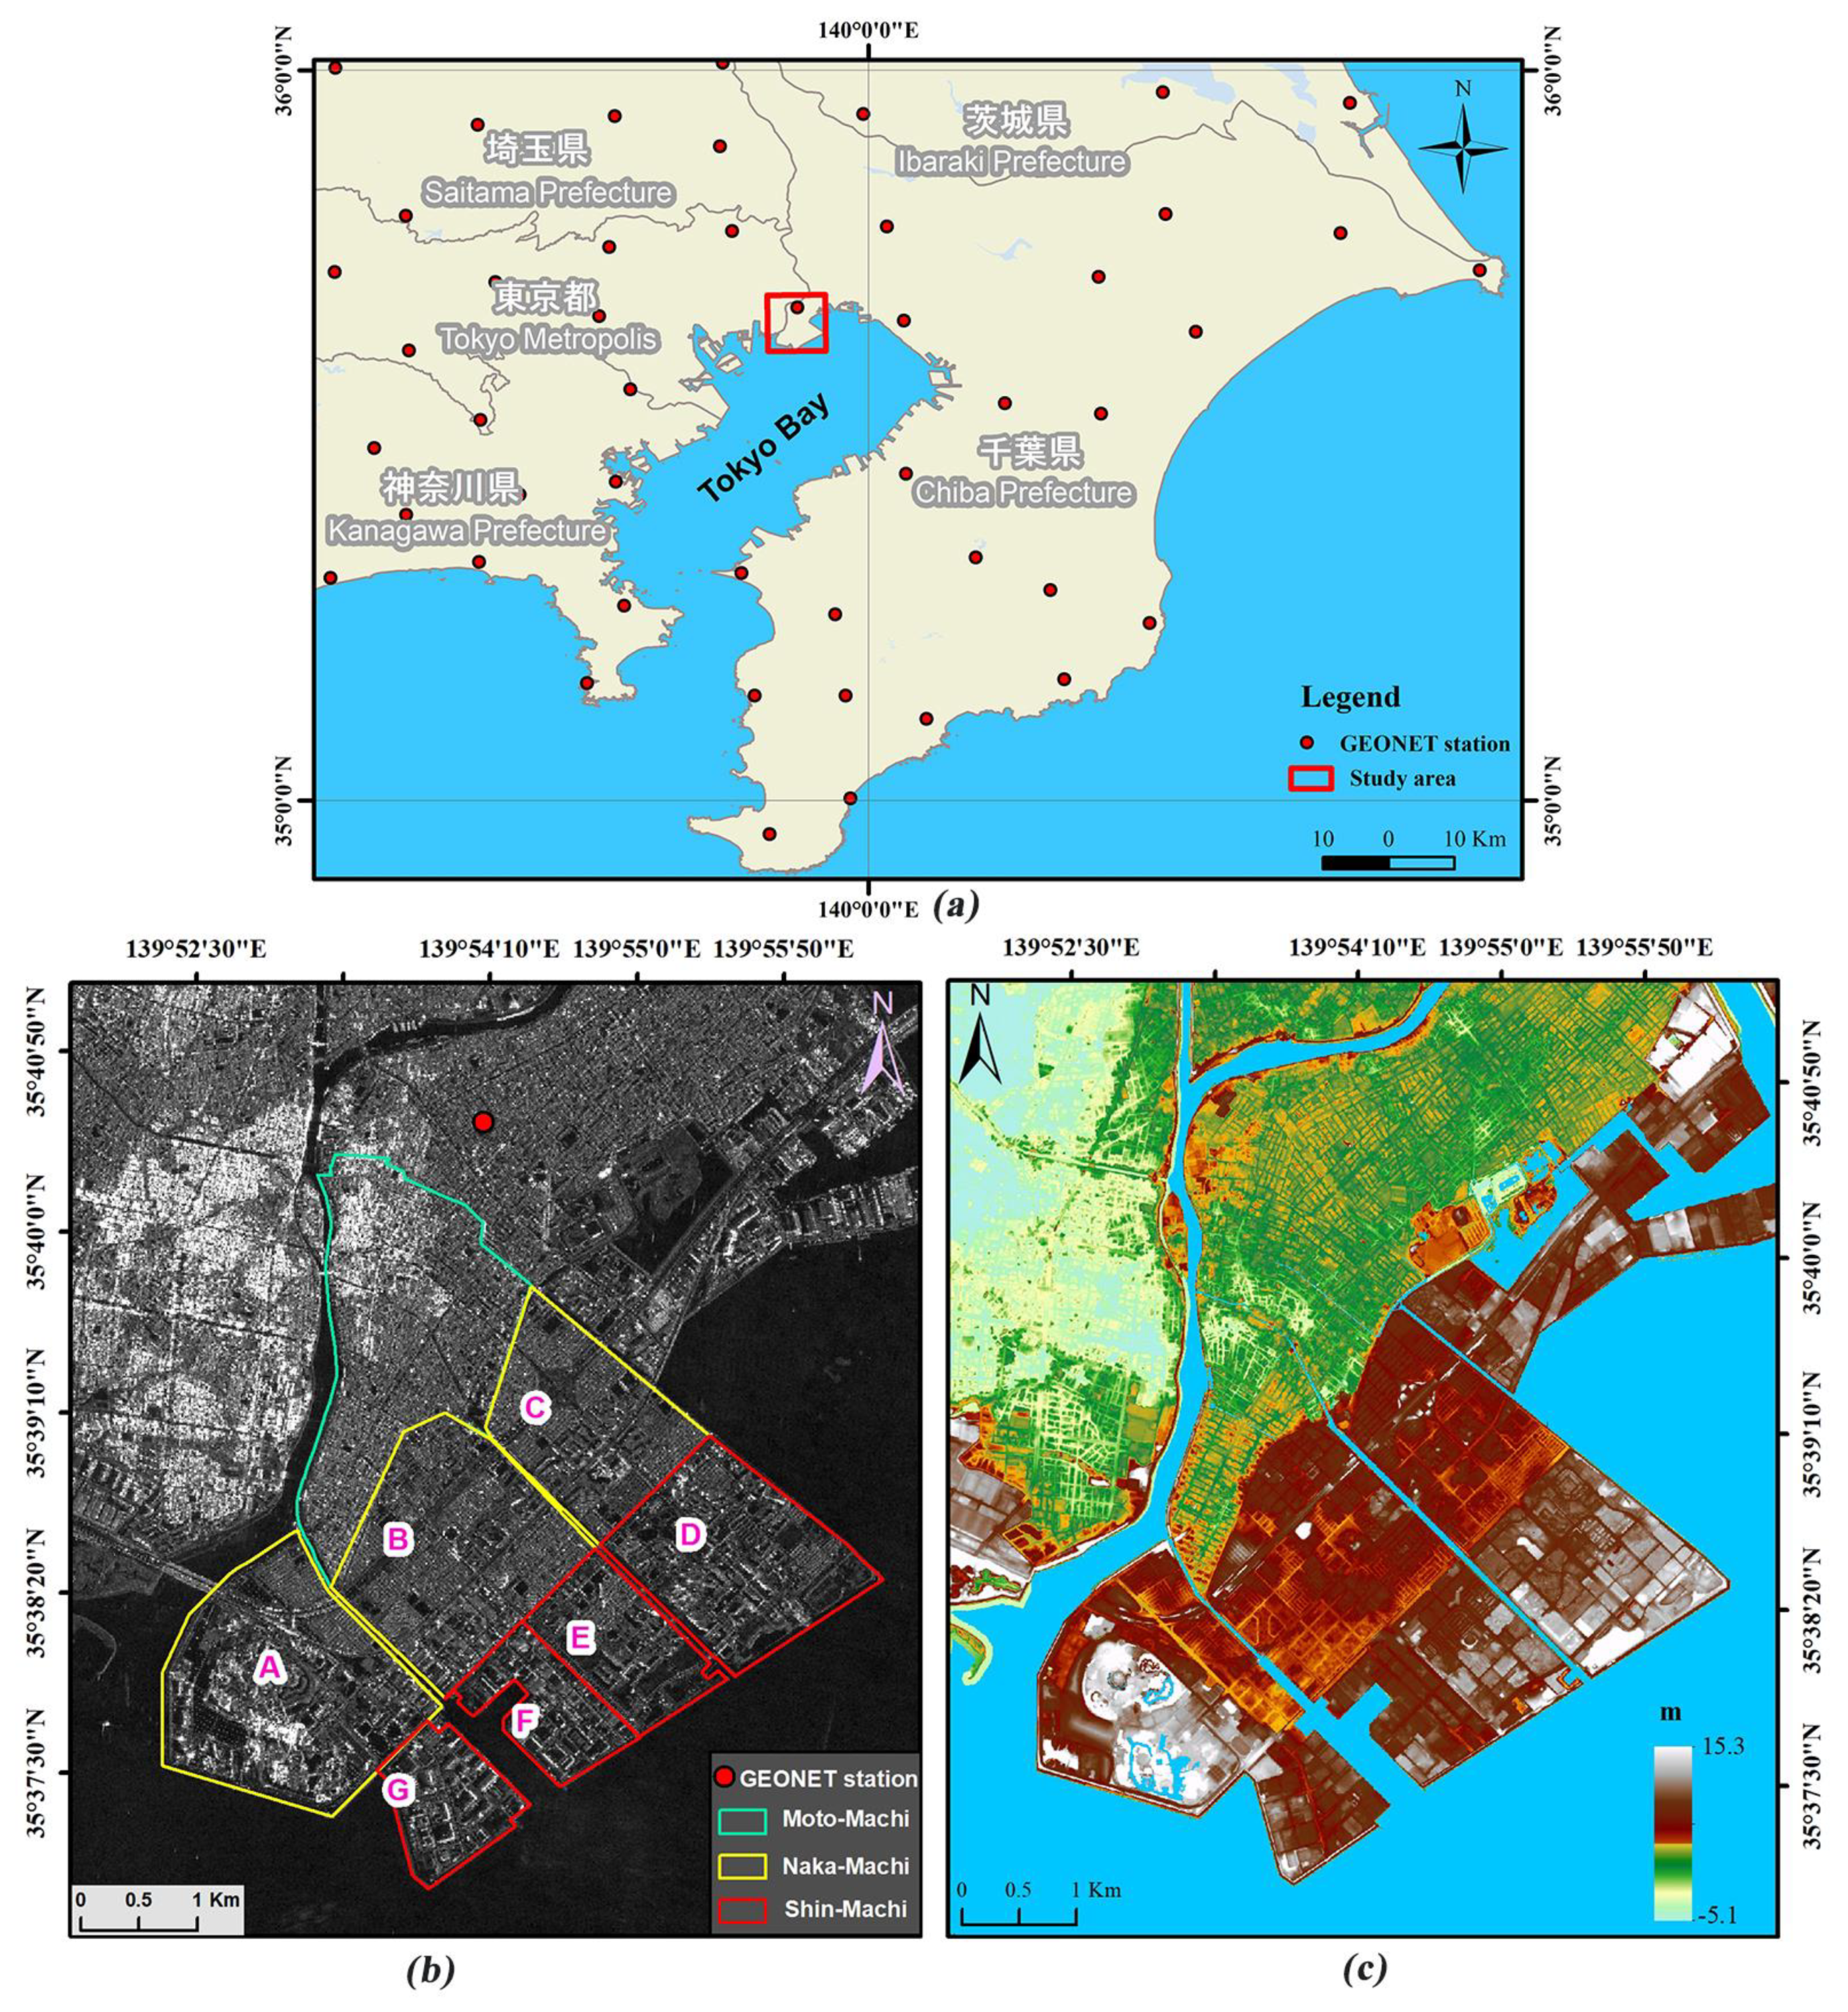
Urayasu City is located in the Tokyo Bay area of Chiba Prefecture, from 139°56′22″E to 139°52′20″E and from 35°37′N to 35°40′23″N. The total area is 16.98 km2, and the total population was 167,950 in February 2018 [33]. As shown in Figure 1, Urayasu City is divided into three areas, namely, Moto-Machi (old town), Naka-Machi (central town) and Shin-Machi (new town). Moto-Machi is a naturally formed Holocene lowland, and the other two areas were reclaimed from 1964 to 1980 [34,35]. Figure 1b and Table 1 shows the distribution and other detailed information of those reclaimed areas. The elevation in the old coastline area of Moto-Machi is approximately 0 to 2 m and gradually increases towards the coastal levee, becoming especially high in Sogo Park of Akemi district and the Tokyo Disney resort area (Figure 1c). The thickness of the alluvial soil layers varies from 20 m in the Moto-Machi area to 60–80 m in the Naka-Machi and Shin-Machi areas, which indicates the complexity of the soft soil distribution in those areas [22,23].
3. Data Sets and Methods
3.1. Data Sets
In this study, the SAR data collected by the ERS-1/-2 and ALOS-1/-2 satellites were used to monitor the long-term deformation pattern of Urayasu City. The ERS-1/-2 data were provided by the European Space Agency (ESA) and the PALSAR & PALSAR-2 data by the Japan Aerospace Exploration Agency (JAXA). A total of 52 C-band ERS-1/-2 single look complex (SLC) scenes were acquired from the track/frame 489/2889 during the period from May 1993 to February 2006. Note that there is a data gap in 1994 and 1995 due to the limited acquisitions of ERS-1 data; 24 L-band ALOS PALSAR SLC data were acquired from the path/frame 58/2900 during the period from June 2006 to December 2010; 13 L-band ALOS-2 PALSAR-2 SLC data were acquired from the path/frame 18/2900 during the period from December 2014 to November 2017. The detailed acquisition parameters of these three SAR data are given in Table 2.
A 5-m high-resolution digital elevation model (DEM) provided by the GSI was used as a reference to remove the topographic phase in the multitemporal InSAR processing [36]. The daily GPS data observed by the GPS earth observation network system was used as reference point, and the leveling survey measurement data was used to validate the InSAR derived deformation. The daily GPS data was provided by the GSI of Japan. The leveling survey measurements have been conducted by the Chiba Prefecture on an annual basis, and the results are publicly available at their official website [37]. The archived leveling survey data before 2008 was obtained from the Chiba Prefectural Archives.
3.2. Methodology
The multitemporal InSAR methodologies involve the use of multiple SAR datasets to overcome the limitations of conventional InSAR (e.g., spatial and temporal decorrelations and atmospheric disturbance) and measure the land surface displacements with high precision [38,39,40]. In this study, the PSI and the SBAS were applied to the archived (i.e., ERS-1/-2 and ALOS PALSAR) and recent (i.e., ALOS-2 PALSAR-2) SAR data. The PSI method utilizes a time-series of radar images to identify high coherent points, the so-called persistent scatterers (PS) [17,18,19]; the SBAS method uses distributed scatterers from all available SAR images with corresponding small baselines in order to reduce the spatial decorrelation and obtain the time-series displacements [20]. The reason for using both techniques relies on the fact that the PSI applicability is limited to temporally uniform rates of displacement, while the SBAS has the ability to capture strong nonlinearities in the study area [41]. The PSI has a high sensitivity to slow displacements but suffers severe limitations in the capability to measure ‘‘fast” deformation phenomena, and the PS density is usually low in vegetated, forested and low-reflectivity areas (e.g. very smooth surfaces) [42], while the SBAS performs better in nonurban vegetated areas, and also in areas with high deformation rates [43,44].
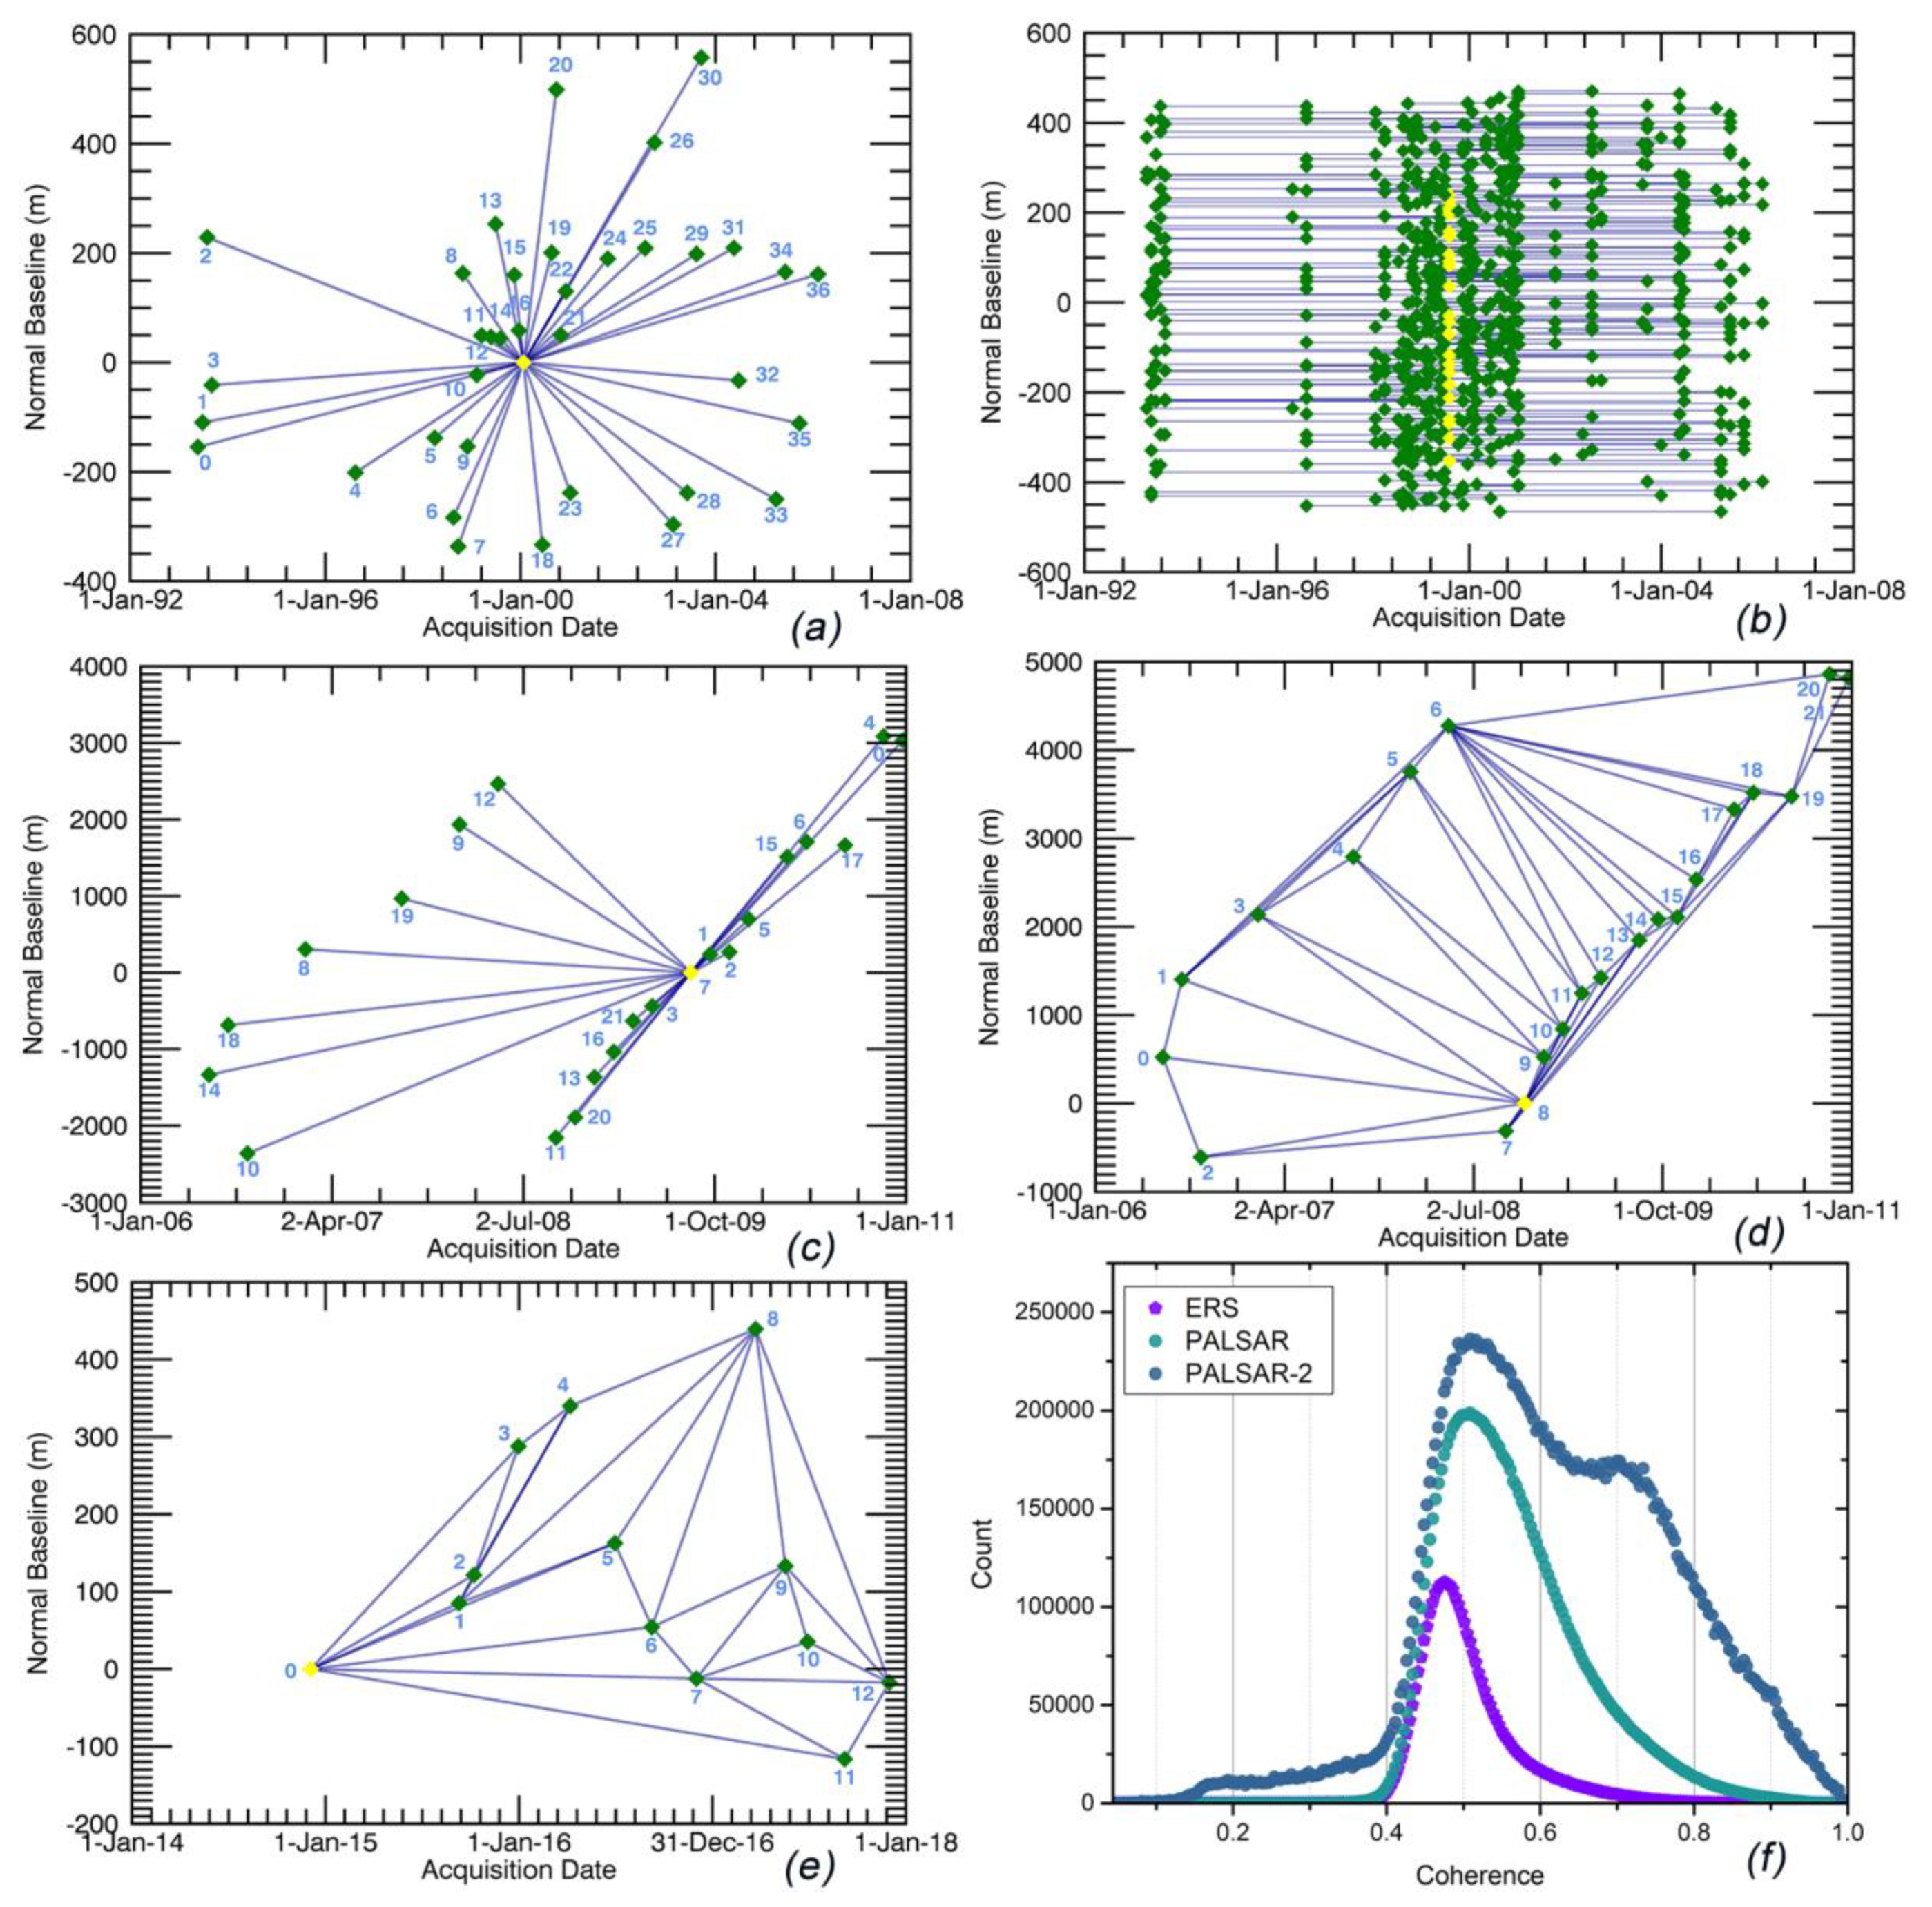
As shown in Figure 2, the ERS-1/-2 and PALSAR data were processed using both the PSI and SBAS methods. Due to the limited number of PALSAR-2 acquisitions, we used only the SBAS method. The SARscape® Modules (5.4) for ENVI (5.4) software suite (HARRIS Geospatial Solutions, Broomfield, CO, USA) was employed to perform the interferometric analyses. For the ERS-1/-2 data, we used the latest precise orbit products provided by the ESA to correct the orbit inaccuracies [45] and generate a total of 424 interferograms, including 36 for PSI processing and 388 for SBAS processing pairs (Figure 2a,b). The PSI pairs were generated with respect to the master image from 24 January 2000. The normal baselines range from 22 m to 557 m. A custom atmospheric filtering was performed with a low pass spatial filter with a 1.2 km × 1.2 km window and a temporal high pass filter at 365 days. The mean coherence threshold of 0.56 was used to identify the PS candidates. To obtain more accurate displacement measurements, the GPS base station was used as a reference point in the geocoding process (Figure 1b). The SBAS pairs were generated with respect to the multi-master images and by setting spatial and temporal threshold criteria. The threshold criteria for the absolute mean of the normal baselines was 210 m and that for the absolute mean of the temporal baselines was 937 days. Moreover, the image acquired on 2 August 1999 formed the largest number of interferometric pairs, when used as a master scene. For that reason, it was chosen as a reference (i.e., super master image). Therefore, all the slave scenes are co-registered to this reference geometry (Figure 2b). To increase the signal-to-noise ratio of the interferograms, a multi-looking factor of one in range and five in azimuth was used, producing a ground resolution of about 20 m. The topographic phases in both the PSI and SBAS interferograms were removed using the 5-m DEM data. After that, we visually checked the intermediate products (i.e., flattened and filtered (wrapped) interferograms and the unwrapped phases) to detect possible errors, which were caused by strong orbit inaccuracy, non-coherent pairs, atmospheric artefacts, residual topography etc., and 23 interferometric pairs were discarded from further processing. For refinement and re-flattening, we selected 45 reference points where the unwrapped phase value was close to zero and the flat areas were identified from the unwrapped interferograms and the topographic map. The linear inversion model was used to estimate the residual height and the displacement velocity for both the PSI and SBAS processing [20].
For the PALSAR data, we used both fine beam single (FBS) polarization and fine beam double (FBD) polarization images, with an HH polarization mode, and generated a total of 150 interferograms, including 21 for PSI processing and 129 for SBAS processing pairs (Figure 2c,d). The PSI pairs were generated with respect to the master image of 5 August 2009. The normal baselines range from 237 m to 3084 m. The same atmospheric filter which was used for the ERS-1/-2 PSI processing was also used to remove the atmospheric phase components. The mean coherence threshold of 0.75 was used to identify the PS candidates. The same GPS base station used for the ERS-1/-2 PSI processing was used as a reference point in the geocoding process. The SBAS pairs were generated with respect to the multi-master images and by setting spatial and temporal threshold criteria. The threshold criteria for the absolute mean of the normal baselines was 1084 m and that for the absolute mean of the temporal baselines was 453 days. The image acquired on 20 March 2009 was chosen as a super master image (Figure 2d). A multi-looking factor of one in range and five in azimuth was used, producing a ground resolution of about 15 m. The topographic phase in both the PSI and SBAS interferograms was removed using the same DEM used for the ERS data. Four interferometric pairs were removed due to the unwrapping errors. The same reference points used in ERS-1/-2 SBAS processing were also used for the refinement and re-flattening. The same linear inversion model was used for both the PSI and SBAS processing.
The histogram of the average coherence for the PALSAR-2 data shows the relatively good coherence of PALSAR-2 when compared with the ERS-1/-2 and PALSAR data (Figure 2f). For the PALSAR-2 data, we generated 78 interferograms for SBAS processing (Figure 2e), with respect to the multi-master images. The threshold criteria for the absolute mean of the normal baselines was 182 m and that for the absolute mean of the temporal baselines was 386 days. The image acquired on 4 December 2014 was chosen as a super master image. A multi-looking factor of six in range and seven in azimuth was used, producing a ground resolution of about 15 m. The topographic phase was removed using the same DEM used for the PALSAR data processing. To smooth the differential phase, the Goldstein filter was applied [46]. The minimum cost flow (MCF) network and Delaunay 3D method were employed to unwrap the differential interferograms [47,48] with an unwrapping coherence threshold of 0.35. The same reference points used in PALSAR SBAS processing was also used for the refinement and re-flattening. The linear inversion model was used in the processing. All the final displacement measurements were measured in the satellite line of sight (LOS) direction and were geocoded in the WGS84 reference ellipsoid with a 25-m ground resolution.
4. Results
4.1. Time-Series Analysis of the ERS-1/-2 Data from May 1993 to February 2006
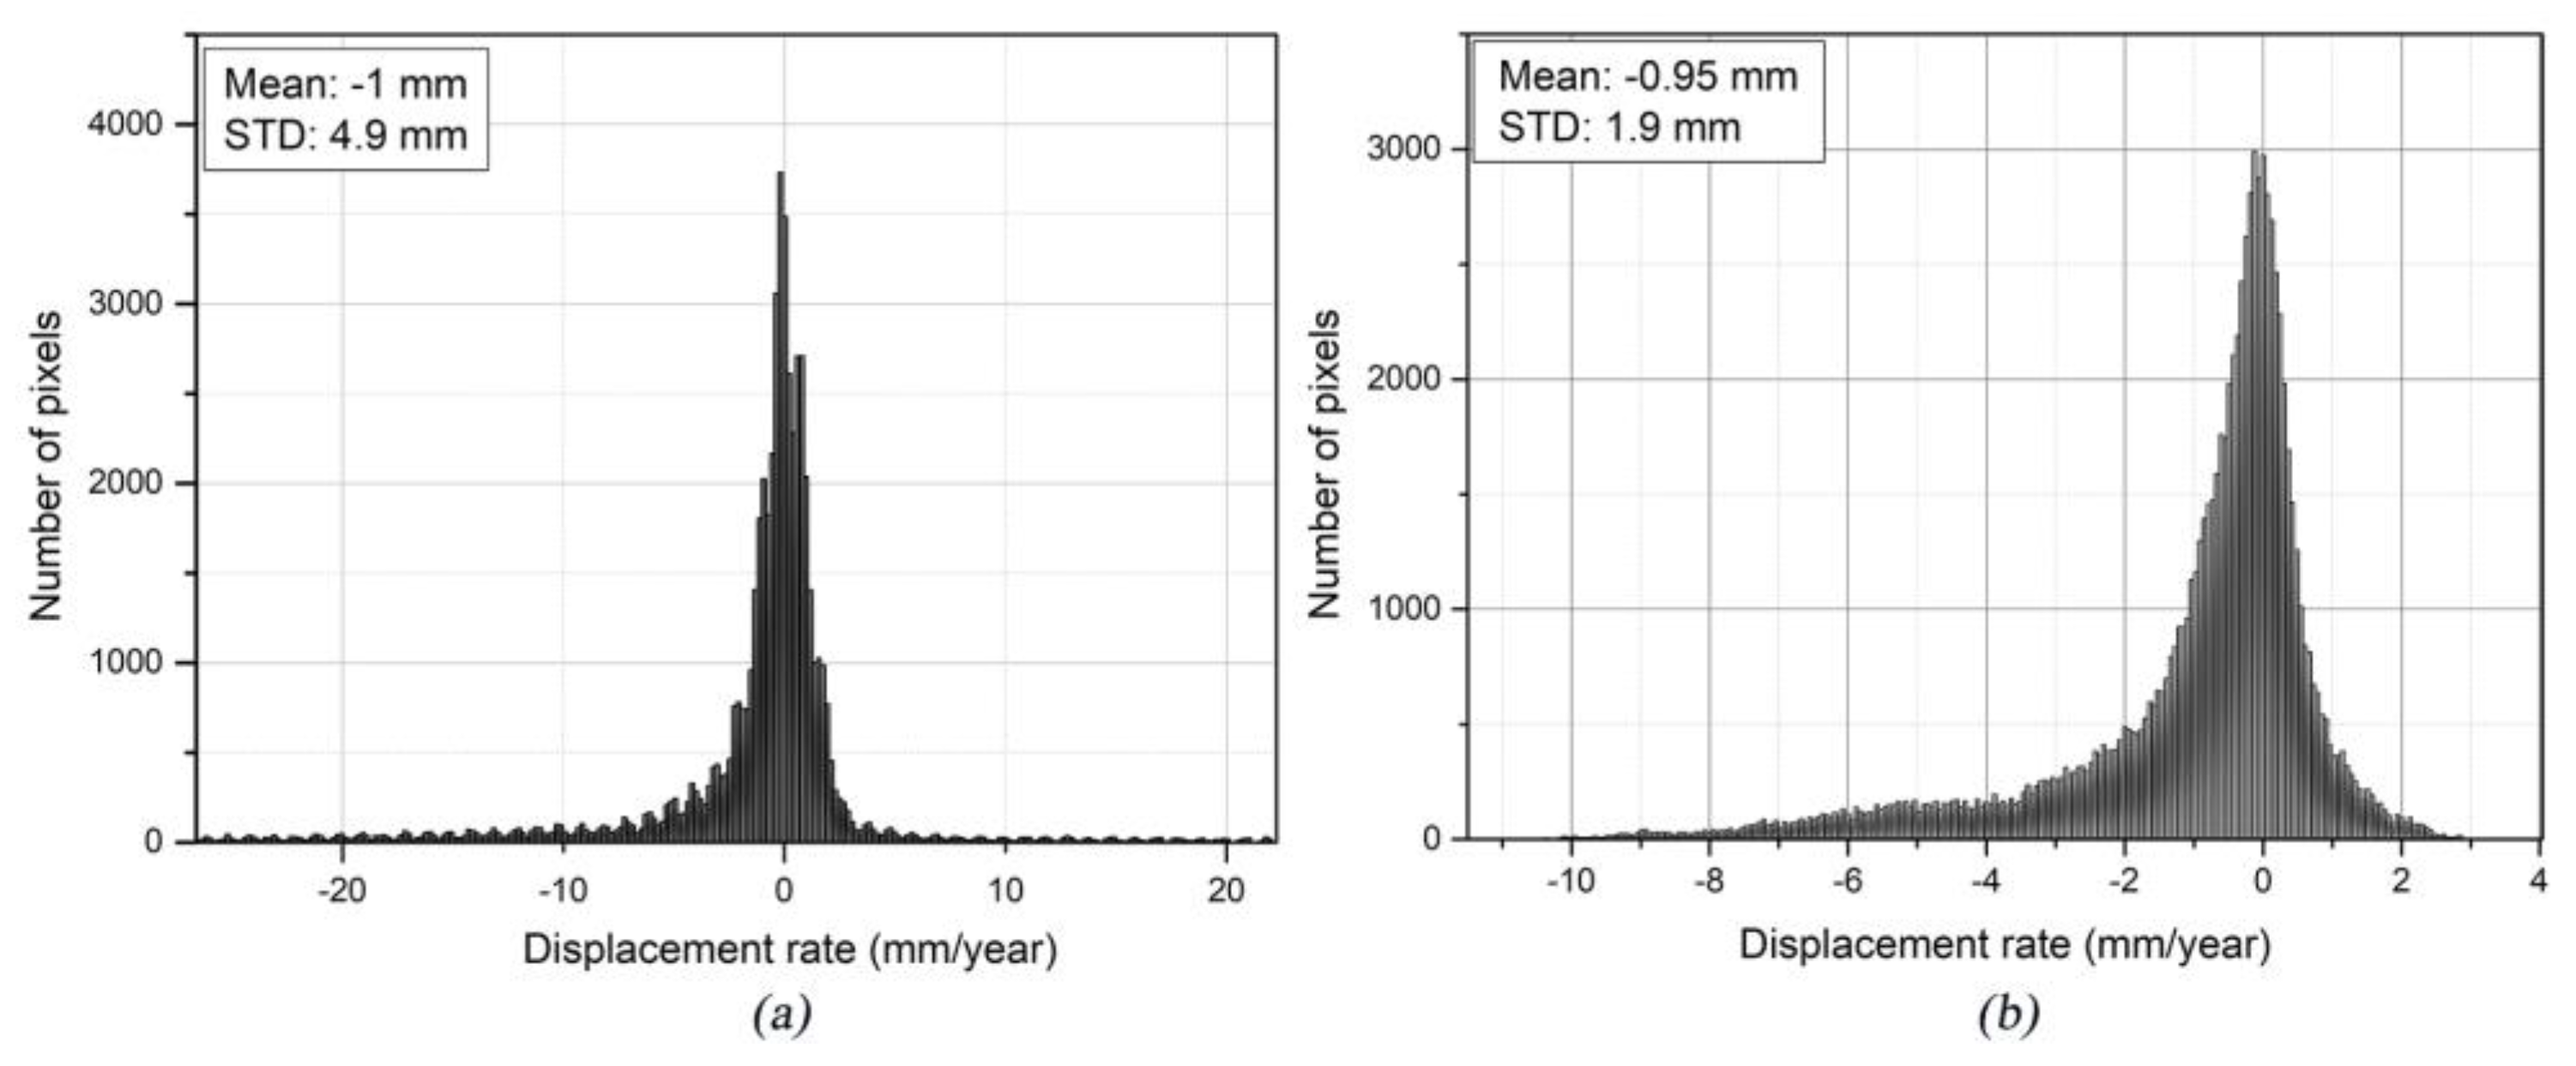
The mean velocity (mm/year) maps of the final geocoded displacements generated from the ERS-1/-2 data are shown in Figure 3a (for PSI) and Figure 3b (for SBAS). The color cycle from green to purple indicates the positive to negative velocities in the LOS direction. The negative values indicate that the surface is moving away from the satellite (i.e., subsidence) while the positive values indicate the opposite direction of movement (i.e., uplift). As shown in Figure 3a,b, the major subsidence areas were highlighted by both InSAR measurements, which were located on the borders of the Naka-Machi and Shin-Machi areas. The results derived from the SBAS method show higher densities of the obtained points than those of the PSI. In the study area of over 860,256 pixels, 54,458 measurement points were obtained by the PSI method, and 89,251 points by the SBAS method. The presence of vegetation in Urayasu City—namely the palm trees in the streets and parks—might cause this difference. The histograms of the estimated displacement velocities by the PSI and SBAS for the study area are shown in Figure 4a,b, respectively. The average displacement rate and the standard deviation for the PSI were −1.0 and 4.9 mm/year, while those for the SBAS were −0.95 and 1.9 mm/year, respectively. In general, the ERS-1/-2 results show that approximately 85% of the PS points indicate displacement rates between −4 mm/year and 2 mm/year (Figure 4).
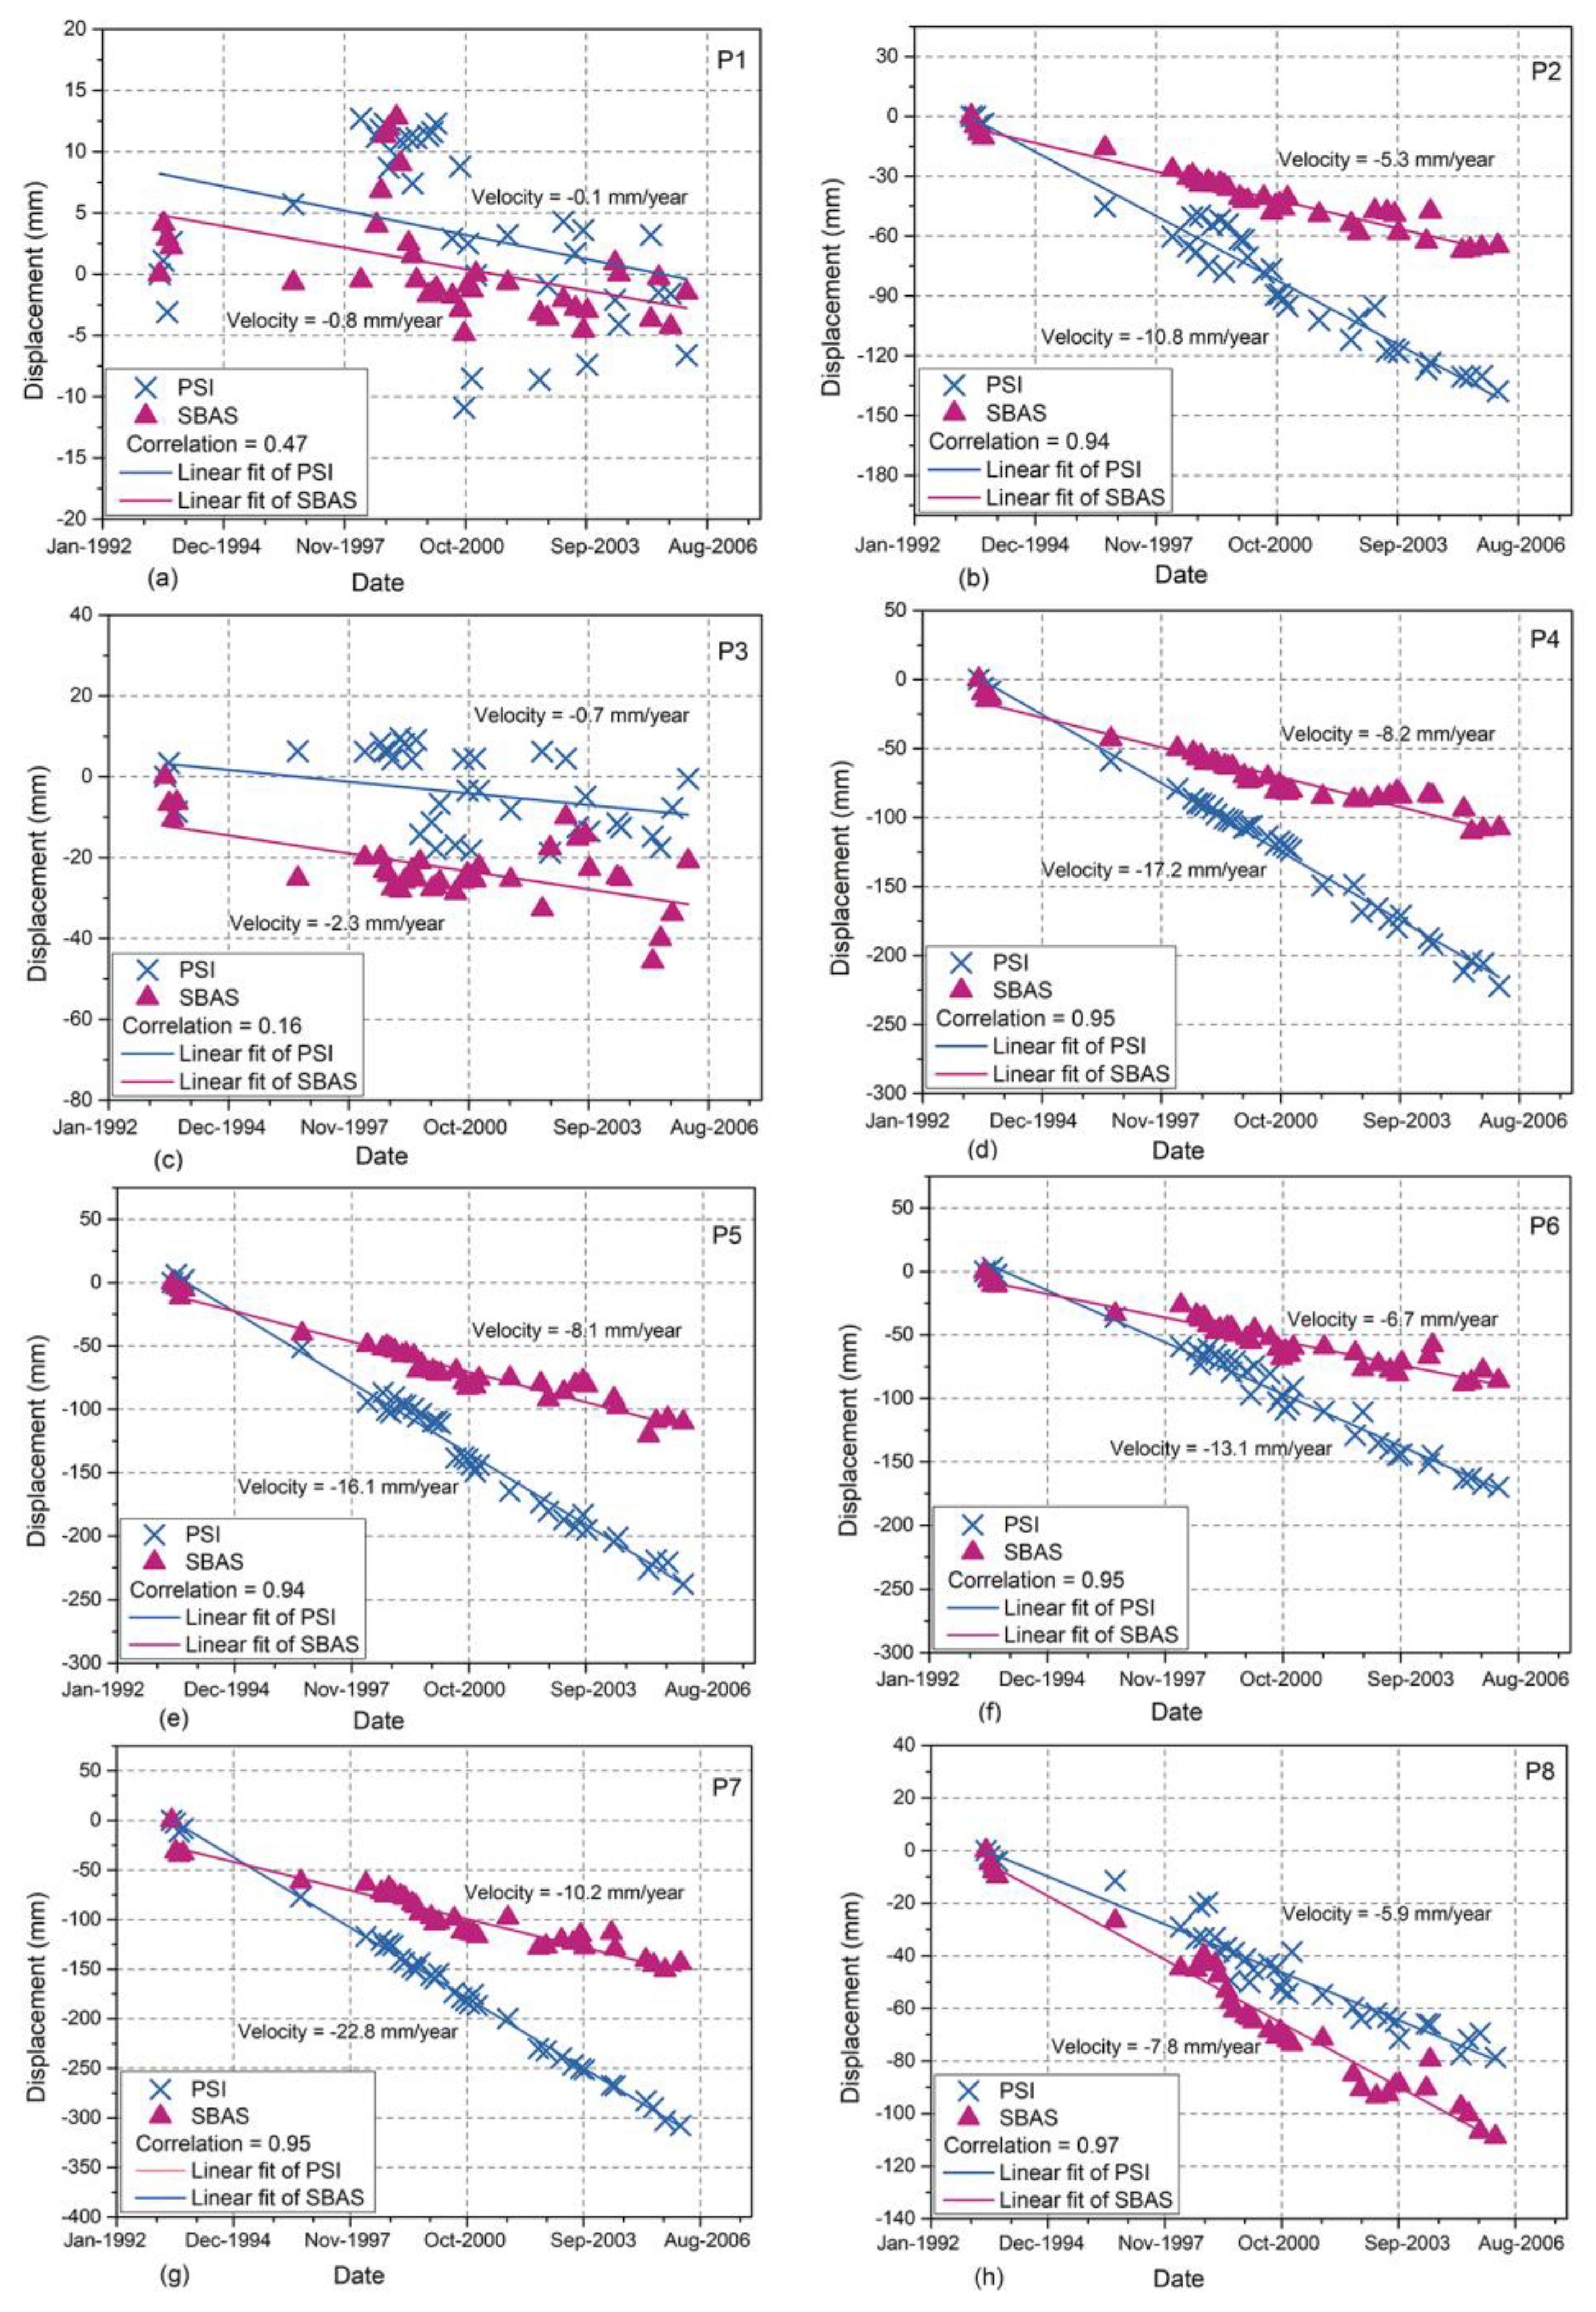
Figure 5 shows the measured displacement histories for eight representative points, which are shown in Figure 3. For both the PSI and SBAS measurements, the patterns of subsidence for each point show similar characteristics, such as an increase in subsidence rates. However, point P1 located in Moto-Machi shows very low subsidence rates (−0.1 and −0.9 mm/year for PSI and SBAS, respectively) compared to those in other areas. This suggests that the Moto-Machi area had relatively stable ground conditions during the ERS-1/-2 monitoring period. It is worth mentioning that the PSI’s estimated displacement velocity is almost two times more than the SBAS results; this may be caused by the different reference points selected in the two methods. We also calculated the correlation coefficient between PSI and SBAS results over those selected points using the Pearson correlation coefficient [49,50]. Most of those points showed relatively good correlation, while the P1 and P3 showed low correlation. However, the points P1 (−0.1 mm/year vs. −0.8 mm/year) and P3 (−0.7 mm/year vs. −2.3 mm/year) both show a small displacement velocity. To provide a quantitative comparison of the estimated time series for those selected points, we calculated the velocity difference between the two methods. The smallest velocity difference was 0.7 mm/year (P1), while the largest velocity difference was 12.6 mm/year (P7). The average velocity difference for all points between the two methods was 4.6 mm/year.
4.2. Time-Series Analysis of the PALSAR Data from June 2006 to December 2010
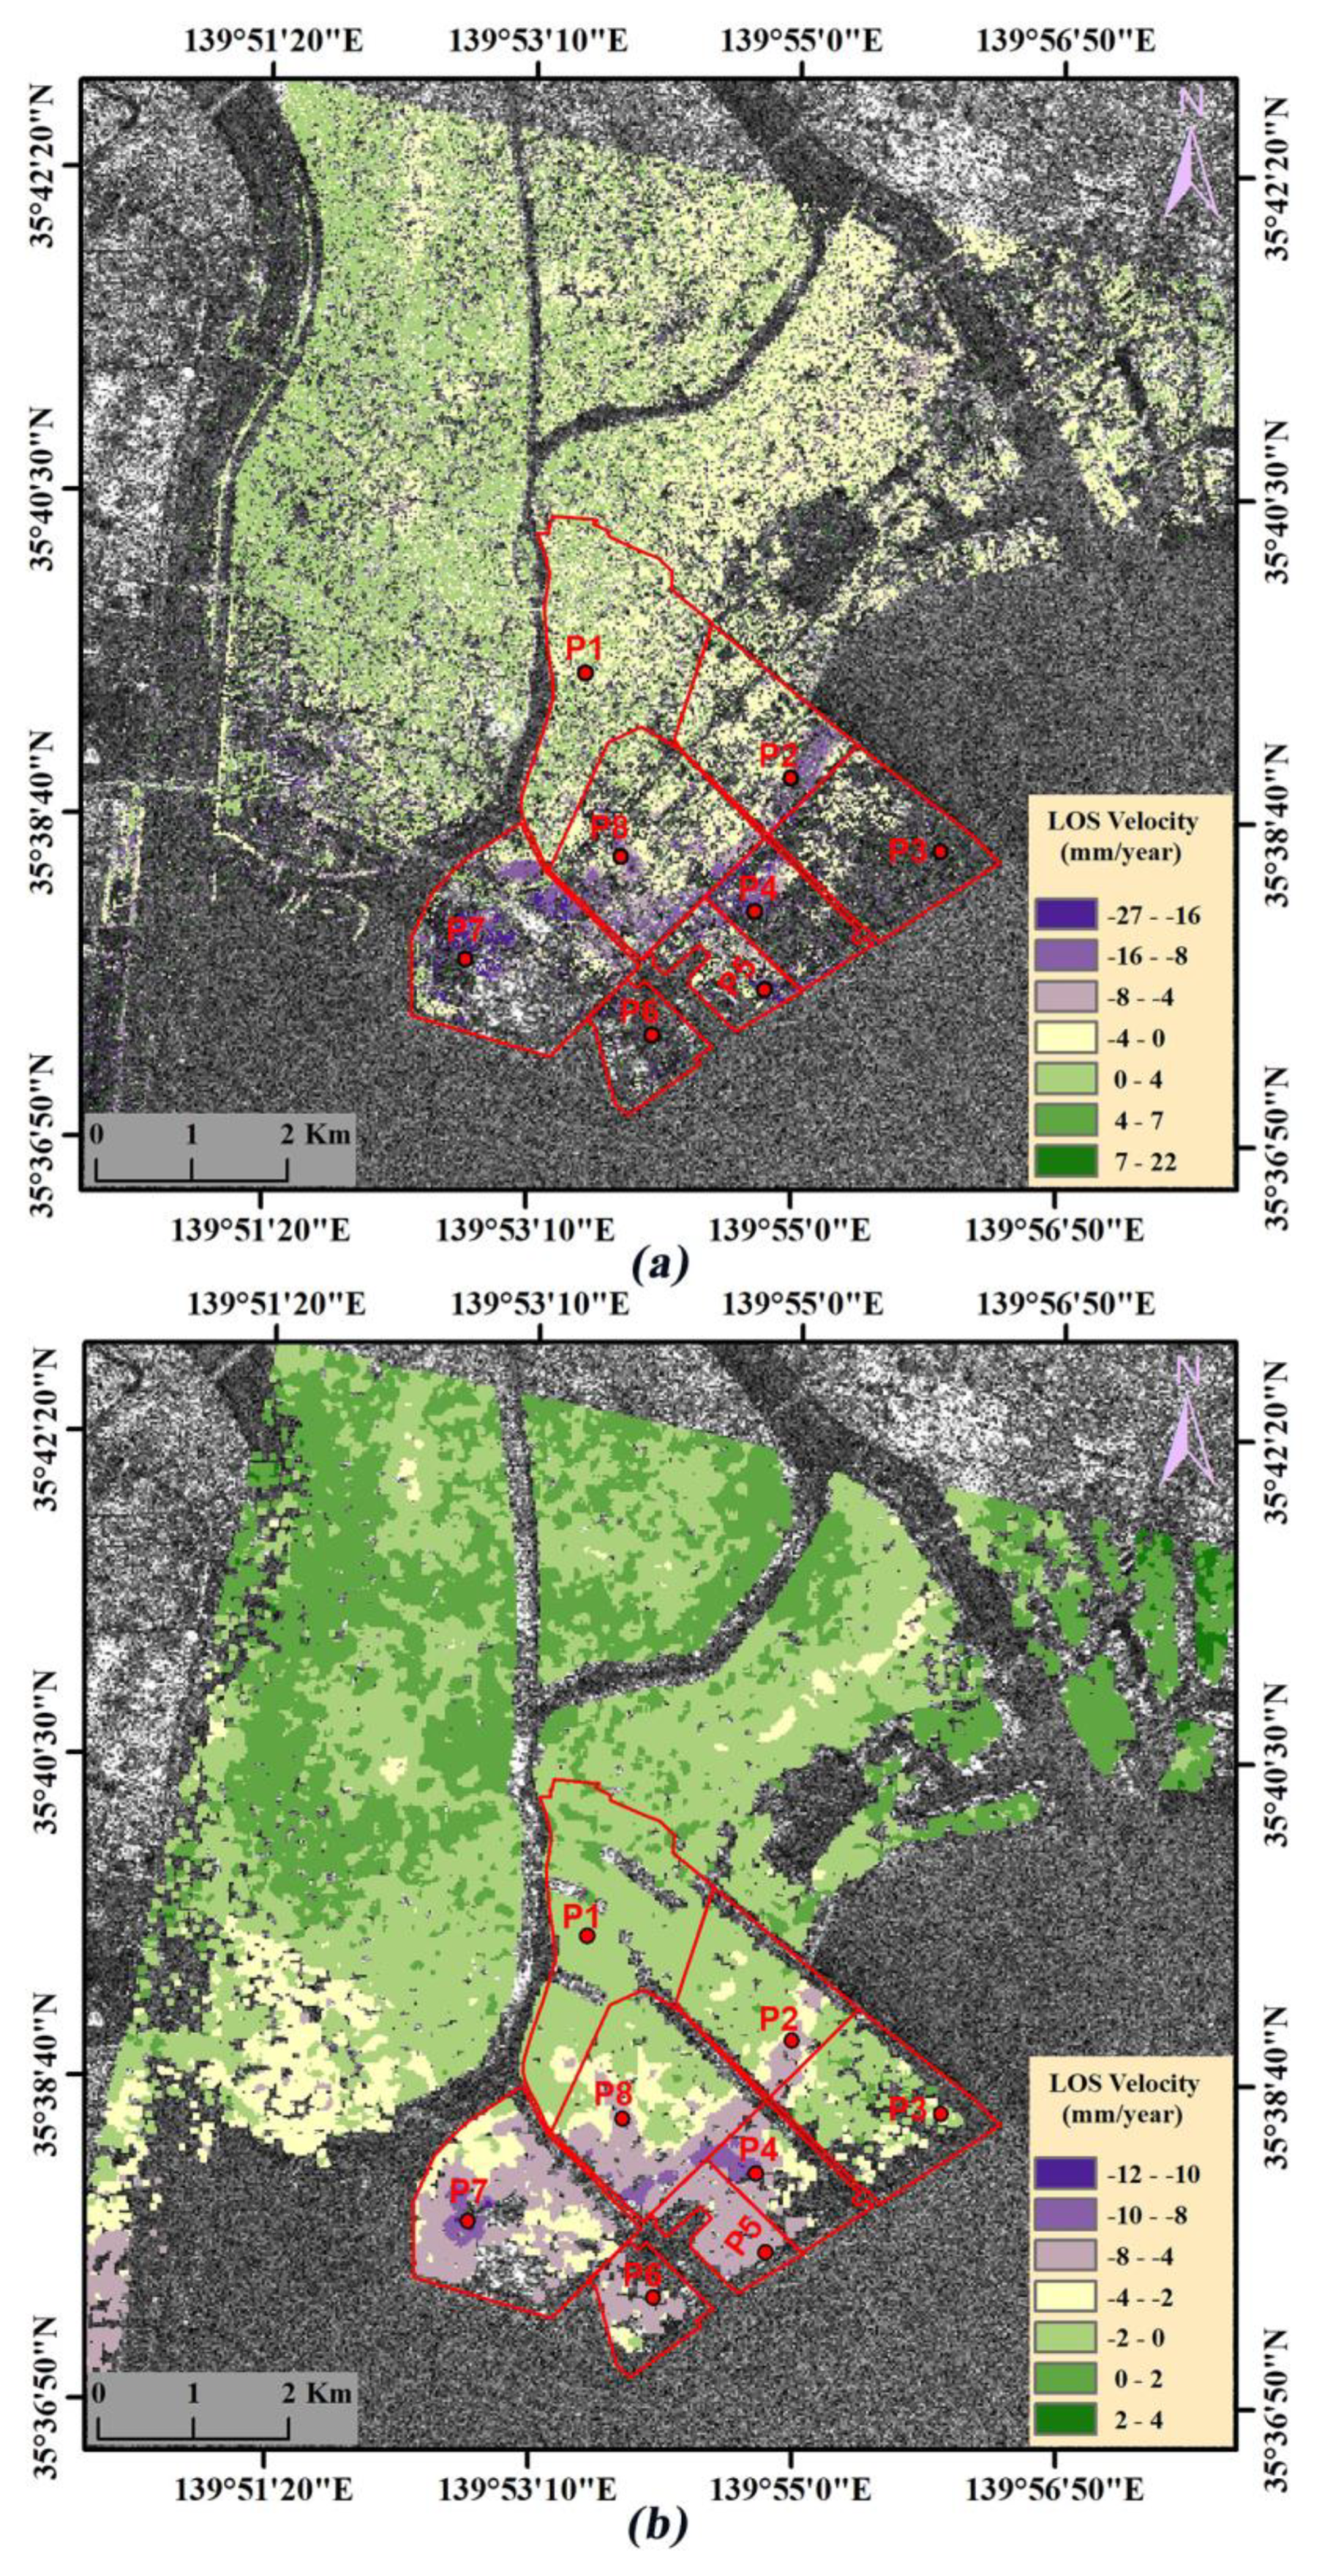
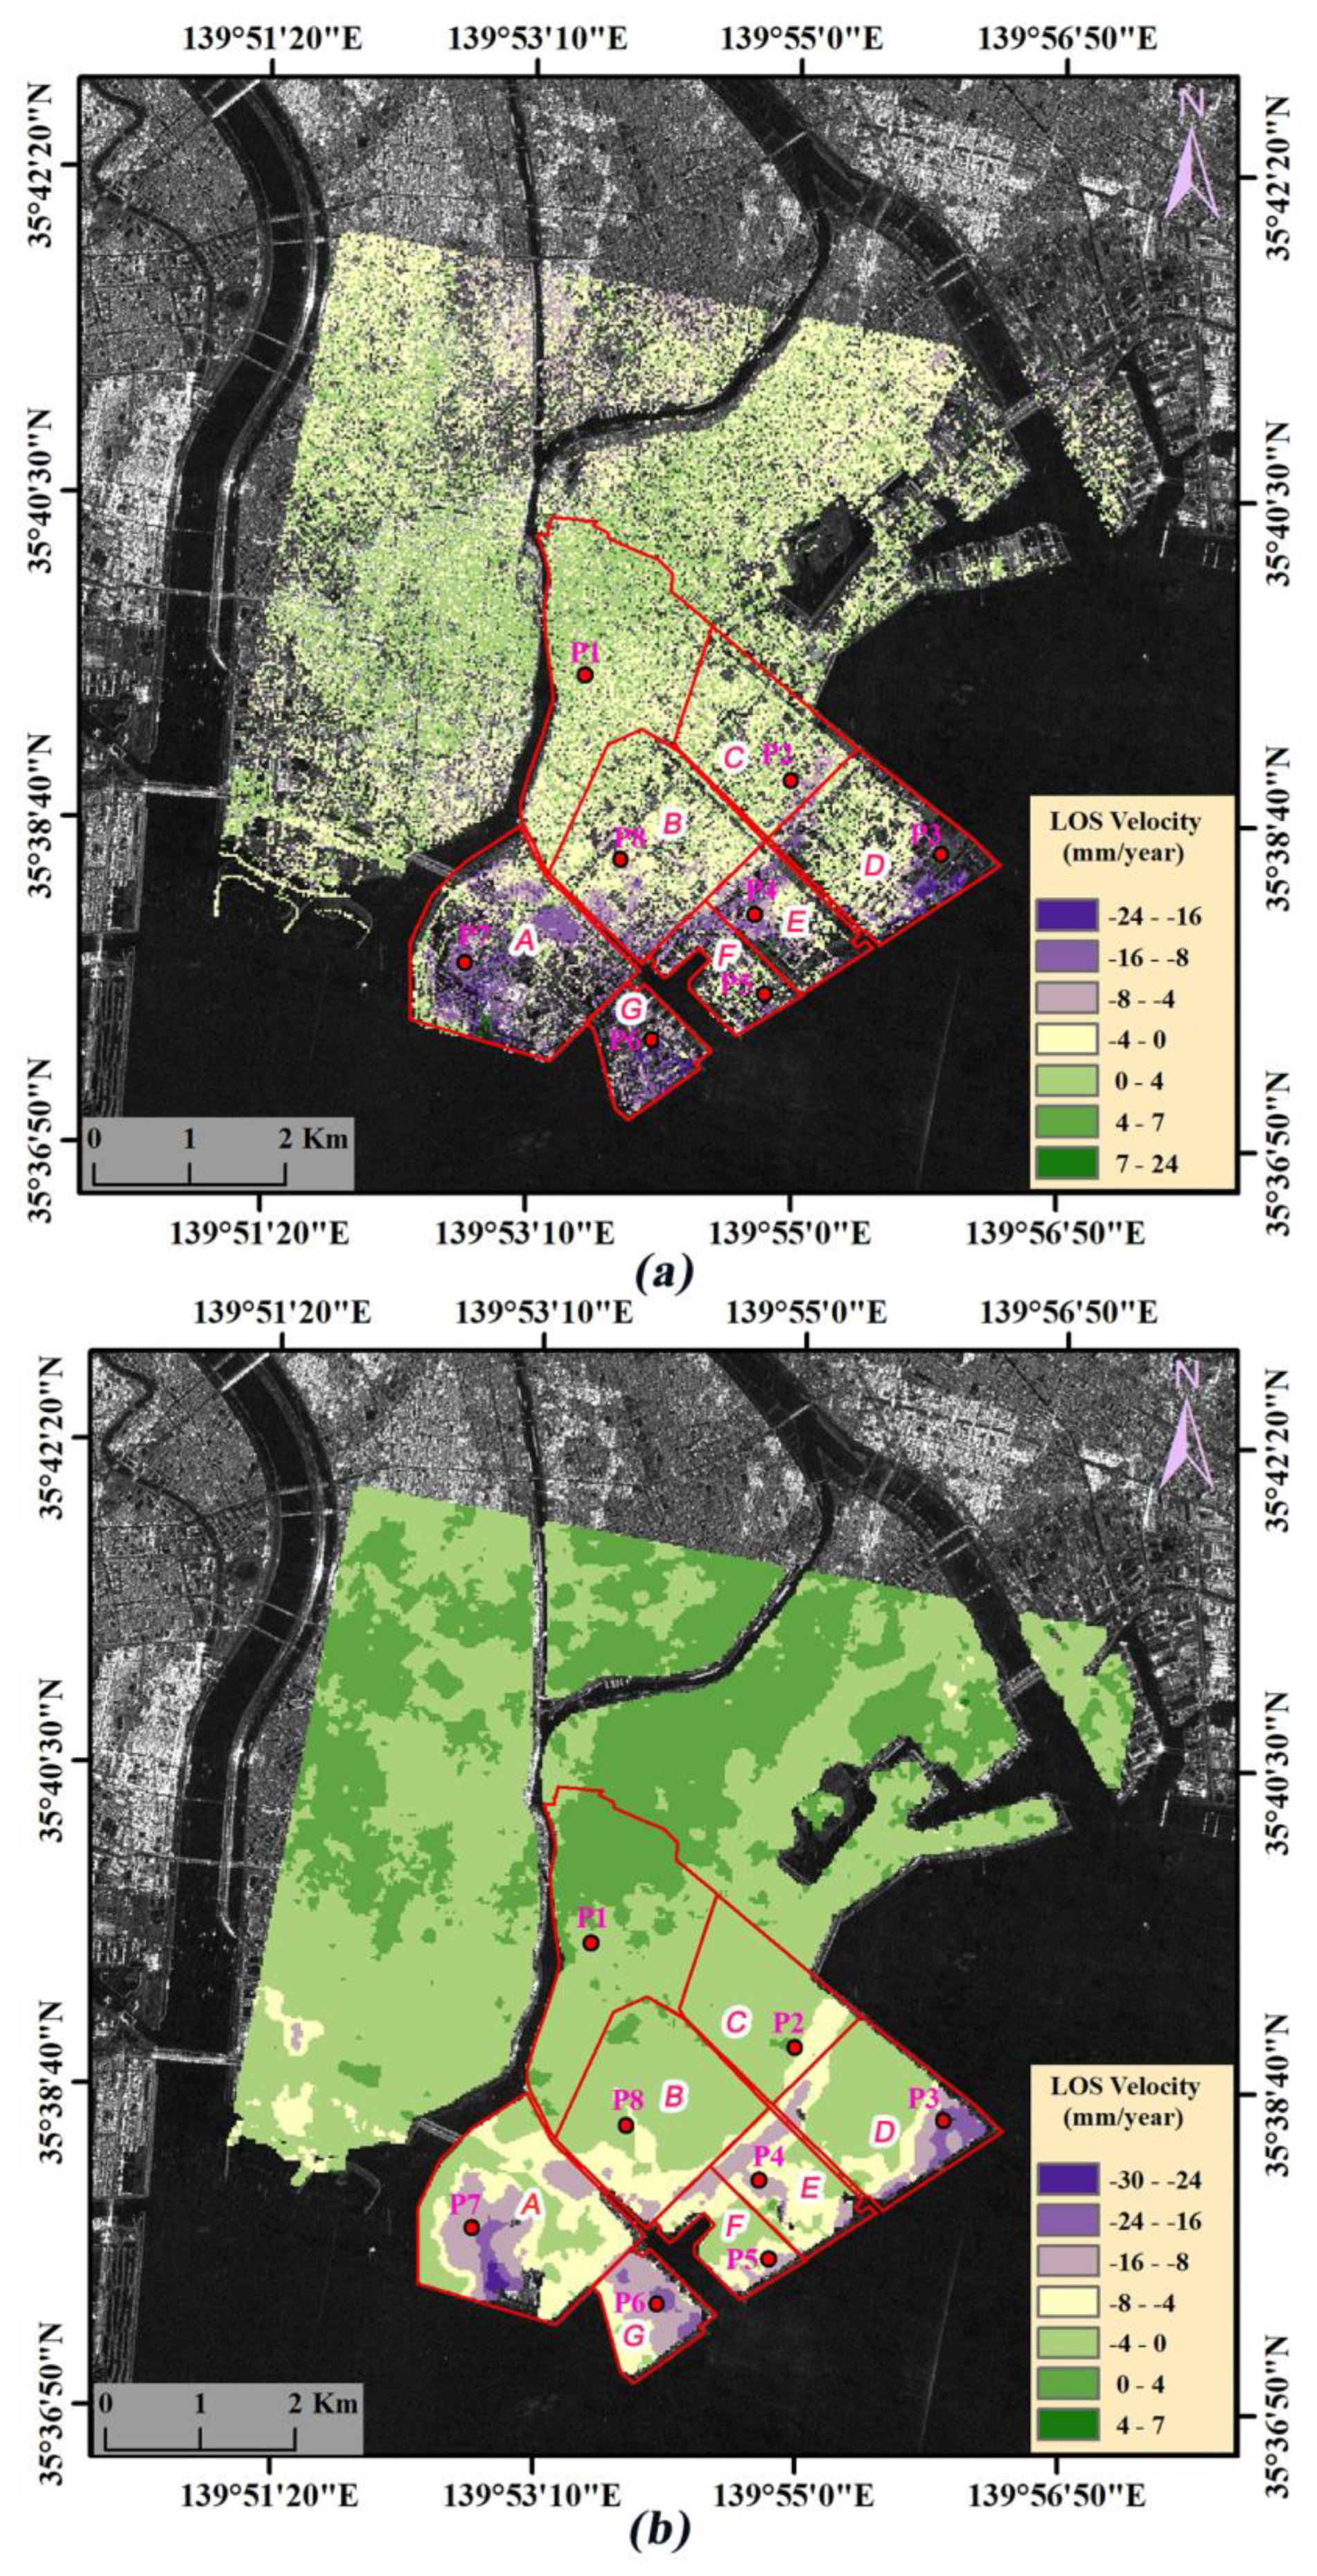
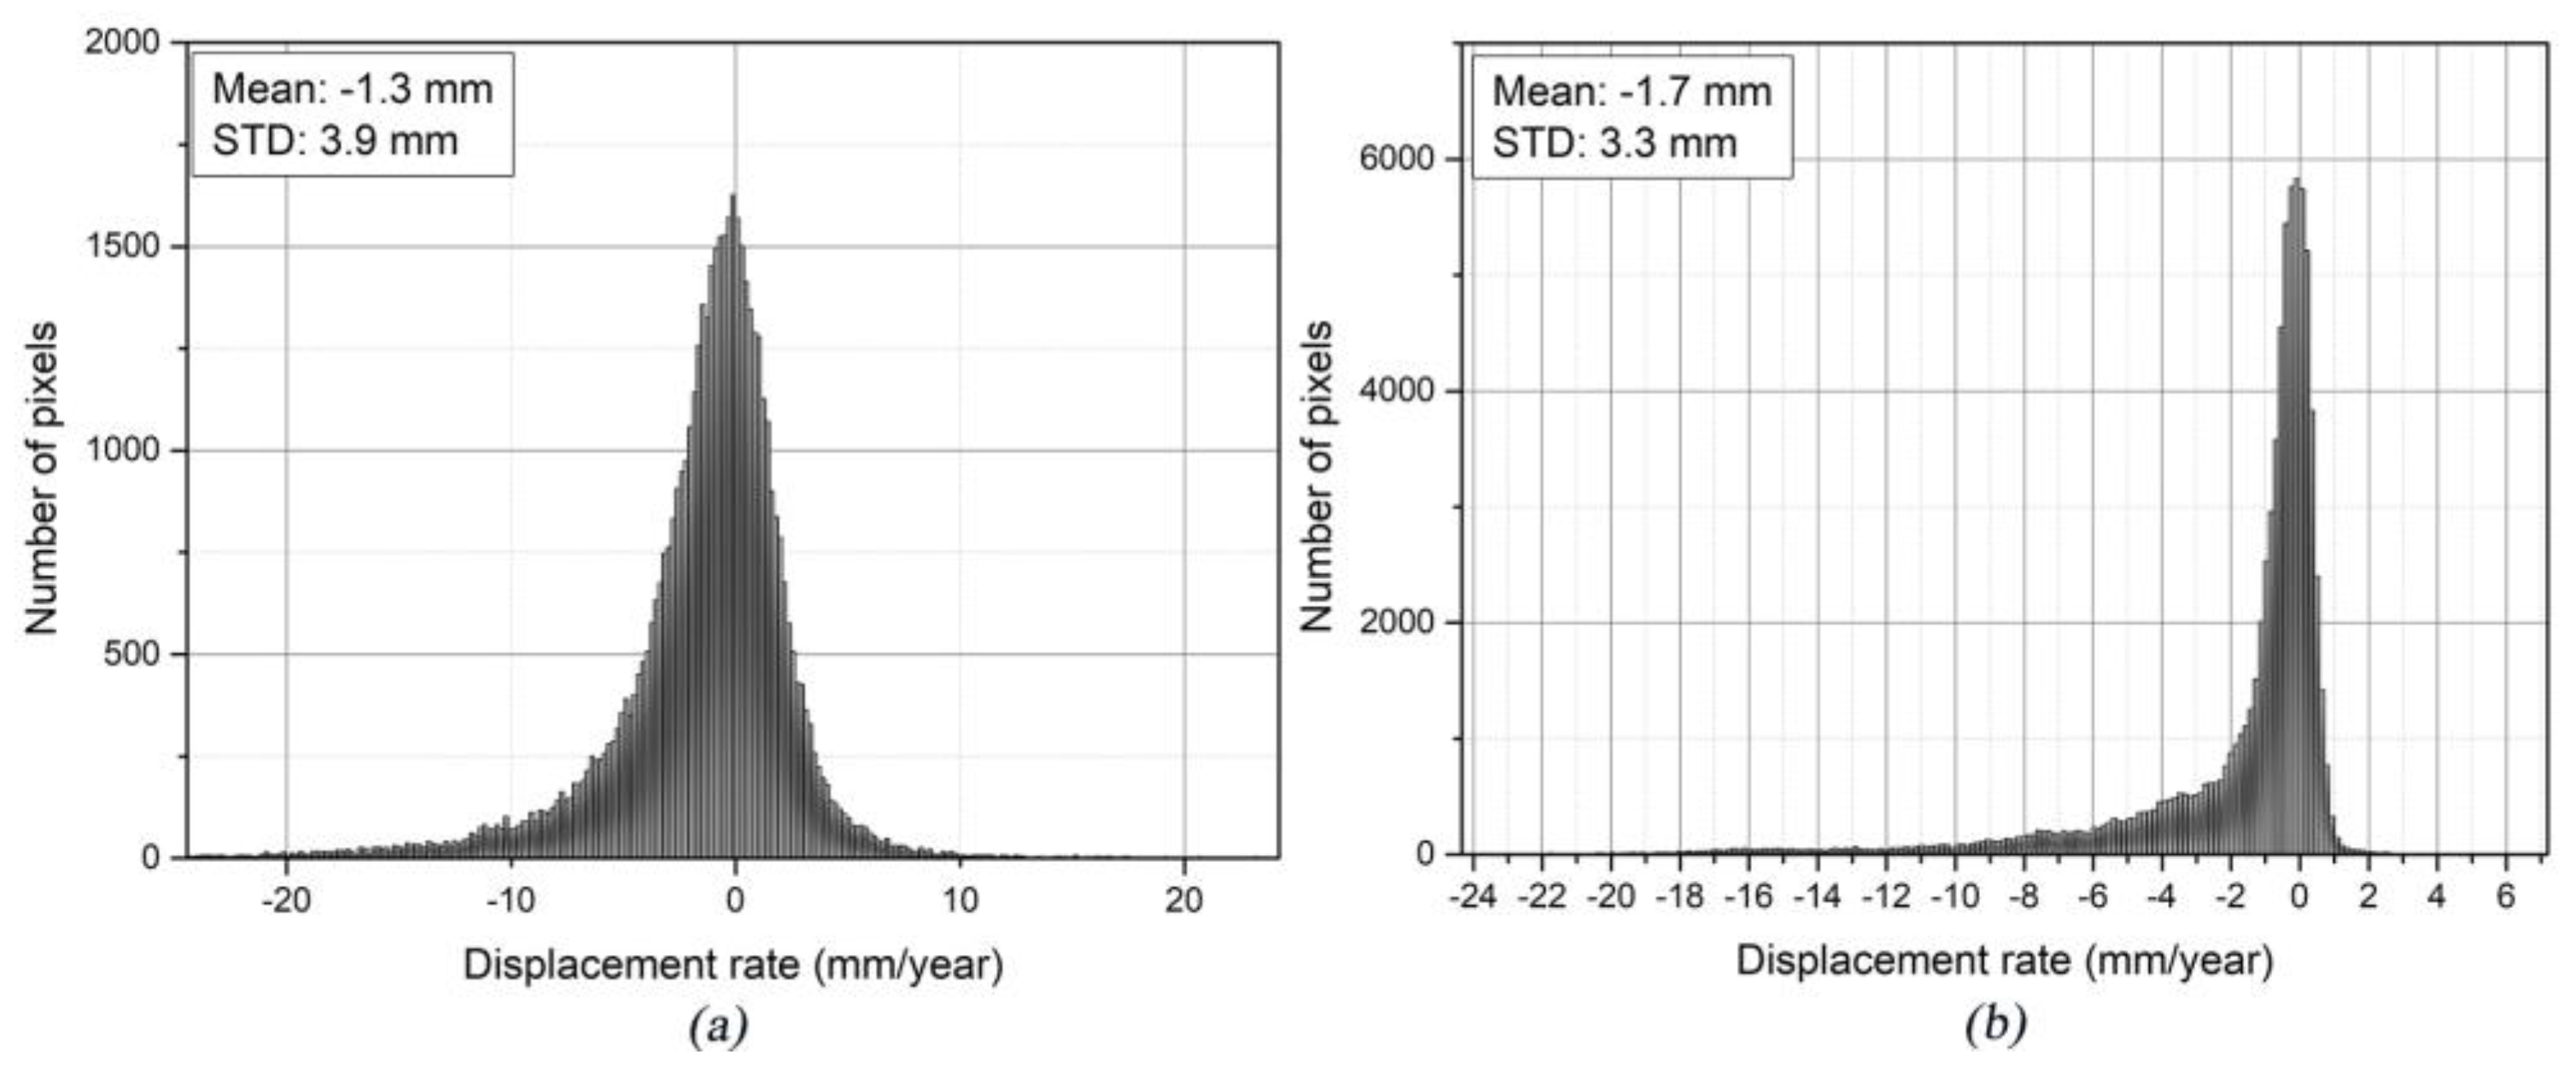
The mean velocity (mm/year) maps of the displacements for the period from June 2006 to December 2010 is shown in Figure 6a for PSI and Figure 6b for SBAS. The same color cycle from green to purple was used for those results. As shown in Figure 6a,b, the density of the measured points by the PSI is coarser than those by the SBAS, due to the existence of vegetation in the study area. In the study area of over 695,387 pixels, 50,441 measurement points were obtained by the PSI method, and 78,044 points by the SBAS method. The histograms of the estimated displacement velocity by the PSI and SBAS for the study area are shown in Figure 7a,b, respectively. The average displacement rate and the standard deviation for the PSI were −1.3 and 3.9 mm/year, whereas those for the SBAS were −1.7 and 3.3 mm/year, respectively. Overall, the PALSAR results show that approximately 85% of the PS points indicate displacement rates between −6 mm/year and 3 mm/year (Figure 7).
During the PALSAR monitoring period, most of the previously detected subsidence areas were also detected in this period, but the spatial distributions of subsidence are reduced (e.g., the areas such as points P2, P4, P5 and P8 located in Figure 6a,b). This indicates that most of those areas were experiencing continuous subsidence over the study period, but the magnitude was beginning to decrease. This is evident at the points P2 and P4 (Naka-Machi) and P8 (Shin-Machi) that showed a decrease in displacement velocity compared to the ERS-1/-2 monitoring period. In addition, the leveling data at the points U-8, U-10, U-11, U-13 and U-14 also reveal that the subsidence rate has begun to decrease from 2003 [37]. However, significant subsidence was identified in the coastal levee areas (i.e., the Maihama (A), Akemi and Hinode (D), Takasu (E), Minato (F) and Chidori (G) districts), which was not identified by the ERS-1/-2 data (Figure 6). In general, the PALSAR (L-band) has a longer wavelength than the ERS-1/-2 (C-band), which has less decorrelation over vegetated terrain and has better coherence [51]. Thus, the results of the PALSAR data offer a higher density of PS pixels. Therefore, we can assume that these areas may have been experiencing subsidence during the ERS-1/-2 monitoring period and may have been excluded from further processing due to the low coherence exhibited in these areas in the ERS-1/-2 data. Another reason for those differences is that the subsidence in the coastal levee may have started during the PALSAR monitoring period.
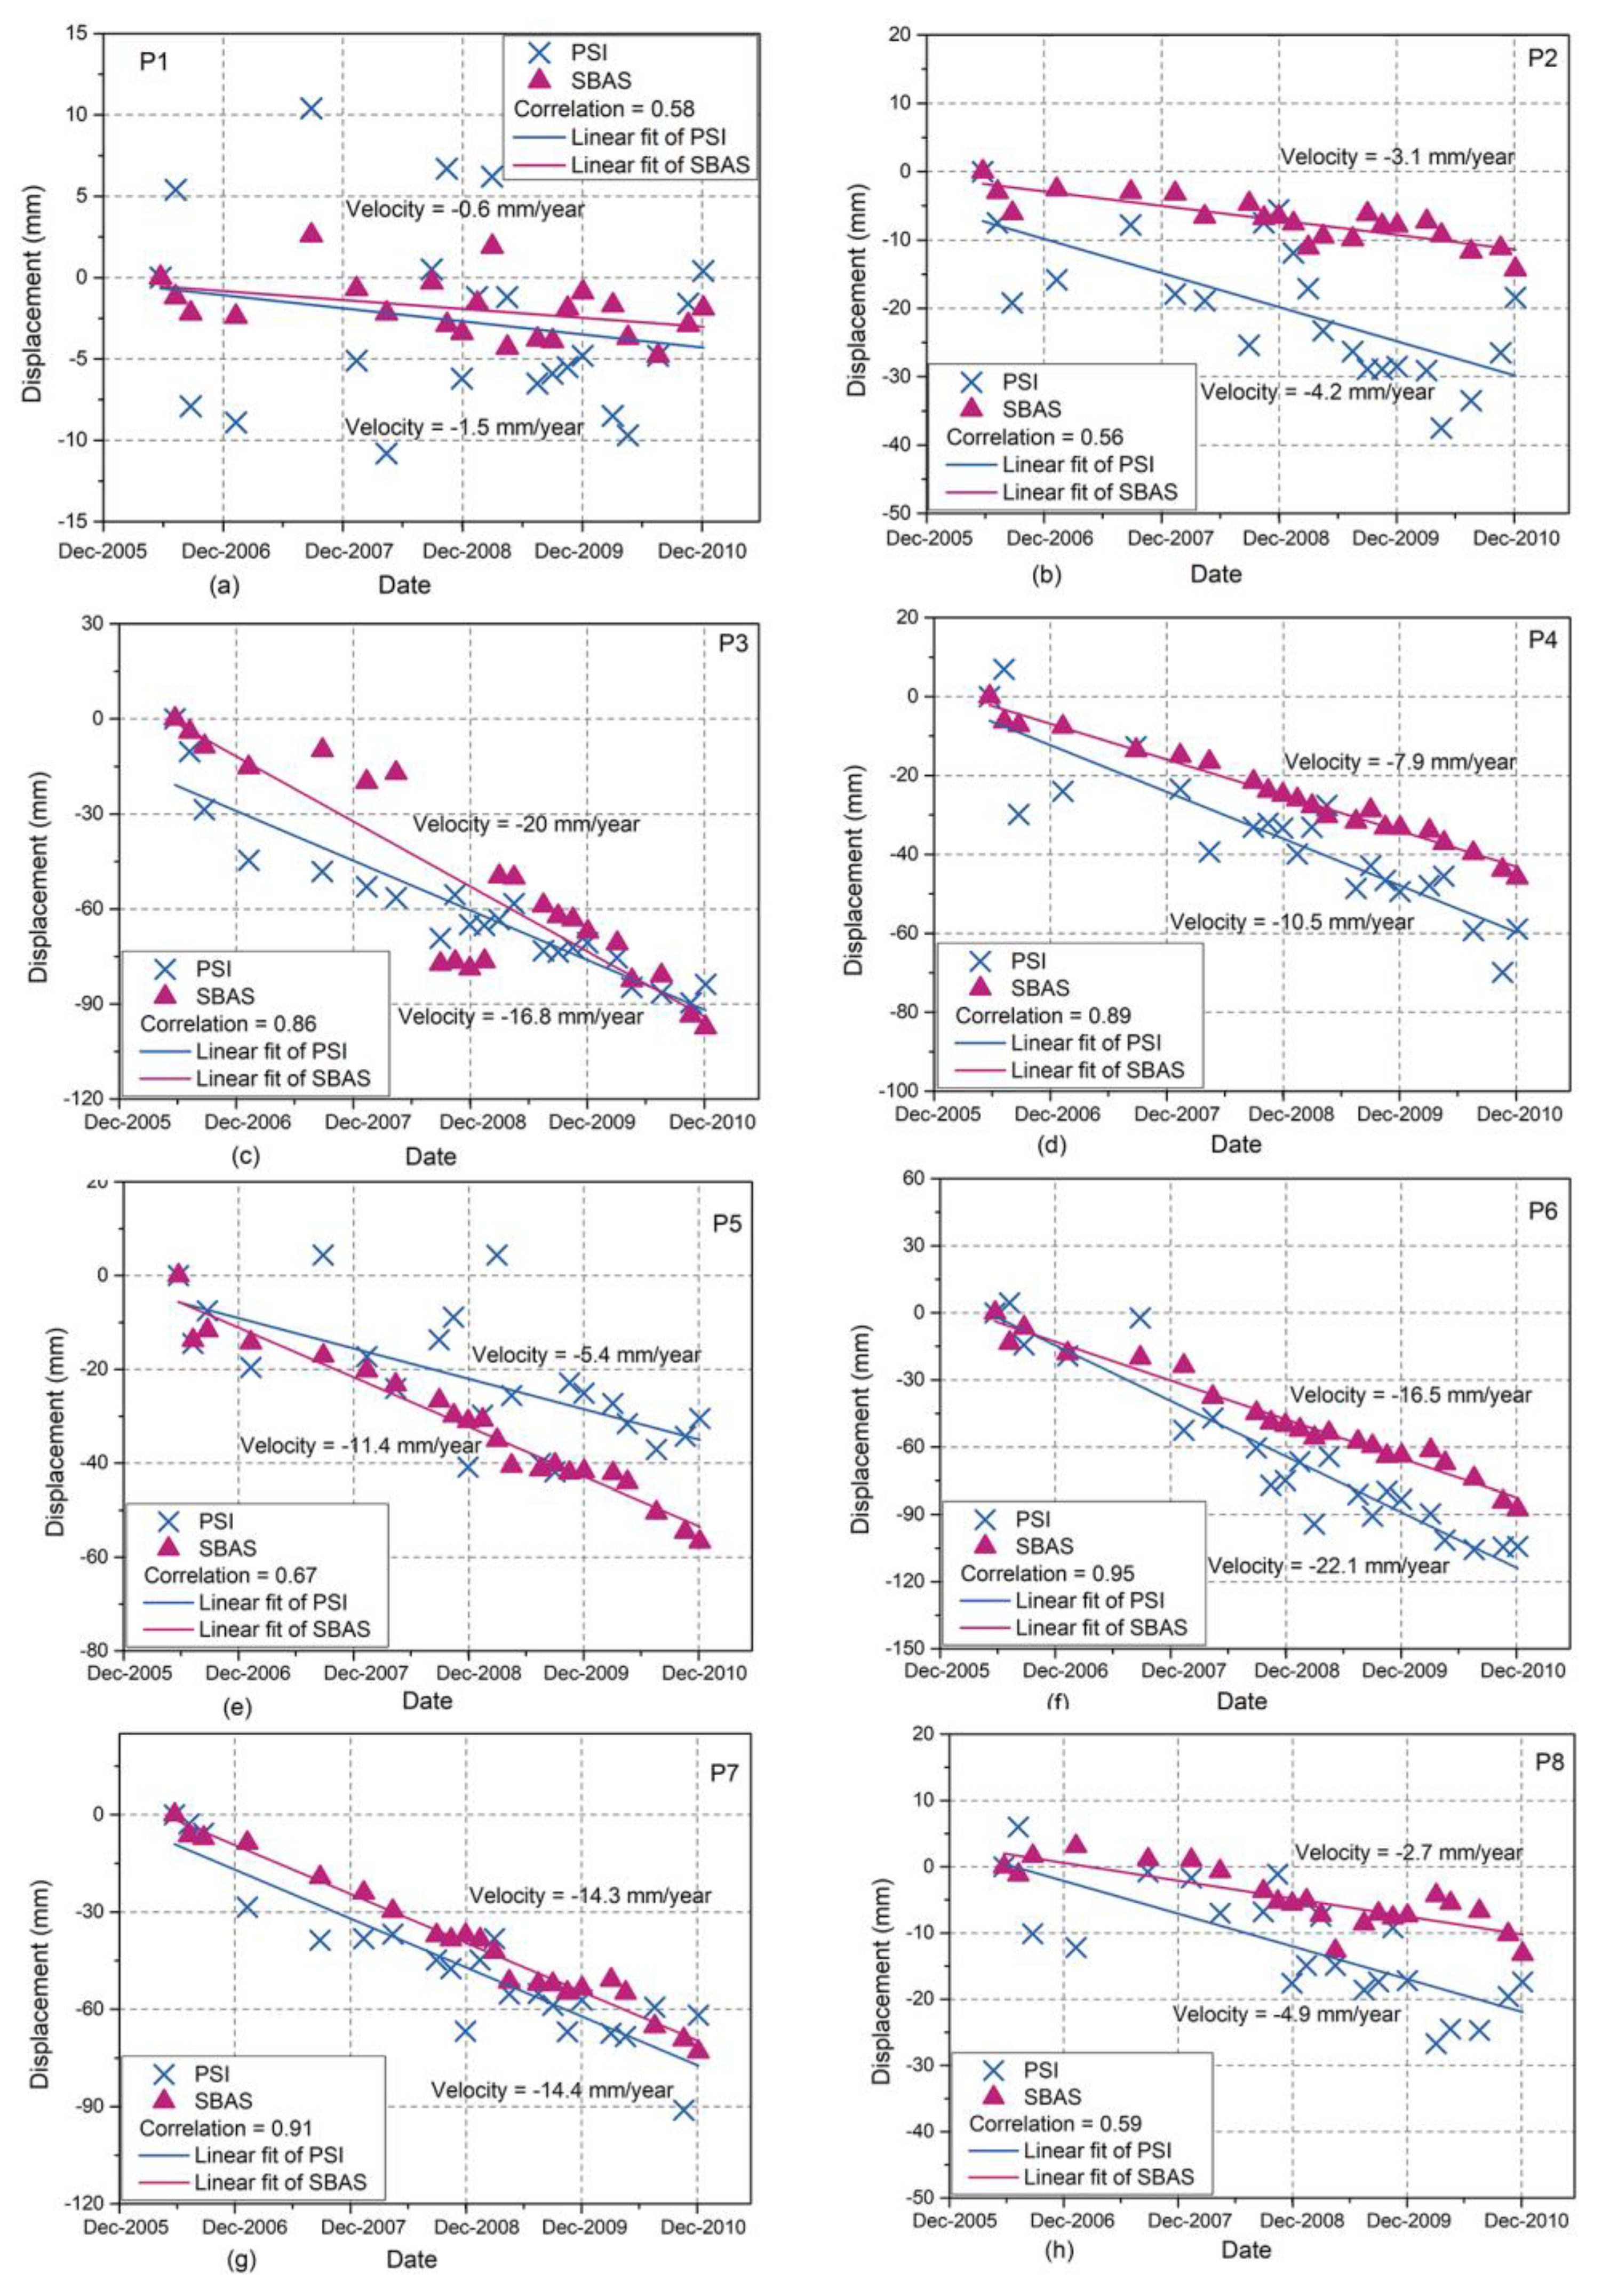
Figure 8a–h shows the measured displacement time-series for eight representative points, which are shown in Figure 6a,b (the same points in Figure 3a,b). From Figure 8a–h, we can see that the time-series LOS deformations derived by both the PSI and SBAS processing showed good agreement in the subsidence trend. The estimated deformation rates by the PSI and SBAS measurements on points P1, P2, P4, P7 and P8 showed a velocity difference of less than 3 mm/year, while the points P3, P5 and P6 showed the largest velocity difference of over 5 mm/year. The average velocity difference for all points between the two methods was 2.9 mm/year. In general, similar to the ERS-1/-2 monitoring period, the Moto-Machi area also showed very low subsidence rates in the PALSAR monitoring period. This may be related to the fact that, in most parts of the Moto-Machi area, the urban infrastructures and houses are built over the naturally formed Holocene lowland that has stable ground conditions over time.
4.3. Time-Series Analysis of the PALSAR-2 Data from December 2014 to November 2017
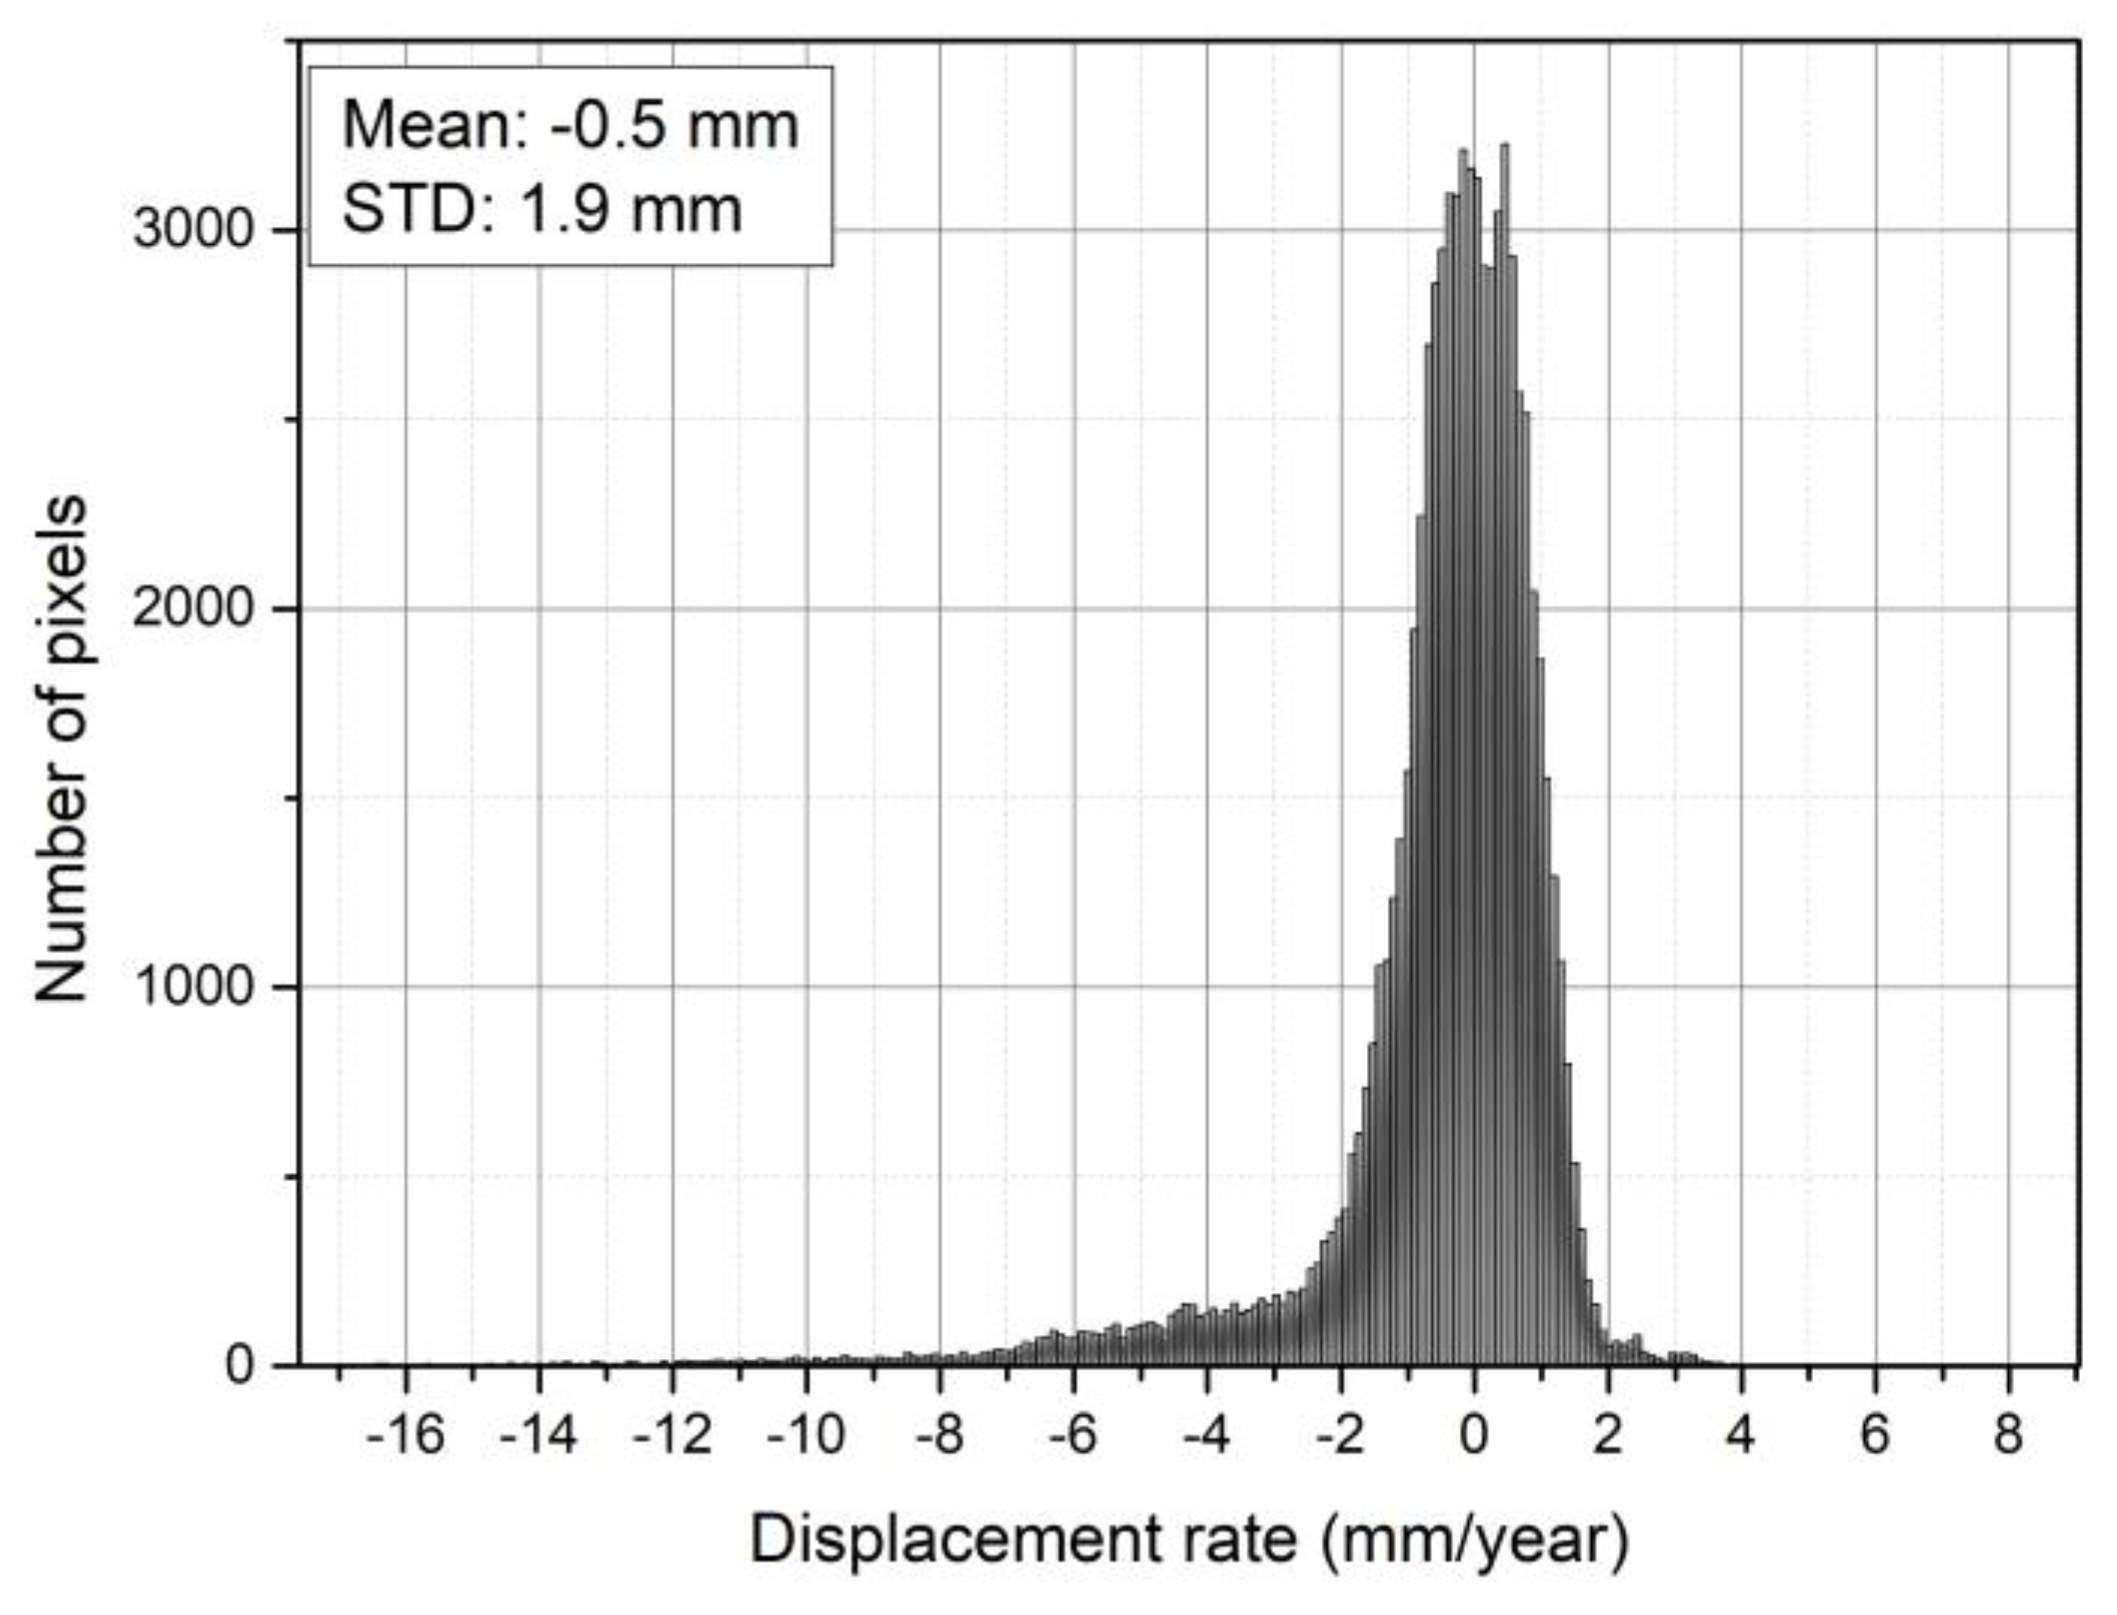
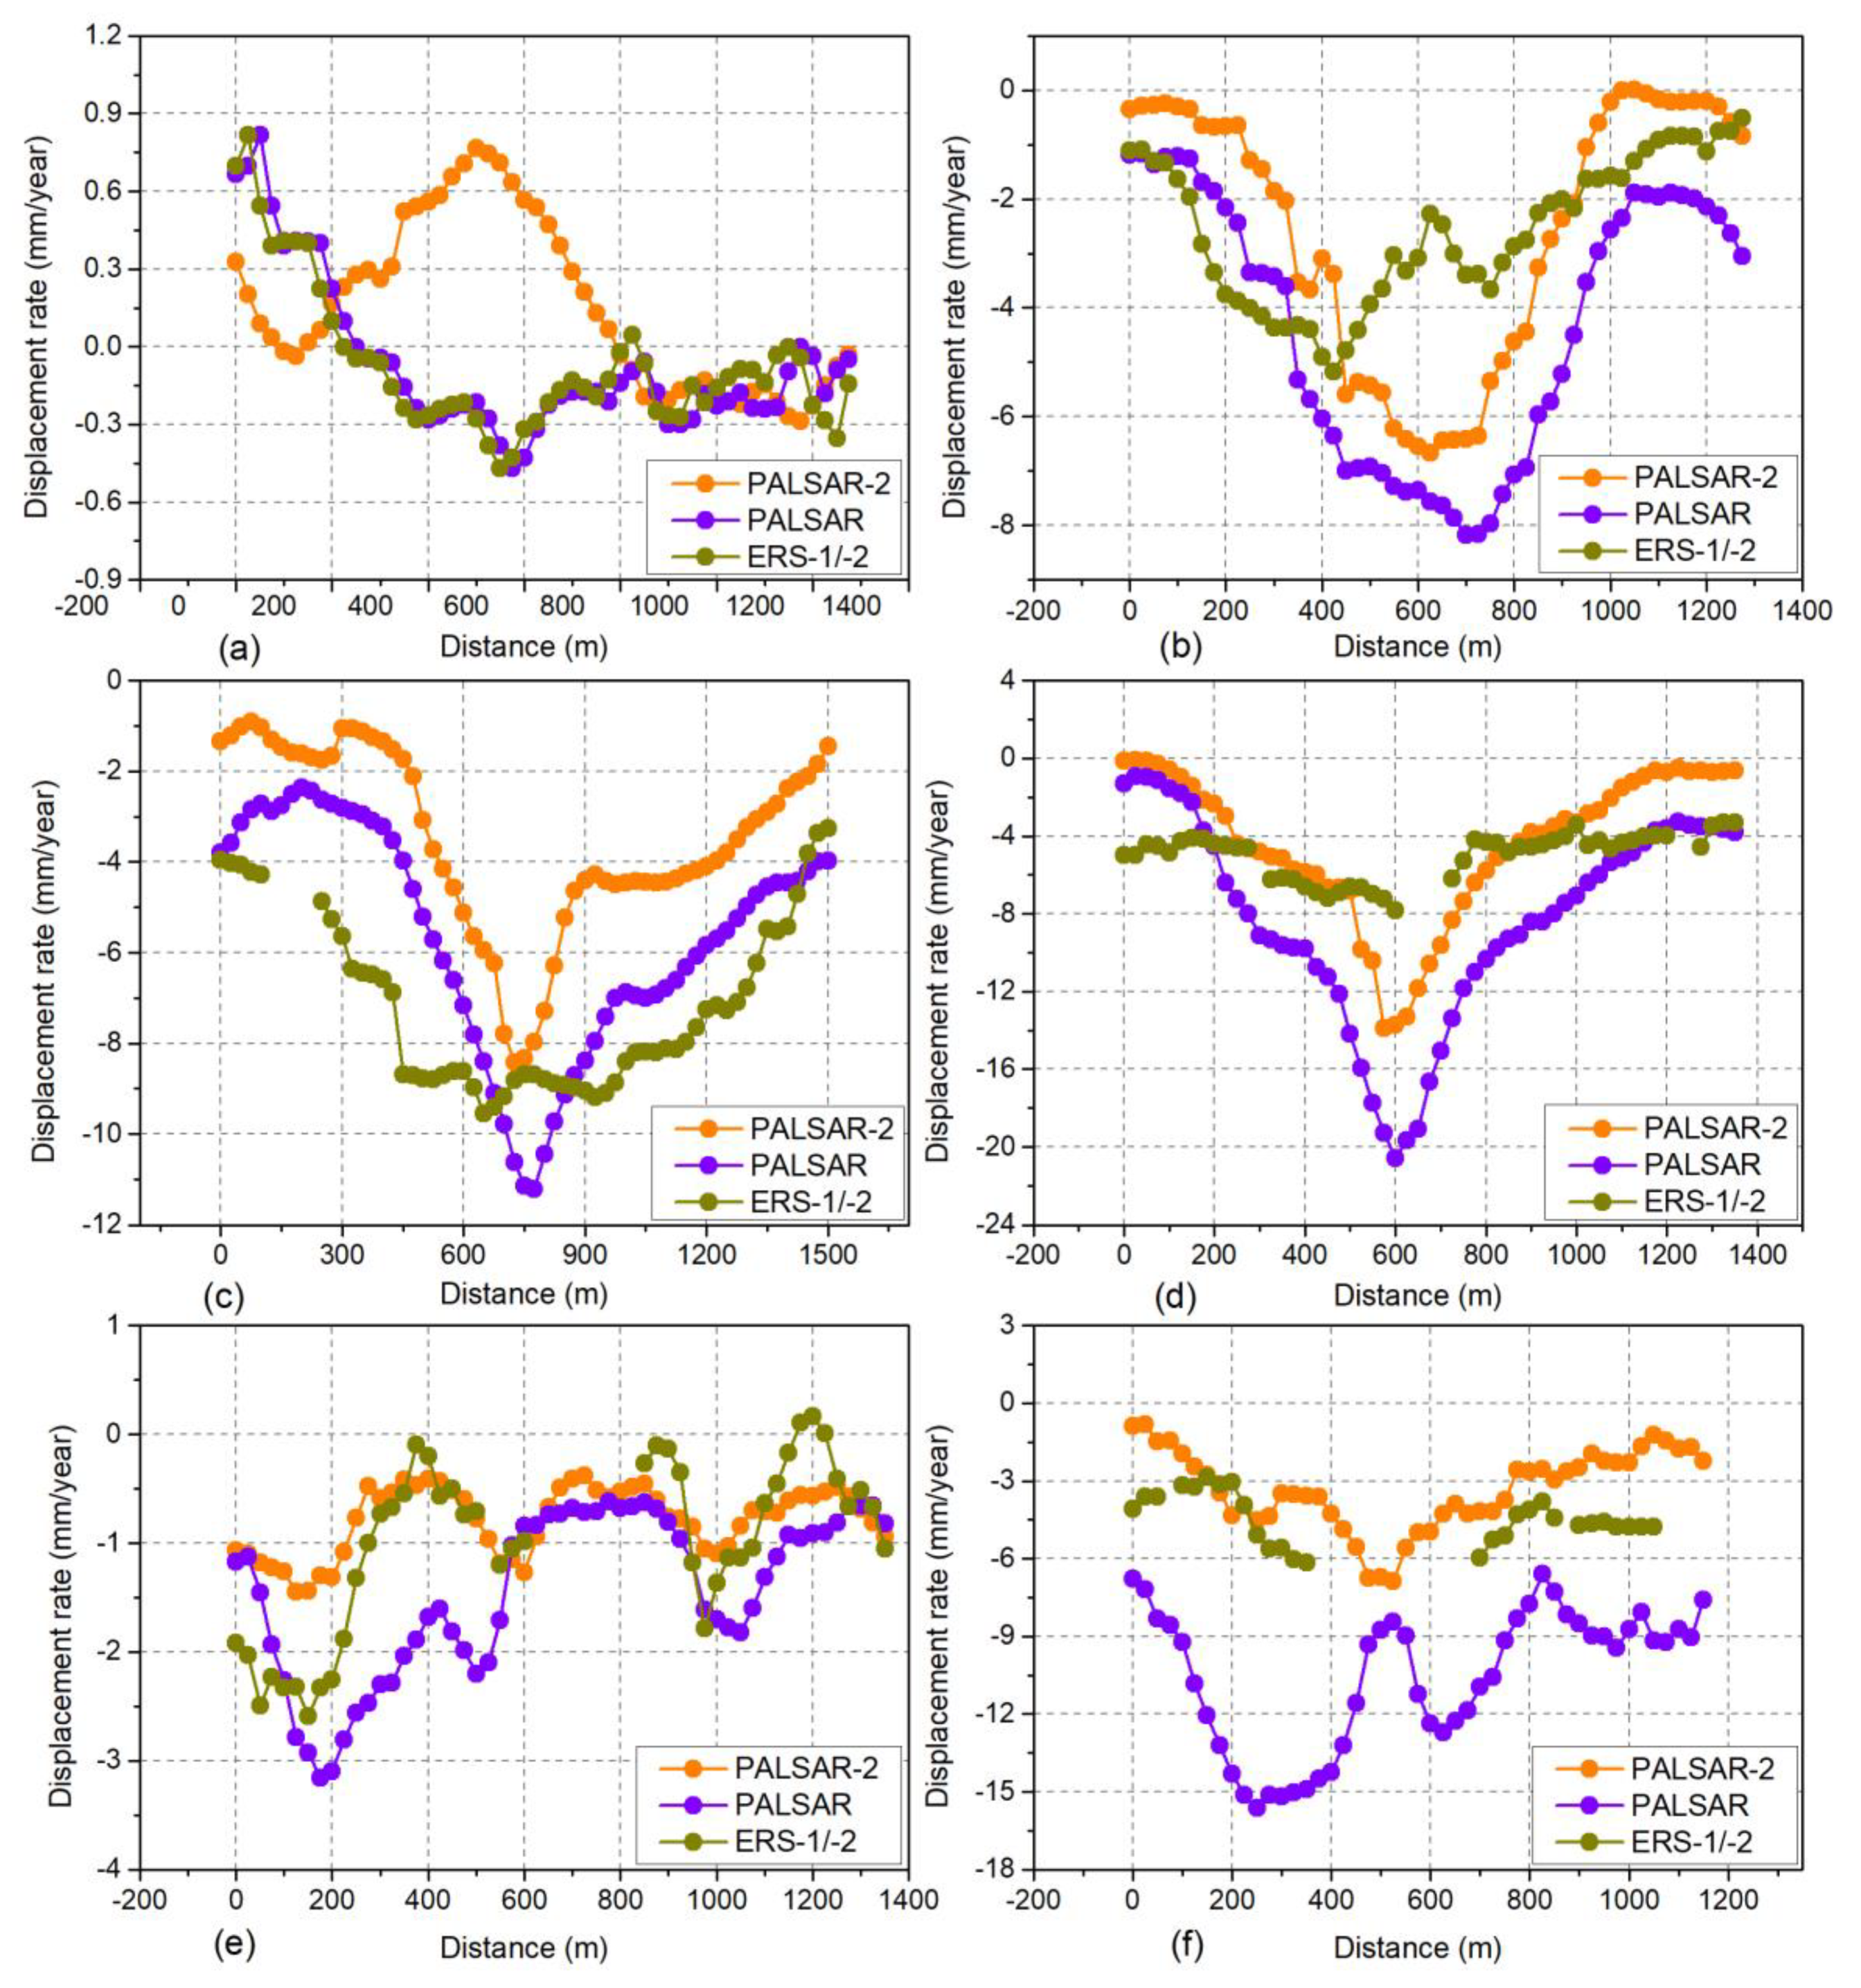
The mean velocity (mm/year) maps of the displacements for the period from December 2014 to November 2017 are shown in Figure 9. The same color cycle from green to purple was used for the result. In the study area of over 690,336 pixels, 76,500 measurement points were obtained by the SBAS method. The histogram of the SBAS-derived displacement velocity for the study area is shown in Figure 10. The average displacement rate and the standard deviation are −0.5 mm/year and 1.9 mm/year, which are lower than those obtained with the ERS-1/-2 and PALSAR data. In general, the PALSAR-2 results show that approximately 85% of the PS points indicate displacement rates between −3 mm/year and 1 mm/year (Figure 10). To show the variations in the LOS displacement velocities at different locations over the three observation periods, six profiles across several locations in Urayasu City were selected (Figure 9). We can see from Figure 11 that these selected profiles show different displacement dispersion patterns, such as profiles P1–P1’ and P5–P5’ which show a dispersion of approximately −0.5 mm/year to −2.6 mm/year. Along profile P4–P4’, the subsidence rate increased from 0.1 to 21 mm/year within the distance of 0.6 km. The profiles in Figure 11b–d,f reveal that the PALSAR-estimated subsidence rate has a larger value than those from the ERS-1/-2 and PALSAR-2. Contrary to the ERS-1/-2 and PALSAR-estimated displacement velocity, the PALSAR-2 results show an uplift within the distance of 300 to 900 m in the profile P1–P1’ across the Moto-Machi area (Figure 11a). Moreover, both PALSAR and PALSAR-2 estimated displacement rates show a significantly decrease along P4–P4’ (Figure 11d).
During the PALSAR-2 monitoring period, because of the high spatial resolution and shorter revisiting time compared to the ERS-1/-2 and PALSAR data, a subsidence estimation with better spatial coverage and precision was achieved. Figure 9 shows that the three areas that have subsided during the previous monitoring periods have also showed land subsidence in this PALSAR-2 monitoring period (i.e., the border areas between Naka-Machi and Shin-Machi; the areas close to the levee of Hinode and Akemi (D); the Maihama area (A)). This may further imply that these areas were experiencing continuous subsidence during the entire monitoring period. Considering the existence of non-linear subsidence, the actual subsidence may not be a linear motion overtime, and the results by PSI and SBAS simply reflect the subsidence phenomena. However, the spatial extent and the magnitude of subsidence over Urayasu City is shrinking. The Moto-Machi area is in a relatively stable ground condition over the whole monitoring period, and the areas close to the borders of Moto-Machi and Naka-Machi began to stabilize over time. A further detailed discussion about the evolutions and the causes of land subsidence in Urayasu City are given in Section 5.4.
5. Discussion
5.1. Comparison of the InSAR-Derived Results with the Leveling Data
To assess the accuracy of the InSAR-derived results over the three observation periods, a quantitative comparison of the time-series displacements with the leveling survey data provided by the Chiba Prefecture at 22 measurement points was performed. To locate each leveling point, we referenced the online version of the Chiba information map and the illustration figures of each leveling point provided [52]. For the InSAR measurement points, especially those in incoherent areas, the pixels that lay within 100 m of the corresponding leveling points were assigned, and the average velocity of these pixels was calculated. We selected the leveling data in the same overlapping periods as the three InSAR measurement periods. We assumed the horizontal deformation was negligible, and the LOS displacement velocity was converted into the vertical displacement velocity by dividing the cosine of the sensor incidence angle [53].
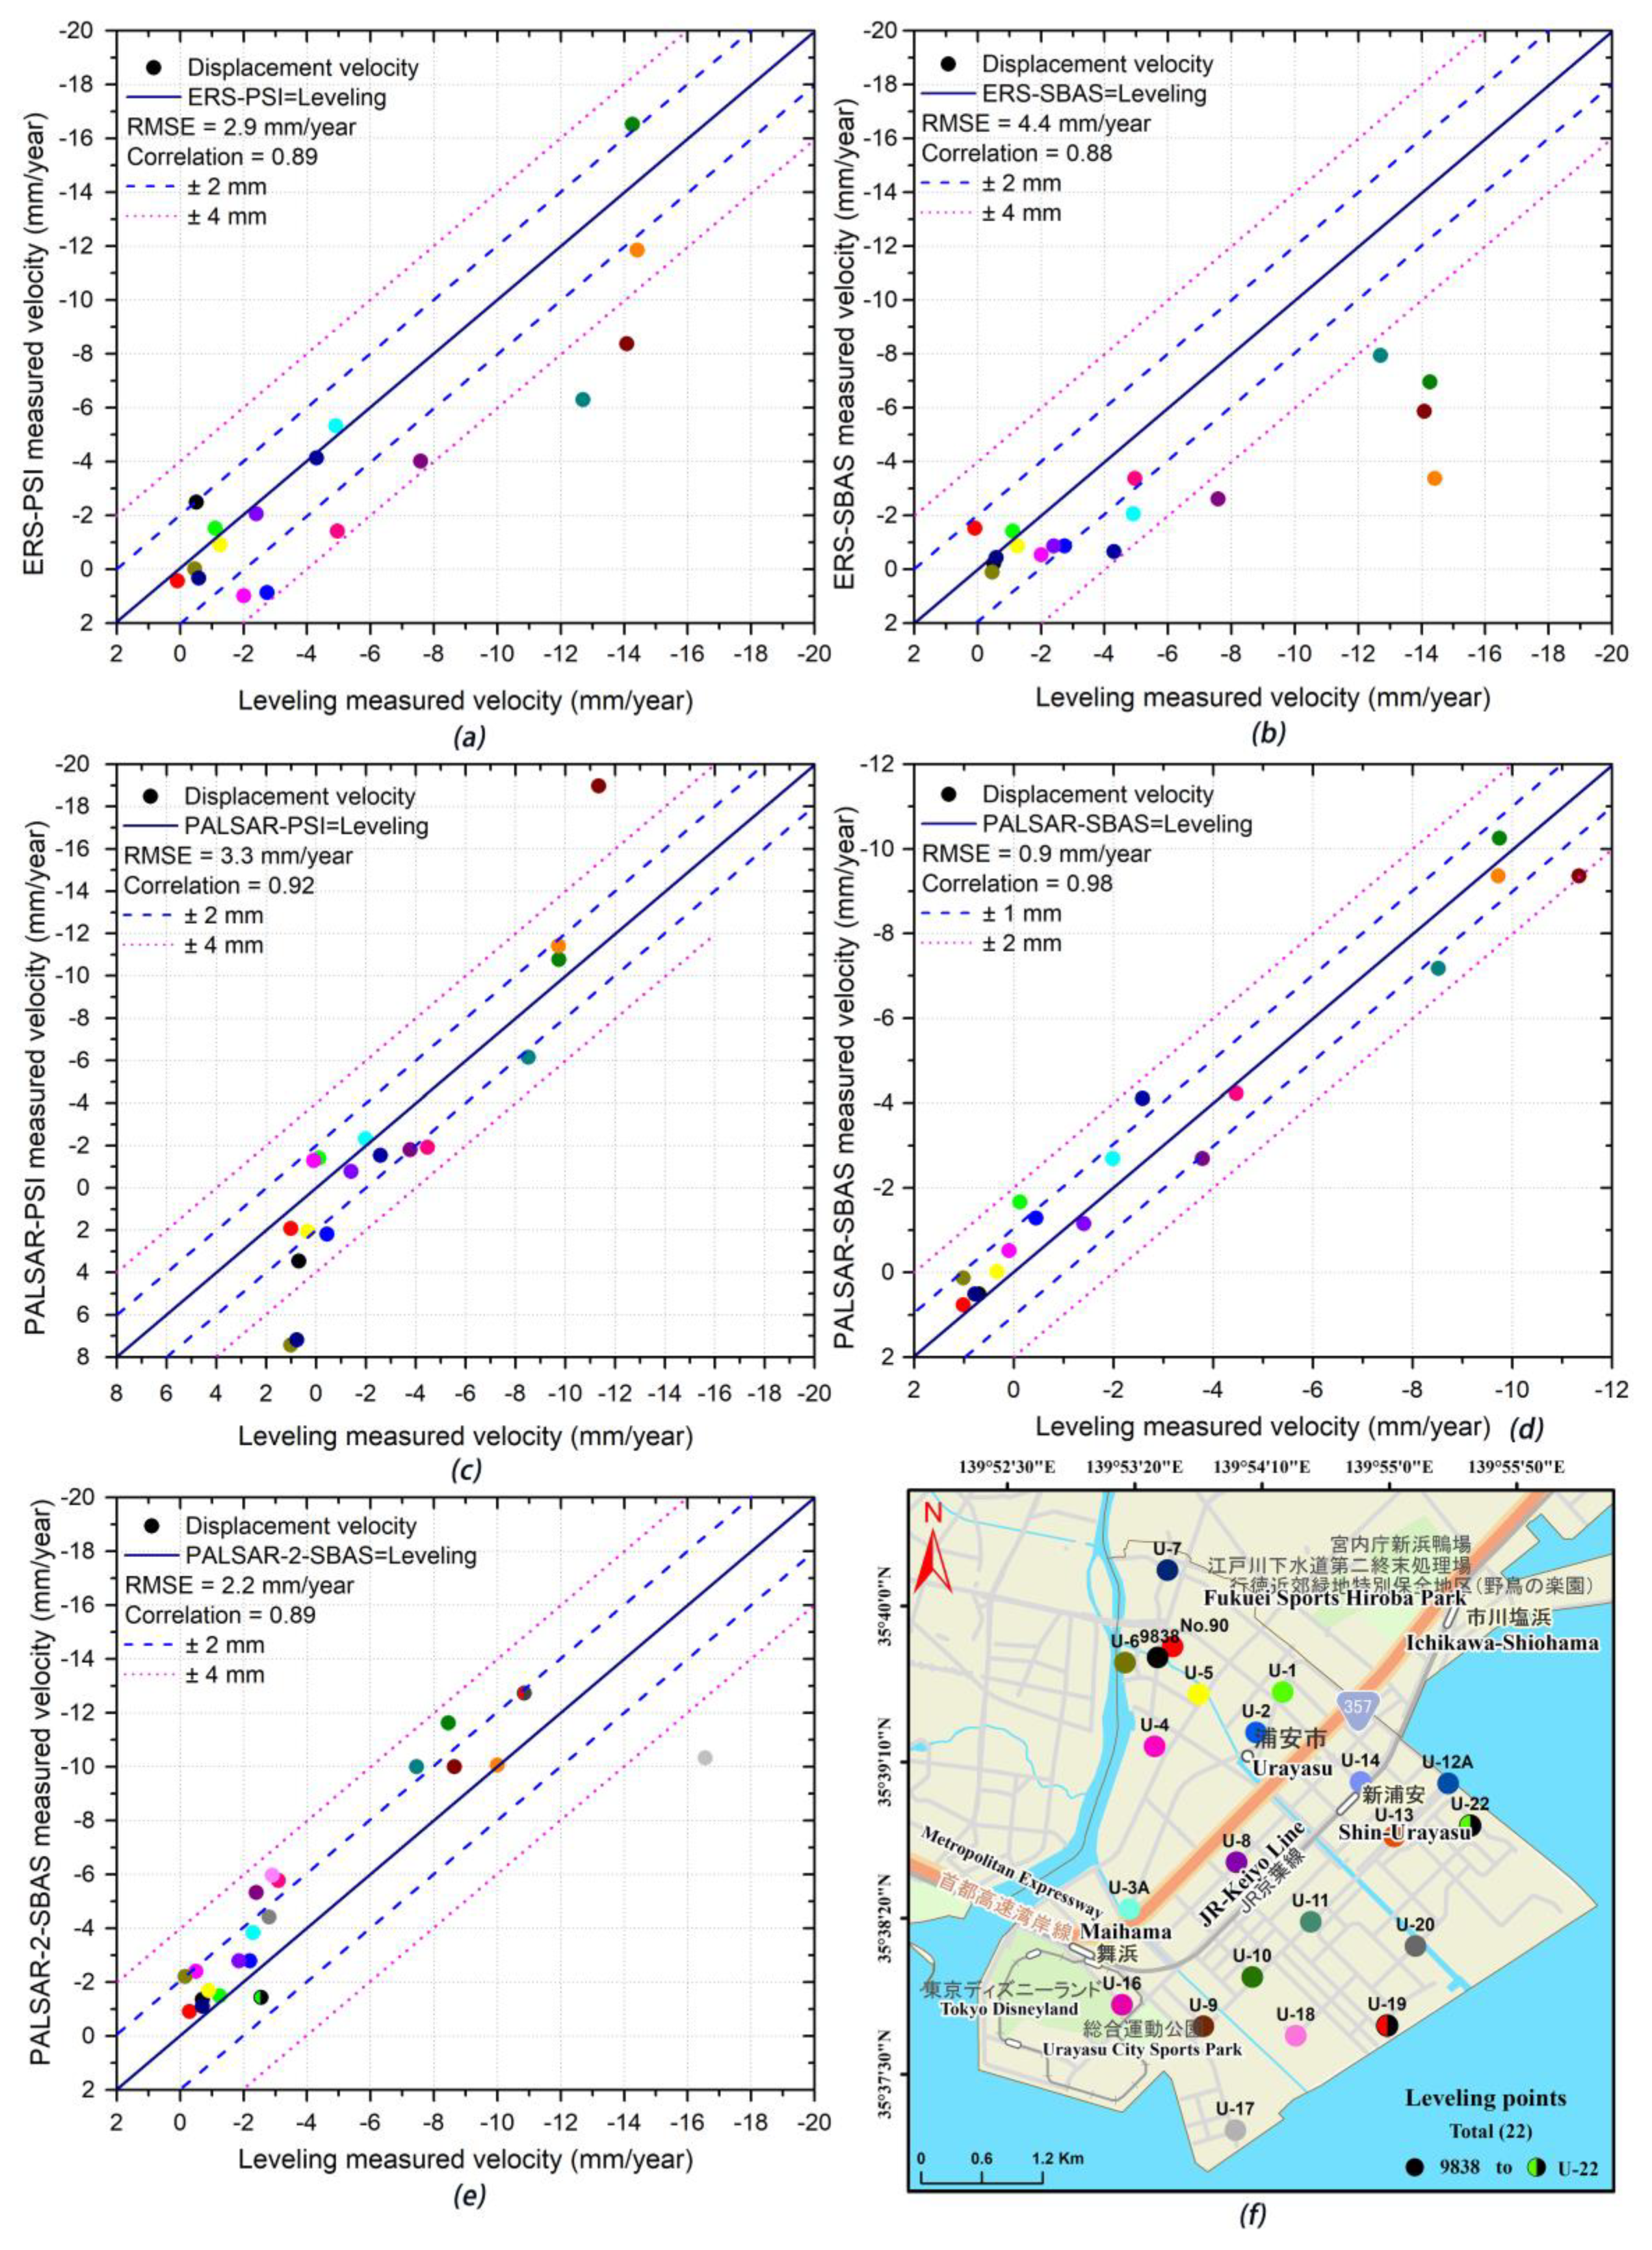
Figure 12 shows the spatial distribution of the leveling points and the comparison between the leveling and InSAR-derived linear subsidence rate. Note that the number of leveling points are different among the different InSAR observation periods; 17 leveling points were used for the comparison of the ERS-1/-2 and PALSAR observation periods, while 21 leveling points were used for the PALSAR-2 observation period, which is due to five new leveling points being established after the 2011 Tohoku Earthquake and the leveling point U-12A being missing in 2016. We also used different plot scales (20 mm/year vs. 12 mm/year) and (2/4 mm vs. 1/2 mm for error lines), due to the smaller errors shown in PALSAR data using the SBAS method (Figure 12d). The comparison results show that the results from the ERS-1/-2 data using the SBAS method have the largest root mean square errors (RMSEs) of 4.4 mm/year, while the results from PALSAR and PALSAR-2 data using the SBAS method have the smallest RMSEs of 0.9 and 2.2 mm/year, respectively. For the ERS-1/-2 and PALSAR data, more than 12 out of the 17 measurement points showed a residual value of less than 4 mm/year (Figure 12a–d); for the PALSAR-2 data, and 14 out of the 21 measurement points showed a residual value of less than 2 mm/year (Figure 12e). As shown in Figure 12a,b,e, the results from the ERS-1/-2 and PALSAR-2 data using the PSI and SBAS method showed the largest discrepancies at several leveling points. This may have been caused by the low coherence of ERS-1/-2 datasets and the contribution of phase noise. The fewer PALSAR-2 image pairs and the sudden elevation changes in the ground, i.e., the leveling point U-17 subsided by the influence of construction work during 2015–2016 [37], may also affect the comparison result. Nevertheless, according to these comparisons, the InSAR-derived results agree relatively well with the result of the leveling measurements and suggest the reliability of the InSAR-measured subsidence rate.
5.2. Spatial and Temporal Patterns of Land Subsidence
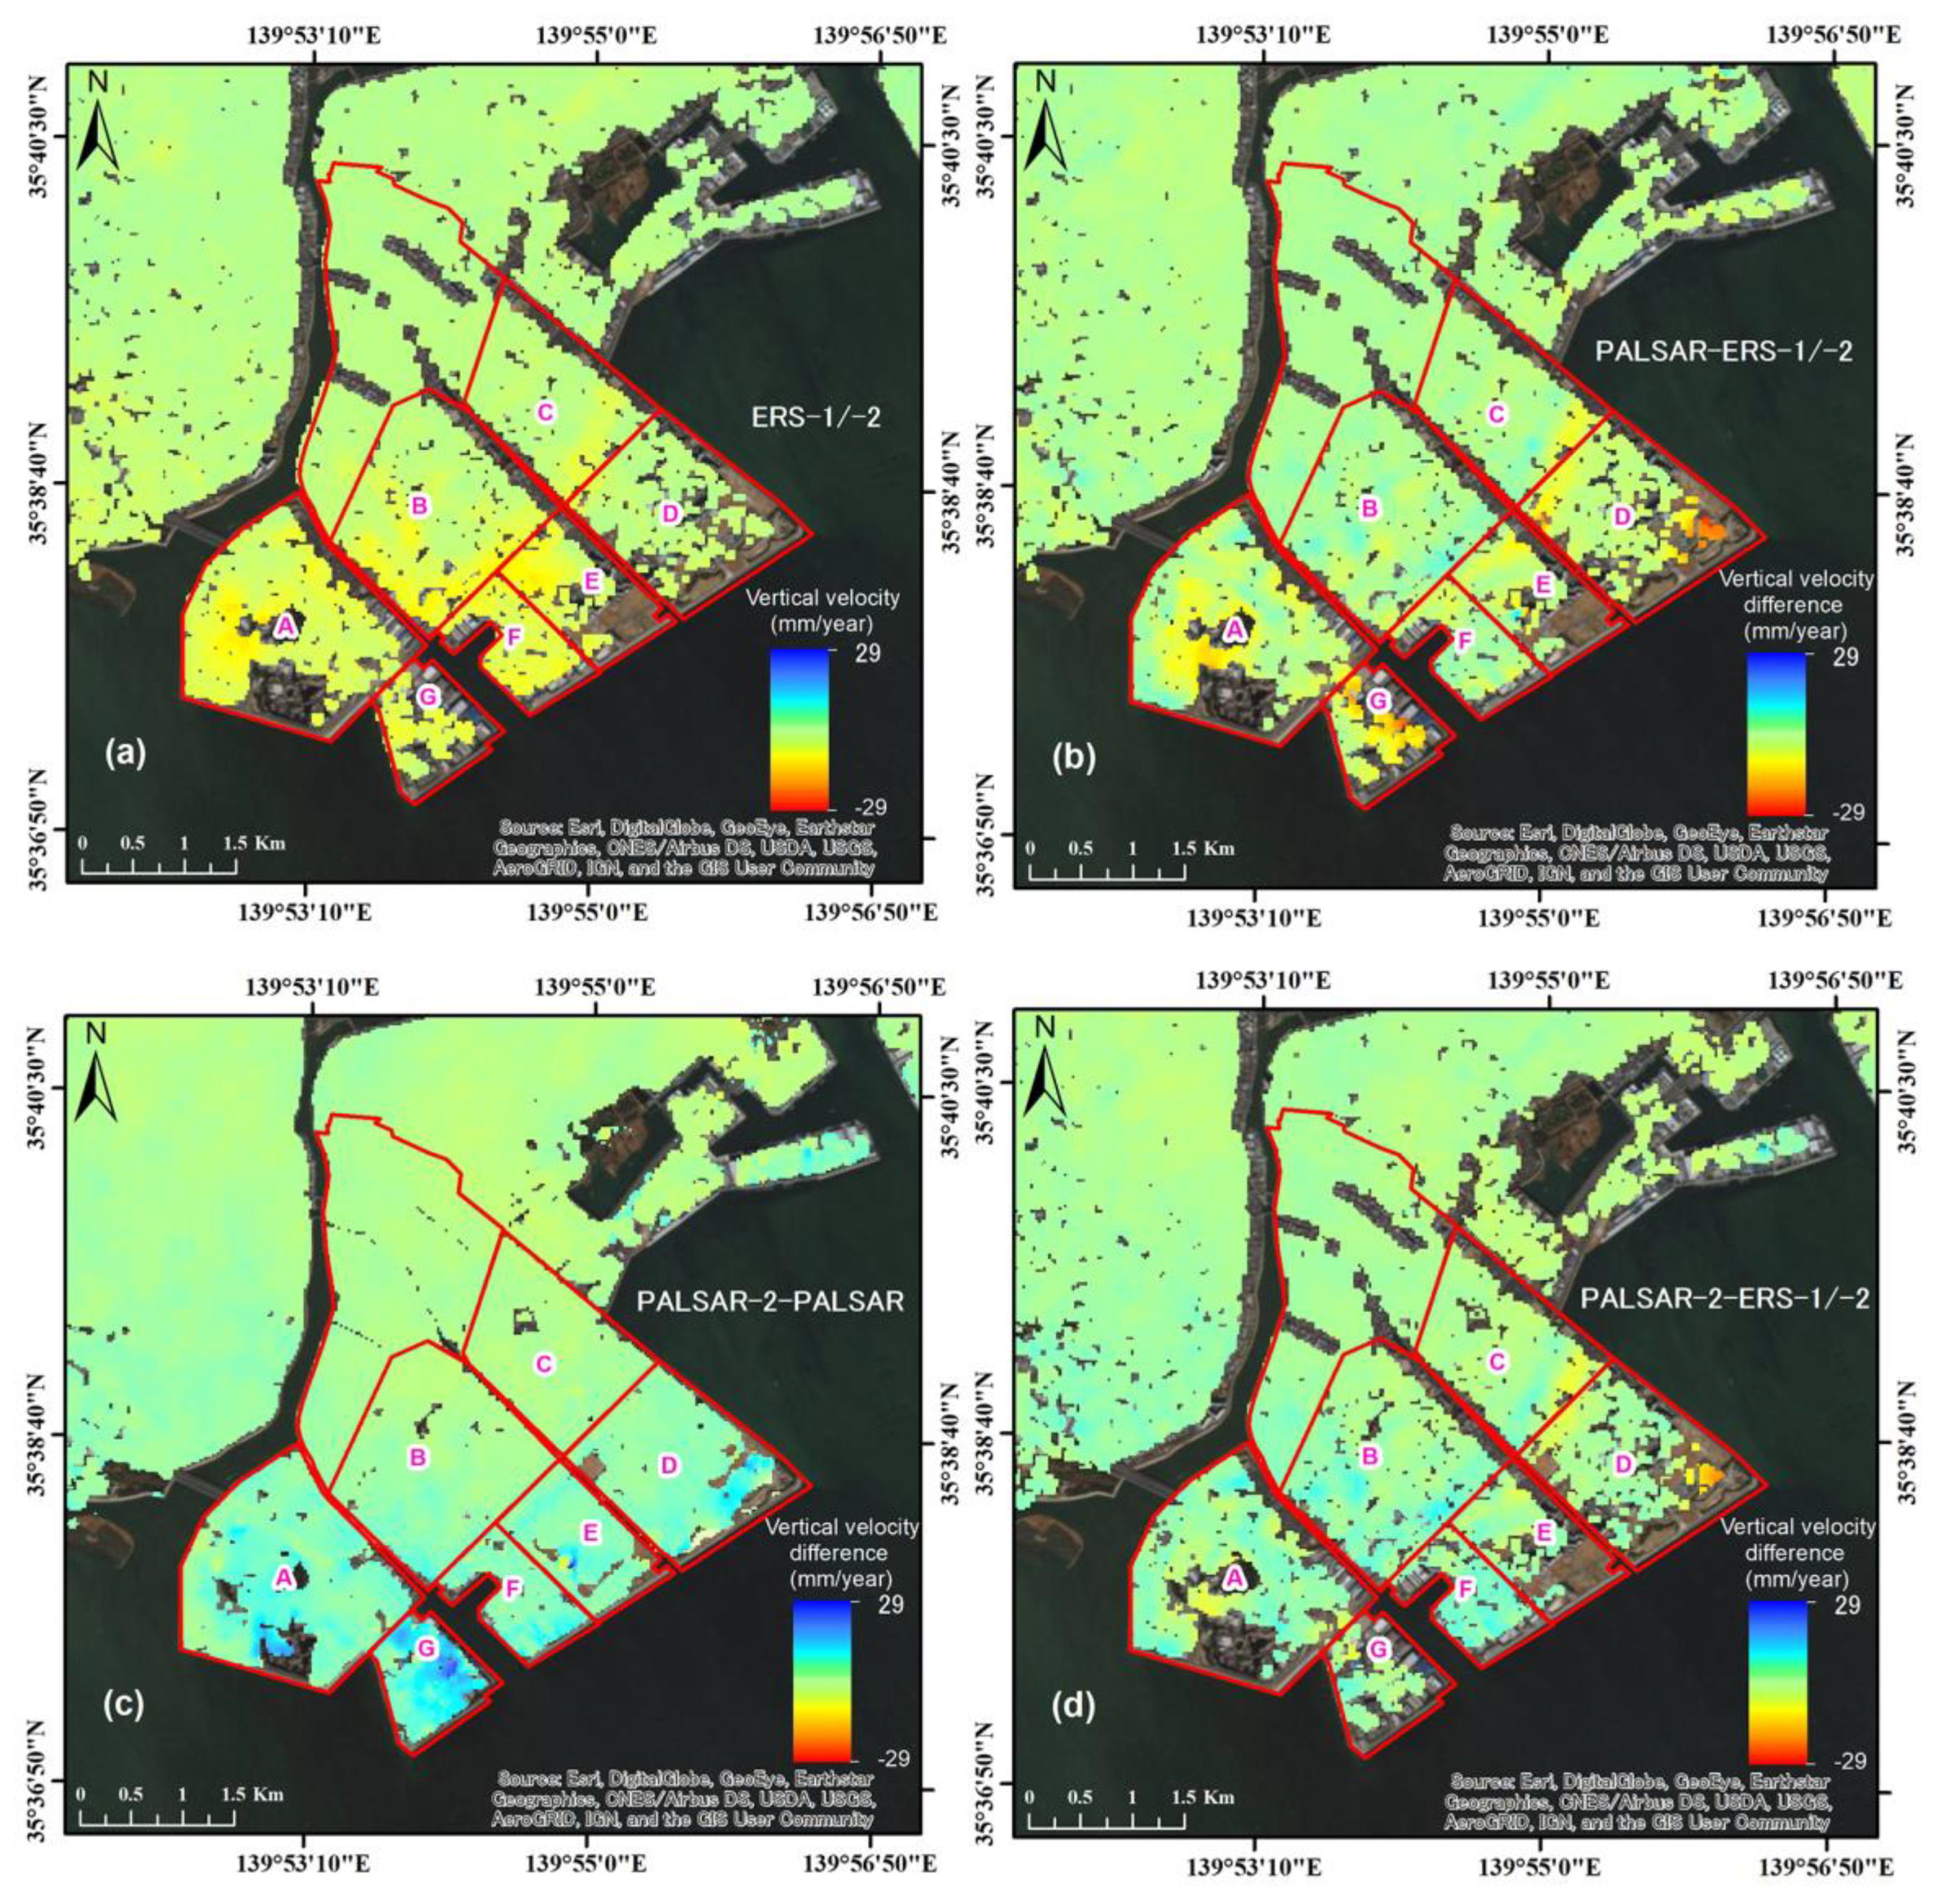
To further reveal the land subsidence patterns in different districts over the three observation periods, we generated the spatial distribution map of difference of land subsidence rates (Figure 13) using the ArcGIS 10.3 (Esri, Redlands, CA, USA) spatial analyst tool. As the incidence angles of those sensors are different, before comparison, the LOS displacement velocity was converted into the vertical displacement velocity by dividing the cosine of the sensor incidence angle [53]. It can be seen from Figure 13a that the areas in the central town (i.e., Maihama (A), Tekkodori, Benten, Imagawa (B) and Irifune (C)) and new town (i.e., Takasu (E), Minato (F) and Chidori (G)) show slight to moderate subsidence with a 2–13 mm/year rate during the ERS-1/-2 observation period. From Figure 13b, we can see that the subsidence rate in some of the districts of the central town (e.g., Benten, Tekkodori and Imagawa (B)) has decreased up to 12 mm/year; while the areas in the new town showed increasing subsidence up to 28 mm/year, especially in Hinode (D) and Chidori (G). The comparison of PALSAR-2 and PALSAR estimated subsidence rate show that, the previous subsiding areas were experiencing a reduced subsiding rate, except some localized subsidence in the new town (Figure 13c). The comparison of PALSAR-2 and ERS-1/-2 estimated subsidence rate show that, the subsidence in both of the central town and new town has significantly decreased, except for areas in Maihama (A), Irifune (C), Hinode and Akemi (D) (Figure 13d). In general, most of those areas in the central town are residential and commercial amusement land, while the bew town are parks and industrial land. The subsidence in parks can only be caused by the natural soil consolidation, while in the residential, commercial and industrial areas, the subsidence may be caused from the integrated effect of numerous natural and anthropogenic processes.
5.3. The Use of Different SAR Sensors in Land Subsidence Monitoring
The number of satellite data sources is currently increasing steadily. These datasets from the previous SAR sensors such as ESA archive (ERS-1/-2, ENVISAT) as well as the new generation of C, X and L-band SAR images provided by the RADARSAT-2, Sentinel-1A, ALOS-2, TerraSAR-X, Tandem-X and the COSMO-SkyMed constellation, etc. have enabled us to compute the time series of the occurred and on-going surface displacements from regional scale to individual buildings. In particular, the exploitation of the free and open access data archives collected by the Sentinel-1A system permit us to conduct continuous land deformation analysis over large areas.
In this study, three different SAR datasets, the ERS-1/-2, ALOS PALSAR and ALOS-2 PALSAR-2, were used to monitor the long-term land subsidence in Urayasu City. The C-band has a shorter wavelength and hence better displacement sensitivity, and the L-band has longer wavelength and lower frequency showing more extensive coverage over natural areas and less temporal decorrelation. The data acquired by these satellites cover long periods of time and enabled us to perform long-term deformation monitoring of the study area. However, those different sensors have different imaging parameters, e.g., spatial and temporal resolution, incidence angle, and wavelength, which show different characteristics in terms of their maximum detection gradient, degree of decorrelation, capability of noise rejection, etc. The different imaging parameters and the use of an uneven number of images among different sensors cause some difficulties in comparing their performance and the quality control of multi-sensor InSAR results. Moreover, the low resolution and the longer revisit time of ERS-1/-2 and PALSAR has prevented us from observing short-term land deformations caused by the anthropogenic activities. Furthermore, data gaps between the PALSAR and PALSAR-2 caused some difficulties in analyzing InSAR results.
5.4. Land Subsidence and Possible Causes
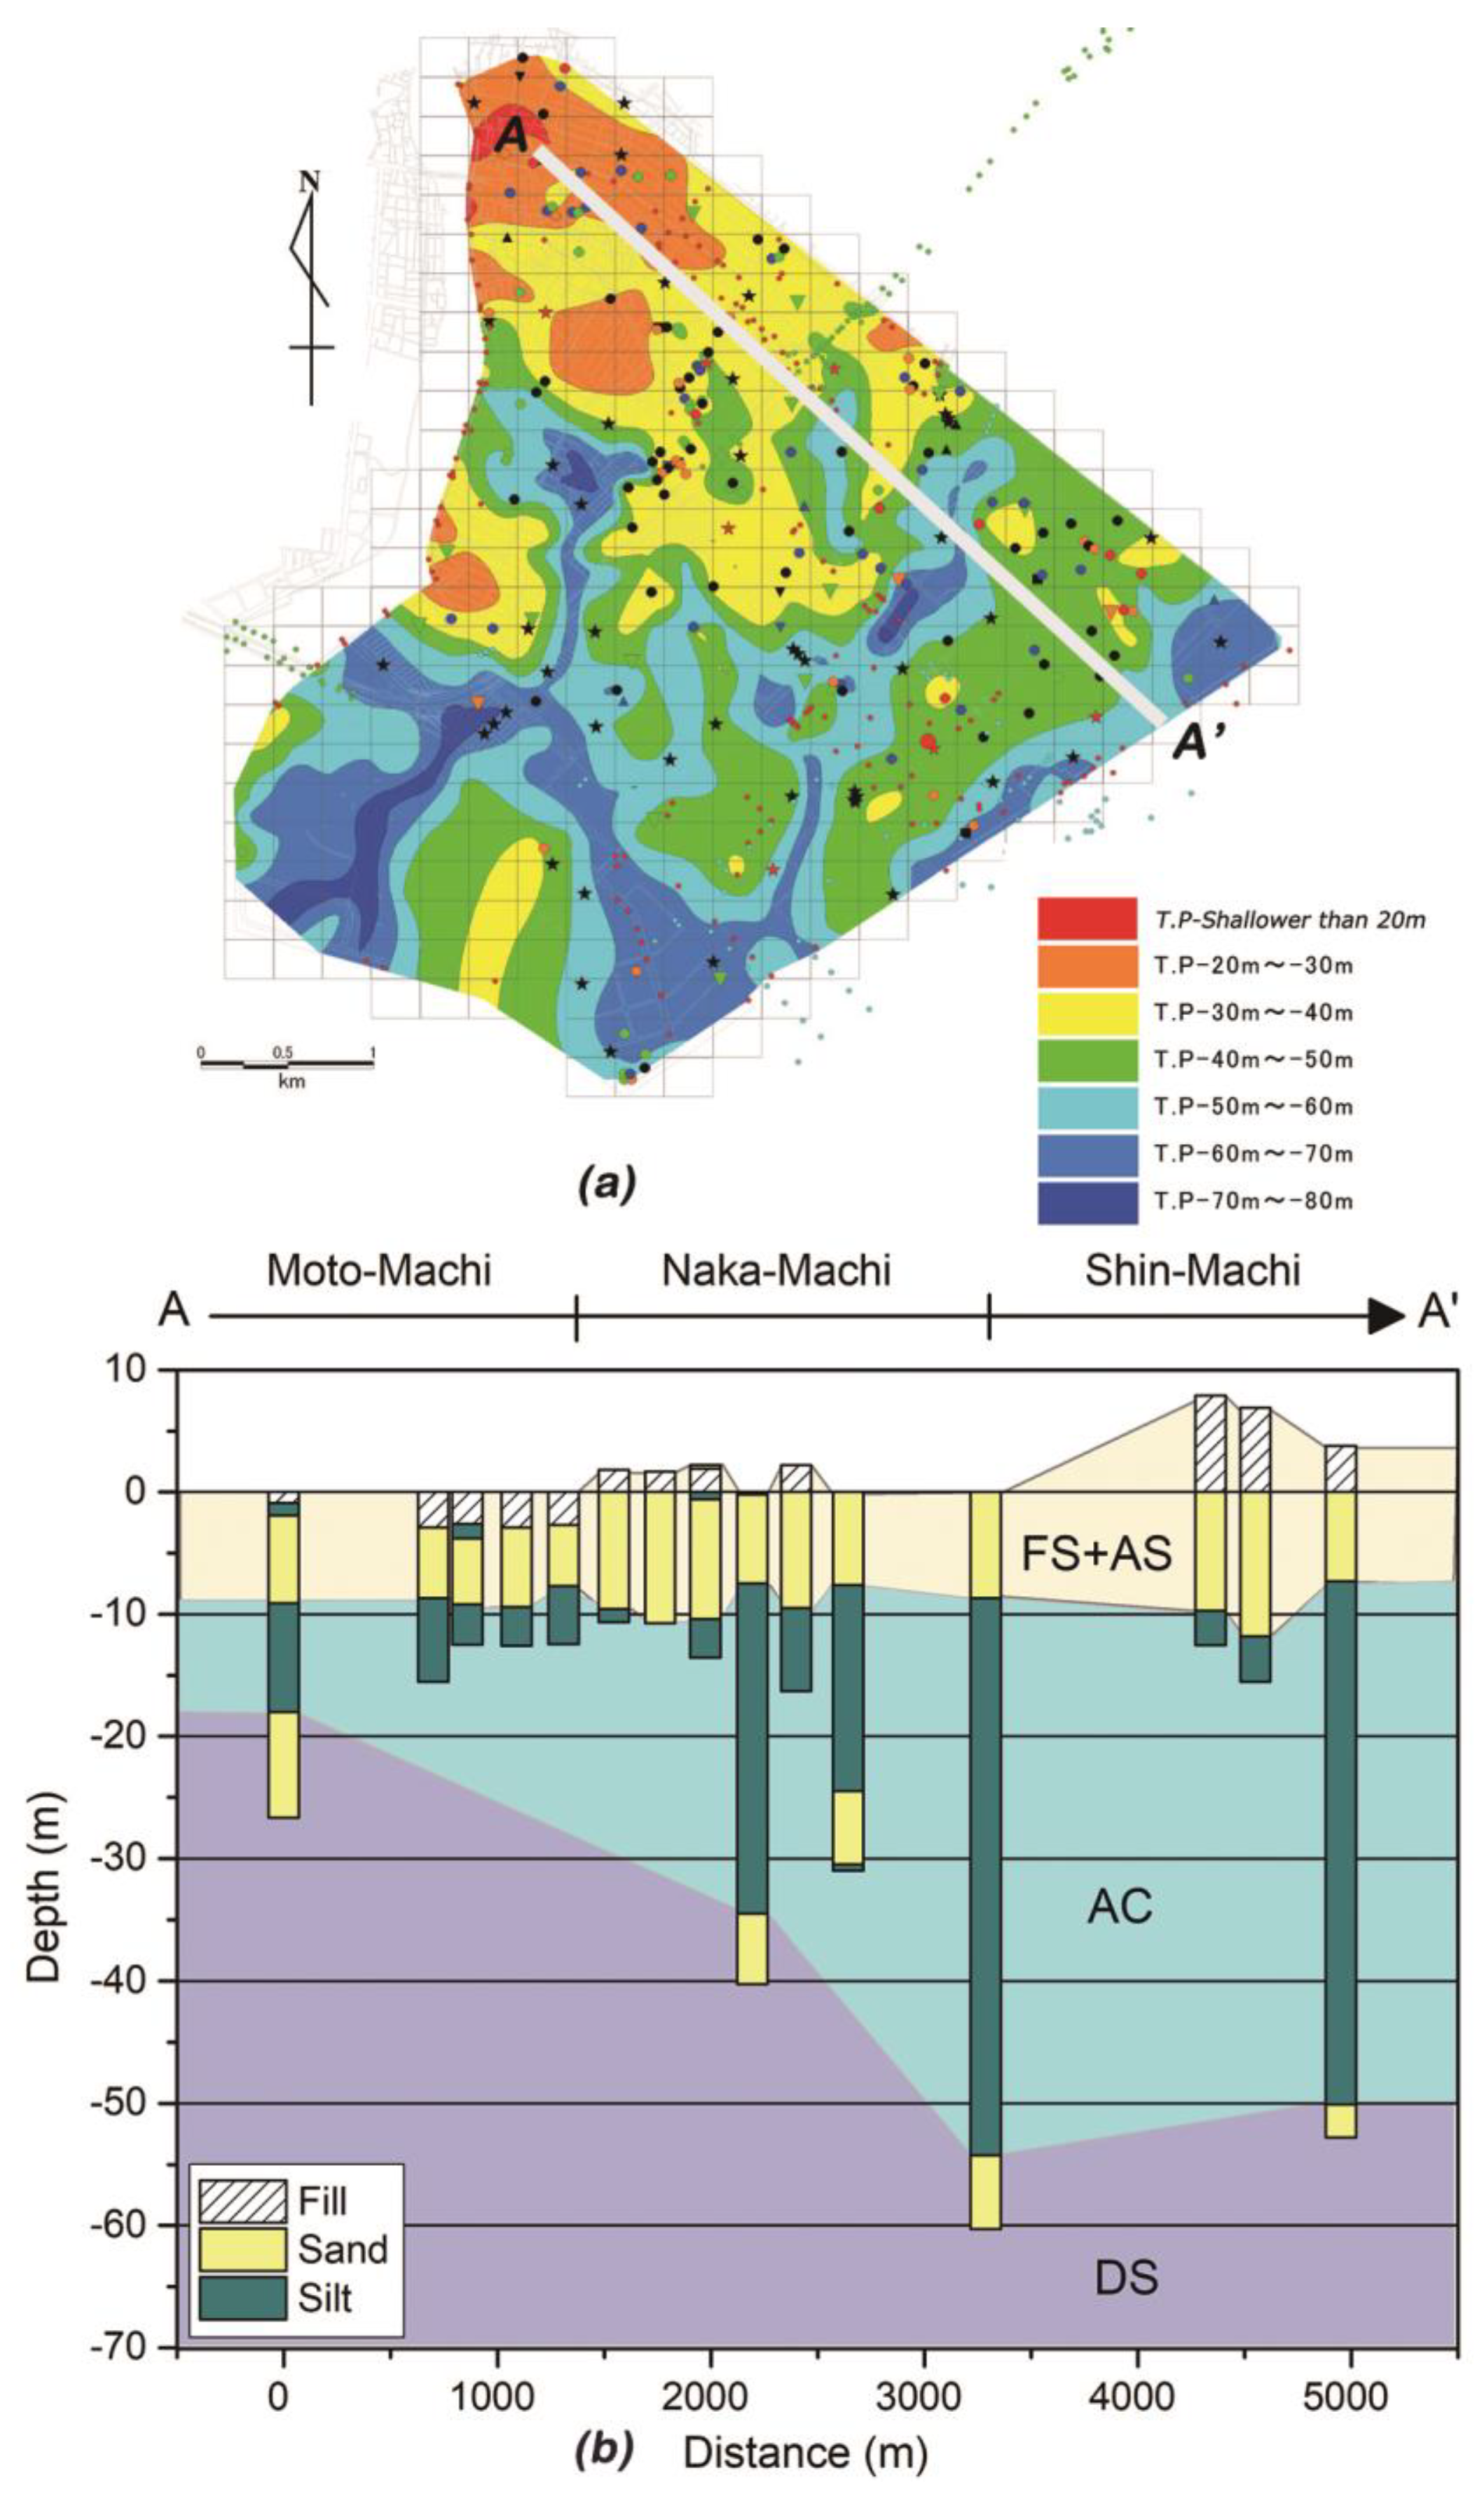
The origin of land subsidence in coastal areas can be summarized into two categories: either caused by natural causes (e.g., natural compaction/consolidation of soil or tectonic movements, such as earthquakes) or anthropogenic activities (e.g., oil, gas and ground water exploitation). In some cases, the pattern of land subsidence might be even more complicated when it is caused by the combined effects of multiple factors at different scales. In Urayasu City, since most of the areas are land-filled, the natural consolidation of soil is postulated to be the primary driver of land subsidence. To further analyze the relation between subsidence and soil geology, we compared the InSAR-derived subsidence areas with the geologic map showing the depth of the upper surface of the solid geological stratum in Urayasu City (Figure 14a) and found a remarkable spatial correlation between the geologic map of the soil properties and the subsiding areas. In most of the reclaimed zones, the upper layer of soil filled with hill sand and dredged sandy soil (FS) with a standard penetration test (SPT) N-value of 2–8; an alluvial sand layer (AS) with SPT N-value of 10–20 underlies the filled layer; a very soft alluvial clay (AC) is deposited under the AS layer with a low SPT N-value of 0–5; a diluvial (Pleistocene) dense sand layer (DS) with SPT N-value of 50 or greater is deposited blow the AC layer (Figure 14b) [23,24]. Along the line A–A’, the thickness of AC layer increases significantly between the Naka-Machi and Shin-Machi area, and it continues towards the sea (Figure 14b). As the consolidation of soil occurs in soft clay deposits, the thick AC layers in Naka-Machi and Shin-Machi area are most probably responsible for the continuing subsidence in Urayasu City.
As shown in Figure 14a, the depth of the bottom of the alluvial layers increases from 20 m in Moto-Machi to about 40 m in Shin-Machi, with several narrow-buried valleys of up to 70 m in depth. The buried-valleys, which are about 60 m deep, exist directly below the Minato, Chidori, Tekkodori, Imagawa, Akemi and Irifune areas, causing complicated changes in the thickness of the soft ground in those areas, while the depth increases up to 80 m in Maihama where the largest subsidence occurred. This further suggests that the areas undergoing large subsidence correspond to those having thick layers of soft soil over a stiff basement. The Moto-Machi area, with soil deposits consisting of sandy soils with an alluvial origin, was quite stable over the observation period, while the Naka-Machi and Shin-Machi areas, with thick layers of fine-grained soft soil overlying a stiff basement, had significant land subsidence over the study period. However, considering the complexity of the land use and the anthropogenic activities in different districts of Urayasu City, the subsidence may not be solely caused by the natural consolidation, but also from the integrated effects of numerous natural and anthropogenic processes.
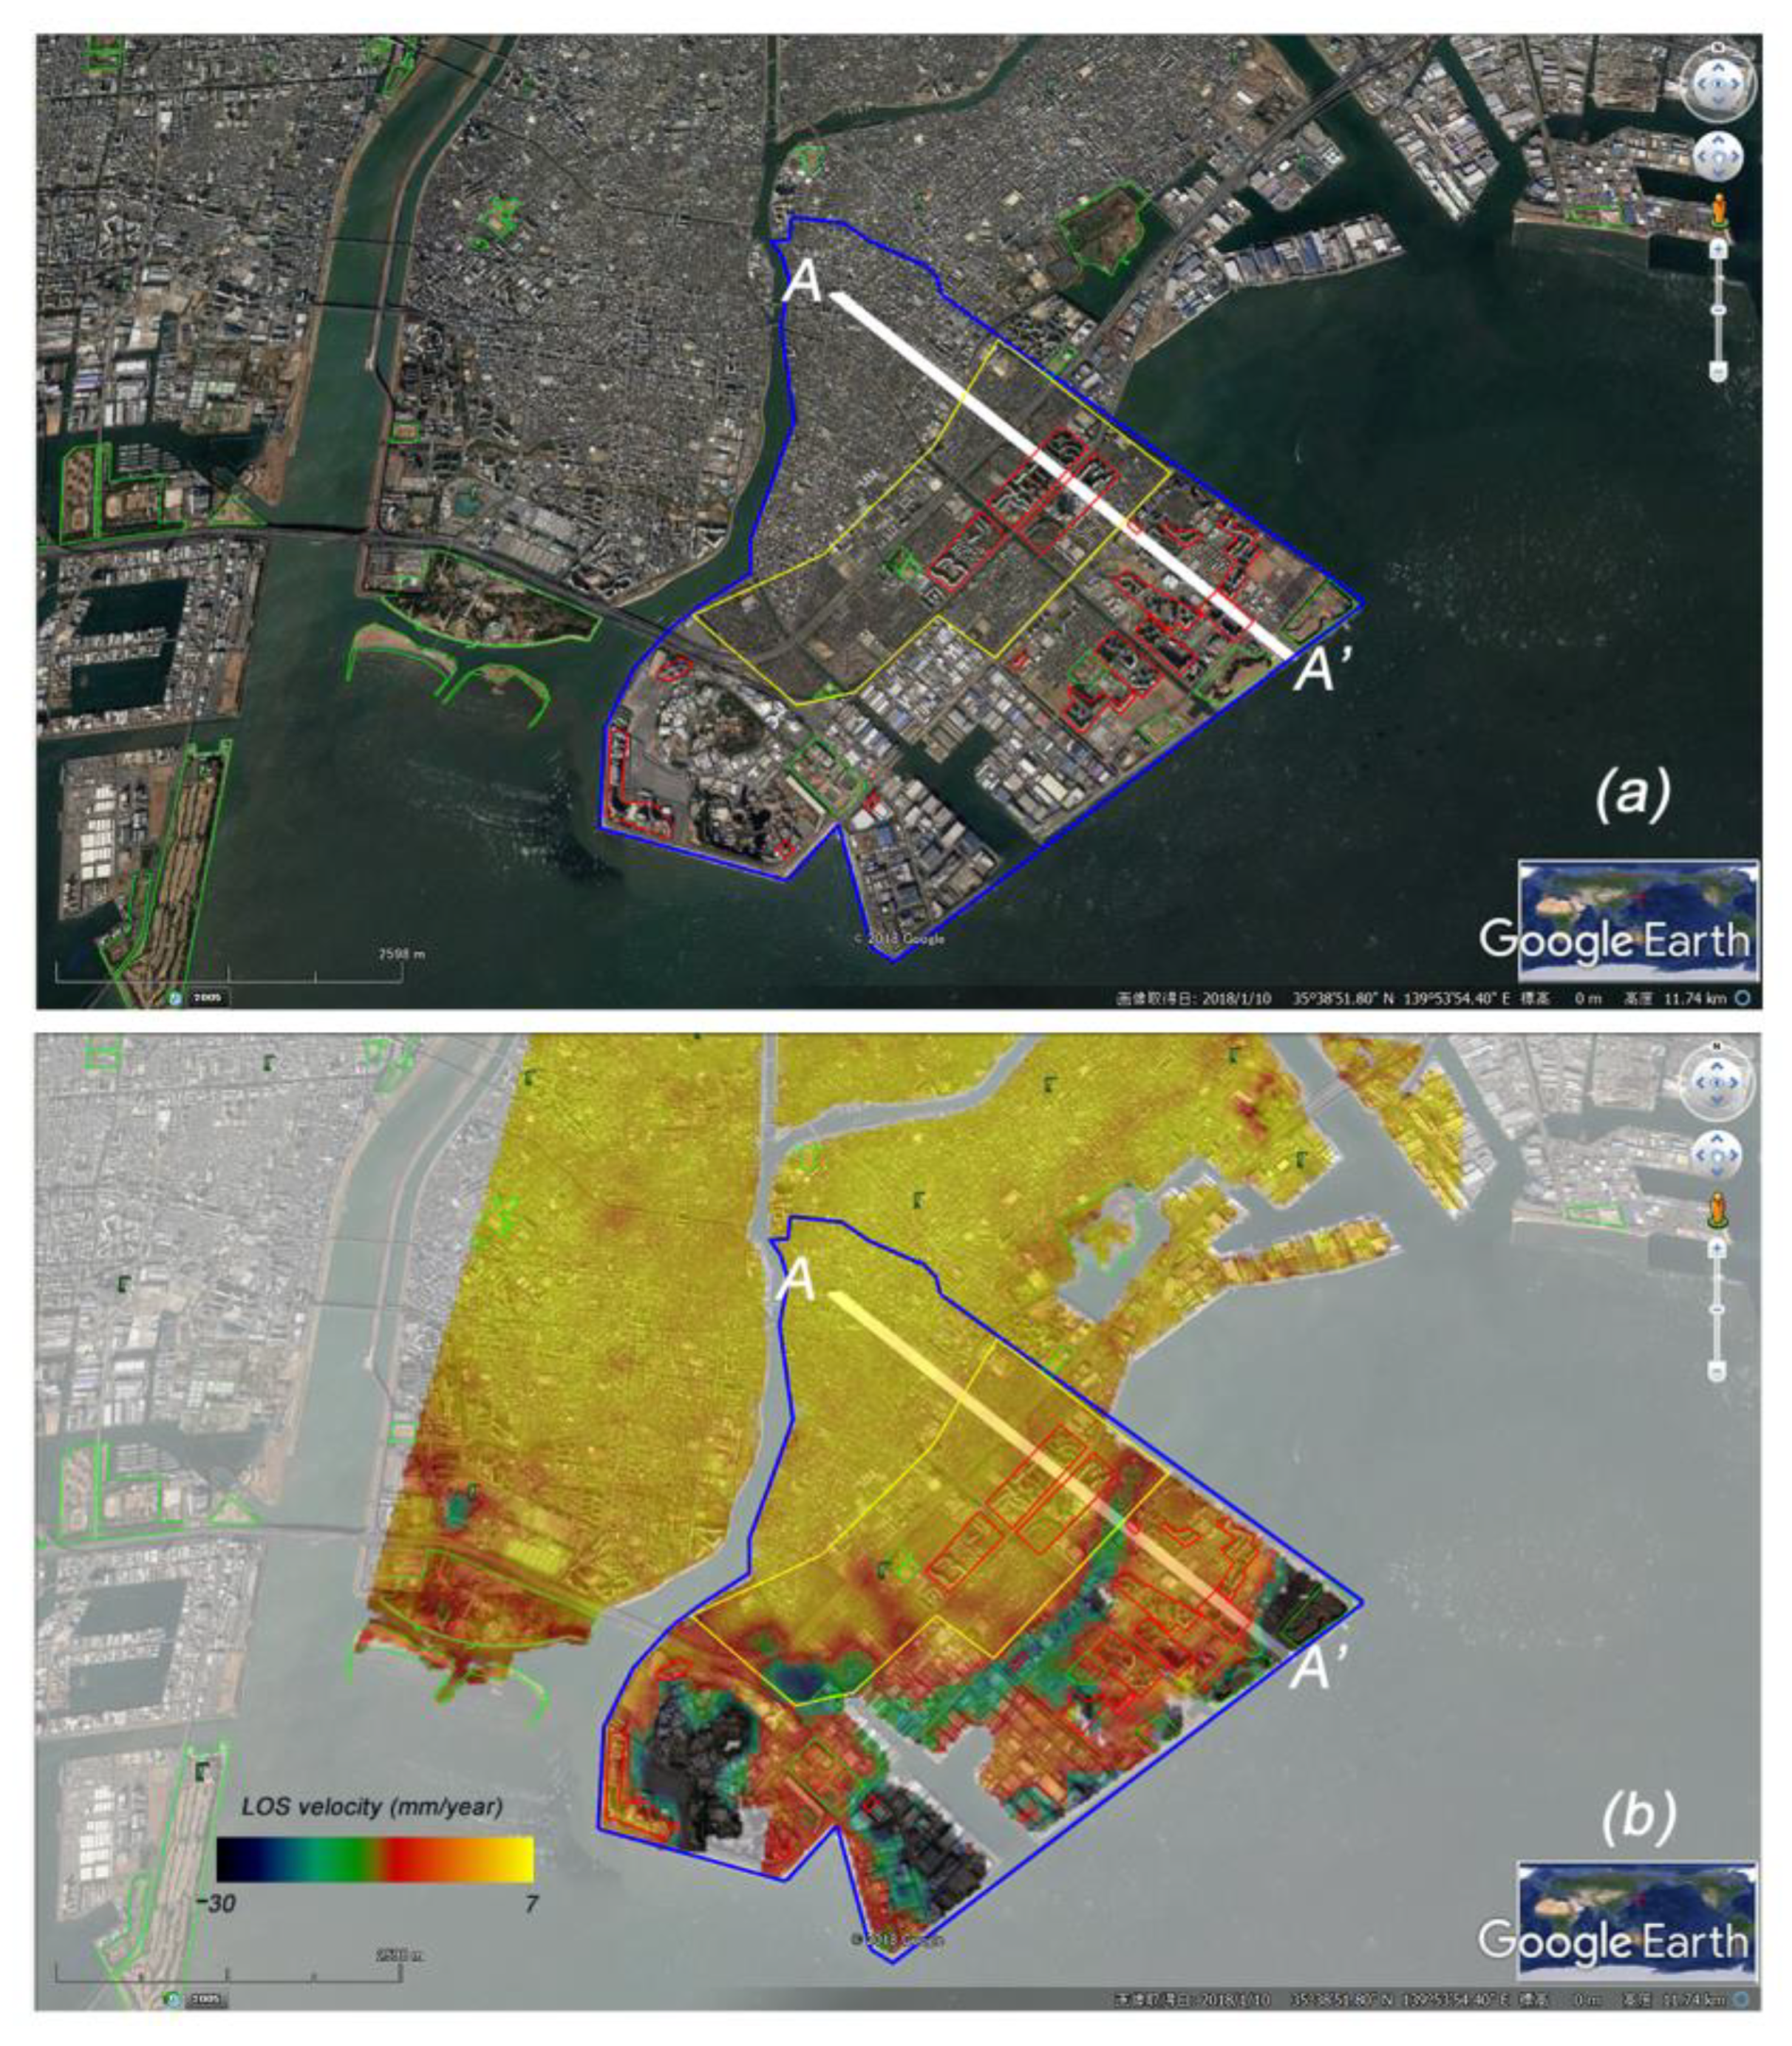
The additional load of buildings and structures is also considered to be one of the causes of land subsidence in urban areas [56]. In Urayasu City, since the establishment of Urayasu town in 1909 in the old town (Moto-Machi)—a naturally formed Holocene lowland—the natural soil consolidation might be gradually reduced and stopped. Besides this, the density of buildings in the old town are lower than the central town. Many houses, commercial buildings and public facilities were built in the central town during the first phase of the project, ending in 1975. Meanwhile, many high-rise buildings, universities, hotels and storehouses were built in the new town during the second phase of the project, ending in 1980 [22]. The additional load during and after the building construction, especially the high-rise buildings, could transfer a high loading to the ground and may eventually lead to substantial land subsidence. However, these buildings use a pile foundation to satisfy bearing capacity and deformation and may not show significant subsidence while the surrounding areas are subsiding. Figure 15 shows the InSAR-derived subsidence velocity (2006–2010) and the locations of high-rise buildings. Most of those buildings show stability, whereas their surroundings show land subsidence. However, further investigations are expected to determine the relationship between land subsidence and the building density/high rise buildings.
The Maihama district in the central town, where Tokyo Disneyland is located, showed significant subsidence throughout the whole InSAR observation period. However, in this area, the pattern of land subsidence may be even more complicated due to the continuous construction and renovation/redevelopment of the fantasy-land and other anthropogenic activities. The SAR images with a low resolution and longer revisiting time, and the linear inversion model used in the InSAR processing, may hinder the effective monitoring of short-term movements such as those induced by human activities and may cause some biased results. Therefore, more high-resolution SAR data with a short revisiting time and further investigation is required to understand the intricacies of the relationship between land subsidence, natural consolidation and load of buildings.
Ground water exploitation is one of the major causes of land subsidence in many coastal cities, such as in Jakarta [5], Bangkok [8] and Shanghai [57]. Nevertheless, this may not be the cause of land subsidence in Urayasu City; this is because the ground water exploitation was gradually reduced and stopped in 1993 [58], and the city receives water from a water purification plant which uses the main water sources of the Tone river and Edogawa river [59]. Moreover, since April 1992, Chiba Prefecture has been implementing restriction rules on groundwater use for the highly susceptible areas of land subsidence, including Urayasu City [60]. Thus, the ground water exploitation has insignificant impacts on land subsidence in Urayasu City.
As an earthquake-prone country, earthquakes happen frequently in Japan. Earthquakes have significant influences on coastal areas, especially on reclaimed land. In the 2011 Tohoku earthquake, houses and infrastructures were severely damaged due to soil liquefaction in Urayasu City [22]. In addition, long-term ground settlement was also observed after the earthquake, and the degree of subsidence was different in areas where reclaimed soils were improved or not [24]. In the areas where the soil was not improved, the subsidence may have been accelerated by the earthquake. The InSAR observation results derived from the PALSAR-2 data showed significant continuing land subsidence near the levee areas (mostly parks and vacant lands), which may have been accelerated by the effects of the earthquake. However, most areas showed a decrease of land subsidence, this may be related to the fact that the PALSAR-2 observations (December 2014 to November 2017) were collected almost 4 years after the Tohoku earthquake, and considering the soil aging effect and soil improvement, the land settlement in most of those areas caused by the natural soil consolidation and the earthquake might gradually decrease. It is worth mentioning that after the earthquake, the Urayasu government started to test several countermeasure methods, such as lowering the ground water level and grid wall soil improvement. Finally, Urayasu has adopted the grid wall soil improvements as a countermeasure to prevent future risks [61]. This project may also have played a positive role in alleviating the land subsidence in Urayasu City.
6. Conclusions
In this study, to monitor the long-term spatial patterns of land subsidence in Urayasu City, we used three sets of different SAR data and advanced InSAR techniques. The obtained InSAR results during the three observation periods from 1993–2010 and 2014 to 2017 show continuing subsidence occurring in several reclaimed areas of Urayasu City. The maximum subsidence rate from 1993 to 2006 was approximately 27 mm/year, from 2006 to 2010 it was 30 mm/year, and from 2014 to 2017 it was about 18 mm/year. The results were verified by comparing them with the leveling survey data. The comparison shows that the obtained InSAR results agree well with the leveling measurements, with a correlation value of over 0.8. The natural consolidation of soil in the reclaimed areas can be considered as a primary driver of land subsidence in Urayasu City, while the integrated effects of numerous natural and anthropogenic processes are also not negligible. Considering the soil aging effect, water-use restriction rules and soil improvement work performed by the government and land owners might also have played a positive role in alleviating the land subsidence and related disasters. However, further investigation is required to understand the intricacies of the relationship between the land subsidence and anthropogenic activities. The outcome of this research further proves the suitability and effectiveness of InSAR measurements in the land subsidence monitoring of coastal urban areas.
Author Contributions
Y.A. conceived the work, processed the SAR data and wrote the paper; F.Y. and W.L. supervised the data processing and revised the manuscript.
Funding
This research received no external funding.
Acknowledgments
We would like to thank JAXA for providing the ALOS-PALSAR and ALOS-2 PALSAR-2 data and ESA for providing the ERS-1/-2 data used in this study. We would also like to thank the editor and the three anonymous reviewers for their insightful comments that greatly helped to improve the quality of this manuscript.
Conflicts of Interest
The authors declare no conflict of interest.
References
- Pradhan, B.; Abokharima, M.H.; Jebur, M.N.; Tehrany, M.S. Land subsidence susceptibility mapping at Kinta Valley (Malaysia) using the evidential belief function model in GIS. Nat. Hazards 2014, 73, 1019–1042. [Google Scholar] [CrossRef]
- Chaussard, E.; Amelung, F.; Abidin, H.; Hong, S.-H. Sinking cities in Indonesia: ALOS PALSAR detects rapid subsidence due to groundwater and gas extraction. Remote Sens. Environ. 2013, 128, 150–161. [Google Scholar] [CrossRef]
- Tessler, Z.D.; Vorosmarty, C.J.; Grossberg, M.; Gladkova, I.; Aizenman, H.; Syvitski, J.P.M.; Foufoula-Georgiou, E. Profiling risk and sustainability in coastal deltas of the world. Science 2015, 349, 638–643. [Google Scholar] [CrossRef] [PubMed] [Green Version]
- Jones, C.E.; An, K.; Blom, R.G.; Kent, J.D.; Ivins, E.R.; Bekaert, D. Anthropogenic and geologic influences on subsidence in the vicinity of New Orleans, Louisiana. J. Geophys. Res. Solid Earth 2016, 121, 3867–3887. [Google Scholar] [CrossRef]
- Abidin, H.Z.; Andreas, H.; Gumilar, I.; Fukuda, Y.; Pohan, Y.E.; Deguchi, T. Land subsidence of Jakarta (Indonesia) and its relation with urban development. Nat. Hazards 2011, 59, 1753–1771. [Google Scholar] [CrossRef]
- Ng, A.H.M.; Ge, L.; Li, X.; Abidin, H.Z.; Andreas, H.; Zhang, K. Mapping land subsidence in Jakarta, Indonesia using persistent scatterer interferometry (PSI) technique with ALOS PALSAR. Int. J. Appl. Earth Obs. Geoinf. 2012, 18, 232–242. [Google Scholar] [CrossRef]
- Ho Tong Minh, D.; Van Trung, L.; Le Toan, T. Mapping ground subsidence phenomena in Ho Chi Minh City through the radar interferometry technique using ALOS PALSAR data. Remote Sens. 2015, 7, 8543–8562. [Google Scholar] [CrossRef] [Green Version]
- Aobpaet, A.; Cuenca, M.C.; Hooper, A.; Trisirisatayawong, I. InSAR time-series analysis of land subsidence in Bangkok, Thailand. Int. J. Remote Sens. 2013, 34, 2969–2982. [Google Scholar] [CrossRef]
- Dong, S.; Samsonov, S.; Yin, H.; Ye, S.; Cao, Y. Time-series analysis of subsidence associated with rapid urbanization in Shanghai, China measured with SBAS InSAR method. Environ. Earth Sci. 2014, 72, 677–691. [Google Scholar] [CrossRef]
- Xu, B.; Feng, G.; Li, Z.; Wang, Q.; Wang, C.; Xie, R. Coastal subsidence monitoring associated with land reclamation using the point target based SBAS-InSAR method: A case study of Shenzhen, China. Remote Sens. 2016, 8, 652. [Google Scholar] [CrossRef]
- Tosi, L.; Teatini, P.; Strozzi, T. Natural versus anthropogenic subsidence of Venice. Sci. Rep. 2013, 3, 2710. [Google Scholar] [CrossRef] [PubMed]
- Koster, K.; Erkens, G.; Zwanenburg, C. A new soil mechanics approach to quantify and predict land subsidence by peat compression. Geophys. Res. Lett. 2016, 43, 10792–10799. [Google Scholar] [CrossRef]
- Raspini, F.; Loupasakis, C.; Rozos, D.; Adam, N.; Moretti, S. Ground subsidence phenomena in the Delta municipality region (Northern Greece): Geotechnical modeling and validation with Persistent Scatterer Interferometry. Int. J. Appl. Earth Obs. Geoinf. 2014, 28, 78–89. [Google Scholar] [CrossRef] [Green Version]
- Normand, J.C.L.; Heggy, E. InSAR Assessment of Surface Deformations in Urban Coastal Terrains Associated with Groundwater Dynamics. IEEE Trans. Geosci. Remote Sens. 2015, 53, 6356–6371. [Google Scholar] [CrossRef]
- Cianflone, G.; Tolomei, C.; Brunori, C.A.; Dominici, R. InSAR time series analysis of natural and anthropogenic coastal plain subsidence: The case of sibari (Southern Italy). Remote Sens. 2015, 7, 16004–16023. [Google Scholar] [CrossRef] [Green Version]
- Hsieh, C.S.; Shih, T.Y.; Hu, J.C.; Tung, H.; Huang, M.H.; Angelier, J. Using differential SAR interferometry to map land subsidence: A case study in the Pingtung Plain of SW Taiwan. Nat. Hazards 2011, 58, 1311–1332. [Google Scholar] [CrossRef]
- Ferretti, A.; Prati, C.; Rocca, F. Nonlinear Subsidence Rate Estimation Using Permanent Scatterers in Differential SAR Interferometry. IEEE Trans. Geosci. Remote Sens. 2000, 38, 2202–2212. [Google Scholar] [CrossRef]
- Ferretti, A.; Prati, C.; Rocca, F. Permanent scatterers in SAR interferometry. IEEE Trans. Geosci. Remote Sens. 2001, 39, 8–20. [Google Scholar] [CrossRef] [Green Version]
- Hooper, A.; Zebker, H.; Segall, P.; Kampes, B. A new method for measuring deformation on volcanoes and other natural terrains using InSAR persistent scatterers. Geophys. Res. Lett. 2004, 31, 1–5. [Google Scholar] [CrossRef]
- Berardino, P.; Fornaro, G.; Lanari, R.; Sansosti, E. A new algorithm for surface deformation monitoring based on small baseline differential SAR interferograms. IEEE Trans. Geosci. Remote Sens. 2002, 40, 2375–2383. [Google Scholar] [CrossRef]
- Armas, I.; Mendes, D.A.; Popa, R.G.; Gheorghe, M.; Popovici, D. Long-term ground deformation patterns of Bucharest using multi-temporal InSAR and multivariate dynamic analyses: A possible transpressional system? Sci. Rep. 2017, 7, 43762. [Google Scholar] [CrossRef] [PubMed]
- Tokimatsu, K.; Tamura, S.; Suzuki, H.; Katsumata, K. Building damage associated with geotechnical problems in the 2011 Tohoku Pacific Earthquake. Soils Found. 2012, 52, 956–974. [Google Scholar] [CrossRef]
- Yasuda, S.; Harada, K.; Ishikawa, K.; Kanemaru, Y. Characteristics of liquefaction in Tokyo Bay area by the 2011 Great East Japan Earthquake. Soils Found. 2012, 52, 793–810. [Google Scholar] [CrossRef]
- Nigorikawa, N.; Asaka, Y. Leveling of long-term settlement of Holocene clay ground induced by the 2011 off the Pacific coast of Tohoku earthquake. Soils Found. 2015, 55, 1318–1325. [Google Scholar] [CrossRef]
- Okada, N.; Ye, T.; Kajitani, Y.; Shi, P.; Tatano, H. The 2011 eastern Japan great earthquake disaster: Overview and comments. Int. J. Disaster Risk Sci. 2011, 2, 34–42. [Google Scholar] [CrossRef] [Green Version]
- Zhou, L.; Guo, J.; Hu, J.; Li, J.; Xu, Y.; Pan, Y.; Shi, M. Wuhan surface subsidence analysis in 2015—2016 based on sentinel-1A data by SBAS-InSAR. Remote Sens. 2017, 9, 982. [Google Scholar] [CrossRef]
- Bhattacharya, S.; Hyodo, M.; Goda, K.; Tazoh, T.; Taylor, C.A. Liquefaction of soil in the Tokyo Bay area from the 2011 Tohoku (Japan) earthquake. Soil Dyn. Earthq. Eng. 2011, 31, 1618–1628. [Google Scholar] [CrossRef]
- Tokimatsu, K.; Katsumata, K. Liquefaction-induced damage to buildings in Urayasu city during the 2011 Tohoku Pacific earthquake. In Proceedings of the International Symposium on Engineering Lessons Learned from the 2011 Great East Japan Earthquake, Tokyo, Japan, 1–4 March 2012; pp. 665–674. [Google Scholar]
- Imakiire, T.; Koarai, M. Wide-area land subsidence caused by “the 2011 off the Pacific Coast of Tohoku Earthquake”. Soils Found. 2012, 52, 842–855. [Google Scholar] [CrossRef]
- Konagai, K.; Kiyota, T.; Suyama, S.; Asakura, T.; Shibuya, K.; Eto, C. Maps of soil subsidence for Tokyo bay shore areas liquefied in the March 11th, 2011 off the Pacific Coast of Tohoku Earthquake. Soil Dyn. Earthq. Eng. 2013, 53, 240–253. [Google Scholar] [CrossRef]
- Pasquali, P.; Cantone, A.; Riccardi, P.; De Filippi, M.; Ogushi, F.; Tamura, M.; Gagliano, S. Monitoring land subsidence in the tokyo region with sar interferometric stacking techniques. In Engineering Geology for Society and Territory—Volume 5: Urban Geology, Sustainable Planning and Landscape Exploitation; Springer: Berlin, Germany, 2015; pp. 995–999. ISBN 9783319090481. [Google Scholar]
- ElGharbawi, T.; Tamura, M. Estimating deformation due to soil liquefaction in Urayasu city, Japan using permanent scatterers. ISPRS J. Photogramm. Remote Sens. 2015, 109, 152–164. [Google Scholar] [CrossRef]
- Urayasu City. Population Statistics. Available online: http://www.city.urayasu.lg.jp/shisei/toukei/jinko/1002267.html (accessed on 20 March 2018). (In Japanese).
- Urayasu City. The Project of Reclaimed Land. Available online: http://www.city.urayasu.lg.jp/shisei/profile/profile/1000020.html (accessed on 16 March 2018). (In Japanese).
- Tokimatsu, K.; Suzuki, H.; Katsumata, K.; Tamura, S. Geotechnical Problems in the 2011 Tohoku Pacific Earthquakes. In Proceedings of the International Conference on Case Histories in Geotechnical Engineering, Chicago, IL, USA, 29 April–4 May 2013; Available online: http://scholarsmine.mst.edu/icchge/7icchge/session12/2 (accessed on 18 August 2018).
- Geospatial Information Authority of Japan. Fundamental Geospatial Data Portal of GSI. Available online: https://fgd.gsi.go.jp/download/menu.php (accessed on 16 March 2018).
- Chiba Prefecture. Chiba Prefecture Leveling Survey Results. Available online: http://www.pref.chiba.lg.jp/suiho/jibanchinka/torikumi/seikaomote.html (accessed on 16 March 2018). (In Japanese).
- Hooper, A.J. A multi-temporal InSAR method incorporating both persistent scatterer and small baseline approaches. Geophys. Res. Lett. 2008, 35. [Google Scholar] [CrossRef] [Green Version]
- Qu, F.; Lu, Z.; Zhang, Q.; Bawden, G.W.; Kim, J.W.; Zhao, C.; Qu, W. Mapping ground deformation over Houston-Galveston, Texas using multi-temporal InSAR. Remote Sens. Environ. 2015, 169, 290–306. [Google Scholar] [CrossRef]
- Grzovic, M.; Ghulam, A. Evaluation of land subsidence from underground coal mining using TimeSAR (SBAS and PSI) in Springfield, Illinois, USA. Nat. Hazards 2015, 79, 1739–1751. [Google Scholar] [CrossRef]
- Hooper, A.; Bekaert, D.; Spaans, K.; Arikan, M. Recent advances in SAR interferometry time series analysis for measuring crustal deformation. Tectonophysics 2012, 514–517, 1–13. [Google Scholar] [CrossRef]
- Crosetto, M.; Monserrat, O.; Cuevas-González, M.; Devanthéry, N.; Crippa, B. Persistent Scatterer Interferometry: A review. ISPRS J. Photogramm. Remote Sens. 2016, 115, 78–89. [Google Scholar] [CrossRef]
- Gourmelen, N.; Amelung, F.; Lanari, R. Interferometric synthetic aperture radar-GPS integration: Interseismic strain accumulation across the Hunter Mountain fault in the eastern California shear zone. J. Geophys. Res. Solid Earth 2010, 115. [Google Scholar] [CrossRef]
- Chaussard, E.; Wdowinski, S.; Cabral-Cano, E.; Amelung, F. Land subsidence in central Mexico detected by ALOS InSAR time-series. Remote Sens. Environ. 2014, 140, 94–106. [Google Scholar] [CrossRef]
- ESA PRARE Precise Orbit Product (ERS.ORB.POD). Available online: https://earth.esa.int/web/guest/-/prare-precise-orbit-product (accessed on 18 May 2018).
- Goldstein, R.M.; Werner, C.L. Radar interferogram filtering for geophysical applications. Geophys. Res. Lett. 1998, 25, 4035–4038. [Google Scholar] [CrossRef] [Green Version]
- Costantini, M. A novel phase unwrapping method based on network programming. IEEE Trans. Geosci. Remote Sens. 1998, 36, 813–821. [Google Scholar] [CrossRef]
- Hooper, A.; Zebker, H.A. Phase unwrapping in three dimensions with application to InSAR time series. J. Opt. Soc. Am. A 2007, 24, 2737–2747. [Google Scholar] [CrossRef]
- Lin, L.I.-K. A Concordance Correlation Coefficient to Evaluate Reproducibility. Biometrics 1989, 45, 255–268. [Google Scholar] [CrossRef] [PubMed]
- Aimaiti, Y.; Yamazaki, F.; Liu, W.; Kasimu, A. Monitoring of Land-Surface Deformation in the Karamay Oilfield, Xinjiang, China, Using SAR Interferometry. Appl. Sci. 2017, 7, 772. [Google Scholar] [CrossRef]
- Rosen, P.A.; Hensley, S.; Zebker, H.A.; Webb, F.H.; Fielding, E.J. Surface deformation and coherence measurements of Kilauea Volcano, Hawaii, from SIR-C radar interferometry. J. Geophys. Res. Planets 1996, 101, 23109–23125. [Google Scholar] [CrossRef]
- Chiba Prefecture. Chiba Information Map. Available online: http://map.pref.chiba.lg.jp/pref-chiba/Portal (accessed on 16 March 2018).
- Pepe, A.; Calò, F. A Review of Interferometric Synthetic Aperture RADAR (InSAR) Multi-Track Approaches for the Retrieval of Earth’s Surface Displacements. Appl. Sci. 2017, 7, 1264. [Google Scholar] [CrossRef]
- Regional Disaster Prevention Project of Urayasu City—Earthquake Disaster. Available online: https://www.city.urayasu.lg.jp/_res/projects/default_project/_page_/001/002/417/1-4.pdf (accessed on 19 June 2018). (In Japanese).
- Chiba Prefecture. Chiba Prefecture Geological Environment Information Bank. Available online: https://www.pref.chiba.lg.jp/suiho/chishitsu.html (accessed on 7 July 2018). (In Japanese).
- Chen, G.; Zhang, Y.; Zeng, R.; Yang, Z.; Chen, X.; Zhao, F.; Meng, X. Detection of land subsidence associated with land creation and rapid urbanization in the Chinese Loess Plateau using time series InSAR: A case study of Lanzhou New District. Remote Sens. 2018, 10, 270. [Google Scholar] [CrossRef]
- Chai, J.-C.; Shen, S.-L.; Zhu, H.-H.; Zhang, X.-L. Land subsidence due to groundwater drawdown in Shanghai. Géotechnique 2004, 54, 143–147. [Google Scholar] [CrossRef]
- Chiba Prefecture. Survey Results of Ground Water Use in Chiba Prefecture. Available online: https://www.pref.chiba.lg.jp/suiho/jibanchinka/torikumi/yousuiryou.html (accessed on 13 April 2018). (In Japanese).
- Chiba Prefecture. Chiba Prefecture Water Source Information. Available online: https://www.pref.chiba.lg.jp/suidou/souki/2nd-page/suigen.html (accessed on 19 March 2018). (In Japanese).
- Chiba Prefecture. Land Subsidence Survey Report on 2014. Available online: https://www.pref.chiba.lg.jp/suiho/press/2015/h26-jibanchinka.html (accessed on 19 March 2018). (In Japanese).
- Ishii, I.; Towhata, I.; HiradateI, R.; Tsukuni, S.; Uchida, A.; Sawada, S.; Yamaguchi, T. Design of grid-wall soil improvement to mitigate soil liquefection damage in residential areas in Urayasu. J. JSCE 2017, 5, 27–44. [Google Scholar] [CrossRef]
Figure 1.
The map of the study area, Urayasu City, Japan. (a) The geographic location of Urayasu City; (b) the distribution and development history of the reclaimed areas, namely Moto-Machi (old town) outlined in green, Naka-Machi (central town) outlined in yellow and Shin-Machi (new town) outlined in red. A to G represent the reclaimed areas at different times. The background image is a Phased Array L-band Synthetic Aperture Radar onboard the Advanced Land Observation Satellite (ALOS-2 PALSAR-2) intensity image acquired on 4 December 2014; and (c) the topography of the study area [36].

Figure 2.
The temporal and spatial baseline distributions of the SAR interferograms from the ERS-1/-2, ALOS PALSAR and ALOS-2 PALSAR-2 data sets (a–e), where each acquisition is represented by a diamond associated to an ID number; the green diamonds represent the valid acquisitions and the yellow diamonds represent the selected master image of persistent scatterers interferometry (PSI) and super master image of the small baseline subset (SBAS). (a) Time–position plot of PSI interferograms generated by the ERS-1/-2 data, with 24 January 2000 as the master image; (b) time–baseline plot of SBAS interferograms generated by the ERS-1/-2 data, with 2 August 1999 as the super master image; (c) time–position plot of PSI interferograms generated by the ALOS PALSAR data, with 5 August 2009 as the master image; (d) time–position Delaunay 3D plot of SBAS interferograms generated by the ALOS PALSAR data, with March 20, 2009 as the super master image; (e) time–position Delaunay 3D plot of SBAS interferograms generated by the ALOS-2 PALSAR-2 data, with 4 December 2014 as the super master image; and (f) the histogram of the average coherence for the three satellite datasets. These connections in (d,(e) are a subset of the whole main network and represent such interferograms that will be unwrapped in a 3D way.

Figure 3.
Line of sight (LOS) displacement velocity in Urayasu City from 1993 to 2006 for the ERS-1/-2 data: (a) Estimated mean displacement velocity using the PSI method; (b) estimated mean displacement velocity using the SBAS method. The background image is an ERS-2 intensity image acquired on 24 May 1999. The red points P1 to P8 are the selected points to show the time-series LOS displacements estimated by the PSI and SBAS measurements in (a,b), respectively.

Figure 4.
Histogram distribution for the ERS-1/-2-derived displacement rates from May 1993 to February 2006: (a) the corresponding histogram of the PSI measurements from the ERS-1/-2 data; and (b) the corresponding histogram of the SBAS measurements from the ERS-1/-2 data.
Figure 4.
Histogram distribution for the ERS-1/-2-derived displacement rates from May 1993 to February 2006: (a) the corresponding histogram of the PSI measurements from the ERS-1/-2 data; and (b) the corresponding histogram of the SBAS measurements from the ERS-1/-2 data.

Figure 5.
Time-series LOS displacement plots of the PSI and SBAS measurements from the ERS-1/-2 data (a–h) for the selected points P1 to P8, which are indicated by red points in Figure 3.
Figure 5.
Time-series LOS displacement plots of the PSI and SBAS measurements from the ERS-1/-2 data (a–h) for the selected points P1 to P8, which are indicated by red points in Figure 3.

Figure 6.
Mean LOS displacement velocity in Urayasu City from 2006 to 2010 for the PALSAR data: (a) estimated mean displacement velocity using the PSI method; (b) estimated mean displacement velocity using the SBAS method. The background image is a PALSAR-2 intensity image acquired on 04 December 2014. The red points P1 to P8 are the selected points to show the time-series LOS displacements estimated by the PSI and SBAS measurements in (a,b), respectively. A-G represent the reclaimed areas and districts which described in Table 1.

Figure 7.
Histogram distribution for the PALSAR-derived results from June 2006 to December 2010. (a) The corresponding histogram of the PSI measurements from the PALSAR data; and (b) the corresponding histogram of the SBAS measurements from the PALSAR data.
Figure 7.
Histogram distribution for the PALSAR-derived results from June 2006 to December 2010. (a) The corresponding histogram of the PSI measurements from the PALSAR data; and (b) the corresponding histogram of the SBAS measurements from the PALSAR data.

Figure 8.
Time-series LOS displacement plots of the PSI and SBAS measurements (a–h) for points P1 to P8, which are indicated as red points in Figure 6a,b, respectively.
Figure 8.
Time-series LOS displacement plots of the PSI and SBAS measurements (a–h) for points P1 to P8, which are indicated as red points in Figure 6a,b, respectively.

Figure 9.
Mean LOS displacement velocity in Urayasu City from 2014 to 2017 for the PALSAR-2 data. The background image is a PALSAR-2 intensity image acquired on 4 December 2014. P1–P1’ to P6–P6’ are the selected profiles to show the displacement velocities at different sites.
Figure 9.
Mean LOS displacement velocity in Urayasu City from 2014 to 2017 for the PALSAR-2 data. The background image is a PALSAR-2 intensity image acquired on 4 December 2014. P1–P1’ to P6–P6’ are the selected profiles to show the displacement velocities at different sites.

Figure 10.
The corresponding histogram of the SBAS measurements from the PALSAR-2 data.

Figure 11.
Mean LOS displacement velocities for the three observation periods (a–f) along the six profiles whose positions are indicated as purple lines in Figure 9.
Figure 11.
Mean LOS displacement velocities for the three observation periods (a–f) along the six profiles whose positions are indicated as purple lines in Figure 9.

Figure 12.
Comparison between InSAR-derived linear subsidence velocity and leveling measured linear subsidence velocity during the three InSAR observation periods: (a,b) ERS-1/-2 derived linear subsidence rate (May 1993 to February 2006) and leveling-derived linear subsidence rate (January 1993 to January 2006); (c,d) PALSAR-derived linear subsidence rate (June 2006 to December 2010) and leveling-derived linear subsidence rate (January 2006 to January 2011); (e) PALSAR-2-derived linear subsidence rate (December 2014 to December 2016) and leveling-derived linear subsidence rate (January 2015 to January 2017); and (f) spatial distribution of leveling points in Urayasu City.

Figure 13.
The spatial distribution map of difference of land subsidence rates during the three observation periods: (a) ERS-1/-2 derived subsidence rate using the SBAS method; (b) difference between ERS-1/-2 and PALSAR derived subsidence rates (subtracting ERS-1/-2 from PALSAR); (c) difference between PALSAR and PALSAR-2 derived subsidence rates (subtracting PALSAR from PALSAR-2); (d) difference between ERS-1/-2 and PALSAR-2 derived subsidence rates (subtracting ERS-1/-2 from PALSAR-2).

Figure 14.
Depth of the upper surface of the solid geological stratum (a) in Urayasu City (adapted from the public report by the technical committee of Urayasu City [54]). The points refer to the locations of borehole sites; (b) soil cross sections along the A–A’ line. FS + AS refer to filled sandy soil and alluvial sand layers, and AC and DS refer to the alluvial clay layer and diluvial dense sandy layer, respectively. The borehole investigation data were obtained from the Chiba Prefecture [55].

Figure 15.
Subsidence rate map (2006–2010) generated with ALOS PALSAR data overlaid on a Google Earth image. The green polygons indicate the park area, red polygons indicate the location of high-rise buildings, the yellow polygon shows the highly populated residential area. The blue polygon indicates the border of Urayasu City and corresponds to the location of Figure 14a, and the A–A’ line corresponds to the soil cross section in Figure 14a,b.


Table 1.
The detailed history of reclaimed areas and the districts.
| Reclaimed Areas | Reclaimed Year | Districts |
|---|---|---|
| A | 1975 | Maihama |
| B | 1968 | Higashino, Tomioka, Imagawa, Benten and Tekkodori |
| C | 1971 | Kairaku, Mihama and Irifune |
| D | 1978 | Akemi and Hinode |
| E | 1980 | Takasu |
| F | 1979 | Minato |
| G | 1979 and 1981 | Chidori |
Table 2.
Acquisition parameters of the ERS-1/-2, ALOS PALSAR and ALOS-2 PALSAR-2 data sets.
| SAR 1 Sensor | ERS-1/-2 2 | ALOS PALSAR | ALOS-2 PALSAR-2 |
|---|---|---|---|
| Orbit direction | Descending | Descending | Descending |
| Operation mode | SAR/IM 3 | FBS/FBD 4 | Strip map (SM)1 |
| Band (wavelength) | C-band (5.6 cm) | L-band (23 cm) | L-band (23 cm) |
| Resolution | 20 m | 10/20 m | 3 m |
| Revisit cycle | 35 days | 46 days | 14 days |
| Look angle | 23° | 34.3° | 35.4° |
| Incidence angle | 23.3° | 38.7° | 39.7° |
| Swath | 100 km | 70 km | 50 km |
| Number of images | 52 | 24 | 13 |
| Temporal coverage | May 1993 to February 2006 | June 2006 to December 2010 | December 2014 to November 2017 |
1 Synthetic aperture radar; 2 European Remote Sensing satellites; 3 IM: image mode; 4 FBS: fine beam single; FBD: fine beam double.
© 2018 by the authors. Licensee MDPI, Basel, Switzerland. This article is an open access article distributed under the terms and conditions of the Creative Commons Attribution (CC BY) license (http://creativecommons.org/licenses/by/4.0/).
Share and Cite
MDPI and ACS Style
Aimaiti, Y.; Yamazaki, F.; Liu, W. Multi-Sensor InSAR Analysis of Progressive Land Subsidence over the Coastal City of Urayasu, Japan. Remote Sens. 2018, 10, 1304. https://0-doi-org.brum.beds.ac.uk/10.3390/rs10081304
AMA Style
Aimaiti Y, Yamazaki F, Liu W. Multi-Sensor InSAR Analysis of Progressive Land Subsidence over the Coastal City of Urayasu, Japan. Remote Sensing. 2018; 10(8):1304. https://0-doi-org.brum.beds.ac.uk/10.3390/rs10081304
Chicago/Turabian StyleAimaiti, Yusupujiang, Fumio Yamazaki, and Wen Liu. 2018. "Multi-Sensor InSAR Analysis of Progressive Land Subsidence over the Coastal City of Urayasu, Japan" Remote Sensing 10, no. 8: 1304. https://0-doi-org.brum.beds.ac.uk/10.3390/rs10081304
Note that from the first issue of 2016, this journal uses article numbers instead of page numbers. See further details here.