Using SAR-Derived Vegetation Descriptors in a Water Cloud Model to Improve Soil Moisture Retrieval


Canada Centre for Mapping and Earth Observation, Natural Resources Canada, Ottawa, ON K1A 0E4, Canada
*
Author to whom correspondence should be addressed.
Remote Sens. 2018, 10(9), 1370; https://0-doi-org.brum.beds.ac.uk/10.3390/rs10091370
Submission received: 26 June 2018
/
Revised: 14 August 2018
/
Accepted: 24 August 2018
/
Published: 29 August 2018
(This article belongs to the Special Issue Microwave Indices from Active and Passive Sensors for Remote Sensing Applications)
Abstract
:The water cloud model (WCM) is a widely used radar backscatter model applied to SAR images to retrieve soil moisture over vegetated areas. The WCM needs vegetation descriptors to account for the impact of vegetation on SAR backscatter. The commonly used vegetation descriptors in WCM, such as Leaf Area Index (LAI) and Normalized Difference Vegetation Index (NDVI), are sometimes difficult to obtain due to the constraints in data availability in in-situ measurements or weather dependency in optical remote sensing. To improve soil moisture retrieval, this study investigates the feasibility of using all-weather SAR derived vegetation descriptors in WCM. The in-situ data observed at an agricultural crop region south of Winnipeg in Canada, RapidEye optical images and dual-polarized Radarsat-2 SAR images acquired in growing season were used for WCM model calibration and test. Vegetation descriptors studied include HV polarization backscattering coefficient () and Radar Vegetation Index (RVI) derived from SAR imagery, and NDVI derived from optical imagery. The results show that achieved similar results as NDVI but slightly better than RVI, with a root mean square error of 0.069 m3/m3 and a correlation coefficient of 0.59 between the retrieved and observed soil moisture. The use of can overcome the constraints of the commonly used vegetation descriptors and reduce additional data requirements (e.g., NDVI from optical sensors) in WCM, thus improving soil moisture retrieval and making WCM feasible for operational use.
1. Introduction
Soil moisture plays a key role in the terrestrial water cycle. The retrieval of soil moisture over a large area is important in the modeling and assessing drought impact [1], evapotranspiration [2], and water budget [3,4]. With high temporal and spatial variations, soil moisture data over large areas is difficult to obtain from in situ networks. Radar has a high backscattering sensitivity to soil moisture due to the high contrast of the microwave dielectric constant (ε) between dry soil (ε = 2~3) and water (ε = 80) [5]. It also has the advantage of observing the earth’s surface day and night in all weather conditions. Therefore, radar remote sensing has the potential to measure soil moisture on a large scale at regular temporal intervals from space [6,7,8,9,10]. Over the past 30 years, considerable effort has been spent on using Synthetic Aperture Radar (SAR) imagery to retrieve soil moisture.
SAR incidence angle and polarization are important factors that affect soil moisture retrieval [5,8,11,12,13,14]. Radar backscatters normally decrease with increasing incidence angle [15,16]. The rate of decrease depends mostly on roughness conditions and land cover. Previous studies showed that SAR at low incidence angle is less sensitive to surface roughness [5,11,12,13,17] and vegetation [18,19] than at high incidence angle. Low incidence angles are thus optimal for soil moisture retrieval. The choice of polarizations also plays an important role in SAR-based soil moisture retrieval. Single-polarization data is often used for soil moisture retrieval [5,11]. Several studies showed that HH polarization is more sensitive than HV to soil moisture but less sensitive than VV [13,20,21]. However some other studies disagreed. For example, Beaudoin et al. [22], Le Loan [23], and Baghdadi et al. [14] found that HH polarization is most relevant to soil moisture estimates. Moreover, the study by McNarin and Brisco [24] demonstrated that additional polarizations can provide more information content in a SAR dataset. For example, cross-polarized SAR images (HV or VH) are sensitive to crop structure within the total canopy volume and thus provide information that can be complementary to HH and VV imagery. Using multiple polarizations should, in theory, improve soil moisture estimation [25]. Improved soil moisture retrieval using multi-polarization SAR data was reported even under dense vegetation canopy [26,27]. It must be noted that Baghdadi et al. [28] found that the accuracy of the soil moisture estimation did not improve significantly (<0.01 cm3/cm3) for two bare soil sites when two polarizations (HH and HV) were used instead of only one polarization. There have been great interests to use full-polarized SAR data in soil moisture retrieval after the data is available [1,25,29] as it contains more information on the scattering objects than the single- and dual-polarization data. However, full-polarized SAR data has the disadvantage of narrow swath, which limits its applications in soil moisture retrieval over large areas. As such, dual-polarized SAR data is recommended for retrieving soil moisture over large areas because of its large swath width of up to 500 km (e.g., Radarsat-2 ScanSAR wide beam mode).
For the case without vegetation or with low vegetation cover, shorter wavelength SAR (especially X-band) is more sensitive to soil moisture and least sensitive to surface roughness than longer wavelength SAR [30,31,32]. For the presence of vegetation (especially dense vegetation), however, longer wavelength L-band, compared with the SAR X-band and C-band, is more suitable for soil moisture retrieval since it has stronger vegetation/soil penetration power and is less sensitive to vegetation canopy [9,33]. Unfortunately, currently, ALOS-2/PALSAR is the only long wavelength L-band SAR sensor currently in orbit. Since its data is limited, especially for regions outside Japan, the ALOS-2/PALSAR is significantly hampered for operational use in soil moisture retrieval. In contrast, Sentinel-1A, Sentinel-1B and Radarsat-2, which are C-band SAR satellites currently in orbit, can provide routine observations of Earth’s surface over large areas. Radarsat Constellation Mission (RCM) with 4-days revisit interval will further expand current C-band SAR satellites’ revisit capabilities (6-days for Sentinel-1A/B and 24-days for Radarsat-2). These capacities are promoting new scientific and operational perspectives, e.g., downscaling passive microwave soil moisture [34,35], in the retrieval of soil moisture continuously over large areas using C-band SAR imagery.
Soil moisture retrievals from C-band SAR are significantly affected by vegetation cover and surface roughness. A number of SAR backscatter models have been proposed to separate the backscattering contributions of soil and vegetation [6,14,36,37,38,39]. These models are generally categorised into three groups: theoretical, empirical, and semi-empirical. The theoretical models such as the Integral Equation Model (IEM) and the advanced IEM model [17,40,41] are complicated and require a large number of parameters. Baghdadi et al. [42,43,44] modified the IEM to reduce the IEM’s input soil parameters from three to two [45]. On the other hand, the empirical models, e.g., Dubois model [46], are simple to develop but may have limitations in applicability for other sites due to their data and site dependency [6,47]. Recently Baghdadi et al. [31] improved the Dubois model for a reliable estimate of soil moisture. The semi-empirical models, e.g., Oh model [15] and Water Cloud Model (WCM) [48], start from a physical background and then use simulated or experimental datasets to simplify the theoretical backscattering models [8]. The WCM is often used in retrieving soil moisture and modelling of the scattering of vegetated areas for its simplicity [27]. In addition, the inversion techniques, including the Neural Network (NN) approach and the Change Detection (CD) method, are also used widely for soil moisture retrieval.
The neural network approach consists of a number of hidden neurons or nodes that work in parallel to convert data from an input vector to an output vector [9,48]. For soil moisture retrieval, the neural network is often trained using a synthetic database generated from SAR backscattering model such as IEM, Oh, and WCM models [39,49,50] or WCM model combined with the IEM model [39,51]. Based on the NN approach, Santi et al. [52] retrieved soil moisture from ENVISAT/ASAR data with an Root Mean Square Error (RMSE) as low as 0.023 m3/m3. Paloscia et al. [39] trained a neural network by using a synthetic database of backscattering coefficients simulated from WCM model combined with IEM model for a wide range of soil moisture, surface roughness, and vegetation index. The inputs to the neural networks were the SAR data and NDVI. The approach doesn’t need roughness measurements. They achieved results with RMSE between 1.67 m3/m3 and 6.68 m3/m3 over several areas in Italy, Australia, and Spain using Sentinel-1 SAR data, which were very much in line with GMES requirements (with RMSE generally <5 m3/m3). The change detection method is based on the near linear relationship between SAR backscatter and soil moisture. It assumes the effect of vegetation and surface roughness on observed backscatter are consistent between acquisitions. The advantage of this method is that it can retrieve soil moisture in the absence of prior information of the study area when multi-temporal SAR data is available. Based on this method, Gao et al. [48] retrieved soil moisture over a site in Urgell (Catalunya, Spain) from multi-temporal Sentinel-1/SAR data, which combined with optical Sentinel-2 data, with an RMSE as low as 0.059 m3/m3. Zribi et al. [53] achieved a better result with a RMSE of about 0.035 m3/m3 in retrieving soil moisture over a semi-arid area using ASAR data. The Water Cloud Model (WCM), a simple semi-empirical backscatter model, can relate the backscattering coefficient (HH or VV polarizations) to soil properties (moisture and roughness) and vegetation properties (e.g., biomass, leaf area index) and thus it can be used to retrieve soil moisture from SAR imagery over densely vegetated areas [48]. Based on the WCM, Gherboudj et al. [27] retrieved soil moisture with an RMSE of 5.9% and 6.6% for two sites in crop fields from multi-polarized and multi-angular Radarsat-2 SAR data. Zribi et al. [54] achieved similar result (RMSE: ~0.06 m3/m3) in a semi-arid region from C-band ASAR data using the WCM. Kumar et al. [55] obtained a better soil moisture retrieval with an RMSE as low as 0.0419 m3/m3 from C-band ASAR data by the use of LAI in the WCM as the vegetation descriptor. The WCM is used in this study for its simplicity.
The performance of the WCM for soil moisture retrieval depends on the characterization of surface roughness and vegetation. Obtaining accurate information about surface roughness is difficult. First, the in-situ measurement of the surface roughness is quite challenging [56]. Second, the SAR-based surface roughness retrievals (e.g., depolarization ratio method) are mainly developed for bare soil and are less efficient in the presence of a vegetation canopy [27]. In this study, the effect of surface roughness is accounted for by using multi-temporal data over the same field, as surface roughness has little change over a short time period especially for crop fields during the growing time period [57].
Various vegetation descriptors such as plant height, leaf area index (LAI), vegetation water content, and normalized difference vegetation index (NDVI) have been used in WCM [14,27,38,55]. These vegetation descriptors are calculated using data either from in-situ measurements or from optical satellite remote sensing. The use of in-situ data is difficult in operational applications because of the high cost and time consuming in data collections, especially in remote areas. The use of optical satellite data is often limited by weather conditions such as cloud and haze.
Recently, some advances have been made toward developing SAR parameters for characterizing vegetation canopies. For example, the radar vegetation index (RVI), which is computed as a ratio of the cross-polarization scattering to the total scattering, has been used to estimate the biomass and the water content of a wheat crop [58]. Kumar et al. [59] showed RVI as a better alternative to NDVI for monitoring soybean and cotton. In other studies, the HV backscattering coefficient () was found to be very sensitive to the vegetation biomass [60,61] and correlated with LAI [62,63]. Using SAR data to characterize vegetation in the WCM for soil moisture retrieval could be much more effective and beneficial than using in situ and optical sensor-based vegetation descriptors, but few studies are available.
The objective of this study was to assess the WCM performance in soil moisture retrieval by using SAR-derived vegetation descriptors. Specifically, the SAR-derived and RVI obtained from dual-polarized Radarsat-2 SAR imagery were tested using a simplified WCM. The NDVI derived from RapidEye images was also used in the WCM for comparison. The goal of this study is to provide a practical tool for continuous mapping of soil moisture over large areas by future SAR missions such as RCM.
2. Methods
A simplified WCM was employed in this study to retrieve soil moisture. Assuming the effect of soil surface roughness on observed backscatter for a given site is consistent over a short period, in such a case, the temporal change in SAR backscattering only reflects the change of vegetation and soil moisture. Therefore the multi-temporal SAR data was used in the WCM for this study. Since the multi-temporal SAR imagery may be in different viewing geometries, an incidence angle normalization was conducted to make the SAR data radiometrically comparable. The RVI was then computed from these normalized SAR images. The accuracy of the retrieved soil moisture was evaluated by root mean square error (RMSE) and the Pearson correlation coefficient (R). The detailed WCM description and data processing methods are given below.
2.1. A Simplified Water-Cloud Model (WCM)
The water-cloud model, initially developed by Attema and Ulaby [36], considers the vegetation canopy as a cloud containing water droplets randomly distributed within the canopy. It provides solutions for the backscattering coefficients for the vegetation canopy as well as the underlying soil [23,28]. The WCM for a given co-polarization (pp) is formulated as:
where
where (in power) is the observed canopy backscattering coefficient, which is represented as the sum of vegetation volume scattering and the bare soil scattering , τ2 is the two-way transmissivity of the vegetation, A and B are the model coefficients, and V1 and V2 are the vegetation descriptors. According to Bai and He [42], the WCM can be further simplified by expanding τ2 through the Maclaurin series [64]:
Only the first two items are preserved in Equation (4). Combining Equations (1)–(4), the WCM is simplified as:
The V1 and V2 are often reduced to a single vegetation descriptor V (V = V1 = V2) in the WCM.
As such, Equation (5) can be further simplified through variable substitution:
in which a = 2AB and b = −2B/cosθi are the coefficients of the simplified WCM. Comparing to Equation (1), Equation (6) can simplify the computation of the unknown model coefficients [38].
The bare soil scattering is represented by the function f(R, Ms) of surface roughness (R) and soil moisture (Ms). For a field especially an agriculture field during the crop growing time period, R is considered constant for a short period. In such a case, when multi-temporal SAR data is used over the same field, the temporal change in bare soil scattering only reflects the change of soil moisture with time for a site, and the has a linear relationship with Ms, which can be expressed as:
where c can be considered as the sensitivity of SAR to soil moisture and d indicates the backscatter due to surface roughness. The parameters a, b, and c for a specific vegetation are assumed to be constant for a specific time period and the parameter d varies with surface roughness. It must be noted that the backscattering coefficients in Equations (6) and (7) are given in power and db formats, respectively. When submitting Equation (7) to Equation (6), the unit conversion must be conducted to make the units of both equations are the same. As mentioned earlier in the Introduction, the V is often parameterized by LAI, vegetation water content, or NDVI estimated using in-situ or optical remote sensing data, and it is parameterized using HV backscattering and RVI from Radarsat-2 dual-polarization (HH + HV) imagery in this study.
2.2. Incidence Angle Normalization of SAR Imagery
Given a short time period, the amount of repeat pass SAR images may not be sufficient for fitting the WCM due to their low temporal resolutions. As a solution, all available SAR images were used to produce a time series dataset. These images may not be radiometrically comparable because they could be captured at different incidence angles (especially low incidence angles), which have a significant impact on radar backscatters [16]. For example, Oh et al.[15] showed that even as little as a 5° incidence angle can sometimes have ~3 db difference in radar backscatters, which may correspond to about 15% soil moisture change when incidence angle was lower than 35°. As such, incidence angle normalization toward a single reference angle is required for the time series SAR images. For this purpose, several studies [65,66] used empirical regression approaches, which assume linear function of SAR backscatter to incidence angles. This kind of approaches is site- and sensor-specific. In this study, we normalized the SAR backscatters to a reference angle based on the theoretical model of Lambert’s law:
where is the incidence angular dependent radar backscatter, and represent the local incidence angle and the reference incidence angle, respectively, and is the normalized radar backscatter to a reference incidence angle . The Lambert’s law assumes that the relationship between the incidence angle and amount of scattering per unit surface area follows the cosine law. This behaviour is typical for the middle range of incidence angles [67]. The model is simple but it was found to be reasonably representative for many types of terrains [65,66]. The model has been applied for agriculture land surfaces by many researchers [57,68,69,70,71,72].
2.3. Radar Vegetation Index (RVI)
The RVI is normally derived from quad-polarization SAR data using the equation proposed by Kim and Van Zyl [73]:
where , , and are backscattering coefficients of HH, HV and VV polarizations, respectively. Since we use dual-polarization (HH + HV) SAR data for soil moisture retrieval, VV polarization data is not available. Instead, we calculate the RVI from the dual-polarization SAR data for each Radarsat-2 image using the following equation as modified by Charbonneau et al. [74],
2.4. Normalized Difference Vegetation Index (NDVI)
The NDVI is computed as the ratio of the difference and sum of the reflectance measurements acquired in the near infrared (NIR) and red spectral regions. It can be written as:
where and are the reflectance at NIR and red spectral wavebands respectively.
2.5. Model Evaluation
The model results for soil moisture are compared to in-situ measurements using the Pearson correlation coefficient (R) and the Root Mean Square Error (RMSE) as given below:
where Msoi and Mspi are the retrieved and in-situ soil moisture at site i, respectively. and are their corresponding mean values, and n is the total number of sample sites. In this study, the wide range of variability for in-situ soil moisture and LAI data and large time span over the growing season provided solid inputs for the model testing, validation and analysis. However, the difficulties and costs associated with field measurements at this scale largely constrained the size of the in situ datasets. To address this limitation, the Leave-One-Out-Cross-Validation (LOOCV) method was used for model evaluation [9]. In this method, one of the data samples was left out of each time for model evaluation and the remaining n − 1 data samples were used to train the model. This resulted in a total of n models trained using the n − 1 data samples. The results of the model evaluation can be obtained by computing R and RMSE using all unique sample estimation from each of the n models. One advantage of the LOOCV method over other traditional validation methods, e.g., splitting the dataset equally into one subset for training and one subset for validation, is that it can effectively reduce the impact of small amount of data samples. The result from this LOOCV evaluation is generally regarded as a more conservative estimate of the model performance than that trained on all samples [75].
3. Study Area and Datasets
3.1. Study Area
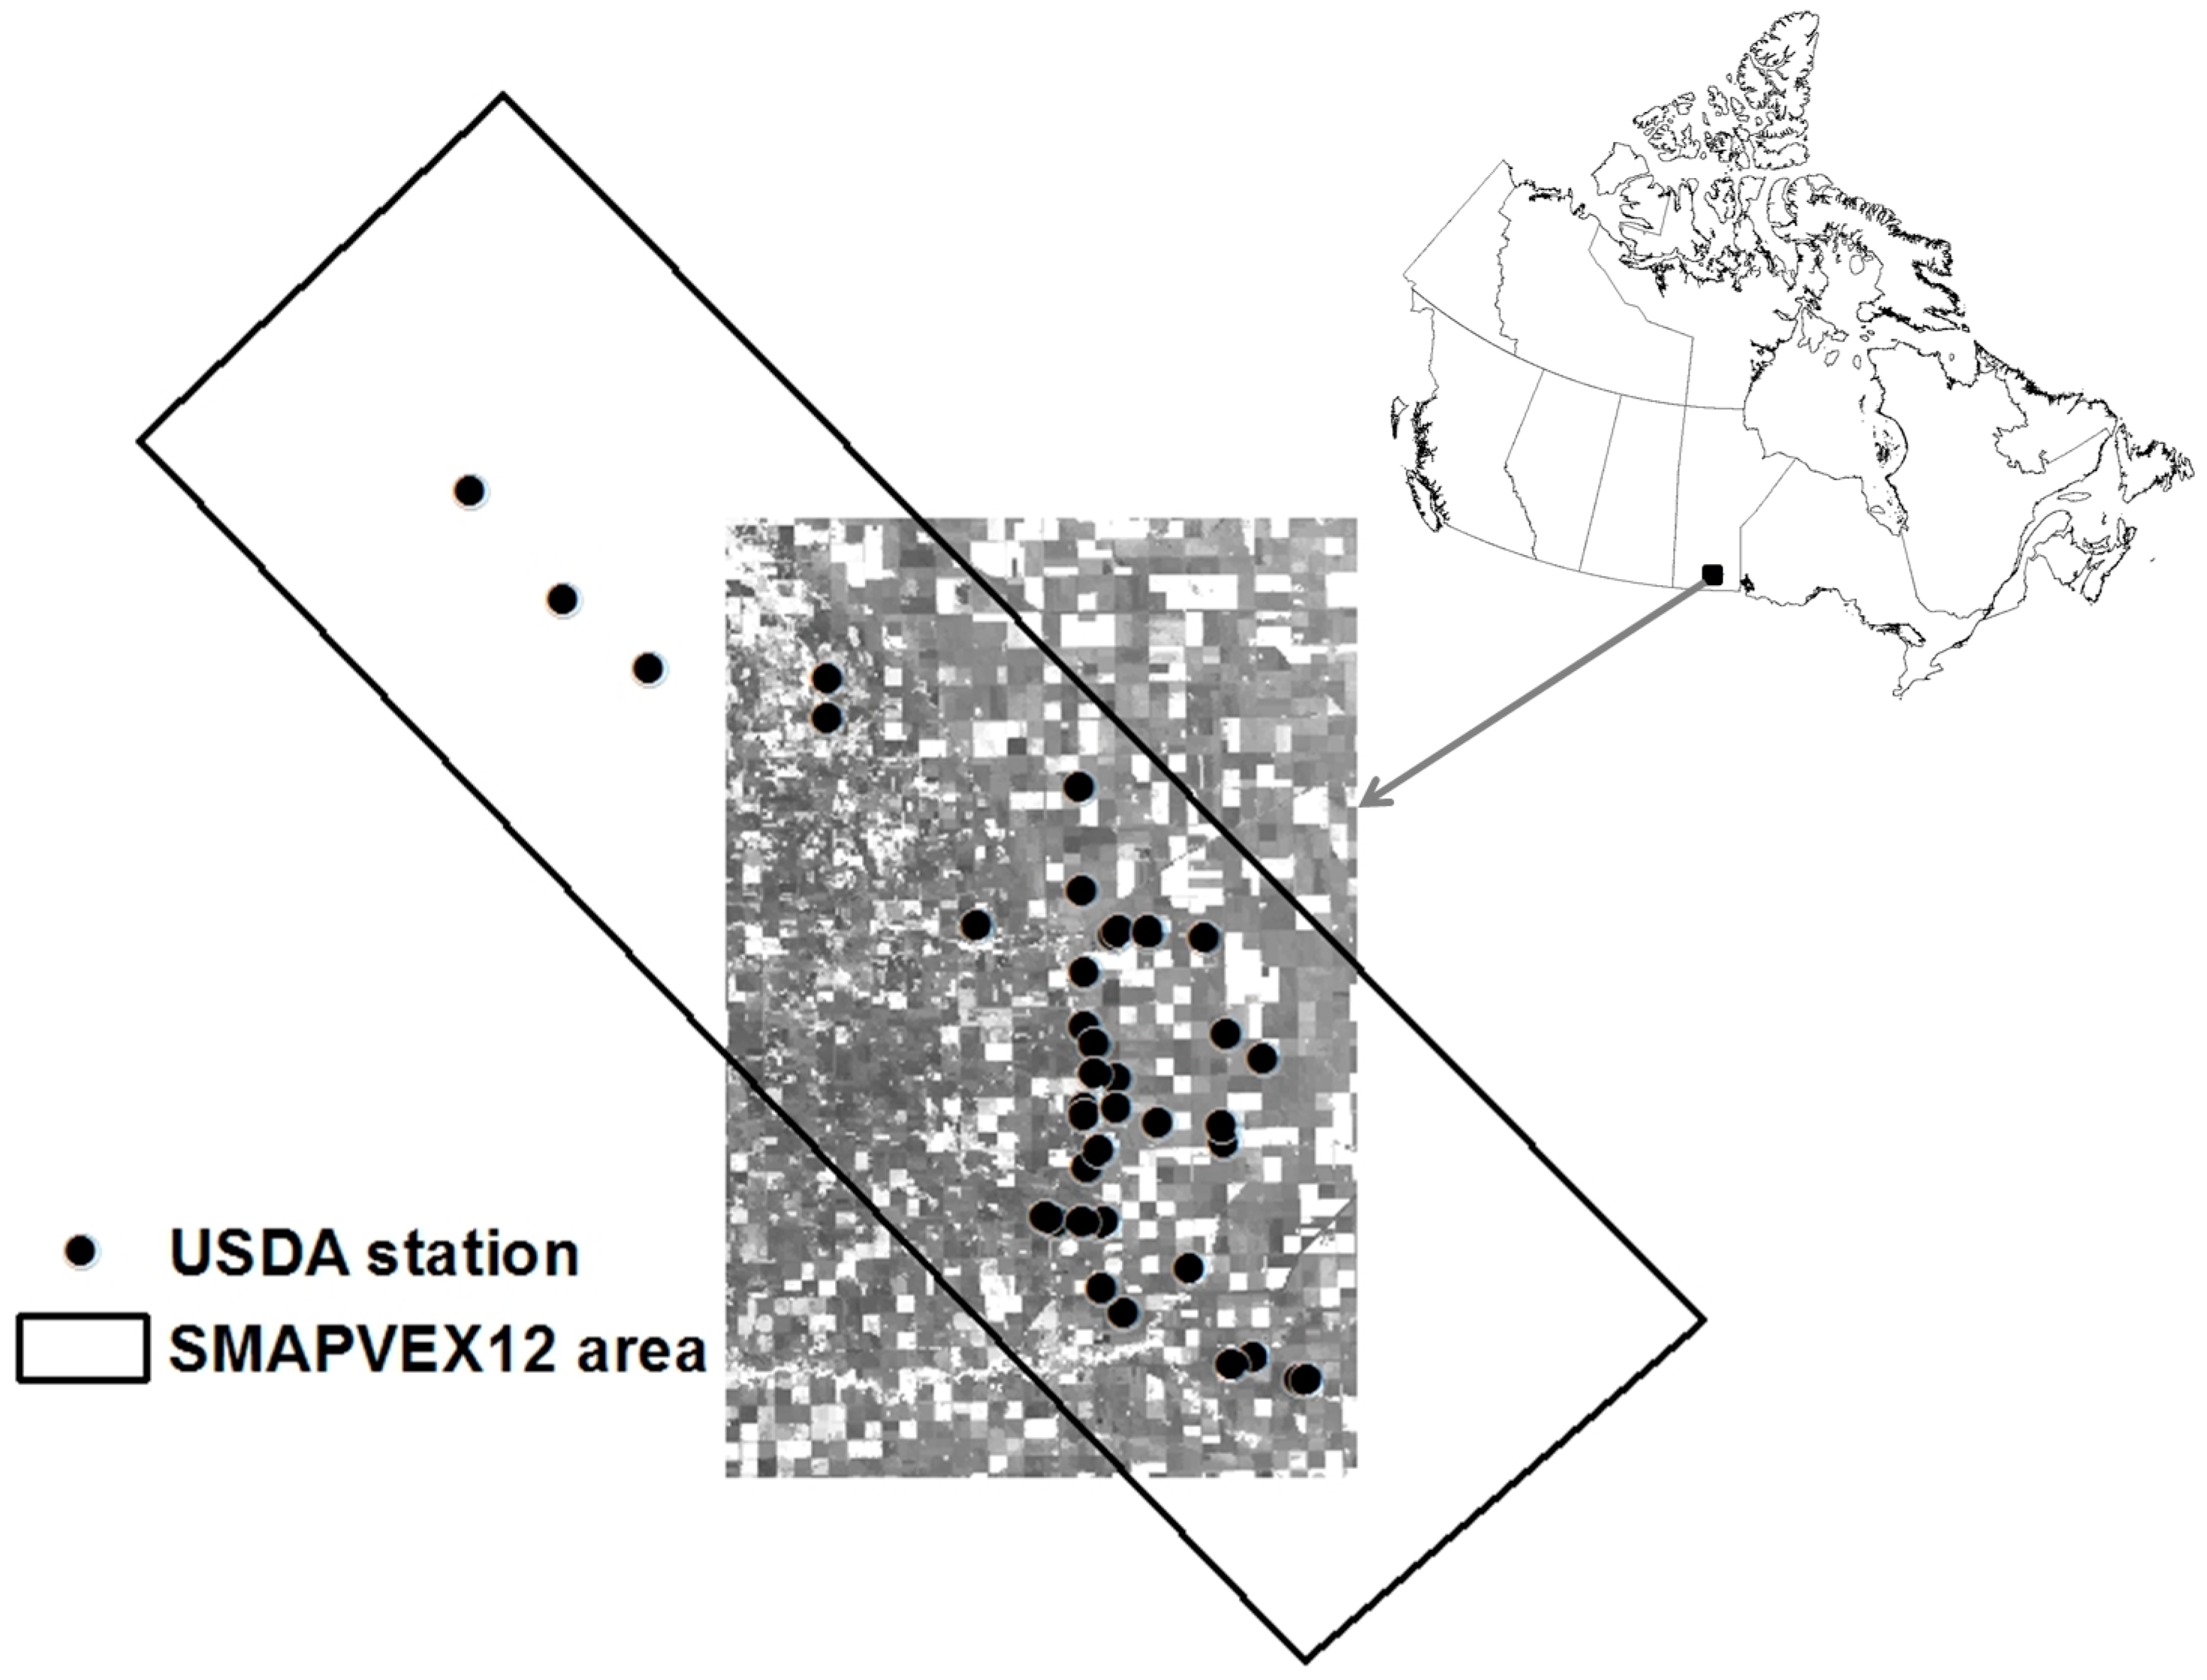
Our study area was located in the SMAP Validation Experiment 2012 (SMAPVEX12) site [31] (Figure 1). The background image shows the coverage (30 km by 50 km) of our study region. It is an agricultural region (90% are crop fields) located in south of Winnipeg in Manitoba, Canada. The crop types include corn, soybean, canola, wheat, and pasture. The soil texture varies greatly across the study region providing a large range of soil moisture levels. Soil moisture, soil temperature, and other surface characteristics (vegetation, roughness, soil density, etc.) data were collected during a six-week field campaign in 2012 (7 June–17 July). Accompanying the field campaign, remotely sensed satellite and airborne data were acquired at a time close to the in-situ data collections. The remote sensing data includes SMOS, AMSR-E, Radarsat-2, RapidEye, SPOT-4, DMC International Ltd. (DMCii) and Uninhabited Aerial Vehicle Synthetic Aperture Radar (UAVSAR). The crop map was produced from a supervised classification of imagery acquired by SPOT-4, DMCii, and Radarsat-2. The wealth of data collected during the intensive field campaign provided a good opportunity for developing and testing our soil moisture retrieval models. More detail information about the study region and the datasets can be found in McNarin et al. [76].
3.2. Data and Pre-Processing
Time series of Radarsat-2 (in single look complex (SLC) format) and RadpidEye (in L1B format) images acquired during the SMAPVEX12 field campaign were used in this study. RapidEye refers to the constellation of five satellites, which provide daily-revisit high resolution (5 m) images. A RapidEye image has five spectral bands: Blue (440–510 nm), Green (520–590 nm), Red (630–690 nm), Red-Edge (690–730 nm), and Near-Infrared (760–880 nm). All the satellite images were obtained through Canada’s National Earth Observation Data Framework (NEODF). There are a total of 12 Radarsat-2 scenes and seven RapidEye scenes of which details are given in Table 1. In addition, a 30 m resolution Shuttle Radar Topography Mission (SRTM) DEM data covering the study area was downloaded from http://eros.usgs.gov for orthorectifying the satellite images.
The SLC (single look complex) format data for the time series of Radarsat-2 images was first multi-looked. The digital number (DN) values of HH and HV polarizations were then converted to backscattering coefficients (denoted as and , respectively) in power format. and were then orthorectified in UTM projection with 20 m resolution by using the SRTM DEM data. While orthorectifying the images, the local incidence angle for each pixel was computed scene by scene. A 5 × 5 enhanced Lee filter was applied to reduce speckle noise. All the processes were completed using the GAMMA Remote Sensing software. Table 1 shows that the incidence angles of the Radarsat-2 images vary from 20° to 37°. To make these images radiometrically comparable, we used Equation (8) to normalize the backscattering coefficients to a reference incidence angle of 25° since low incidence angle (<35°) is less sensitive to surface roughness [12,13]. The RVI images were then generated from these incidence angle normalized images by using Equation (10).
For the time series L1B RapidEye images, a series of preprocessing procedures were conducted using the PCI Geomatica software including the conversion of DN values to Top of Atmosphere (TOA) reflectance, atmospheric corrections for converting TOA reflectance to surface reflectance, and orthorectifiction. Finally, all the images represented surface reflectance in UTM projection with 20 m resolution. The NDVI images were then generated from these processed images by using Equation (11). Due to the differences of acquisition dates between Radarsat-2 imagery and RapidEye imagery (see Table 1), we used the B-Spline interpolation method to interpolate the NDVI images to generate time series NDVI images corresponding to the acquisition dates of Radarsat-2.
Considering that the in situ soil moisture data collected in the field campaign was only coincident with flight overpasses of the UAVSAR rather than the Radarsat-2, we used soil moisture measurements (0–5 cm) from the U.S. Department of Agriculture’s (USDA) stations, which were installed during the SMAPVEX12 campaign. The USDA datasets provided hourly calibrated soil moisture measurements from 4 June to 18 July 2012. For each station, only soil moisture recorded close (less than 30 min) to the acquisition time of Radarsat-2 imagery was used in this study. The soil surface roughness and LAI data measured during the SMAPVEX12 were also used for analysis. Each measurement of soil surface roughness and LAI represents a crop field where a USDA station was located. For most of the USDA stations, LAI were measured on 12, 13, 19, 20, 27, 29, and 30 June, and 6, 7, 13, and 14 July 2012. Since the dates of LAI measurements were different from the acquisition dates of Radarsat-2 imagery, the LAI measurements were also interpolated to match the acquisition dates of Radarsat-2 imagery using the B-Spline interpolation method, similar to that for NDVI. All the in-situ measurements were downloaded from https://smapvex12.espaceweb.usherbrooke.ca and were processed in ArcGIS shapefile format. More details about in-situ measurements can be found in McNairn et al. [75] or the above website.
As mentioned earlier, the effect of surface roughness can be eliminated by using multi-temporal data over the same field. However, soil surface roughness varies with the fields even having the same crop types. To make data as most as possible for analysis, we used the in-situ data with similar roughness in the WCM for each crop type. The soil moisture data were processed as follows. For each crop type, the USDA soil moisture stations with similar surface roughness are grouped. The group with the largest number of stations were selected for this study. For each selected soil moisture station, the time series of soil moisture (Ms) and LAI measurements at the acquisition times of Radarsat-2 images, as well as the co-located 3 × 3 pixel averaged Radarsat-2 backscatter coefficients ( and ), RVI and RapidEye NDVI values, were extracted. Using a 3 × 3 pixel averaged value to replace a single pixel value can reduce errors caused by co-registration errors between satellite images and soil moisture measurement sites. It is noted that the study was based on data representing each specific in-situ measurement site and not the whole crop field. Table 2 lists the statistics of the selected soil moisture and LAI measurements for five crop types: soybean, canola, corn, wheat, and pasture. The root mean square (RMS) roughness values of the selected fields for each crop type are 0.31–0.42 cm (soybean), 1.31–1.33 cm (canola), 1.23–1.28 cm (corn), 1.27–1.29 cm (wheat), and 0.6–0.74 cm (pasture), which are also listed in Table 2.
4. Results and Discussion
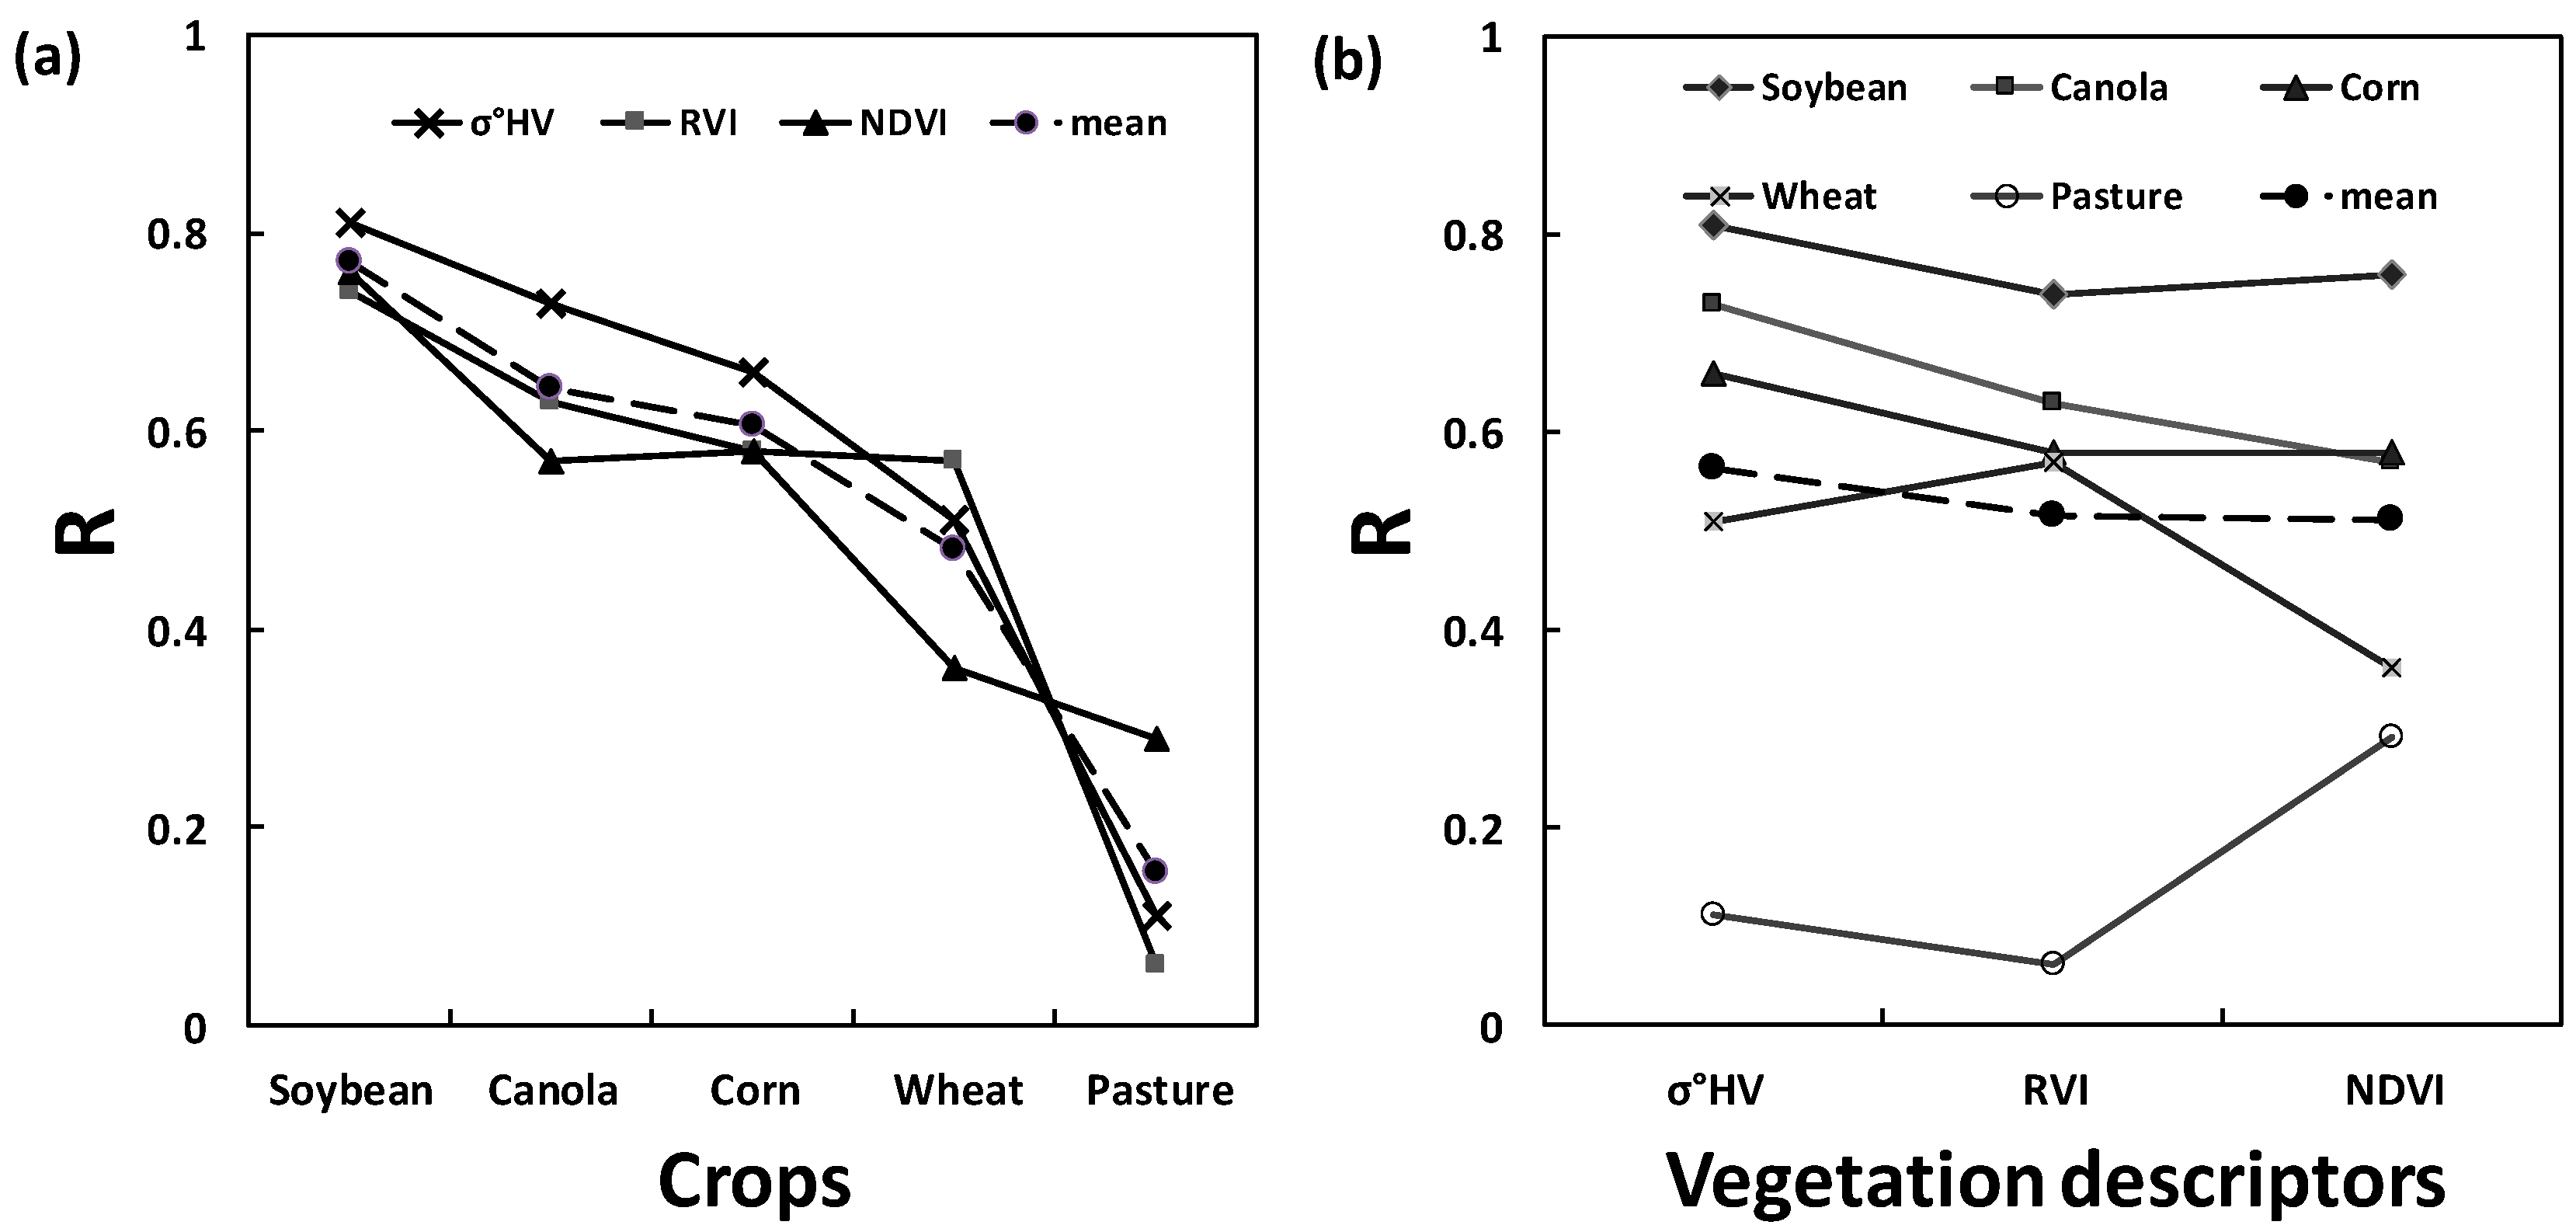
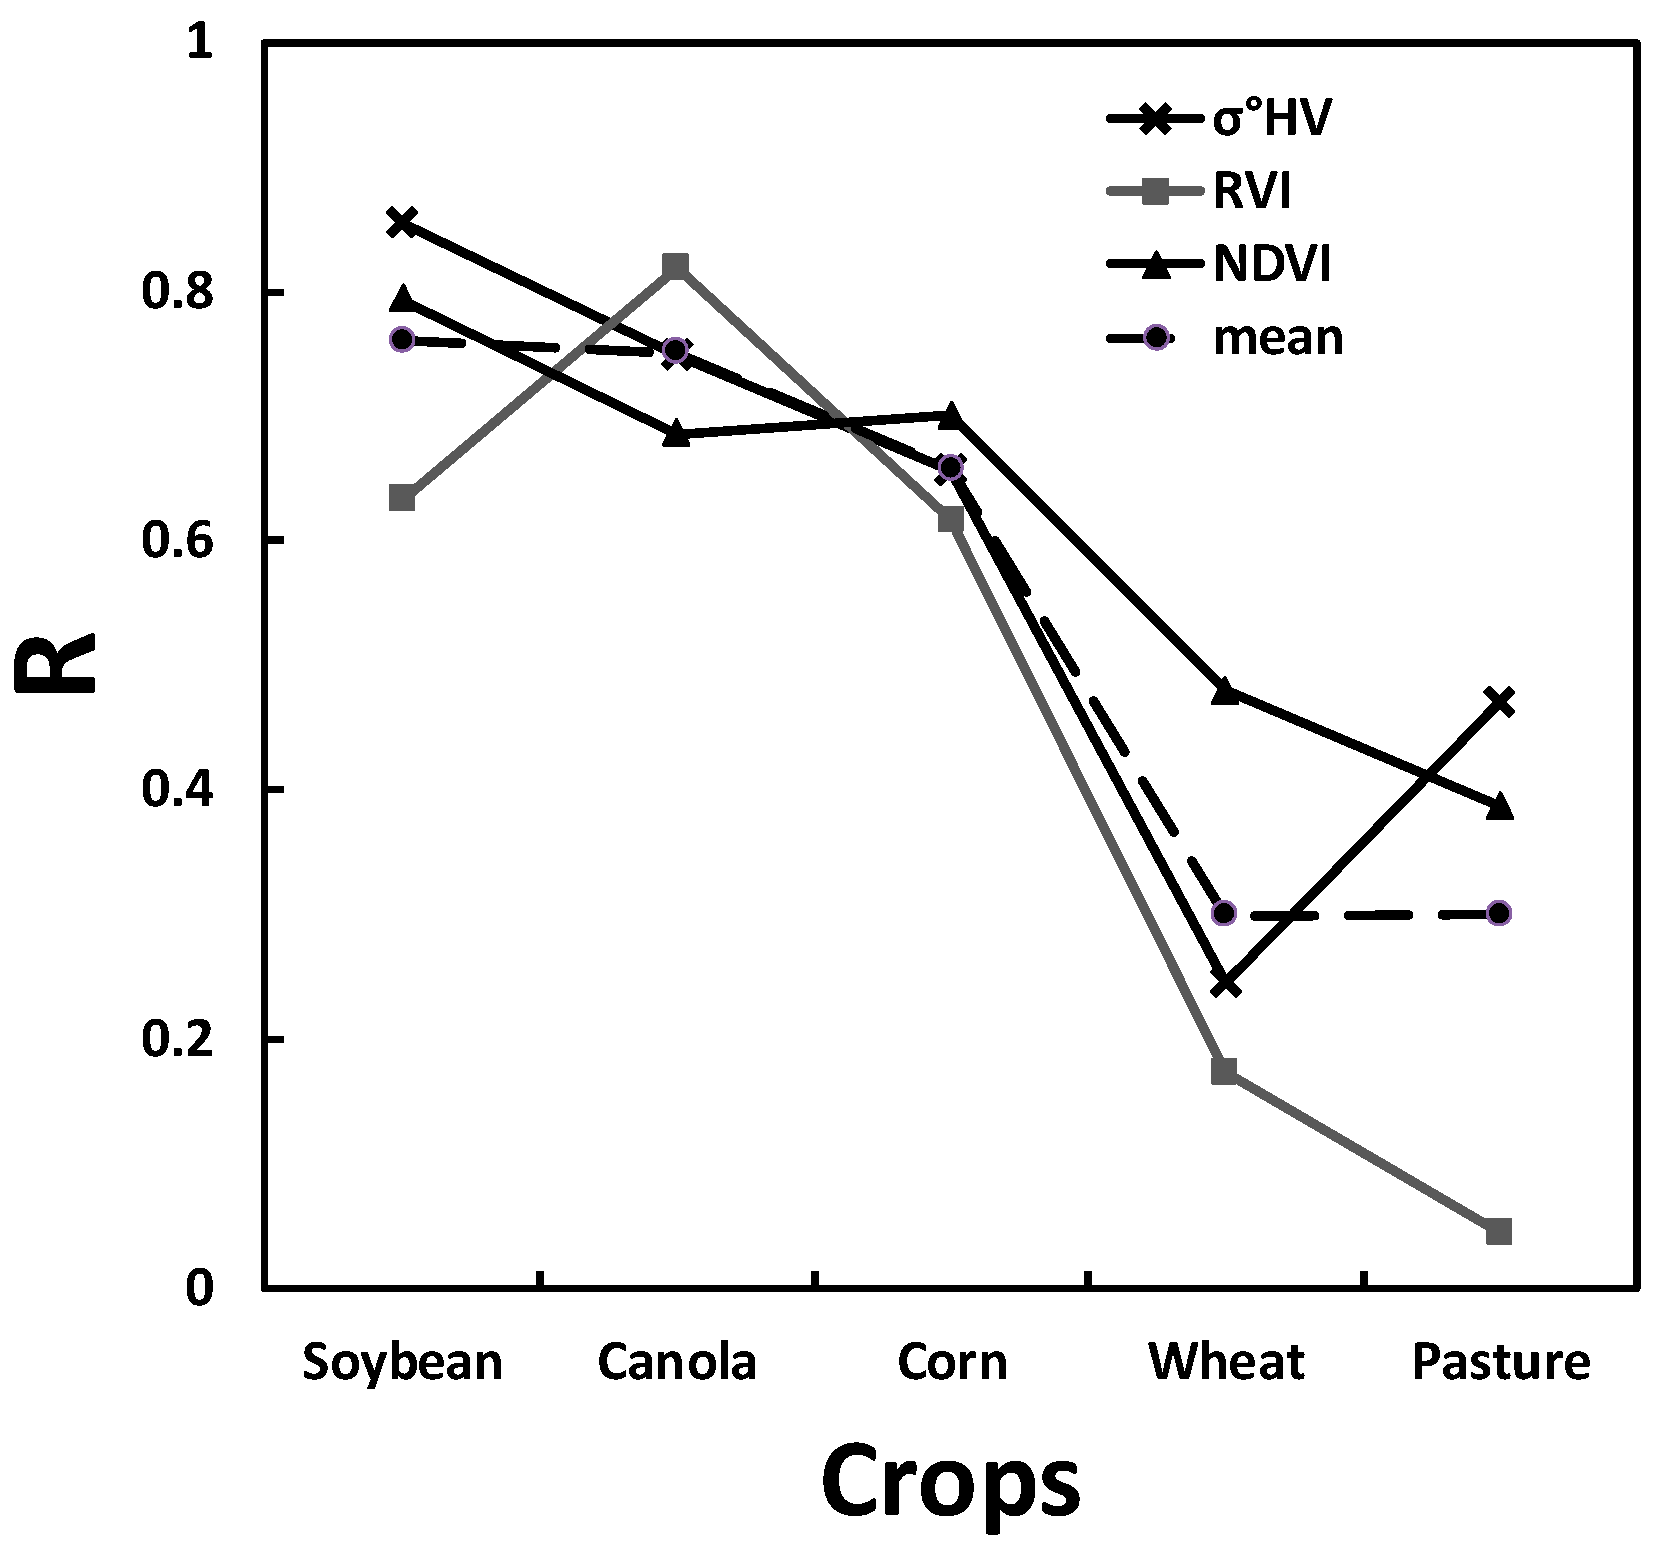
SAR backscatters are generally related to vegetation properties such as shape, height, size, and density, which vary with vegetation types [77]. Different vegetation types may present different behavior in WCM’s calibrations [27,78,79]. In this study, therefore, the simplified WCM (Equation (6)) was applied to five different crop types: soybean, canola, pasture, wheat, and corn where was used as the soil moisture retriever . The , RVI, and NDVI were separately used as the vegetation descriptor V. The WCM was calibrated for each crop type separately. The LOOCV method was used for the model evaluation. We calculated R values between the in-situ and modelled soil moisture for each crop type. Figure 2 show the plots of the R values for the five crop types. The results showed that the R values vary with crop types and vegetation descriptors.
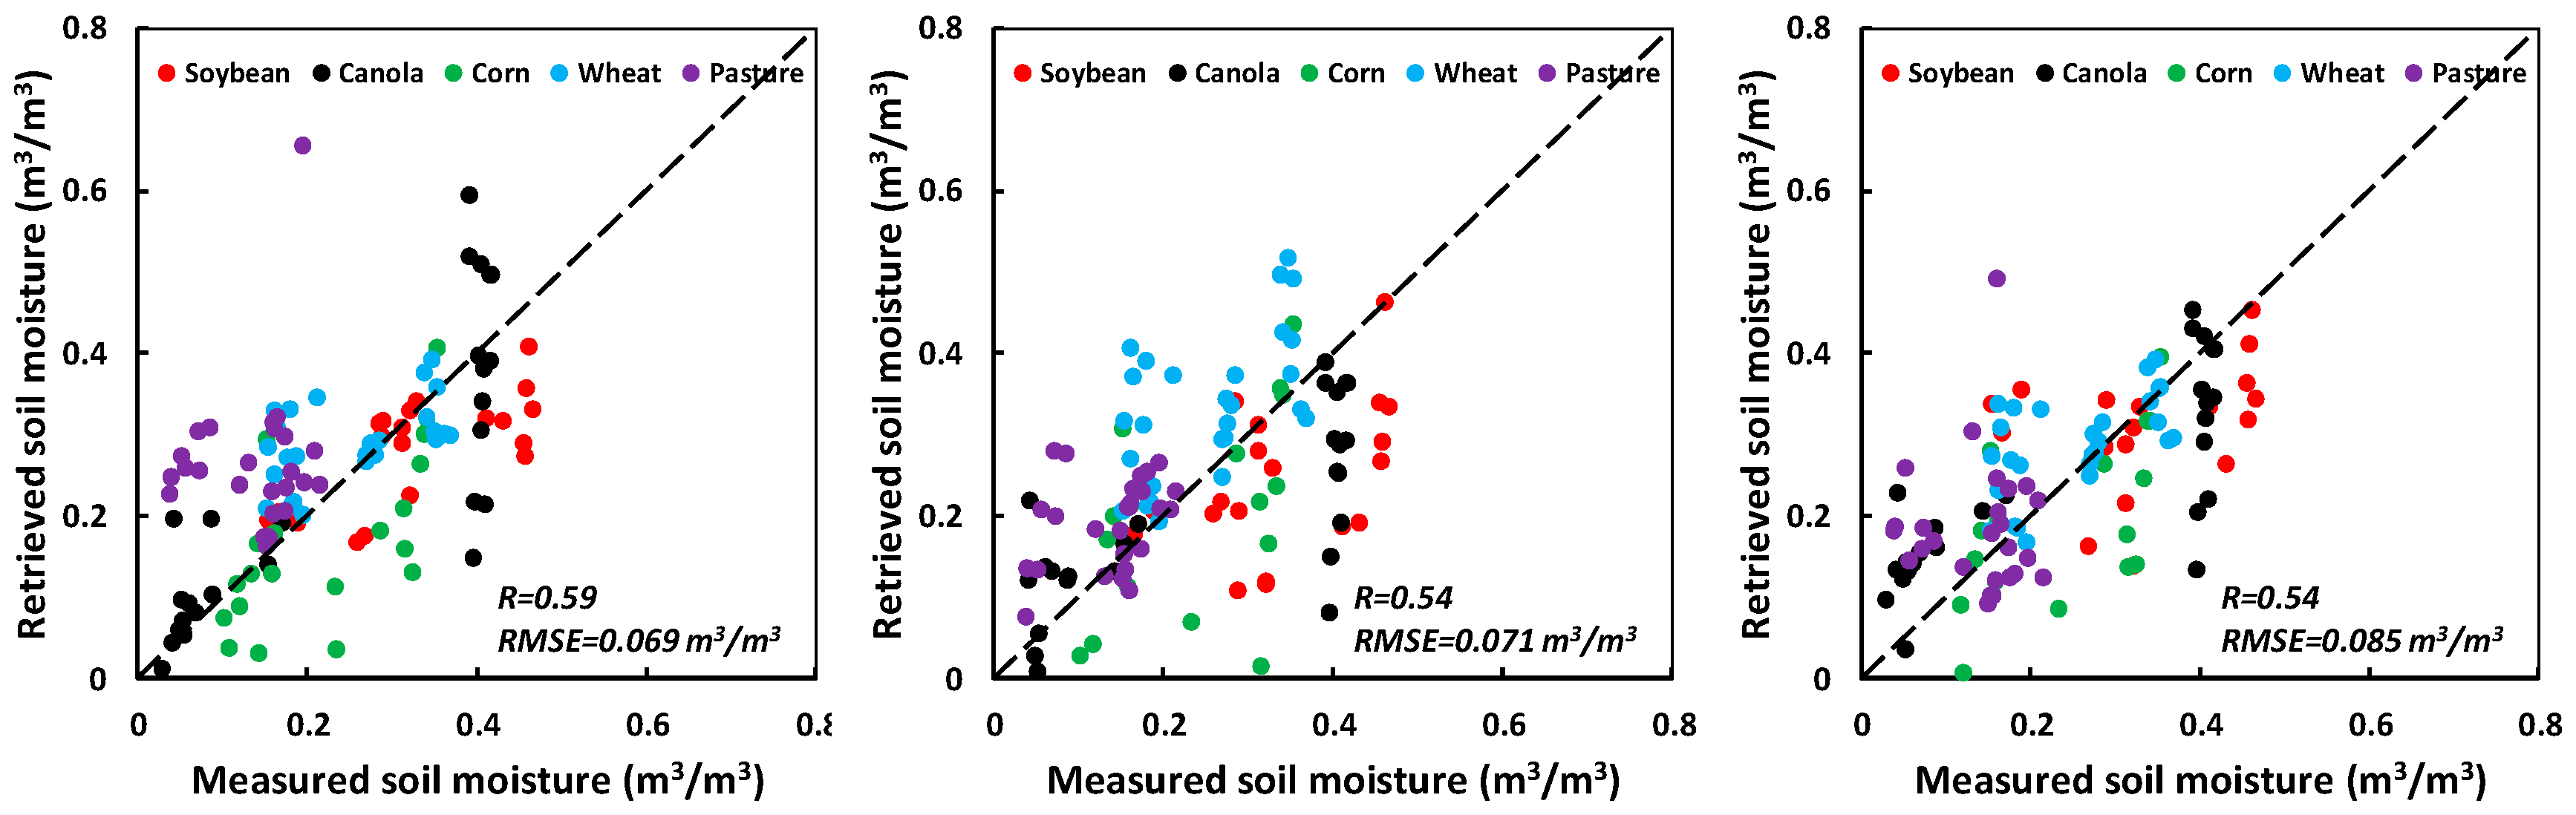
The soil moisture retrieval for soybean, canola, and corn generally showed higher R values than those for wheat and pasture for all the three vegetation descriptors (Figure 2a). Among the five crop types, soybean and pasture have the best and the worst soil moisture retrieval, respectively. These results are confirmed by the mean R values of the three vegetation descriptors. The soybean, canola, and corn have mean R values ranging from 0.61 to 0.77 while the wheat and pasture have mean R values of 0.48 and 0.15, respectively. Figure 2b shows the mean R values for , RVI, and NDVI are 0.57, 0.52, and 0.51. It also demonstrates that used as the vegetation descriptor in the WCM gave slightly better soil moisture retrieval results than RVI and NDVI. The results are also confirmed by Figure 3, which shows the scatter plots with R values between the in-situ measured and model retrieved moisture together for all crop types. The R values for , RVI, and NDVI are 0.59, 0.54, and 0.54, respectively. The values of RMSE between retrieved and in-situ soil moisture are 0.069 m3/m3, 0.085 m3/m3, and 0.071 m3/m3 for , RVI, and NDVI, respectively. The results are similar to those in the literature for soil moisture retrieval for other crops from SAR data using the WCM [12,28]. Overall, as the vegetation descriptor in the WCM shows similar accuracy as NDVI but slightly outperforms RVI for the retrieval of soil moisture. It worth mentioning that the in-situ LAI as the vegetation descriptor in the WCM achieved slightly better results (R = 0.8 and RMSE = 0.067 m3/m3) than . Nevertheless our study showed that the use of can overcome the constraints of the commonly used vegetation descriptors (e.g., NDVI) in WCM such as data availability and weather dependency, thus improving soil moisture retrieval.
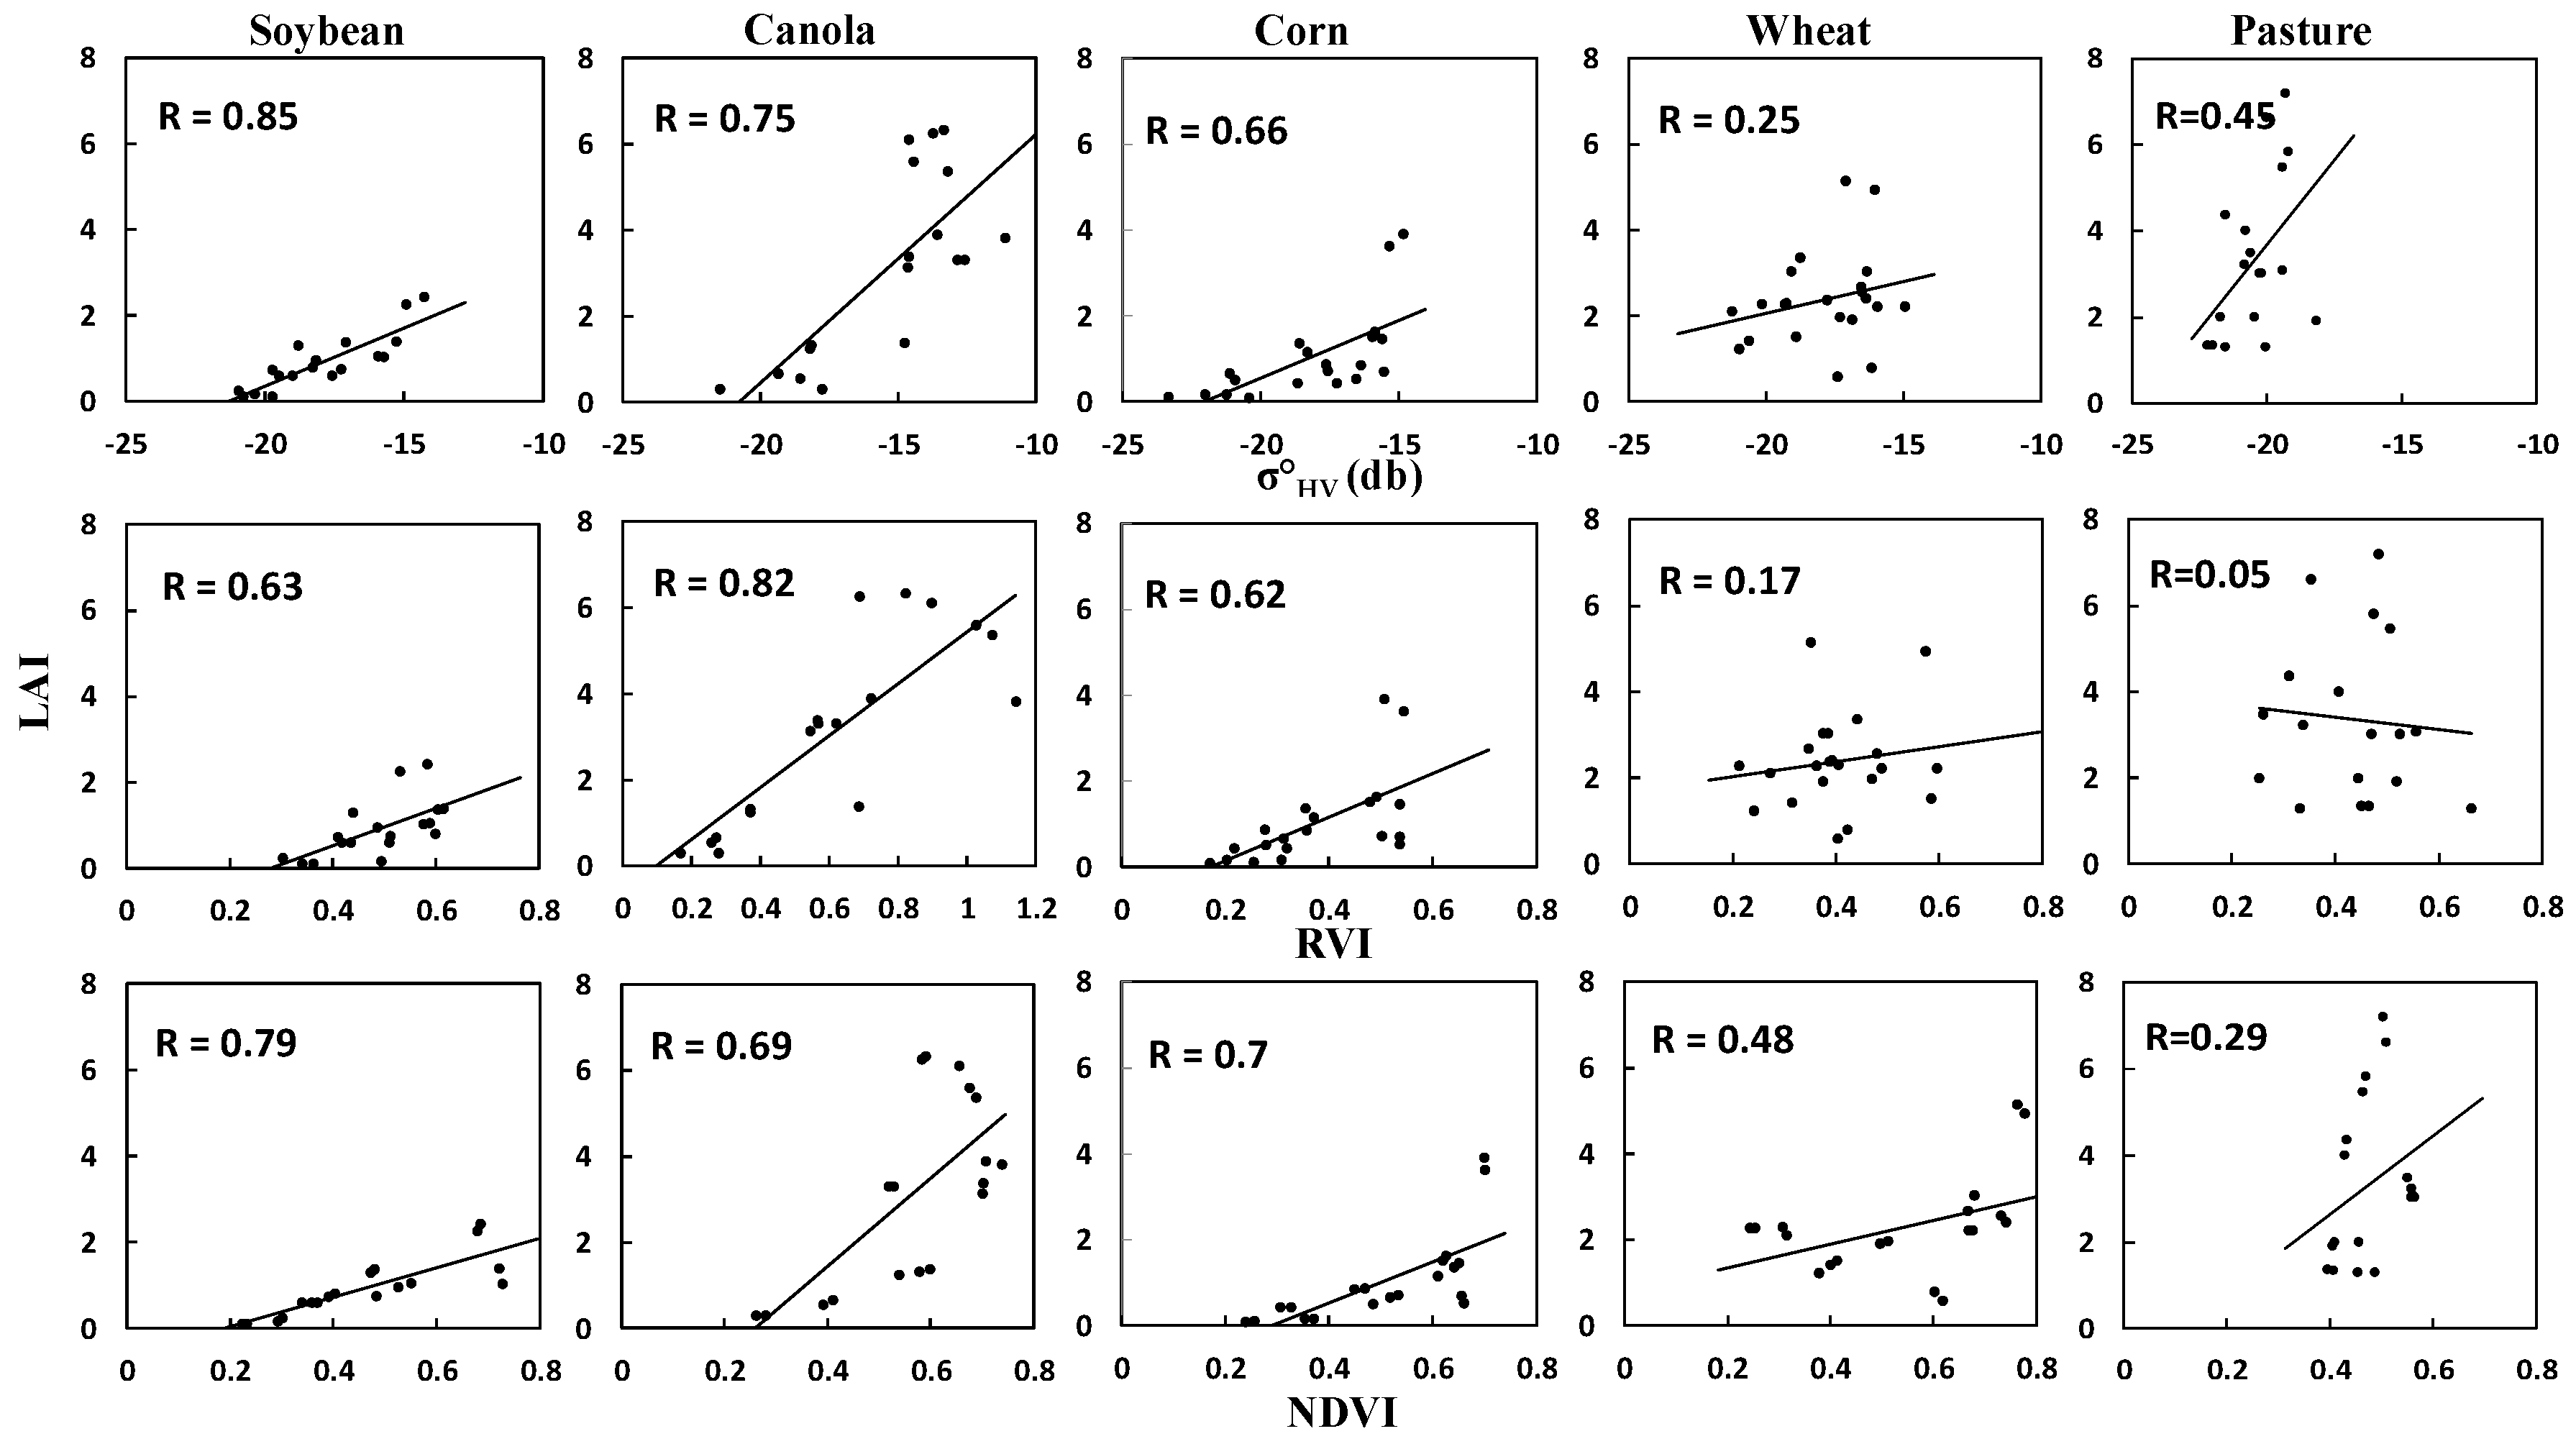
To further understand the results, we examined the relationships between the LAI and the vegetation descriptors for each crop type. Figure 4 shows the scatter plots of the LAI vs. the three vegetation descriptors of , RVI, and NDVI. The R values between the LAI and the three vegetation descriptors were given in Figure 5. The results show that soybean, canola, and corn generally have better correlations (R) between the LAI and three vegetation descriptors than wheat and pasture. Soybean, canola and corn have mean R values larger than 0.65 while wheat and pasture have mean R values around 0.3, which helps to explain the results shown in Figure 2a. The results indicate that the crops that have a stronger correlation between LAI and vegetation descriptors generally demonstrate better soil moisture retrievals when using the WCM.
Figure 4 show that for some crop types, e.g., wheat and pasture, the relationships between vegetation descriptors (, RVI, and NDVI) are not good. Moreover, for some crop types, vegetation descriptors do not saturate with LAI. More specifically, for soybean, the has a better sensitivity to LAI than RVI and NDVI. It could result in the more accurate soil moisture retrieval (with R = 0.81). Canola shows LAI values ranging from 0.3 m2/m2 to 6.3 m2/m2 with a mean value of 3.12 (Table 2). All three vegetation descriptors present a good relationship with LAI, but and RVI are more sensitive to LAI than NDVI , which is saturated at a LAI of around 2.0 m2/m2 as shown in Figure 4. This could be the reason why NDVI as the vegetation descriptor in the WCM achieves less accurate soil moisture retrievals (R = 0.57) than and RVI. For corn, the three vegetation descriptors show good linear relationships with LAI when LAI is less than 2.0 m2/m2, but they saturate quickly. Their similar relationships with LAI could lead to similar soil moisture estimations (Figure 2b). For wheat, all three vegetation descriptors saturate with LAI and have weak relationships with LAI, with NDVI showing slightly better correlations than and RVI. Some of the LAI having values between 3.0 m2/m2 and 5.0 m2/m2 (Figure 4) indicated some observations were in late growing stage of wheat with dense canopy, as a result, the penetration of SAR is in fact limited when vegetation canopy is dense. The three vegetation descriptors present similar soil moisture estimations (Figure 2b). We also tested LAI as the vegetation descriptor in the WCM. The LAI gives the values of 0.59 and 0.07 m3/m3 for R and RMSE, separately. It shows that even LAI as the vegetation descriptor cannot significantly improve the result at this growing stage. However the estimation accuracies are still acceptable. The partial reason for the results is that NDVI and LAI are often influenced by vegetation water content [80], in addition, Kim et al. [58] also showed that RVI is highly correlated with vegetation water content in wheat. The vegetation water content could correlate with the soil moisture underneath the canopy. For pasture of which the LAI values ranged from 2.0 m2/m2 to 7.0 m2/m2 (Table 1), all three vegetation descriptors were saturated and had weak relationships with LAI (R = 0.47 for , R = 0.04 for RVI and R = 0.29 for NDVI). However, NDVI leads to better soil moisture retrieval than and RVI which needs to be explained by further studies. In general, Figure 4 shows the became saturated at relatively higher LAI values and is more sensitive to LAI than RVI and NDVI for some crop types The results are consistent with the studies of Paloscia [62], Simoes et al. [63], and Jiao et al. [81] which showed that is related to LAI and vegetation biomass.
Although, is generally more sensitive to vegetation than NDVI and RVI, its backscatter still contains some soil moisture signals, which may introduce errors. However, this study shows, overall, as the vegetation descriptor presents similar soil moisture estimation accuracy as NDVI and slightly outperforms RVI (Figure 3). Actually Baghdadi et al. showed that cross polarization is more sensitive to vegetation cover than to soil moisture and the soil contribution in cross polarization quickly becomes lower than the vegetation contribution. The sensitivity of cross polarization to soil moisture strongly decreases when both incidence angle and vegetation density increases. Therefore only introduce errors when the WCM is applied to areas with less vegetation. Moreover, the sensitivity decreases when the soil moisture decreases. For example, the soil contribution becomes negligible for incidence angle higher than 25° from an NDVI of 0.27 and 0.39 for soil moisture with 0.05 m3/m3 and 0.10 m3/m3, respectively [16]. The soil contribution in cross polarization to the total signal is low in the case of well-developed vegetation cover. Moreover, in this study, 25% of in-situ data were collected when LAI was less than 1.0. Majority of the in-situ data has LAI larger than 1.0. The influence of soil contribution to HV backscatter on the soil moisture estimation is low in this study. The study also showed that (R = 0.63) achieved better soil moisture estimations than RVI (R = 0.53) and NDVI (0.52) for LAI larger than 2.0 and vice versa for LAI less than 1.0 (R = 0.80, 0.86, 0.83 for , RVI and NDVI, separately).
As stated above, NDVI has a saturation point at lower LAI than for some crop types. The reason could be that NDVI is a measure of vegetation greenness whereas is a measure of volumetric scattering. In general, vegetation reaches the maximum greenness before it becomes matured volumetrically due to radar’s penetration. Normally and RVI have similar results in vegetation characterization [82]. The dispersion of and RVI in this study may be related to the effect of crop planting directions. RVI was calculated only from HH and HV polarization in this study. A previous study [83] reported that the planting row orientations in a sugarcane field had an influence on the HH polarization but not on the HV polarization. In addition, it can be also noticed from Figure 3 that the retrieved soil moisture is overestimated for relatively dry sites (Ms < 0.25 m3 m-3) and underestimated for wet sites (Ms > 0.25 m3 m−3) due to the difference of penetration of SAR in dry and wet soils. In addition, the data we used in this study is from the SMAPVEX12, which is a six-week field campaign in 2012 (7 June–17 July). The database for some crop types may cover a limited period. It could be useful to test WCM for a vegetation growth cycle in future study.
Ideally, the Radarsat-2 data should be in the same viewing geometry. Since Radarsat-2 has a revisit time of 24 days, it is difficult to obtain enough repeat pass images within a short period for the analysis. Instead, we used all available Radarsat-2 data, which are in different modes and possess different incidence angles. To reduce the effect of SAR incidence angle, we normalized all Radarsat-2 images to a reference angle theoretical model of Lambert’s law. However, it should be noted that the theoretical approach may not be the most appropriate one and could introduce errors [40]. The assessments of errors and different approaches are beyond the scope of this paper. Therefore, although an incidence angle normalization process was applied to these images to minimize the effect of different viewing geometries on SAR backscatters, the residual errors may still exist. The SAR imagery limitations can be improved after the RCM data become available. The RCM has a 4-day revisit time, which makes it possible to acquire sufficient repeat pass SAR images in a short period.
5. Conclusions
This study investigated the capability of using SAR-derived vegetation descriptors in a WCM for improving soil moisture retrieval over a vegetated area. Two vegetation descriptors, and RVI, derived from Radarsat-2/SAR were studied. The results were compared to those obtained from using NDVI. The use of in WCM achieved similar soil moisture retrieval as the use of NDVI but slightly better than the use of RVI. The RMSE between retrieved and observed soil moisture were 0.069 m3/m3, 0.085 m3/m3 and 0.071 m3/m3 for , RVI and NDVI, respectively. The corresponding R were 0.59, 0.54, and 0.54, respectively. The results can be explained from the relationships of the vegetation descriptors with LAI, which shows saturates at relatively higher LAI values for some crop types and is generally more sensitive to vegetation than RVI and NDVI. Soil contribution in HV polarization brings an effect on the soil moisture estimation over areas with less vegetation but the effect is limit in this study. The small difference of RVI and (or NDVI) in soil moisture retrieval indicates that RVI is also a relevant vegetation descriptor in the WCM. Moreover, the use of in the WCM overcomes the dependency of WCM on in-situ or optical remote sensing data for deriving vegetation descriptors and further reduces additional data requirements for WCM, thus improves soil moisture retrieval. The study also indicates that the use of dual-polarized SAR images presents a practical way to retrieve soil moisture over a large area since the dual-polarized images can have a large swath width of up to 500 km (e.g., Radarsat-2 ScanSAR wide mode). The RCM will further enhance the capability with its rapid revisit and compact polarimetric (CP) configuration. The RCM CP is considered as a possible alternative of quad-polarized (QP) system but with wider image swath. Therefore the use of CP data in WCM could achieve a better soil moisture retrieval over a large area even under dense vegetation canopy.
Author Contributions
J.L. performed the experiment, analyzed the data, validated the results and wrote the manuscript. S.W. provided crucial guidance and support during the research, and revised the manuscript.
Funding
The research received no external funding.
Acknowledgments
This work was supported by the Groundwater Geoscience Program and Remote Sensing Program of Natural Resources Canada. We gratefully thank the investigators of the SMAP Validation Experiment 2012 (SMAPVEX12) for their sharing the SMAPVEX12 in-situ measurements with the scientific community. The editor and anonymous reviewers are also thanked for their valuable comments and suggestions, which improved an earlier version of this paper.
Conflicts of Interest
The authors declare no conflict of interest.
References
- Hajnsek, I.; Jagdhuber, T.; Schön, H.; Papathanassiou, K.P. Potential of estimating soil moisture under vegetation cover by means of PolSAR. IEEE Trans. Geosci. Remote Sens. 2009, 47, 442–454. [Google Scholar] [CrossRef] [Green Version]
- Wang, S. Simulation of evapotranspiration and its response to plant water and CO2 transfer dynamics. J. Hydrometeorol. 2008, 9, 426–443. [Google Scholar] [CrossRef]
- Wang, S.; McKenney, D.W.; Shang, J.; Li, J. A national-scale assessment of long-term water budget closures for Canada’s watersheds. J. Geophys. Res. 2014, 119, 8712–8725. [Google Scholar] [CrossRef]
- Wang, S.; Huang, J.; Li, J.; Rivera, A.; McKenney, D.W.; Sheffield, J. Assessment of water budget for sixteen large drainage basins in Canada. J. Hydrol. 2014, 512, 1–15. [Google Scholar] [CrossRef]
- Ulaby, F.T.; Moore, R.K.; Fung, A.K. Microwave Remote Sensing: Active and Passive; Artech House: Dedham, MA, USA, 1986; Volume III. [Google Scholar]
- Zribi, M.; Baghdadi, N.; Holah, N.; Fafin, O. New methodology for soil surface moisture estimation and its application to ENVISAT-ASAR multi incidence data inversion. Remote Sens. Environ. 2005, 96, 485–496. [Google Scholar] [CrossRef]
- Srivastava, H.S.; Patel, P.; Sharma, Y.; Navalgund, R.R. Large-area soil moisture estimation using multiincidence-angle RADARSAT-1 SAR data. IEEE Trans. Geosci. Remote Sens. 2009, 47, 2528–2535. [Google Scholar] [CrossRef]
- Petropoulos, G.P.; Ireland, G.; Barrett, B. Surface soil moisture retrievals from remote sensing: Current status, products & future trends. Phys. Chem. Earth 2015, 83, 36–56. [Google Scholar]
- Alexakis, D.D.; Mexis, F.K.; Vozinaki, A.K.; Daliakopoulos, I.N.; Tsanis, I.K. Soil moisture content estimation based on sentinel-1 and auxiliary earth observation products. A Hydrological Approach. Sensors 2017, 17, 1455. [Google Scholar] [CrossRef] [PubMed]
- Zhang, Y.; Gong, J.; Sun, K.; Yin, J.; Chen, X. Estimation of soil moisture index using multi-temporal Sentinel-1 images over Poyang Lake ungauged zone. Remote Sens. 2018, 10, 12. [Google Scholar] [CrossRef]
- Autret, M.; Bernard, R.; Vidal-Madjar, D. Theoretical study of the sensitivity of the microwave backscattering coefficient to the soil surface parameters. Int. J. Remote Sens. 1989, 10, 171–179. [Google Scholar] [CrossRef]
- Zribi, M.; Gorrab, A.; Baghdadi, N. A new soil roughness parameter for the modelling of radar backscattering over bare soil. Remote Sens. Environ. 2014, 152, 62–73. [Google Scholar] [CrossRef] [Green Version]
- Holah, N.; Baghdadi, N.; Zribi, M.; Bruand, A.; King, C. Potential of ASAR/ENVISAT for the characterization of soil surface parameters over bare agricultural fields. Remote Sens. Environ. 2005, 96, 78–86. [Google Scholar] [CrossRef] [Green Version]
- Baghdadi, N.; Hajj, M.E.; Zribi, M.; Bousbih, S. Calibration of the water cloud model at C-band for winter crop fields and grasslands. Remote Sens. 2017, 9, 969. [Google Scholar] [CrossRef]
- Oh, Y.; Sarabandi, K.; Ulaby, F.T. An empirical model and an inversion technique for radar scattering from bare soil surfaces. IEEE Trans. Geosci. Remote Sens. 1992, 30, 370–381. [Google Scholar] [CrossRef]
- Mladenova, I.E.; Jackson, T.J.; Bindlish, R.; Hensley, S. Incidence angle normalization of radar backscatter data. IEEE Trans. Geosci. Remote Sens. 2013, 51, 1791–1804. [Google Scholar] [CrossRef]
- Fung, A.K.; Chen, K.S. Dependence of the surface backscattering coefficients on roughness, frequency and polarization stats. Int. J. Remote Sens. 1992, 13, 1663–1680. [Google Scholar] [CrossRef]
- Sun, G.; Simonett, D.S.; Strahler, A.H. A radar backscatter model for discontinuous coniferous forests. IEEE Trans. Geosci. Remote Sens. 1991, 29, 639–650. [Google Scholar] [CrossRef]
- Wang, Y.; Day, J.L.; Davis, F.W.; Melack, J.M. Modeling L-band radar backscatter of Alaskan boreal forest. IEEE Trans. Geosci. Remote Sens. 1993, 31, 1146–1154. [Google Scholar] [CrossRef]
- Li, Y.Y.; Zhao, K.; Ren, J.H.; Ding, Y.L.; Wu, L.L. Analysis of the dielectric constant of saline-alkali soils and the effect on radar backscattering coefficient: A case study of soda alkaline saline soils in Western Jilin Province using RADARSAT-2 data. Sci. World J. 2014, 2014, 563015. [Google Scholar] [CrossRef] [PubMed]
- Zhang, T.; Zeng, Q.; Li, Y.; Xiang, Y. Study on relation between InSAR coherence and soil moisture. In Proceedings of the ISPRS Congress, Beijing, China, 3–11 July 2008. [Google Scholar]
- Beaudoin, A.; Le Toan, T.; Gwyn, Q.H.J. SAR observations and modeling of the C-band backscatter variability due to multiscale geometry and soil moisture. IEEE Trans. Geosci. Remote Sens. 1990, 28, 886–895. [Google Scholar] [CrossRef]
- Le Toan, T. Active microwave signatures of soil and crops: Significant results of three years of experiments. In Proceedings of the Symposium IGARSS’82, Munich, Germany, 1–4 June 1982. [Google Scholar]
- McNairn, H.; Brisco, B. The application of C-band polarimetric SAR for agriculture: A review. Can. J. Remote Sens. 2004, 303, 525–542. [Google Scholar] [CrossRef]
- Barrett, B.W.; Dwyer, E.; Whelan, P. Soil moisture retrieval from active spaceborne microwave observations: An evaluation of current techniques. Remote Sens. 2009, 1, 210–242. [Google Scholar] [CrossRef]
- Romshoo, S.A.; Koike, M.; Hironaka, S.; Oki, T.; Musiake, K. Influence of Surface and Vegetation Characteristics on C-band Radar Measurements for Soil Moisture Content. J. Indian Soc. Remote Sens. 2002, 30, 229. [Google Scholar] [CrossRef]
- Gherboudj, I.; Maga gi, R.; Berg, A.A.; Toth, B. Soil moisture retrieval over agriculture fields from multi-polarized and multi-angular Radarsat-2 SAR data. Remote Sens. Environ. 2011, 115, 33–43. [Google Scholar] [CrossRef]
- Baghdadi, N.; Holah, N.; Zribi, M. Soil moisture estimation using multi-incidence and multi-polarization ASAR data. Int. J. Remote Sens. 2006, 27, 1907–1920. [Google Scholar] [CrossRef]
- Cloude, S.R.; Pottier, E. A review of target decomposition theorems in radar polarimetry. IEEE Trans. Geosci. Remote Sens. 1996, 34, 498–518. [Google Scholar] [CrossRef]
- Baghdadi, N.; Zribi, M.; Loumagne, C.; Ansart, P.; Anguela, T.P. Analysis of TerraSAR-X data and their sensitivity to soil surface parameters over bare agriculture fields. Rmote Sens. Environ. 2008, 112, 4370–4379. [Google Scholar] [CrossRef]
- Baghdadi, N.; Choker, M.; Zribi, M.; Hajj, M.E.; Paloscia, S.; Verhoest, N.E.C.; Lievens, H.; Baup, F.; Mattia, F. A new empirical model for radar scattering from bare soil surfaces. Remote Sens. 2016, 8, 920. [Google Scholar] [CrossRef]
- Aubert, M.; Baghdadi, N.; Zribi, M.; Douaoui, A.; Loumagne, C.; Baup, F.; Garrigues, S. Analysis of TerraSAR-X data sensitivity to bare soil moisture, roughness, composition and soil crust. Remote Sens. Environ. 2011, 115, 1801–1810. [Google Scholar] [CrossRef] [Green Version]
- Das, K.; Paul, P.K. Present status of soil moisture estimation by microwave remote sensing. Cogent Geosci. 2015, 1, 1084669. [Google Scholar] [CrossRef]
- He, L.; Hong, Y.; Wu, X.; Ye, N.; Walker, J.P.; Chen, X. Investigation of SMAP active-passive downscaling algortihms using combined Sentinel-1 SAR and SMAP radiometer data. IEEE Trans. Geosci. Remote Sens. 2018, 56, 4906–4918. [Google Scholar] [CrossRef]
- Li, J.; Wang, S.; Gunn, G.; Joosse, P.; Hazen, A.J. A model for downscaling SMOS soil moisture using Sentinel-1 SAR data. Int. J. Appl. Earth Obs. 2018, 72, 109–121. [Google Scholar] [CrossRef]
- Attema, E.P.W.; Ulaby, F.T. Vegetation modeled as a water cloud. Radio Sci. 1978, 13, 357–364. [Google Scholar] [CrossRef]
- Oh, Y. Quantitative retrieval of soil moisture content and surface roughness from multipolarized radar observations of bare soil surfaces. IEEE Trans. Geosci. Remote Sens. 2004, 42, 596–601. [Google Scholar] [CrossRef]
- Bai, X.; He, B. Potential of Dubois model for soil moisture retrieval in prairie areas using SAR and optical data. Int. J. Remote Sens. 2015, 36, 5737–5753. [Google Scholar] [CrossRef]
- Paloscia, S.; Pettinato, S.; Santi, E.; Notarnicola, C.; Pasolli, L.; Reppucci, A. Soil moisture mapping using Sentinel-1 images: Algorithm and preliminary validation. Remote Sens. Environ. 2013, 134, 234–248. [Google Scholar] [CrossRef]
- Fung, A.K. Microwave Scattering and Emission Models and Their Applications; Artech House: Nordwood, MA, USA, 1994. [Google Scholar]
- Chen, K.-S.; Wu, T.-D.; Tsang, L.; Li, Q.; Shi, J.; Fung, A.K. Emission of rough surfaces calculated by the integral equation method with comparison to three-dimensional moment method simulations. IEEE Trans. Geosci. Remote Sens. 2006, 27, 3831–3852. [Google Scholar] [CrossRef]
- Baghdadi, N.; Saba, E.; Aubert, M.; Zribi, M.; Baup, F. Evaluation of radar backscattering models IEM, Oh, and Dubois for SAR data in X-band over bare soils. IEEE Geosci. Remote Sens. Lett. 2011, 6, 1160–1164. [Google Scholar] [CrossRef]
- Baghdadi, N.; Chaaya, J.A.; Zribi, M. Semiempirical calibration of the integral equation model for SAR data in C-band and cross polarization using radar images and field measurements. IEEE Geosci. Remote Sens. Lett. 2011, 8, 14–18. [Google Scholar] [CrossRef]
- Baghdadi, N.; Zribi, M.; Paloscia, S.; Verhoest, N.E.; Lievens, H.; Baup, F.; Mattia, F. Semi-empirical calibration of the integral equation model for co-polarized L-band backscattering. Remote Sens. 2015, 7, 13626–13640. [Google Scholar] [CrossRef] [Green Version]
- Choker, M.; Baghdadi, N.; Zribi, M.; El Hajj, M.; Paloscia, S.; Verhoest, N.; Lievens, H.; Mattia, F. Evaluation of the Oh, Dubois and IEM models using large dataset of SAR signal and experimental soil measurements. Water 2017, 9, 38. [Google Scholar] [CrossRef]
- Dubois, P.; van Zyl, J.; Engman, T. Measuring soil moisture with imaging radars. IEEE Trans. Geosci. Remote Sens. 1995, 33, 915–926. [Google Scholar] [CrossRef] [Green Version]
- Gorrab, A.; Zribi, M.; Baghdadi, N.; Lili-Chabaane, Z.; Mougenot, B. Multi-frequency analysis of soil moisture vertical heterogeneity effect on radar backscatter. In Proceedings of the 2014 1st International Advanced Technologies for Signal and Image Processing (ATSIP), Sousse, Tunisia, 17–19 March 2014; pp. 379–384. [Google Scholar]
- Gao, Q.; Zribi, M.; Escorihuela, M.J.; Baghdadi, N. Synergetic Use of Sentinel-1 and Sentinel-2 Data for Soil Moisture Mapping at 100 m Resolution. Sensors 2017, 17, 1966. [Google Scholar] [CrossRef] [PubMed]
- Palosica, S.; Pampaloni, P.; Pettinato, S.; Santi, E. A comparison of algorithms for retrieving soil moisture from ENVISAT/ASAR images. IEEE Trans. Geosci. Remote Sens. 2008, 46, 3274–3284. [Google Scholar] [CrossRef]
- Hajj, M.E.; Baghdadi, N.; Zribi, M.; Belaud, G.; Cheviron, B.; Courault, D.; Charron, F. Soil moisture retrieval over irrigated grassland using X-band SAR data. Remote Sens. Environ. 2016, 176, 202–218. [Google Scholar] [CrossRef] [Green Version]
- Hajj, M.E.; Baghdadi, N.; Zribi, M.; Bazzi, H. Synergic use of Sentinel-1 and Sentinel-2 images for operational soil moisture mapping at high spatial resolution over agricultural areas. Remote Sens. 2017, 9, 1292. [Google Scholar] [CrossRef]
- Santi, E.; Paloscia, S.; Pettinato, S.; Notarnicola, C.; Pasolli, E.; Pistocchi, A. Comparison between SAR Soil Moisture Estimates and Hydrological Model Simulations over the Scrivia Test Site. Remote Sens. 2013, 5, 4961–4976. [Google Scholar] [CrossRef] [Green Version]
- Zribi, M.; Kotti, F.; Amri, R.; Wagner, W.; Shabou, M.; LiliChabaane, Z.; Baghdadi, N. Soil moisture mapping in a semiarid region, based on ASAR/wide swath satellite data. Water Resour. Res. 2014, 50, 823–835. [Google Scholar] [CrossRef]
- Zribi, M.; Chahbi, A.; Shabou, M.; Lili-Chabaane, Z.; Duchemin, B.; Baghdadi, N.; Amri, R.; Chehbouni, A. Soil surface moisture estimation over a semi-arid region using ENVISAT ASAR radar data for soil evaporation evaluation. Hydrol. Earth Syst. Sci. 2011, 15, 345–358. [Google Scholar] [CrossRef] [Green Version]
- Kumar, K.; Rao, H.P.S.; Arora, M.K. Study of water cloud model vegetation descriptors in estimating soil moisture in Solani catchment. Hydrol. Process. 2015, 29, 2137–2148. [Google Scholar] [CrossRef]
- Borgeaud, M.; Attema, E.; Salgado-Gispert, G.; Bellini, A.; Noll, J. Analysis of bare soil surface roughness parameters with ERS-1 SAR data. In Proceedings of the Symposium on Retrieval of Bio- and Geophysical Parameters from SAR data for Land Applications, Toulouse, France, 17–20 October 1995. [Google Scholar]
- Tomer, S.K.; Bitar, A.A.; Sekhar, M.; Zribi, M.; Bandyopadhyay, S.; Sreelash, K.; Sharma, A.K.; Corgne, S.; Kerr, Y. Retrieval and Multi-scale Validation of Soil Moisture from Multi-temporal SAR data in a Semi-Arid Tropical Region. Remote Sens. 2015, 7, 8128–8153. [Google Scholar] [CrossRef]
- Kim, Y.; Jackson, T.; Bindlish, R.; Lee, K. Retrieval of wheat growth parameters with radar vegetation indices. IEEE Geosci. Remote Sens. 2013, 11, 808–812. [Google Scholar]
- Kumar, S.D.; Rao, S.S.; Sharma, J.R. Radar vegetation index as an alternative to NDVI for monitoring of soybean and cotton. Indian Cartogr. 2013, 33, 91–96. [Google Scholar]
- Kasischke, E.S.; Tanase, M.A.; Bourgeau-Chavez, L.L.; Borr, M. Soil moisture limitations on monitoring boreal forest regrowth using spaceborne L-band SAR data. Remote Sens. Environ. 2011, 115, 227–232. [Google Scholar] [CrossRef]
- Rao, S.S.; Kumar, S.D.; Das, S.N.; Nagaraju, M.S.S.; Venugopal, M.V.; Rajankar, O.; Laghate, P.; Reddy, M.S.; Joshi, A.K.; Sharma, J.R. Modified Dubois model for estimating soil moisture with dual polarized SAR data. J. Indian Soc. Remote Sens. 2013, 41, 865–872. [Google Scholar]
- Paloscia, S. An Empirical Approach to Estimating Leaf Area Index from Multifrequency SAR Data. Int. J. Remote Sens. 1998, 19, 359–364. [Google Scholar] [CrossRef]
- Simões, M.S.; Rocha, J.V.; Lamparelli, R.A.C. Growth Indices and Productivity in Sugarcane. Sci. Agric. 2005, 62, 23–30. [Google Scholar] [CrossRef]
- Kseneman, M.; Gleich, D. Soil Moisture Estimation from X-Band Data Using Tikhonov Regularization and Neural Net. IEEE Trans. Geosci. Remote Sens. 2013, 51, 3885–3898. [Google Scholar] [CrossRef]
- Wagner, W.; Bloeschl, G.; Pampaloni, P.; Calvet, J.-C.; Bizzarri, B.; Wigneron, J.-P.; Kerr, Y. Operational readiness of microwave remote sensing of soil moisture for hydrologic applications. Hydrol. Res. 2007, 38, 1–20. [Google Scholar] [CrossRef]
- Mason, D.C.; Garcia-Pintado, J.; Cloke, H.L.; Dance, S.L. Evidence of a topographic signal in surface soil moisture derived from ENVISAT ASAR wide swath data. Int. J. Appl. Earth Obs. 2016, 45, 178–186. [Google Scholar] [CrossRef]
- Ulaby, F.T.; Moore, R.K.; Fung, A.K. Microwave Remote Sensing, Active and Passive, Volume II: Radar Remote Sensing and Surface Scattering and Emission Theory; Artech House: Boston, MA, USA, 1982. [Google Scholar]
- Lievens, H.; Verhoest, E.C. On the retrieval of soil moisture in wheat fields from L-band SAR based on water cloud modelling, the IEM, and effective roughness parameters. IEEE Geosci. Remote Sens. 2011, 8, 740–744. [Google Scholar] [CrossRef]
- Martinez-Agirre, A.; Alvarez-Mozos, J.; Lievens, H.; Verhoest, E.C.; Gimenez, R. Sensitivity of C-band backscatter to surface roughness parameters measured at differenct scales. In Proceedings of the 2015 IEEE International Geoscience and Remote Sensing Symposium, Milan, Italy, 26–31 July 2015. [Google Scholar]
- Lievens, H.; Verhoest, E.C. Spatial and temporal soil moisture estimation from RADARSAT-2 imagery over Flevland, The Netherlands. J. Hydrol. 2012, 456, 44–56. [Google Scholar] [CrossRef]
- Keyser, E.D.; Lievens, H.; Vernieuwe, H.; Alvarez-Mozos, J.; De Baets, B.; Verhoest, E.C. Assessment of the impact of uncertainty on modeled soil surface roughness on SAR-retrieved soil moisture uncertainty. In Proceedings of the ISPRS TC VII Symposium—100 Years ISPRS, Vienna, Austria, 5–7 July 2010; Volume XXXVIII. [Google Scholar]
- Van der Velde, R.; Salama, M.S.; Eweys, O.A.; Wen, J.; Wang, Q. Soil moisture mapping using combined active/passive microwave observations over the east of the Netherlands. IEEE J. Sel. Top. Appl. 2014, 8, 4355–4372. [Google Scholar] [CrossRef]
- Kim, Y.; van Zyl, J.J. A Time-Series Approach to Estimate Soil Moisture Using Polarimetric Radar Data. IEEE Trans. Geosci. Remote Sens. 2009, 47, 2519–2527. [Google Scholar] [CrossRef]
- Charbonneau, F.; Trudel, M.; Fernandes, R. Use of Dual Polarization and Multi-Incidence SAR for soil permeability mapping. In Proceedings of the 2005 Advanced Synthetic Aperture Radar (ASAR) Workshop, St-Hubert, QC, Canada, 15–17 November 2005. [Google Scholar]
- Wang, S.; Zhou, F.; Russell, H.A.J. Estimating snow mass and peak river flows for the Mackenzie river basin using GRACE satellite observations. Remote Sens. 2017, 9, 256. [Google Scholar] [CrossRef]
- McNairn, H.; Jackson, T.; Wiseman, G.; Belair, S.; Berg, A.; Bullock, P.; Colliander, A.; Cosh, M.; Kim, S.; Magagi, R.; et al. The Soil Moisture Active Passive validation experiment 2012 (SMAPVEX12): Pre-launch calibration and validation of the SMAP Satellite. IEEE Trans. Geosci. Remote Sens. 2015, 53, 2784–2801. [Google Scholar] [CrossRef]
- Macelloni, G.; Paloscia, S.; Pampaloni, P.; Marliani, F.; Gai, M. The relationship between the backscattering coefficient and the biomass of narrow and broad leaf crops. IEEE Trans. Geosci. Remote Sens. 2001, 39, 873–884. [Google Scholar] [CrossRef]
- Van De Griend, A.A.; Wigneron, J.P. The b-factor as a function of frequency and canopy type at h-polarization. IEEE Trans. Geosci. Remote Sens. 2004, 42, 786–794. [Google Scholar] [CrossRef]
- Ulaby, F.T.; Wilson, E.A. Microwave attenuation properties of vegetation canopies. IEEE Trans. Geosci. Remote Sens. 1985, 23, 746–753. [Google Scholar] [CrossRef]
- Zarco-Tejada, P.J.; Rueda, C.A.; Ustin, S.L. Water content estimation in vegetation with MODIS reflectance data and model inversion methods. Remote Sens. Environ. 2003, 85, 109–124. [Google Scholar] [CrossRef]
- Jiao, X.; McNairn, H.; Shang, J.; Pattey, E.; Liu, J.; Champagne, C. The sensitivity of RADARSAT-2 polarimetric SAR data to corn and soybean Leaf Area index. Can. J. Remote Sens. 2011, 37, 69–81. [Google Scholar] [CrossRef]
- Moran, M.S.; Alonso, L.; Moreno, J.; Mateo, M.C.; de la Cruz, F.; Montoro, A. A radarsat-2 quad-polarized time series for monitoring crop and soil conditions in Barrax, Spain. IEEE Trans. Geosci. Remote Sens. 2012, 50, 1057–1070. [Google Scholar] [CrossRef]
- Picoli, M.; Lamparelli, R.; Sano, E.; de Mello, J.; Rocha, J. Effect of sugarcane planting row directions on ALOS/PALSAR satellite images. GISci. Remote Sens. 2013, 50, 349–357. [Google Scholar]
Figure 1.
The location of the study area.

Figure 2.
The plots of R values of the retrieved and measured soil moisture against (a) crop types and (b) vegetation descriptors.
Figure 2.
The plots of R values of the retrieved and measured soil moisture against (a) crop types and (b) vegetation descriptors.

Figure 3.
Plots of soil moisture measured from U.S. Department of Agriculture’s (USDA) stations and soil moisture retrieved from Radarsat-2 using (a) backscatters of HV polarization , (b) RVI, and (c) NDVI in the WCM for all crops.
Figure 3.
Plots of soil moisture measured from U.S. Department of Agriculture’s (USDA) stations and soil moisture retrieved from Radarsat-2 using (a) backscatters of HV polarization , (b) RVI, and (c) NDVI in the WCM for all crops.

Figure 4.
The plots of LAI against three vegetation descriptors: σ°HV (top row), RVI (middle row) and NDVI (bottom row) for each crop type.
Figure 4.
The plots of LAI against three vegetation descriptors: σ°HV (top row), RVI (middle row) and NDVI (bottom row) for each crop type.

Figure 5.
The plots of R values between LAI and vegetation descriptors for crop types calculated from Figure 4.
Figure 5.
The plots of R values between LAI and vegetation descriptors for crop types calculated from Figure 4.


Table 1.
The satellite images used in this study.
| Radarsat-2 | RapidEye | ||||
|---|---|---|---|---|---|
| Acquisition Date (2012) | Flight Direction | Mode | Polarizations | Incidence Angle | Acquisition Date (2012) |
| 5 June | Descending | FQ3W | HH, HV, VH,VV | 20.0–23.6° | 4 June |
| 6 June | Ascending | S3 | HH, HV | 30.4–37° | 12 June |
| 13 June | Ascending | FQ10W | HH, HV, VH, VV | 28.4–31.6° | 28 June |
| 19 June | Descending | S3 | HH, HV | 30.4–37° | 5 July |
| 20 June | Ascending | FQ6W | HH, HV, VH, VV | 23.7–27.2° | 14 July |
| 27 June | Ascending | FQ2W | HH, HV, VH, VV | 19.7–22.7° | 21 July |
| 29 June | Descending | FQ3W | HH, HV, VH, VV | 20.0–23.6° | 27 July |
| 30 June | Ascending | S3 | HH, HV | 30.4–37° | |
| 7 July | Ascending | FQ10W | HH, HV, VH, VV | 28.4–31.6° | |
| 14 July | Ascending | FQ6W | HH, HV, VH, VV | 23.7–27.2° | |
| 21 July | Ascending | FQ2W | HH, HV, VH, VV | 19.7–22.7° | |
| 24 July | Ascending | S3 | HH, HV | 30.4–37° | |
Table 2.
The in-situ soil moisture (0–5 cm) and Leaf Area Index (LAI) data used in this study.
| Crop Types | Soil Moisture (m3/m3) | LAI (m2/m2) | RMS * (cm) | ||||
|---|---|---|---|---|---|---|---|
| Range | Average | n * | Range | Average | n | ||
| Soybean | 0.155–0.467 | 0.317 | 26 | 0.11–2.43 | 0.92 | 18 | 0.31–0.42 |
| Canola | 0.042–0.419 | 0.24 | 27 | 0.31–6.33 | 3.12 | 18 | 1.31–1.33 |
| Corn | 0.122–0.354 | 0.211 | 23 | 0.09–3.92 | 1.04 | 21 | 1.23–1.28 |
| Wheat | 0.123–0.37 | 0.245 | 27 | 0.59–5.15 | 2.38 | 20 | 1.27–1.29 |
| Pasture | 0.0398–0.217 | 0.14 | 25 | 1.3–7.19 | 3.36 | 18 | 0.6–0.74 |
* n is the number of in-situ measurements and RMS is the root mean square roughness.
© 2018 by the authors. Licensee MDPI, Basel, Switzerland. This article is an open access article distributed under the terms and conditions of the Creative Commons Attribution (CC BY) license (http://creativecommons.org/licenses/by/4.0/).
Share and Cite
MDPI and ACS Style
Li, J.; Wang, S. Using SAR-Derived Vegetation Descriptors in a Water Cloud Model to Improve Soil Moisture Retrieval. Remote Sens. 2018, 10, 1370. https://0-doi-org.brum.beds.ac.uk/10.3390/rs10091370
AMA Style
Li J, Wang S. Using SAR-Derived Vegetation Descriptors in a Water Cloud Model to Improve Soil Moisture Retrieval. Remote Sensing. 2018; 10(9):1370. https://0-doi-org.brum.beds.ac.uk/10.3390/rs10091370
Chicago/Turabian StyleLi, Junhua, and Shusen Wang. 2018. "Using SAR-Derived Vegetation Descriptors in a Water Cloud Model to Improve Soil Moisture Retrieval" Remote Sensing 10, no. 9: 1370. https://0-doi-org.brum.beds.ac.uk/10.3390/rs10091370
Note that from the first issue of 2016, this journal uses article numbers instead of page numbers. See further details here.