Article

Image Segmentation Parameter Selection and Ant Colony Optimization for Date Palm Tree Detection and Mapping from Very-High-Spatial-Resolution Aerial Imagery

by
Rami Al-Ruzouq
1,2,*,
Abdallah Shanableh
1,2,
Mohamed Barakat A. Gibril
2 and
Saeed AL-Mansoori
3
1
Department of Civil and Environmental Engineering, University of Sharjah, Sharjah 27272, UAE
2
Research Institute of Sciences and Engineering, University of Sharjah, Sharjah 27272, UAE
3
Applications Development and Analysis Section, Mohammed Bin Rashid Space Center (MBRSC), Dubai 211833, UAE
*
Author to whom correspondence should be addressed.
Submission received: 16 July 2018 / Revised: 29 August 2018 / Accepted: 3 September 2018 / Published: 5 September 2018
(This article belongs to the Section Remote Sensing in Agriculture and Vegetation)

Abstract

:
Accurate mapping of date palm trees is essential for their sustainable management, yield estimation, and environmental studies. In this study, we integrated geographic object-based image analysis, class-specific accuracy measures, fractional factorial design, metaheuristic feature-selection technique, and rule-based classification to detect and map date palm trees from very-high-spatial-resolution (VHSR) aerial images of two study areas. First, multiresolution segmentation was optimized through the synergy of the F1-score accuracy measure and the robust Taguchi design. Second, ant colony optimization (ACO) was adopted to select the most significant features. Out of 31 features, only 12 significant color invariants and textural features were selected. Third, based on the selected features, the rule-based classification with the aid of a decision tree algorithm was applied to extract date palm trees. The proposed methodology was developed on a subset of the first study area, and ultimately applied to the second study area to investigate its efficiency and transferability. To evaluate the proposed classification scheme, various supervised object-based algorithms, namely random forest (RF), support vector machine (SVM), and k-nearest neighbor (k-NN), were applied to the first study area. The result of image segmentation optimization demonstrated that segmentation optimization based on an integrated F1-score class-specific accuracy measure and Taguchi statistical design showed improvement compared with objective function, along with the Taguchi design. Moreover, the result of the feature selection by ACO outperformed, with almost 88% overall accuracy, several feature-selection techniques, such as chi-square, correlation-based feature selection, gain ratio, information gain, support vector machine, and principal component analysis. The integrated framework for palm tree detection outperformed RF, SVM, and k-NN classification algorithms with an overall accuracy of 91.88% and 87.03%, date palm class-specific accuracies of 0.91 and 0.89, and kappa coefficients of 0.90 and 0.85 for the first and second study areas, respectively. The proposed integrated methodology demonstrated a highly efficient and promising tool to detect and map date palm trees from VHSR aerial images.

Graphical Abstract

1. Introduction

Since prehistoric times, date palm trees have been one of the most commonly cultivated trees in the world, due to their significant societal, commercial, and environmental importance [1]. They are regarded as a symbol of life because they can endure high temperatures, water scarcity, and soil salinity. The palm tree is mostly located in West Asia and North Africa, and it is generally grown in arid and semi-arid environments [2]. The date palm tree industry in the United Arab Emirates (UAE) has exponentially increased over the years; the number of date palm trees planted was estimated to be over 40 million in 2010 [3]. Proper knowledge of the distribution, number, and health of date palm trees is essential for their monitoring, irrigation, yield estimation, and the determination of their effects on water resources and climate conditions.
Remote sensing technologies provide a cost-effective and feasible means of vegetation mapping and monitoring, compared to field-based studies [4,5]. Considering the growing availability of very-high-spatial-resolution (VHSR) remote sensing data from various platforms and sensors, a broad spectrum of research has adopted geographic object-based image analysis (GEOBIA) as a successful classification approach to map various vegetation species, such as oil palm trees [6,7], mangrove trees [8,9], rubber plantations [10], and olives [11,12]. In fact, GEOBIA has extensively been used in the literature as a fundamental approach for feature extraction from VHSR images, due to its advantages over the traditional per-pixel classifiers [13,14,15]. While pixel-based classification methods only consider the spectral properties of individual pixels, GEOBIA enables the recognition of multiscale objects from a single image or across several images, and makes the best use of integration between spectral, spatial, textural, thermal, and backscattering values, vector data, and contextual information to accurately extract natural and human-made features [16,17,18,19]. However, GEOBIA performance might be affected by the image segmentation quality, the selection of the most relevant features, the selection of the representative training samples, and the classification method [20].
The generic objective of the current study was to accurately map date palm trees from VHSR aerial images using GEOBIA. To effectively achieve the major objective of this research, this study attempted to (a) integrate an F1-score accuracy measure with the Taguchi statistical technique to find the optimal combination of multiresolution segmentation (MRS) parameters for date palm mapping; (b) apply ant colony optimization (ACO) for the GEOBIA feature selection to find the most relevant features from an aerial image and compare its performance with various feature-selection techniques; (c) apply a decision tree (DT) rule-based classification scheme and investigate the transferability of the developed model in detecting date palm trees; and (d) compare the performance of the rule-based classification in the proposed method with supervised GEOBIA classification methods, namely random forest (RF), support vector machine (SVM), and k-nearest neighbor (k-NN).

Background

The general framework of GEOBIA consists of two main steps: (1) image segmentation to produce homogenous non-intersecting objects from the image-pixel level, and (2) classification of the generated objects [21]. One of the most popular image segmentation algorithms is MRS. MRS is controlled by three user-defined parameters: (a) scale, (b) shape/color weight, and (c) compactness/smoothness weight. The size and the shape of the created image objects are critically dependent on the combinations of these parameters [16,22]. Therefore, changing these combinations using a trial-and-error approach can be a very subjective and time-consuming process, leading to various choices of delineating the features of interest that may not produce meaningful segments [23,24]. Owing to the fact that attaining high classification accuracy is vastly reliant on image segmentation quality, implementing an optimization technique to find the optimal combinations of these parameters is important to reduce the time and effort required to obtain image segments and ensure adequate delineation of the objects of interest to produce promising results [16,25,26]. Various methods can be used for the evaluation of segmentation quality, including (a) visual assessment, (b) supervised methods (empirical discrepancy method), (c) unsupervised methods (empirical goodness method), and (d) system/application-level methods [27].
In a visual assessment, various segmentation outputs are compared with one another, and MRS parameters that closely resemble real-world objects are selected. This method can be extremely subjective and time-consuming, because imaged objects from various scales are interpreted visually [28]. In the supervised evaluation method, segmentation quality is assessed by measuring the discrepancy between ground truth samples (reference objects) and corresponding image segments from segmentation outputs. One of the shortcomings of this technique is that it requires the manual preparation of reference objects, and is thus laborious and time-consuming, especially when image segmentations from large images are assessed [16,27].
In contrast to supervised evaluation methods, unsupervised methods allow the evaluation of image segmentation performance, scoring, and ranking of multiple image segmentations, and the selection of optimum MRS through the use of statistical quality measures instead of reference objects [28,29,30]. Espindola et al. [31] proposed the use of unsupervised global quality scores (GSs), which act as a quality measure of image segmentation by maximizing intrasegment homogeneity and heterogeneity. Espindola et al.’s GS function is expressed as the combination of normalized spatial autocorrelation (Global Moran’s Index (MI)) and normalized weighted variance [31]. This function may also be used to evaluate local segmentation quality since Moran’s index, and weighted variance can be calculated for individual objects [28]. Johnson et al. [30] proposed an overall goodness (OG) metric that combines under- and over-segmentation metrics by using the F1-score with an adjustable weighting parameter to allow for the identification of multiscale segmentation parameters. Grybas et al. [25] compared three unsupervised image segmentation optimization techniques, including Espindola’s GS, Johnson’s OG, and local variance. The study concluded that the local variance method was the least successful, while GS and OG produced similar results regardless of the differences in their approaches. These unsupervised quality evaluation methods have been used in different applications as image segmentation quality measures to statistically judge and rank all MRS-examined scales, and select the optimum scale value(s) [28,30,32,33,34]. The vast majority of unsupervised quality measures focus on optimizing the scale parameters only, and not much attention has been paid to finding the optimum combination of MRS parameters [35,36]. However, the synergy of the robust Taguchi statistical technique and the unsupervised Espindola GS function were successfully used to find the optimum combination of MRS parameters in various applications [16,18,35,36,37,38,39]. Finally, the system/application-level method is made from a land-cover mapping perspective. In this method, the quality of segmentation is evaluated through the classification accuracy assessment. This concept is based on the fact that high classification accuracy implies high segmentation quality [40,41].
Despite the advantages of GEOBIA in enabling the utilization of large numbers of spectral, textural, geometrical, and contextual features in the analysis, using all of these features in the classification process may consequently increase the processing time and degrade classification accuracy [42]. Moreover, overfitting might be encountered, and the complexity of the model is increased. Therefore, the selection of relevant features is a key step in any image analysis procedure [43]. Recent studies have successfully applied a variety of feature-selection approaches with GEOBIA, including RF [34,44], SVM with recursive feature elimination [45], correlation-based feature selection (CFS) [46], and chi-square [47]. Recently, only a few studies have integrated the metaheuristic optimization technique with the GEOBIA framework, such as particle swarm optimization (PSO) [42] and ACO [13,17]. Sameen et al. [17] integrated ACO to select the most relevant features to classify LIDAR data using GEOBIA. ACO provides the highest accuracy when compared to the results of the RF, SVM, and chi-square feature-selection techniques applied to the k-nearest neighbor classifier. Ridha et al. [13] compared the RF, CFS, and ACO techniques to improve the identification of shallow and deep-seated landslide types and pointed out that CFC, followed by ACO, provided the highest accuracy for distinguishing between landslide types.
The remainder of this paper is organized as follows: in Section 2, the proposed method, study area, and data sets are demonstrated briefly. This section also describes image segmentation evaluation methods and optimization techniques employed in this study, specifically ant colony optimization for feature selection and rule-based classification based on DT. The results of the experiments and the accuracy assessments are reported in Section 3. In Section 4, the interpretation of the results and the effectiveness of the proposed method are discussed. Finally, Section 5 presents the conclusions.

2. Methodology

2.1. Overview

In this study, the object-based approach, class-specific accuracy measure, robust Taguchi-based statistical design, and ACO were integrated for date palm tree detection and mapping using VHSR aerial imagery. The generic framework of this study is summarized in Figure 1. This framework encompasses six main steps. First, the optimum combination of MRS parameters, namely scale, shape, and compactness, were selected through the synergy of the F1-score accuracy measure and the robust Taguchi statistical technique. Second, the spectral difference segmentation algorithm was applied to merge adjacent objects with a small spectral difference to produce more homogenous image objects. Third, the most relevant features were selected for further analysis through ACO. Fourth, the significant features were utilized to develop a decision tree model via a selected training sample. Afterward, image objects were classified through rule-based classification and supervised GEOBIA classifiers. The first study area was dedicated to developing the methodology, while the second study area was used to investigate the efficiency and transferability of the proposed method in the detection of the date palm trees from VHSR aerial images. Ultimately, accuracy assessment and post-processing were performed to evaluate and produce date palm maps.

2.2. Study Areas and Aerial Images

The proposed framework was applied to two study areas in Ajman City, a city located in the northern part of the UAE along the northern coast of the Arabian Gulf of the Arabian Peninsula (central coordinates of 25.4° N, 55.5° E). Ajman City has a dry, semi-arid climate with a daily high temperature of 24–42 °C and a daily mean temperature of 18–34 °C. Ajman City and the UAE in general have faced massive urbanization and expansion since the 1970s [48]. Figure 2a,b show the UAE map with respect to its neighboring countries and the study area of Ajman City, respectively. Two areas were adopted for this study to apply the suggested algorithm and its verification in sequence. Study Area 1 extended over 1.5 km2, while Study Area 2 covered about 0.8 km2 (Figure 2c,d). The VHSR aerial-rectified imagery used in this study was provided by the Ajman municipality; the aerial images with Red, Green, and Blue (RGB) spectral bands were captured in summer 2015 and had a 15 cm spatial resolution.

2.3. Image Segmentation

In this research, the MRS algorithm, one of the most widely used remote sensing image segmentation algorithms, was used for the generation of image objects from aerial imagery. MRS is a bottom-up region-merging technique that uses spectral and spatial information to produce homogeneous and non-intersecting polygons; it enables the merging of neighboring pixels or existing objects to large ones according to three user-defined values [49,50]: scale, color/shape weight, and compactness/smoothness weight. The scale is one of the significant parameters in the segmentation process because it can be used to control the size of a generated object. Given that the selection of a large-scale value results in the generation of massive image objects and the discarding of small objects and vice versa, it directly influences classification accuracy [16,51]. Shape and compactness parameters are used for determining the weight of the shape and the smoothness of an object generated by the segmentation process [52].

2.3.1. MRS Parameter Optimization

Having a variety of MRS outputs is common, since the parameters that control MRS output might take ranges of values within their spaces (i.e., shape and compactness ranges from 0.1–0.9), or the various combinations of these parameters [53]. Proper image segmentation is usually achieved when generated image objects correspond to real-world objects of interest. Such objects are achieved only when the combinations of MRS parameters are optimal. In this study, a system/application-level method [40], based on the evaluation of the classification accuracy of date palm tree class, was used to measure the quality of multiple image segmentation outputs. This method was also compared with the performance of an unsupervised segmentation evaluation method based on an objective statistical function [31], which is one of the widely used unsupervised segmentation quality measures.

2.3.2. System/Application-Level Quality Measure

Since this research focused on mapping date palm trees, a class-specific classification accuracy measure (F1-score) was used as a segmentation quality indicator. The aim of using an F1-score accuracy measure in this study was not only to determine optimum scale parameters, but also to find the best combination among the three parameters. In this research, the best segmentation level attained from MRS combinations was defined as the level with the highest date palm classification accuracy. The applied F1-score measure [14] was defined as the harmonic mean values of precision and recall measures, which were expressed in Equations (1)–(3):
F 1 - score = 2 Precision × Recall Precision + Recall
Precision = True   Positive True   positive + False   positive
Recall = True   positive True   positive + False   negative

2.3.3. Unsupervised Evaluation Quality Measure

In the present study, the performance of the objective function (OF), proposed by Espindola et al. [31], was compared to that of the F1-score accuracy measure to assess the performance of image segmentation in the mapping of date palm trees. This OF was defined as the combination between intrasegment homogeneity (weighted variance) and intersegment heterogeneity (MI), and can be expressed in Equations (4) and (5):
WV = i = 1 n a i · v i i = 1 n a i
where WV is the weighted variance, and a i and v i are the area and variance of object i, respectively.
MI = n i = 1 n j = 1 n w ij ( y i y ¯ ) ( y j y ¯ ) ( i = 1 n ( y i y ¯ ) 2 ) ( i j j = 1 n w ij )
where n is the total number of objects; y i and y j are the means of the spectral values of object i (Oi) and object j (Oj), respectively; y ¯ is the mean spectral value of the total objects in an image or a particular band; w ij is a spatial proximity measure. The value of w ij is 1 when Oi and Oj are contiguous. Otherwise, w ij is 0. Given that WV and MI do not have the same range of magnitudes, they must be normalized before they can be combined in a single function. The OF in normalized form is shown in Equation (6):
OF = WV norm + MI norm
where WVnorm and MInorm are the normalized weighted variance and MI value, respectively. The normalization function can be expressed as:
F ( X ) = X max X X max X min
High OF values indicate high segmentation quality and they can be obtained at a low weighted variance (within-object homogeneity is high) and low MI (between-object homogeneity is low) [28,31].

2.3.4. Taguchi-Based MRS Optimization

The well-known Taguchi statistical technique, developed by Genichi Taguchi, is an optimization technique that involves the use of an orthogonal array for the minimization of the number of trials. In this technique, essential experiments are primarily used for analyzing experiment outputs and determining the optimal settings of parameters; this approach reduces costs, time, and effort [54]. The result of each experiment, that is, the F1-score measure or OF value, is converted into a signal-to-noise ratio (SNR) value for the identification and measurement of a quality characteristic that deviates from a desired value [55]. In this research, the amalgamation of the F1-score, a specific class accuracy measure, and the Taguchi statistical technique were used to identify the best combinations of MRS parameters for the mapping of date palm trees.
First, we performed a preliminary analysis on the basis of scale, shape, and compactness in different ranges to determine the possible levels and ranges of MRS parameters that closely delineate date palm trees. The MRS parameters, and their levels used and investigated in this study to keep undersegmentation as low as possible, are shown in Table 1.
Second, an orthogonal array (L25) was selected and designed according to the number of levels and parameters. Third, segmentation experiments were conducted, and each segmentation level in the orthogonal array was exported as a vector layer. Every exported segmentation level contains several features that include color invariants, textural features, and geometrical features. Fourth, representative training samples (points) were selected and overlaid with each segmentation level. The attributes of each segmentation level were spatially joined with the class attribute of the training samples in order to be used for classification. Fifth, the DT algorithm was applied to classify image objects in each segmentation level. Afterwards, accuracy was computed using stratified cross-validation with 10 folds [56,57]. The overall accuracy, kappa coefficient (K), user and producer accuracy, and F1-score measure were estimated for each 25 MRS levels. Finally, the effect of each parameter on the classification accuracy was measured by computing the SNR, where the best level of each MRS parameter was selected as an optimal parameter. The SNR with the “higher-the-better” characteristic was employed in this study and expressed as in Equation (8):
SNR = 10 log ( 1 n i = 1 n 1 y i 2 )
where n is the number of experiments and y i represents the F1-score values computed from each segmentation.

2.4. Feature Acquisition and Computation

Given that a high-spatial-resolution orthophoto contains only three spectral bands, which cannot be used in the accurate extraction of date palm trees, a set of color invariants, textural features, and geometrical features were investigated and are listed in Table 2. Six spectral features, two geometrical features, and 17 textural features were computed from the image objects for further analysis. The color invariants that were examined in this research are listed below.
First, a vegetation color invariant (v) was studied. This index was used in previous studies for the detection of vegetation areas from aerial images on the basis of green (G) and blue (B) spectral bands [58,59]. It was expressed with the following equation:
v = 4 π · arctan ( G B G + B )
Second, the shadow invariant, s, proposed by Cretu and Payeur [60], was modified and investigated by using the following formula:
s = 4 π · arctan ( 1 R 2 + G 2 + B 2 1 + R 2 + G 2 + B 2 )
Third, several color invariants proposed by Gevers et al. [61] were investigated and denoted in this research as Ratio-R, Ratio-G, and Ratio-B, which were expressed with the following formulas:
Ratio - G = G G + B + R
Ratio - B = B G + B + R
Ratio - R = R G + B + R
Based on the preceding steps, the 31 mentioned features were calculated and examined in this research using the ACO feature-selection technique.

2.5. Ant Colony Optimization

The aim in adopting ACO for feature selection is to determine the most significant features that can be used for achieving a high classification accuracy. ACO, developed by Dorigo and Di Caro [64], is a nature-inspired algorithm that solves an optimization problem by imitating the cooperative social behavior of ants searching for the shortest path between their nests and food sources. Because ants cannot see, they release odorous substances known as pheromones as a medium of communication on the routes between the food source and their nests. The quantities of the pheromones are dependent on the food’s quality, quantity, and distance. The routes with a high concentration of pheromones are most often selected by ants. Accordingly, the shortest path is considered to be the optimum solution to an optimization problem.
The selection of several features from a variety of spectral, textural, and geometrical features through the use of ACO is generally considered to be an optimization problem, and the most significant selected features that provide high classification accuracies are the solutions to that problem. The process commences with the random placement of artificial ants (equal to the number of the examined features) on a graph for the generation of a solution space. Each node in the graph corresponds to a particular feature, and each ant can initiate different path constructions in a feature. The pheromone is laid on the edges between the nodes. Each ant starts with a feature and constructs a route that contains different nodes (features) according to the concentration of the pheromones on the edges. The ants from the initial positions traverse nodes probabilistically until a stopping criterion is satisfied. The resultant feature subsets are collected and evaluated with a classifier, and the classification result is evaluated by computing the error matrix. In this study, feature subsets were evaluated by applying a Naïve Bayes (NB) classifier. The image objects used in ACO were divided into training (70%) and testing (30%) samples in the evaluation process [17]. The algorithm stops if the optimal subset is found, or the algorithm is executed for a certain number of cycles, and the best feature subset is returned as an output; otherwise, the process is reiterated by updating the pheromone, and a new set of ants are employed.

2.6. Rule-Based and Decision Tree Classification

The development of proper rule sets for distinguishing date palm trees from other land-cover classes using selected relevant features requires thorough scrutiny of the ranges of all features and their thresholds needed to assign objects to classes. This process can be challenging and time consuming. Thus, in this study, the DT algorithm was employed to identify feature thresholds. This non-parametric algorithm creates a binary decision to separate a particular class or some of the classes from the remaining classes [65]. The advantage of DT is that it is swift, it makes no assumptions regarding the distribution of data, and, most importantly, it can easily fit into a GEOBIA framework [66].
A total of 2400 random training samples were selected with the aid of ground truth data to represent seven different classes. These samples were selected carefully to ensure that they represented the variation of each class. Given that date palm objects might differ slightly due to age, height, water content, and the presence of shadow, the samples were selected from different parts of the trees. The selected features through ACO were spatially linked with the training samples and prepared for classification. The image objects were classified by the DT rule-based classifier into seven different classes: date palm, grass, other vegetation, bare soil, roads, built-up areas, and shadow. The classification results were assessed by computing the confusion matrix for both study areas to derive overall accuracy (OA), the Kappa coefficient (KC), the user accuracy (UA), the producer accuracy (PA), and the F1-score.
Three supervised GEOBIA algorithms—RF, SVM, and k-NN—were used in the current study to classify image objects and to compare their performance with rule-based classifications based on DT to map date palm trees. These algorithms were employed to classify the optimized image segments with the selected features through ACO. The theoretical background of RF, SVM, and k-NN can be found in the literature [67,68,69,70,71].

3. Results

3.1. MRS Parameter Optimization Results

As stated in Section 2, the L25 orthogonal array adopted in this research limited the experiment to only 25 trials. Table 3 lists the essential 25 MRS parameter combinations that needed to be examined. First, a DT classifier was used to classify image objects of the 25 experiments, and the F1-score for date palm tree class accuracy measure, using Equation (1), was computed to represent the output of each experiment. Second, the computed F1-score values were used as an input for the second phase to calculate SNR using Equation (8), as shown in Table 3. For the sake of comparison, the F1-score was compared with the OF. The computation of the OF followed the same procedure but used the combination of the normalized WV and MI as represented in Equation (6) first as a segmentation quality indicator. The normalized WV and MI were computed for each band of the three RGB bands and then averaged. The OF values were used as an input to compute SNR, using Equation (8), as shown in Table 3.
Since some experiments resulted in similar F1-score values, SNR pinpointed the optimal combination of MRS parameters, as shown in Table 4. The highest values of SNR for each parameter, highlighted in gray in Table 4, represent the optimum level of each parameter that correspond to the examined levels in Table 1. The optimal levels of MRS obtained from the Taguchi technique and the F1-score were as follows: (a) a scale of 20, (b) a shape parameter of 0.3, and (c) a compactness parameter of 0.125. The use of the Taguchi technique and OF resulted in the optimum combination of 20:0.5:0.2 for the scale, shape, and compactness parameters.
The effectiveness of integrating the F-score and the Taguchi technique was assessed by comparing the results of the Taguchi with OF. The two segmentation results were classified using the DT algorithm. The use of the F1-score and Taguchi statistical design showed improvement over the use of OF and the Taguchi design, with a class-specific accuracy of 0.919 and 0.891 for the two methods, respectively.

3.2. Results of Feature Selection through ACO

The ACO algorithm for feature selection was carried out in MATLAB 2017b at a workstation with a double 2.4 GHz processor and 32 GB RAM. The NB classifier was trained and tested using image objects containing 31 features prepared in ArcGIS and Microsoft Excel. Due to significant variations in the range and value of the tested features, the data were normalized from 0 to 1.
To determine the effectiveness of ACO, we compared it with other various feature-selection methods, such as chi-square, CFS, gain ratio, information gain, SVM, and principal component analysis (PCA) by applying the NB classifier. The procedure of feature selection implemented by Sameen et al. [17] was adopted in the present research. The process was carried out to classify image objects into six classes: date palm trees, grass, other vegetation, bare soil, built-up areas, and shadow. Accuracy assessment was conducted through 10-fold cross-validation to the training data set. Figure 3 shows the selected number of features against the OA and the K values for ACO and other feature-selection techniques. The highest OA and K were achieved through ACO with 12 selected features out of 31 features. The most significant features selected by ACO were Ratio-G, Ratio-B, V, S, Mean-B, GLCM_Mean_G, GLCM_Mean_B, GLCM_homogeneity_G, GLCM_homogeneity_B, GLCM_StdDe_B, GLCM_Entropy_R, and GLDV_Mean_R. Utilization of the selected significant features in the classification procedure improved the GEOBIA classification accuracy, minimized the processing time, and contributed to the development of a simple and transferable classification model.

3.3. Classification Result

As stated in Section 1, this research mainly focused on mapping date palm trees from VHSR aerial imagery through GEOBIA. Figure 4 presents the generated DT from the most significant features to classify date palm trees and the remaining land-use/land-cover (LULC) classes. The generated DT was first implemented to classify the optimized image objects of the first study area. Table 5 shows the confusion matrix generated from the pixel level in the ENVI software using validation testing sets.
Figure 5 shows the classification output of the first study area. The use of the proposed classification scheme showed a strong capacity for mapping date palm trees from aerial images with an overall classification accuracy of 91.9%, a KC of 0.90, a UA of 90.6%, and a PA of 90.5%. The date palm class-specific accuracy measure, namely the F1-score, was 0.91.
The transferability check was conducted by applying the optimum MRS parameters, the features selected through ACO, and the generated DT to classify the second study area and to further investigate the performance of the proposed method. Figure 6 and Table 6 show the results and the error matrix assessment of the second study area. The obtained results included an OA of 87.0336%, a KC of 0.846, a UA of 93.44%, and a PA of 85.15%. The particular class of date palm accuracy measure, namely the F1-score, was 0.89.
The optimized image objects of the first study image were also classified by applying different supervised GEOBIA classifiers to evaluate the performance of detecting date palm trees by RF, SVM, and k-NN classifiers. Figure 7 and Table 7 show the results and the error matrix assessment of the supervised GEOBIA classifiers when applied to the first study area. The SVM classification algorithm provided the highest result (with an overall accuracy of 87.44% and a kappa coefficient of 0.85), followed by RF (86.25%, 0.84) and k-NN (84.01%, 0.81).

4. Discussion

Feature extraction from very-high-spatial-resolution images with a limited number of spectral bands can be challenging, due to the heterogeneity and spectral similarity between various land-use types and land-cover classes. Thus, GEOBIA is widely used to extract features from VHSR images because it allows for the differentiation of various classes by employing spectral, spatial, textural, and geometrical features in the classification process. Image segmentation is the initial and fundamental step in GEOBIA; poor quality of image segmentation often results in low classification accuracy. Gao et al. [26] investigated the effects of selecting the optimum segmentation result on classification accuracy by evaluating nine image segmentations with different MRS parameter settings from Landsat imagery. They selected the optimum segmentation using the OF, classified the nine segmentations, and computed the accuracy assessments for the nine classification results. They concluded that segmentation with the highest OF values resulted in the highest classification accuracies. Thus, MRS parameter optimization should be conducted before image analysis to ensure proper input for image classification. Smith [
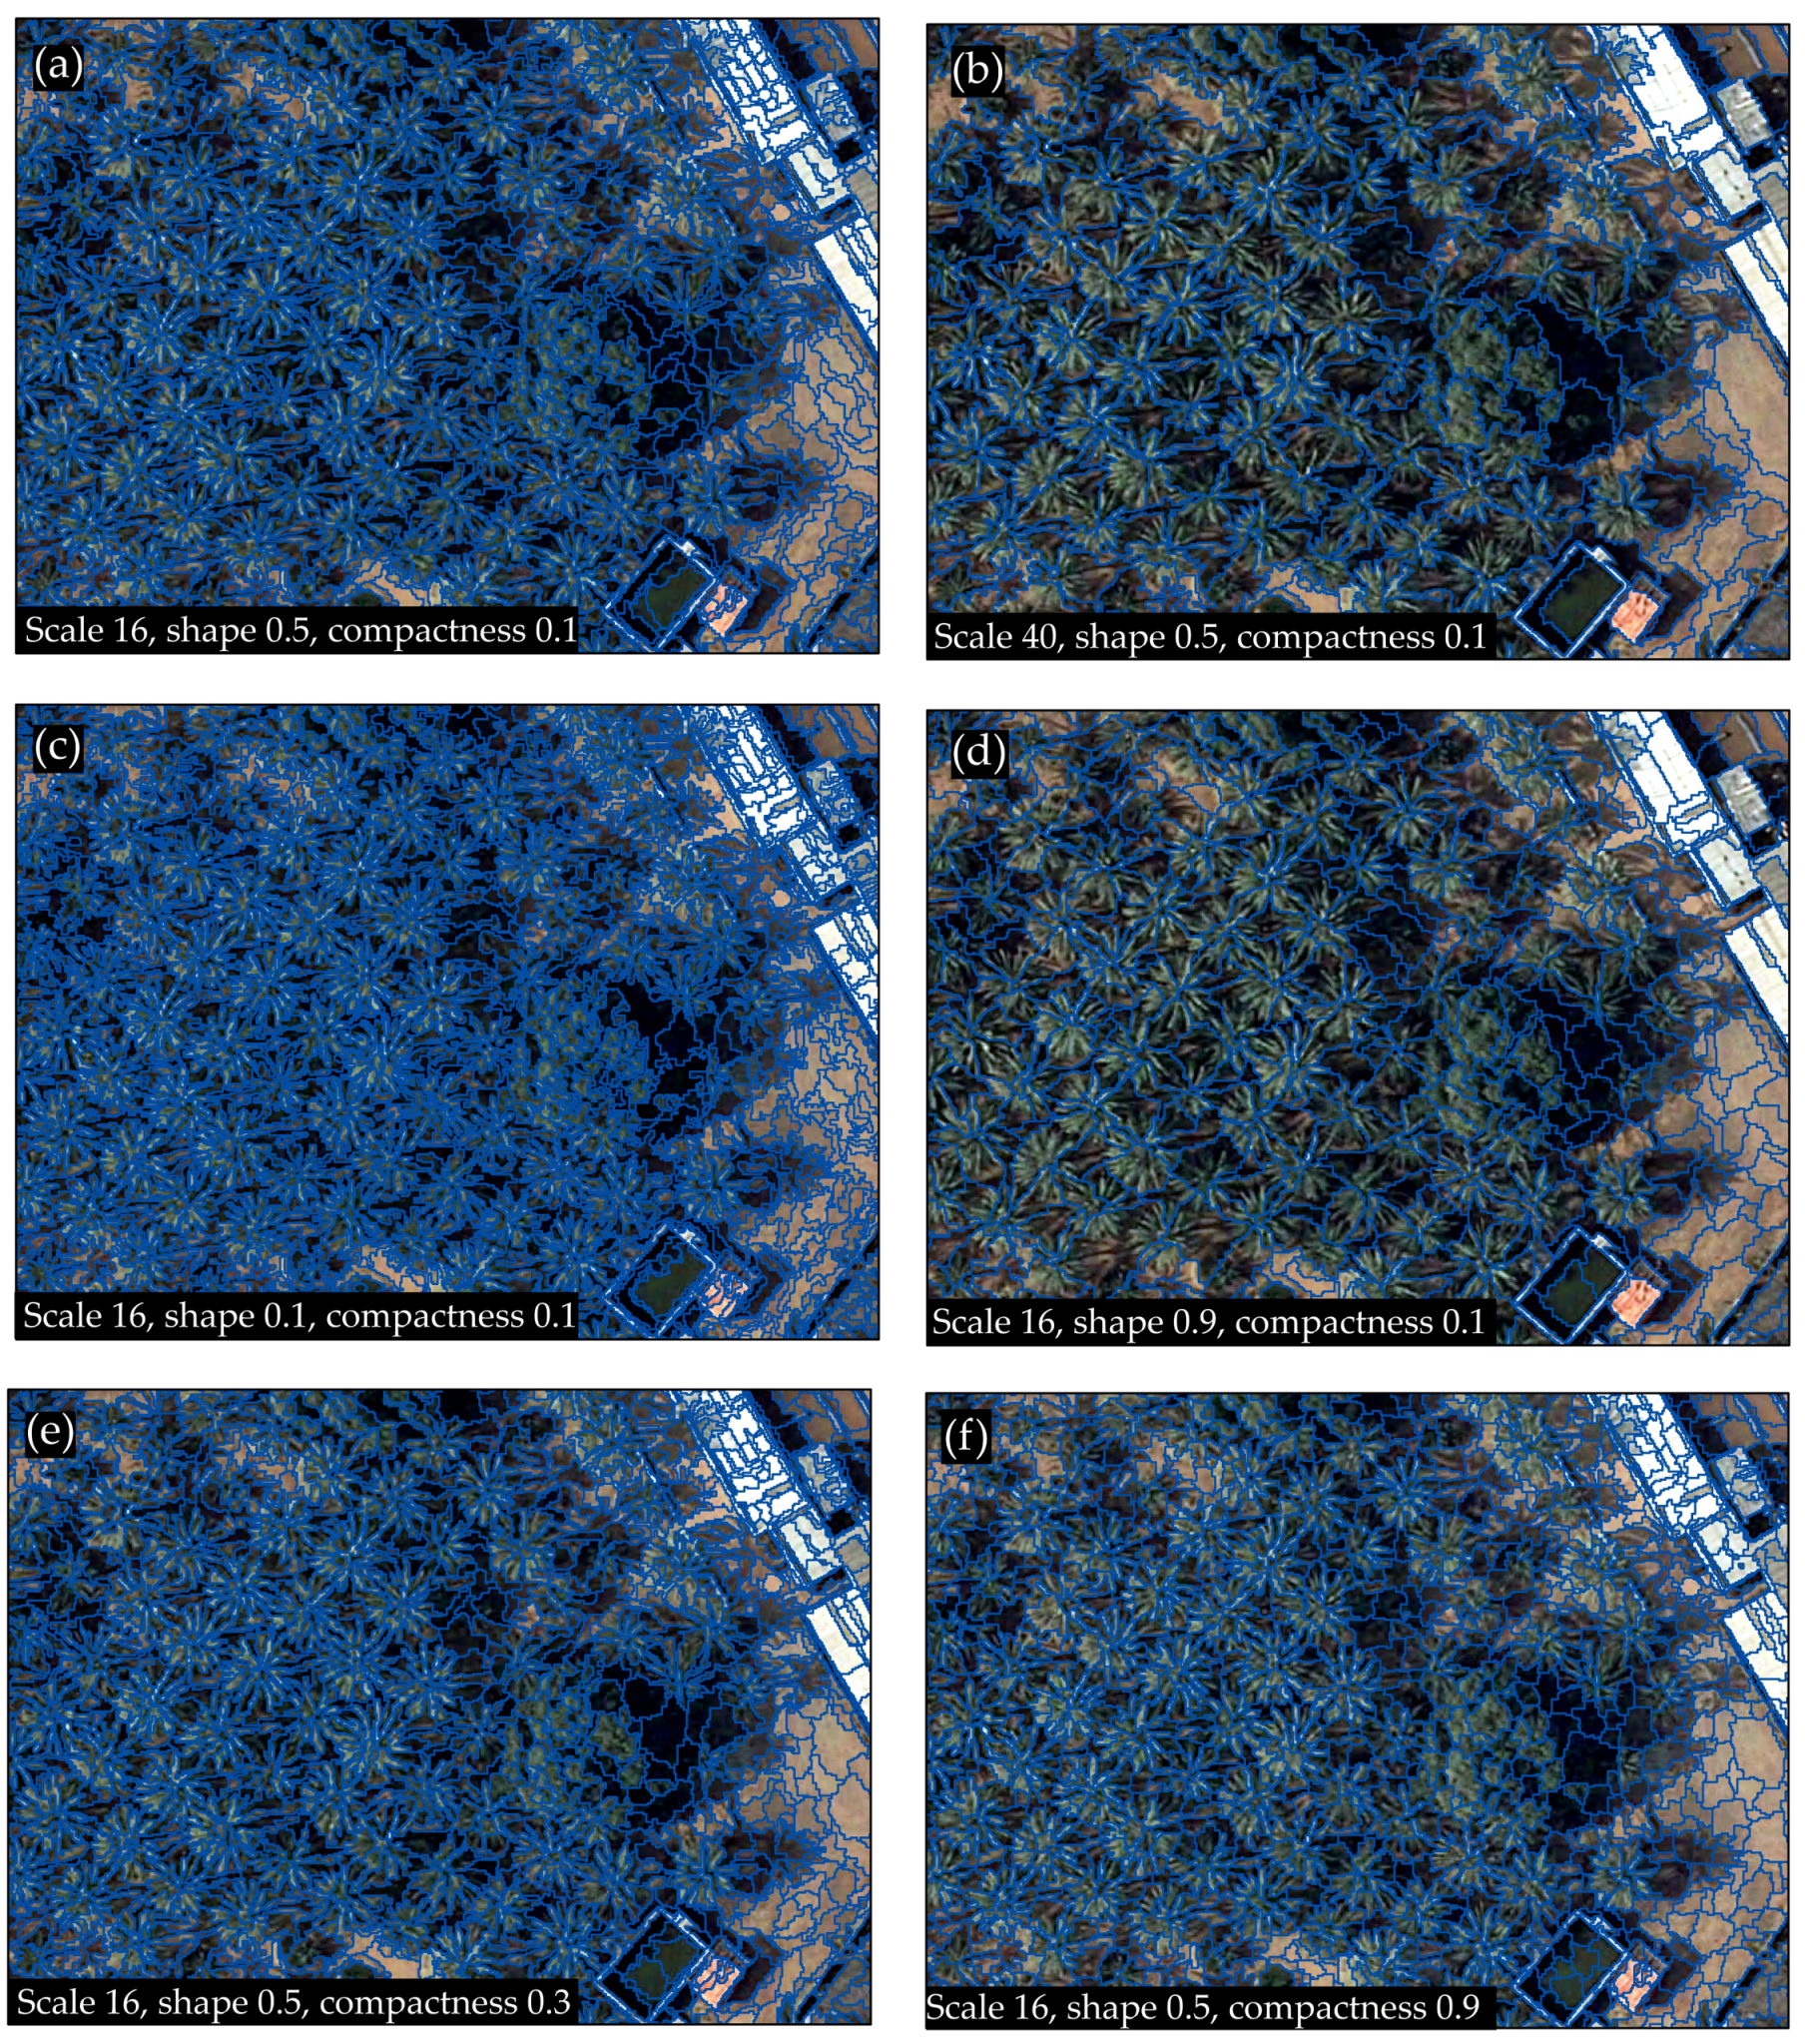
41] used an RF classification algorithm to evaluate the image segmentation result and identified the optimum segmentation scale to obtain high classification accuracy of land-cover classes from spot scenes. The strength of this approach is that it enables the analyst to evaluate image segmentation alternatives and their predicted classification accuracy on small image subsets without classifying the entire image or assessing the accuracy of many map products derived from image segmentation. Most of the system/application-level techniques used to evaluate segmentation quality focus on finding the optimum scale parameter while keeping the shape and compactness parameters fixed. Selection of various combinations of MRS parameters often results in different segmentation outputs with unique ways of delineating the objects of interest, as shown in Figure 8. It clearly depicts a visual comparison of how the changes in the combinations of MRS parameters can affect the way that date palm trees and built-up areas are segmented. Figure 8a,b show effect of various values of the scale parameter on segmentation results, while Figure 8c,d show the effect of various values of the shape parameter and finally Figure 8d,f illustrate the effect of various values of compactness parameter.
Because different classes or components of a particular class might need to be analyzed and extracted at multiple scales, different optimal scales are often required to achieve an accurate result. However, since this study was focused on extracting date palm trees specifically, and these trees have relatively similar sizes, a single segmentation scale was optimized and selected. To minimize the confusion between date palm trees and the rest of the classes in the images, a spectral difference segmentation algorithm was applied on the optimized image object by MRS to merge objects with a small difference in their spectral values.
In this study, the optimal combinations of MRS parameters were defined as the parameters that produce the highest accuracy for classifying date palm trees. The synergy of the Taguchi statistical technique and F1-score for the classification of date palm trees was used to optimize the MRS parameters. The segmentation experiment was carried out on a small image subset with an area of 0.292 km2, to minimize the processing time and storage. A DT classifier was applied to classify 25 segmentation results suggested by an L25 orthogonal array based on the same training samples. The date palm tree accuracy measure was computed for the 25 experiments. SNR was computed to determine the optimum MRS parameter that was suitable for mapping date palm trees, because some experiments may have similar classification outputs. The optimal result is pinpointed when high SNR occurs. The MRS parameters proposed by the integration of the F1-score with the robust Taguchi approach were tested with the performance of the common OF with the Taguchi method, to investigate the efficiency of the proposed method. Although the results of the two methods were pinpointed the same scale level, they obtained different shape and compactness values. The segmentation results of the F1-score and OF were classified using the NB classifier. The proposed method achieved improvements in the OA, KC, and class-specific accuracy for classifying date palms.
The quality of the ultimate GEOBIA classification result is highly dependent on the image segmentation, as well as on using relevant and appropriate numbers of features. Use of feature-selection methods in GEOBIA has been studied, and it produced significantly different outputs with regard to the number of selected features and the achieved classification accuracy [43,72,73,74]. In the current study, ACO was employed to select the most significant features that contribute to differentiating date palm trees from other LULC classes. ACO is considered to be more computationally efficient than PSO and a genetic algorithm [17]. Among the tested features mentioned in 
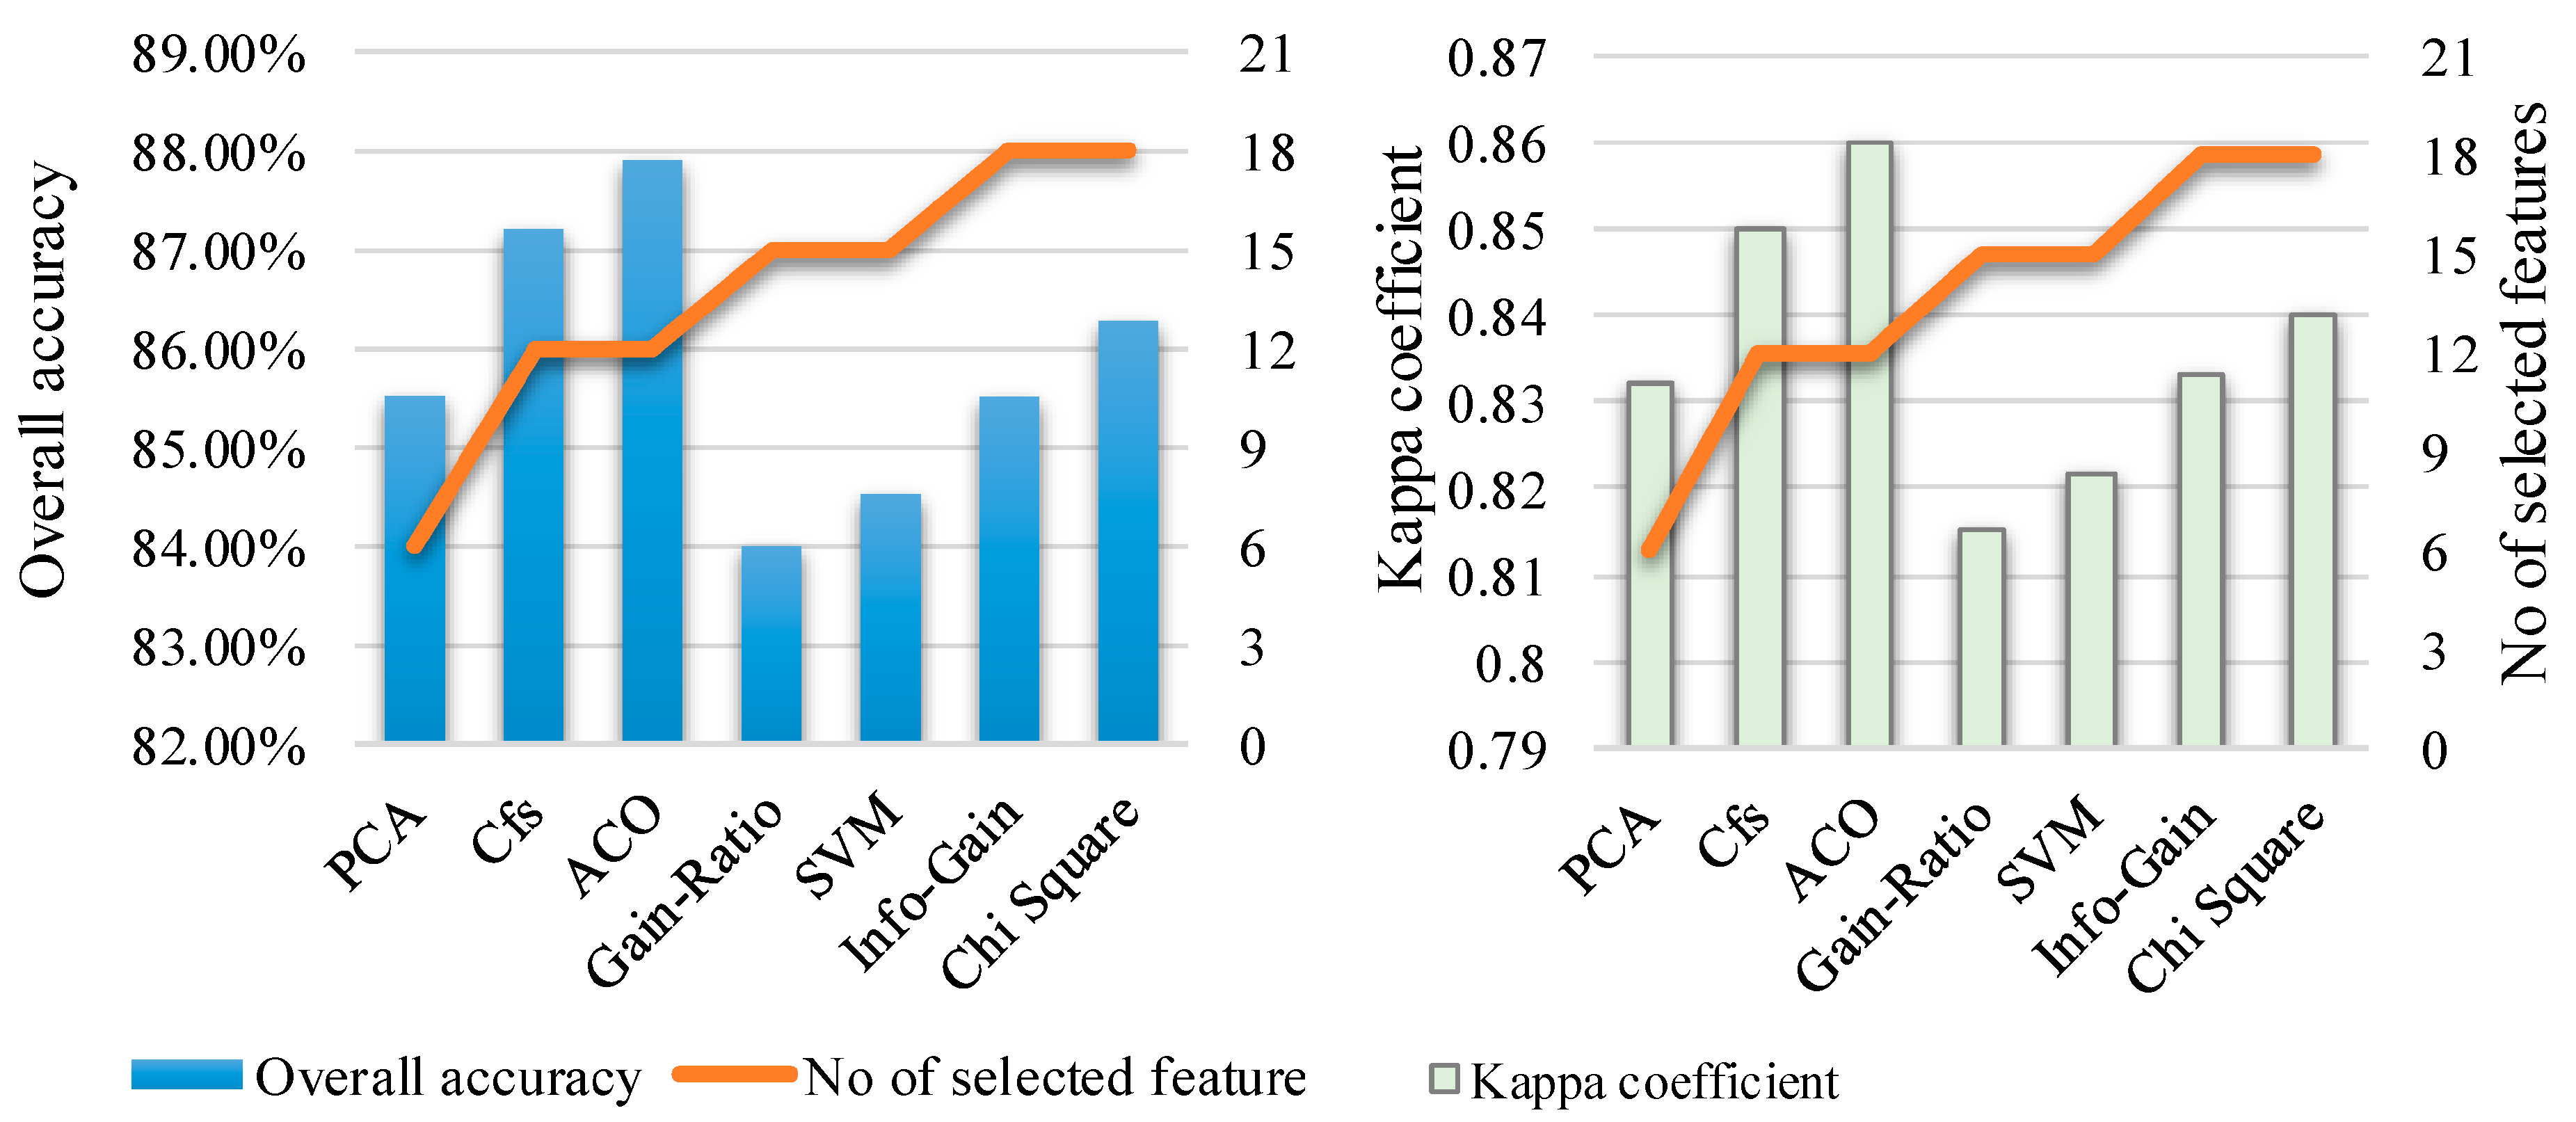
Section 2, 31 features were proposed, based on extensive literature and the authors’ general knowledge and experience. Ten ACO experiments were conducted to return the best features with a particular percentage from the total features, starting from 10%, to 20%, and so on, up to 90% out of the total features. The fourth experiment with 12 features provided the highest classification accuracy and it was used for further analysis. Several feature-selection techniques, including PCA, CFS, SVM, information gain, gain ratio, and chi-square, were used to investigate the efficiency of ACO. ACO, followed by CFS, outperformed the other methods with regard to OA, KC, and F1-score for classifying date palm trees. A previous study [13] confirmed that CFS and ACO outperformed the RF algorithm to improve the differentiation between two types of landslide.
Image object classification adopted in research is the ultimate step in the GEOBIA approach that follows image segmentation and feature selection. Classification techniques in the GEOBIA environment can be categorized into rule-based and supervised methods. Reference [
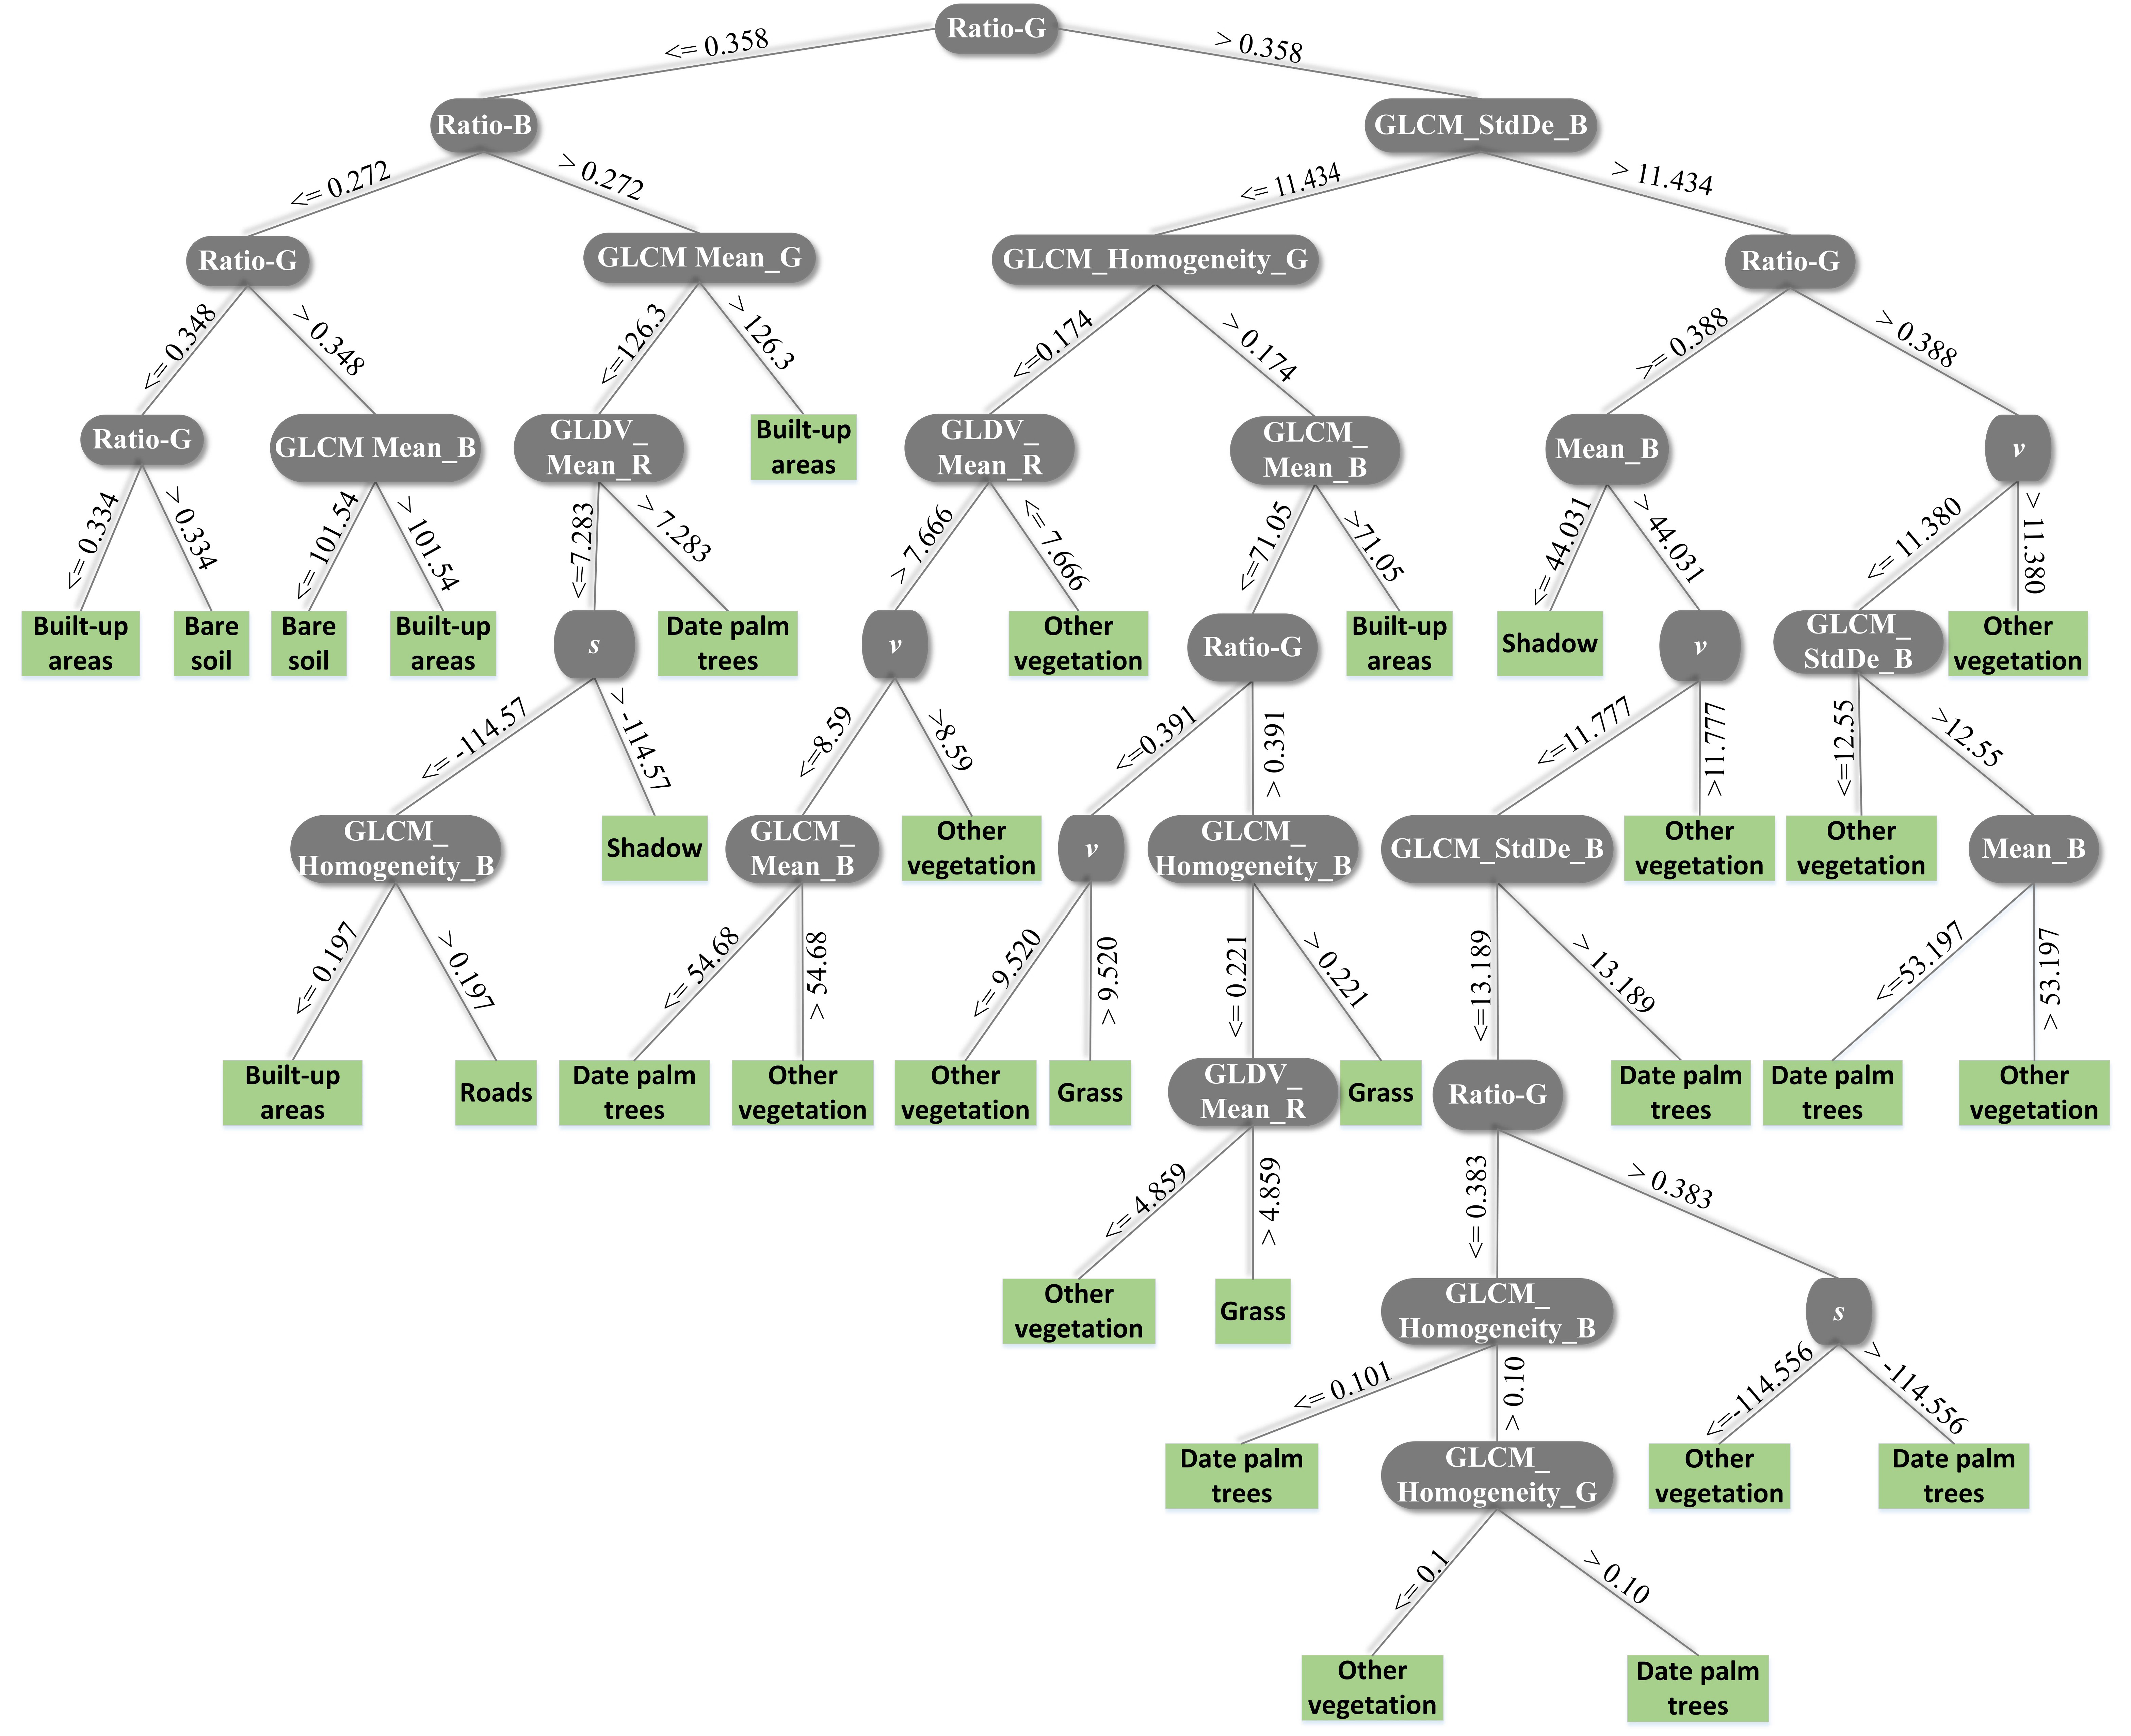
37] compared rule-based classification to several unsupervised algorithms, including RF, SVM, Bayes, and k-nearest neighbor, to map asbestos cement roofs obtained from WorldView-2 images. They concluded that rule-based classification provided the highest classification accuracy and allowed the transferability of the proposed method. However, every classification technique in the GEOBIA environment might provide different classification results because GEOBIA is affected by image segmentation, feature selection, and the adopted classification algorithm. In the present study, rule-based classification was applied based on the DT classifier. The DT was built through a set of training samples collected from date palm trees of different ages, heights, and health status, and by using the rest of the various LULC classes. As shown in Figure 4, image objects were categorized as vegetation and non-vegetation based on the Ratio-G index. In addition, the color invariant index was a very effective index that contributed to the differentiation between the date palm and various vegetation species. Each date palm tree is segmented into different image objects because the leaves of a tree are not spatially connected, and some shadow might exist between them. Thus, small objects on a date palm tree might share similar spectral and textural attributes with some vegetation species in the RGB image. However, date palm trees have unique textural and color invariant characteristics that distinguish them from other trees. For example, GLCM_homogeneity-B, GLCM_homogeneity-G were observed to be the most distinct textural features for date palm trees, while Ratio-G, -V, and -S were the most effective color invariants that contributed to the detection and the refinement of the date palm trees Class. Therefore, the combinations of various color invariants and textural features were used to detect and map date palm trees from VHSR aerial images.
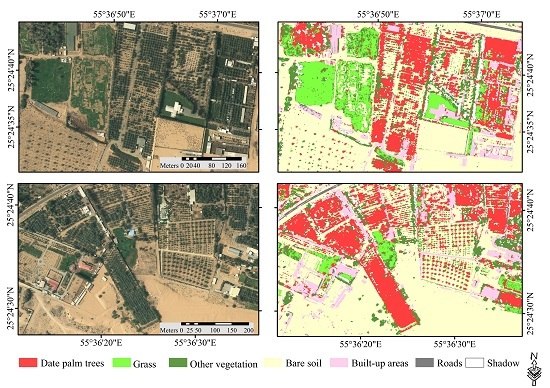
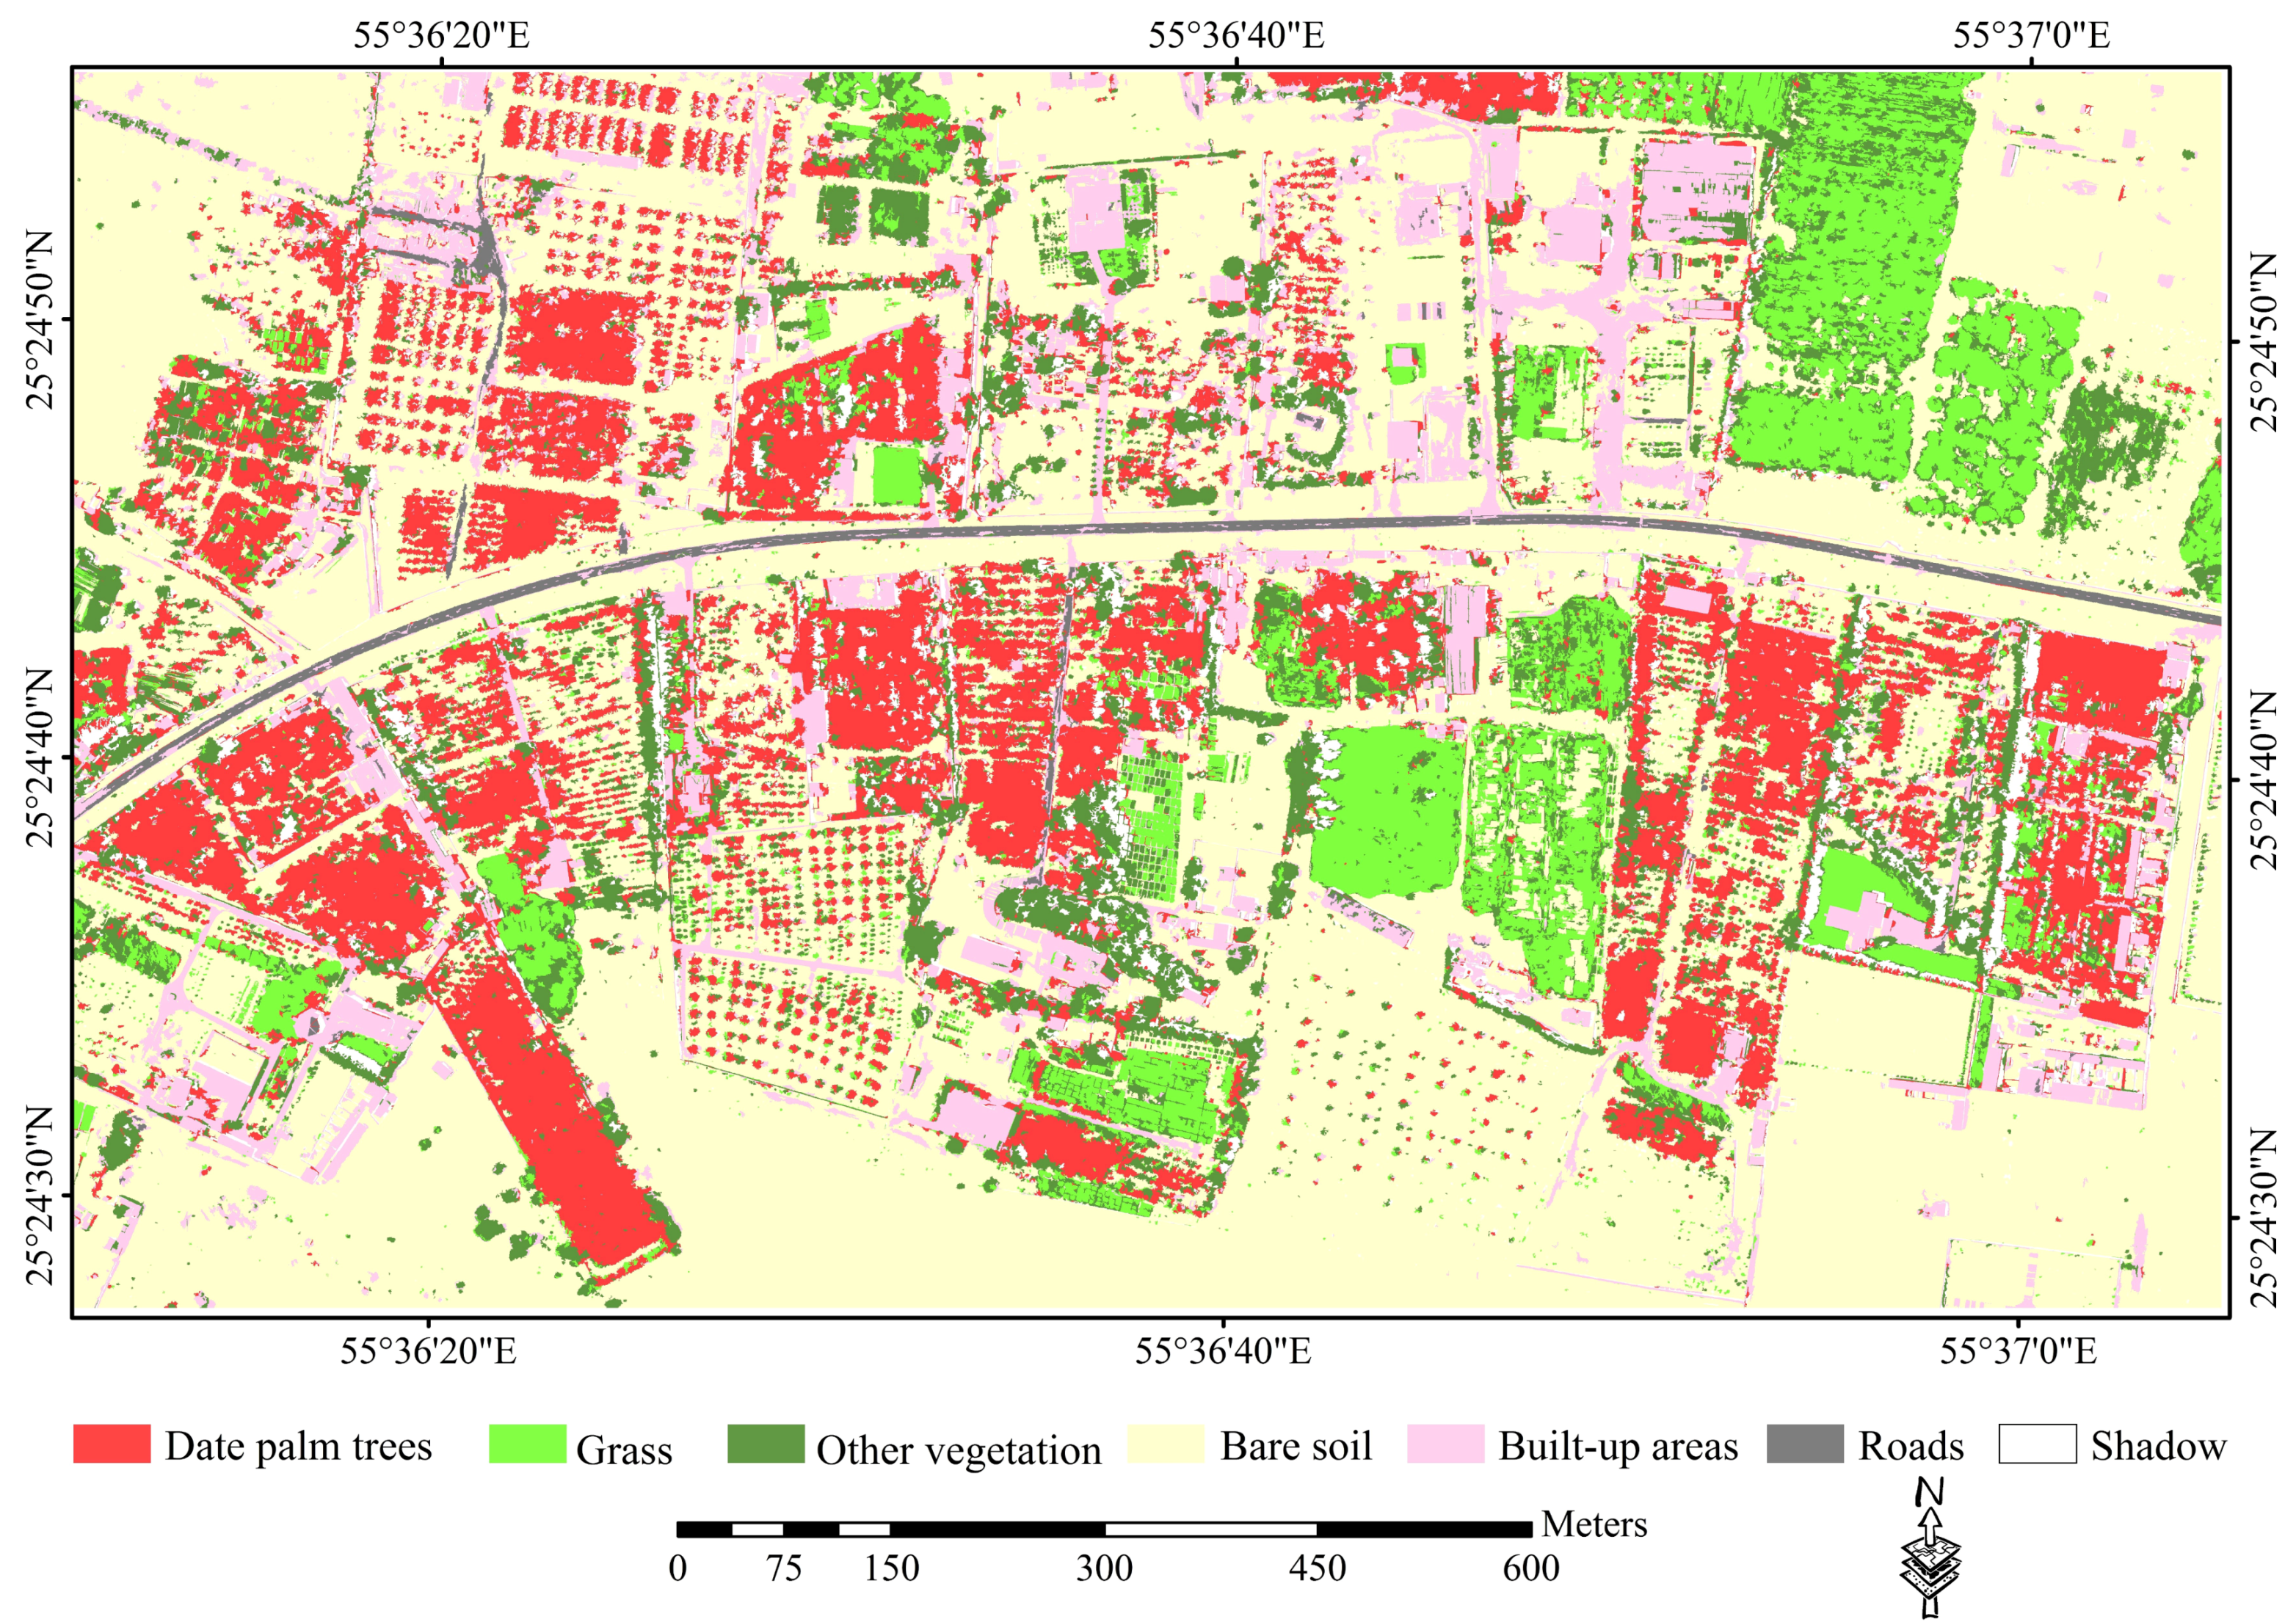
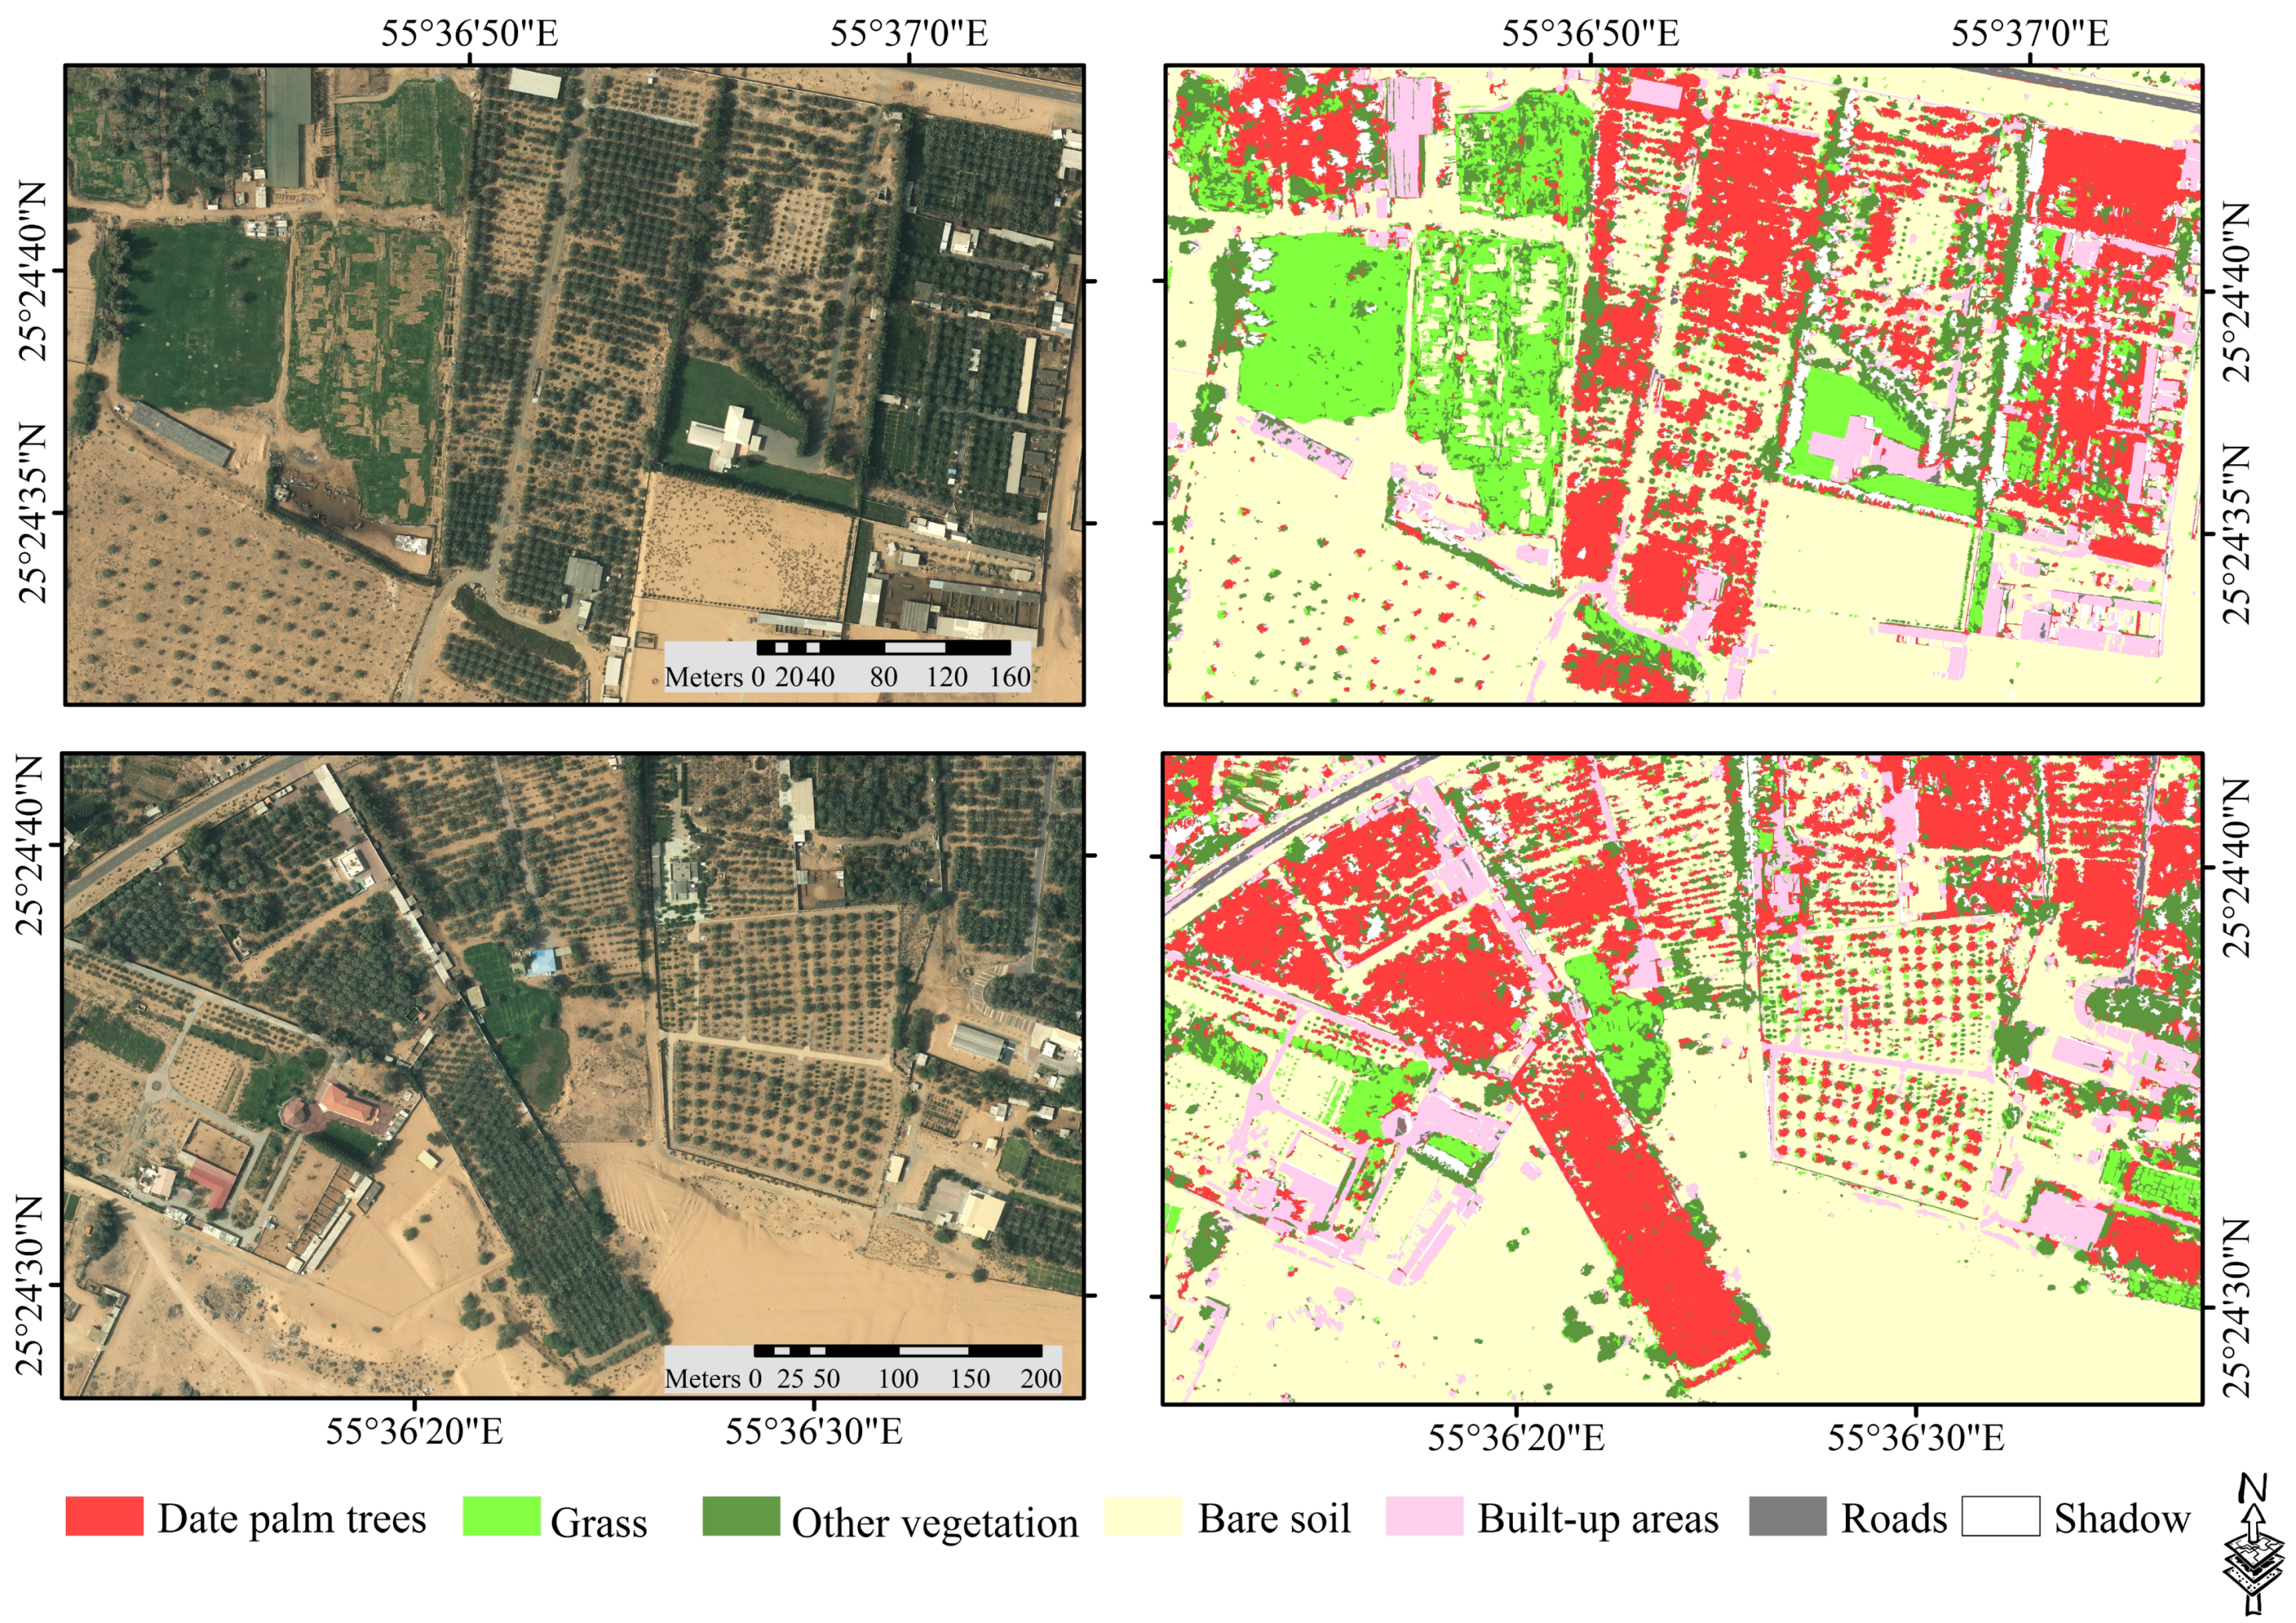
The rule-based classification based on DT, SVM, RF, and k-NN algorithms were conducted to classify the first study area (Figure 5 and Figure 7). Rule-based classification based on DT outperformed the supervised GEOBIA classifiers. The proposed GEOBIA classification approach through the integration of F1-score, Taguchi design, ACO, and rule-based classification was very promising and yielded an OA of 91.9%, a KC of 0.9, and a date palm accuracy-specific measure of 0.91. Minor misclassifications of objects containing date palm trees were encountered with several image objects of the other vegetation class, and built-up areas mixed with vegetation and shadow, as shown in Figure 9. This misclassification might be attributed to different reasons. For example, image segmentation might be a factor, given the imperfect image segmentation, the lack of spectral information of the RGB image, the dryness of some parts of the date palm trees, and the presence of shadow.
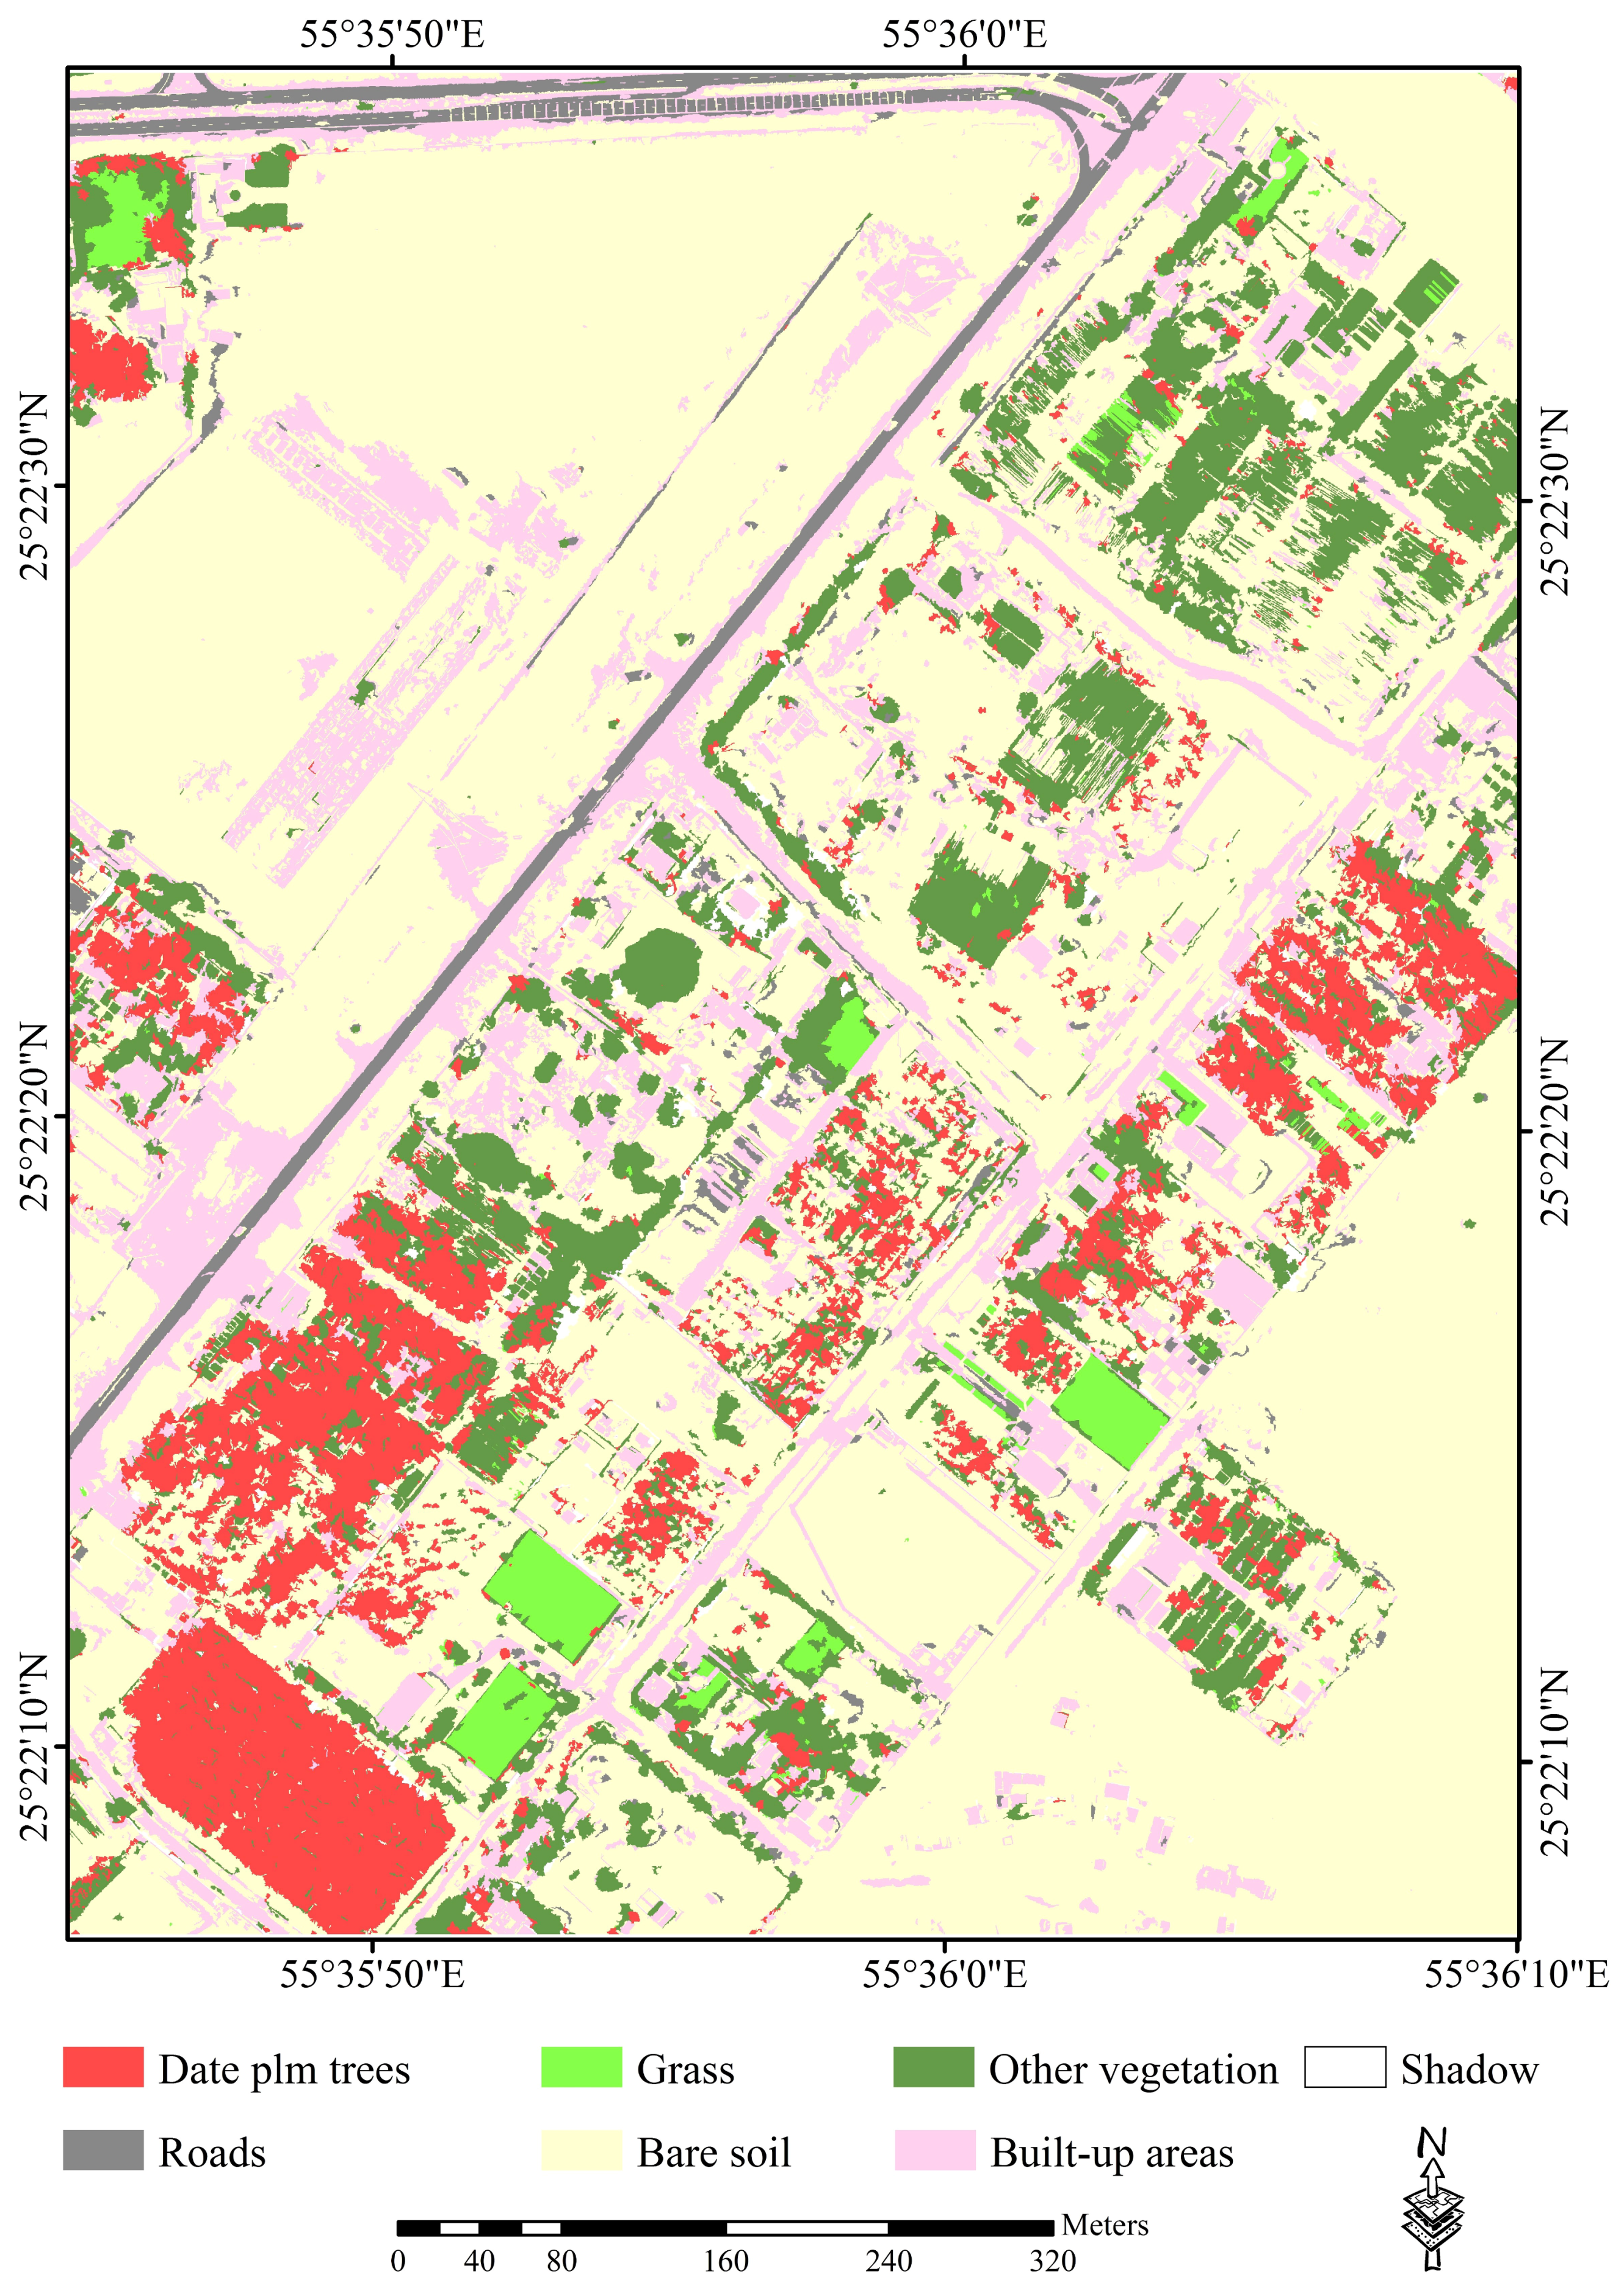
The transferability of the proposed method was investigated by applying it to another study area. Although the second study area was different from the first study area in terms of heterogeneity and contrast of the RGB color, realistic classification results were achieved, with OA, KC, and F1-score values for classifying date palm trees of 87.0%, 0.85, and 0.89, respectively. The minor misclassification can be improved by adding contextual features for refining the final results. The misclassified date palm objects that are within a small distance from the date palm classification can be reassigned to their right classifications, based on the “relation-to-neighbor-objects” attribute. Moreover, some morphological and reshaping features might be added to increase the accuracy of the classification result. Having sufficient spectral information improves the differentiation among healthy and unhealthy date palm trees with subtle differences, and this aspect can be very challenging if an RGB image is used. The integration of RGB images and digital surface models can be another solution to performing high-quality mapping of date palms.

5. Conclusions

Date palm trees play vital societal, commercial, and environmental roles in the UAE. Accurate and up-to-date information on date palm trees contribute to their monitoring, yield estimation, and environmental impacts. This study aimed to detect and map date palm trees from very-high-resolution aerial imagery. This study integrated GEOBIA, the F1-score, the Taguchi statistical technique, and ACO, to map and improve the detection and mapping of date palm trees.
Image segmentation quality had a great impact on classification results, where the F1-score and Taguchi optimization were used to obtain the optimum combinations of MRS parameters. The advantage of this method is that it can be applied to optimize the parameters of MRS, based on a small data set generalized to a segment’s larger images. The first study area was segmented using the optimum MRS parameters, and 31 features were computed for all image objects. ACO was employed, due to its efficiency to obtain the most relevant features among the 31 tested features; based on its data, various color invariants and textural parameters (12 features) were chosen. The result is that ACO achieved the highest accuracy when compared to several other feature-selection techniques that include PCA, CFS, SVM, information gain, gain ratio, and chi-square.
Finally, a rule-based classification technique based on DT was adopted. The proposed method was built from a selected study area. The adopted classification method in the proposed method was compared with three supervised GEOBIA classifiers: RF, SVM, and k-NN. A rule-based classifier based on DT outperformed the supervised GEOBIA classifiers.
Another study area was used to investigate the effectiveness of the proposed method in mapping date palm trees. The proposed method yielded promising results and represents an efficient tool for mapping date palm trees from very-high-resolution RGB images. The proposed method also provides a robust classification scheme for extracting date palm trees from fine spatial resolution, and can be used to map other objects of interest while maintaining a high degree of classification accuracy.

Author Contributions

R.A.-R., A.S., M.B.A.G. and S.A.-M. contributed to the conceptualization of the research; R.A.-R. and M.B.A.G. performed the experiments; R.A.-R., M.B.A.G. and A.S. analyzed the data and results; R.A.-R., A.S., M.B.A.G. and S.A.-M. reviewed and edited the paper.

Acknowledgments

The authors would like to acknowledge the municipality of Ajman for its continuous support and for providing the aerial images of the study area.

Conflicts of Interest

The authors declare no conflict of interest.

References

  1. Al-Khayri, J.M.; Jain, S.M.; Johnson, D.V. Date Palm Genetic Resources and Utilization: Volume 2: Asia and Europe; Springer: Dordrecht, The Netherland, 2015; Volume 2, pp. 1–566. [Google Scholar] [CrossRef]
  2. Jaradati, A.A.; Zaid, A. Quality traits of date palm fruits in a center of origin and center of diversity. Environment 2004, 2, 208–217. [Google Scholar]
  3. El-Juhany, L. Degradation of date palm trees and date production in Arab countries: Causes and potential rehabilitation. Aust. J. Basic Appl. Sci. 2010, 4, 3998–4010. [Google Scholar] [CrossRef]
  4. Pei, F.; Wu, C.; Liu, X.; Li, X.; Yang, K.; Zhou, Y.; Wang, K.; Xu, L.; Xia, G. Monitoring the vegetation activity in China using vegetation health indices. Agric. For. Meteorol. 2018, 248, 215–227. [Google Scholar] [CrossRef]
  5. Xie, Y.; Sha, Z.; Yu, M. Remote sensing imagery in vegetation mapping: A review. J. Plant Ecol. 2008, 1, 9–23. [Google Scholar] [CrossRef]
  6. Rizeei, H.M.; Shafri, H.Z.M.; Mohamoud, M.A.; Pradhan, B.; Kalantar, B. Oil Palm Counting and Age Estimation from WorldView-3 Imagery and LiDAR Data Using an Integrated OBIA Height Model and Regression Analysis. J. Sens. 2018, 2018, 2536327. [Google Scholar] [CrossRef]
  7. Chemura, A.; Van Duren, I.C. Determination of the age of oil palm from crown projection area detected from WorldView-2 multispectral remote sen. ISPRS J. Photogramm. Remote Sens. 2015, 100, 118–127. [Google Scholar] [CrossRef]
  8. Cao, J.; Leng, W.; Liu, K.; Liu, L.; He, Z.; Zhu, Y. Object-Based mangrove species classification using unmanned aerial vehicle hyperspectral images and digital surface models. Remote Sens. 2018, 10, 89. [Google Scholar] [CrossRef]
  9. Pham, L.T.H.; Brabyn, L. Monitoring mangrove biomass change in Vietnam using SPOT images and an object-based approach combined with machine learning algorithms. ISPRS J. Photogramm. Remote Sens. 2017, 128, 86–97. [Google Scholar] [CrossRef]
  10. Dibs, H.; Idrees, M.O.; Alsalhin, G.B.A. Hierarchical classification approach for mapping rubber tree growth using per-pixel and object-oriented classifiers with SPOT-5 imagery. Egypt. J. Remote Sens. Space Sci. 2017, 20, 21–30. [Google Scholar] [CrossRef]
  11. Karydas, C.; Gewehr, S.; Iatrou, M.; Iatrou, G.; Mourelatos, S. Olive Plantation Mapping on a Sub-Tree Scale with Object-Based Image Analysis of Multispectral UAV Data; Operational Potential in Tree Stress Monitoring. J. Imaging 2017, 3, 57. [Google Scholar] [CrossRef]
  12. Peters, J.; van Coillie, F.; Westra, T.; de Wulf, R. Synergy of very high resolution optical and radar data for object-based olive grove mapping. Int. J. Geogr. Inf. Sci. 2011, 25, 971–989. [Google Scholar] [CrossRef]
  13. Ridha, M.; Pradhan, B. Catena An improved algorithm for identifying shallow and deep-seated landslides in dense tropical forest from airborne laser scanning data. Catena 2018, 167, 147–159. [Google Scholar] [CrossRef]
  14. Chen, G.; Hay, G.J.; Castilla, G.; St-Onge, B.; Powers, R. A multiscale geographic object-based image analysis to estimate lidar-measured forest canopy height using quickbird imagery. Int. J. Geogr. Inf. Sci. 2011, 25, 877–893. [Google Scholar] [CrossRef]
  15. Chen, G.; Weng, Q.; Hay, G.J.; He, Y. Geographic Object-based Image Analysis (GEOBIA): Emerging trends and future opportunities. GISci. Remote Sens. 2018, 55, 159–182. [Google Scholar] [CrossRef]
  16. Gibril, M.B.A.; Idrees, M.O.; Yao, K.; Shafri, H.Z.M. Integrative image segmentation optimization and machine learning approach for high quality land-use and land-cover mapping using multisource remote sensing data. J. Appl. Remote Sens. 2018, 12, 016036. [Google Scholar] [CrossRef]
  17. Sameen, M.I.; Pradhan, B.; Shafri, H.Z.M.; Mezaal, M.R.; Hamid, H. Bin Integration of Ant Colony Optimization and Object-Based Analysis for LiDAR Data Classification. IEEE J. Sel. Top. Appl. Earth Obs. Remote Sens. 2017, 10, 2055–2066. [Google Scholar] [CrossRef]
  18. Pradhan, B.; Sameen, M.I.; Kalantar, B. Optimized Rule-Based Flood Mapping Technique Using Multitemporal RADARSAT-2 Images in the Tropical Region. IEEE J. Sel. Top. Appl. Earth Obs. Remote Sens. 2017, 10, 3190–3199. [Google Scholar] [CrossRef]
  19. Kamal, M.; Phinn, S.; Johansen, K. Object-based approach for multi-scale mangrove composition mapping using multi-resolution image datasets. Remote Sens. 2015, 7, 4753–4783. [Google Scholar] [CrossRef]
  20. Ma, L.; Li, M.; Ma, X.; Cheng, L.; Du, P.; Liu, Y. A review of supervised object-based land-cover image classification. ISPRS J. Photogramm. Remote Sens. 2017, 130, 277–293. [Google Scholar] [CrossRef]
  21. Kim, M.; Madden, M.; Warner, T.T. A Forest Type Mapping using Object-specific Texture Measures from Multispectral Ikonos Imagery: Segmentation Quality and Image Classification Issues. Photogramm. Eng. Remote Sens. 2009, 75, 819–829. [Google Scholar] [CrossRef]
  22. Liu, Y.; Bian, L.; Meng, Y.; Wang, H.; Zhang, S.; Yang, Y.; Shao, X.; Wang, B. Discrepancy measures for selecting optimal combination of parameter values in object-based image analysis. ISPRS J. Photogramm. Remote Sens. 2012, 68, 144–156. [Google Scholar] [CrossRef]
  23. Mesner, N.; Oštir, K. Investigating the impact of spatial and spectral resolution of satellite images on segmentation quality. J. Appl. Remote Sens. 2014, 8, 83696. [Google Scholar] [CrossRef] [Green Version]
  24. Zhang, H.; Fritts, J.E.; Goldman, S.A. Image segmentation evaluation: A survey of unsupervised methods. Comput. Vis. Image Underst. 2008, 110, 260–280. [Google Scholar] [CrossRef] [Green Version]
  25. Grybas, H.; Melendy, L.; Congalton, R.G. A comparison of unsupervised segmentation parameter optimization approaches using moderate- and high-resolution imagery. GISci. Remote Sens. 2017, 54, 515–533. [Google Scholar] [CrossRef]
  26. Gao, Y.; Mas, J.F.; Kerle, N.; Pacheco, J.A.N. Optimal region growing segmentation and its effect on classification accuracy. Int. J. Remote Sens. 2011, 32, 3747–3763. [Google Scholar] [CrossRef]
  27. Zhang, X.; Feng, X.; Xiao, P.; He, G.; Zhu, L. Segmentation quality evaluation using region-based precision and recall measures for remote sensing images. ISPRS J. Photogramm. Remote Sens. 2015, 102, 73–84. [Google Scholar] [CrossRef]
  28. Johnson, B.; Xie, Z. Unsupervised image segmentation evaluation and refinement using a multi-scale approach. ISPRS J. Photogramm. Remote Sens. 2011, 66, 473–483. [Google Scholar] [CrossRef]
  29. Chabrier, S.; Emile, B.; Rosenberger, C.; Laurent, H. Unsupervised performance evaluation of image segmentation. Eurasip J. Appl. Signal Process. 2006, 2006, 96306. [Google Scholar] [CrossRef]
  30. Johnson, B.; Bragais, M.; Endo, I.; Magcale-Macandog, D.; Macandog, P. Image Segmentation Parameter Optimization Considering Within- and Between-Segment Heterogeneity at Multiple Scale Levels: Test Case for Mapping Residential Areas Using Landsat Imagery. ISPRS Int. J. Geo-Inf. 2015, 4, 2292–2305. [Google Scholar] [CrossRef] [Green Version]
  31. Espindola, G.M.; Camara, G.; Reis, I.A.; Bins, L.S.; Monteiro, A.M. Parameter selection for region-growing image segmentation algorithms using spatial autocorrelation. Int. J. Remote Sens. 2006, 27, 3035–3040. [Google Scholar] [CrossRef]
  32. Hadavand, A.; Saadatseresht, M.; Homayouni, S. Segmentation parameter selection for object-based land-cover mapping from ultra high resolution spectral and elevation data. Int. J. Remote Sens. 2017, 38, 3586–3607. [Google Scholar] [CrossRef]
  33. Martha, T.R.; Kerle, N.; Van Westen, C.J.; Jetten, V.; Kumar, K.V. Segment optimization and data-driven thresholding for knowledge-based landslide detection by object-based image analysis. IEEE Trans. Geosci. Remote Sens. 2011, 49, 4928–4943. [Google Scholar] [CrossRef]
  34. Kalantar, B.; Mansor, S.B.; Sameen, M.I.; Pradhan, B.; Shafri, H.Z.M. Drone-based land-cover mapping using a fuzzy unordered rule induction algorithm integrated into object-based image analysis. Int. J. Remote Sens. 2017, 38, 2535–2556. [Google Scholar] [CrossRef]
  35. Idrees, M.O.; Pradhan, B. Hybrid taguchi-objective function optimization approach for automatic cave bird detection from terrestrial laser scanning intensity image. Int. J. Speleol. 2016, 45, 289–301. [Google Scholar] [CrossRef]
  36. Moosavi, V.; Talebi, A.; Shirmohammadi, B. Producing a landslide inventory map using pixel-based and object-oriented approaches optimized by Taguchi method. Geomorphology 2014, 204, 646–656. [Google Scholar] [CrossRef]
  37. Gibril, M.B.A.; Shafri, H.Z.M.; Hamedianfar, A. New semi-automated mapping of asbestos cement roofs using rule-based object-based image analysis and Taguchi optimization technique from WorldView-2 images. Int. J. Remote Sens. 2017, 38, 467–491. [Google Scholar] [CrossRef]
  38. Pradhan, B.; Jebur, M.N.; Zulhaidi, H.; Shafri, M.; Tehrany, M.S. Data Fusion Technique Using Wavelet Transform and Taguchi Methods for Automatic Landslide Detection From Airborne Laser Scanning Data and QuickBird Satellite Imagery. IEEE Trans. Geosci. Remote Sens. 2016, 54, 1610–1622. [Google Scholar] [CrossRef]
  39. Idrees, M.O.; Pradhan, B.; Buchroithner, M.F.; Shafri, H.Z.M.; Bejo, S.K. Assessing the transferability of a hybrid Taguchi-objective function method to optimize image segmentation for detecting and counting cave roosting birds using terrestrial laser scanning data. J. Appl. Remote Sens. 2016, 10, 035023. [Google Scholar] [CrossRef]
  40. Dronova, I.; Gong, P.; Clinton, N.E.; Wang, L.; Fu, W.; Qi, S.; Liu, Y. Landscape analysis of wetland plant functional types: The effects of image segmentation scale, vegetation classes and classification methods. Remote Sens. Environ. 2012, 127, 357–369. [Google Scholar] [CrossRef]
  41. Smith, A. Image segmentation scale parameter optimization and land cover classification using the random forest algorithm. J. Spat. Sci. 2010, 55, 69–79. [Google Scholar] [CrossRef]
  42. Alizadeh Naeini, A.; Babadi, M.; Mirzadeh, S.M.J.; Amini, S. Particle Swarm Optimization for Object-Based Feature Selection of VHSR Satellite Images. IEEE Geosci. Remote Sens. Lett. 2018, 15, 379–383. [Google Scholar] [CrossRef]
  43. Laliberte, A.S.; Browning, D.M.; Rango, A. A comparison of three feature selection methods for object-based classification of sub-decimeter resolution UltraCam-L imagery. Int. J. Appl. Earth Obs. Geoinf. 2012, 15, 70–78. [Google Scholar] [CrossRef]
  44. Duro, D.C.; Franklin, S.E.; Dubé, M.G. Multi-scale object-based image analysis and feature selection of multi-sensor earth observation imagery using random forests. Int. J. Remote Sens. 2012, 33, 4502–4526. [Google Scholar] [CrossRef]
  45. Huang, X.; Zhang, L. An SVM ensemble approach combining spectral, structural, and semantic features for the classification of high-resolution remotely sensed imagery. IEEE Trans. Geosci. Remote Sens. 2013, 51, 257–272. [Google Scholar] [CrossRef]
  46. Mezaal, M.R.; Pradhan, B.; Sameen, M.I.; Mohd Shafri, H.Z.; Yusoff, Z.M. Optimized Neural Architecture for Automatic Landslide Detection from High-Resolution Airborne Laser Scanning Data. Appl. Sci. 2017, 7, 730. [Google Scholar] [CrossRef]
  47. Shahi, K.; Shafri, H.Z.M.; Hamedianfar, A. Road condition assessment by OBIA and feature selection techniques using very high-resolution WorldView-2 imagery. Geocarto Int. 2017, 32, 1389–1406. [Google Scholar] [CrossRef]
  48. Al-Ruzouq, R.; Hamad, K.; Shanableh, A.; Khalil, M. Infrastructure growth assessment of urban areas based on multi-temporal satellite images and linear features. Ann. GIS 2017, 23, 183–201. [Google Scholar] [CrossRef]
  49. Baatz, M.; Sch, A. Multiresolution Segmentation: An optimization approach for high quality multi-scale image segmentation. J. Photogramm. Remote Sens. 2004, 58, 239–258. [Google Scholar]
  50. Li, D.; Ke, Y.; Gong, H.; Li, X. Object-based urban tree species classification using bi-temporal worldview-2 and worldview-3 images. Remote Sens. 2015, 7, 16917–16937. [Google Scholar] [CrossRef]
  51. Yan, J.; Zhou, W.; Han, L.; Qian, Y. Mapping vegetation functional types in urban areas with WorldView-2 imagery: Integrating object-based classification with phenology. Urban For. Urban Green. 2018, 31, 230–240. [Google Scholar] [CrossRef]
  52. Yan, J.; Lin, L.; Zhou, W.; Ma, K.; Pickett, S.T.A. A novel approach for quantifying particulate matter distribution on leaf surface by combining SEM and object-based image analysis. Remote Sens. Environ. 2016, 173, 156–161. [Google Scholar] [CrossRef] [Green Version]
  53. Witharana, C.; Civco, D.L. Optimizing multi-resolution segmentation scale using empirical methods: Exploring the sensitivity of the supervised discrepancy measure Euclidean distance 2 (ED2). ISPRS J. Photogramm. Remote Sens. 2014, 87, 108–121. [Google Scholar] [CrossRef]
  54. Tsui, K.-L. An Overview of Taguchi Method and Newly Developed Statistical Methods for Robust Design. IIE Trans. 1992, 24, 44–57. [Google Scholar] [CrossRef]
  55. Raza, Z.A.; Ahmad, N.; Kamal, S. Multi-response optimization of rhamnolipid production using grey rational analysis in Taguchi method. Biotechnol. Rep. 2014, 3, 86–94. [Google Scholar] [CrossRef] [PubMed]
  56. Witten, I.H.; Frank, E.; Hall, M. A Data Mining: Practical Machine Learning Tools and Techniques (Google eBook); Elsevier: New York, NY, USA, 2011; ISBN 0080890369. [Google Scholar]
  57. Carreiras, J.M.B.; Pereira, J.M.C.; Campagnolo, M.L.; Shimabukuro, Y.E. Assessing the extent of agriculture/pasture and secondary succession forest in the Brazilian Legal Amazon using SPOT vegetation data. Remote Sens. Environ. 2006, 101, 283–298. [Google Scholar] [CrossRef]
  58. Sirmacek, B.; Unsalan, C. Building detection from aerial images using invariant color features and shadow information. In Proceedings of the 2008 23rd International Symposium on Computer and Information Sciences, Istanbul, Turkey, 27–29 October 2008; pp. 1–5. [Google Scholar] [CrossRef]
  59. Shorter, N.; Kasparis, T. Automatic vegetation identification and building detection from a single nadir aerial image. Remote Sens. 2009, 1, 731–757. [Google Scholar] [CrossRef]
  60. Cretu, A.M.; Payeur, P. Building detection in aerial images based on watershed and visual attention feature descriptors. In Proceedings of the 2013 International Conference on Computer and Robot Vision, Regina, SK, Canada, 28–31 May 2013; pp. 265–272. [Google Scholar] [CrossRef]
  61. Gevers, T.; Smeulders, A.W.M. PicToSeek: Combining Color and Shape Invariant Features for Image Retrieval. IEEE Trans. Image Process. 2000, 9, 102–119. [Google Scholar] [CrossRef] [PubMed]
  62. Trimble, T. ECognition Developer 8.7 Reference Book; Trimble Germany GmbH: Munich, Germany, 2011; pp. 319–328. [Google Scholar]
  63. Haralick, R.M.; Shanmugam, K.; Dinstein, I. Textural features for image classification. IEEE Trans. Syst. Man Cybern. 1973, SMC-3, 610–621. [Google Scholar] [CrossRef]
  64. Dorigo, M.; Di Caro, G. Ant colony optimization: A new meta-heuristic. In Proceedings of the 1999 Congress on Evolutionary Computation-CEC99 l, (Cat. No. 99TH8406), Washington, DC, USA, 6–9 July 1999; Volume 2, pp. 1470–1477. [Google Scholar] [CrossRef]
  65. Breiman, L.; Friedman, J.H.; Olshen, R.A.; Stone, C.J. Classification and Regression Trees; Chapman & Hall/CRC Press: Boca Raton, FL, USA, 1984. [Google Scholar]
  66. Aguilar, M.A.; Nemmaoui, A.; Novelli, A.; Aguilar, F.J.; Lorca, A.G. Object-based greenhouse mapping using very high resolution satellite data and Landsat 8 time series. Remote Sens. 2016, 8, 513. [Google Scholar] [CrossRef]
  67. Reyes, A.; Solla, M.; Lorenzo, H. Comparison of different object-based classifications in LandsatTM images for the analysis of heterogeneous landscapes. Measurement 2017, 97, 29–37. [Google Scholar] [CrossRef]
  68. Li, M.; Zang, S.; Zhang, B.; Li, S.; Wu, C. A Review of Remote Sensing Image Classification Techniques: The Role of Spatio-contextual Information. Eur. J. Remote Sens. 2014, 47, 389–411. [Google Scholar] [CrossRef]
  69. Heumann, B.W. An Object-Based Classification of Mangroves Using a Hybrid Decision Tree—Support Vector Machine Approach. Remote Sens. 2011, 3, 2440–2460. [Google Scholar] [CrossRef] [Green Version]
  70. Belgiu, M.; Drăguţ, L. Random forest in remote sensing: A review of applications and future directions. ISPRS J. Photogramm. Remote Sens. 2016, 114, 24–31. [Google Scholar] [CrossRef]
  71. Trimble. Trimble eCognition Developer User Guide; Trimble Germany GmbH: Munich, Germany, 2014; pp. 1–266. [Google Scholar]
  72. Georganos, S.; Grippa, T.; Vanhuysse, S.; Lennert, M.; Shimoni, M.; Kalogirou, S.; Wolff, E. Less is more: Optimizing classification performance through feature selection in a very-high-resolution remote sensing object-based urban application. GISci. Remote Sens. 2018, 55, 221–242. [Google Scholar] [CrossRef]
  73. Ma, L.; Cheng, L.; Li, M.; Liu, Y.; Ma, X. Training set size, scale, and features in Geographic Object-Based Image Analysis of very high resolution unmanned aerial vehicle imagery. ISPRS J. Photogramm. Remote Sens. 2015, 102, 14–27. [Google Scholar] [CrossRef]
  74. Cánovas-García, F.; Alonso-Sarría, F. Optimal combination of classification algorithms and feature ranking methods for object-based classification of submeter resolution Z/I-Imaging DMC imagery. Remote Sens. 2015, 7, 4651–4677. [Google Scholar] [CrossRef]
Figure 1. Flowchart of the proposed methodology.
Remotesensing 10 01413 g001
Figure 2. The study area: (a) location map; (b) Ajman City; (c) Study Area 1; (d) Study Area 2.
Remotesensing 10 01413 g002
Figure 3. Overall accuracy (OA) and Kappa coefficient (KC) of the Naïve Bayes (NB) classifier applied to selected features by various feature-selection methods.
Remotesensing 10 01413 g003
Figure 4. Decision tree (DT) generated for developing rule sets for rule-based classification.
Remotesensing 10 01413 g004
Figure 5. Date palm trees detected in the first study area using the proposed method.
Remotesensing 10 01413 g005
Figure 6. Date palm trees identified in the second area using the proposed method.
Remotesensing 10 01413 g006
Figure 7. Date palm trees identified in the first study area using (a) support vector machine (SVM), (b) random forest (RF), and (c) k-nearest neighbor (k-NN) classifiers.
Remotesensing 10 01413 g007
Figure 8. Image segmentation results based on different MRS parameter settings.
Remotesensing 10 01413 g008
Figure 9. Results of the identification of date palm trees in some parts of the first study area using the proposed method.
Remotesensing 10 01413 g009
Table 1. Multiresolution segmentation (MRS) parameters and their selected ranges used for optimization.
Levels12345
Scale48121620
Shape0.50.40.30.20.1
Compactness0.10.1250.150.1750.2
Table 2. Description of object features derived from Red, Green, and Blue (RGB) imagery.
Tested Feature NameDescriptionReference
Mean-R, Mean-G, and Mean-BMean intensity of an image object of reflectance RGB band[62]
SD-R, SD-G, and SD-BStandard deviation of an image object of the reflectance bands[62]
Ratio-G G G + B + R [61]
Ratio-B B G + B + R [61]
Ratio-R R G + B + R [61]
V 4 π · arctan ( G B G + B ) [58]
S 4 π · arctan ( 1 R 2 + G 2 + B 2 1 + R 2 + G 2 + B 2 ) [60]
GLCM_Mean_R, GLCM_Mean_G, GLCM_Mean_BGray level co-occurrence matrix mean sum of all directions from the red, green, and blue spectral bands, respectively[63]
GLCM_homogeneity_R, GLCM_homogeneity_G, GLCM_homogeneity_BGray level co-occurrence matrix homogeneity sum of all directions from the red, green, and blue spectral bands, respectively[63]
GLCM_contrast_R, GLCM_contrast_G, GLCM_contrast_BGray level co-occurrence matrix contrast sum of all directions from the red, green, and blue spectral bands, respectively[63]
GLCM_Entropy_R, GLCM_Entropy_G, GLCM_Entropy_BGray level co-occurrence matrix entropy sum of all directions from the red, green, and blue spectral bands, respectively[63]
GLCM_StdDe_R, GLCM_StdDe_G, GLCM_StdDe_BGray level co-occurrence matrix standard deviation sum of all directions from the red, green, and blue spectral bands, respectively[63]
GLDV_Mean_R, GLDV_Mean_G, GLDV_Mean_BGray level difference vector matrix mean sum of all directions from the red, green, and blue spectral bands, respectively[63]
LengthWidthRatio of length and width[62]
Rectangular FitHow well an image object fits into a rectangle[62]
Table 3. L25 orthogonal array and the corresponding F1-score, objective function (OF), and signal-to-noise ratio (SNR) for the MRS parameters.
RunScaleShapeCompactnessNo. of ObjectsF1-ScoreSNRAverage WVAverage MIOFSNR
140.50.1895,9320.772−2.2480.0780.8980.976−0.209
240.40.1251,021,0700.763−2.3500.0500.8800.930−0.626
340.30.151,135,0210.773−2.2360.0290.8740.904−0.881
440.20.1751,234,6110.751−2.4870.0130.8390.852−1.396
540.10.21,316,7020.767−2.3040.0000.7970.797−1.974
680.50.125269,0680.832−1.5980.3640.6901.0540.456
780.40.15297,6990.820−1.7240.3110.6680.979−0.188
880.30.175320,2010.826−1.6600.2700.6600.929−0.635
980.20.2340,6880.815−1.7770.2390.5250.764−2.339
1080.10.1348,9180.792−2.0250.2170.4960.713−2.936
11120.50.15131,7040.867−1.2400.6050.5861.1911.521
12120.40.175144,6750.857−1.3400.5320.5441.0760.636
13120.30.2155,1400.863−1.2800.4750.6921.1671.342
14120.20.1160,5100.833−1.5870.4320.3990.831−1.608
15120.10.125164,2530.832−1.5980.4020.2710.672−3.450
16160.50.17578,2520.876−1.1500.8170.5091.3262.450
17160.40.285,9790.878−1.1300.7220.4101.1321.075
18160.30.190,6890.889−1.0220.6510.3591.0100.084
19160.20.12594,6450.891−1.0020.6000.2580.858−1.334
20160.10.1596,5370.855−1.3610.5610.1230.685−3.290
21200.50.252,2910.891−1.0021.0000.3831.3832.815
22200.40.156,7230.895−0.9640.8840.3301.2141.683
23200.30.12560,5400.919−0.7340.8040.2541.0570.485
24200.20.1562,8630.883−1.0810.7440.0840.828−1.639
25200.10.17563,9250.911−0.8100.7020.0000.702−3.079
Table 4. Statistical evaluations of SNR of the results of F1-score and OF for the MRS parameters.
F1-ScoreOF
LevelScaleShapeCompactnessScaleShapeCompactness
1−2.325−1.6195−1.5692−1.017−2.94598−0.59714
2−1.7568−1.5869−1.4561−1.12854−1.66329−0.89402
3−1.4089−1.3864−1.5282−0.311780.07911−0.89546
4−1.133−1.5015−1.4895−0.203140.516−0.40469
5−0.918−1.4474−1.49870.053041.406730.18389
Delta1.4070.2330.1131.181584.352711.07935
Rank123213
Table 5. Confusion matrix for DT rule-based classification of the first aerial image.
Date Palm TreesOther VegetationGrassBare SoilBuilt-Up AreaRoadsShadowTotalPA %UA %
Date palm trees33119000182070365390.5490.64
Other vegetation26733621430464658392294.9285.72
Grass434626590000274894.996.76
Bare soil0180285620400307897.9192.79
Built-up area242200226713224246980.9991.82
Roads0006110024720263393.2893.89
Shadow12400001075109187.6198.53
Total365735422802291727992650122719,594
Table 6. Confusion matrix for DT rule-based classification of the second aerial image.
Date Palm TreesOther VegetationGrassBare SoilBuilt-Up AreaRoadsShadowTotalPA %UA %
Date palm trees3946257200000422385.1593.44
Other vegetation470287710150052120453487.5563.45
Grass8022050000221368.0699.64
Bare soil22690356153813113433410082.16
Built-up area18883004098034440388.493.07
Roads0000024270242792.99100
Shadow0000001157115787.39100
Total463432863240356146362610132423,291
Table 7. Accuracy assessments of supervised geographic object-based image analysis (GEOBIA) classifiers of the first aerial image.
SVMRFk-NN
PA %UA %PA %UA %PA %UA %
Date palm trees82.1492.9878.6195.1185.9388.95
Other vegetation90.4579.788.2873.2884.6475
Grass96.4799.8996.9392.1397.2597.22
Bare soil88.8597.0888.8593.6183.2694.29
Built-up area92.0369.7774.7489.3676.5370.16
Roads96.1994.9786.7884.1571.2280.43
Shadow41.2485.4797.6479.1393.8989.65
Overall accuracy %87.4486.25%84.09%
Kappa coefficient0.85130.83790.8121

