Earth-Observation-Based Estimation and Forecasting of Particulate Matter Impact on Solar Energy in Egypt

 ,
, 
 , , ,
, , ,
Abstract
:
1. Introduction
2. Data and Methodology
2.1. Data
2.1.1. Model Forecasts
2.1.2. Satellite Observations
2.2. Methodology
2.2.1. Radiative Transfer Modelling Technique
2.2.2. Energy Management and Planning (M&P)
2.2.3. Financial Analysis
3. Results and Discussion
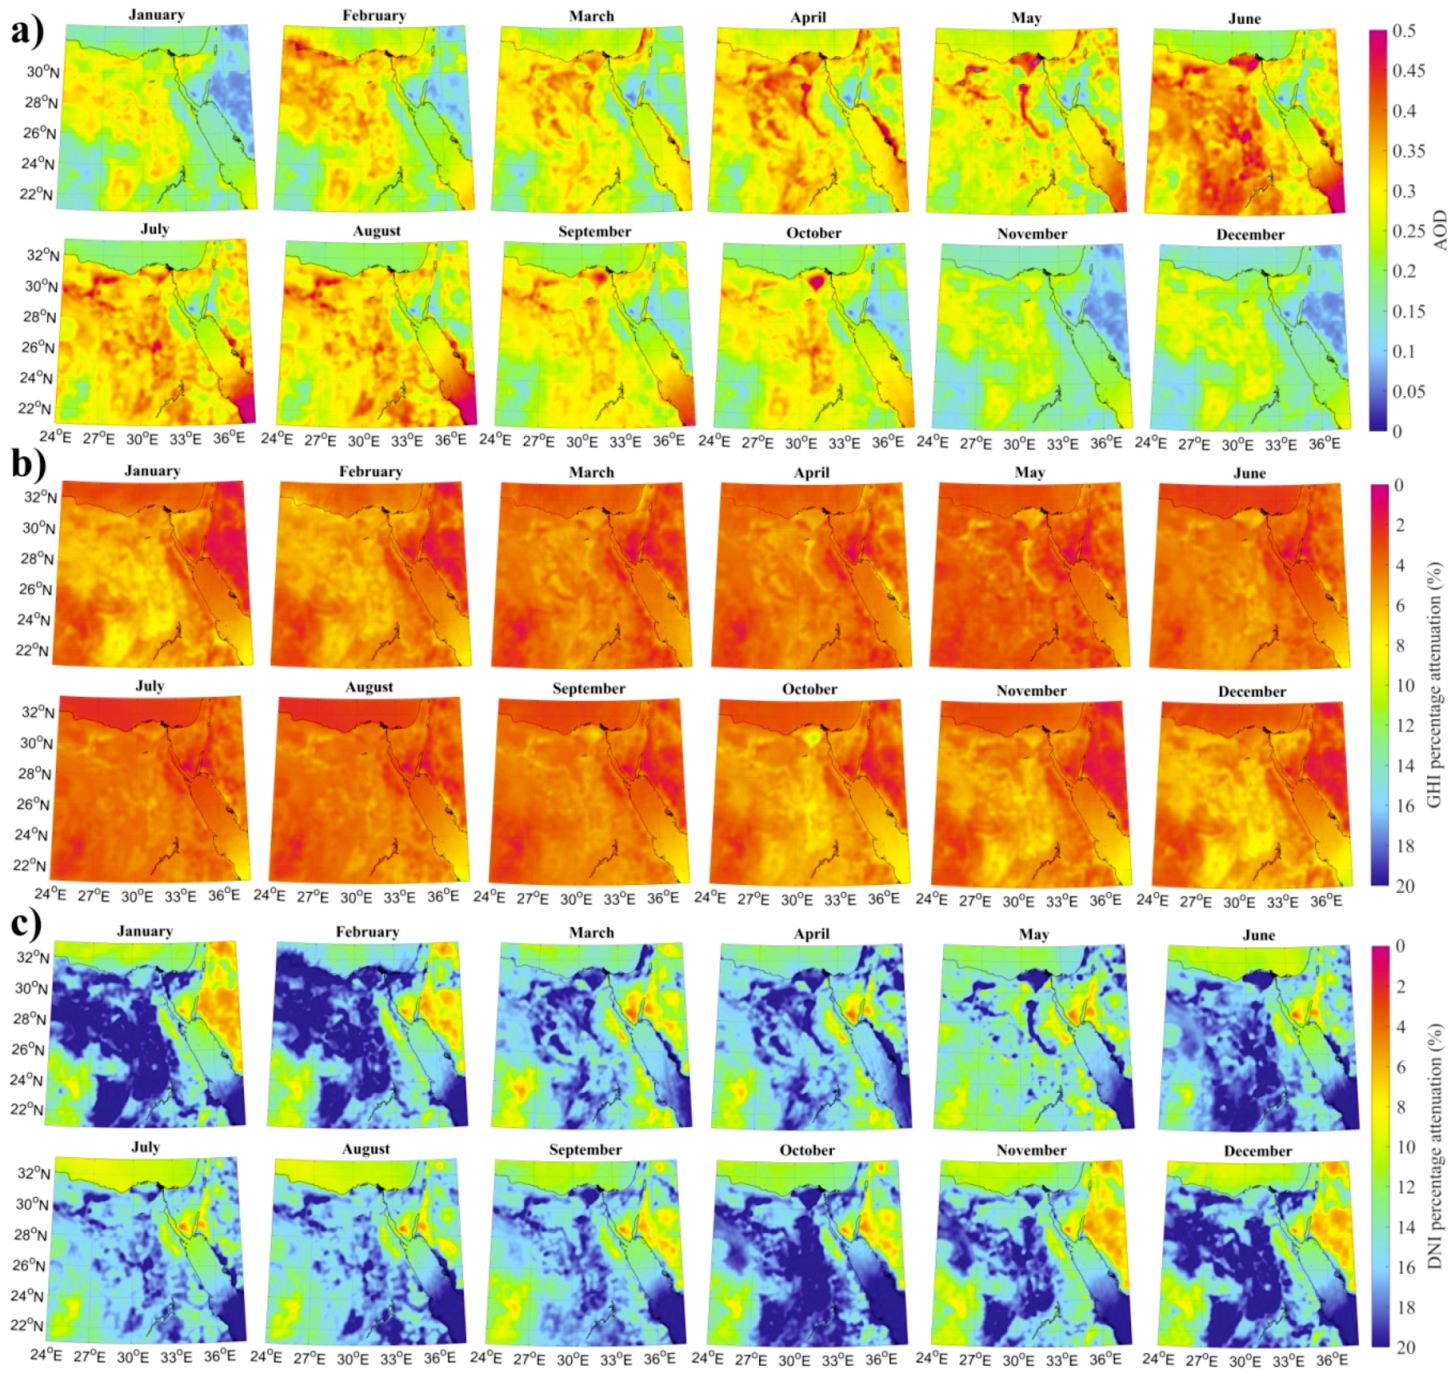
3.1. Climatological Impact
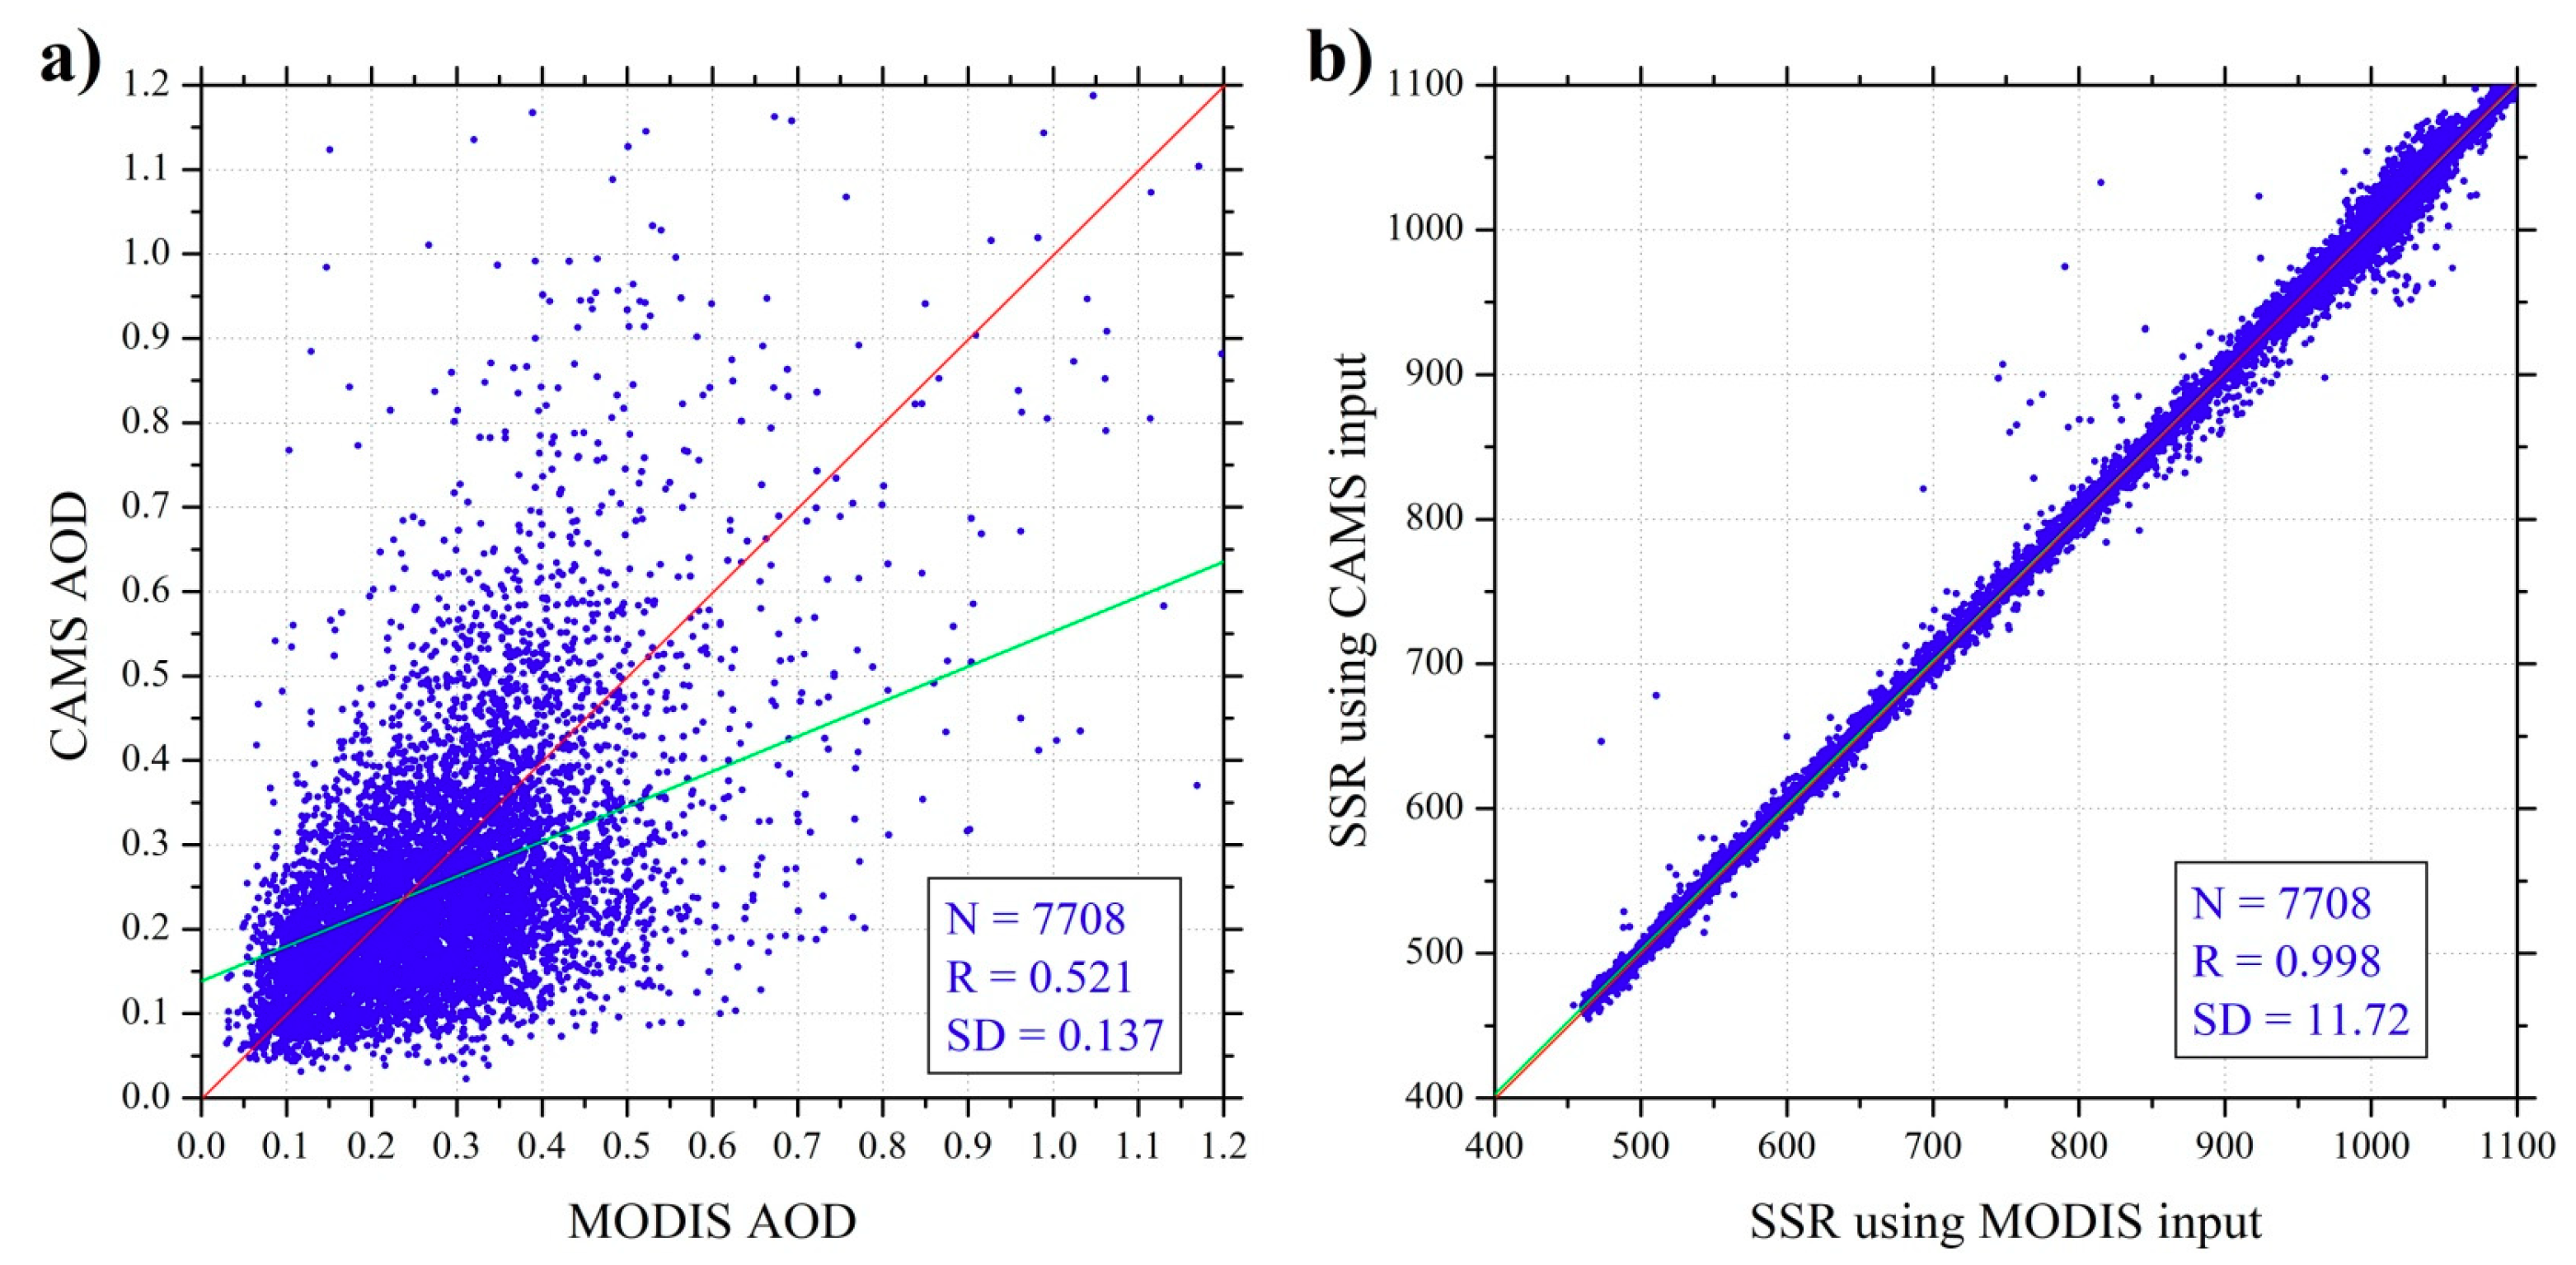
3.2. Performance of CAMS
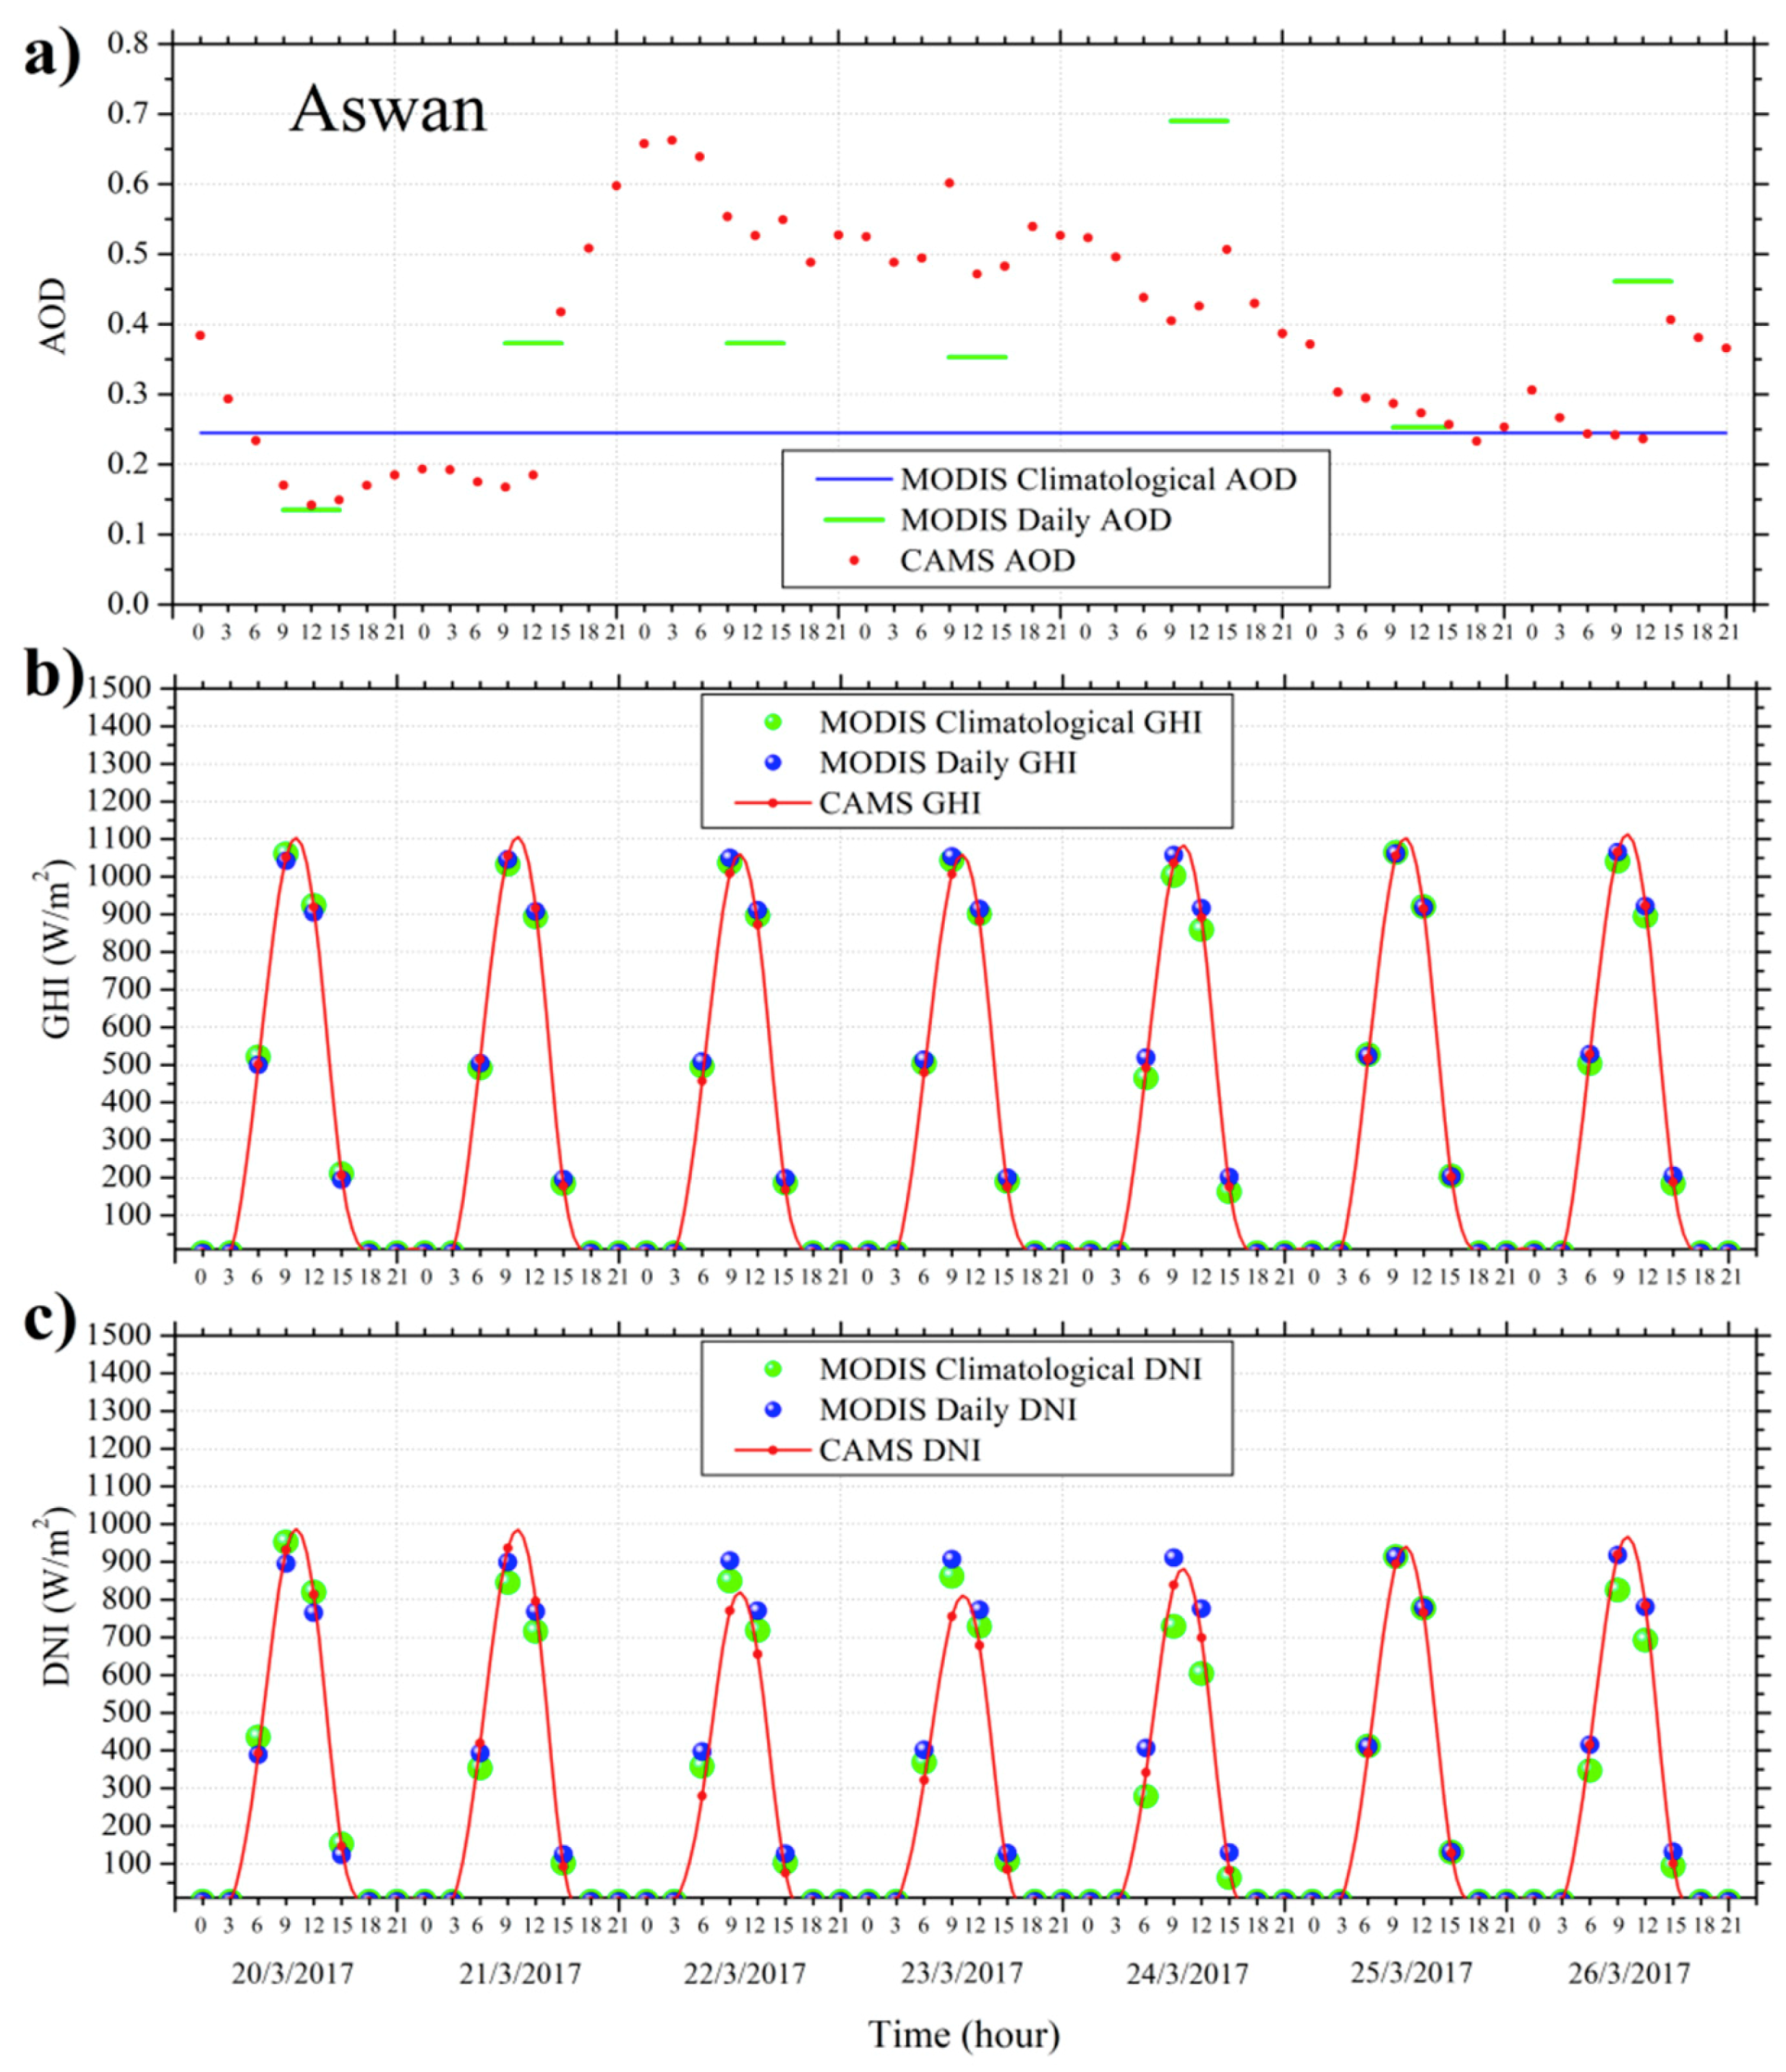
3.3. Performance of M&P Techniques
3.4. Economic Impact
4. Summary and Conclusions
Author Contributions
Funding
Acknowledgments
Conflicts of Interest
Abbreviations
| AE | Angstrom Exponent |
| AeroCom | Aerosol Compositions between Observations and Models |
| AOD | Aerosol Optical Depth |
| CAMS | Copernicus Atmosphere Monitoring Service |
| CLIM | Climatology |
| COT | Cloud Optical Thickness |
| CSP | Concentrated Solar Power |
| DB | Deep Blue |
| DNI | Direct Normal Irradiance |
| DR | Daily Revenue |
| DSO | Distribution System Operator |
| DT | Dark Target |
| ECMWF | European Centre for Medium-Range Weather Forecasts |
| EO | Earth Observation |
| EP | Energy Production |
| EU | European Union |
| FL | Financial Losses |
| GHI | Global Horizontal Irradiance |
| LUT | Look Up Table |
| M&P | Management and Planning |
| MACC | Monitoring Atmospheric Composition and Climate |
| MODIS | Moderate resolution Imaging Spectroradiometer |
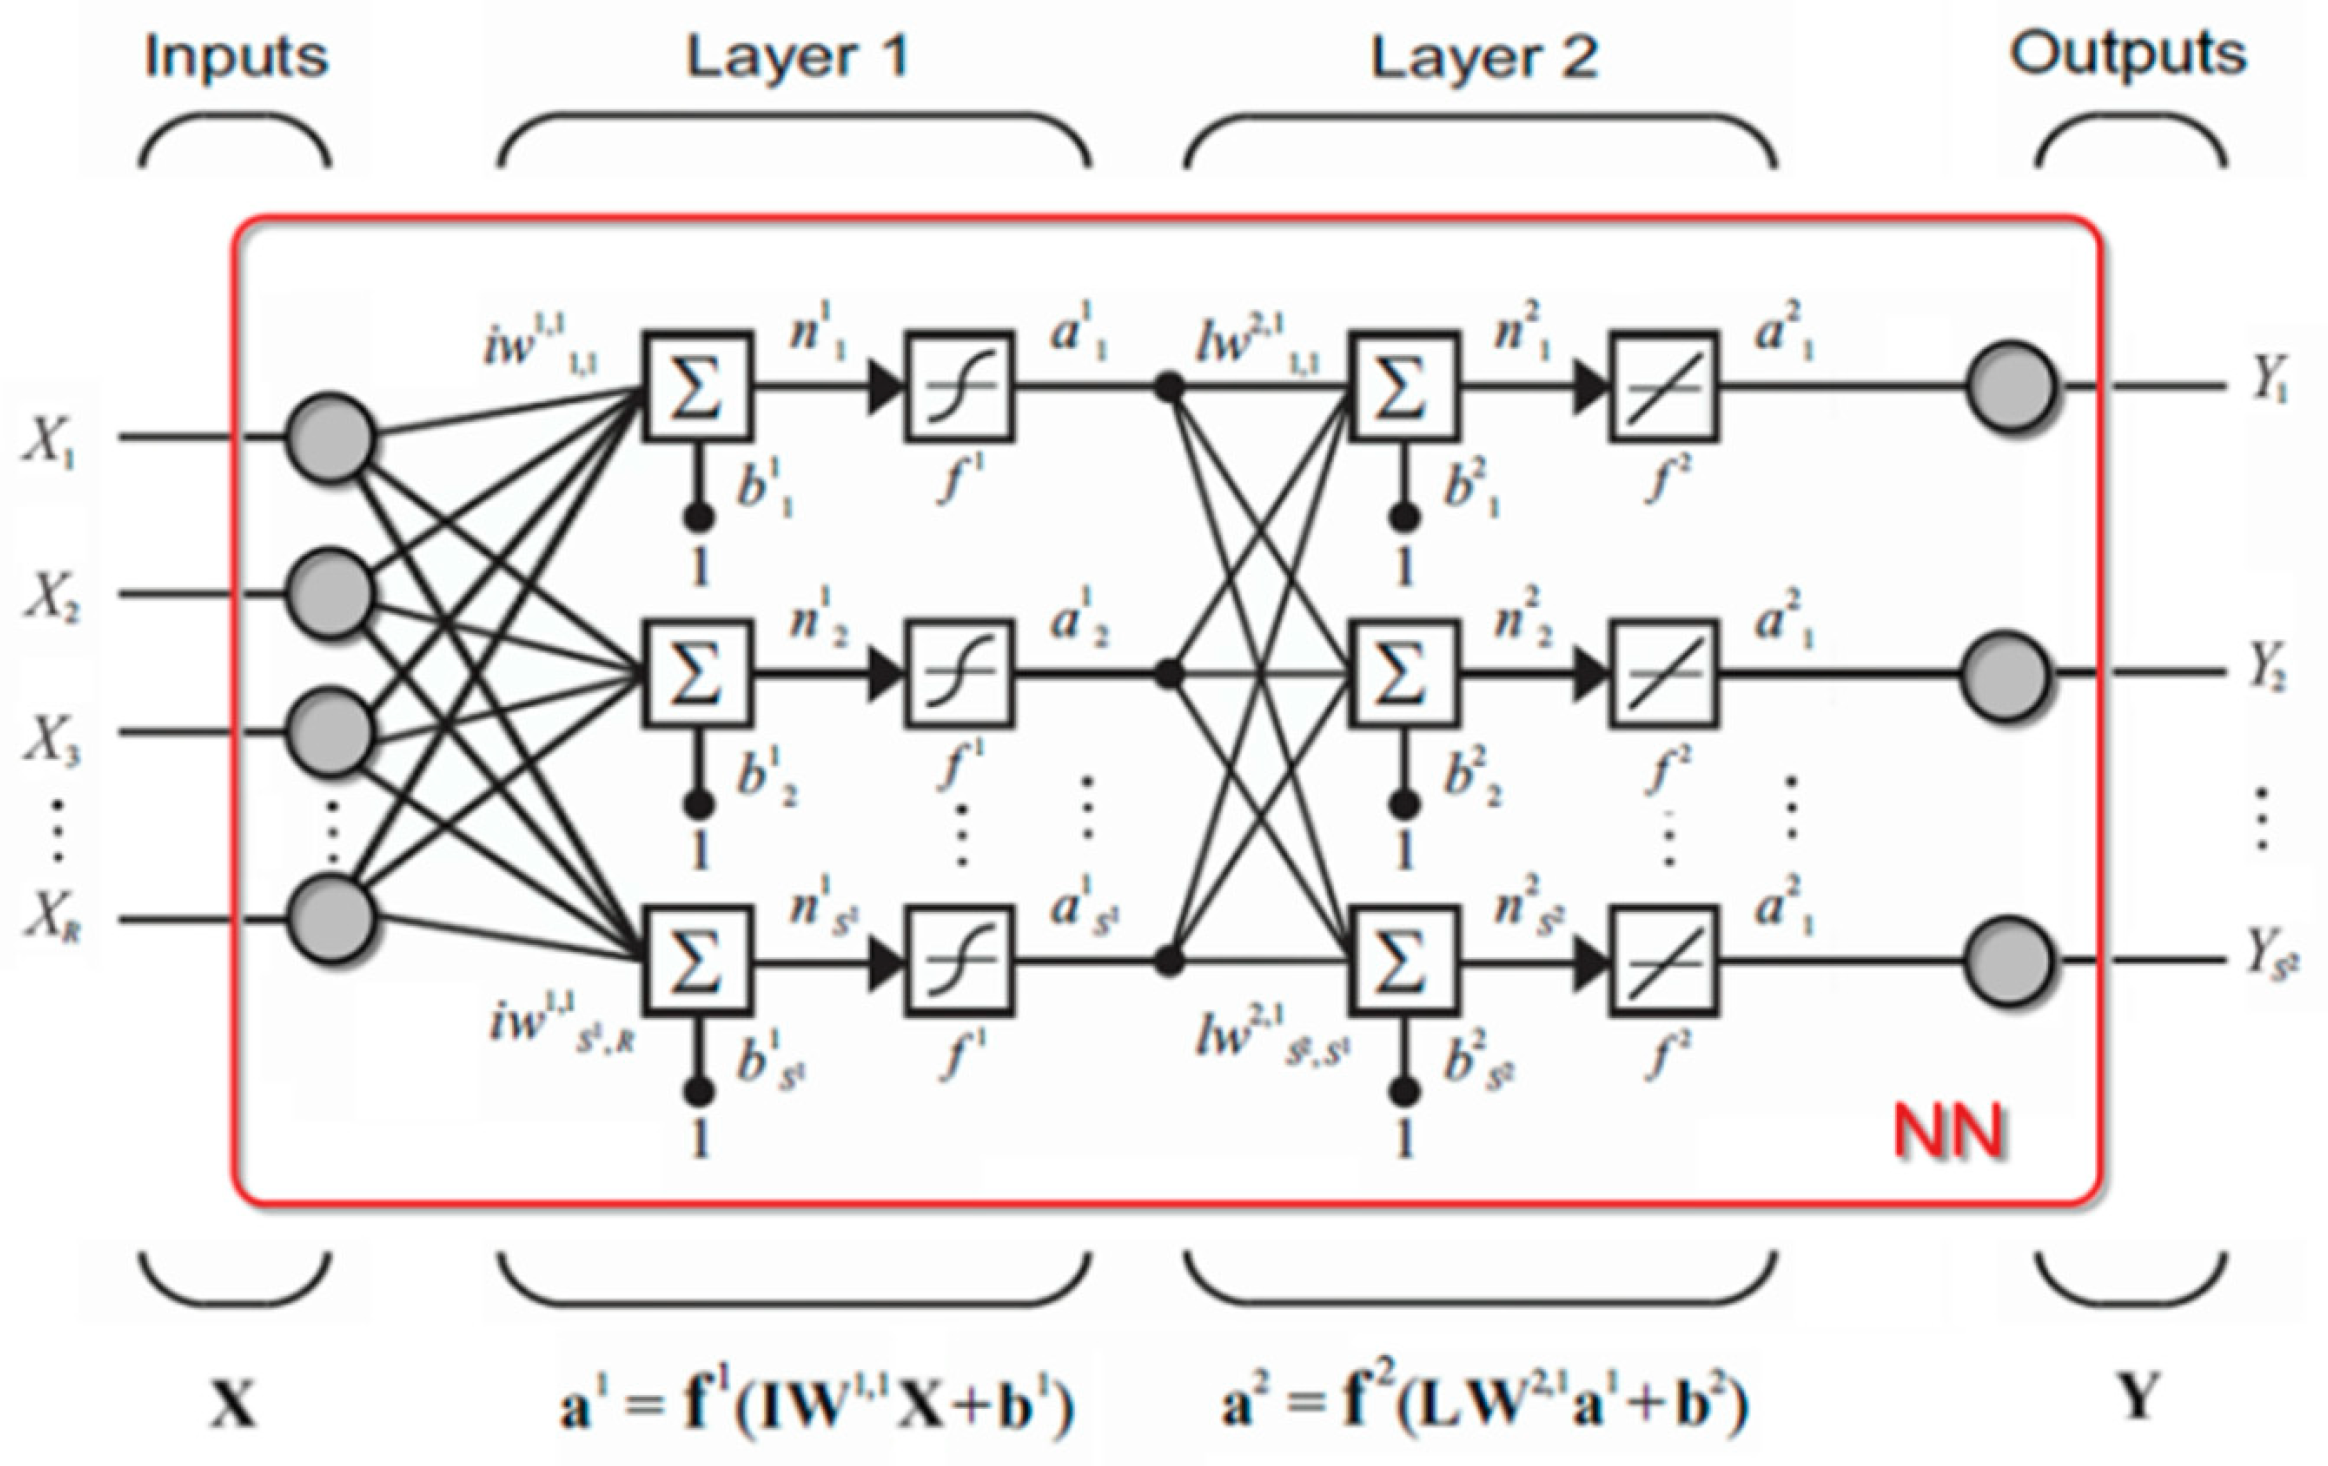
| NN | Neural Network |
| NREA | New and Renewable Energy Authority |
| NWP | Numerical Weather Prediction |
| PERS | Persistence |
| PV | Photovoltaic |
| QA | Quality Assurance |
| R | Coefficient of Determination |
| RTM | Radiative Transfer Model |
| SD | Standard Deviation |
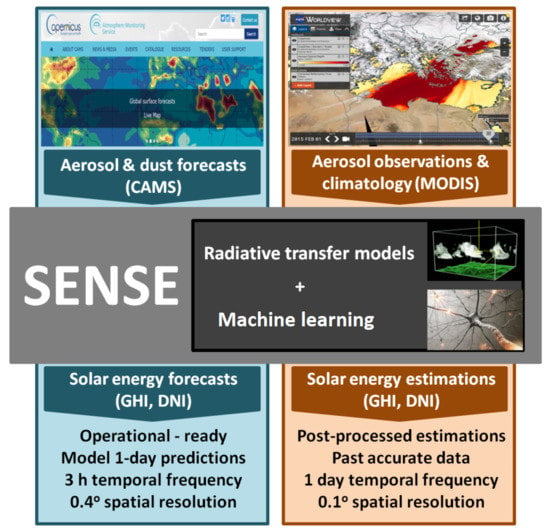
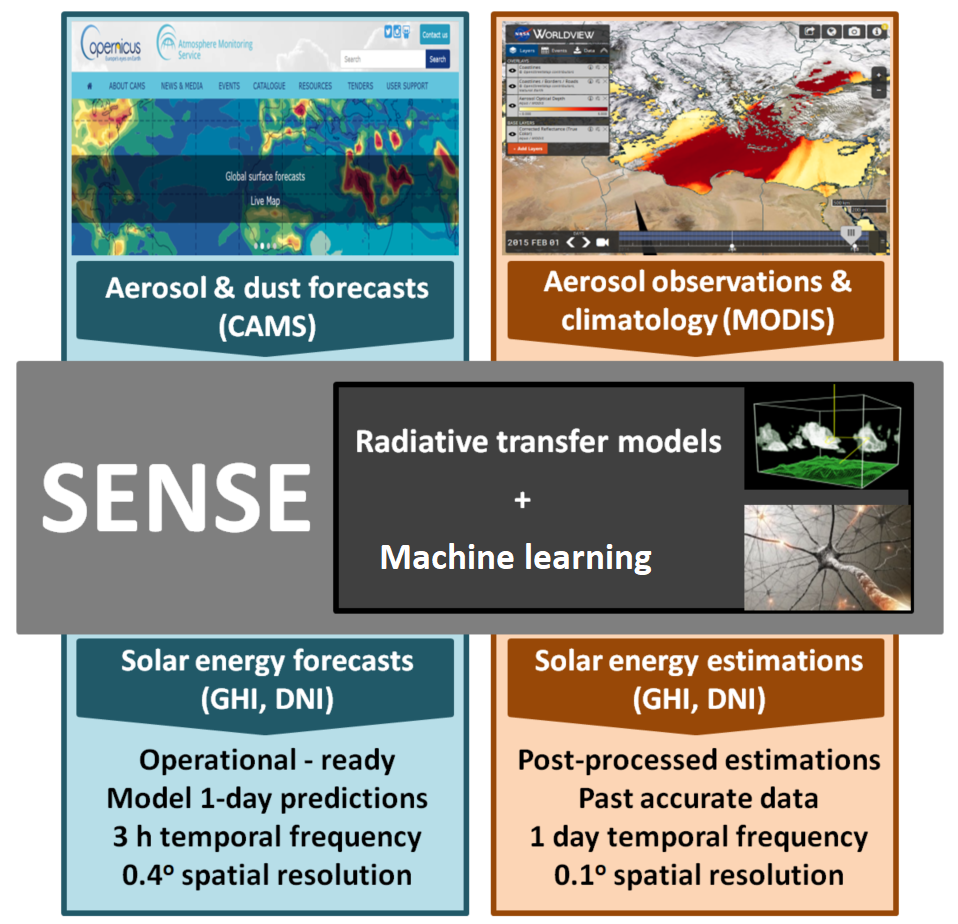
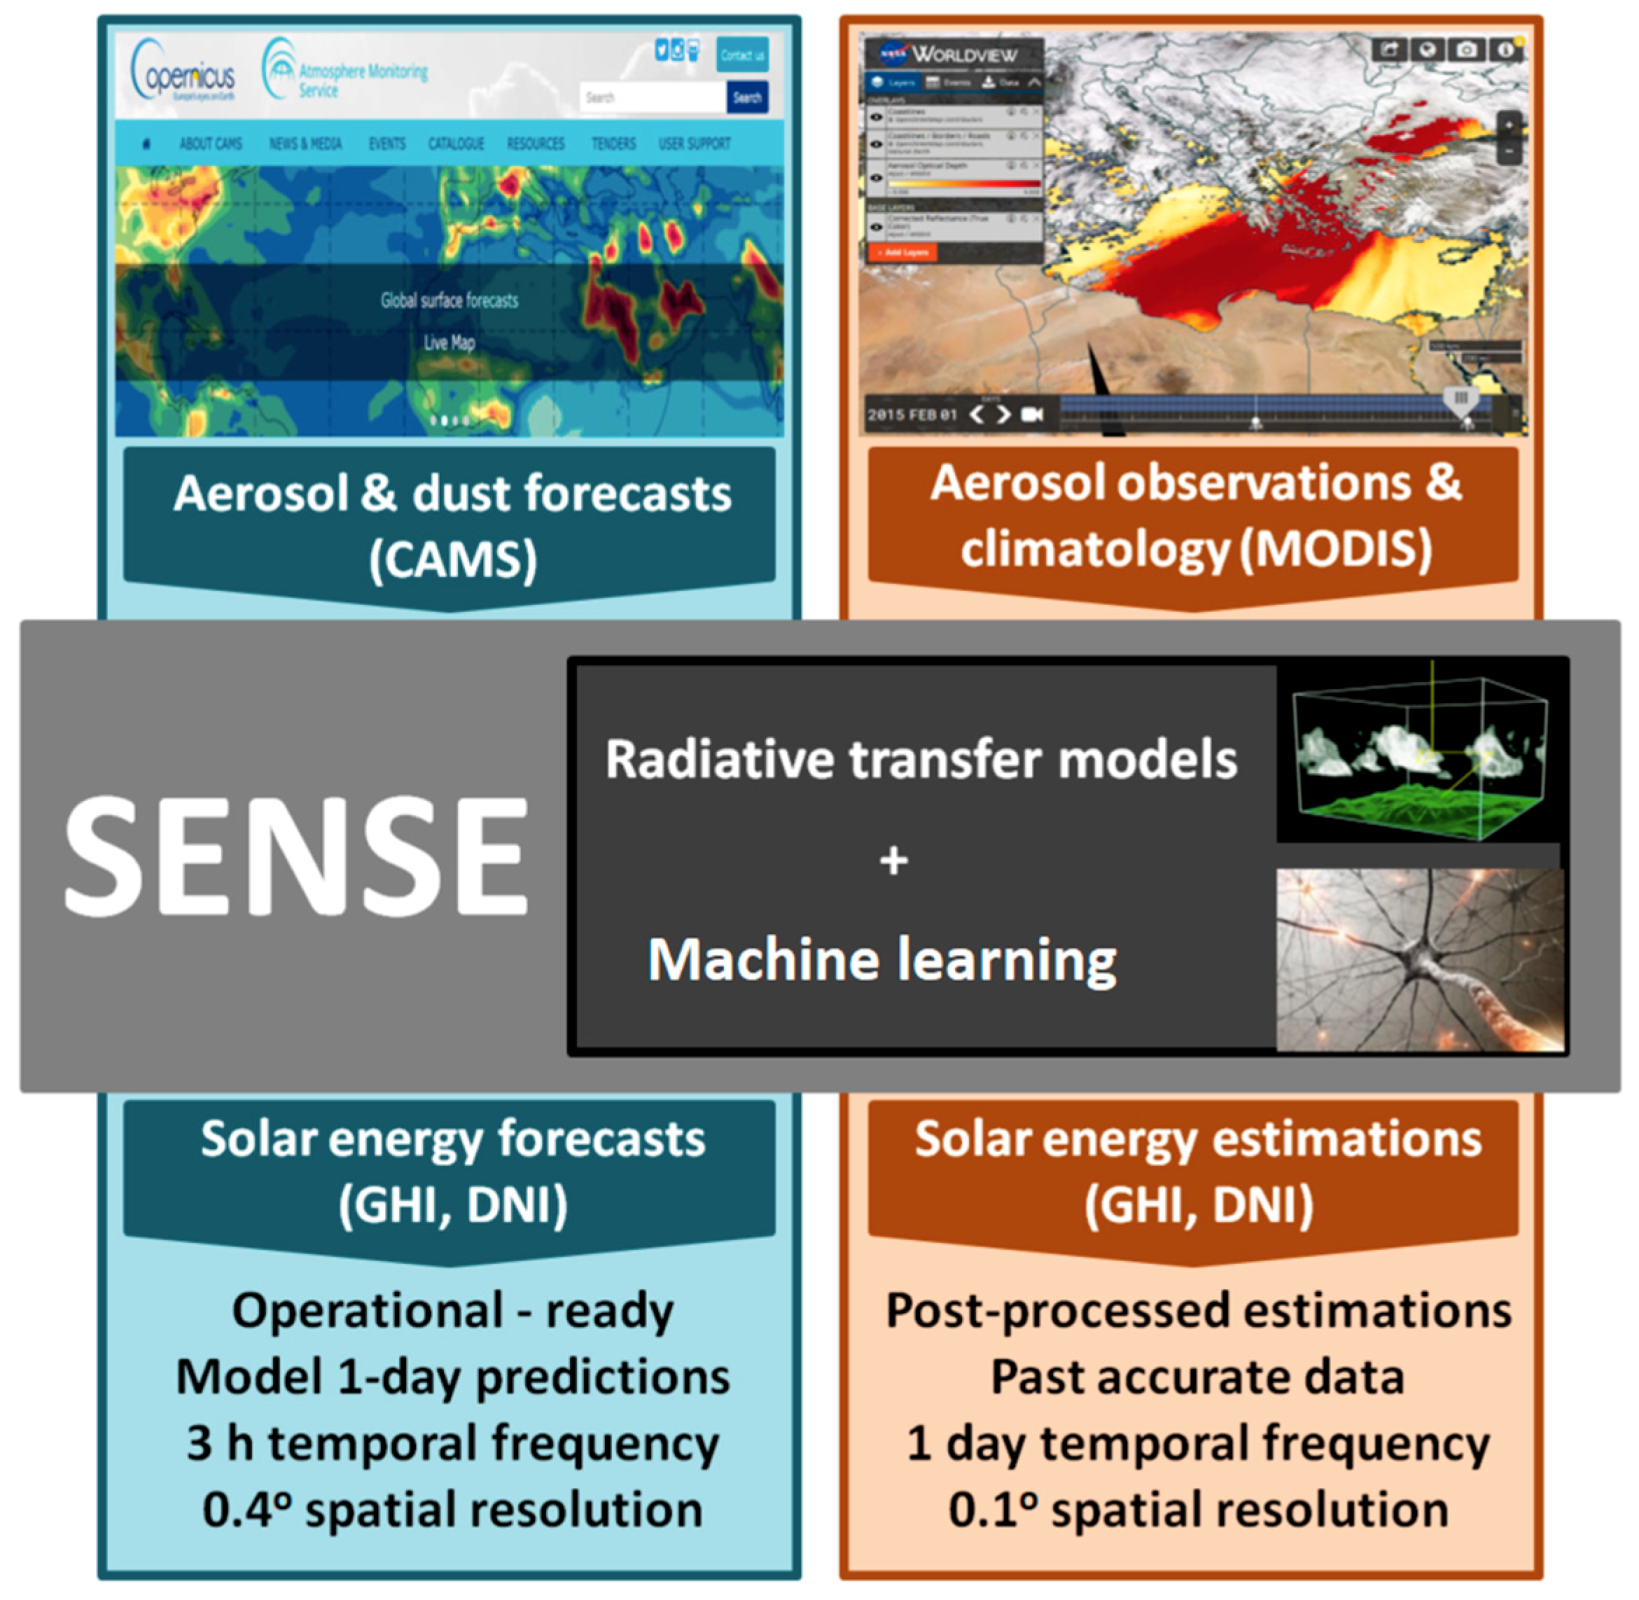
| SENSE | Solar Energy Nowcasting SystEm |
| SSA | Single Scattering Albedo |
| SSR | Surface Solar Radiation |
| SZA | Solar Zenith Angle |
| TOC | Total Ozone Column |
| TSO | Transmission System Operator |
| WV | Columnar Water Vapor |
References
- Solangi, K.H.; Islam, M.R.; Saidur, R.; Rahim, N.A.; Fayaz, H. A review on Global Solar Energy Policy. Renew. Sustain. Energy Rev. 2011, 15, 2149–2163. [Google Scholar] [CrossRef]
- REN21. Renewables Global Futures Report: Great Debates towards 100% Renewable Energy 2017. Available online: http://www.ren21.net/wp-content/uploads/2017/03/GFR-Full-Report-2017.pdf (accessed on 27 September 2018).
- International Energy Agency (IEA). Renewables: Analysis and Forecasts to 2022; International Energy Agency: Paris, France, 2017. [Google Scholar]
- UN. Progress towards the Sustainable Development Goals, Report of the Secretary-General 2017. Available online: http://www.un.org/ga/search/view_doc.asp? symbol=E/2017/66&Lang=E (accessed on 12 October 2018).
- Omran, M.A. Analysis of solar radiation over Egypt. Theor. Appl. Clim. 2000, 67, 225–240. [Google Scholar] [CrossRef]
- El-Sobki, M.S. Electrical sector in Egypt between challenges and opportunities—Full scale program for renewable energy in Egypt. Presented at the World Future Energy Summit, Abu Dhabi, UAE, 27 January 2015; Available online: http://www.mesia.com/wp-content/uploads/Sobki%20-%20NREA%20-%20Abu Dhabi-January%2020-2015.pdf (accessed on 12 October 2018).
- Khalil, A.; Mubarak, A.; Kaseb, S. Road map for renewable energy research and development in Egypt. J. Adv. Res. 2010, 1, 29–38. [Google Scholar] [CrossRef]
- International Renewable Energy Agency (IRENA). Renewable Energy Outlook: Egypt; International Renewable Energy Agency: Abu Dhabi, UAE, 2018; ISBN 978-92-9260-069-3. [Google Scholar]
- Middle East Solar Industry Association (MESIA). Solar Outlook Report 2018. Available online: https://www.mesia.com/ wp-content/ uploads/ 2018/ 03/ MESIA-OUTLOOK-2018-Report-7March2018.pdf (accessed on 8 November 2018).
- Nabat, P.; Somot, S.; Mallet, M.; Sevault, F.; Driouech, F.; Meloni, D.; Di Sarra, A.; Di Biagio, C.; Formenti, P.; Sicard, M.; et al. Dust aerosol radiative effects during summer 2012 simulated with a coupled regional aerosol-atmosphere-ocean model over the Mediterranean. Atmos. Chem. Phys. 2015, 15, 3303–3326. [Google Scholar] [CrossRef] [Green Version]
- Khalil, S.A.; Shaffie, A.M. Evaluation of transposition models of solar irradiance over Egypt. Renew. Sustain. Energy Rev. 2016, 66, 105–119. [Google Scholar] [CrossRef]
- Schroedter-Homscheidt, M.; Oumbe, A.; Benedetti, A.; Moncrette, J.J. Aerosols for concentrated solar electricity production forecasts: Requirement quantification and ECMWF/MACC aerosol forecast assessment. Bull. Am. Meteorol. Soc. 2013, 94, 903–914. [Google Scholar] [CrossRef]
- Maghami, M.R.; Hizam, H.; Gomes, C.; Radzi, M.A.; Rezadad, I.; Hajighorbani, S. Power loss due to soiling on solar panel: A review. Renew. Sustain. Energy Rev. 2016, 59, 1307–1316. [Google Scholar] [CrossRef]
- Rieger, D.; Steiner, A.; Bachmann, V.; Gasch, P.; Forstner, J.; Deetz, K.; Vogel, B.; Vogel, H. Impact of the 4 April 2014 Saharan dust outbreak on the photovoltaic power generation in Germany. Atmos. Chem. Phys. 2017, 17, 13391–13415. [Google Scholar] [CrossRef] [Green Version]
- Kosmopoulos, P.G.; Kazadzis, S.; Taylor, M.; Athanasopoulou, E.; Speyer, O.; Raptis, P.I.; Marinou, E.; Proestakis, E.; Solomos, S.; Gerasopoulos, E.; et al. Dust impact on surface solar irradiance assessed with model simulations, satellite observations and ground-based measurements. Atmos. Meas. Tech. 2017, 10, 2435–2453. [Google Scholar] [CrossRef] [Green Version]
- Neher, I.; Buchmann, T.; Crewell, S.; Evers-Dietze, B.; Pfeilsticker, K.; Pospichal, B.; Schirrmeister, C.; Meilinger, S. Impact of atmospheric aerosols on photovoltaic energy production Scenario for the Sahel zone. Energy Procedia 2017, 125, 170–179. [Google Scholar] [CrossRef]
- El-Askary, H.; Sarkar, S.; Kafatos, M.; El-Gahzawi, T. A multi-sensor approach to dust storm monitoring over the Nile Delta. IEEE Trans. Geosc. Remote Sens. 2003, 41, 2386–2391. [Google Scholar] [CrossRef]
- El-Askary, H.; Farouk, R.; Ichoku, C.; Kafatos, M. Transport of dust and anthropogenic aerosol across Alexandria, Egypt. Ann. Geophys. 2009, 27, 2869–2879. [Google Scholar] [CrossRef]
- Prasad, A.K.; El-Askary, H.; Kafatos, M. High altitude dust transport over Nile Delta during biomass burning season. Environ. Pollut. 2010, 158, 3385–3391. [Google Scholar] [CrossRef] [PubMed]
- Marey, H.S.; Gille, J.C.; El-Askary, H.; Shalaby, E.A.; El-Raey, M.E. Aerosol climatology over Nile Delta based on MODIS, MISR and OMI satellite data. Atmos. Chem. Phys. 2011, 11, 10637–10648. [Google Scholar] [CrossRef] [Green Version]
- Cowie, S.M.; Knippertz, P.; Marsham, H. A climatology of dust emission events from northern Africa using long-term surface observations. Atmos. Chem. Phys. 2014, 14, 8579–8597. [Google Scholar] [CrossRef]
- Shokr, M.; El-Tahan, M.; Ibrahim, A.; Steiner, A.; Gad, N. Long-term, high-resolution survey of atmospheric aerosols over Egypt with NASA’s MODIS data. Remote. Sens. 2017, 9, 1027. [Google Scholar] [CrossRef]
- IPCC. Climate Change: The Physical Science Basis; Contribution of Working Group I to the Fifth Assessment Report of the Intergovernmental Panel on Climate Change; Stocker, T.F., Qin, D., Plattner, G.K., Tignor, M., Allen, S.K., Boschung, J., Nauels, A., Xia, Y., Bex, V., Midgley, P.M., Eds.; Cambridge University Press: Cambridge, UK; New York, NY, USA, 2013. [Google Scholar] [CrossRef]
- World Meteorological Organization (WMO). Global Atmospheric Watch (GAW) Aerosol Measurement Procedures, Guidelines and Recommendations, 2nd ed.; GAW Report No. 227; World Meteorological Organization: Geneva, Switzerland, 2016. [Google Scholar]
- Li, X.; Wagner, F.; Peng, W.; Yang, J.; Mauzerall, D.L. Reduction of solar photovoltaic resources due to air pollution in China. Proc. Natl. Acad. Sci. USA 2017, 2017, 11462. [Google Scholar] [CrossRef] [PubMed]
- Gerard, H.; Puente, E.I.R.; Six, D. Coordination between transmission and distribution system operators in the electricity sector: A conceptual framework. Util. Policy 2018, 50, 40–48. [Google Scholar] [CrossRef]
- Haywood, J.M.; Allan, R.P.; Culverwell, I.; Slingo, T.; Milton, S.; Edwards, J.; Clerbaux, N. Can desert dust explain the outgoing longwave radiation anomaly over the Sahara during July 2003? J. Geoph. Res. 2005, 110, D05105. [Google Scholar] [CrossRef]
- Rodwell, M.J.; Jung, T. Understanding the local and global impacts of model physics changes: An aerosol example. Q. J. R. Meteorol. Soc. 2008, 134, 1479–1497. [Google Scholar] [CrossRef]
- Benedetti, A.; Reid, J.S.; Knippertz, P.; Marsham, J.H.; Di Giuseppe, F.; Remy, S.; Basart, S.; Boucher, O.; Brooks, I.M.; Menut, L.; et al. Status and future of numerical atmospheric aerosol prediction with a focus on data requirements. Atmos. Chem. Phys. 2018, 18, 10615–10643. [Google Scholar] [CrossRef]
- Takenaka, H.; Nakajima, T.Y. Estimation of solar radiation using a neural network based on radiative transfer. J. Geophys. Res. 2011, 116, D08215. [Google Scholar] [CrossRef]
- Inman, R.H.; Pedro, H.T.C.; Coimbra, C.F.M. Solar forecasting methods for renewable energy integration. Prog. Energy Combust. Sci. 2013, 39, 535–576. [Google Scholar] [CrossRef]
- Lefevre, M.; Oumbe, A.; Blanc, P.; Espinar, B.; Gschwind, B.; Qu, Z.; Wald, L.; Schroedter-Homscheidt, M.; Hoyer-Klick, C.; Arola, A.; et al. McClear: A new model estimating downwelling solar radiation at ground level in clear-sky conditions. Atmos. Meas. Tech. 2013, 6, 2403–2418. [Google Scholar] [CrossRef] [Green Version]
- Kosmopoulos, P.G.; Kazadzis, S.; Lagouvardos, K.; Kotroni, V.; Bais, A. Solar energy prediction and verification using operational model forecasts and ground-based solar measurements. Energy 2015, 93, 1918–1930. [Google Scholar] [CrossRef]
- Kosmopoulos, P.G.; Kazadzis, S.; Taylor, M.; Raptis, P.I.; Keramitsoglou, I.; Kiranoudis, C.; Bais, A.F. Assessment of the surface solar irradiance derived from real-time modelling techniques and verification with ground-based measurements. Atmos. Meas. Tech. 2018, 11, 907–924. [Google Scholar] [CrossRef]
- Qu, Z.; Oumbe, A.; Blanc, P.; Espinar, B.; Gesell, G.; Gschwind, B.; Gschwind, B.; Kluser, L.; Lenevre, M.; Sabonet, L.; et al. Fast radiative transfer parameterisation for assessing the surface solar irradiance: The Heliosat-4 method. Energy Meteorol. 2017, 26, 33–57. [Google Scholar] [CrossRef]
- Allen, R.J.; Norris, J.R.; Wild, M. Evaluation of multidecadal variability in CMIP5 surface solar radiation and inferred underestimation of aerosol direct effects over Europe, China, Japan, and India. J. Geophys. Res. Atmos. 2013, 118, 6311–6336. [Google Scholar] [CrossRef] [Green Version]
- Ishii, T.; Otani, K.; Takashima, T.; Xue, Y. Solar spectral influence on the performance of photovoltaic (PV) modules under fine weather and cloudy weather conditions. Prog. Photovolt. Res. Appl. 2013, 21, 481–489. [Google Scholar] [CrossRef]
- Dirnberger, D.; Blackburn, G.; Müller, B.; Reise, C. On the impact of solar spectral irradiance on the yield of different PV technologies. Sol. Energy Mater. Sol. Cells 2015, 132, 431–442. [Google Scholar] [CrossRef]
- El-Metwally, M. Simple new methods to estimate global solar radiation based on meteorological data in Egypt. Atmos. Res. 2004, 69, 217–239. [Google Scholar] [CrossRef]
- El-Metwally, M.; Alfaro, S.C.; Abdel Wahab, M.M.; Favez, O.; Mohamed, Z.; Chatenet, B. Aerosol properties and associated radiative effects over Cairo (Egypt). Atmos. Res. 2011, 99, 263–276. [Google Scholar] [CrossRef]
- El-Metwally, M.; Alfaro, S.C. Correlation between meteorological conditions and aerosol characteristics at an East-Mediterranean coastal site. Atmos. Res. 2013, 132–133, 76–90. [Google Scholar] [CrossRef]
- Eissa, Y.; Korany, M.; Aoun, Y.; Boraiy, M.; Abdel-Wahab, M.M.; Alfaro, S.C.; Blanc, P.; El-Metwally, M.; Ghedira, H.; Hungershoefer, K.; et al. Validation of the surface downwelling solar irradiance estimates of the HelioClim-3 database in Egypt. Remote. Sens. 2015, 7, 9269–9291. [Google Scholar] [CrossRef] [Green Version]
- Dee, D.P.; Uppala, S. Variational bias correction of satellite radiance data in the ERA-Interim reanalysis. Q. J. R. Meteorol. Soc. 2009, 135, 1830–1841. [Google Scholar] [CrossRef] [Green Version]
- Inness, A.; Baier, F.; Benedetti, A.; Bouarar, I.; Chabrillat, S.; Clark, H.; Clerbaux, C.; Coheur, P.; Engelen, R.J.; Errera, Q.; et al. The MACC reanalysis: An 8 yr data set of atmospheric composition. Atmos. Chem. Phys. 2013, 13, 4073–4109. [Google Scholar] [CrossRef] [Green Version]
- Penning de Vries, M.J.M.; Beirle, S.; Hormann, C.; Kaiser, J.W.; Stammes, P.; Tilstra, L.G.; Tuinder, O.N.E.; Wagner, T. A global aerosol classification algorithm incorporating multiple satellite data sets of aerosol and trace gas abundances. Atmos. Chem. Phys. 2015, 15, 10597–10618. [Google Scholar] [CrossRef]
- Eskes, H.; Huijnen, V.; Arola, A.; Benedictow, A.; Blechschmidt, A.M.; Botek, E.; Boucher, O.; Bouarar, I.; Chabrillat, S.; Cuevas, E.; et al. Validation of reactive gases and aerosols in the MACC global analysis and forecast system. Geosci. Model Dev. 2015, 8, 3523–3543. [Google Scholar] [CrossRef] [Green Version]
- Boucher, O.; Pham, M.; Venkataraman, C. Simulation of the Atmospheric Sulfur Cycle in the LMD GCM: Model Description, Model Evaluation, and Global and European Budgets; Note 23; Inst. Pierre-Simon Laplace: Paris, France, 2002. [Google Scholar]
- Reddy, M.S.; Boucher, O.; Bellouin, N.; Schulz, M.; Balkanski, Y.; Dufresne, J.L.; Pham, M. Estimates of global multi-component aerosol optical depth and direct radiative perturbation in the Laboratoire de Météorologie Dynamique general circulation model. J. Geophys. Res. 2005, 110, D10S16. [Google Scholar] [CrossRef]
- Huijnen, V.; Eskes, H.J.; Basart, S.; Benedictow, A.; Blechschmidt, A.M.; Chabrillat, S.; Christophe, Y.; Cuevas, E.; Flentje, H.; Jones, L.; et al. Validation Report of the CAMS Near-Real-Time Global Atmospheric Composition Service. System Evolution and Performance Statistics. Copernicus Atmosphere Monitoring Service (CAMS) Report 2015, CAMS84_1_D1.1_201512. Available online: https://atmosphere.copernicus.eu/sites/default/files/repository/CAMS84_1_D1.1_201512_0.pdf (accessed on 8 November 2018).
- Dentener, F.; Kinne, S.; Bond, T.; Boucher, O.; Cofala, J.; Generoso, S.; Ginoux, P.; Gong, S.; Hoelzemann, J.J.; Ito, A.; et al. Emissions of primary aerosol and precursor gases in the years 2000 and 1750 prescribed data-sets for AeroCom. Atmos. Chem. Phys. 2006, 6, 4321–4344. [Google Scholar] [CrossRef] [Green Version]
- Guelle, W.; Schulz, M.; Balkanski, Y.; Dentener, F. Influence of the source formulation on modeling the atmospheric global distribution of the sea salt aerosol. J. Geophys. Res. 2001, 106, 27509–27524. [Google Scholar] [CrossRef]
- Schulz, M.; de Leeuw, G.; Balkanski, Y. Sea-salt aerosol source functions and emissions. In Emission of Atmospheric Trace Compounds; Granier, C., Artaxo, P., Reeves, C.E., Eds.; Kluwer Acad.: Norwell, MA, USA, 2004; pp. 333–354. [Google Scholar]
- Morcrette, J.J.; Beljaars, A.; Benedetti, A.; Jones, L.; Boucher, O. Sea-salt and dust aerosols in the ECMWF IFS model. Geophys. Res. Lett. 2008, 35, L24813. [Google Scholar] [CrossRef]
- Levy, R.C.; Remer, L.A.; Dubovik, O. Global aerosol optical properties and application to Moderate Resolution Imaging Spectroradiometer aerosol retrieval over land. J. Geophys. Res. Atmos. 2007, 112, D13210. [Google Scholar] [CrossRef]
- Levy, R.C.; Remer, L.A.; Kleidman, R.G.; Mattoo, S.; Ichoku, C.; Kahn, R.; Eck, T.F. Global evaluation of the Collection 5 MODIS dark-target aerosol products over land. Atmos. Chem. Phys. 2010, 10, 10399–10420. [Google Scholar] [CrossRef] [Green Version]
- Remer, L.A.; Kaufman, Y.J.; Tanre, D.; Mattoo, S.; Chu, D.A.; Martins, J.V.; Li, R.R.; Ichoku, C.; Levy, R.C.; Kleidman, R.G.; et al. The MODIS aerosol algorithm, products, and validation. J. Atmos. Sci. 2005, 62, 947–973. [Google Scholar] [CrossRef]
- Remer, L.A.; Kleidman, R.G.; Levy, R.C.; Kaufman, Y.J.; Tanré, D.; Mattoo, S.; Martins, J.V.; Ichoku, C.; Koren, I.; Yu, H.; et al. Global aerosol climatology from the MODIS satellite sensors. J. Geophys. Res. Atmos. 2008, 113, D14S07. [Google Scholar] [CrossRef]
- Hsu, N.C.; Jeong, M.J.; Bettenhausen, C.; Sayer, A.M.; Hansell, R.; Seftor, C.S.; Huang, J.; Tsay, S.C. Enhanced Deep Blue aerosol retrieval algorithm: The second generation. J. Geophys. Res. 2013, 118, 9296–9315. [Google Scholar] [CrossRef] [Green Version]
- Levy, R.C.; Mattoo, S.; Munchak, L.A.; Remer, L.A.; Sayer, A.M.; Patadia, F.; Hsu, N.C. The Collection 6 MODIS aerosol products over land and ocean. Atmos. Meas. Tech. 2013, 6, 2989–3034. [Google Scholar] [CrossRef] [Green Version]
- Sayer, A.M.; Munchak, L.A.; Hsu, N.C.; Levy, R.C.; Bettenhausen, C.; Jeong, M.J. MODIS Collection 6 aerosol products: Comparison between Aqua’s e-Deep Blue, Dark Target, and “merged” data sets, and usage recommendations. J. Geophys. Res. Atmos. 2014, 119, 13965–13989. [Google Scholar] [CrossRef]
- Hubanks, P.A.; Platnick, S.; King, M.D.; Ridgway, B. MODIS Atmosphere L3 Gridded Product Algorithm Theoretical Basis Document & Users Guide; ATBD Reference Number: ATBD-MOD-30; MODIS Atmosphere Documents 2016; Available online: https://modis-images.gsfc.nasa.gov/index.html or https://modis-images. gsfc.nasa.gov/_docs/L3_ATBD_C6.pdf; (accessed on 22 October 2018).
- Sayer, A.M.; Hsu, N.C.; Bettenhausen, C.; Jeong, M.J. Validation and uncertainty estimates for MODIS Collection 6 “Depp Blue” aerosol data. J. Geophys. Res. 2013, 118, 7864–7873. [Google Scholar] [CrossRef]
- Mayer, B.; Kylling, A. Technical note: The libRadtran software package for radiative transfer calculations—Description and examples of use. Atmos. Chem. Phys. 2005, 5, 1855–1877. [Google Scholar] [CrossRef]
- Emde, C.; Buras-Schnell, R.; Kylling, A.; Mayer, B.; Gasteiger, J.; Hamann, U.; Kylling, J.; Richter, B.; Pause, C.; Dowling, T.; et al. The libRadtran software package for radiative transfer calculations (version 2.0.1). Geosci. Model Dev. 2016, 9, 1647–1672. [Google Scholar] [CrossRef] [Green Version]
- Dahlback, A.; Stamnes, K. A new spherical model for computing the radiation field available for photolysis and heating at twilight. Planet Space Sci. 1991, 39, 671–683. [Google Scholar] [CrossRef]
- Taylor, M.; Kosmopoulos, P.G.; Kazadzis, S.; Keramitsoglou, I.; Kiranoudis, C.T. Neural network radiative transfer solvers for the generation of high resolution solar irradiance spectra parameterized by cloud and aerosol parameters. J. Quant. Spectr. Radiat. Transf. 2015, 168, 176–192. [Google Scholar] [CrossRef]
- Hornik, K.; Stinchcombe, M.; White, H. Multilayer Feedforward Networks Are Universal Approximators. Neural Netw. 1989, 2, 359–366. [Google Scholar] [CrossRef]
- Taylor, M.; Kazadzis, S.; Tsekeri, A.; Gkikas, A.; Amiridis, V. Satellite retrieval of aerosol microphysical and optical parameters using neural networks: A new methodology applied to the Sahara desert dust peak. Atmos. Meas. Tech. 2014, 7, 3151–3175. [Google Scholar] [CrossRef] [Green Version]
- Shettle, E.P. Models of aerosols, clouds and precipitation for atmospheric propagation studies. In Proceedings of the AGARD Conference 454 on Atmospheric Propagation in the UV, Visible, IR and MM-Region and Related System Aspects, Copenhagen, Denmark, 9–13 October 1989; Available online: http://www.dtic.mil/dtic/tr/fulltext/u2/a221594.pdf (accessed on 8 November 2018).
- Hess, M.; Koepke, P.; Schult, I. Optical Properties of Aerosols and Clouds: The Software Package OPAC. Bull. Am. Meteor. Soc. 1998, 79, 831–844. [Google Scholar] [CrossRef] [Green Version]
- Kato, S.; Ackerman, T.; Mather, J.; Clothiaux, E. The k-distribution method and correlated-k approxiamation for shortwave radiative transfer model. J. Quant. Spectrosc. Radiat. Transf. 1999, 62, 109–121. [Google Scholar] [CrossRef]
- Kinne, S.; Schulz, M.; Textor, C.; Guibert, S.; Balkanski, Y.; Bauer, S.E.; Berntsen, T.; Berglen, T.F.; Boucher, O.; Chin, M.; et al. An AeroCom initial assessment—Optical properties in aerosol component modules of global models. Atmos. Chem. Phys. 2006, 6, 1815–1834. [Google Scholar] [CrossRef]
- Kumar, S.; Devara, P.C.S. Along-term study of aerosol modulation of atmospheric and surface solar heating over Pune, India. Tellus B Chem. Phys. Meteorol. 2012, 64, 18420. [Google Scholar] [CrossRef]
- Eskes, H.J.; Douros, J.; Akritidis, D.; Antonakaki, T.; Blechschmidt, A.M.; Clark, H.; Gielen, C.; Hendrick, F.; Kapsomenakis, J.; Kartsios, S.; et al. Validation of CAMS Regional Services: Concentrations Above the Surface, Status Update for March–May 2017. Copernicus Atmosphere Monitoring Service (CAMS) Report 2017. Available online: https://atmosphere.copernicus.eu/sites/default/files/2018-08/CAMS84_2015SC2_ D84.5.1.8_D84.6.1.3_2017MAM_v1.pdf (accessed on 12 October 2018).
- PVGIS. Photovoltaic Geographical Information System. Available online: http://re.jrc.ec.europa.eu/pvgis/ (accessed on 12 October 2018).
- Eck, M.; Hirsch, T.; Feldhoff, J.F.; Kretschmann, D.; Dersch, J.; Gavilan Morales, A.; Gonzales-Martinez, L.; Bachelier, C.; Platzer, W.; Riffelmann, K.J.; et al. Guidelines for CSP yield analysis—Optical losses of line focusing systems; definitions, sensitivity analysis and modeling approaches. Energy Procedia 2014, 49, 1318–1327. [Google Scholar] [CrossRef]
- Ouali, H.A.L.; Merrouni, A.A.; Moussaoui, M.A.; Mezrhab, A. Electricity yield analysis of a 50 MW solar power plant under Moroccan climate. In Proceedings of the International Conference on Electrical and Information Technologies (ICEIT) 2015, Marrakech, Morocco, 25–27 March 2015. [Google Scholar] [CrossRef]
- El-Metwally, M.; Alfaro, S.C.; Abdel Wahab, M.M.; Zakey, A.S.; Chatenet, B. Seasonal and inter-annual variability of the aerosol content in Cairo (Egypt) as deduced from the comparison of MODIS aerosol retrievals with direct AERONET measurements. Atmos. Res. 2010, 97, 14–25. [Google Scholar] [CrossRef]
- Robaa, S.M. A study of solar radiation climate at Cairo urban area, Egypt and its environs. Int. J. Clim. 2006, 26, 1913–1928. [Google Scholar] [CrossRef] [Green Version]
- Kohil, E.E.; Saleh, I.H.; Ghatass, Z.F. A study of atmospheric aerosol optical properties over Alexandria city—Egypt. J. Phys. Conf. Ser. 2017, 810, 012033. [Google Scholar] [CrossRef]
- Bellouin, N.; Boucher, O.; Haywood, J.; Reddy, M.S. Global estimate of aerosol direct radiative forcing from satellite measurements. Nature 2005, 7071, 1138–1141. [Google Scholar] [CrossRef] [PubMed]
- Lee, L.A.; Reddington, C.L.; Carslaw, K.S. On the relationship between aerosol model uncertainty and radiative forcing uncertainty. Proc. Natl. Acad. Sci. USA 2016, 113, 5820–5827. [Google Scholar] [CrossRef] [PubMed] [Green Version]
- IRENA. Renewable Power Generation Costs in 2014, Report 2015. Available online: http://www.irena.org/-/media/Files/IRENA/Agency/Publication/2015/IRENA_RE_Power_Costs_ 2014_report.pdf (accessed on 9 November 2018).
- Haney, J.; Burstein, A. PV System Operations and Maintenance Fundamentals. Solar America Board for Codes and Standards Report 2013. Available online: http://www.solarabcs.org/about/publications/ reports/operations-maintenance/pdfs/SolarABCs-35-2013.pdf (accessed on 12 November 2018).
- IRENA. Renewable Energy Integration in Power Grids 2015, IEA-ETSAP and IRENA Technology Brief E15. Available online: http://www.irena.org/DocumentDownloads/Publications/IRENA-ETSAP_Tech_ Brief_Power_Grid_Integration_2015.pdf (accessed on 7 August 2018).
- Evenflow SPRL. Business Plan for the Establishment, Operation and Exploitation of a Solar Farm: Aswan’s Solar Plant Project, Report 2017. Available online: http://solea.gr/wp-content/uploads/2018/03/ Aswan-Solar-Plant-Business-Plan.pdf (accessed on 11 November 2018).
- MOEE. Ministry of Electricity and Renewable Energy of Egypt. Electricity Pricelist 2017–2018. Available online: http://www.moee.gov.eg/english_new/home.aspx (accessed on 10 November 2018).


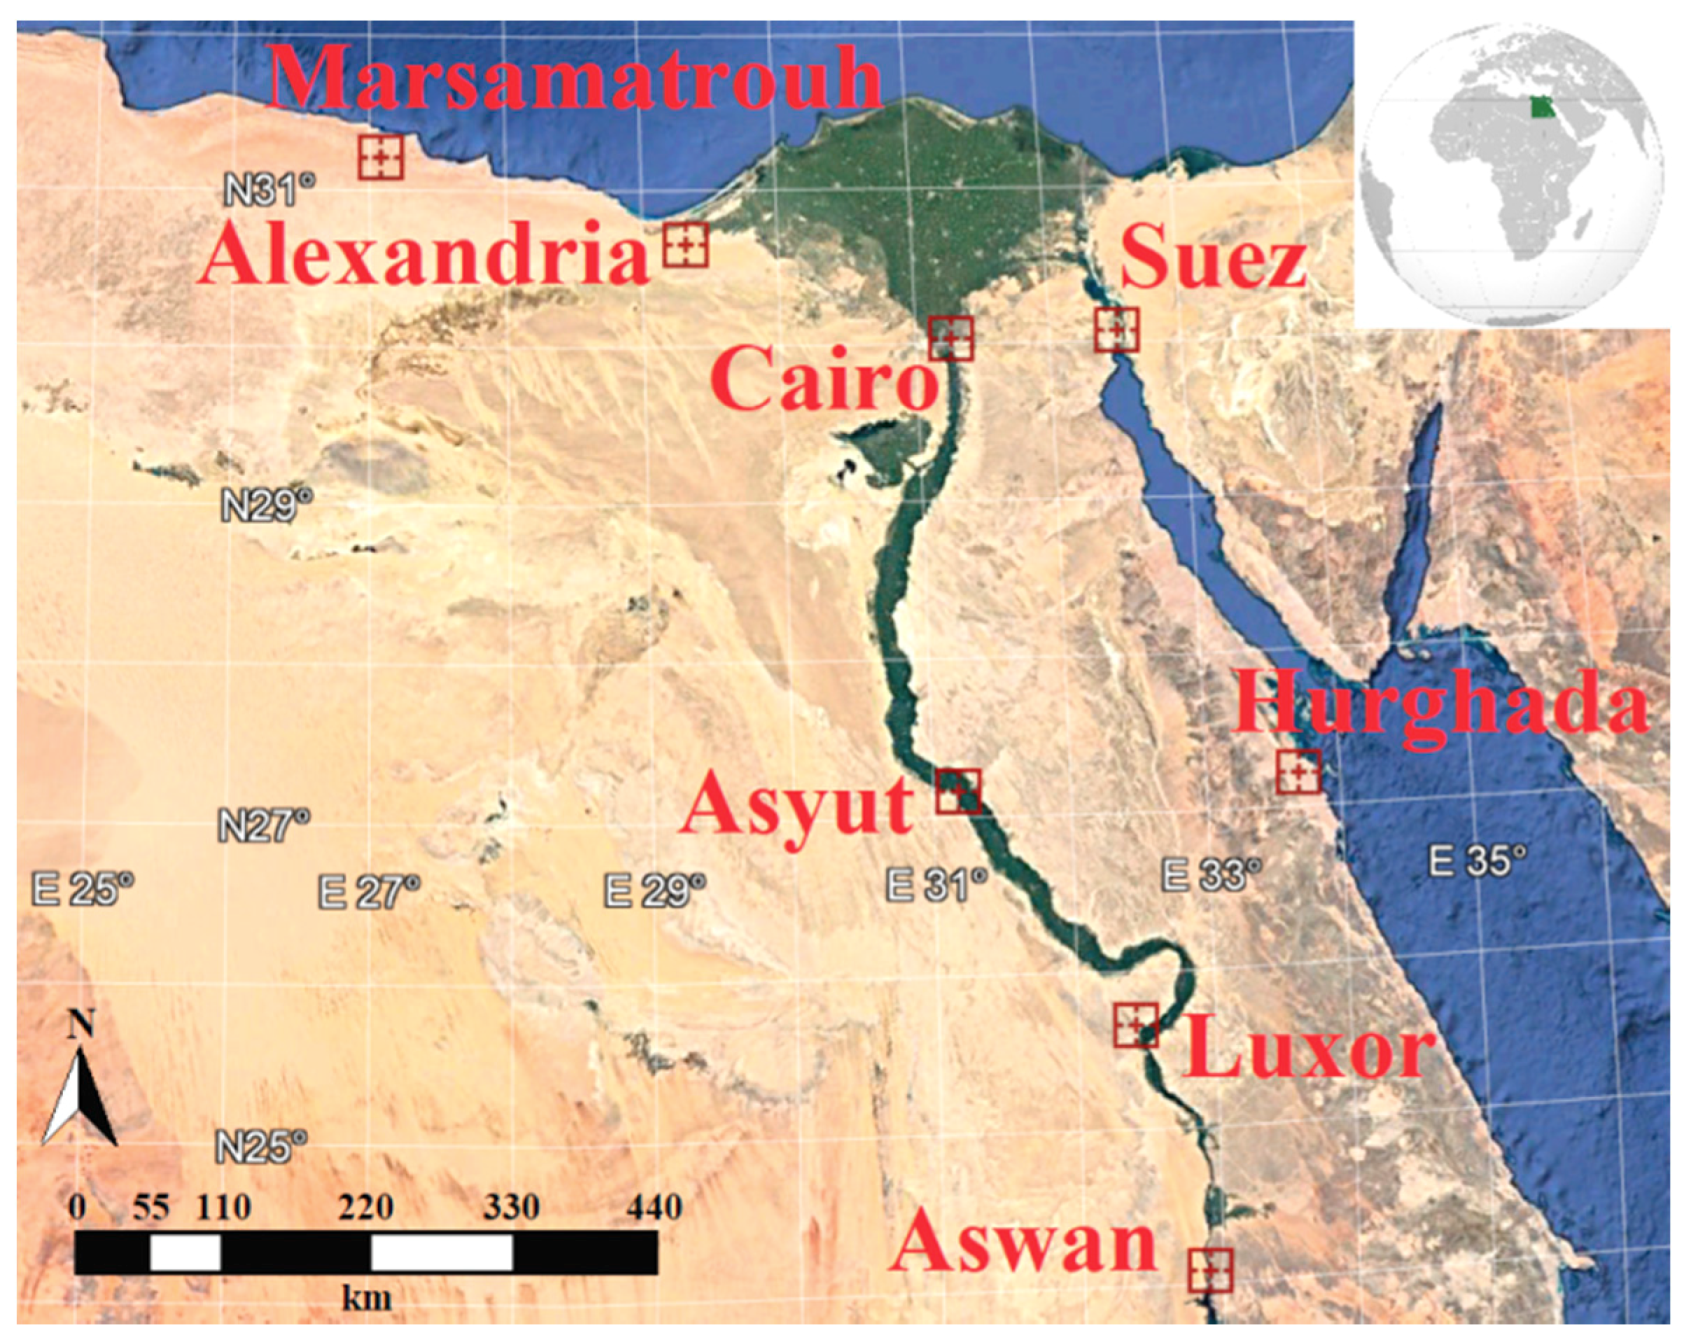
| Location | Population | Code | Latitude | Longitude | Height (m.a.s.l.) |
|---|---|---|---|---|---|
| Alexandria | 5,172,000 | ALE | 31.2001 | 29.9187 | 12 |
| Cairo | 9,153,000 | CAI | 30.0444 | 31.2357 | 75 |
| Suez | 744,000 | SUE | 29.9668 | 32.5498 | 5 |
| Hurghada | 288,000 | HUR | 27.2579 | 33.8116 | 14 |
| Aswan | 290,000 | ASW | 24.0889 | 32.8998 | 194 |
| Luxor | 507,000 | LUX | 25.6872 | 32.6396 | 76 |
| Marsamatrouh | 448,000 | MAR | 31.3543 | 27.2373 | 30 |
| Asyut | 4,123,000 | ASY | 27.1783 | 31.1859 | 70 |
© 2018 by the authors. Licensee MDPI, Basel, Switzerland. This article is an open access article distributed under the terms and conditions of the Creative Commons Attribution (CC BY) license (http://creativecommons.org/licenses/by/4.0/).
Share and Cite
Kosmopoulos, P.G.; Kazadzis, S.; El-Askary, H.; Taylor, M.; Gkikas, A.; Proestakis, E.; Kontoes, C.; El-Khayat, M.M. Earth-Observation-Based Estimation and Forecasting of Particulate Matter Impact on Solar Energy in Egypt. Remote Sens. 2018, 10, 1870. https://0-doi-org.brum.beds.ac.uk/10.3390/rs10121870
Kosmopoulos PG, Kazadzis S, El-Askary H, Taylor M, Gkikas A, Proestakis E, Kontoes C, El-Khayat MM. Earth-Observation-Based Estimation and Forecasting of Particulate Matter Impact on Solar Energy in Egypt. Remote Sensing. 2018; 10(12):1870. https://0-doi-org.brum.beds.ac.uk/10.3390/rs10121870
Chicago/Turabian StyleKosmopoulos, Panagiotis G., Stelios Kazadzis, Hesham El-Askary, Michael Taylor, Antonis Gkikas, Emmanouil Proestakis, Charalampos Kontoes, and Mohamed Mostafa El-Khayat. 2018. "Earth-Observation-Based Estimation and Forecasting of Particulate Matter Impact on Solar Energy in Egypt" Remote Sensing 10, no. 12: 1870. https://0-doi-org.brum.beds.ac.uk/10.3390/rs10121870