Investigating Subsidence in the Bursa Plain, Turkey, Using Ascending and Descending Sentinel-1 Satellite Data


1
Univ. Grenoble Alpes, Univ. Savoie Mont Blanc, CNRS, IRD, IFSTTAR, ISTerre, 38000 Grenoble, France
2
Department of Geological Engineering, Istanbul Technical University, 34469 Istanbul, Turkey
3
Université de Lyon, UCBL, ENSL, CNRS, LGL-TPE, 69622 Villeurbanne, France
4
The Njord Centre, PGP, Department of Geosciences, University of Oslo, NO-0316 Oslo, Norway
*
Author to whom correspondence should be addressed.
Remote Sens. 2019, 11(1), 85; https://0-doi-org.brum.beds.ac.uk/10.3390/rs11010085
Submission received: 29 November 2018
/
Revised: 23 December 2018
/
Accepted: 28 December 2018
/
Published: 5 January 2019
(This article belongs to the Special Issue Remote Sensing of Land Subsidence)
Abstract
:We characterize and monitor subsidence of the Bursa Plain (southern Marmara region of Turkey), which has been interpreted as resulting from tectonic motions in the region. We quantify the subsidence using Interferometric Synthetic Aperture Radar (InSAR) time-series analysis. The Stanford Method for Persistent Scatterers InSAR package (StaMPS) is employed to process series of Sentinel 1 A-B radar images acquired between 2014 and 2017 along both ascending and descending orbits. The vertical velocity field obtained after decomposition of line-of-sight velocity fields on the two tracks reveals that the Bursa plain is subsiding at rates up to 25 mm/yr. The most prominent subsidence signal in the basin forms an east-west elongated ellipse of deformation in the east, and is bounded by a Quaternary alluvial plain undergoing average vertical subsidence at ~10 mm/yr. Another localized subsidence signal is located 5 km north of the city, following the Bursa alluvial fan, and is subsiding at velocities up to 25 mm/yr. The comparison between temporal variations of the subsiding surface displacements and variations of the water pressure head in the aquifer allows estimation of the compressibility of the aquifer, . It falls in the range of Pa−1, which corresponds to typical values for clay and sand sediments. We find a clear correlation between subsidence patterns and the lithology, suggesting a strong lithological control over subsidence. In addition, the maximum rate of ground subsidence occurs where agricultural activity relies on groundwater exploitation. The InSAR time series within the observation period is well correlated with changes in the depth of the ground water. These observations indicate that the recent acceleration of subsidence is mainly due to anthropogenic activities rather than tectonic motion.
1. Introduction
Subsidence is one of the most diverse forms of ground vertical displacement, varying from local collapses to regional-scale sinking. Depending on the deformation regimes of the subsidence, vertical displacement may be associated with horizontal deformation that may have significant damaging effects. Land subsidence in the Bursa Plain in northwestern Turkey was first documented using four ALOS PALSAR (L-band) images acquired between 2007 and 2010 [1]. The authors investigated the surface deformation using the differential Interferometric Synthetic Aperture Radar (InSAR) technique and concluded that Bursa plain is subsiding at a rate of 10.9 cm/yr. They suggested that this subsidence is driven by local tectonic activity, as the Bursa basin likely corresponds to a pull-apart basin geometry, caused by strike-slip faulting. However, it is well known that subsidence may also occur due to the compaction of unconsolidated sediments that results from exploitation of groundwater [2,3,4] and due to urbanization [5,6]. It is therefore important to determine the mechanism of subsidence and its spatiotemporal characteristics because it allows the development of mitigation strategies that could minimize the risk of damage to surface structures and infrastructures [7,8,9,10].
Ground subsidence is a common phenomenon in urban areas built on thick, unconsolidated loose soil layers consisting of clay, silt, and peat formations [11,12,13], as is the case in the Bursa basin. Subsidence has been correlated to strata lithology, formation, and structure [14,15,16,17]. Dewatering of loose soil layers in which the water provides structural support produces volumetric contraction and surface subsidence [18]. Consequently, the depth of groundwater exploitation strongly controls the magnitude of land subsidence.
Since the 1960s, a considerable amount of literature has been published on land subsidence using various methods of investigations, including conventional practices and advanced ground sensing systems, depending on the spatial extent of the anticipated deformation. Data are interpreted to characterize the deformation mechanism and their environmental consequences [19]. These conventional techniques include optical leveling [20], GPS (Global Positioning System) surveys [21,22], groundwater monitoring [23], and tape-extensometers [24,25,26]. Advanced techniques include airborne and space based observtions, such as InSAR [27,28] and LiDAR [29], which can provide high-resolution imagery of the subsiding rates. InSAR is an observation technique that uses phase differences in reflected radar signals acquired at different times to detect and monitor different forms of ground deformations over wide areas (up to 400 × 400 km) with potentially high resolution and precision depending on the sensors [30,31,32,33]. Due to the development of new satellite technologies and advancing processing techniques, InSAR has been successfully used to investigate deformation resulting from subsidence due to the withdrawal of groundwater or other fluids [4,34,35,36], soil consolidation [37,38], subsurface mining or collapse of old mines [39,40], permafrost thawing [41], tectonic activity [42], and soluble earth materials [43]. Besides, InSAR has also been used to infer aquifer hydraulic properties, such as compressibility and the storage coefficient, as well as the mechanics of aquifer systems [2,4,44,45,46,47].
The present study focuses on the surface deformation associated with groundwater extraction, and its temporal evolution in the Bursa Plain to understand how surface subsidence evolves in response to the water table fluctuations and changing soil properties. We investigate this evolution by integrating SAR interferometry and geological and hydrogeological data to shed insight on the underlying processes governing subsidence. We have restricted our study to the Bursa Plain located in the east of the Bursa basin along the northern slope of the Uludag Mount (Figure 1 and Figure 2a). We use PS-InSAR time series with Sentinel-1 data acquired between 2014 and 2017. The observed subsidence signal is interpreted by comparison with spatio-temporal piezometric level variations in the aquifer, and analyzed in terms of local geological conditions. We first describe the tectonic and geological setting of the study area, and other morphological characteristics. After summarizing the Sentinel-1 SAR data used and the processing methodologies employed, we present the mean velocity fields obtained from different viewing geometries, and their vertical components. Finally, we compare vertical InSAR velocity fields with hydrological and geological data to constrain the compressibility of the underlying aquifer that compacted due to a reduction of the water level decrease. In addition, we interpret Landsat 8 optical images to better understand the relationship between subsidence and the spatial pattern of alluvial fans, bare lands, urban and agricultural areas, and other land-use patterns.
2. Study Area
Located on the northern slope of Mount Uludag (2543 m a.s.l.) in north-west Turkey, the city of Bursa is one of the most industrialized and populated cities of Turkey, with a population of 2.9 million inhabitants [48]. The Bursa plain is located 5 km to the north of the city and bordered by the Mount Uludag to the south and Mount Katirli to the north (Figure 1b). The plain has a high agricultural potential due to its rich underground aquifer and surface water resources, and its fertile soils [49]. Consequently, the plain exerts considerable impact upon Turkey’s national economy, which has led to rapid population inflow over the past few decades. This determined a rapid expansion of industrial and residential zones into the fertile Bursa plain, previously mainly for farming activities.
From a tectonic point of view, the southern branch of the North Anatolian Fault (NAF) in the Marmara region controls the long-term tectonic evolution of the Bursa basin. The segmentation of the NAF in the region results in the formation of extentional basins (with a roughly N-S extension direction), at the origin of the Bursa Plain in the eastern part of the E-W trending Bursa-Gönen Depression, named Bursa basin hereafter. This basin is bounded to the north and the south by the Bandirma-Mudanya and Uludag-Sularya mountain ranges, respectively (Figure 1b) [50]. These highlands consist of metamorphic and granitic basement rocks and are dominant morphological features along the southern branch of the NAF [51]. Tectonic models suggest that the depressed areas opened as pull-apart basins and are filled with Upper Pleistocene fluvial terrace and alluvial fan materials (Figure 2b) [50]. The alluvium has high transmissivity in comparison with the Neogene deposits surrounding the Nilufer Valley [52]
The city of Bursa is located within the area with the highest probability of strong earthquakes in Turkey (i.e., first-degree seismic hazard zone). The seismicity of the region is controlled mainly by active faults, such as the Gemlik Fault, Geyve-Iznik Fault Yenisehir Fault, Bursa Fault, and the Inonu-Eskisehir Fault Zone [53]. Bursa also hosts thermal springs that follow major fracture zones [54]. The Quaternary sediments thicken to the south and exceeds 300 m in the Bursa basin [55,56], suggesting that the deposition pattern is tectonically controlled [50].
3. Datasets and Methodology
3.1. InSAR Datasets
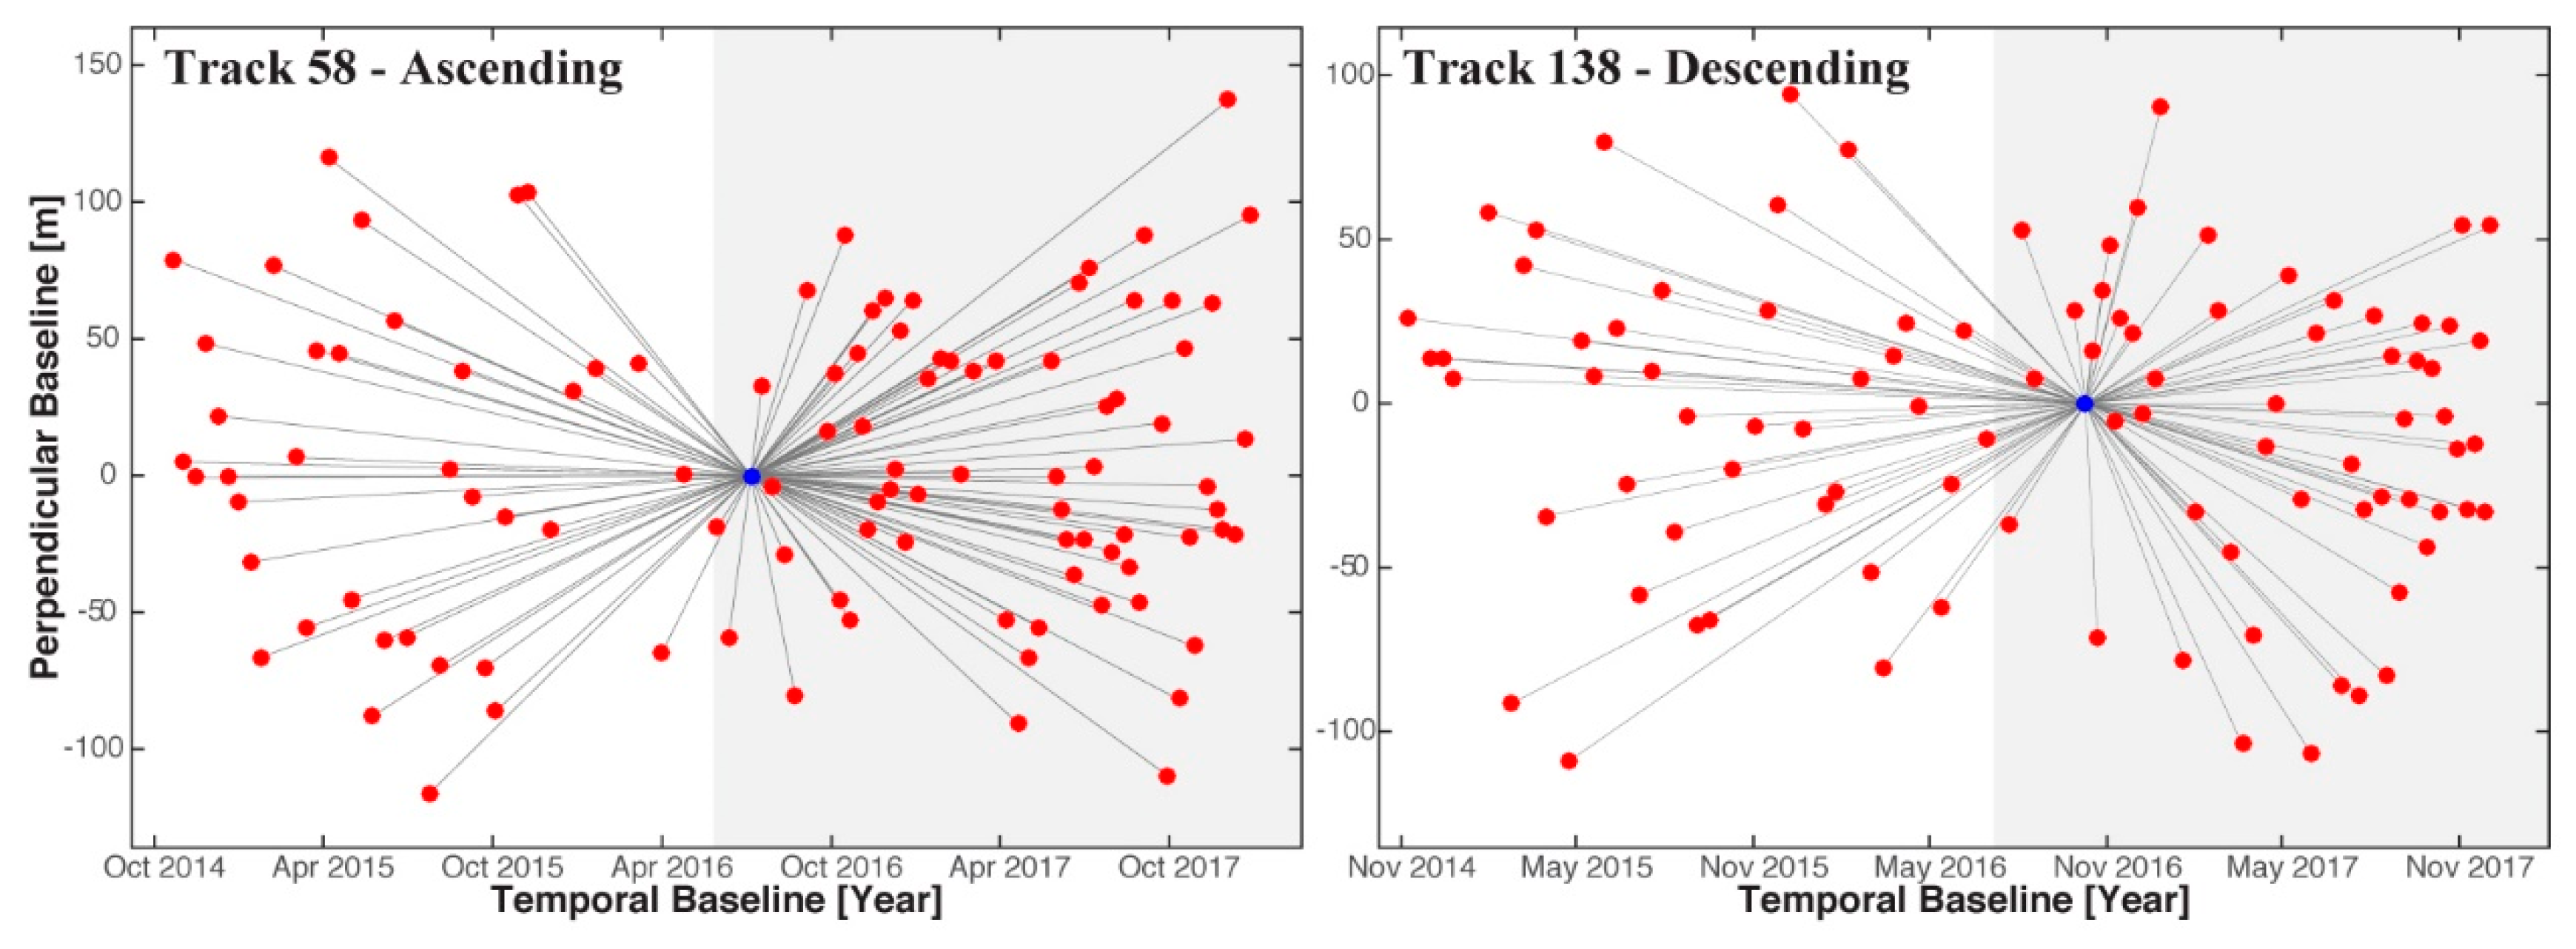
We use C-band (~6 cm wavelength) Sentinel 1 A/B TOPS images to map the spatial distribution and rate of subsidence in the Bursa Basin. The data used in the present study consist of two datasets with short temporal sampling (Figure 3). 105 images were acquired on ascending Track 58 between 21 October 2014 and 28 December 2017, and 96 images were acquired on descending Track 138 between 8 November 2014 and 4 December 2017. The study area is fully covered by all tracks (Figure 1b).
3.2. Methodology
3.2.1. PS-InSAR Processing Methodology
All interferograms were generated using the latest version of the open source (GNU General Public License) InSAR processing system called “Generic Mapping Tools Synthetic Aperture Radar (GMTSAR)” [61]. To correct the topographic contribution to the radar phase, we used the Shuttle Radar Topography Mission (SRTM) 3-arcsecond digital elevation model [62]. All interferograms were computed based on a single master network for Permanent Scatterer InSAR (PS-InSAR) analysis. The choice of the master images for both tracks (blue dots on Figure 3) minimizes the spatial and temporal baselines. The single master stacks of interferograms were processed using the software package, StaMPS [63,64]. StaMPS allows the identification of PS points, using both amplitude and phase information. In the first step, the initial selection of PS points is performed based on their noise characteristics, using amplitude analysis. The amplitude dispersion criterion is defined by , where and are the standard and mean deviation of the amplitude in time, respectively [65]. We selected a threshold value of 0.4 for , which minimizes the random amplitude variability and eliminates highly decorrelated pixels in some areas covered with vegetation, agricultural fields, or snow. Once coherent PS points have been selected based on amplitude analysis, the PS probability is refined by phase analysis in a series of iterations. This process allows the detection of stable pixels even with low amplitude. Once the final selection of PS has been done, the residual topographic component can be removed. Then, 3D unwrapping of the PS phase is performed both spatially and temporally. This analysis enables retrieval of the average Line-Of-Sight (LOS) subsidence rate maps. To remove atmospheric effects, we used the freely available Toolbox for Reducing Atmospheric InSAR Noise (TRAIN) developed by Bekaert et al. [66]. This toolbox uses ERA-Interim (ERA-I, European Center for Medium-Range Weather Forecasts) numerical weather model datasets [67].
The results obtained from the InSAR time series were compared with the groundwater level pressure head variations obtained from piezometric measurements. The water level data were collected in two wells (#58581 and #62821), whose locations are shown in Figure 2b, and used to demonstrate the correlation in time between land subsidence and the level of water in the aquifer. The piezometric heads in the study area were measured monthly during the InSAR observation time, from October 2014 to December 2017.
3.2.2. Decomposition of Sentinel-1 Data into 2D Displacement Rates
The subsidence signal in the Bursa plain is covered entirely by Sentinel-1 data from two different orbits and therefore only two different viewing geometries are available. Consequently, we can only retrieve two of the three components of the actual deformation vector. We decomposed the mean PS-InSAR line-of-sight velocity fields into east-west and vertical components. We assumed that the north-south displacement was negligible because the near polar orbits of the SAR satellites produce a low sensitivity to the north-south component of displacement [68]. In a first step, we resampled the mean line-of-sight velocities for the ascending and descending tracks onto a 100 × 100 m regular grid, which was used as input for displacement decomposition. We used a nearest neighbor procedure to resample the persistent scatterer pixels that are within 200 m of the center of each grid nodal point. In a second step, we selected all the pixels that exist in both the ascending and descending tracks. Before decomposition, we transformed the InSAR mean velocity fields of both tracks into the same reference frame using a reference area considered as a stable area (black star in Figure 2b and Figure 4). In a last step, the line-of-sight velocity fields were decomposed into two components: The horizontal component along the east-west direction () and the vertical component () were computed, considering the local incidence angle of the satellite view by solving the following equation [69]:
where and represent the local incidence angles and and are the satellite heading angles in the ascending and descending modes, respectively.
4. Results
InSAR-Derived Land Subsidence Maps
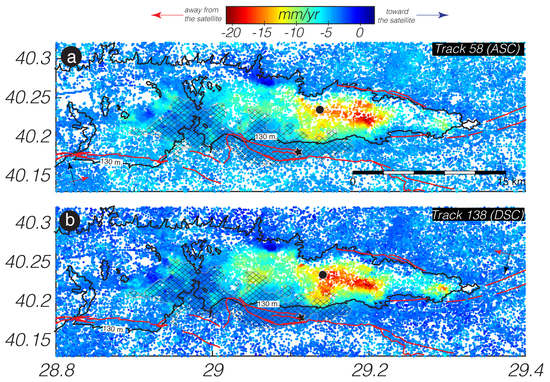
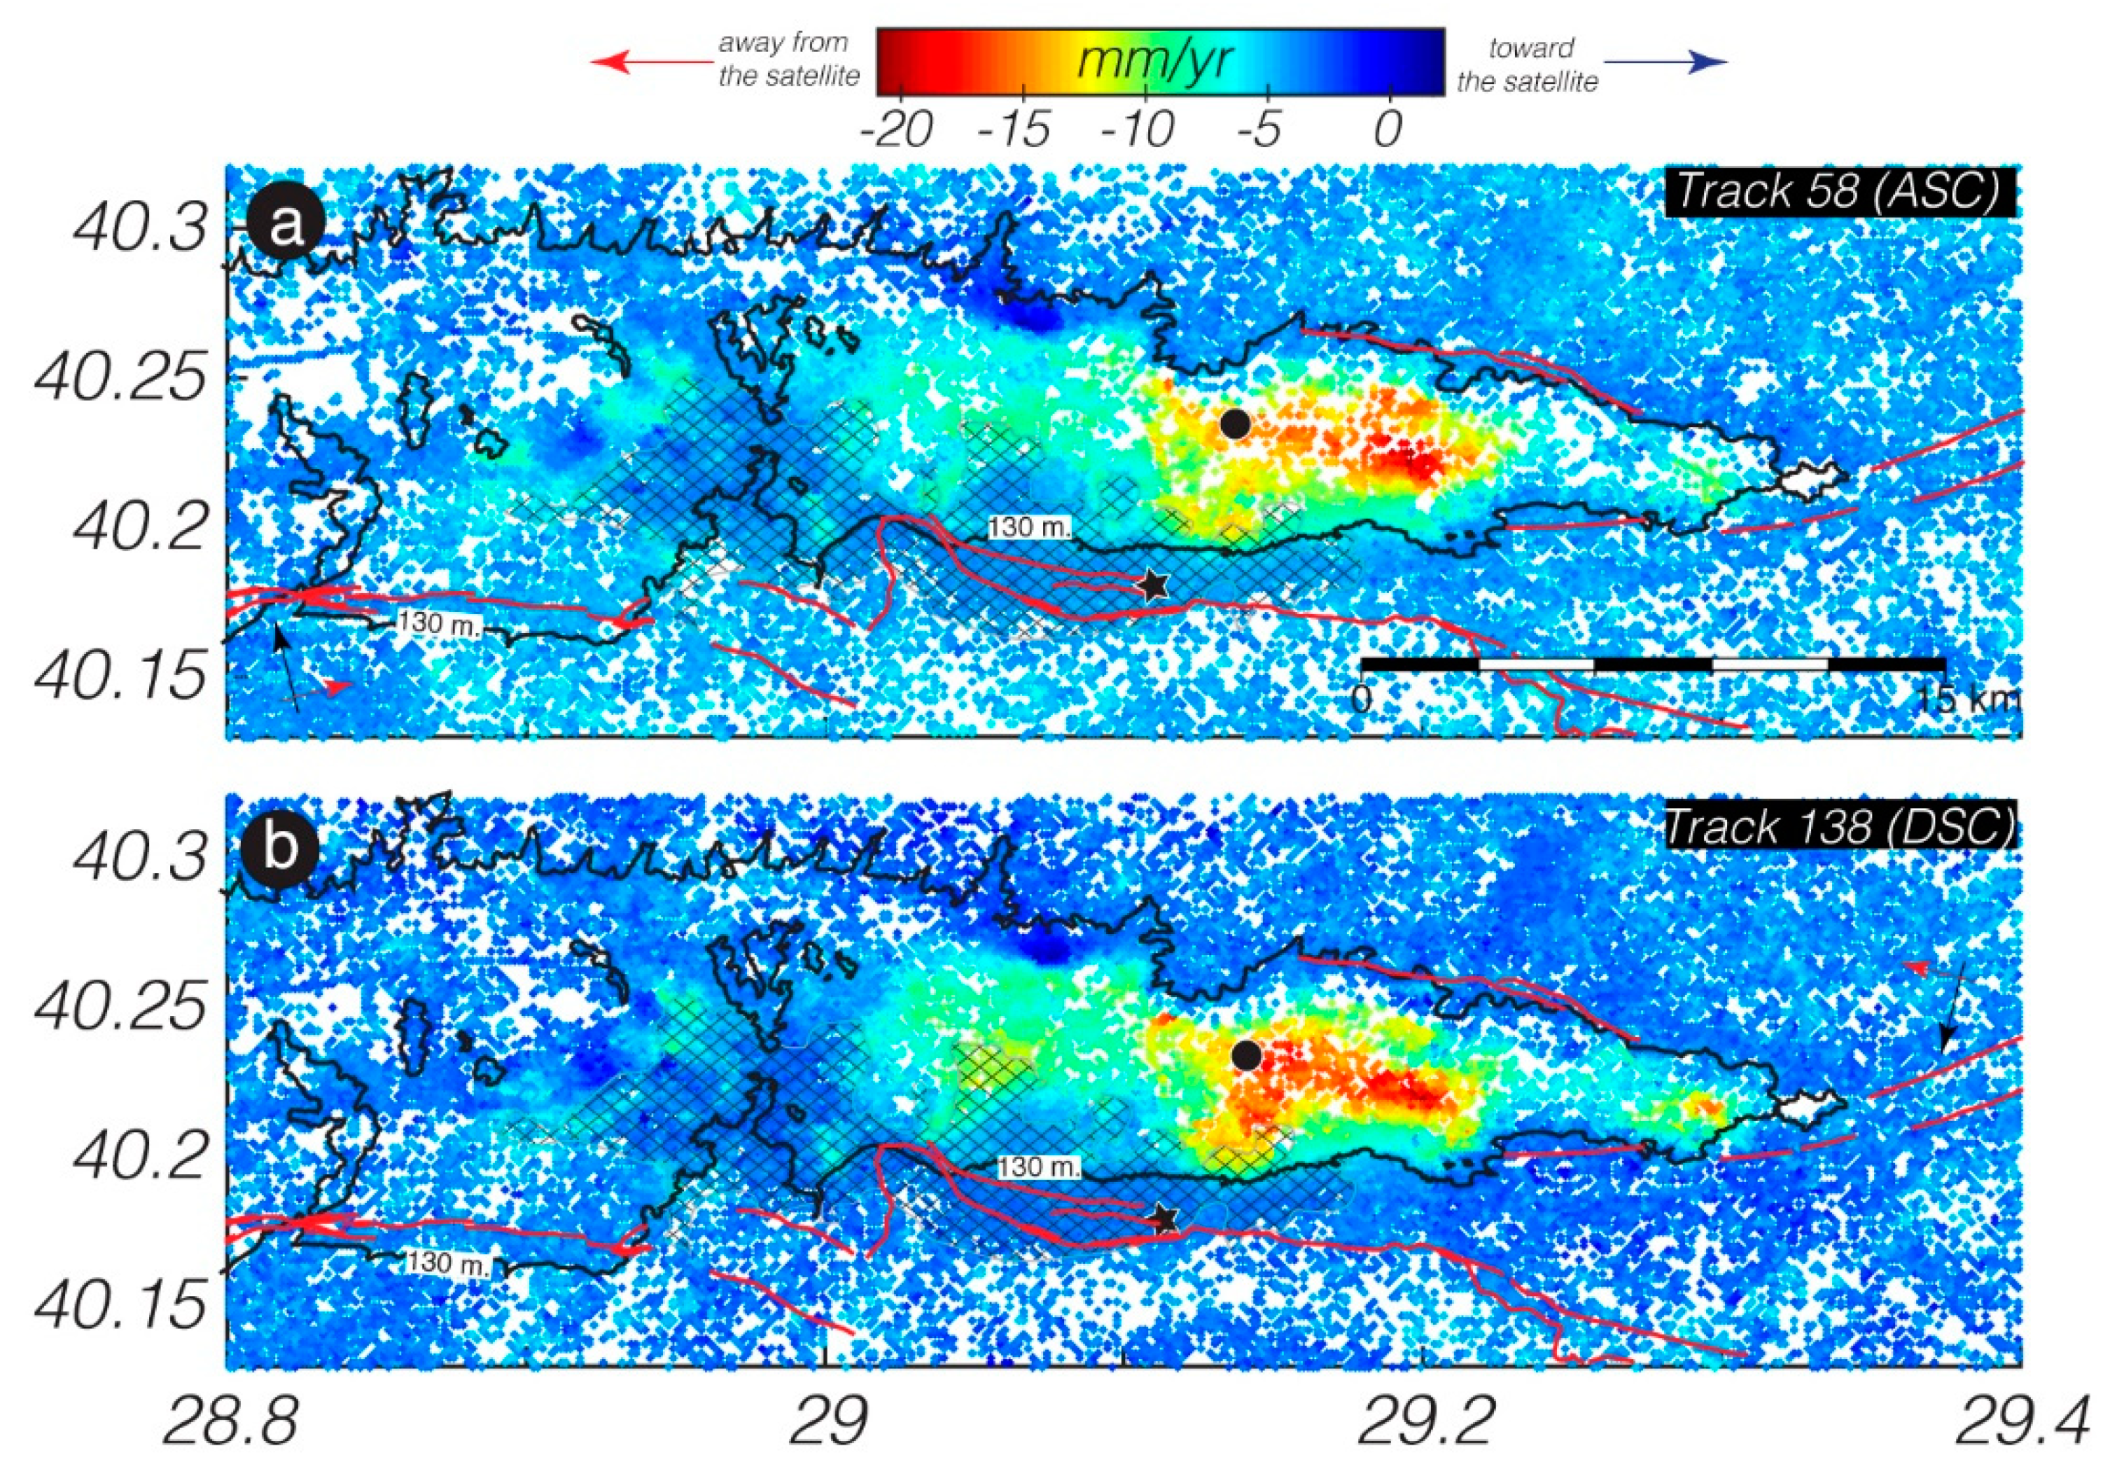
Figure 4 shows the InSAR-derived mean line-of-sight velocity fields calculated from the PS-InSAR time series analysis for the Bursa Plain. There is no ground-truth data (i.e., data collected at the ground surface) available in the study area. Consequently, the mean phase values for both tracks were initially used for referencing the velocity fields in the time series analysis. The area in the south of the subsiding basin located within the shaded polygon representing the extension of the Bursa city was chosen as the reference area because it is considered as a stable area (black star in Figure 3).
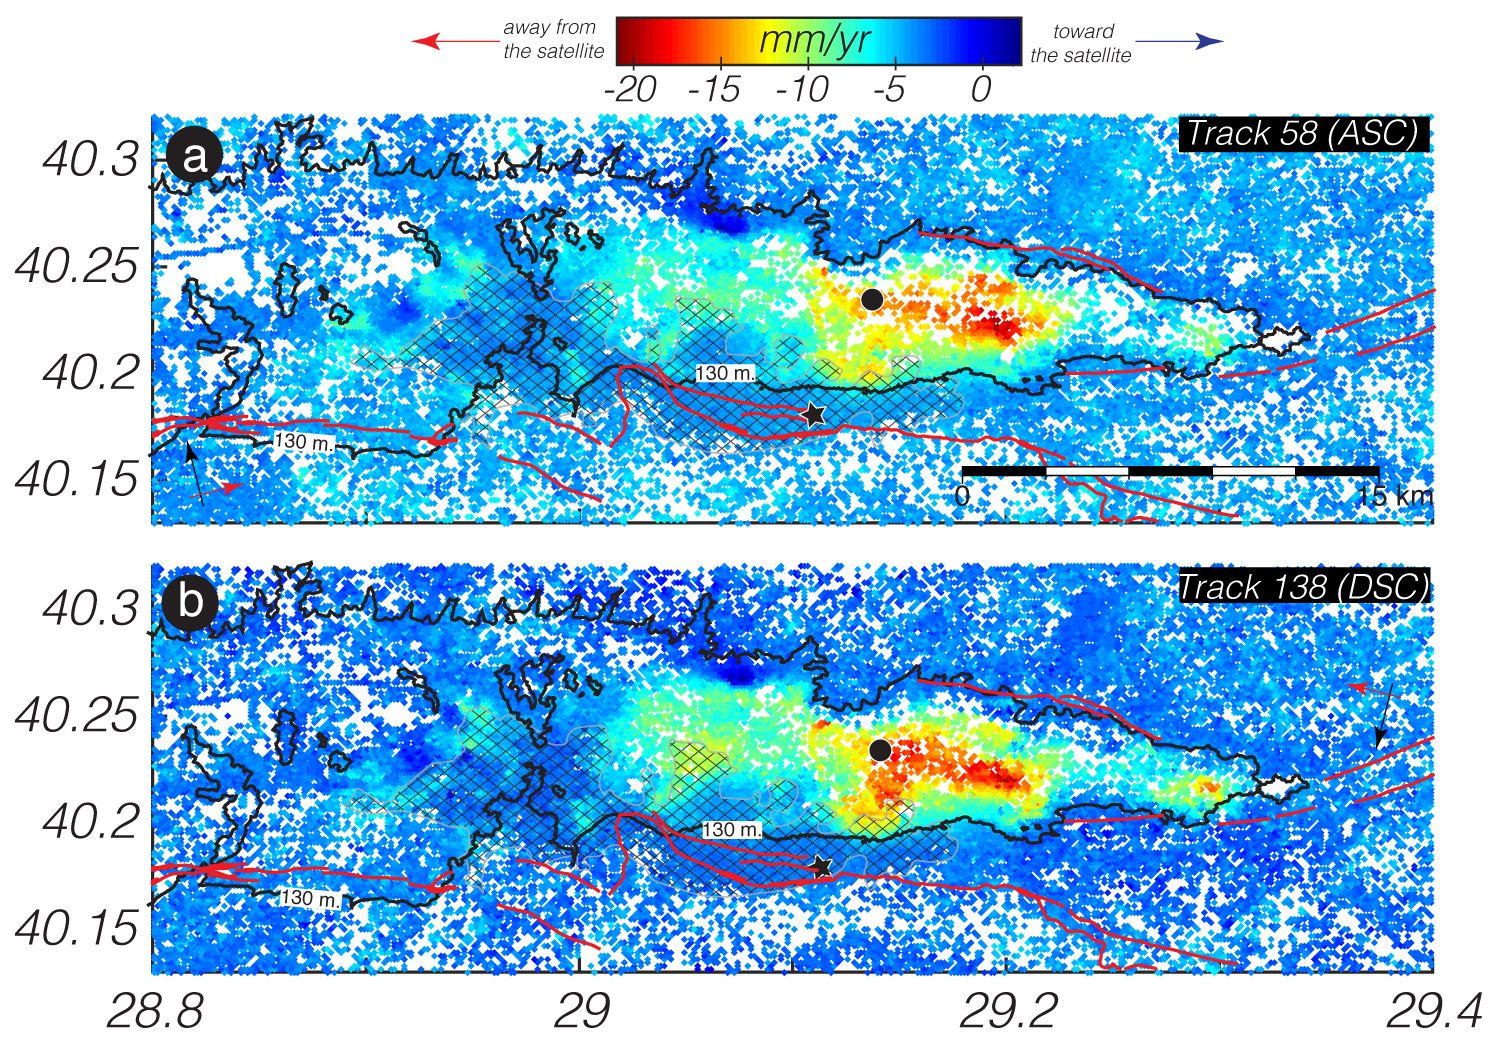
The velocity fields of both tracks exhibit similar spatial patterns. This similarity suggests that the LOS velocities show mostly vertical deformation with negligible horizontal motion and atmospheric effects. The most prominent deformation pattern in the eastern part of the basin, northeast of the Bursa city, is thus interpreted as subsidence. In order to assess the consistency between ascending and descending orbits, we performed an inter-comparison of the line of-sight displacement rates (Section 5.1). Slight differences in the locations of the subsidence patterns are also discussed below. While near-urban areas (marked by shaded polygon) have a high density of PS points, such points are sparse in the basin due to dense vegetation coverage and higher deformation rates.
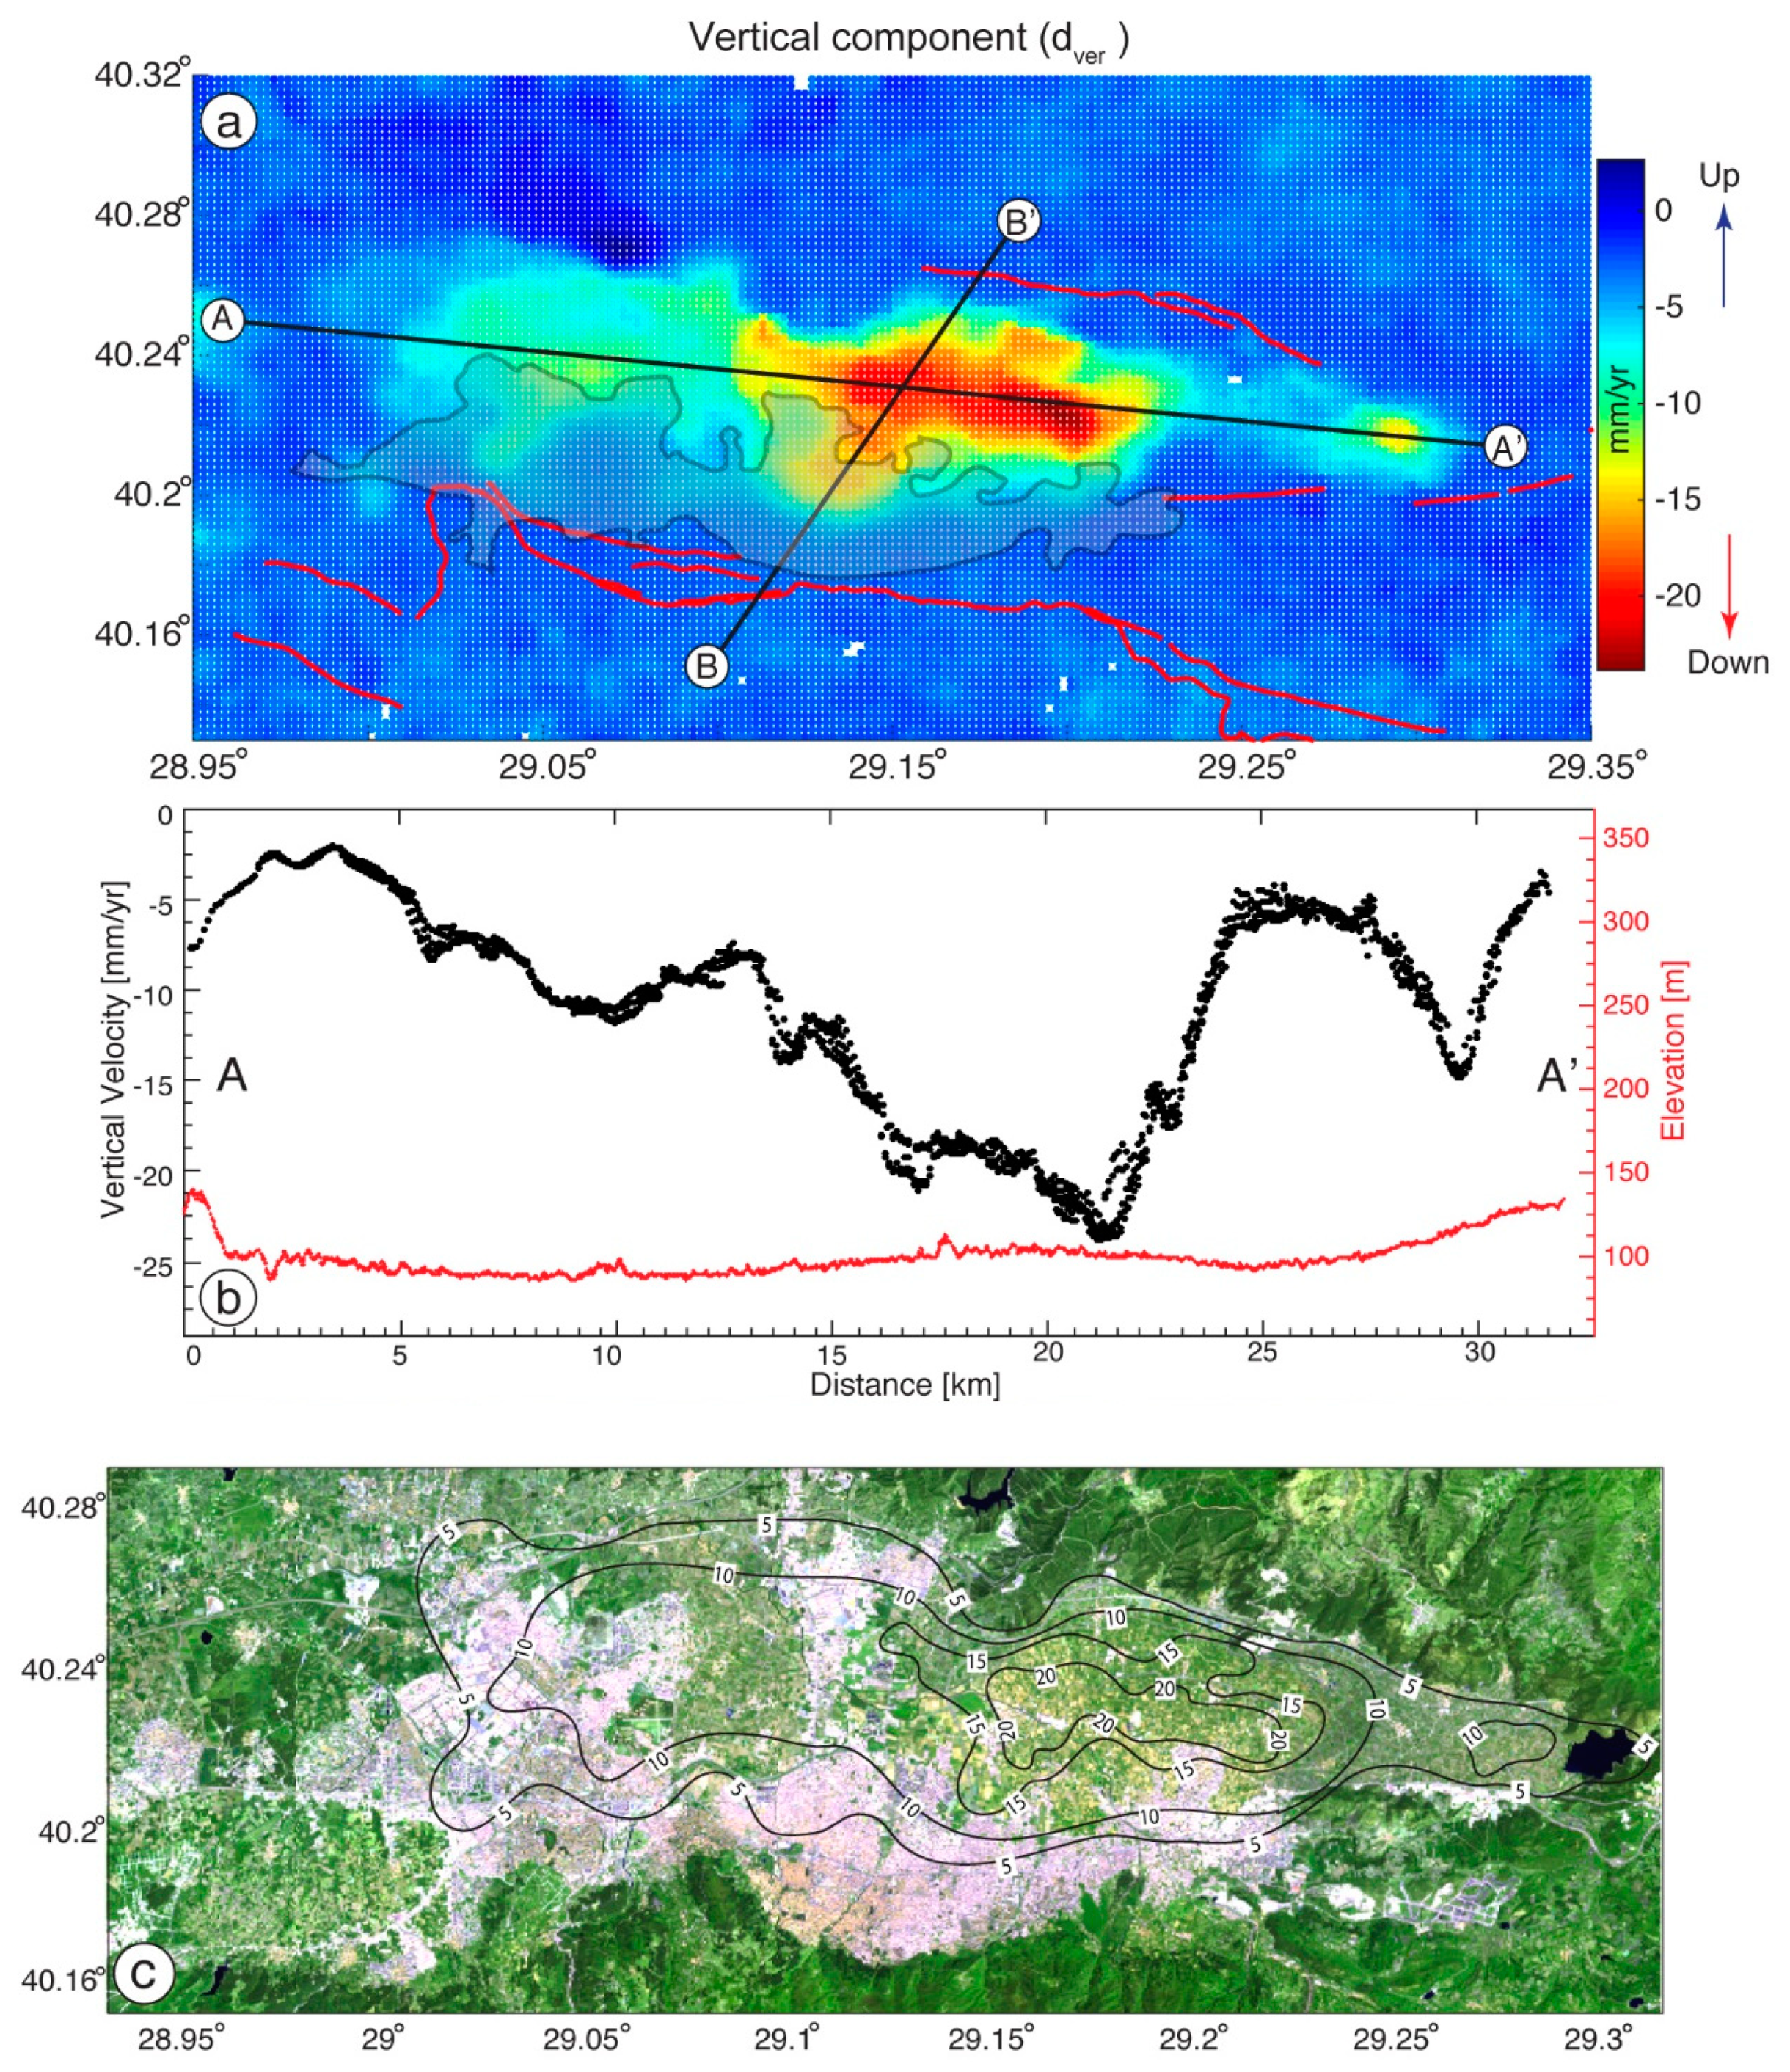
The spatial distribution of the subsidence rates for the period of 2014–2017, obtained after decomposition of ascending and descending LOS velocity maps and corresponding to the component, is shown in Figure 5. Figure 5c shows that the city of Bursa, which is settled on the northwest slope of the Uludag Mountain, is not affected by the subsidence. The maximum subsidence rate at the center of the depression is ~25 mm/yr. The shape and the location of the subsidence pattern coincide with the extension of the agricultural zone, which relies heavily on groundwater exploitation.
5. Discussion
5.1. Self-Consistency Checking between the Ascending and Descending InSAR Observations
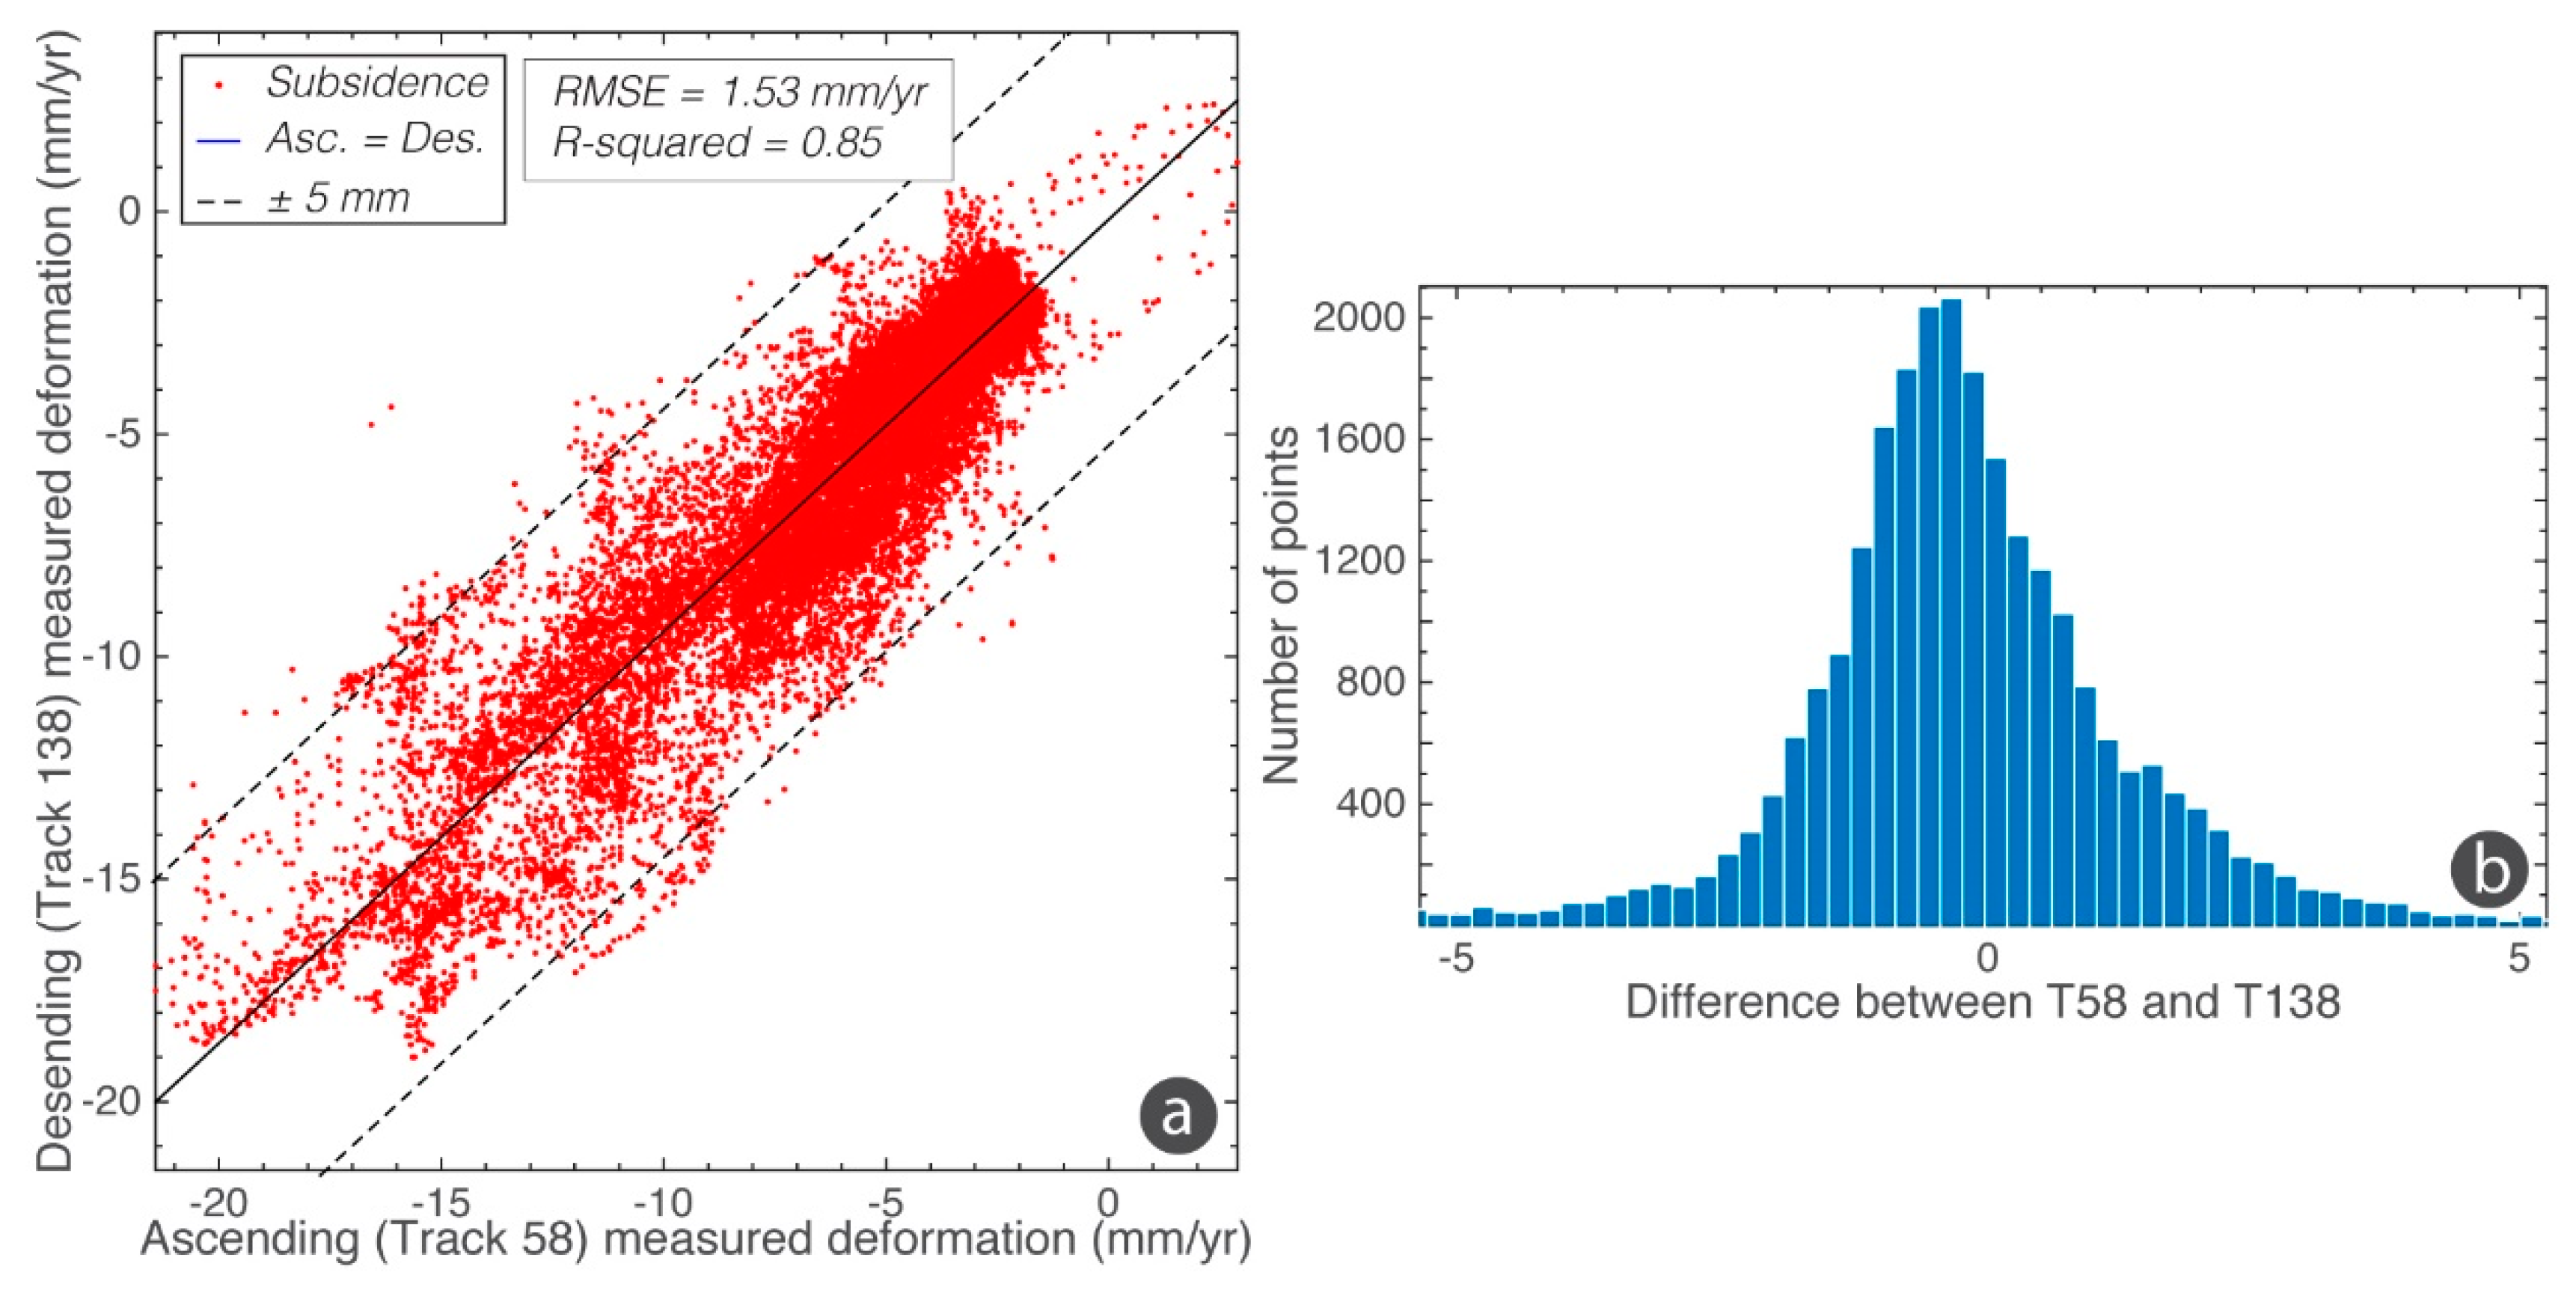
In order to show the self-consistency between InSAR measurements from two different viewing geometries, we first compared InSAR mean velocity measurements calculated from the two different Sentinel 1A/B datasets for the subsidence area in the Bursa plain and its surrounding region. Figure 6 shows the correlation between both datasets within the region of interest. The inter-comparison of the two line-of-sight displacement rate maps in this area was performed using a two-step procedure. In the first step, the mean velocity fields were resampled to a grid of 100 × 100 m to minimize the error of geo-localization (spatial mismatch between measurements). In the second step, we selected all pixels in the localized deforming areas that are common to both tracks. Then, we compared the distribution of the subsidence rates for both tracks. We found a root-mean-square value of 1.53 mm/yr and the coefficient of determination (R2) was close to 0.85. These values indicate that the two subsidence patterns (mean velocity) obtained from the different datasets are correlated with each other dominated by vertical motion. This agreement demonstrates that the deformation obtained from both datasets exhibits similar linear motions between 2014 and 2017, lending confidence to the subsidence patterns and amplitude determined by these datasets.
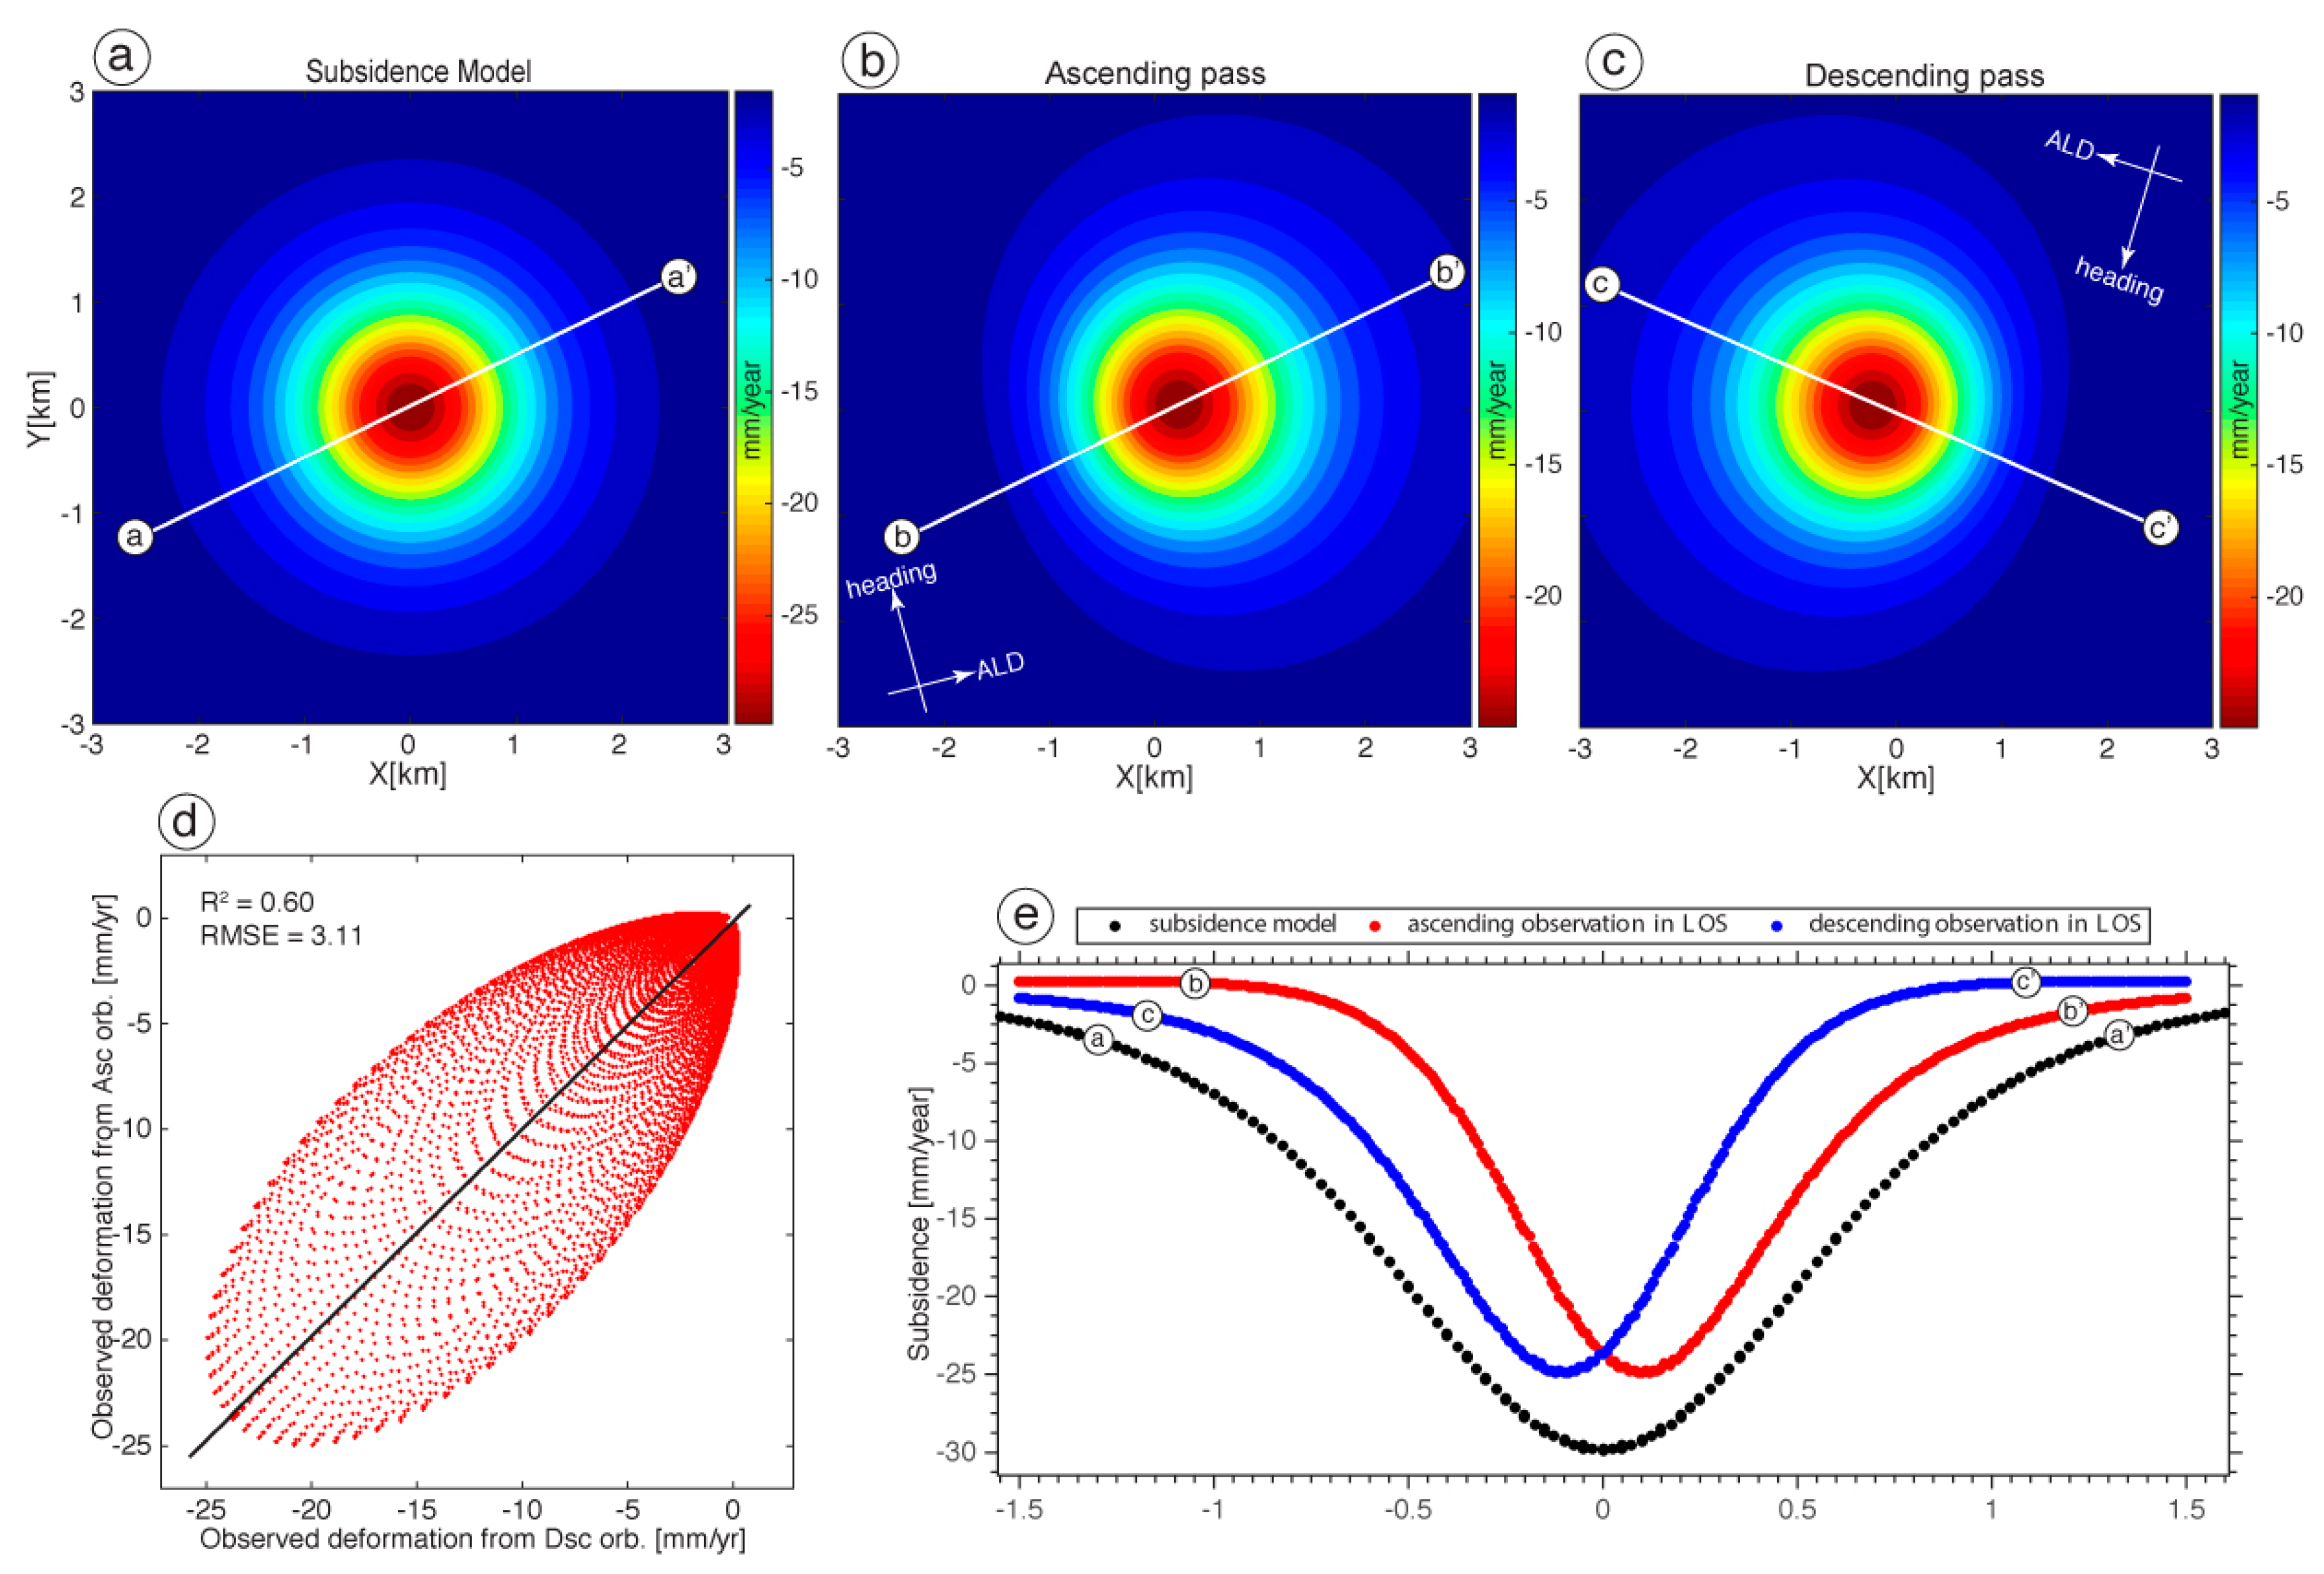
Comparison of the deformation rates between ascending and descending InSAR measurements of the same or different sensors is a common practice for quantitatively checking the consistency of measurements. The observed differences could stem from insufficient acquisitions, georeferencing uncertainty, seasonal biases, long temporal gaps, different temporal coverage, and, most importantly, different looking geometries. In order to show the impact of the looking geometry on the observed differences of the land subsidence induced by a single point source, we simulated a simple subsidence depression (Figure 7a). When this synthetic subsidence signal is observed with an incidence angle of 37.5°, considered as a mean incidence angle for Sentinel 1, the observed LOS deformation pattern will differ depending on the looking geometry of the sensor, either with a heading angle of −13.5° on ascending orbits, or −166.5° for descending orbits (Figure 7b,c). The maximum subsidence value moves away from the center along the azimuth look directions between the ascending and descending tracks. This idealized subsidence pattern gives a large dispersion and low correlation between the ascending and descending tracks as observed for our datasets.
5.2. Water Table Variations and InSAR Time Series
Using piezometric measurements, we can better constrain the hydro-geological processes that produce the observed subsidence. Agricultural activity that relies significantly on irrigation contributes to the groundwater depletion in aquifer systems of fine-grained sediments [71]. Ground-truth monitoring, satellites [72], InSAR [73], GPS [74], and numerical modeling have been used to understand the spatiotemporal variations of groundwater depletion. Many studies have shown that InSAR-derived subsidence patterns agree with water budgets [71,75,76]. Exploitation of aquifers decreases the groundwater volume, causing land subsidence that can be detected by InSAR. Given the lithological and hydrogeological data throughout the subsiding Bursa basin, we can constrain the amount of the groundwater depletion from the inversion of InSAR-derived land subsidence.
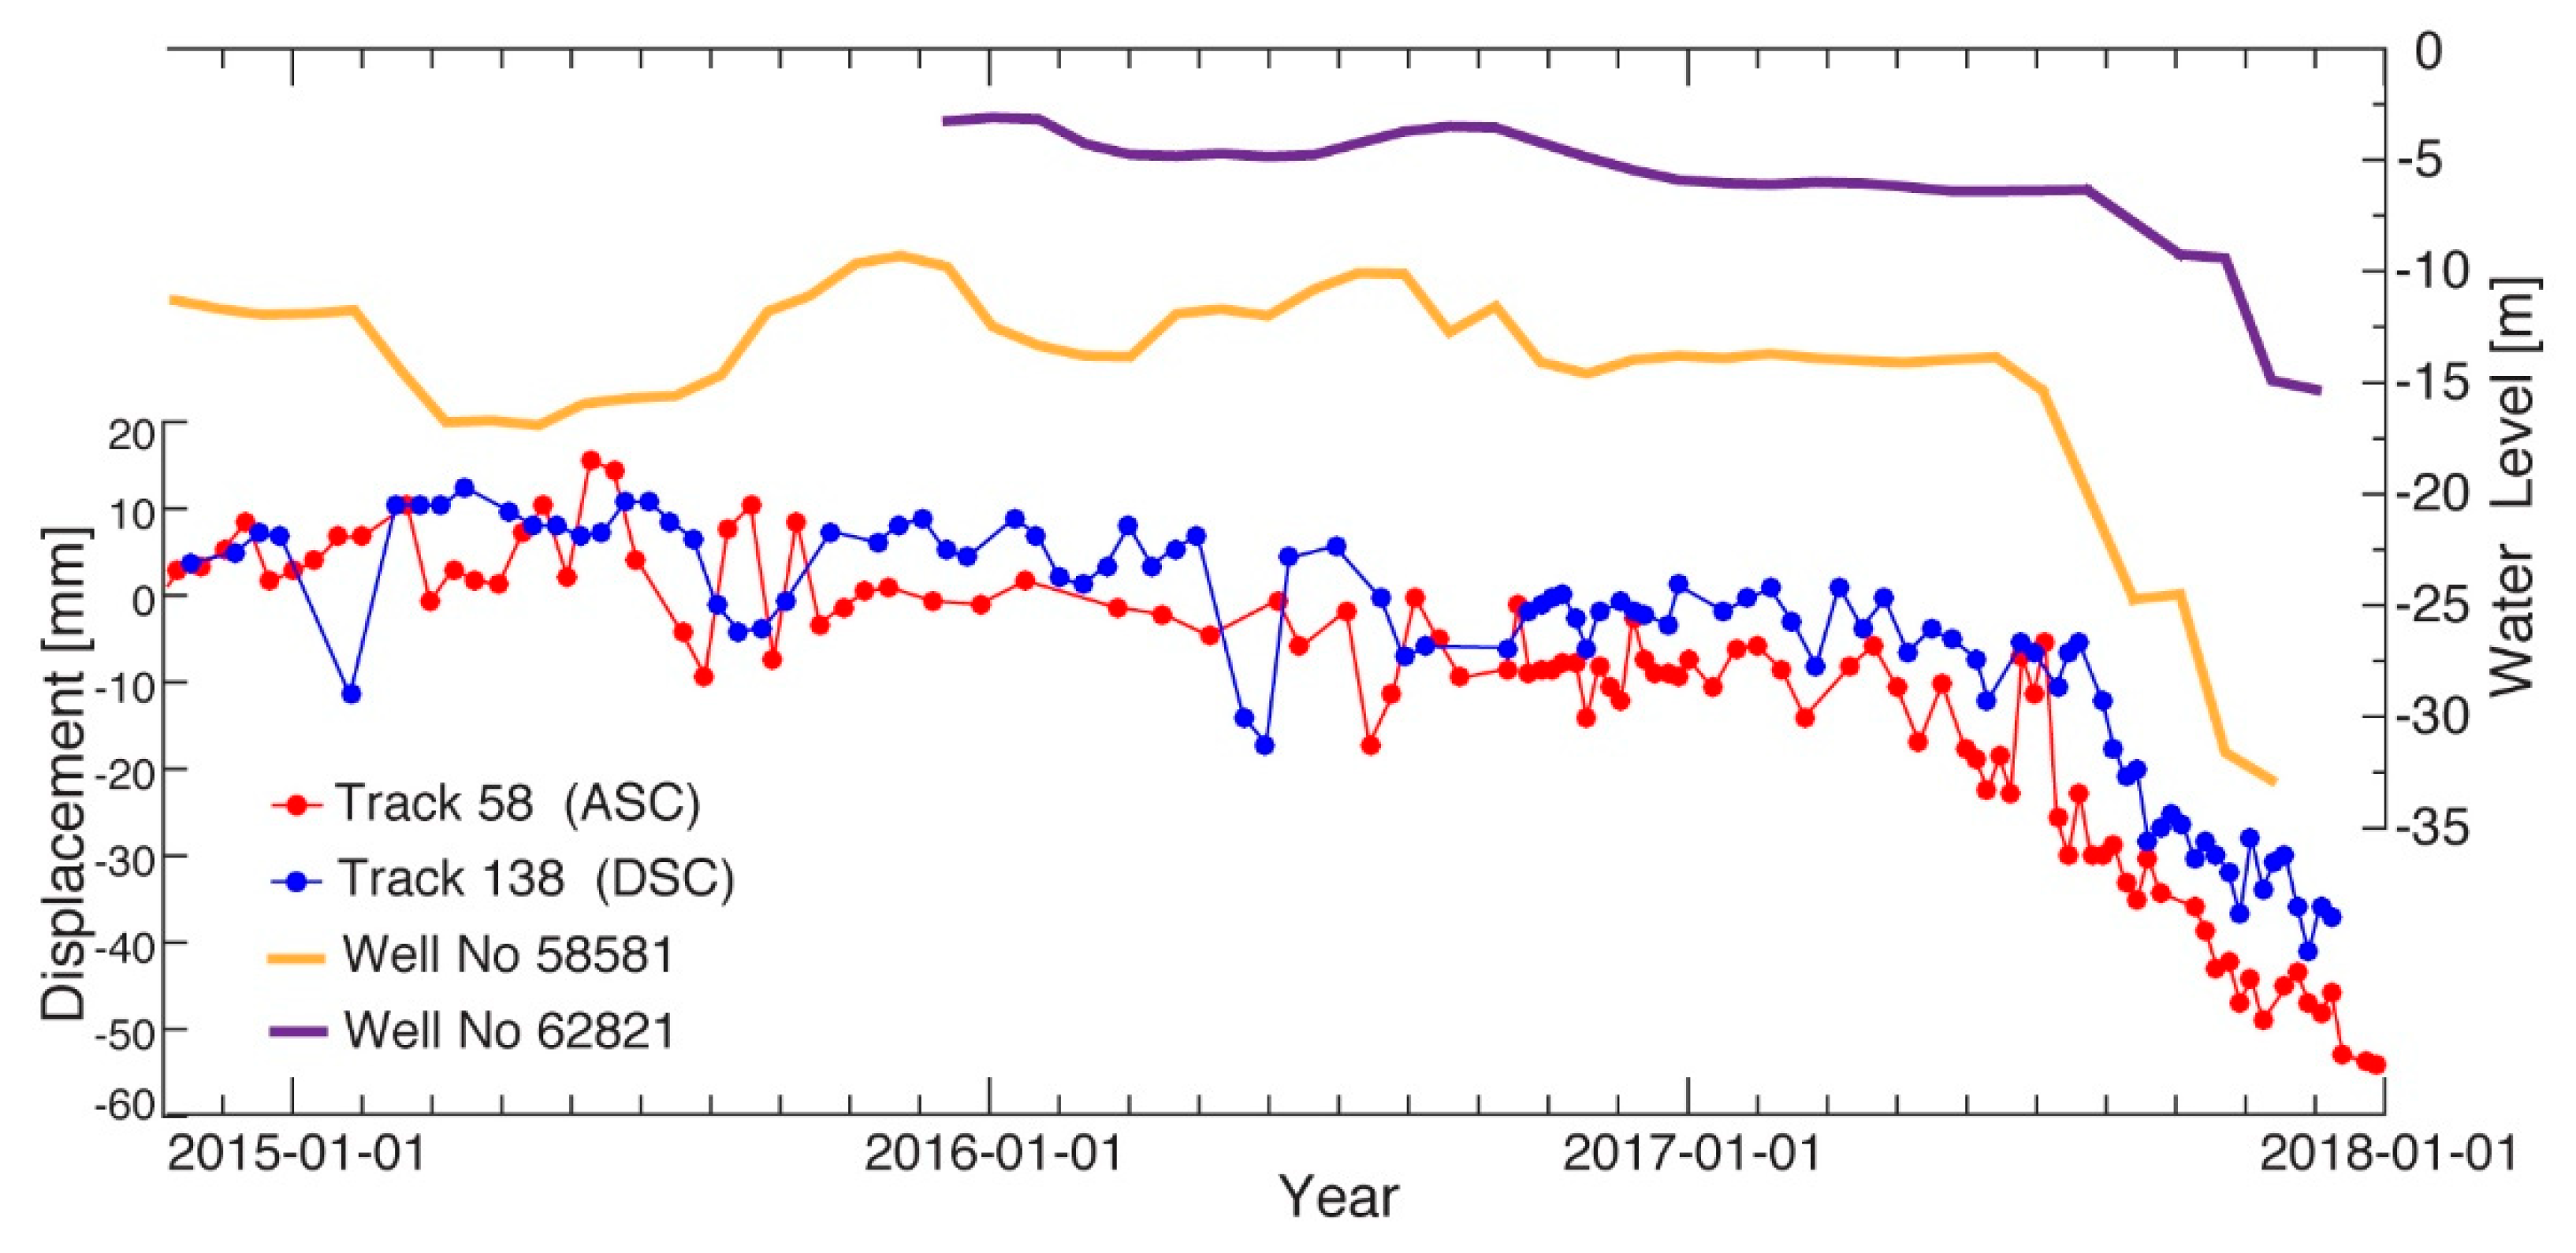
The Bursa ground water basin has a surface area of 208 km2. To investigate the correlation between groundwater exploitation and surface deformation, we compared the temporal variations of our measured LOS displacements with temporal variations of the water table measured in two wells during the period of InSAR measurements (2014–2017). We only used LOS measurement points that fell within a 1 km radius around the wells. As seen in Figure 8, the decreasing trend observed on InSAR displacement time series and water level data show a very good agreement. The pressure head variations of both wells show ~10 and ~20 m of water level decrease starting in mid-2017, coinciding with an acceleration of the subsidence in InSAR data.
5.3. Compressibility of the Aquifer in the Bursa Plain
We used the subsidence measured by InSAR data and the level of water in the two wells (Figure 8) to estimate the compressibility of the aquifer that compacted due to the water level decrease. The compressibility of an aquifer is defined as:
where is the total volume of the aquifer, its temporal evolution, and is the change in effective pressure in the aquifer [77]. We considered an increment of drawdown, , due to the pumping of water in the aquifer. This drawdown induces an increment of subsidence at the surface, , related to a compaction of the reservoir such that:
where is the thickness of the aquifer, taken here as equal to 50 m. The change in effective pressure is:
where kg·m−3 and g = 9.81 m·s−2 are the density of water and the constant of gravity, respectively. The compressibility can be calculated as:
Applied to the Bursa basin and considering a unit surface area of 1 m2, Figure 8 shows that the drawdown increased in the range of during the year of 2017 and the surface subsidence increased in the range of . As a result, the compressibility is in the range of Pa−1, corresponding to typical values for clay and sand sediments [77,78]. These values agree with the alluvium sedimentary filling of the Bursa basin (see geological map in Figure 2).
5.4. Lithological and Tectonic Control over Land Subsidence
Alluvial deposits in the Bursa plain area in which we observed subsidence are made of Neogene and Quaternary deposits [51]. The thickness of these deposits varies from 50 to 300 m [55]. They are composed of predominantly soft clay and loose silt and sand [50]. Such highly compressible lithological units are more vulnerable to land subsidence due to groundwater extraction. We estimated a maximum vertical subsidence rate of 25 mm/yr for the 2014–2017 period in the Bursa plain. The spatial distribution of subsidence is characterized by an east-west oriented, elongated, elliptical shape of deformation along the axis of the Bursa plain, in areas where agricultural activities are well developed (Figure 5c). The vertical mean velocity field shows the subsidence to be on the order of 10 mm/yr in the part of the alluvial plain that extends for approximately 200 km2 in the northern part of the Bursa city center. Within this subsidence zone, an oblong subsidence lobe (red in Figure 5a) is subsiding the fastest, sinking at the fastest observed rate of 25 mm/yr. The overall subsidence pattern in the study area shows very clear correlation with the shape of the basin, agricultural land use, and geological units of the study area. These correlations suggest that the land deformation is partially controlled by lithology and human activities. The fact that the pattern of subsidence mimics the shape of the basin may suggest that the alluvial thickness of the basin impacts the subsidence rate.
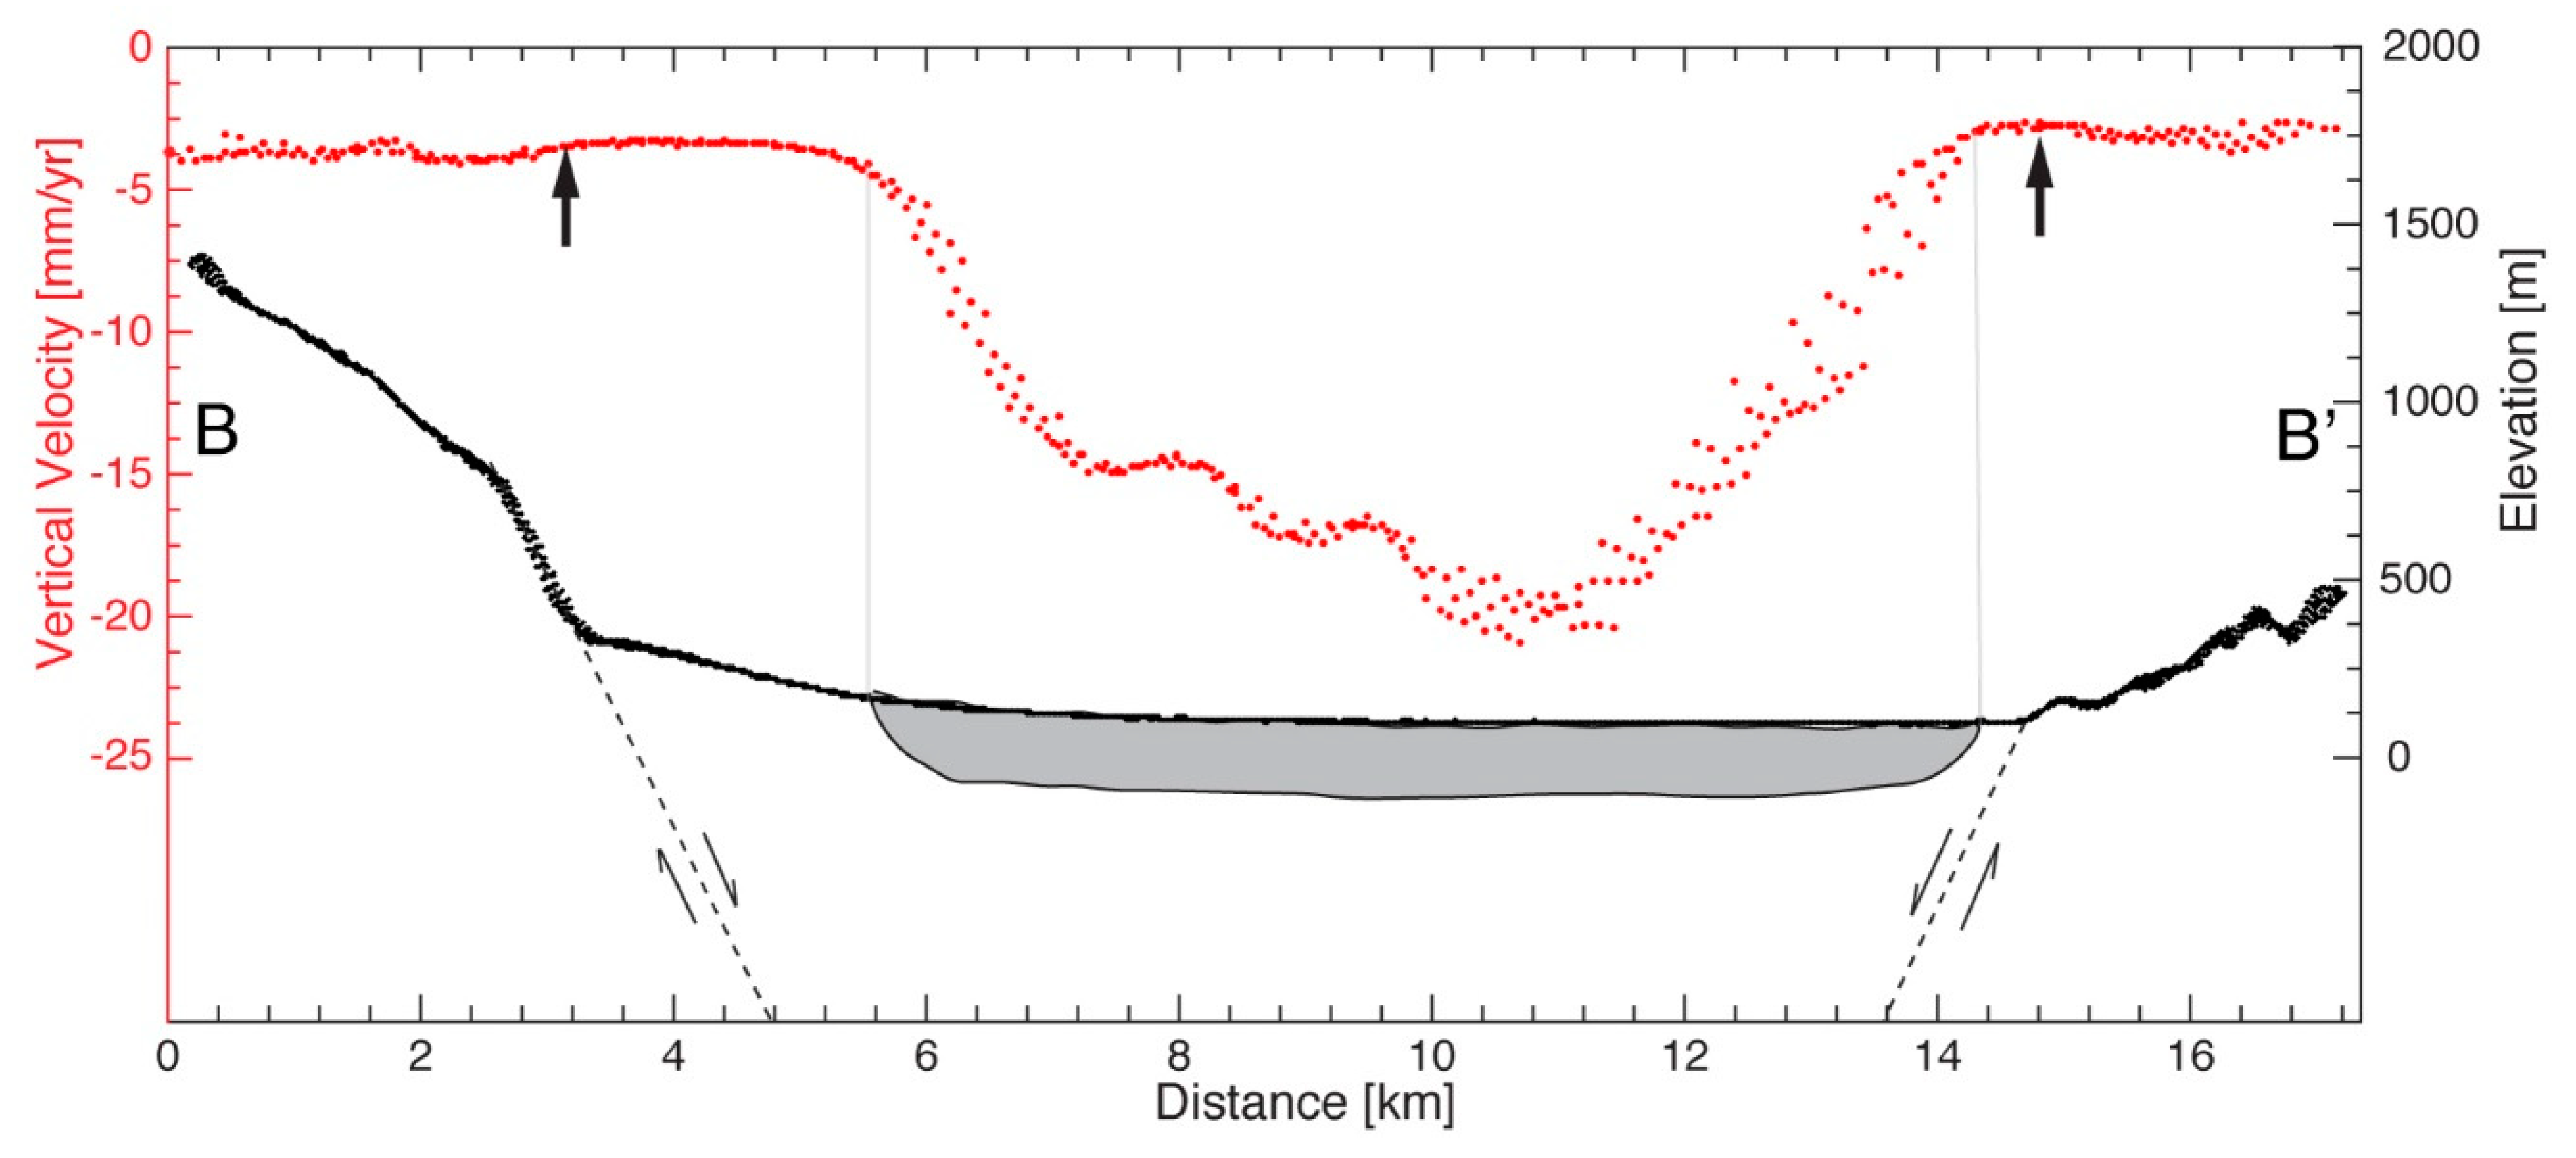
Similar to our results, Kutoglu et al. [1] have detected a subsidence signal in the Bursa plain between 2007 and 2010 and interpreted this signal as due to movements of the active faults that in the long term, have created the Bursa basin. However, the subsidence rate of 10.9 cm/yr proposed by Kutoglu et al. [1] is too high to be attributed to tectonic movements, such as shallow (surface creep) or lower crust deep creep [58]. As shown by GPS velocities in Figure 1b, the N-S horizontal velocity difference between the northern and southern shoulders of the Bursa basin that could be caused by aseismic slip on the basin boundary faults is negligible or too small to be detected in a few decades. As seen in Figure 9, there are no differences in the InSAR velocity across both the southern and northern boundary faults, confirming that there is no shallow creep on them. A deep creep would cause subsidence in the entire basin, not only in the alluvial plain. Therefore, our new observations and the strong correlation between the subsidence rate and ground water level suggest that most of the current subsidence detected in the past years is most likely due to the decline of the ground water table, rather than tectonic movements. An extremely high subsidence rate for the period of 2007–2010 was probably due to either droughts or more intensive pumping of the aquifer.
We have detected the very localized subsidence signal in the eastern tip of the basin overlapping with the agricultural area results from water pumping activities, but we do not have sufficient data to characterize this local signal.
6. Conclusions and Perspectives
The population of Bursa is increasing due to the city’s growing economy. This growing population is causing rapid urbanization, heavy land use, and land cover change. Such a rapid land development is forcing the land use to change from agricultural to more urban activities on the city’s outskirt and hinterland. We have detected ground subsidence in the northern part of Bursa at rates ranging from 5 to ~25 mm/yr in an area of 200 km2 from the time series analysis of Sentinel 1-A/B images collected between 2014 and 2017. The use of both ascending and descending tracks, showing consistent results, is critical here to better quantification of the subsidence rate and further intercomparison with other SAR sensors’ data will continue to improve the subsidence monitoring.
In order to investigate the possible correlation between detected InSAR-derived land subsidence and water level change, we analyzed piezometric records for the same 2014–2017 period. These records show a water table drop starting in mid 2017 that correlates with a subsidence acceleration in the InSAR-derived time series. The coincidence of the InSAR subsidence spatial extent with the alluvial deposits suggests a hydrogeological control of the Bursa plain on the observed subsidence. The eastern part of the subsiding area is sinking at a maximum rate of ~25 mm/yr, where agricultural activities rely significantly on groundwater extraction. The spatial pattern of subsidence reveals that the urban environment is not yet affected by significant subsidence. Finally, no velocity gradient associated with active faults is presently observed.
All these observations indicate that the subsidence in Bursa plain is due to excessive groundwater extraction, not tectonic motions. This study demonstrates the capability of InSAR time series, combined with geological and hydrogeological data, to detect and monitor subsidence and identify potential control factors in the Bursa Province. Further work, complementary to InSAR, would be required to better monitor and asses the hazard related to land subsidence, using continuous GPS time-series in combination with in-situ measurements, including piezometric and geophysical data, such as borehole extensometers. In order to predict the future development of the land subsidence along the basin and differentiate the tectonic and anthropogenic contribution to the subsidence signal, further research should be performed to investigate elastic and hydraulic characteristics of the aquifer system. Because the entire Bursa basin is affected by land subsidence, and elaborate and orderly use of land is necessary to secure the infrastructures of the urban areas.
Author Contributions
G.A. carried out SAR data processing, data analysis and manuscript writing and revision. Z.C. supervised the SAR data processing, and Z.C., C.L. and F.R. contributed to manuscript writing and data interpretation.
Funding
This research received funding from TUBITAK project 113Y102 and AFAD project UDAP-G-16-02 to Z.C., the Norwegian Research Council, project HADES, grant 250661 to F.R. This is part of the Ph.D. dissertation of Gokhan Aslan who is supported by the French Embassy in Turkey (Bourse Etudes scholarship program 889075G). Université Grenoble Alpes LabeX OSUG@2020 project of C.L. and CMIRA scholarship program provided by the Rhone-Alpes Region. The APC was funded by CNES/INSU to C.L.
Acknowledgments
Sentinel 1A/B images were processed at TUBITAK ULAKBIM, High Performance and Grid Computing Center (TRUBA resources). We thank the Turkish State Hydraulic Works for providing the piezometric data.
Conflicts of Interest
The authors declare no conflict of interest.
References
- Kutoglu, H.S.; Kemaldere, H.; Deguchıi, T.; Berber, M. Discovering a pull-apart basin using InSAR in Bursa, Turkey. Nat. Hazards 2014, 71, 871–880. [Google Scholar] [CrossRef]
- Galloway, D.L.; Hudnut, K.W.; Ingebritsen, S.E.; Phillips, S.P.; Peltzer, G.; Rogez, F.; Rosen, P.A. Detection of aquifer system compaction and land subsidence using interferometric synthetic aperture radar, Antelope Valley, Mojave Desert, California. Water Resour. Res. 1998, 34, 2573–2585. [Google Scholar] [CrossRef] [Green Version]
- Brunori, C.A.; Bignami, C.; Albano, M.; Zucca, F.; Samsonov, S.; Groppelli, G.; Norini, G.; Saroli, M.; Stramondo, S. Land subsidence, Ground Fissures and Buried Faults: InSAR Monitoring of Ciudad Guzmán (Jalisco, Mexico). Remote Sens. 2015, 7, 8610–8630. [Google Scholar] [CrossRef] [Green Version]
- Béjar-Pizarro, M.; Ezquerro, P.; Herrera, G.; Tomás, R.; Guardiola-Albert, C.; Ruiz Hernández, J.M.; Fernández Merodo, J.A.; Marchamalo, M.; Martínez, R. Mapping groundwater level and aquifer storage variations from InSAR measurements in the Madrid aquifer, Central Spain. J. Hydrol. 2017, 678–689. [Google Scholar] [CrossRef]
- Solari, L.; Ciampalini, A.; Raspini, F.; Bianchini, S.; Moretti, S. PSInSAR analysis in the Pisa Urban Area (Italy): A case study of subsidence related to stratigraphical factors and urbanization. Remote Sens. 2016, 8, 120. [Google Scholar] [CrossRef]
- Del Soldato, M.; Farolfi, G.; Rosi, A.; Raspini, F.; Casagli, N. Subsidence Evolution of the Firenze–Prato–Pistoia Plain (Central Italy) Combining PSI and GNSS Data. Remote Sens. 2018, 10, 1146. [Google Scholar] [CrossRef]
- Chang, W.Y.; Wang, C.T.; Chu, C.Y.; Kao, J.R. Mapping geo-hazard by satellite radar interferometry. Proc. IEEE 2012, 100, 2835–2850. [Google Scholar] [CrossRef]
- Pacheco-Martínez, J.; Cabral-Cano, E.; Wdowinski, S.; Hernández-Marín, M.; Ortiz-Lozano, J.Á.; Zermeño-de-León, M.E. Application of insar and gravimetry for land subsidence hazard zoning in Aguascalientes, Mexico. Remote Sens. 2015, 7, 17035–17050. [Google Scholar] [CrossRef]
- Galve, J.P.; Pérez-Peña, J.V.; Azañón, J.M.; Closson, D.; Caló, F.; Reyes-Carmona, C.; Jabaloy, A.; Ruano, P.; Mateos, R.M.; Notti, D.; et al. Evaluation of the SBAS InSAR Service of the European Space Agency’s Geohazard Exploitation Platform (GEP). Remote Sens. 2017, 9, 1291. [Google Scholar] [CrossRef]
- Barra, A.; Solari, L.; Béjar-Pizarro, M.; Monserrat, O.; Bianchini, S.; Herrera, G.; Crosetto, M.; Sarro, R.; González-Alonso, E.; Mateos, R.M.; et al. A Methodology to Detect and Update Active Deformation Areas Based on Sentinel-1 SAR Images. Remote Sens. 2017, 9, 1002. [Google Scholar] [CrossRef]
- Zeitoun, D.G.; Wakshal, E. The Subsidence Phenomenon throughout the World in Land Subsidence Analysis in Urban Areas: The Bangkok Metropolitan Area Case Study; Springer Science & Business Media: London, UK, 2013; pp. 9–23. [Google Scholar] [CrossRef]
- Changxing, S.; Dian, Z.; Lianyuan, Y.; Bingyuan, L.; Zulu, Z.; Ouyang, Z. Land subsidence as a result of sediment consolidation in the Yellow River Delta. J. Coast. Res. 2007, 173–181. [Google Scholar] [CrossRef]
- Evinemi, I.E.; Adepelumi, A.A.; Adebayo, O. Canal structure subsidence investigation using ground penetrating radar and geotechnical techniques. Int. J. Geo-Eng. 2016, 7, 9. [Google Scholar] [CrossRef]
- Törnqvist, T.E.; Wallace, D.J.; Storms, J.E.; Wallinga, J.; Van Dam, R.L.; Blaauw, M.; Derksen, M.S.; Cornelis, J.W.; Meijneken, C.; Snijders, E.M.A. Mississippi Delta subsidence primarily caused by compaction of Holocene strata. Nat. Geosci. 2008, 1, 173. [Google Scholar] [CrossRef]
- Van Asselen, S. The contribution of peat compaction to total basin subsidence: Implications for the provision of accomodation space in organic-rich deltas. Basin Res. 2011, 23, 239–255. [Google Scholar] [CrossRef]
- Wang, X.Y.; Sun, L.; Liu, C.L. Present situation of land subsidence and its mechanism in China. Global View of Engineering Geology and the Environment. In Proceedings of the International Symposium and 9th Asian Regional Conference of IAEG (AREG2013), Beijing, China, 24–25 September 2013; pp. 475–480. [Google Scholar]
- Higgins, S.A.; Overeem, I.; Steckler, M.S.; Syvitski, J.P.; Seeber, L.; Akhter, S.H. InSAR measurements of compaction and subsidence in the Ganges-Brahmaputra Delta, Bangladesh. J. Geophys. Res. Earth Surf. 2014, 119, 1768–1781. [Google Scholar] [CrossRef] [Green Version]
- López-Quiroz, P.; Doin, M.P.; Tupin, F.; Briole, P.; Nicolas, J.M. Time series analysis of Mexico City subsidence constrained by radar interferometry. J. Appl. Geophys. 2009, 69, 1–15. [Google Scholar] [CrossRef]
- Dang, V.K.; Doubre, C.; Weber, C.; Gourmelen, N.; Masson, F. Recent land subsidence caused by the rapid urban development in the Hanoi region (Vietnam) using ALOS InSAR data. Nat. Hazards Earth Syst. Sci. 2014, 14, 657. [Google Scholar] [CrossRef]
- Bitelli, G.; Bonsignore, F.; Unguendoli, M. Levelling and GPS networks to monitor ground subsidence in the Southern Po Valley. J. Geodyn. 2000, 30, 355–369. [Google Scholar] [CrossRef]
- Sato, H.P.; Abe, K.; Ootaki, O. GPS-measured land subsidence in Ojiya city, Niigata prefecture, Japan. Eng. Geol. 2003, 67, 379–390. [Google Scholar] [CrossRef]
- Gourmelen, N.; Amelung, F.; Casu, F.; Manzo, M.; Lanari, R. Mining-related ground deformation in Crescent Valley, Nevada: Implications for sparse GPS networks. Geophys. Res. Lett. 2007, 34. [Google Scholar] [CrossRef] [Green Version]
- Taylor, C.J.; Alley, W.M. Ground-Water-Level Monitoring and the Importance of Long-Term Water-Level Data (No. 1217-2002); US Geological Survey: Reston, VA, USA, 2002. [Google Scholar]
- Ireland, R.L.; Poland, J.F.; Riley, F.S. Land Subsidence in the San Joaquin Valley, California, as of 1980; US Geological Survey Professional, US Government Printing Office: Washington, DC, USA, 1984; p. 93. [Google Scholar]
- Poland, J.F. Guidebook to Studies of Land Subsidence Due to Ground-Water Withdrawal; UNESCO: Paris, France, 1984. [Google Scholar]
- Evseev, A.; Asanov, V.; Lomakin, I.; Tsayukov, A. Experimental and theoretical studies of undermined strata deformation during room and pillar mining. In Geomechanics and Geodynamics of Rock Masses; CRC Press: Boca Raton, FL, USA, 2018; Volume 2, pp. 985–990. [Google Scholar]
- Tosi, L.; Teatini, P.; Carbognin, L.; Brancolini, G. Using high resolution data to reveal depth-dependent mechanisms that drive land subsidence: The Venice coast, Italy. Tectonophysics 2009, 474, 271–284. [Google Scholar] [CrossRef]
- Rucker, M.L.; Panda, B.B.; Meyers, R.A.; Lommler, J.C. Using InSAR to detect subsidence at brine wells, sinkhole sites, and mines. Carbonates Evaporites 2013, 28, 141–147. [Google Scholar] [CrossRef]
- Froese, C.R.; Mei, S. Mapping and monitoring coal mine subsidence using LiDAR and InSAR. In Proceedings of the GeoEdmonton2008, Edmonton, AB, Canada, 21–24 September 2008; pp. 1127–1133. [Google Scholar]
- Zebker, H.A.; Goldstein, R.M. Topographic mapping from interferometric synthetic aperture radar observations. J. Geophys. Res. Solid Earth 1986, 91, 4993–4999. [Google Scholar] [CrossRef]
- Gabriel, A.K.; Goldstein, R.M.; Zebker, H.A. Mapping small elevation changes over large areas: Differential radar interferometry. J. Geophys. Res. Solid Earth 1989, 94, 9183–9191. [Google Scholar] [CrossRef]
- Massonnet, D.; Rabaute, T. Radar interferometry: Limits and potential. IEEE Trans. Geosci. Remote Sens. 1993, 31, 455–464. [Google Scholar] [CrossRef]
- Bürgmann, R.; Rosen, P.A.; Fielding, E.J. Synthetic aperture radar interferometry to measure Earth’s surface topography and its deformation. Annu. Rev. Earth Planet. Sci. 2000, 28, 169–209. [Google Scholar] [CrossRef]
- Massonnet, D.; Holzer, T.; Vadon, H. Land subsidence caused by the East Mesa geothermal field, California, observed using SAR interferometry. Geophys. Res. Lett. 1997, 24, 901–904. [Google Scholar] [CrossRef]
- Fielding, E.J.; Blom, R.G.; Goldstein, R.M. Rapid subsidence over oil fields measured by SAR interferometry. Geophys. Res. Lett. 1998, 25, 3215–3218. [Google Scholar] [CrossRef] [Green Version]
- Wright, P.; Stow, R. Detecting mining subsidence from space. Int. J. Remote Sens. 1999, 20, 1183–1188. [Google Scholar] [CrossRef]
- Kim, S.W.; Wdowinski, S.; Dixon, T.H.; Amelung, F.; Kim, J.W.; Won, J.S. Measurements and predictions of subsidence induced by soil consolidation using persistent scatterer InSAR and a hyperbolic model. Geophys. Res. Lett. 2010, 37. [Google Scholar] [CrossRef] [Green Version]
- Aslan, G.; Cakır, Z.; Ergintav, S.; Lasserre, C.; Renard, F. Analysis of Secular Ground Motions in Istanbul from a Long-Term InSAR Time-Series (1992–2017). Remote Sens. 2018, 10, 408. [Google Scholar] [CrossRef]
- Carnec, C.; Delacourt, C. Three years of mining subsidence monitored by SAR interferometry, near Gardanne, France. J. Appl. Geophys. 2000, 43, 43–54. [Google Scholar] [CrossRef]
- Abdikan, S.; Arıkan, M.; Sanli, F.B.; Çakir, Z. Monitoring of coal mining subsidence in peri-urban area of Zongundak city (NWTurkey) with persistent scatterer interferometry using ALOS-PALSAR. Environ. Earth Sci. 2014, 71, 4081–4089. [Google Scholar] [CrossRef]
- Rykhus, R.P.; Lu, Z. InSAR detects possible thaw settlement in the Alaskan Arctic Coastal Plain. Can. J. Remote Sens. 2008, 34, 100–112. [Google Scholar] [CrossRef]
- Temtime, T.; Biggs, J.; Lewi, E.; Hamling, I.; Wright, T.; Ayele, A. Spatial and temporal patterns of deformation at the Tendaho geothermal prospect, Ethiopia. J. Volcanol. Geotherm. Res. 2018, 357, 56–67. [Google Scholar] [CrossRef] [Green Version]
- Baer, G.; Magen, Y.; Nof, R.N.; Raz, E.; Lyakhovsky, V.; Shalev, E. InSAR Measurements and Viscoelastic Modeling of Sinkhole Precursory Subsidence: Implications for Sinkhole Formation, Early Warning, and Sediment Properties. J. Geophys. Res. Earth Surf. 2018, 123, 678–693. [Google Scholar] [CrossRef]
- Hoffmann, J.; Zebker, H.; Galloway, D.; Amelung, F. Seasonal subsidence and rebound in Las Vegas Valley, Nevada, observed by synthetic aperture radar interferometry. Water Resour. Res. 2001, 37, 1551–1566. [Google Scholar] [CrossRef]
- Tomás, R.; Herrera, G.; Delgado, J.; Lopez-Sanchez, J.M.; Mallorqui, J.J.; Mulas, J. A ground subsidence study based on DInSAR data: Calibration of soil parameters and subsidence prediction in Murcia City (Spain). Eng. Geol. 2009, 111, 19–30. [Google Scholar] [CrossRef]
- Calderhead, A.I.; Therrien, R.; Rivera, A.; Martel, R.; Garfias, J. Simulating pumping-induced regional land subsidence with the use of InSAR and field data in the Toluca Valley, Mexico. Adv. Water Resour. 2011, 34, 83–97. [Google Scholar] [CrossRef]
- Ezquerro, P.; Herrera, G.; Marchamalo, M.; Tomás, R.; Béjar-Pizarro, M.; Martínez, R. A quasi-elastic aquifer deformational behavior: Madrid aquifer case study. J. Hydrol. 2014, 519, 1192–1204. [Google Scholar] [CrossRef] [Green Version]
- Turkish Statistical Institute, TUIK. Available online: http://www.tuik.gov.tr/HbGetirHTML.do?id=27587 (accessed on 26 November 2018).
- Serbetci, Z. Examination of Agro-Tourism Potential: Bursa Plain Plain. J. Int. Soc. Res. 2018, 11. [Google Scholar] [CrossRef]
- Selim, H.H.; Tüysüz, O. The Bursa–Gönen Depression, NW Turkey: A complex basin developed on the North Anatolian Fault. Geol. Mag. 2013, 150, 801–821. [Google Scholar] [CrossRef]
- Selim, H.H.; Tüysüz, O.; Karakaş, A.; Taş, K.Ö. Morphotectonic evidence from the southern branch of the North Anatolian Fault (NAF) and basins of the south Marmara sub-region, NW Turkey. Quat. Int. 2013, 292, 176–192. [Google Scholar] [CrossRef]
- Bursa Environment Project Report on Hydrology and Water Quality Modelling; Institute of Hydrology: Wallingford, UK, 1991; p. 14.
- Gok, E.; Polat, O. An assessment of the seismicity of the Bursa region from a temporary seismic network. Pure Appl. Geophys. 2012, 169, 659–675. [Google Scholar] [CrossRef]
- Eisenlohr, T. Die Thermalwässer der ArmutluHalbinsel (NW-Türkei) und deren Beziehung zu Geologie und aktiver Tektonik. Ph.D. Thesis, ETH-Zürich, Zürich, Switzerland, 1995; p. 11340. [Google Scholar] [CrossRef]
- Imbach, T. Deep groundwater circulation in the tectonically active area of Bursa, Northwest Anatolia, Turkey. Geothermics 1997, 26, 251–278. [Google Scholar] [CrossRef]
- Akyol, N.; Akıncı, A.; Eyidogan, H. Site amplification of S-waves in Bursa City and its vicinity, Northwestern Turkey: Comparison of different approaches. Soil Dyn. Earthq. Eng. 2002, 22, 579–587. [Google Scholar] [CrossRef]
- Emre, Ö.; Duman, T.Y.; Özalp, S.; Elmaci, S.; Olgun, S.; Saroglu, F. Active Fault Map of Turkey with and Explanatory Text. In General Directorate of Mineral Research and Exploration; Special Publication Series-30; General Directorate of Mineral Research and Expansion (MTA): Ankara, Turkey, 2003. [Google Scholar]
- Reilinger, R.; McClusky, S.; Vernant, P.; Lawrence, S.; Ergintav, S.; Cakmak, R.; Ozener, H.; Kadirov, F.; Guliev, I.; Stepanyan, R.; et al. GPS constraints on continental deformation in the Africa-Arabia-Eurasia continental collision zone and implications for the dynamics of plate interactions. J. Geophys. Res. Solid Earth 2006, 111. [Google Scholar] [CrossRef] [Green Version]
- B.U. KOERI-RETMC (Boğaziçi University Kandilli Observatory and Earthquake Research Institute—Regional Earthquake-Tsunami Monitoring Center)—Earthquake Catalogue. Available online: http://www.koeri.boun.edu.tr/sismo/2/earthquake-catalog/ (accessed on 20 October 2018).
- Wikipedia, The Free Encyclopedia, Bursa, The View of Bursa Plain from the Hills of Mount Uludag. Available online: https://tr.wikipedia.org/wiki/Bursa (accessed on 26 November 2018).
- Sandwell, D.; Mellors, R.; Tong, X.; Wei, M.; Wessel, P. Open Radar Interferometry Software for Mapping Surface Deformation. Eos Trans. AGU 2011, 92, 234. [Google Scholar] [CrossRef]
- Farr, T.; Rosen, P.; Caro, E.; Crippen, R.; Duren, R.; Hensley, S.; Alsdorf, D. The shuttle radar topography mission. Rev. Geophys. 2007, 45. [Google Scholar] [CrossRef]
- Hooper, A. A Multi-temporal InSAR method incorporating both persistent scatterer and small baseline approaches. Geophys. Res. Lett. 2008, 35, L16. [Google Scholar] [CrossRef]
- Hooper, A.; Bekaert, D.; Spaans, K.; Arıkan, M. Recent advances in SAR interferometry time series analysis for measuring crustal deformation. Tectonophysics 2011, 514, 1–13. [Google Scholar] [CrossRef]
- Ferretti, A.; Prati, C.; Rocca, F. Permanent scatterers in SAR interferometry. IEEE Trans. Geosci. Remote Sens. 2001, 39, 8–20. [Google Scholar] [CrossRef] [Green Version]
- Bekaert, D.P.S.; Walters, R.J.; Wright, T.J.; Hooper, A.J.; Parker, D.J. Statistical comparison of InSAR tropospheric correction techniques. Remote Sens. Environ. 2015, 170, 40–47. [Google Scholar] [CrossRef] [Green Version]
- Dee, D.P.; Uppala, S.M.; Simmons, A.J.; Berrisford, P.; Poli, P.; Kobayashi, S.; Andrea, U. The ERA-Interim reanalysis: Configuration and performance of the data assimilation system. Q. J. R. Meteorol. Soc. 2011, 137, 553–597. [Google Scholar] [CrossRef]
- Wright, T.J.; Parsons, B.E.; Zhong, L. Toward mapping surface deformation in three dimensions using InSAR. Geophys. Res. Lett. 2004, 31, L01607. [Google Scholar] [CrossRef]
- Motagh, M.; Shamshiri, R.; Haghshenas Haghighi, M.; Wetzel, H.U.; Akbari, B.; Nahavandchi, H.; Roessner, S.; Arabi, S. Quantifying groundwater exploitation induced subsidence in the Rafsanjan plain, southeastern Iran, using InSAR time-series and in situ measurements. Eng. Geol. 2017, 218, 134–151. [Google Scholar] [CrossRef]
- Focareta, M.; Marcuccio, S.; Votto, C.; Ullo, S.L. Combination of Landsat 8 and Sentinel 1 data for the characterization of a site of interest. A Case Study: The Royal Palace of Caserta. In Proceedings of the 1st International Conference on Metrology for Archaeology, Benevento, Italy, 21–23 October 2015. [Google Scholar]
- Castellazzi, P.; Martel, R.; Rivera, A.; Huang, J.; Pavlic, G.; Calderhead, A.I.; Chaussard, E.; Garfias, J.; Salas, J. Groundwater depletion in Central Mexico: Use of GRACE and InSAR to support water resources management. Water Resour. Res. 2016, 52, 5985–6003. [Google Scholar] [CrossRef]
- Castellazzi, P.; Longuevergne, L.; Martel, R.; Rivera, A.; Brouard, C.; Chaussard, E. Quantitative mapping of groundwater depletion at the water management scale using a combined GRACE/InSAR approach. Remote Sens. Environ. 2018, 205, 408–418. [Google Scholar] [CrossRef]
- Béjar-Pizarro, M.; Guardiola-Albert, C.; García-Cárdenas, R.P.; Herrera, G.; Barra, A.; López Molina, A.; Tessitore, S.; Staller, A.; Ortega-Becerril, A.J.; García-García, R.P. Interpolation of GPS and geological data using InSAR deformation maps: Method and application to land subsidence in the alto guadalentín aquifer (SE Spain). Remote Sens. 2016, 8, 965. [Google Scholar] [CrossRef]
- Liu, R.; Zou, R.; Li, J.; Zhang, C.; Zhao, B.; Zhang, Y. Vertical Displacements Driven by Groundwater Storage Changes in the North China Plain Detected by GPS Observations. Remote Sens. 2018, 10, 259. [Google Scholar] [CrossRef]
- Chaussard, E.; Wdowinski, S.; Cabral-Cano, E.; Amelung, F. Land subsidence in central Mexico detected by ALOS InSAR time-series. Remote Sens. Environ. 2014, 140, 94–106. [Google Scholar] [CrossRef]
- Caló, F.; Notti, D.; Galve, J.P.; Abdikan, S.; Görüm, T.; Pepe, A.; Balik Şanli, F. Dinsar-based detection of land subsidence and correlation with groundwater depletion in Konya Plain, Turkey. Remote Sens. 2017, 9, 83. [Google Scholar] [CrossRef]
- Hiscock, K.M.; Bense, V.F. Hydrogeology: Principles and Practice; John Wiley & Sons: Hoboken, NJ, USA, 2009. [Google Scholar]
- Castellazzi, P.; Martel, R.; Galloway, D.L.; Longuevergne, L.; Rivera, A. Assessing groundwater depletion and dynamics using GRACE and InSAR: Potential and limitations. Groundwater 2016, 54, 768–780. [Google Scholar] [CrossRef]
Figure 1.
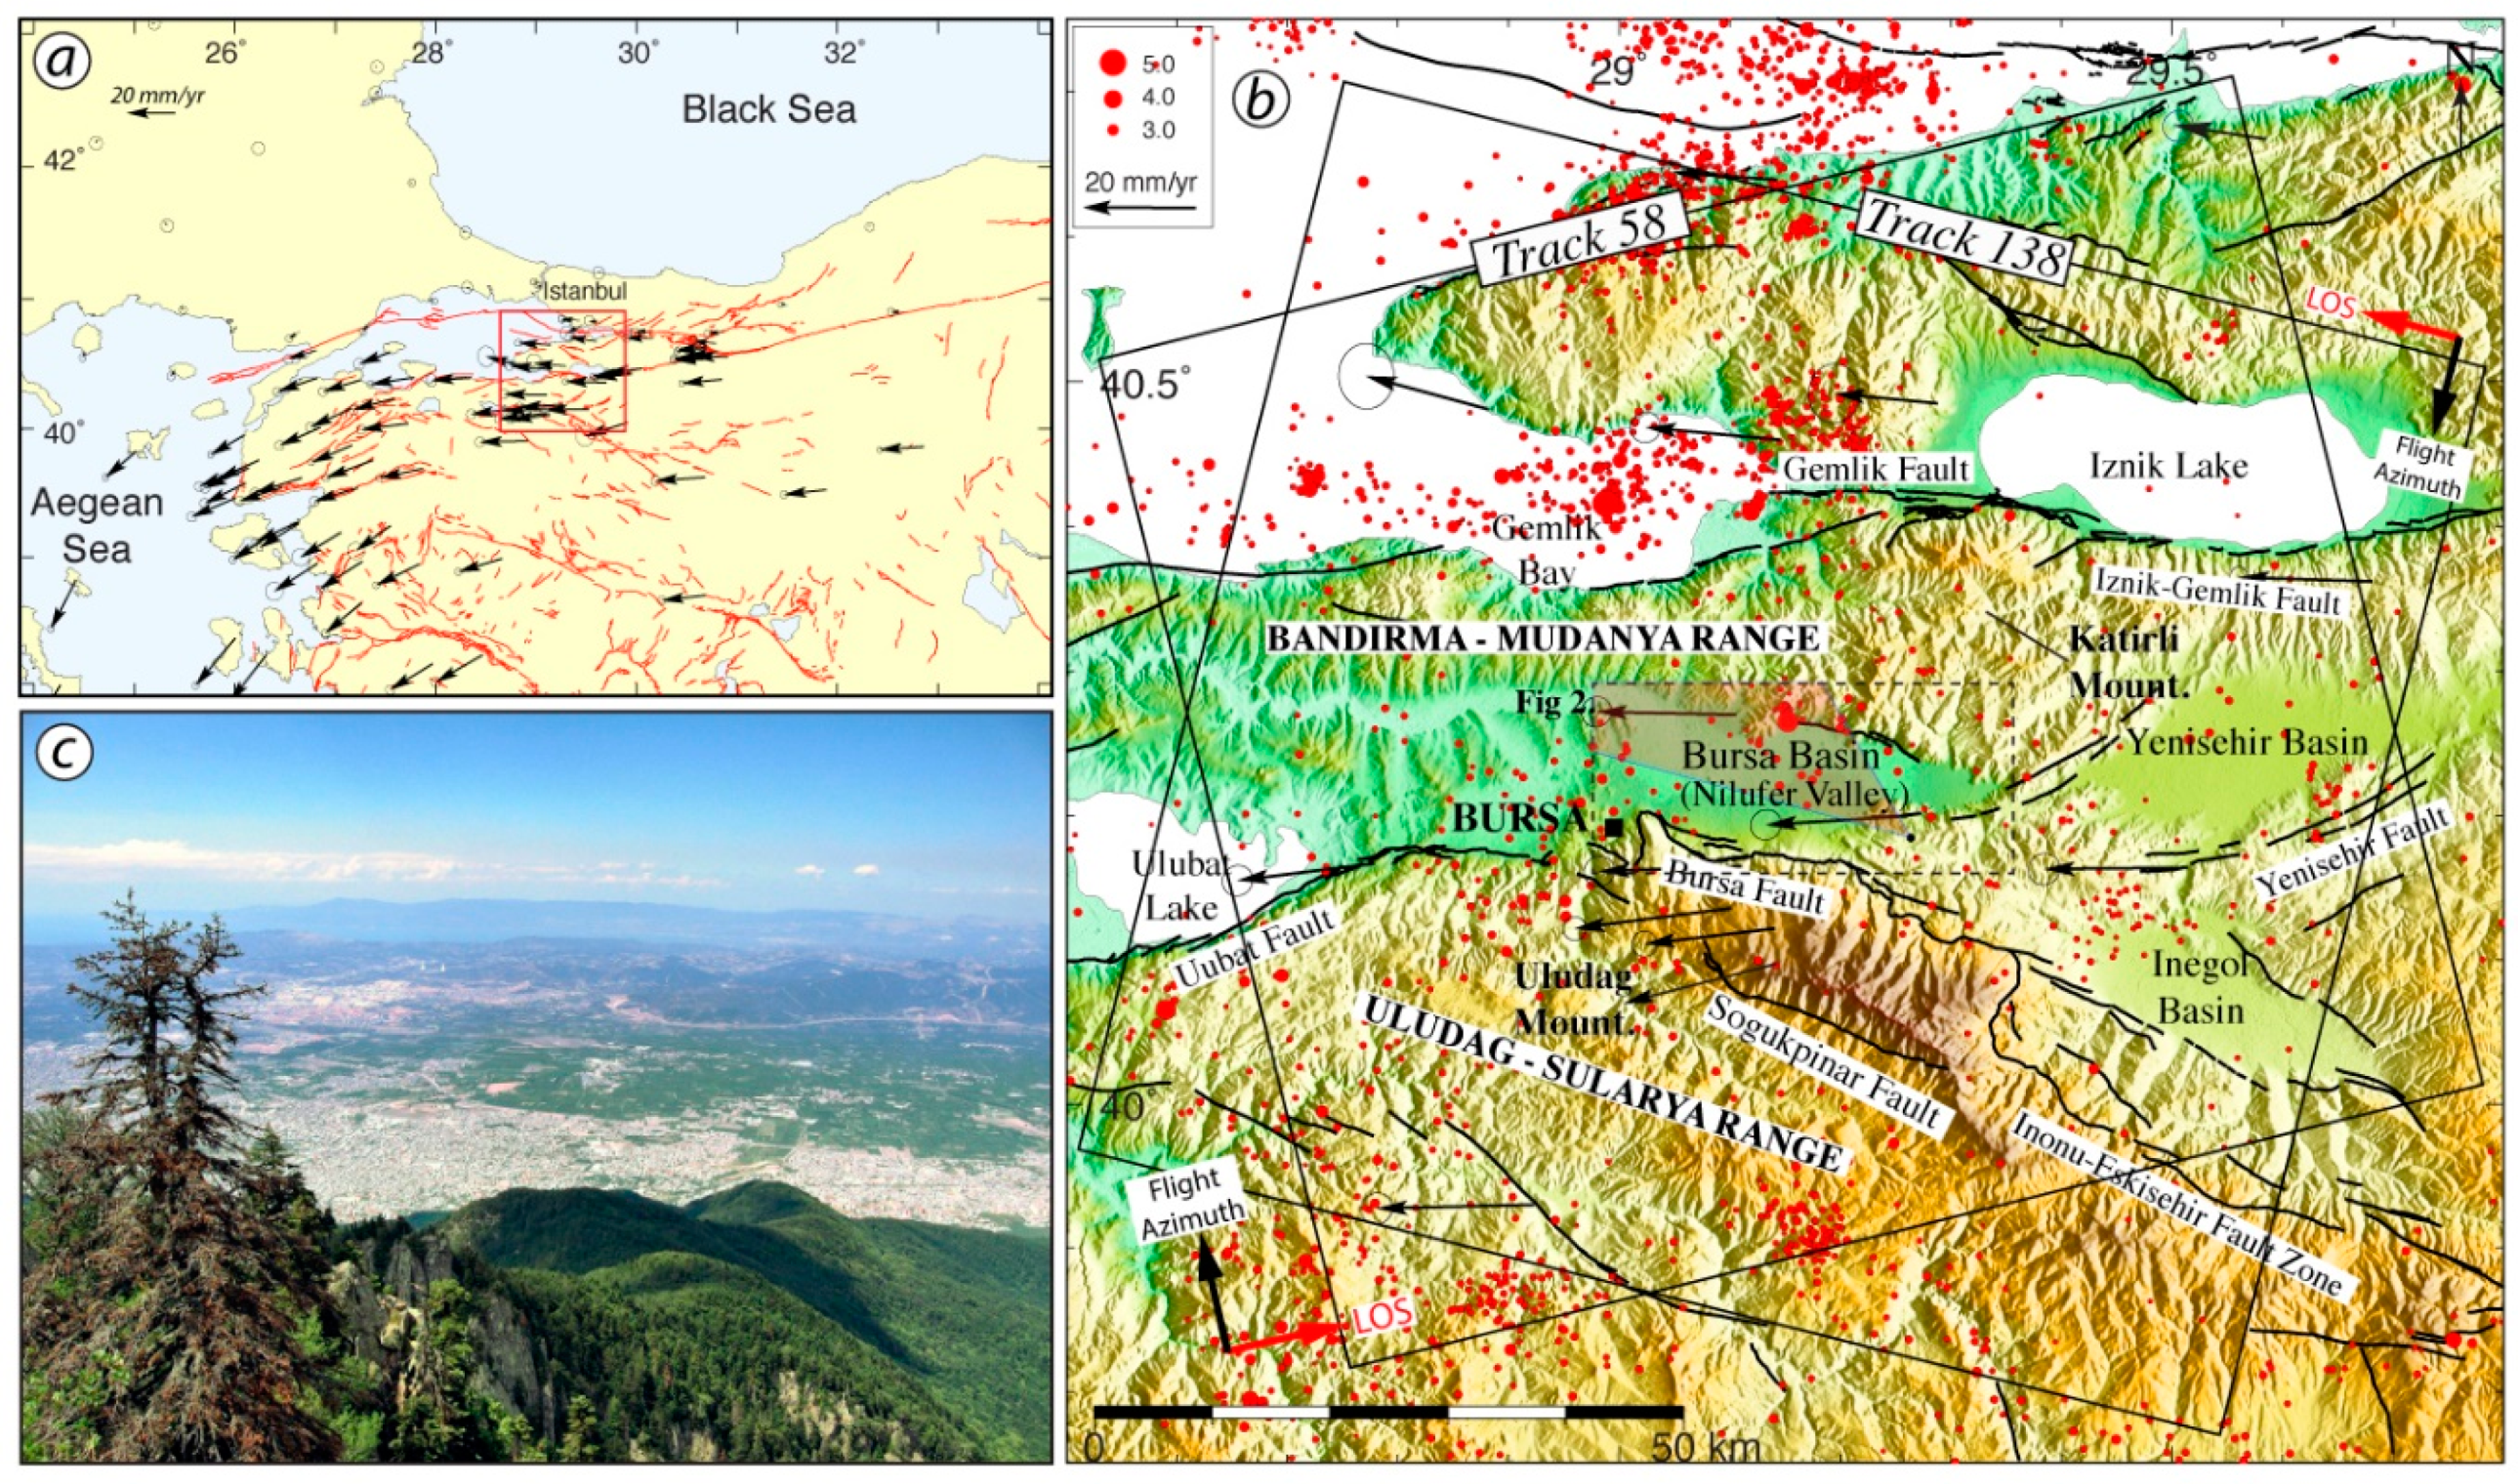
Study area and Sentinel-1 synthetic aperture radar data coverage used in the present study. (a) Map of northwestern Turkey with major active faults drawn in red [57] and GPS vector in a Eurasia fixed reference frame [58]. The plain red box highlights the region of interest. (b) Shaded topography from Shuttle Radar Topography Mission (SRTM) south of Marmara Region, with major active faults in black [57]. Rectangles labeled with track numbers indicate the coverage of the SAR (Synthetic Aperture Radar) images. Red and black arrows at the bottom left indicate the satellite’s line-of-sight look and flight directions, respectively. Red dots depict the seismicity of the region since 2005 [59]. Black arrows are GPS velocities with respect to fixed Eurasia [58]. (c) View of the Bursa Plain, looking to the North from the hills of Mount Uludag [60].
Figure 1.
Study area and Sentinel-1 synthetic aperture radar data coverage used in the present study. (a) Map of northwestern Turkey with major active faults drawn in red [57] and GPS vector in a Eurasia fixed reference frame [58]. The plain red box highlights the region of interest. (b) Shaded topography from Shuttle Radar Topography Mission (SRTM) south of Marmara Region, with major active faults in black [57]. Rectangles labeled with track numbers indicate the coverage of the SAR (Synthetic Aperture Radar) images. Red and black arrows at the bottom left indicate the satellite’s line-of-sight look and flight directions, respectively. Red dots depict the seismicity of the region since 2005 [59]. Black arrows are GPS velocities with respect to fixed Eurasia [58]. (c) View of the Bursa Plain, looking to the North from the hills of Mount Uludag [60].

Figure 2.
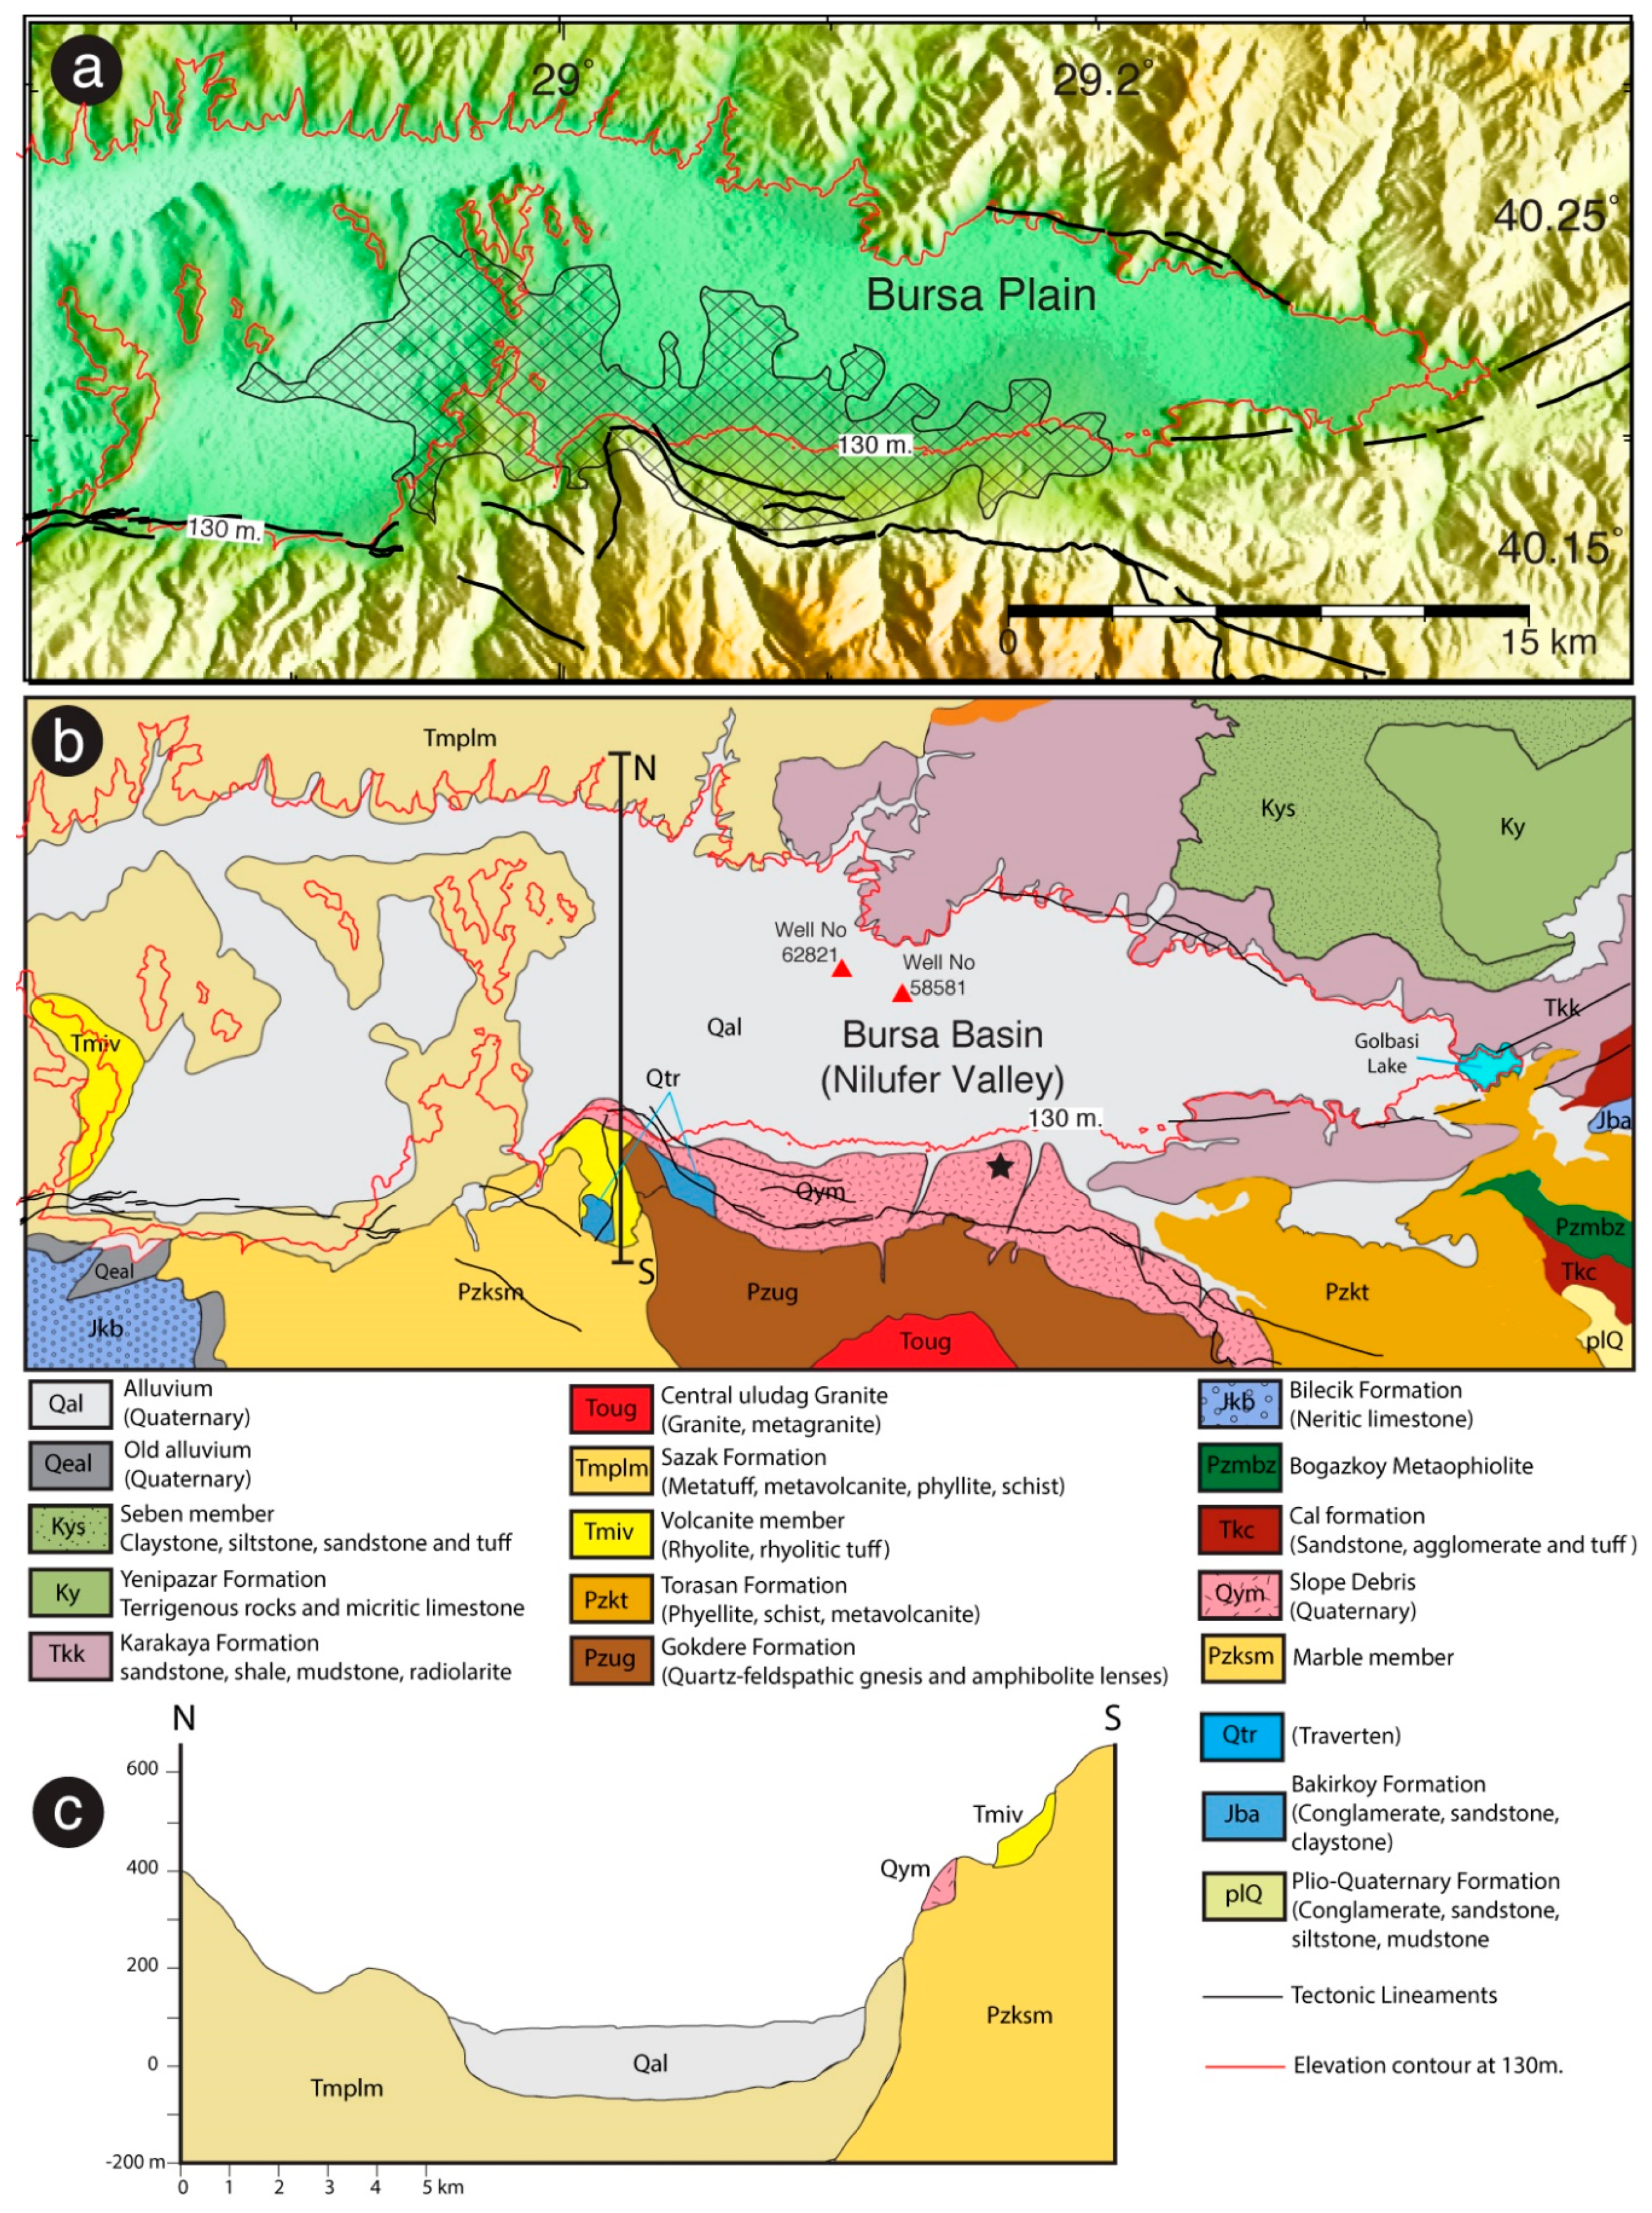
(a) Topographic view of the Bursa Plain. Elevation contour at 130 m surrounding the Bursa Plain is shown in red solid lines and major active faults in solid black lines [57]. The shaded area shows the extent of urbanization for Bursa. (b) Geological map of the study area simplified from MTA—Turkey General Directorate of Mineral Research and Exploitation 1/100,000 scale geology map. Red triangles show the locations of wells (well #58581 and #62821). Black star shows the area to which InSAR velocities are referenced. (c) North-south geological cross section of the Nilufer Valley from [52]; see profile location on Figure 2b.
Figure 2.
(a) Topographic view of the Bursa Plain. Elevation contour at 130 m surrounding the Bursa Plain is shown in red solid lines and major active faults in solid black lines [57]. The shaded area shows the extent of urbanization for Bursa. (b) Geological map of the study area simplified from MTA—Turkey General Directorate of Mineral Research and Exploitation 1/100,000 scale geology map. Red triangles show the locations of wells (well #58581 and #62821). Black star shows the area to which InSAR velocities are referenced. (c) North-south geological cross section of the Nilufer Valley from [52]; see profile location on Figure 2b.

Figure 3.
Baseline versus time plots for Sentinel-1 ascending tracks 58 and descending track 138 used in this study, with red dots at the time of image acquisitions. Blue dots indicate the master image used as a reference for each track. Gray lines connect pairs (single master interferograms). Temporal resolution of the dataset increased from 12 days until mid-2016 to 6 days (grey zone) after it, after the launch and starting of operational phase of Sentinel 1B.

Figure 4.
Line-of-sight (LOS) velocity maps from Sentinel 1A/B time-series analysis for the time period of 2014-2017. Positive velocities (cold colors) represent stable areas and displacement of the ground toward the satellite while negative velocities (warm colors) indicate displacement away from the satellite. Average line-of-sight velocity (a) on ascending track 58; and (b) on descending track 138. Elevation contours at 130 m around the subsiding Bursa Plain are shown in black solid lines. Shaded area shows the city extension of Bursa. Major active faults are drawn in red [57]. Black circles show the chosen location to illustrate the temporal evolution of the subsidence in Figure 8 referenced to a stable area (black solid star), considered as a stable area.

Figure 5.
Decomposition of LOS velocities into vertical component for Sentinel-1 data during the time period of 2014–2017. (a) Vertical mean velocity map. The warm colors represent the land subsidence relative to the reference area. The shaded area shows the Bursa city AA’ profile is shown in (b), BB’ profile in Figure 9. (b) East-west AA’ profile showing vertical displacement rates in black and altitude in red. (c) 5 mm/yr interval contour maps superimposed onto Landsat 8 image of 23 April 2018, in RGB combination of bands 7, band 6, and 4. Agriculture areas appear in shades of light green and yellow during the growth season and are located where the subsidence is the highest. Urban areas are in white, gray, or light purple colors [70].

Figure 6.
Quantitative comparison of the line-of-sight displacement rates between ascending and descending tracks. (a) Correlation between point measurements. (b) Differences analysis between T58 Ascending and T138 Descending tracks. Offset from zero is related to local viewing angles’ differences.
Figure 6.
Quantitative comparison of the line-of-sight displacement rates between ascending and descending tracks. (a) Correlation between point measurements. (b) Differences analysis between T58 Ascending and T138 Descending tracks. Offset from zero is related to local viewing angles’ differences.

Figure 7.
Effect of the looking geometry on the InSAR observations. (a) Simulated subsidence model induced by a single point source. (b) Expected LOS observations for ascending and (c) descending orbits. (d) Comparison of LOS displacements rates observed from ascending and descending orbits. (e) Cross section of the subsidence observations along the azimuth look directions (ALD).

Figure 8.
Temporal evolution of the subsidence of selected points within the black solid circle shown in Figure 4. Locations of well #58581 and #62821 are shown in Figure 2b. The blue line represents the displacement measured using T138 descending data, and the red line represents the displacement measured using the T58 ascending Sentinel 1 data. Orange and purple lines represent the water level at wells #58581 and #62821, respectively.

Figure 9.
Cross section showing vertical deformation rates in red and altitude in black taken from b–b’ profile shown in Figure 5a.
Figure 9.
Cross section showing vertical deformation rates in red and altitude in black taken from b–b’ profile shown in Figure 5a.

© 2019 by the authors. Licensee MDPI, Basel, Switzerland. This article is an open access article distributed under the terms and conditions of the Creative Commons Attribution (CC BY) license (http://creativecommons.org/licenses/by/4.0/).
Share and Cite
MDPI and ACS Style
Aslan, G.; Cakir, Z.; Lasserre, C.; Renard, F. Investigating Subsidence in the Bursa Plain, Turkey, Using Ascending and Descending Sentinel-1 Satellite Data. Remote Sens. 2019, 11, 85. https://0-doi-org.brum.beds.ac.uk/10.3390/rs11010085
AMA Style
Aslan G, Cakir Z, Lasserre C, Renard F. Investigating Subsidence in the Bursa Plain, Turkey, Using Ascending and Descending Sentinel-1 Satellite Data. Remote Sensing. 2019; 11(1):85. https://0-doi-org.brum.beds.ac.uk/10.3390/rs11010085
Chicago/Turabian StyleAslan, Gokhan, Ziyadin Cakir, Cécile Lasserre, and François Renard. 2019. "Investigating Subsidence in the Bursa Plain, Turkey, Using Ascending and Descending Sentinel-1 Satellite Data" Remote Sensing 11, no. 1: 85. https://0-doi-org.brum.beds.ac.uk/10.3390/rs11010085
Note that from the first issue of 2016, this journal uses article numbers instead of page numbers. See further details here.