Article

Assessing Correlation of High-Resolution NDVI with Fertilizer Application Level and Yield of Rice and Wheat Crops Using Small UAVs

National Agriculture and Food Research Organization, Kyushu Okinawa Agricultural Research Center, 496 Izumi, Chikugo, Fukuoka 833-0041, Japan
*
Author to whom correspondence should be addressed.
These authors contributed equally to this work.
Submission received: 20 November 2018 / Revised: 2 January 2019 / Accepted: 4 January 2019 / Published: 9 January 2019
(This article belongs to the Section Remote Sensing in Agriculture and Vegetation)

Abstract

:
The aim of this study was to use small unmanned aerial vehicles (UAVs) for determining high-resolution normalized difference vegetation index (NDVI) values. Subsequently, these results were used to assess their correlations with fertilizer application levels and the yields of rice and wheat crops. For multispectral sensing, we flew two types of small UAVs (DJI Phantom 4 and DJI Phantom 4 Pro)—each equipped with a compact multispectral sensor (Parrot Sequoia). The information collected was composed of numerous RGB orthomosaic images as well as reflectance maps with spatial resolution greater than a ground sampling distance of 10.5 cm. From 223 UAV flight campaigns over 120 fields with a total area coverage of 77.48 ha, we determined that the highest efficiency for the UAV-based remote sensing measurement was approximately 19.8 ha per 10 min while flying 100 m above ground level. During image processing, we developed and used a batch image alignment algorithm—a program written in Python language–to calculate the NDVI values in experimental plots or fields in a batch of NDVI index maps. The color NDVI distribution maps of wide rice fields identified differences in stages of ripening and lodging-injury areas, which accorded with practical crop growth status from aboveground observation. For direct-seeded rice, variation in the grain yield was most closely related to that in the NDVI at the early reproductive and late ripening stages. For wheat, the NDVI values were highly correlated with the yield ( R 2 = 0.601–0.809) from the middle reproductive to the early ripening stages. Furthermore, using the NDVI values, it was possible to differentiate the levels of fertilizer application for both rice and wheat. These results indicate that the small UAV-derived NDVI values are effective for predicting yield and detecting fertilizer application levels during rice and wheat production.

Graphical Abstract

1. Introduction

Small commercial UAVs–often referred to as drones–are conspicuous newcomers providing easy cost-efficient measurements for use in remote sensing science. Presently, most small commercial UAVs on the market have the ability to fly autonomously and to survey crops from overhead for detailed observation. Particularly for unobstructed areas free of interference, such as in sparsely populated agricultural and forestry land, UAVs on autopilot can fly much more widely and safely for acquiring significant sensing imagery. When using automatic flight, it is possible for a UAV to resume flight from a break waypoint for battery replacement, allowing the photogrammetry area to be dozens of hectares or more. The acquired high-resolution orthomosaic imagery gives researchers and growers enormous advantages for accurate observation and measurement in agricultural and environmental applications. In a few recent studies, UAV-based high-resolution imagery was proposed for estimating the plant density of wheat (Triticum aestivum L.) [1], ascertaining the canopy height and aboveground biomass of maize (Zea mays L.) [2] or grassland [3], predicting the yield of rice (Oryza sativa L.) [4,5] or wheat [6], quality assessment of digital surface models (DSMs) [7], and land cover classification [8]. Many more applications of UAVs for agroforestry and environmental monitoring can be found in recent review papers [9,10,11].
The observation and assessment of the overall plant growth in a local area requires a fusion of technologies with regard to UAVs, image processing, and crop growth diagnosis [9,10]. Technological advancements such as automatic flight and user-friendly controls for small commercial UAVs have enabled convenient one-man operation of UAVs flying over fields on-demand. As proposed in [12], the high-resolution images provide substantially more significant signals for perceiving or predicting the physiological variations during plant vegetation processes. Flying small UAVs at low altitude, the on-board camera or multispectral sensor can easily capture very high-resolution images with spatial resolution better than 10 cm ground sampling distance (GSD).
The attached camera or sensor type is determined by the objectives of the monitoring and assessment of plant growth. Except certain active sensors such as LiDAR for detecting canopy height [13], most UAV sensors are referred to as RGB, near-infrared (NIR), multispectral, hyperspectral, or thermal cameras. The RGB cameras are typically applied for acquiring visual imagery of plant growth; assessing plant density, canopy height, and amount of biomass; mapping plant area [14]; and approximately observing crop nitrogen status [15]. Nevertheless, images captured by RGB cameras are not effective for assessing vegetation characteristics, owing to the absence of information on the invisible light spectrum. A lightweight multispectral camera is generally designed for capturing the distinctive reflectance signal of plants in several narrow bands of the visible, red edge, or NIR regions. It exhibits the advantages of lower cost and more convenient operation than a hyperspectral camera, which captures accurate and particular signals for diversified applications [16,17]. Furthermore, the narrow band sensors of a multispectral camera are more sensitive to subtle variation in crop health than that of a modified NIR camera [18]. At present, similar to RGB cameras, multispectral cameras offer sufficient capability for monitoring and assessing plant growth [10].
Because the reflectance values of plants vary in response to environmental changes in sunshine irradiance, solar angle [19], soil background, and water glint [20,21], reducing sampling noise due to these environmental changes for UAV-based measurement is crucial for accurate and stable data acquisition. This is particularly so for long-term measurement during an entire crop-growing season. Several multispectral cameras such as compact Parrot Sequoia, MicaSense RedEdge, and RedEdge-M are equipped with a light sensor that can record both reflectance and incident solar radiation. The reflectance deviation related to changes in sunshine or cloud influence is calibrated in the subsequent image processing; thus, the reflectance values become more reliable. Researchers have recently observed the advantages of these compact multispectral cameras and contributed technical experience [22] (in preprint) and applications for hierarchical land cover and vegetation classification [23], monitoring post-fire vegetation regeneration in large and heterogeneous burned areas of approximately 3000 ha [24], and observing wheat phenotypes based on vegetation indices (VIs) [6,25].
With spectral images captured by a multispectral camera, it is convenient to create an index map of spectral VIs such as NDVI and normalized difference red edge index (NDRE) [21,26]. The high spatial resolution VIs are subsequently analyzed and segmented in order to detect growth diversity [27] or predict yield and optimal harvesting time [6]. They are particularly significant for monitoring relatively small crop plants such as rice, wheat, and soybean (Glycine max. (L.) Merr.), which are widely cultivated in flat lowland areas. Referring to the spectral VIs as well as the RGB images, growers or agronomists are capable of observing the overall growth status in the field and rapidly identifying problem areas of stress, disease occurrence, or nutrient deficiency.
Because crop growth status always varies with environmental changes over time, analyzing the time-series variation in crop growth requires long-term measurement of the crop plants during an entire crop-growing season. An ideal solution is use of long-term time-series of satellite imagery [28,29,30] or aerial photographs from manned aircraft [16,27]. The use of the satellite imagery could be applicable to very large-scale farming, but it does not seem realistic for smallholder farming due to lack of flexibility for on-demand application. The smallholder farming accounts for the greatest proportion in our study area in the southwestern Japan. The average cultivated land size for single farm entity in this area is 1.8 ha [31], which is ordinarily comprised of several small and dispersed fields. For the smallholder farming, even using the satellite imagery with high resolution of 1 m GSD such as WorldView series multispectral imagery [32,33], the spatial resolution is not sufficient to differentiate the growth status between these small fields. An easy and on-demand UAV-based system offering very high-spatial resolution imagery is adequate to observe and assess the crop growth for the smallholder farming.
In this study, consequently, we put emphasis on (1) constructing the small UAV-based multispectral sensing system and assessing its operating efficiency at different above-ground levels (AGLs); (2) developing a batch image alignment (BIA) algorithm for aligning and quantifying the NDVI values from a batch of index maps generated with or without use of ground control points (GCPs); (3) evaluating UAV-derived high resolution NDVI for predicting yield, and (4) estimating the effects of nitrogen fertilizer treatment on NDVI values. The main targets in the study were two lowland crops, rice and wheat, used in a double cropping system within the study area.

2. Materials and Methods

2.1. High-Resolution Aerial Imagery Acquisition

The high-resolution aerial images were captured by an on-board RGB camera and multispectral camera attached on each of the following two types of UAVs: DJI Phantom 4 and DJI Phantom 4 Pro (DJI, Hong Kong, China) (Table 1). The DJI Phantom 4 Pro has weight approximately equal to that of the DJI Phantom 4, whereas the on-board camera sensor differs in CMOS size, lens, focal length, and image resolution. The multispectral sensor of the Parrot Sequoia was mounted on the DJI Phantom 4 or the DJI Phantom 4 Pro by a customized mount (Zcopters, Cataluna, Spain) that is capable of incorporating an additional operating battery for the sensor. Attaching the battery and the sensor reduces the maximum flight time of the UAV from the original 30 min to approximately 16 min. The Parrot Sequoia sensor is composed of an RGB camera and four spectral cameras for the spectral bandwidths (full width half maximum bandwidth) of green 530–570 nm, red 640–680 nm, red-edge 730–740 nm, and NIR 770–810 nm. The sensor can simultaneously capture and store an RGB image of 4608 × 3456 pixels and four monochrome images of 1280 × 960 pixels. The images contain illumination data for calibrating the irradiance on all sunny or cloudy days, and Global Positioning System (GPS) data for constructing a geographical reflectance map.
Acquiring high-resolution aerial imagery requires autonomous flight on a pre-defined flight route, particularly when flying over wide fields. The forward and side overlap for the autonomous flight are highly critical for successfully constructing RGB orthomosaic image or reflectance map. For an autonomous flight plan constructed by certain automatic flight control applications such as DJI GS Pro (DJI, Hong Kong, China) or Pix4D Capture (Pix4D S.A., Lausanne, Switzerland), the overlap should be calculated by the specification parameters of the multispectral camera. The shutter interval for the on-board RGB camera and the multispectral camera should also be determined in advance.
The operating efficiency depends on the forward and side overlap, time interval for capture, and flight altitude. We measured the average operating efficiency from 223 automatic flights at 30, 50, and 100 m AGLs. The multispectral sensing was conducted from August 2017 to May 2018, within a 5 h time window around solar noon, with wind speed below 5 m/s and air temperature higher than 5 C. The times when the sunlight was partly obscured in the sensing area were avoided to guarantee relatively consistent light conditions during the flight. For flooded rice fields, a 3 h window around the solar noon on sunny days was removed from the photogrammetry because of a high water glint. Before UAV takeoff, three sets of calibration panel images of the reflectance panel (MicaSense, Seattle, WA, USA) were captured to calibrate the reflectance values in reflectance maps. For each flight, we manually triggered the capture of data at 1.5 s intervals by the Parrot Sequoia sensor before takeoff, and after landing, stopped it in the same way.

2.2. Image Processing

Using interval capturing, one autonomous flight could produce six image sets: four multispectral image sets of the green, red, red-edge, and NIR bands; and two RGB image sets of the UAV on-board camera and the Parrot Sequoia. The four multispectral image sets and the two RGB image sets were used to construct multispectral reflectance maps of the four bands and RGB orthomosaic image, respectively. We prefer to use the RGB image set of the UAV on-board camera owing to its high resolution. The images sets were processed by Pix4D Mapper Pro (Pix4D S.A., Lausanne, Switzerland). The PC used to run the software included a Core i7-7700K CPU (4.2 GHz, 4 cores), 32 GB of memory, and a graphics accelerator with 2560 GPU cores (NVIDIA GeForce GTX 1080 8 GB).
The process of generating orthomosaic RGB images was performed after marking five or more pre-defined GCPs on the raw RGB images, for which the GPS coordinates were derived from Google satellite map. The GCPs referred to certain conspicuous ground objects that were not moved both in the study area and on the Google satellite map during the entire photogrammetry period. The orthomosaic RGB images were dispensable if only concerned with VI index maps. Before the process of generating the reflectance maps, we performed radiometric calibration of multispectral images using “Camera and Sun Irradiance” in the processing options of the Pix4D Ag Multispectral project. Because the output reflectance maps and NDVI index maps had sufficient alignment accuracy, most of the projects used to generate the reflectance maps were processed without using GCPs. For those output index maps with noticeable distortion or alignment accuracy that was too poor, we defined five or more GCPs and regenerated the maps.
Owing to GPS errors in the captured raw images, the output reflectance or index maps generally contained different boundaries of areas that covered the experimental plots or fields. Hence, we developed the BIA algorithm that was responsible for an affine transform from the original reflectance or index map to a normalized one in which the experimental plots or fields all have identical size and position. Unlike image masking for satellite imagery [34], we defined a masking region as only the area of the experimental plot or field is included. The affine transformation was applied to each normalized destination image based on a matrix v, which was calculated from three pairs of affine transform points (ATPs) in the source reflectance or index map and a basis image. The algorithm rapidly read a batch of reflectance or index maps and automatically quantified the average NDVI values in the specified plots. The BIA algorithm was programmed in Python language, and its pseudo-code is briefly described as follows:
00:begin
01: initialize the three ATPs in the basis image IM b ;
02: initialize a set of source reflectance or index maps IM with the size z;
03: initialize the regions of the experimental plots or fields P with the size n;
04:for i = 1 to z
05:  calculate v i using three pairs of ATPs in IM i and IM b ;
06:  apply the affine transformation to IM i by V i ;
07:  for j = 1 to n
08:   create a mask for P j ;
09:   cut the masked image and obtain the statistical indices in P j ;
10:  end for
11:  save the statistical indices of each P to a summary file;
12:end for
13: save the total summary indices for all source reflectance or index maps;
14:end
where IM consisted of data including field name, image date, camera type, flight altitude, and the position coordinates of the three ATPs and the target plots or fields. Referring to the method proposed in [35], we assessed the accuracy for index map alignment using pixel coordinates of of 7–18 check points.
Using the reflectance maps from the green, red, red-edge, and NIR bands, we obtained the NDVI index map by inputting the formula (Equation (1), [36,37]) into the index calculator of Pix4D Mapper Pro.
NDVI = ( N I R r e d ) / ( N I R + r e d )

2.3. Study Sites for Field Experiment Design and Measurements

Because the warm temperate climate and abundant water resources in our study area enable double cropping, our study crops include rice as well as wheat. 
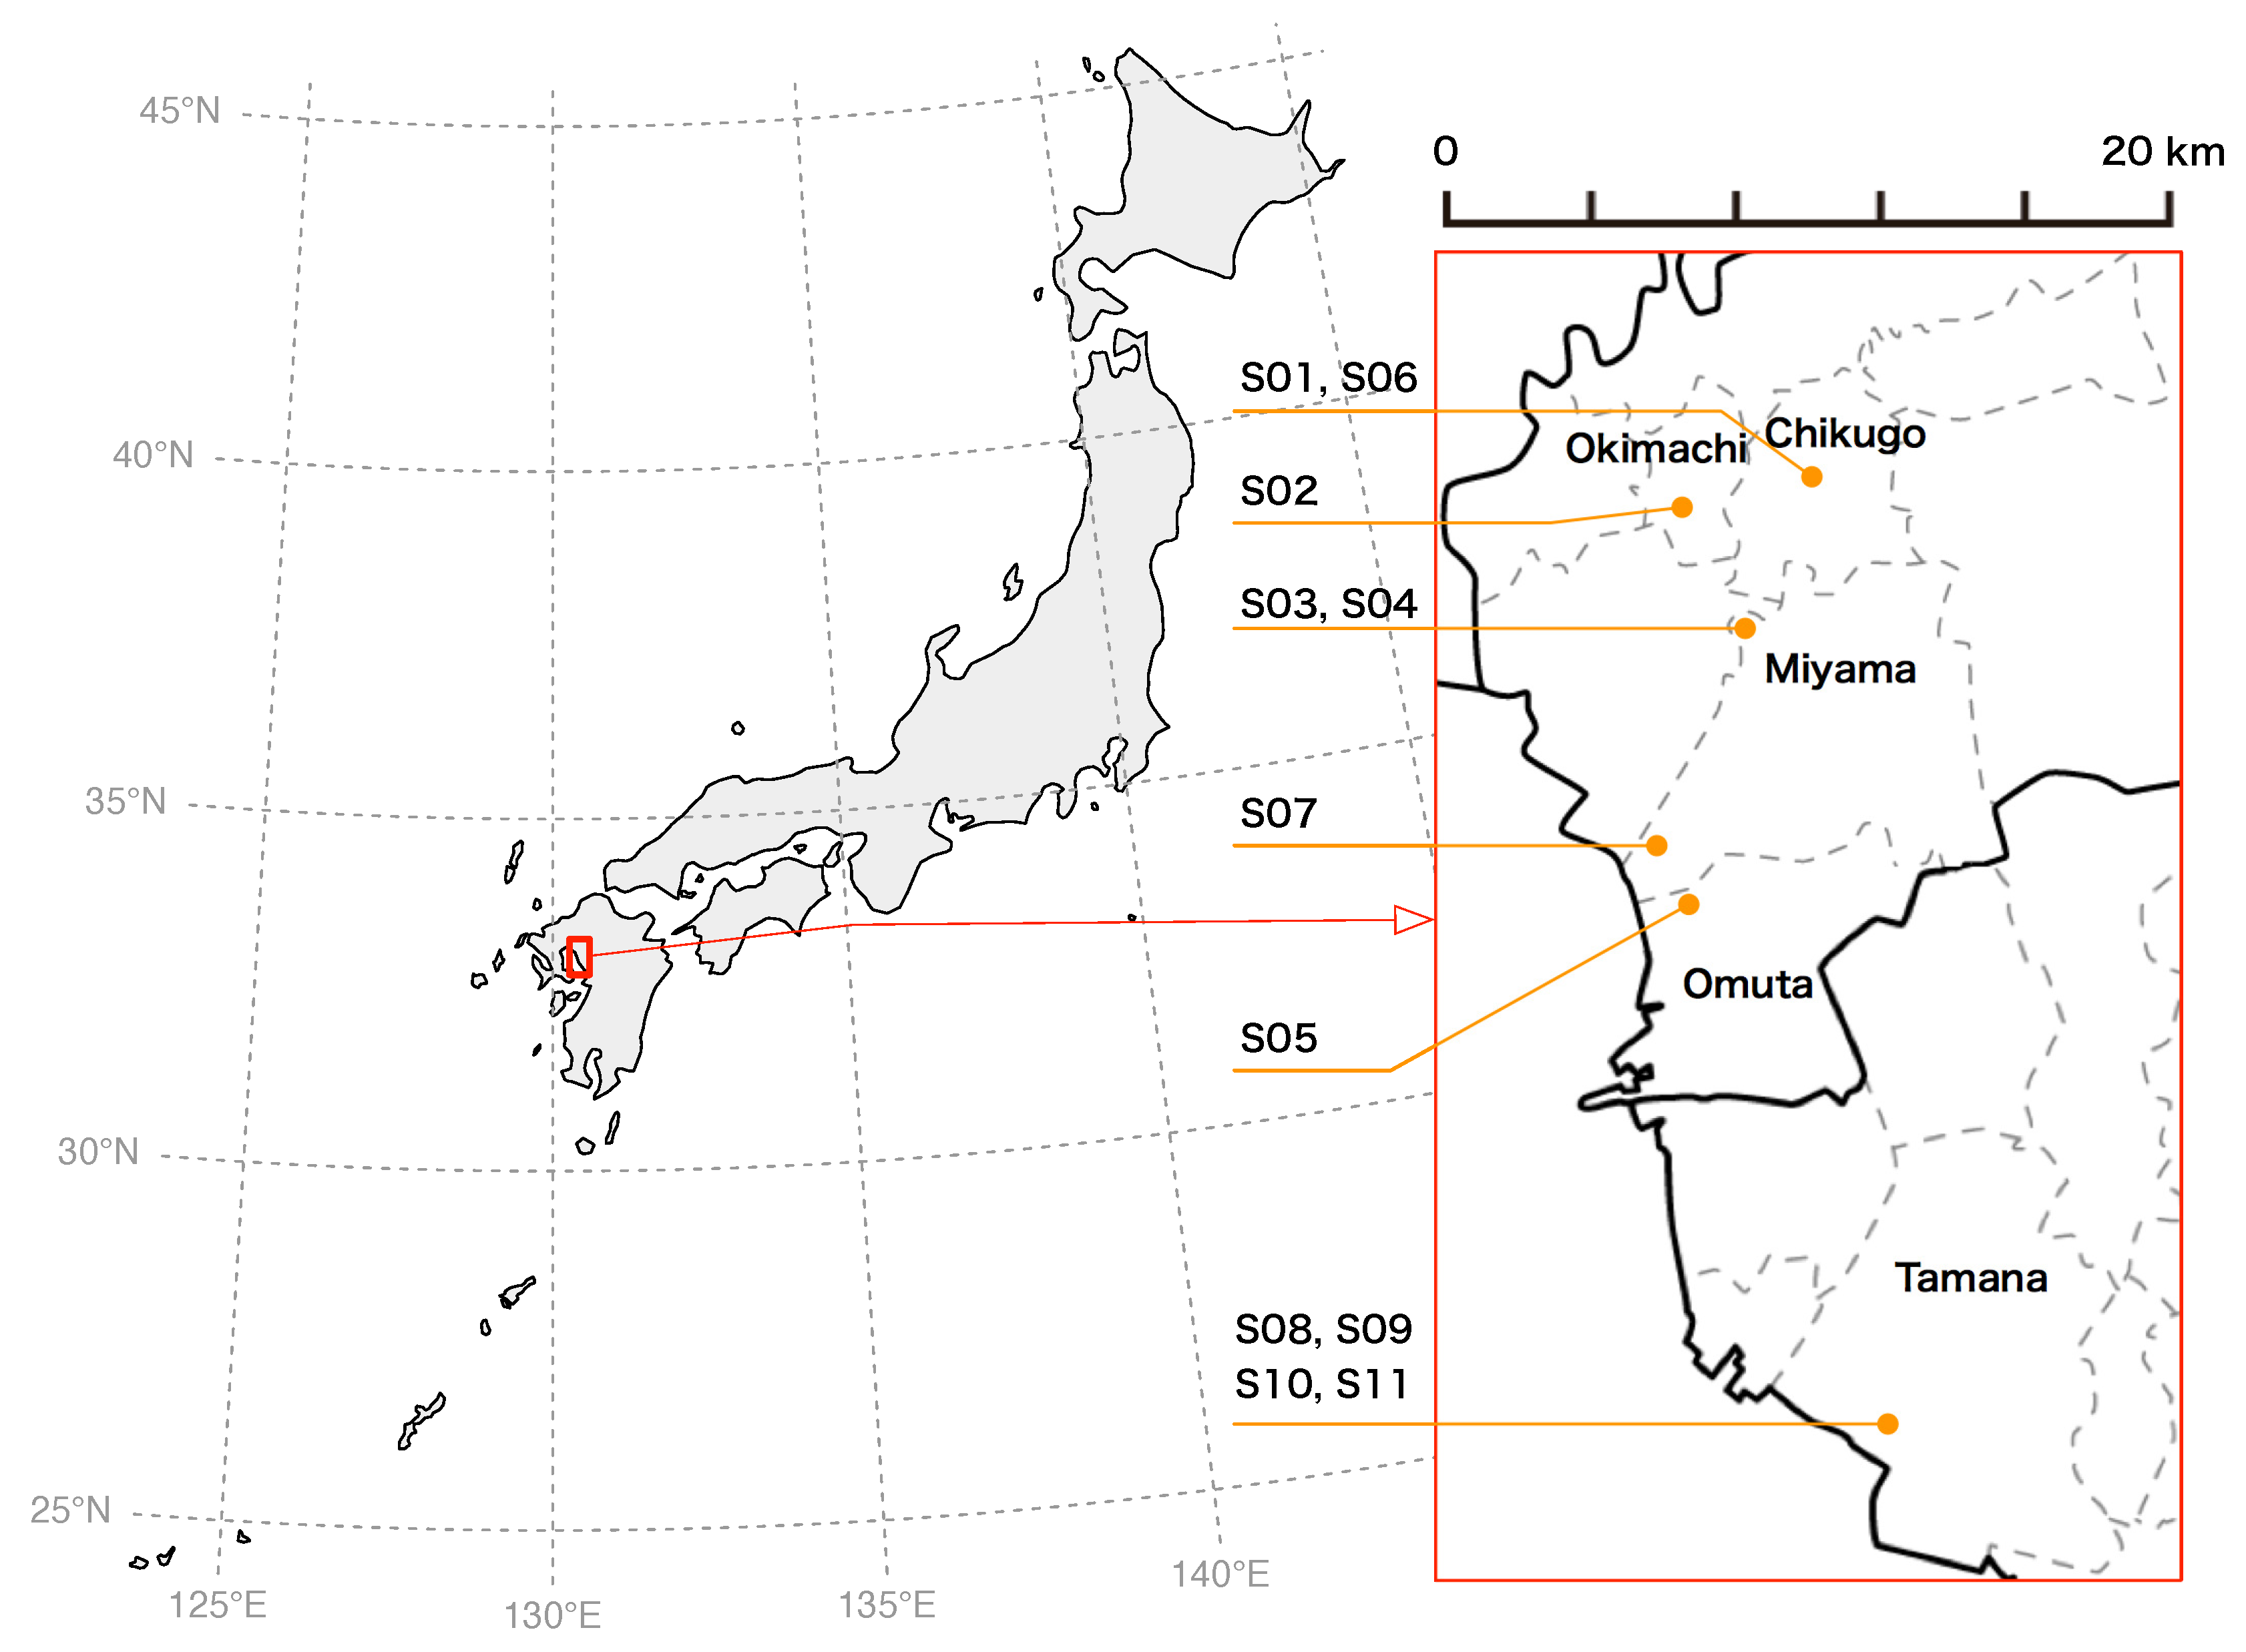
Table 2 lists the geographical condition, field area, and cultivated crop types of the 11 sites comprising 120 fields. Highly-mechanized farms in fields with an average size of less than 1.0 ha represents the typical farming style for this region. The map of the study sites is shown in Figure 1.
The eleven study sites were segmented into two groups according to research purpose. The first group was composed of S 01 S 05 and was designed to assess the relations between the VIs and yield. The UAV-based multispectral sensing was periodically conducted at approximately 7–10-day intervals, whereas the fields in the first group were measured on the same day (or 1–2 days before or after). The second group including S 06 S 11 was designed for evaluating the remote sensing efficiency and for a trial of discrimination of normally grown rice crop from weeds and lodged rice crops by NDVI. The details of the growing condition for the former group are described in the following sub-sections.

2.3.1. Rice Cultivation Methods by Direct Seeding

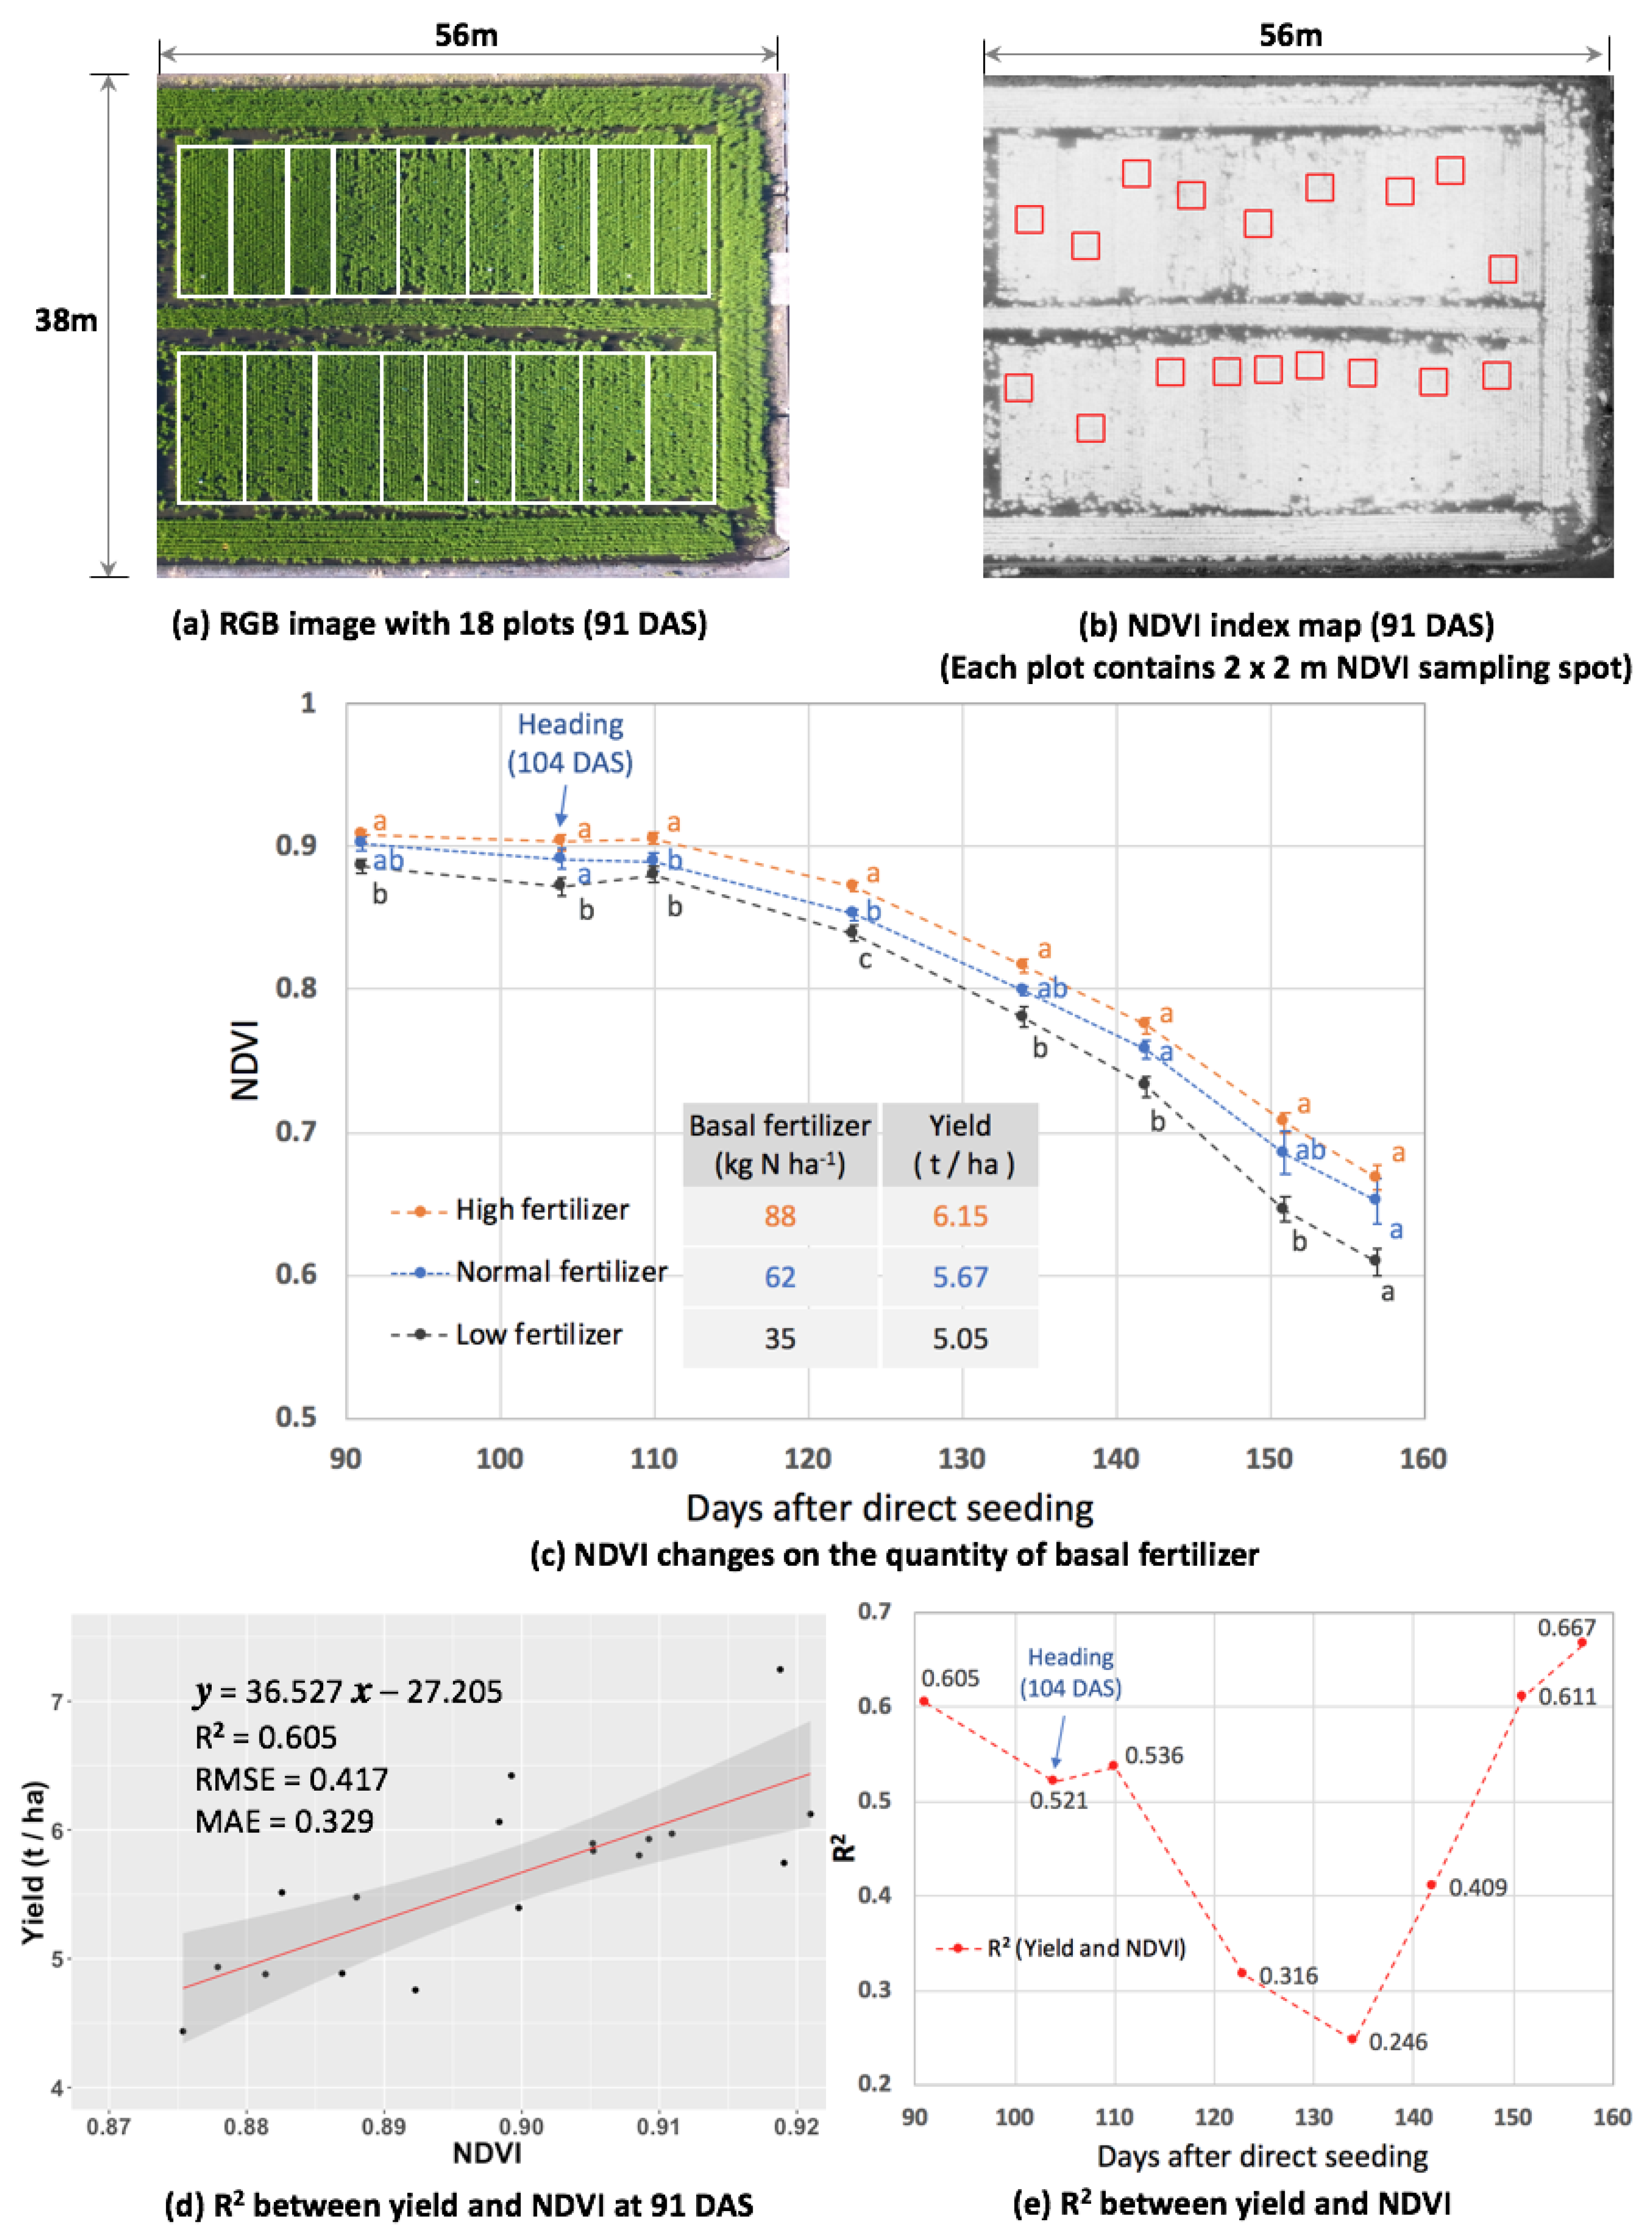
Although transplanting accounts for an overwhelming proportion of rice production, growing rice by direct seeding is gradually on the increase in our study area. The study site S 01 was designed to assess the relationships between NDVI and growth parameters for the dry direct seeded rice in 2017 (Okami et al., in preparation). The experiments covered 18 plots subjected to two seeding-methods—lane direct seeding and ridge-making direct seeding [38]—and three levels of slow-releasing basal fertilizer treatments—88.5, 61.5, and 35.5 kg N ha 1 (20% N, 10% P 2 O 5 , and 12% K 2 O, respectively) with three replications. The UAV photogrammetry was carried out at 30 m AGL, such that the GSD of the RGB orthomosaic image and the NDVI index map reached 1.3 cm and 3.2 cm, respectively. By using the proposed algorithm, the NDVI value of each plot was calculated as the average value of a 1.6 × 1.6-m 2 area in the NDVI index map. Because the UAV multispectral sensing was conducted starting from the early reproductive stage of rice, the NDVI values from 91 days after seeding (DAS) only were available. The final yield was sampled at an identical unit acreage 2.7 m 2 of each plot and measured from the weight of brown rice of thickness 1.8 mm or above and 15% water content.

2.3.2. Wheat Grown under Different Conditions

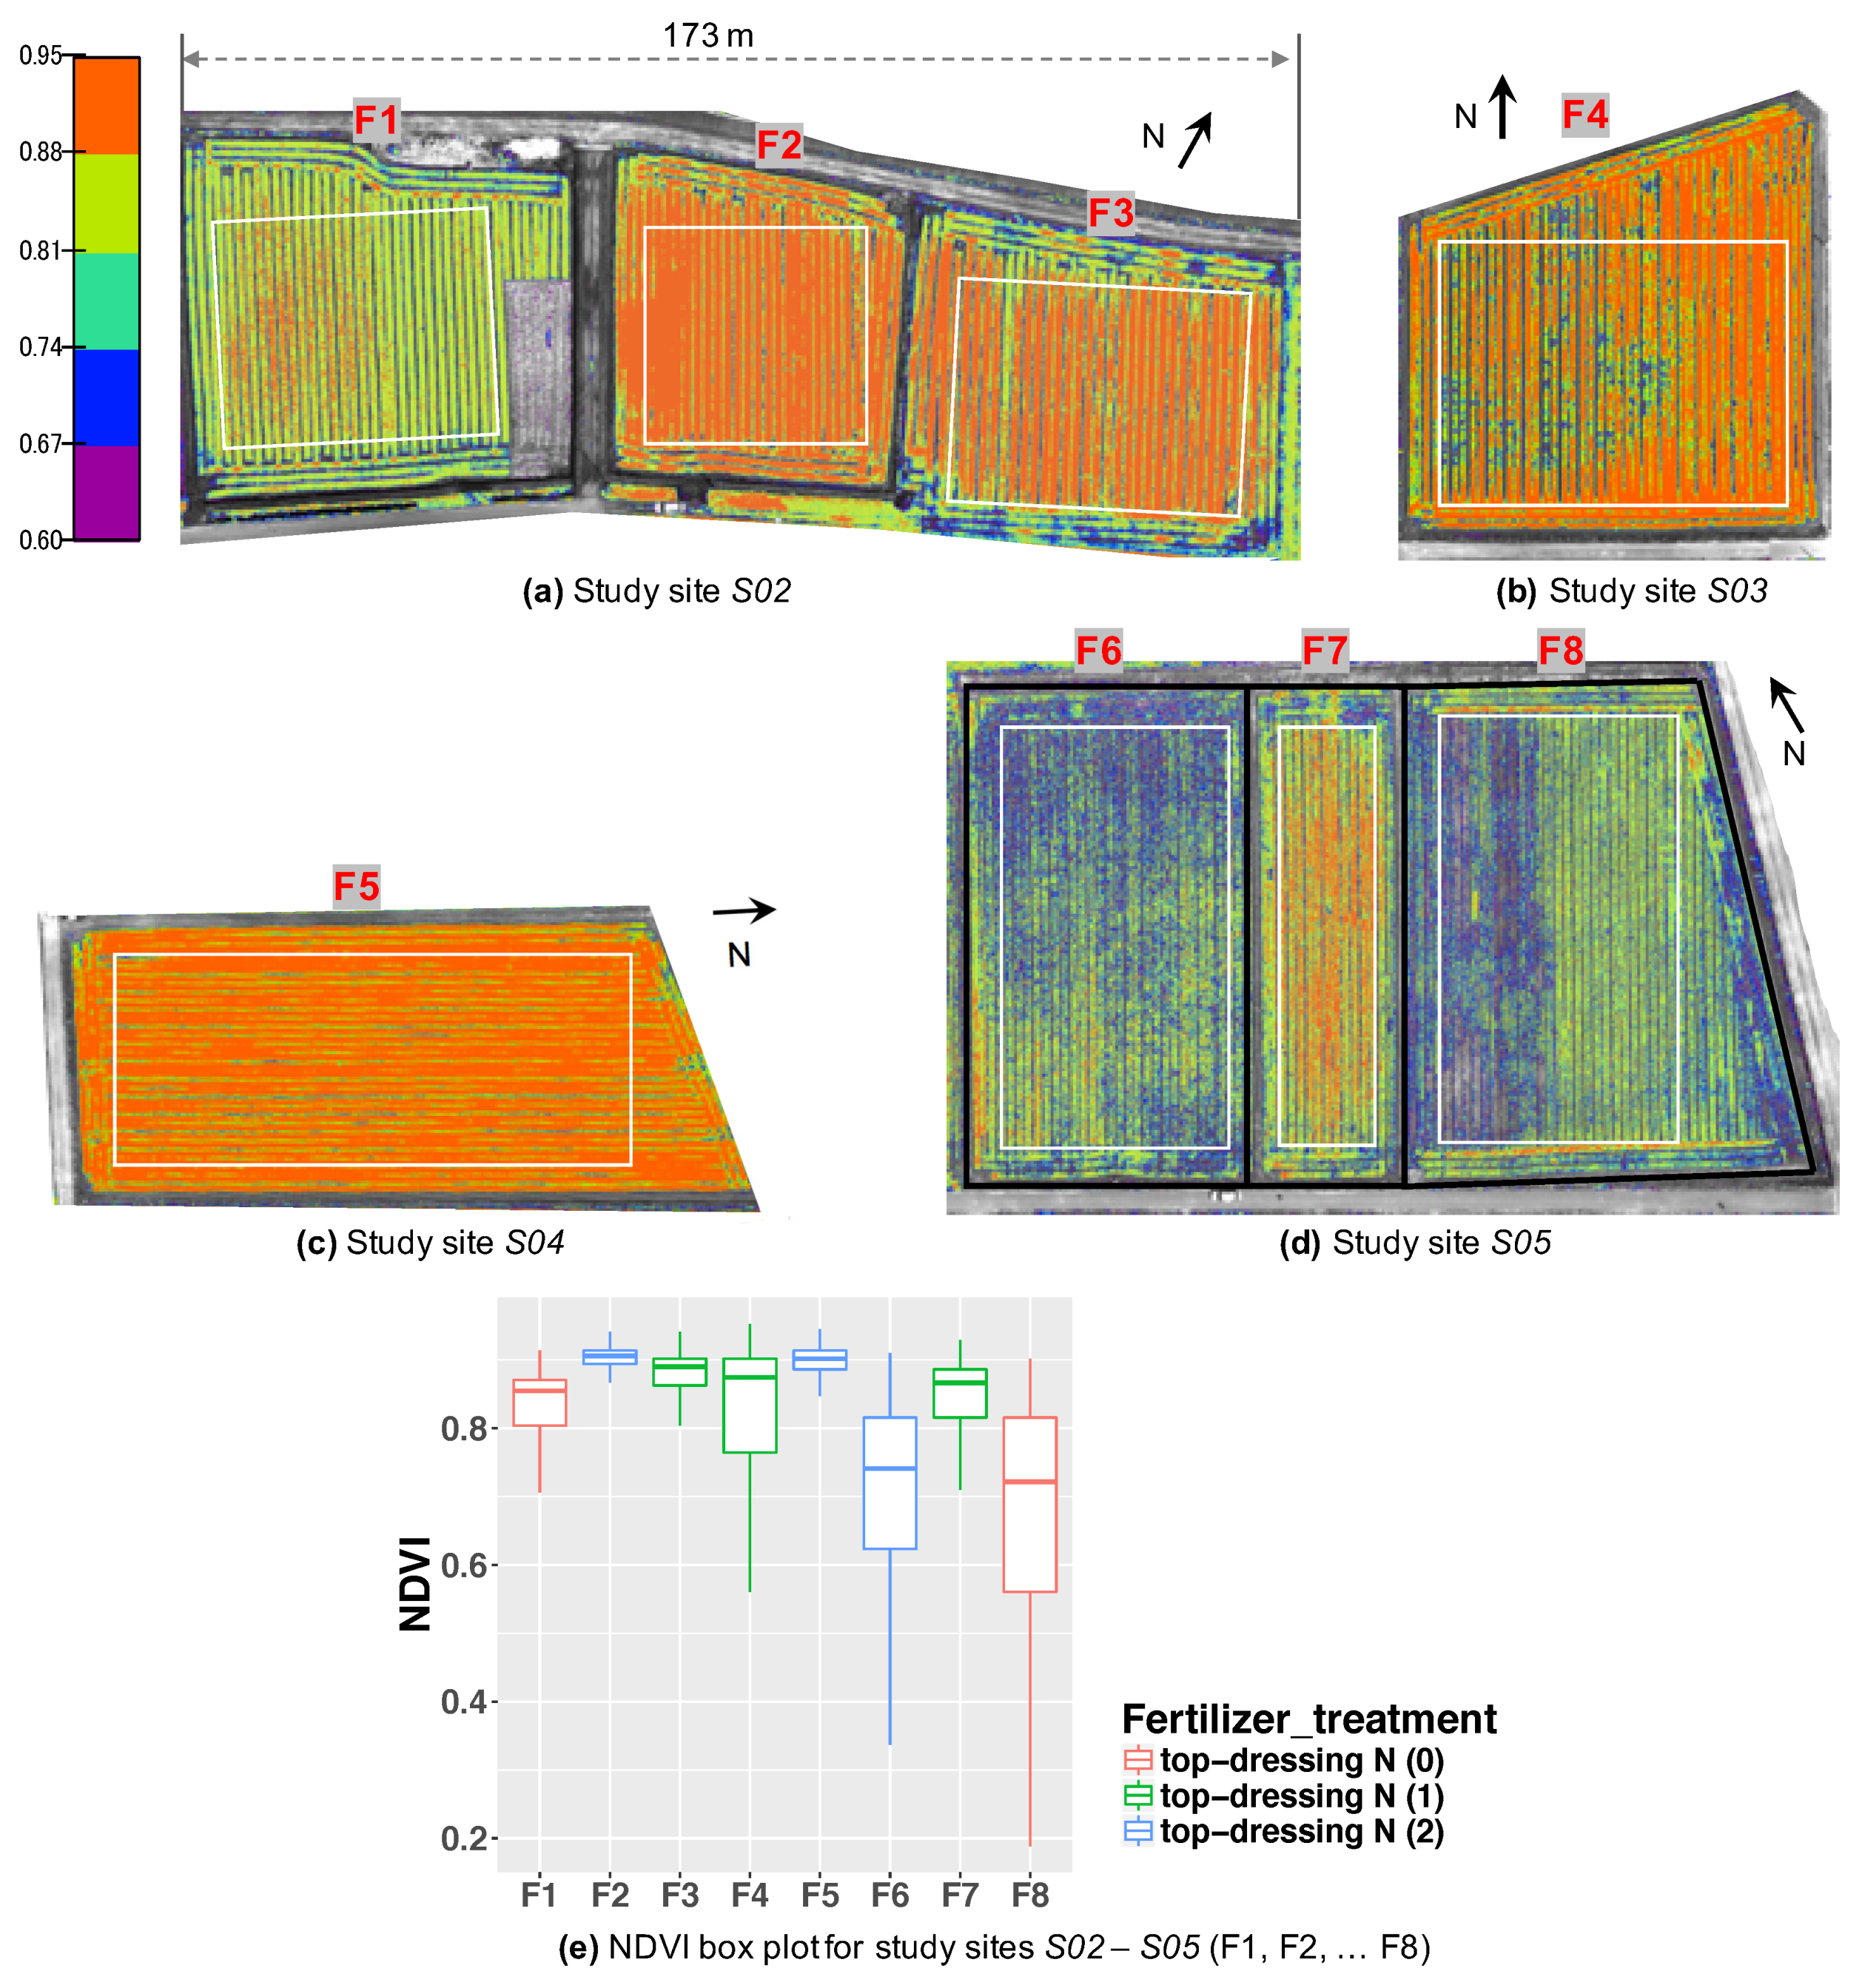
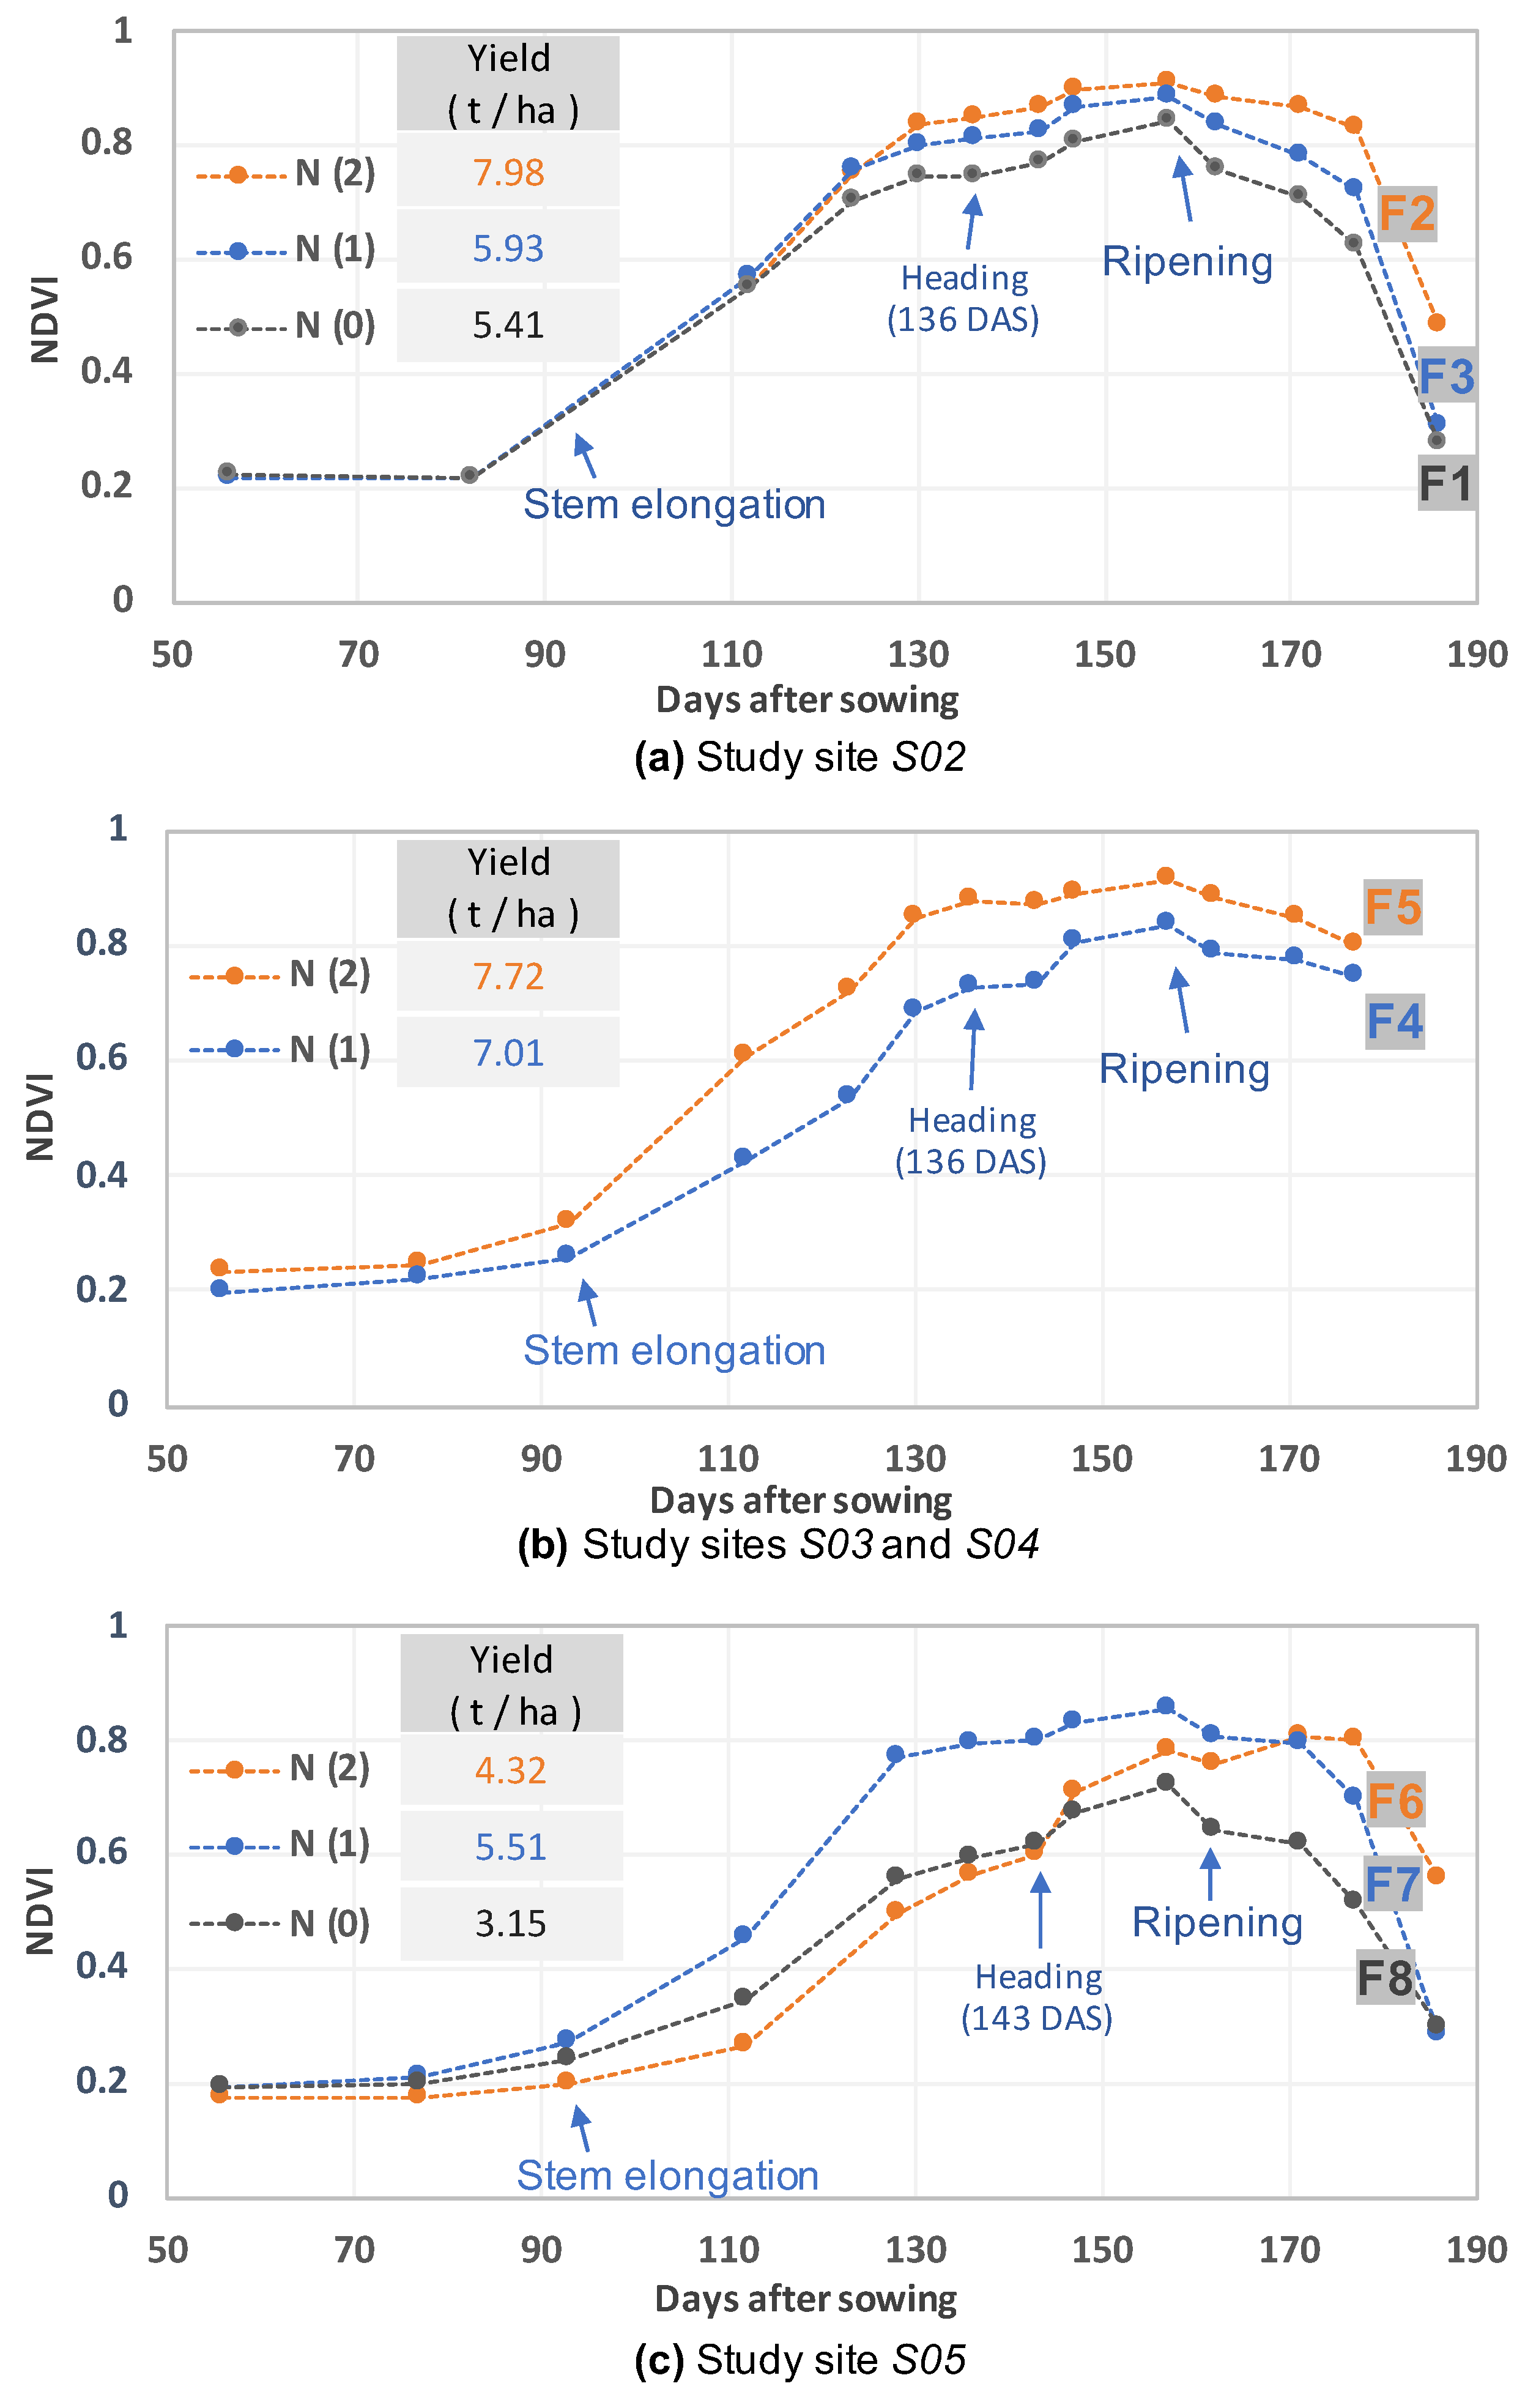
The experiments on wheat were conducted during the 2017–2018 crop season at the study sites S 02 S 05 (cultivar: “Shiroganekomugi”; sowing day: 20 November). Table 3 lists the growing conditions: amount of basal fertilizer and top-dressing fertilizer and their application date, sowing density, and seedlings establishment rate. The fields were categorized into three types based on the application of topdressing fertilizer: applied zero, one, or two times. Because the seedling establishment was highly effective in the field F6 at site S 05 , we applied a high amount of fertilizer by two times of top-dressing in order to improve the growth. The final yield based on unit acreage sampling was measured from the weight of the whole and plump grains with 12% water content.

3. Results

3.1. The Operating Efficiency of Small UAV-Based Remote Sensing and the Accuracy of Index Maps Alignment

The 223 flights using the DJI Phantom 4 and DJI Phantom 4 Pro yielded the following average multispectral sensing area per 10 min: 19.8 (18.3–20.4) ha and 13.4 (13.0–13.5) ha, respectively, for 100 m AGL; 5.2 (4.7–5.6) ha and 3.1 (3.0–3.1) ha, respectively, for 50 m AGL; and 2.0 (1.8–2.3) ha and 1.4 (1.1–1.5) ha, respectively, for 30 m AGL. The measured time varied marginally with the wind speed and number of flight routes. The flying time from the takeoff point to the first way point on the automatic flight routes and that from the last way point to the landing point were excluded. The forward overlap of the multispectral camera for the flights of the DJI Phantom 4 (65%) was smaller than that of the DJI Phantom 4 Pro (76%); therefore, the operating efficiency of the former was higher. An identical overlap for the multispectral camera would have resulted in an identical operating efficiency for the two.
The accuracy of index maps alignment was assessed using the root mean squared error (RMSE) of the pixel coordinates of 7–18 check points on the index maps. Because the normalized index maps by the BIA algorithm were on the same geographical scale, the average RMSE value for the index maps alignment is approximately equal to that in the fields: 15.1 (7.8–28.1) cm, 37.2 (14.0–61.1) cm, 38.7 (17.6–60.8) cm, 10.7 (30.9–58.7) cm, and 32.4 (11.1–49.0) cm at the study sites S 01 S 05 , respectively. The accuracies of index maps alignment were sufficient to align within one crop-line space of 30 cm at the study site S 01 and two crop-line spaces at the study sites S 02 S 05 .

3.2. NDVI Values Varying with Ripening Stages, Lodging and Weed Leaves, and Planting Method in Wide Rice Fields

Figure 2 illustrates the a high-resolution RGB orthomosaic image and an NDVI distribution map from the flight altitude of 100 m AGL. The 55 experimental fields inside the red range-lines (Figure 2a) covered approximately 37.5 ha; this required 25 min of flight time, including the break time for replacing the UAV battery. The number of raw images used for synthesizing the RGB orthomosaic image and the NDVI index map were 525 and 2948, respectively. The RGB orthomosaic image had a large dimension and high spatial resolution (4.3 cm GSD). The spatial resolution of the NDVI map also attained 10.5 cm GSD.
The fields for late transplanting, early ripening, and direct seeded rice as well as the plots for weed and lodging are marked in both the RGB orthomosaic image and the NDVI distribution map. High NDVI values were exhibited by the late transplanted rice paddies (Figure 2b), wherein the dark-green color in Figure 2a also differed from the color of the other areas. The NDVI values ranging from 0.75 to 0.85 mostly corresponded to the fields for early ripening rice, except two fields by direct seeding. The NDVI at the plots of weed or lodging distinctly differed from that at ambient places of normal rice plants. Compared to the area of weed or lodging in the RGB image (Figure 2a), the NDVI distribution map (Figure 2b) were more effective for segmentation of the crop growth status into categories such as ripening stage, weed, and lodging. The NDVI distribution map was generated from a source monochrome NDVI index map, which enabled us to quantize the NDVI values for subsequent analysis of the crop growth status.

3.3. Relationships between NDVI, Fertilizer Application Level, and Yield With Regard to Rice Growth in Site  S 01

Figure 3a,b show an RGB image with 18 plots and an NDVI index map with 18 NDVI sampling areas. The NDVI values grouped by three levels of basal fertilizer treatments included two seeding methods with three replications; their changes with DAS are illustrated in Figure 3c. Multiple comparisons of the NDVI mean values between high fertilizer level and low fertilizer level, through the Ryan–Einot–Gabriel–Welsch and Quiot (REGWQ) test at 5% level of significance, exhibited significant difference between the two levels, except at 157 DAS. Although most of the comparisons between the high and normal fertilizer levels did not have much significance, the NDVI mean values of the high fertilizer level was apparently higher than those of the normal fertilizer and low fertilizer levels. The high, normal, and low quantity of the basal fertilizer resulted in similar high, normal, and low final yields of 6.15, 5.67, and 5.05 t ha 1 , respectively.
The linear regressions between the yields and the NDVI values were conducted for all DAS. Figure 3d shows an example of significant correlation between the rice yields and the NDVI values at 91 DAS. The R 2 for linear regression between the yields and the NDVI values for all DAS (Appendix Table A1) were plotted in Figure 3e. Strong correlations were found at 91, 104 and 110 DAS in the early reproductive stage, and 151 and 157 DAS in the late ripening stage. We also observed that the R 2 values declined at 123, 134, 142 DAS in the early and middle ripening stage.

3.4. Relationships between NDVI and Fertilizer Application Level and Yield with Regard to Wheat Growth in Study Sites S 02 S 05

The study sites S 02 S 05 for wheat experiments comprised three fields (F1, F2, and F3), one field (F4), one field (F5), and three fields (F6, F7, and F8), respectively, of the farmers (Figure 4). Because the early wheat seedlings grew very gradually owing to the low ambient temperature, the UAV-based multispectral photogrammetry was started approximately a month later from the sowing date. The NDVI distribution maps displayed the detailed distribution and variation of the wheat growth in each field. Figure 4a–d illustrate an example of the NDVI distribution maps at 147 DAS that was around the critical flowering time. Relatively high and uniform NDVI indices were observed in the fields F2 and F5 compared to the others; these two fields had been applied with two times of top-dressing fertilizer. Only the basal fertilizer in the fields F1 and F8, without top-dressing fertilizer application, resulted in relatively non-uniform NDVI values. However, the NDVI indices in the field F6, which was also applied two times of top-dressing fertilizer application, were highly non-uniform. Similar results were also revealed by the box plots of the NDVI distribution for the eight fields in Figure 4e; here, the box plots were segmented into three groups, each labelled with the number of top-dressing application. Based on the daily aboveground observation, the flowering time in the study site S 05 were approximately a week later than that in the others. The excessively low seedling establishment rate in this study site is considered to be the cause of this phenomenon (Table 3).
The effects of the number of times of top-dressing fertilizer application on the NDVI values are illustrated in Figure 5. The NDVI values were estimated from the pixel values of the central area of the field in the NDVI index map, except the area of the peripheral headland in each field. In all the sub-figures of Figure 5, the NDVI vs. DAS curves maintained a flat uptrend before the stem elongation, increased to a peak around the early ripening stage, and then gradually decreased until maturity. For each field, in addition to basal fertilizer, two, one, or zero times of top-dressing fertilizer application were conducted at the appropriate DAS (Table 3). The geographically adjacent fields at the study sites S 03 and S 04 were analyzed in the same group. For the fields with approximately identical seeding establishment rates (Figure 5a,b), higher NDVI values were obtained by applying two times of top-dressing fertilizer. However, the NDVI values at the study site S 05 varied in a different order with the number of times of top-dressing fertilizer application (Figure 5c), maintaining the lowest value until 136 DAS in the field applied with two times of the top-dressing. Nevertheless, the high amount of fertilizer as a result of the two times of top-dressing resulted in exuberant growth of the late tillers in the field F6. Meanwhile, accompanying the senescence of leaves in the other fields, the NDVI for the field F6 received high values after 171 DAS.
The linear regression between wheat yield and NDVI around the flowering time (147 DAS) and early ripening stage (162 DAS) are plotted in Figure 6a,b using the data obtained from S 02 S 05 . The NDVI values were abstracted from 24 plots within a 6 × 18 m area, which surrounded the center of the plots for unit acreage sampling for the yield. The relationships between yield and NDVI were strong around the flowering time at 147 DAS and maintained till around the period of the early ripening stage (Figure 6c); subsequently, they declined with senescence of leaves from the middle to the final ripening stage. The highest R 2 (=0.809) appeared at 162 DAS, when the flowering was completed at all the study sites. The p-values ( p < 0.001 ) in the linear regression analysis (Appendix Table A2) indicated statistical significance for all the linear regression models on each DAS.

4. Discussion

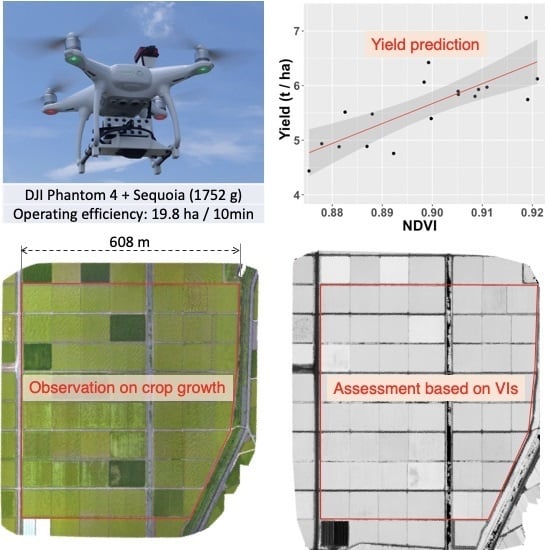
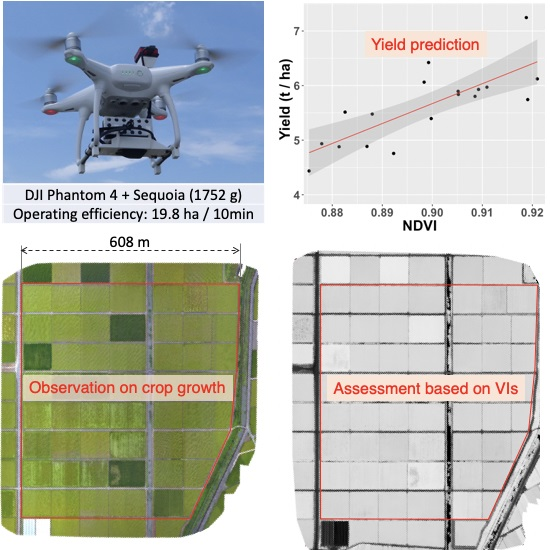
In this study, we examined the feasibility of using small UAVs for remote sensing in order to support the rice and wheat growers in the double cropping region. The one-man operable UAV-based multispectral sensing exhibited high operating efficiency (1.4, 3.1, and 13.4 ha per 10 min at 30, 50, and 100 m AGL, respectively; Table 1), which was higher than that represented in [6] (1 ha per 10 min at 30–50 m AGL) and in [39] (approximately 7.1 ha per 10 min at 240-m AGL). The total takeoff weight was approximately 1.7 kg, which was lighter and more compact than those for the other UAVs used for multispectral sensing for monitoring crop growth [1,6,14,40,41,42]. These advantages make it feasible for the common farmers to use the UAV-based remote sensing system for their daily or long-term observation of crop growth.
The initial cost to construct the system was around USD $13,500, including UAV, multispectral sensor, PC and image-processing software, and the related accessories. To perform UAV photogrammetry at 100 m AGL for an area with 100 ha, we needed to secure two operators who both work for 1.5 h, which corresponded to labor cost of approximately USD $64. This was higher than the cost of USD $32 for satellite image acquisition for the same area. In addition to these costs, the required time for data initialization and image processing needed about 2 h and 7.5 h, respectively. However, the minimum order area for the satellite imagery is 25 km 2 , which is excessive and the data is coarse for small farmlands less than 1 ha in farm size. The high-resolution imagery based on on-demand UAV measurement is distinctly more appropriate for the smallholder farming in our study area.
To obtain reliable reflectance index maps, we conducted many experiments assessing data noise of VIs due to photogrammetry conditions such as different AGLs, time spans for photogrammetry in a day, and so on. We observed that the reflectance NDVI values at different AGLs did not exhibit statistically significant correlation with the yield. Although the 65% forward overlap of the multispectral camera was sufficient to succeed in generating reflectance or index maps, 76% or more overlap was much safer and more reliable if taking incidental malfunction of the multispectral sensor into consideration. Due to the limited scope of this paper, we omitted the detailed experimental design and results and only described the necessary key points for photogrammetry conditions in Section 2.1. In addition to those photogrammetry conditions, the essentials for success in long-term measurement also involved (1) flying the UAV at the same AGL during the entire crop-growing season, (2) performing radiometric calibration to create reflectance maps by using the calibration images of the reflectance panel, and (3) guaranteeing sufficient accuracy of index maps alignment if quantizing VI values at the same experimental plots or fields in a series of index maps.
Our proposed BIA algorithm aided alignment of the series of reflectance or index maps that were generated with or without the use of GCPs. The RGB orthomosaic images generated without the use GCPs often had noticeable distortion, and they had to be reconstructed for alignment by marking GCPs on the raw images. In contrast, most of the reflectance or index maps generated without the use of GCPs had slight distortion and were well aligned within our expected accuracy. This reveals that we could avoid costly measurement of GCPs and extra operations by marking GCPs on the raw image, and directly using the reflectance or index maps generated without the use of GCPs. The BIA algorithm was adequate for our study purpose at the field level. Nevertheless, for a study requiring much more alignment accuracy (such as breeding surveys of small plots), we still recommend generating and aligning reflectance or index maps using GCPs.
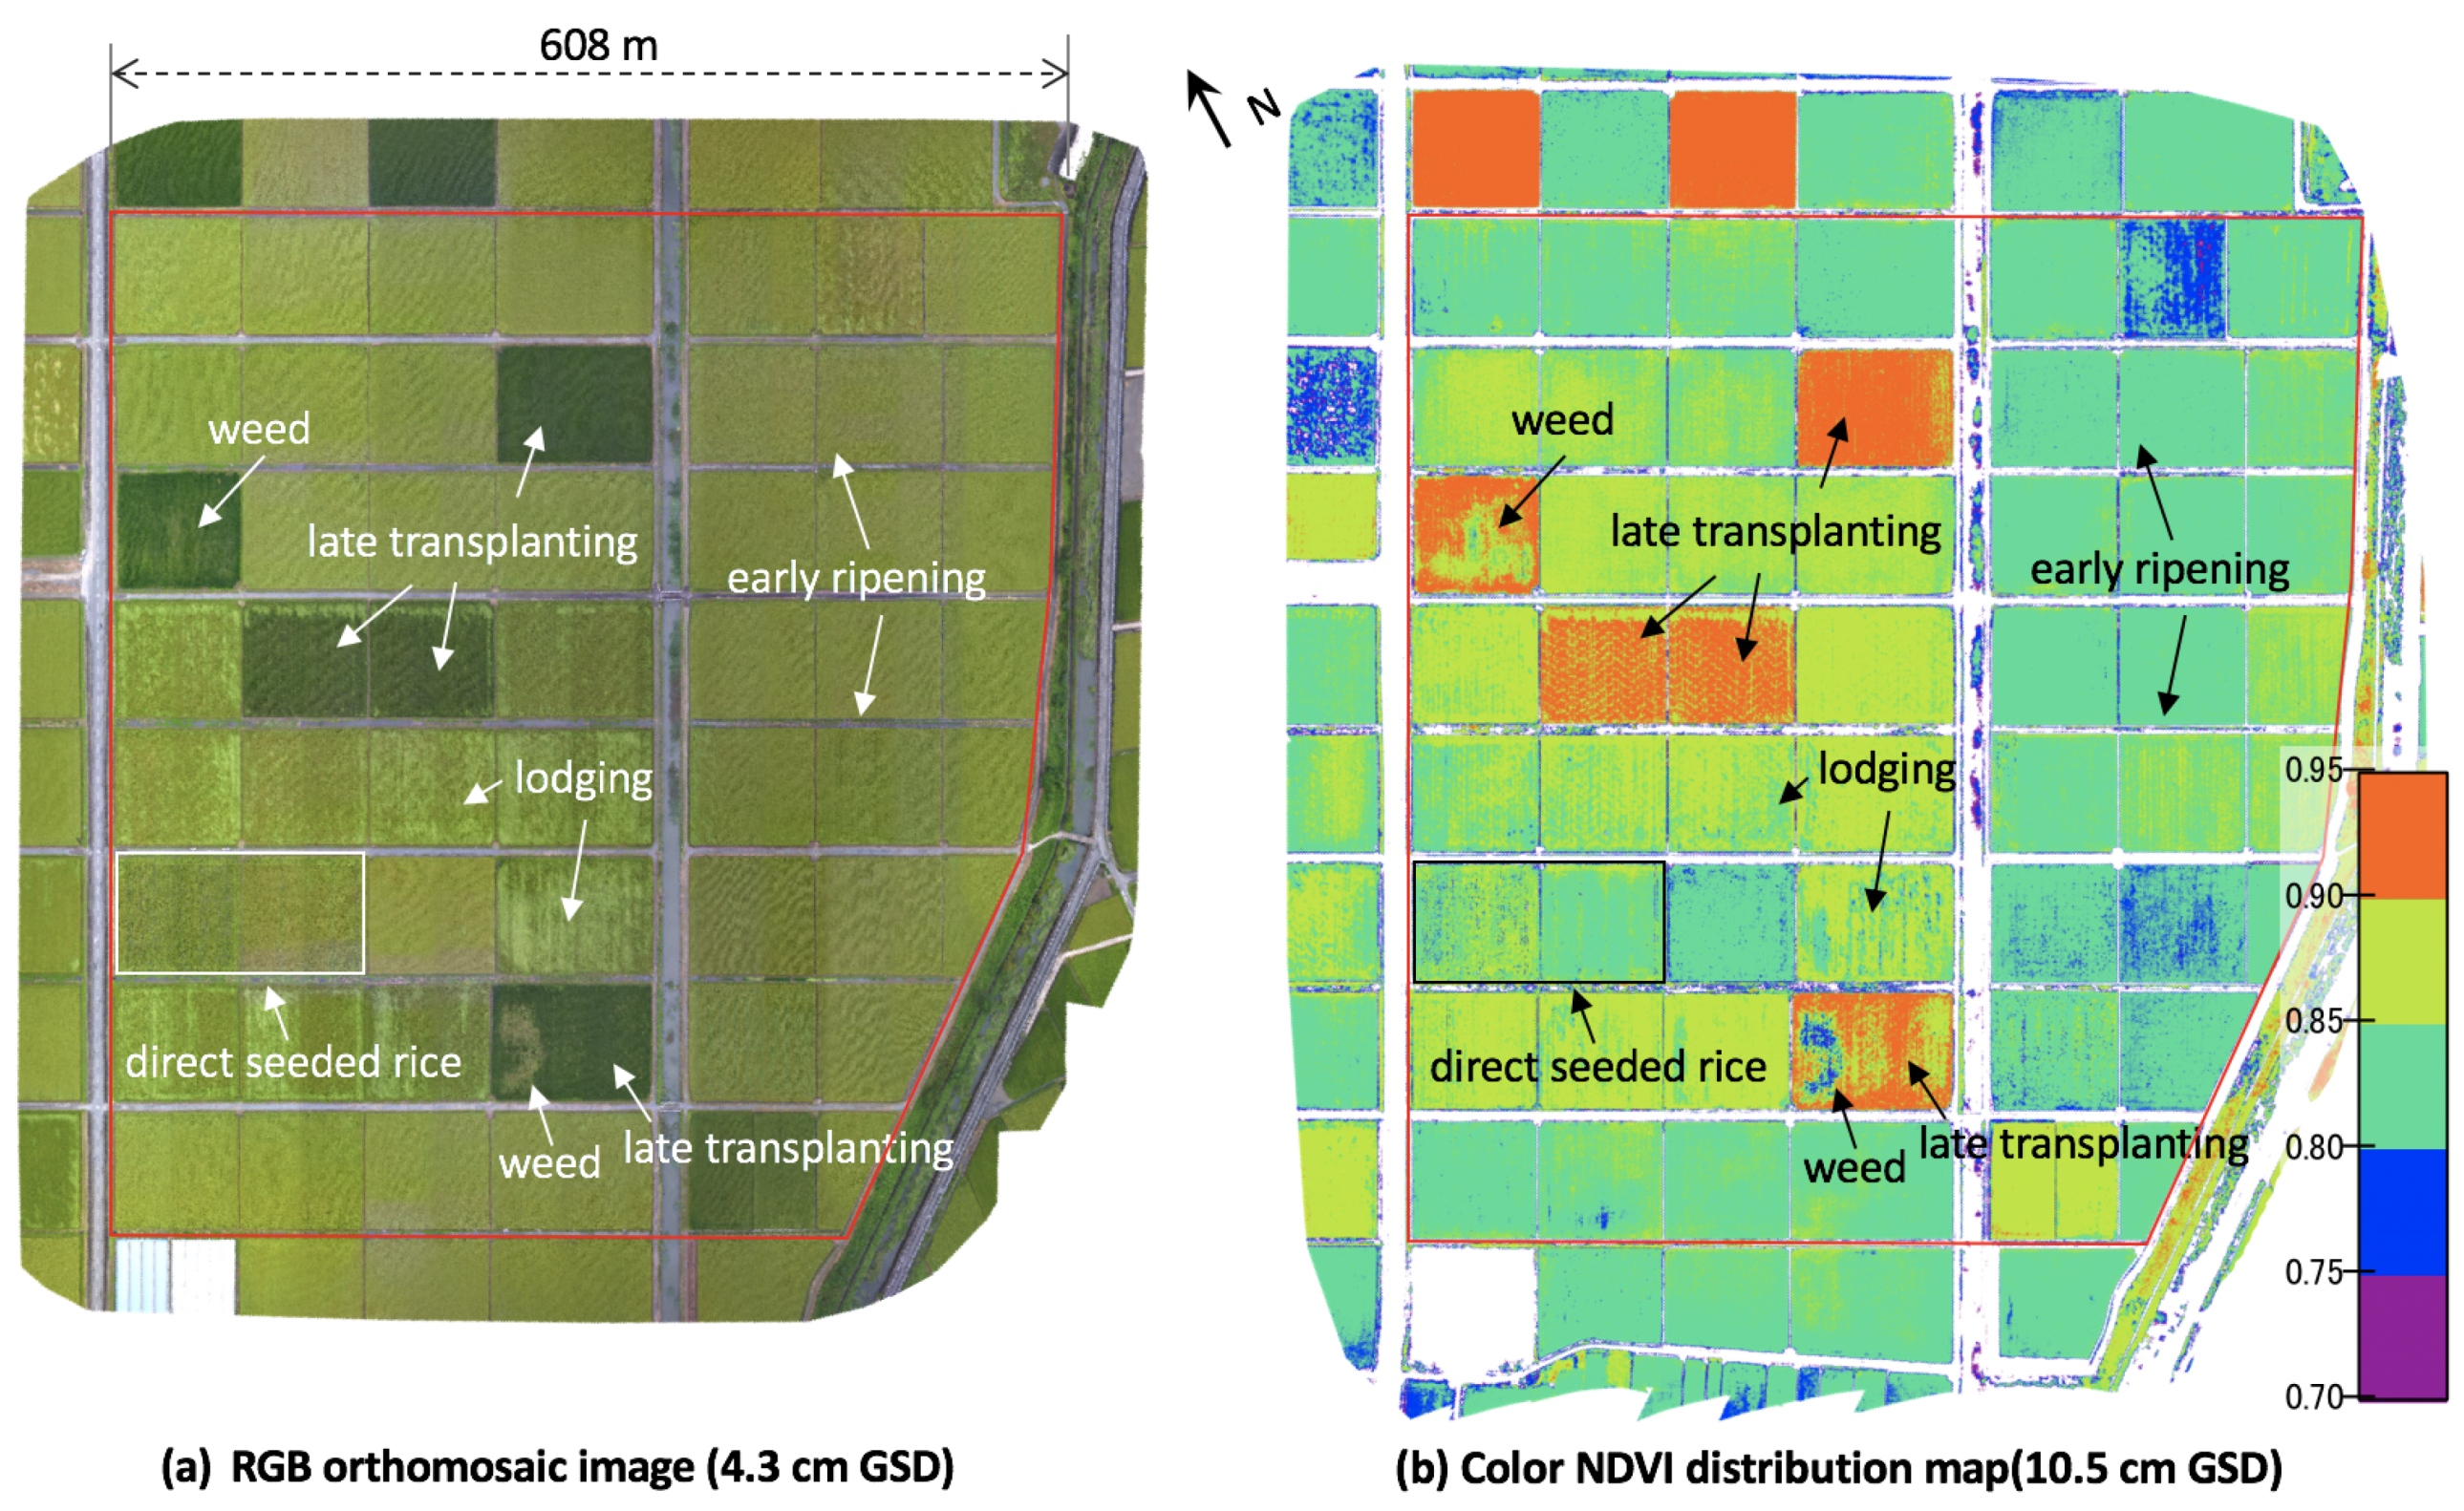
The high-resolution RGB orthomosaic image and NDVI index map (Figure 2) contained numerous implicit signals for estimating the weed and lodging injury areas, identifying the different growth stages between fields, and forecasting the optimum harvesting time. Data conjugation between the UAV-based multispectral sensing and aboveground measurement would aid effective decision-making for seasonable field management of the consolidated farms. The NDVI values of both the rice and the wheat obtained using the high-resolution multispectral images appear to reflect highly responsive plant reactions to levels of fertilizer application (Figure 3c and Figure 5). This indicates that our system could enable us detect nitrogen deficiency by referring to criteria based on NDVI values at different nitrogen fertilizer levels. In order to exactly estimate the applied nitrogen fertilizer levels by NDVI, performing the UAV-based multispectral sensing at a similar growth stage for a similar cultivar is strongly recommended.
Based on the statistical analysis for the direct seeded rice in a single growth season, the high correlation coefficients between NDVI and yield would enable us to predict the yield based on NDVI by using our system at the early reproductive stage or the late ripening stage (Figure 3). The value of R 2 = 0.605 ( n = 18 ) between yield and NDVI (Figure 3) was lower than that measured at heading for the transplanted rice in [4] ( R 2 = 0.84 , n = 6 ) and [5] ( R 2 = 0.75 , n = 72 ). Because the direct seeded rice in our study produced non-uniform plant density, it was challenging to compare the prediction model with those for the transplanted rice. With regard to the decline of R 2 in the early and middle ripening stages, we consider that rice panicles in this period would be the source of noise in NDVI measurement, though further experiments are required to verify it.
For the wheat, we obtained a lower correlation between yield and NDVI ( R 2 = 0.601 ) at the flowering time (Figure 6) in comparison with that in [6] ( R 2 = 0.82 ). Nevertheless, a similar R 2 (=0.809) was obtained at 162 DAS, which was in the early ripening stage. This indicates the feasibility of predicting yield using our system; furthermore, there would exist an appropriate time window, not only limiting at a specified DAS.
In the paper, we report on the feasibility of NDVI remote sensing by using small UAV in rice and wheat fields. However, other effective indices such as red edge vegetation indices [42] and the canopy chlorophyll content index (CCCI) [43] have been reported. Furthermore, soybean and barley are also grown in the double cropping system, so that studies on such cases are currently underway in conjunction with the evaluation of the red edge vegetation indices and the canopy chlorophyll content index.

5. Conclusions

We successfully constructed a small UAV-based multispectral sensing system to obtain the NDVI values of rice and wheat plants. A small UAV with a compact multispectral sensor, exhibited high operating efficiency for rapid proximal multispectral sensing. It enabled one-man and on-demand operation for the farmers to acquire both visible RGB and reliable spectral imagery with high-resolution. These high-resolution RGB orthomosaic images and NDVI distribution maps were useful to identify differences in crop-growth status; thereby helping farmers to grasp early subtle anomalies in overall crops growth in their plots or fields of concern. The proposed BIA algorithm enabled us to quantize the NDVI values directly from a series of reflectance or index maps generated with or without the use of GCPs. Strong correlations between NDVI and yield were observed at the early reproductive stage or the late ripening stage for the direct-seeded rice, and at the middle reproductive stage of the early ripening stage for the wheat. The result that the NDVI values were highly responsive to fertilizer application levels indicated the potential for early detection of nitrogen deficiency.

Author Contributions

S.G. and K.F. contributed to the remote sensing data acquisition and methodology, and the processing and analysis of the field and remote sensing data. H.M., M.O., and K.F. contributed to the field experiment and the field data acquisition. K.N., T.S., R.T., and H.N. assisted in the experimental field supervision and the field data acquisition. K.T. and H.O. contributed to the overall experimental design and supervision. S.G. wrote and revised the article, and all the authors contributed with their recommendations on revisions to this article.

Funding

This research was supported by grants from the Project of the NARO Biooriented Technology Research Advancement Institution (the special scheme project on vitalizing management entities of agriculture, forestry and fisheries) of Japan.

Acknowledgments

We are grateful to Norio Iriki for his constructive comments and valuable recommendations for this manuscript. We also acknowledge machinery specialists Yasutaka Kawaguchi, Makoto Nakajima, and Keiji Miike for their assistance in data acquisition for both the field experiment and UAV photogrammetry, and the growers who provided the fields for the experiments and their extensive co-operation in the daily field management. Special thanks are also due to Mitsunori Ishihara for his effective recommendations on the remote sensing techniques.

Conflicts of Interest

The authors declare no conflict of interest. The founding sponsors had no role in the design of the study; in the collection, analyses, or interpretation of data; in the writing of the manuscript, and in the decision to publish the results.

Abbreviations

AGLAbove Ground Level
ATPAffine Transform Point
BIABatch Image Alignment
CCCICanopy Chlorophyll Content Index
DASDay after sowing
DSMDigital Surface Model
GCPGround Control Point
GPSGlobal Positioning System
GSDGround Sampling Distance
MAEMean Absolute Error
NDRENormalized Difference Red-Edge Index
NDVINormalized Difference Vegetation Index
NIRNear InfraRed
RMSERoot Mean Squared Error
REGWQRyan–Einot–Gabriel–Welsch and Quiot
UAVUnmanned Aerial Vehicle
VIVegetation Index

Appendix A

Table A1. Supplementary data for linear regression analysis between rice yield and NDVI ( n = 18 ).
Remotesensing 11 00112 i003
Table A2. Supplementary data for linear regression analysis between wheat yield and NDVI ( n = 24 ).
Remotesensing 11 00112 i004

References

  1. Jin, X.; Liu, S.; Baret, F.; Hemerlé, M.; Comar, A. Estimates of plant density of wheat crops at emergence from very low altitude UAV imagery. Remote Sens. Environ. 2017, 198, 105–114. [Google Scholar] [CrossRef]
  2. Li, W.; Niu, Z.; Chen, H.; Li, D.; Wu, M.; Zhao, W. Remote estimation of canopy height and aboveground biomass of maize using high-resolution stereo images from a low-cost unmanned aerial vehicle system. Ecol. Indic. 2016, 67, 637–648. [Google Scholar] [CrossRef]
  3. Zhang, H.; Sun, Y.; Chang, L.; Qin, Y.; Chen, J.; Qin, Y.; Du, J.; Yi, S.; Wang, Y. Estimation of Grassland Canopy Height and Aboveground Biomass at the Quadrat Scale Using Unmanned Aerial Vehicle. Remote Sens. 2018, 10. [Google Scholar] [CrossRef]
  4. Tanaka, K.; Kondoh, A. Mapping of Rice Growth Using Low Altitude Remote Sensing by Multicopter. J. Remote Sens. Soc. Jpn. 2016, 36, 373–387. [Google Scholar] [CrossRef]
  5. Zhou, X.; Zheng, H.; Xu, X.; He, J.; Ge, X.; Yao, X.; Cheng, T.; Zhu, Y.; Cao, W.; Tian, Y. Predicting grain yield in rice using multi-temporal vegetation indices from UAV-based multispectral and digital imagery. ISPRS-J. Photogramm. Remote Sens. 2017, 130, 246–255. [Google Scholar] [CrossRef]
  6. Duan, T.; Chapman, S.; Guo, Y.; Zheng, B. Dynamic monitoring of NDVI in wheat agronomy and breeding trials using an unmanned aerial vehicle. Field Crops Res. 2017, 210, 71–80. [Google Scholar] [CrossRef]
  7. Forlani, G.; Dall’Asta, E.; Diotri, F.; Cella, U.M.d.; Roncella, R.; Santise, M. Quality Assessment of DSMs Produced from UAV Flights Georeferenced with On-Board RTK Positioning. Remote Sens. 2018, 10. [Google Scholar] [CrossRef]
  8. Natesan, S.; Armenakis, C.; Benari, G.; Lee, R. Use of UAV-Borne Spectrometer for Land Cover Classification. Drones 2018, 2. [Google Scholar] [CrossRef]
  9. Yang, G.; Liu, J.; Zhao, C.; Li, Z.; Huang, Y.; Yu, H.; Xu, B.; Yang, X.; Zhu, D.; Zhang, X.; et al. Unmanned Aerial Vehicle Remote Sensing for Field-Based Crop Phenotyping: Current Status and Perspectives. Front. Plant Sci. 2017, 8, 1111. [Google Scholar] [CrossRef]
  10. Pádua, L.; Vanko, J.; Hruška, J.; Adão, T.; Sousa, J.J.; Peres, E.; Morais, R. UAS, sensors, and data processing in agroforestry: A review towards practical applications. Int. J. Remote Sens. 2017, 38, 2349–2391. [Google Scholar] [CrossRef]
  11. Manfreda, S.; McCabe, M.F.; Miller, P.E.; Lucas, R.; Pajuelo Madrigal, V.; Mallinis, G.; Ben Dor, E.; Helman, D.; Estes, L.; Ciraolo, G.; et al. On the Use of Unmanned Aerial Systems for Environmental Monitoring. Remote Sens. 2018, 10. [Google Scholar] [CrossRef]
  12. Sankaran, S.; Khot, L.R.; Espinoza, C.Z.; Jarolmasjed, S.; Sathuvalli, V.R.; Vandemark, G.J.; Miklas, P.N.; Carter, A.H.; Pumphrey, M.O.; Knowles, N.R.; et al. Low-altitude, high-resolution aerial imaging systems for row and field crop phenotyping: A review. Eur. J. Agron. 2015, 70, 112–123. [Google Scholar] [CrossRef]
  13. Sankey, T.; Donager, J.; McVay, J.; Sankey, J.B. UAV lidar and hyperspectral fusion for forest monitoring in the southwestern USA. Remote Sens. Environ. 2017, 195, 30–43. [Google Scholar] [CrossRef]
  14. Rasmussen, J.; Nielsen, J.; Garcia-Ruiz, F.; Christensen, S.; Streibig, J.C. Potential uses of small unmanned aircraft systems (UAS) in weed research. Weed Res. 2013, 53, 242–248. [Google Scholar] [CrossRef]
  15. Schirrmann, M.; Giebel, A.; Gleiniger, F.; Pflanz, M.; Lentschke, J.; Dammer, K.H. Monitoring Agronomic Parameters of Winter Wheat Crops with Low-Cost UAV Imagery. Remote Sens. 2016, 8. [Google Scholar] [CrossRef]
  16. Gonzalez-Dugo, V.; Hernandez, P.; Solis, I.; Zarco-Tejada, P.J. Using High-Resolution Hyperspectral and Thermal Airborne Imagery to Assess Physiological Condition in the Context of Wheat Phenotyping. Remote Sens. 2015, 7, 13586–13605. [Google Scholar] [CrossRef] [Green Version]
  17. Adão, T.; Hruška, J.; Pádua, L.; Bessa, J.; Peres, E.; Morais, R.; Sousa, J.J. Hyperspectral Imaging: A Review on UAV-Based Sensors, Data Processing and Applications for Agriculture and Forestry. Remote Sens. 2017, 9. [Google Scholar] [CrossRef]
  18. Nebiker, S.; Lack, N.; Abächerli, M.; Läderach, S. Light-Weight Multispectral UAV Sensors and Their Capabilities for Predicting Grain Yield and Detecting Plant Diseases. ISPRS Arch. 2016, 41, 963–970. [Google Scholar] [CrossRef]
  19. Ishihara, M.; Inoue, Y.; Ono, K.; Shimizu, M.; Matsuura, S. The Impact of Sunlight Conditions on the Consistency of Vegetation Indices in Croplands—Effective Usage of Vegetation Indices from Continuous Ground-Based Spectral Measurements. Remote Sens. 2015, 7, 14079–14098. [Google Scholar] [CrossRef] [Green Version]
  20. Ortega-Terol, D.; Hernandez-Lopez, D.; Ballesteros, R.; Gonzalez-Aguilera, D. Automatic Hotspot and Sun Glint Detection in UAV Multispectral Images. Sensors 2017, 17. [Google Scholar] [CrossRef]
  21. Mulla, D.J. Twenty five years of remote sensing in precision agriculture: Key advances and remaining knowledge gaps. Biosyst. Eng. 2013, 114, 358–371. [Google Scholar] [CrossRef]
  22. Assmann, J.J.; Kerby, J.T.; Cunliffe, A.M.; Myers-Smith, I.H. Vegetation monitoring using multispectral sensors-best practices and lessons learned from high latitudes. bioRxiv 2018. [Google Scholar] [CrossRef]
  23. Ahmed, O.S.; Shemrock, A.; Chabot, D.; Dillon, C.; Williams, G.; Wasson, R.; Franklin, S.E. Hierarchical land cover and vegetation classification using multispectral data acquired from an unmanned aerial vehicle. Int. J. Remote Sens. 2017, 38, 2037–2052. [Google Scholar] [CrossRef]
  24. Fernández-Guisuraga, J.M.; Sanz-Ablanedo, E.; Suárez-Seoane, S.; Calvo, L. Using Unmanned Aerial Vehicles in Postfire Vegetation Survey Campaigns through Large and Heterogeneous Areas: Opportunities and Challenges. Sensors 2018, 18, 586. [Google Scholar] [CrossRef] [PubMed]
  25. Hassan, M.A.; Yang, M.; Rasheed, A.; Jin, X.; Xia, X.; Xiao, Y.; He, Z. Time-Series Multispectral Indices from Unmanned Aerial Vehicle Imagery Reveal Senescence Rate in Bread Wheat. Remote Sens. 2018, 10. [Google Scholar] [CrossRef]
  26. Hatfield, J.L.; Prueger, J.H. Value of Using Different Vegetative Indices to Quantify Agricultural Crop Characteristics at Different Growth Stages under Varying Management Practices. Remote Sens. 2010, 2, 562–578. [Google Scholar] [CrossRef] [Green Version]
  27. Gabriel, J.L.; Zarco-Tejada, P.J.; López-Herrera, P.J.; Pérez-Martín, E.; Alonso-Ayuso, M.; Quemada, M. Airborne and ground level sensors for monitoring nitrogen status in a maize crop. Biosyst. Eng. 2017, 160, 124–133. [Google Scholar] [CrossRef]
  28. Atzberger, C.; Eilers, P.H. A time series for monitoring vegetation activity and phenology at 10-daily time steps covering large parts of South America. J. Environ. Manag. 2011, 4, 365–386. [Google Scholar] [CrossRef]
  29. Rembold, F.; Atzberger, C.; Savin, I.; Rojas, O. Using Low Resolution Satellite Imagery for Yield Prediction and Yield Anomaly Detection. Remote Sens. 2013, 5, 1704–1733. [Google Scholar] [CrossRef] [Green Version]
  30. Franch, B.; Vermote, E.F.; Roger, J.C.; Murphy, E.; Becker-Reshef, I.; Justice, C.; Claverie, M.; Nagol, J.; Csiszar, I.; Meyer, D.; et al. A 30+ Year AVHRR Land Surface Reflectance Climate Data Record and Its Application to Wheat Yield Monitoring. Remote Sens. 2017, 9. [Google Scholar] [CrossRef]
  31. Ministry of Agriculture, Forestry and Fisheries Japan. The 91th Statistical Yearbook; Ministry of Agriculture, Forestry and Fisheries Japan: Tokyo, Japan, 2018.
  32. Stratoulias, D.; Tolpekin, V.; de By, R.A.; Zurita-Milla, R.; Retsios, V.; Bijker, W.; Hasan, M.A.; Vermote, E. A Workflow for Automated Satellite Image Processing: from Raw VHSR Data to Object-Based Spectral Information for Smallholder Agriculture. Remote Sens. 2017, 9. [Google Scholar] [CrossRef]
  33. Rahman, M.M.; Robson, A.; Bristow, M. Exploring the Potential of High Resolution WorldView-3 Imagery for Estimating Yield of Mango. Remote Sens. 2018, 10. [Google Scholar] [CrossRef]
  34. Kastens, J.H.; Kastens, T.L.; Kastens, D.L.; Price, K.P.; Martinko, E.A.; Lee, R.Y. Image masking for crop yield forecasting using AVHRR NDVI time series imagery. Remote Sens. Environ. 2005, 99, 341–356. [Google Scholar] [CrossRef]
  35. Gómez-Candón, D.; De Castro, A.I.; López-Granados, F. Assessing the accuracy of mosaics from unmanned aerial vehicle (UAV) imagery for precision agriculture purposes in wheat. Precis. Agric. 2014, 15, 44–56. [Google Scholar] [CrossRef]
  36. Tucker, C.J. Red and photographic infrared linear combinations for monitoring vegetation. Remote Sens. Environ. 1979, 8, 127–150. [Google Scholar] [CrossRef] [Green Version]
  37. Tucker, C.; Holben, B.; Elgin, J., Jr.; McMurtrey, J. III. Relationship of spectral data to grain yield variation. Photogramm. Eng. Remote Sens. 1980, 46, 657–666. [Google Scholar]
  38. Fukami, K.; Tsuchiya, F.; Nakano, K.; Koarai, A.; Okami, M. Labor-saving and low cost technology for paddy crop rotation on the basis of using ridge-making direct seeder. Jpn. J. Farm Work Res. 2017, 52, 7–8. [Google Scholar]
  39. Zhang, J.; Hu, J.; Lian, J.; Fan, Z.; Ouyang, X.; Ye, W. Seeing the forest from drones: Testing the potential of lightweight drones as a tool for long-term forest monitoring. Biol. Conserv. 2016, 198, 60–69. [Google Scholar] [CrossRef]
  40. Ballester, C.; Hornbuckle, J.; Brinkhoff, J.; Smith, J.; Quayle, W. Assessment of In-Season Cotton Nitrogen Status and Lint Yield Prediction from Unmanned Aerial System Imagery. Remote Sens. 2017, 9. [Google Scholar] [CrossRef]
  41. Candiago, S.; Remondino, F.; De Giglio, M.; Dubbini, M.; Gattelli, M. Evaluating Multispectral Images and Vegetation Indices for Precision Farming Applications from UAV Images. Remote Sens. 2015, 7, 4026–4047. [Google Scholar] [CrossRef] [Green Version]
  42. Zheng, H.; Cheng, T.; Li, D.; Zhou, X.; Yao, X.; Tian, Y.; Cao, W.; Zhu, Y. Evaluation of RGB, Color-Infrared and Multispectral Images Acquired from Unmanned Aerial Systems for the Estimation of Nitrogen Accumulation in Rice. Remote Sens. 2018, 10. [Google Scholar] [CrossRef]
  43. Fitzgerald, G.; Rodriguez, D.; O’Leary, G. Measuring and predicting canopy nitrogen nutrition in wheat using a spectral index—The canopy chlorophyll content index (CCCI). Field Crops Res. 2010, 116, 318–324. [Google Scholar] [CrossRef]
Figure 1. The map of the study sites in southwestern Japan.
Remotesensing 11 00112 g001
Figure 2. The high-resolution RGB orthomosaic image and the NDVI distribution image of wide rice paddies for the study site S 10 (Approx. 37.5 ha). The UAV-based remote sensing were carried out from 100 m AGL at approximately 90 days after transplanting.
Remotesensing 11 00112 g002
Figure 3. Analysis of direct seeded rice at study site S 01 . (a): RGB image with 18 plots; (b) NDVI index map with 18 sampling areas; (c): NDVI changes on fertilizer levels. For each DAS, the NDVI values labeled by the same letter are not significantly different. The error bars indicate the standard error, where n = 6 ; (d): Linear regression between yield and NDVI ( n = 18 , p < 0.001 ). The red trend line is surrounded by the 95% confidence interval (dark gray area); (e): R 2 between yield and NDVI with DAS ( n = 18 , p < 0.05 for all DAS).
Remotesensing 11 00112 g003
Figure 4. NDVI distribution maps of wheat sites at 147 DAS (flight at 30 m AGL).
Remotesensing 11 00112 g004
Figure 5. Comparison of NDVI values between plots differing in the number of times of top-dressing fertilizer application in wheat fields. “N (2)”, “N (1)”, and “N (0)” represent the NDVI values obtained by applying two, one, and zero times, respectively, of top-dressing fertilizer.
Remotesensing 11 00112 g005
Figure 6. (a,b): Linear regression between wheat yield and NDVI for study sites S 02 S 05 at 147 DAS ( n = 24 , p < 0.001 ) and 162 DAS ( n = 24 , p < 0.001 ), respectively. The dark gray area represents 95% confidence interval. (c): The NDVI changes with DAS and the R 2 between yield and NDVI ( n = 24 , p < 0.001 ). The error bars indicate the standard deviation.
Remotesensing 11 00112 g006
Table 1. Small UAVs and multispectral sensors for experimental use.
Remotesensing 11 00112 i001
Table 2. Study sites used for the UAV-based multispectral sensing.
Remotesensing 11 00112 i002
Table 3. Fertilizer and sowing density at the wheat study sites.
Remotesensing 11 00112 i005

