Assessment of Coastal Aquaculture for India from Sentinel-1 SAR Time Series


1
Department of Geography, School of Earth Sciences, Central University of Tamil Nadu, Thiruvarur 610005, Tamil Nadu, India
2
German Remote Sensing Data Center, Earth Observation Center, German Aerospace Center, 82234 Wessling, Germany
3
Department of Remote Sensing, Institute of Geography and Geology, University of Wuerzburg, 97074 Wuerzburg, Germany
*
Author to whom correspondence should be addressed.
Remote Sens. 2019, 11(3), 357; https://0-doi-org.brum.beds.ac.uk/10.3390/rs11030357
Submission received: 28 December 2018
/
Revised: 25 January 2019
/
Accepted: 6 February 2019
/
Published: 11 February 2019
(This article belongs to the Special Issue Remote Sensing for Fisheries and Aquaculture)
Abstract
:Aquaculture is one of the fastest growing primary food production sectors in India and ranks second behind China. Due to its growing economic value and global demand, India’s aquaculture industry experienced exponential growth for more than one decade. In this study, we extract land-based aquaculture at the pond level for the entire coastal zone of India using large-volume time series Sentinel-1 synthetic-aperture radar (SAR) data at 10-m spatial resolution. Elevation and slope from Shuttle Radar Topographic Mission digital elevation model (SRTM DEM) data were used for masking inappropriate areas, whereas a coastline dataset was used to create a land/ocean mask. The pixel-wise temporal median was calculated from all available Sentinel-1 data to significantly reduce the amount of noise in the SAR data and to reduce confusions with temporary inundated rice fields. More than 3000 aquaculture pond vector samples were collected from high-resolution Google Earth imagery and used in an object-based image classification approach to exploit the characteristic shape information of aquaculture ponds. An open-source connected component segmentation algorithm was used for the extraction of the ponds based on the difference in backscatter intensity of inundated surfaces and shape metrics calculated from aquaculture samples as input parameters. This study, for the first time, provides spatial explicit information on aquaculture distribution at the pond level for the entire coastal zone of India. Quantitative spatial analyses were performed to identify the provincial dominance in aquaculture production, such as that revealed in Andhra Pradesh and Gujarat provinces. For accuracy assessment, 2000 random samples were generated based on a stratified random sampling method. The study demonstrates, with an overall accuracy of 0.89, the spatio-temporal transferability of the methodological framework and the high potential for a global-scale application.
Keywords:
aquaculture; food security; India; Asia; coast; Sentinel-1; Copernicus; SAR; time series; object-based image analysis (OBIA)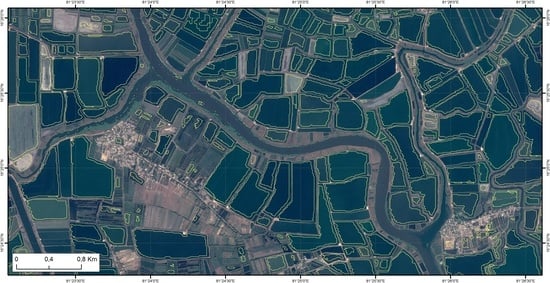
1. Introduction
In the context of increasing global population and food demand, aquaculture is considered as one of the fastest growing food industries in the world. Even though deep-sea and inland fish capture meets half of the share of the global fish demand, the aquaculture industry contributes almost 50% of global fish consumption. As per the latest estimates by the Food and Agricultural Organization (FAO), global aquaculture production reached 76.6 million tons (excluding aquatic plants and non-food products) with a value of 157.9 billion United States dollars (USD) in the year 2015. This marks 4% annual growth from production in the year 2014, which was about 73.8 million tons as reported by Reference [1]. Based on the global fish production, consumption, and multi-market models, the total fish supply is expected to increase from 154 million tons in 2011 to 186 million tons in 2030, with the aquaculture industry solely responsible for the increase. This rapid development has significant effects on the coastal land-use systems worldwide. Although an increase in aquaculture production is expected in all regions, the largest expansion (about 121%) is expected in India during the time period of 2010–2030 [2]. Currently, India is the second largest aquaculture production country with an exponential growth in production from 0.75 million tons in 1950 to 9.6 million tons in 2014 [3,4]. The rapid increase of aquaculture production in India led to uncontrolled and unsustainable conversion of such coastal wetlands, particularly mangrove wetlands to shrimp cultivation ponds in recent times, raising concerns among climate scientists, environmental managers, and policy-makers regarding the impact of aquaculture systems on prevailing coastal ecosystems. Furthermore, eutrophication and ecological degradation of coastal and estuarine systems was caused due to nutrient-rich effluents, chemicals, antibiotics, and feeds from fish and prawn culture ponds [5,6]. Furthermore, the introduction of exotic species and the dispersal of diseases disturb the ecological sustainability of the coastal ecosystem [7]. In India, the east coast experienced a significant loss of mangroves due to large-scale conversion to aquaculture ponds, such as that experienced in the Godavari delta in Andhra Pradesh and the Sundarbans in West Bengal [8,9,10]. Further expansion of aquaculture ponds in other potential areas along India’s coast toward coastal wetlands, deltas, and estuaries is expected in future.
Despite this rapid transformation of India’s coastal landscape, up-to-date spatial explicit and spatially continuous information regarding the distribution of coastal aquaculture is lacking and is, therefore, urgently needed to provide baseline information for decision-making and coastal zone monitoring. Earth observation is a highly recommended tool for mapping and monitoring of the production of fisheries at large scales [1,11]. The potential opportunities of using remote sensing data for aquaculture mapping was discussed in detail in Reference [12]. Long-term satellite missions such as European Remote Sensing satellite (ERS-1/2), ENVISAT, Landsat series, Moderate Resolution Imaging Spectroradiometer (MODIS), and the recently launched Sentinel series ensure extended monitoring of such processes. Medium- to high-resolution optical satellite data were used by researchers to delineate and monitor temporal changes in the spatial extent and distribution of aquaculture ponds in different parts of the world including India [13,14,15,16,17,18,19,20,21]. Object-based image classification was used for the extraction of aquaculture ponds using high-resolution multispectral data from Satellite Pour l’Observation de la Terre (SPOT) and WorldView satellites [22,23]. The usage of high-resolution multispectral data for mapping of aquaculture ponds at national or continental scales, however, can be problematic with respect to high-quality and temporally uniform data coverage, particularly in the cloud-prone hotspot regions of aquaculture production in Asia. Conversely, synthetic-aperture radar (SAR) data provide weather-independent, time-independent, and, with the Copernicus Sentinel-1 satellite, also sufficiently high-resolution data for the mapping of aquaculture ponds in tropical and sub-tropical coastal areas. A few studies attempted to map aquaculture ponds using SAR data, but these studies were generally performed in spatially limited focus regions [24,25,26,27,28,29].
A novel approach based on dense time series data from Sentinel-1 was developed by Reference [1] to delineate coastal aquaculture ponds for four major river deltas in China and Vietnam with an average overall accuracy of 83%. The results of this study demonstrated that the Sentinel-1 characteristics in terms of spatial and temporal resolution are well suited for large-scale mapping of land-based aquaculture at the pond level. However, a real large-scale application of the methods developed by Reference [1] remain to be demonstrated. In view of this, in this study, we adopted the methodology of Reference [1] to demonstrate the suitability of this approach at a subcontinental scale. Although official statistics on aquaculture production exist at the province level for India, these data give no insights into the spatial distribution and concentration of aquaculture at the local scale. Due to this information gap, land-based coastal aquaculture was mapped at the pond level for the entire coast of India, summing up to an area of more than one million km2, thereby exploiting the complete Sentinel-1 data archive. Furthermore, detected aquaculture ponds were quantified, and respective patterns were analyzed at a regular distance along the coast in relation to other phenomena such as major river deltas, cities, and mangrove ecosystems. By doing so, this study aims to provide comparable and spatially explicit information on land-based aquaculture, giving insights into local hotspots of this raising economic sector, and providing baseline information for policy-makers and environmental managers for the sustainable management of coastal wetlands in India.
2. Study Area Description
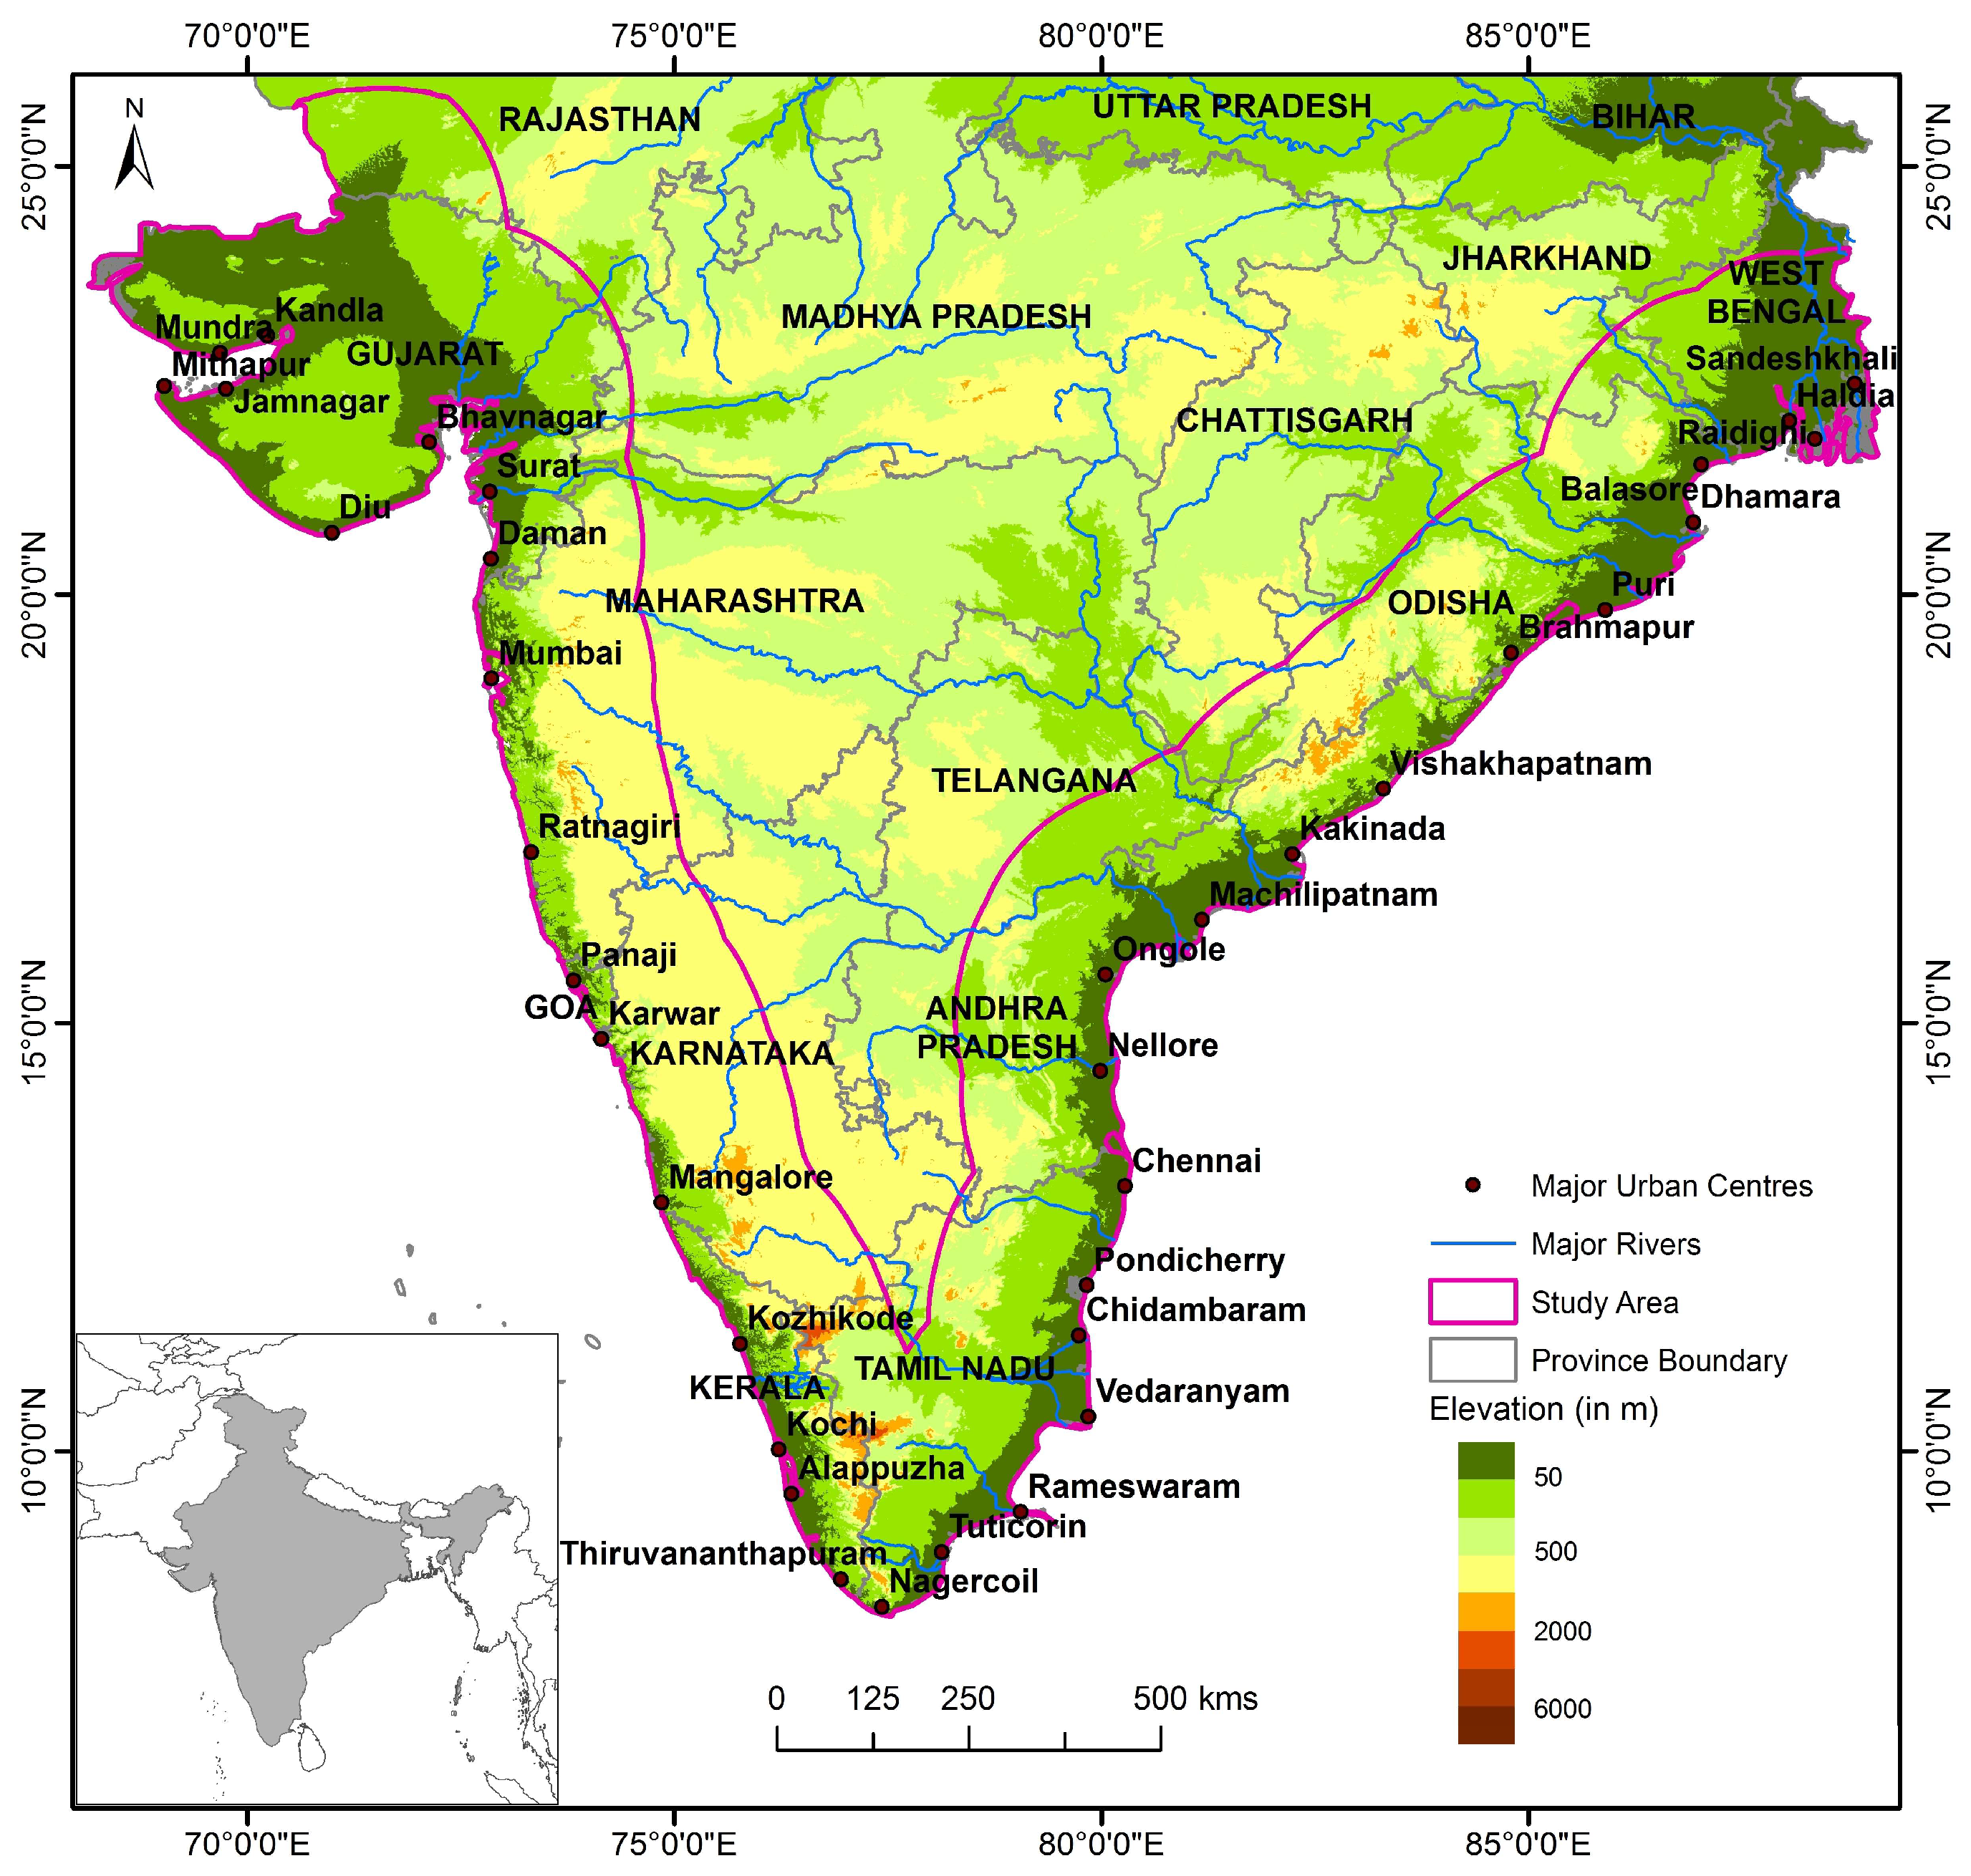
India is the second largest country in the aquaculture industry, and shrimp cultivation is prevalent along the coastal lagoons, deltas, estuaries, and the transition zones outside mangrove forests. India’s mainland has a very long coastline of 5422 km, and shrimp cultivation is carried out in 102 districts of nine coastal provinces of India (Gujarat, Maharashtra, Goa, Karnataka, Kerala, Tamil Nadu and Pondicherry, Andhra Pradesh, Odisha, and West Bengal) by mainly small-scale farmers [30]. India is the second most populous nation in the world. The total population in the 102 coastal districts is 0.29 billion, which is about one-fourth of the total population of India. Approximately 62% of the total population of the nine coastal provinces is located in the coastal districts of these states, and about 250 million people live within a corridor of 50 km from the actual coastline [3,4]. As per the reports of the Marine Products Export Development Authority (MPEDA), Government of India, the total shrimp production in the year 2015–2016 was 497,622 tons, and about 1.2 to 1.4 million ha in the coastal zone of the country was estimated to have potential for shrimp farming [31]. According to the United Nations (UN) FAO report on the national aquaculture sector overview in India (2014), small-scale farmers along the nine coastal provinces contribute over 90% of the total shrimp production and they mainly depend on backwaters and estuaries [30] where shrimps are commonly grown in small dedicated ponds along coastal wetlands, such as mangroves, swamps, estuaries, brackish water, and lagoons. In total, around 4.7% of India’s land area comprises wetlands, of which about 27% are coastal wetlands. In 2011, about 2900 km2 of these wetlands were occupied by aquaculture ponds, representing about 1.9% of the total wetland area of the country [32,33]. In our study, we applied a rather open definition of the coastal zone by applying a 200-km buffer zone inland from the mainland coastline of India, which sums up to approximately 1.1 million km2 of total land area (Figure 1).
3. Data Used
3.1. Sentinel-1 Multi-Temporal Data
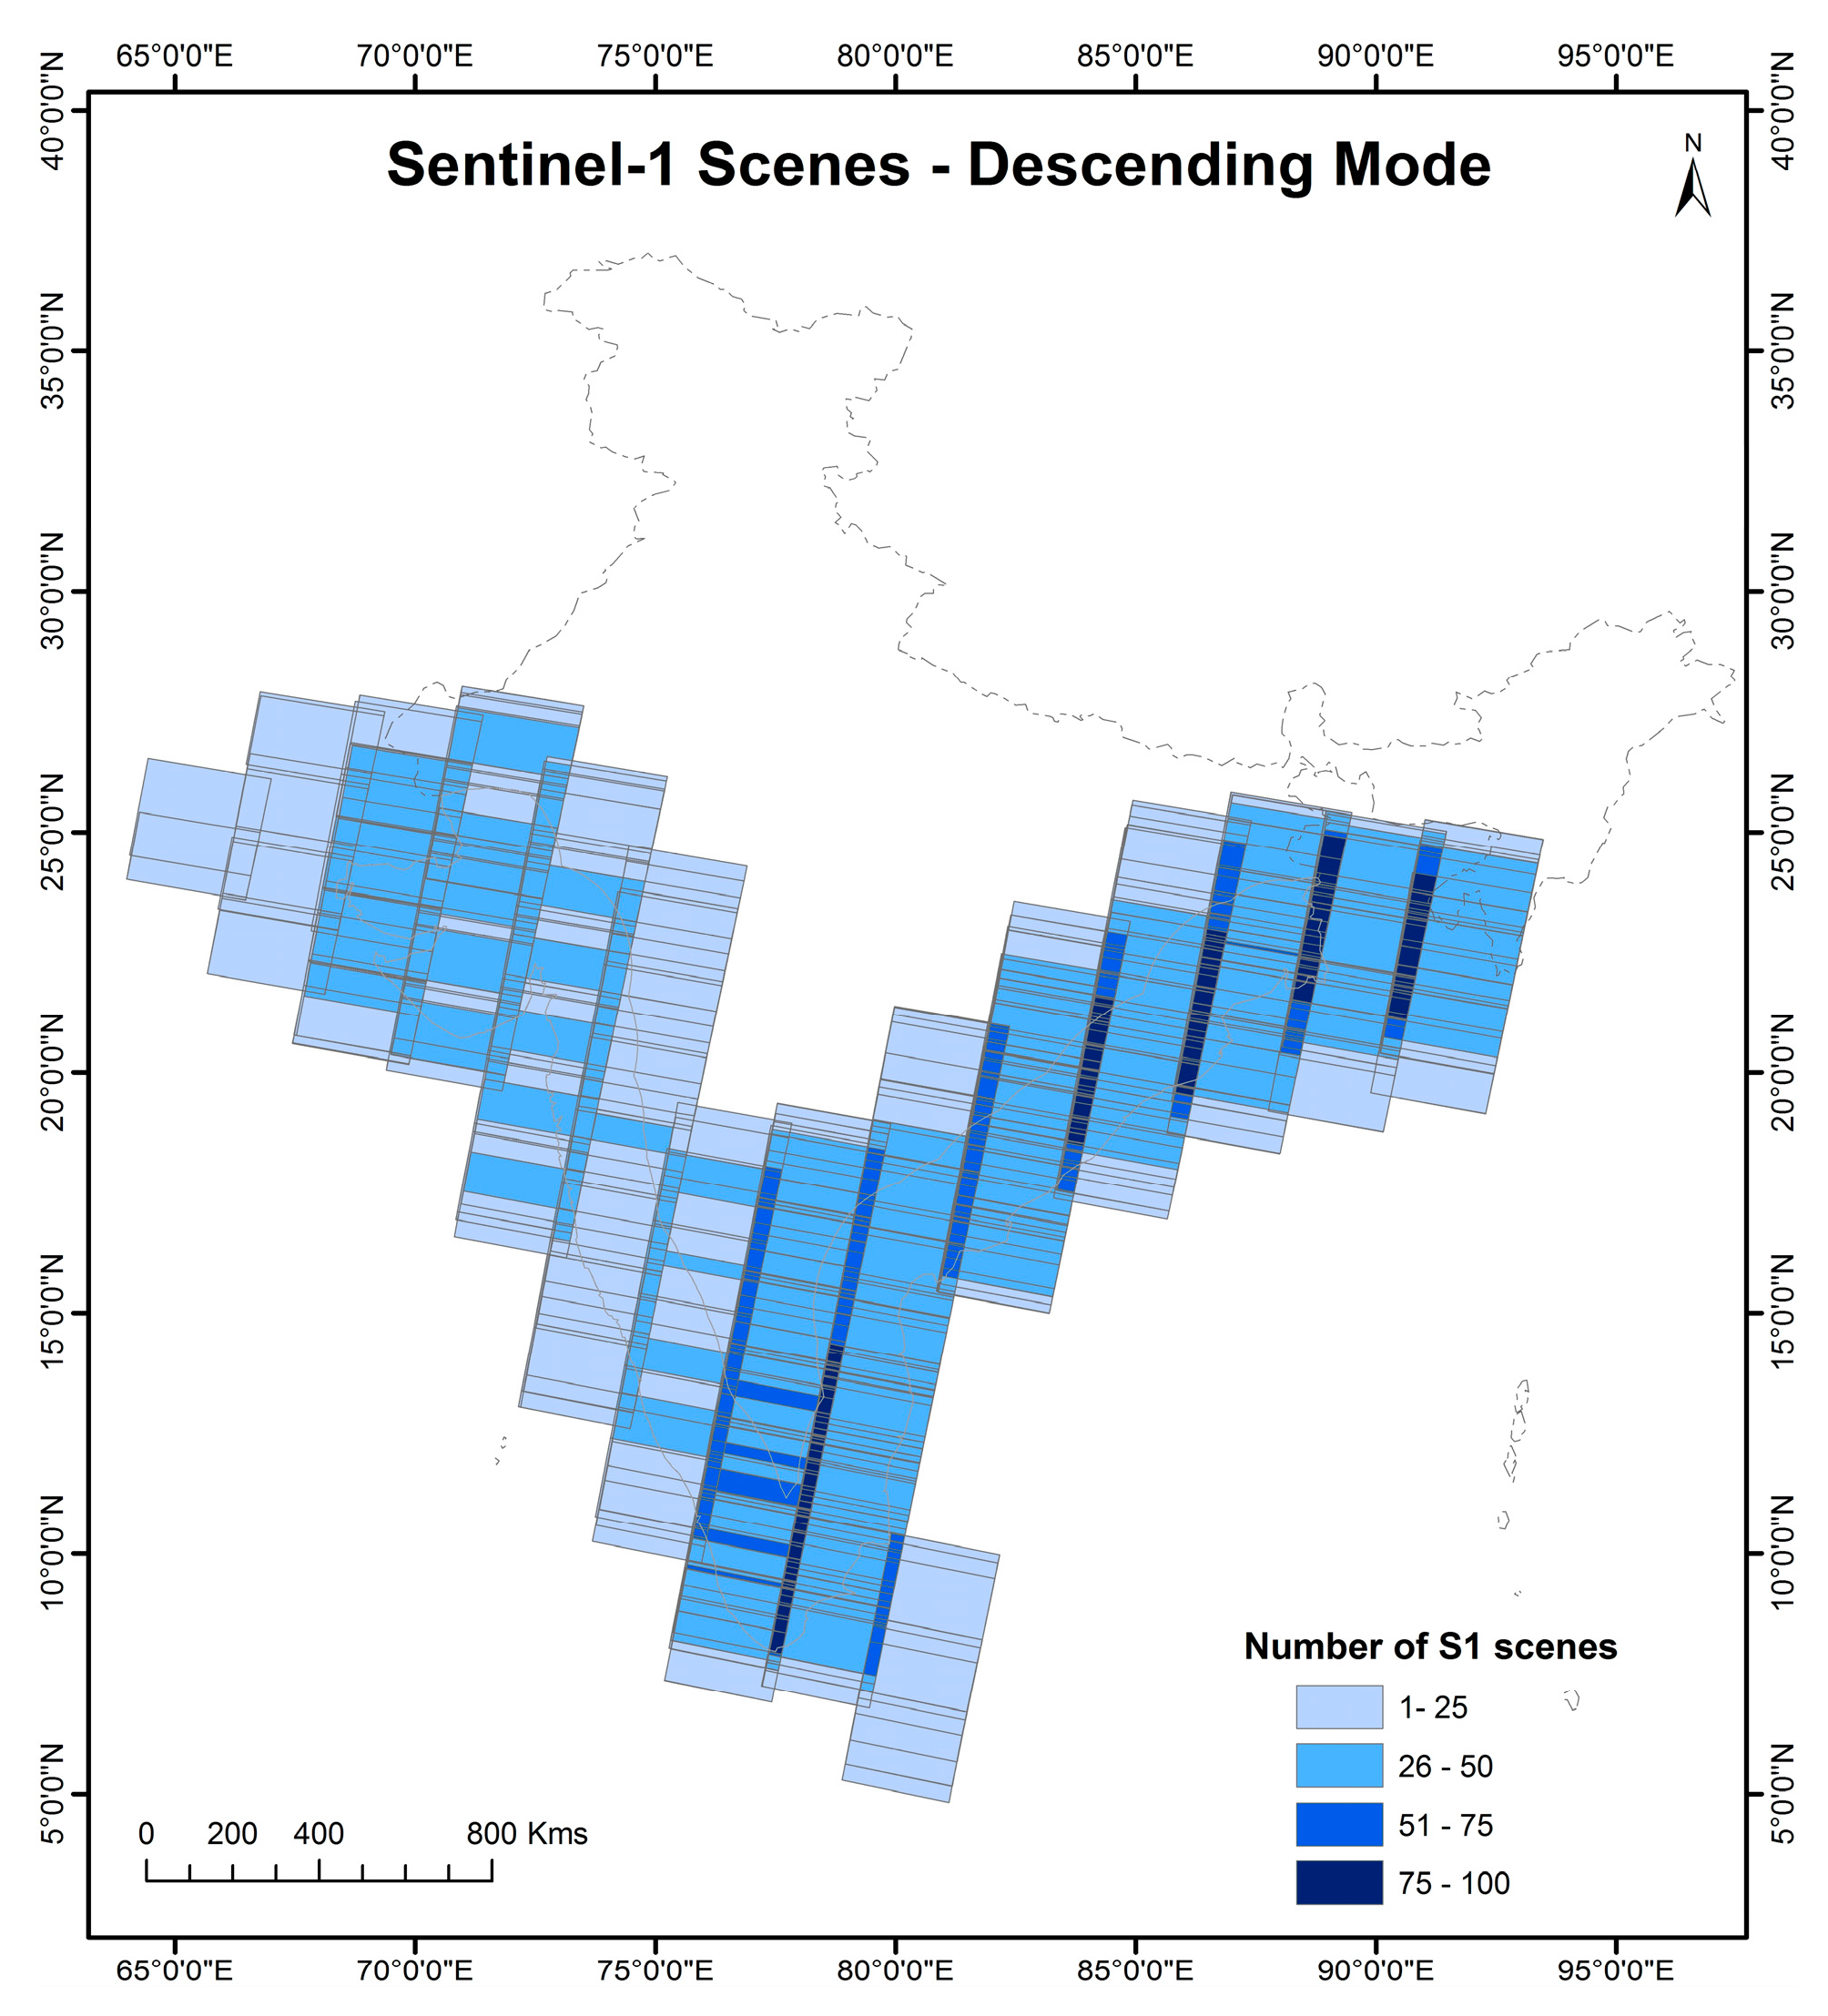
In this study, the main data source originated from the Sentinel-1 satellites. The Sentinel series of satellites is part of the Copernicus program designed by the European Union (EU) and European Space Agency (ESA). Sentinel-1 is a series of currently two satellites (Sentinel-1A and Sentinel-1B) with a synthetic-aperture radar (SAR) instrument operating on board at a C-band of 5.5-GHz frequency. In this study, we used all available vertical-horizontal (VH) polarized SAR data in the default interferometric wide-swath (IW) mode and the ground range detected high-resolution (GRDH) format acquired during the time period of September 2014 to June 2017. Each scene in the IW mode was captured in three sub-swaths using the terrain observation with progressive scans SAR (TOPSAR) method. This method results in a swath width of 250 km and 5 m by 20 m spatial resolution, which is then resampled to 10-m spacing for GRDH products. Figure 2 represents the coverage of the acquired Sentinel-1 VH polarization data for the time period of September 2014 to June 2017 in both look angles. In our study, we used only the descending mode look angle in favor of a more homogeneous backscatter data cube, resulting in a total of 2983 scenes distributed over the whole coastal zone of India.
3.2. Auxiliary Geodata
Further auxiliary data used in this study comprise the following:
- Elevation data for topographic masking of areas unfavorable for aquaculture cultivation, which is acquired for the whole study area from the Shuttle Radar Topographic Mission digital elevation model (SRTM DEM). A total of 441 tiles covering the whole study area were downloaded from the United States Geological Survey (USGS) web portal. The downloaded dataset has a resolution of 30 m and is freely available.
- A detailed coastline dataset for India for generating a land/water mask, which was provided by the Institute of Geographic Sciences and Natural Resources Research (IGSNRR), Chinese Academy of Sciences. This dataset gives more detailed and up-to-date shoreline vector data than other globally available datasets.
- Up-to-date shrimp production data for India from the Marine Products Export Development Authority (MPEDA), Government of India. The state-wise estimated shrimp production and the area under cultivation from the time period of 2001–2002 to 2015–2016 are available on the website of MPEDA [34].
- The global mangrove distribution from USGS at 30-m spatial resolution was generated from global land survey (GLS) data for 2000 (version 1.3); the Landsat archive was used for spatial profiling. Even though it was validated using existing datasets, this dataset has some limitations, such as misidentification of small patches of mangroves (less than 900–2700 m2), and errors due to cloud cover and noise [35].
- Administrative areas at the district level based on Census 2011, which were downloaded from http://projects.datameet.org/maps/.
4. Methodology
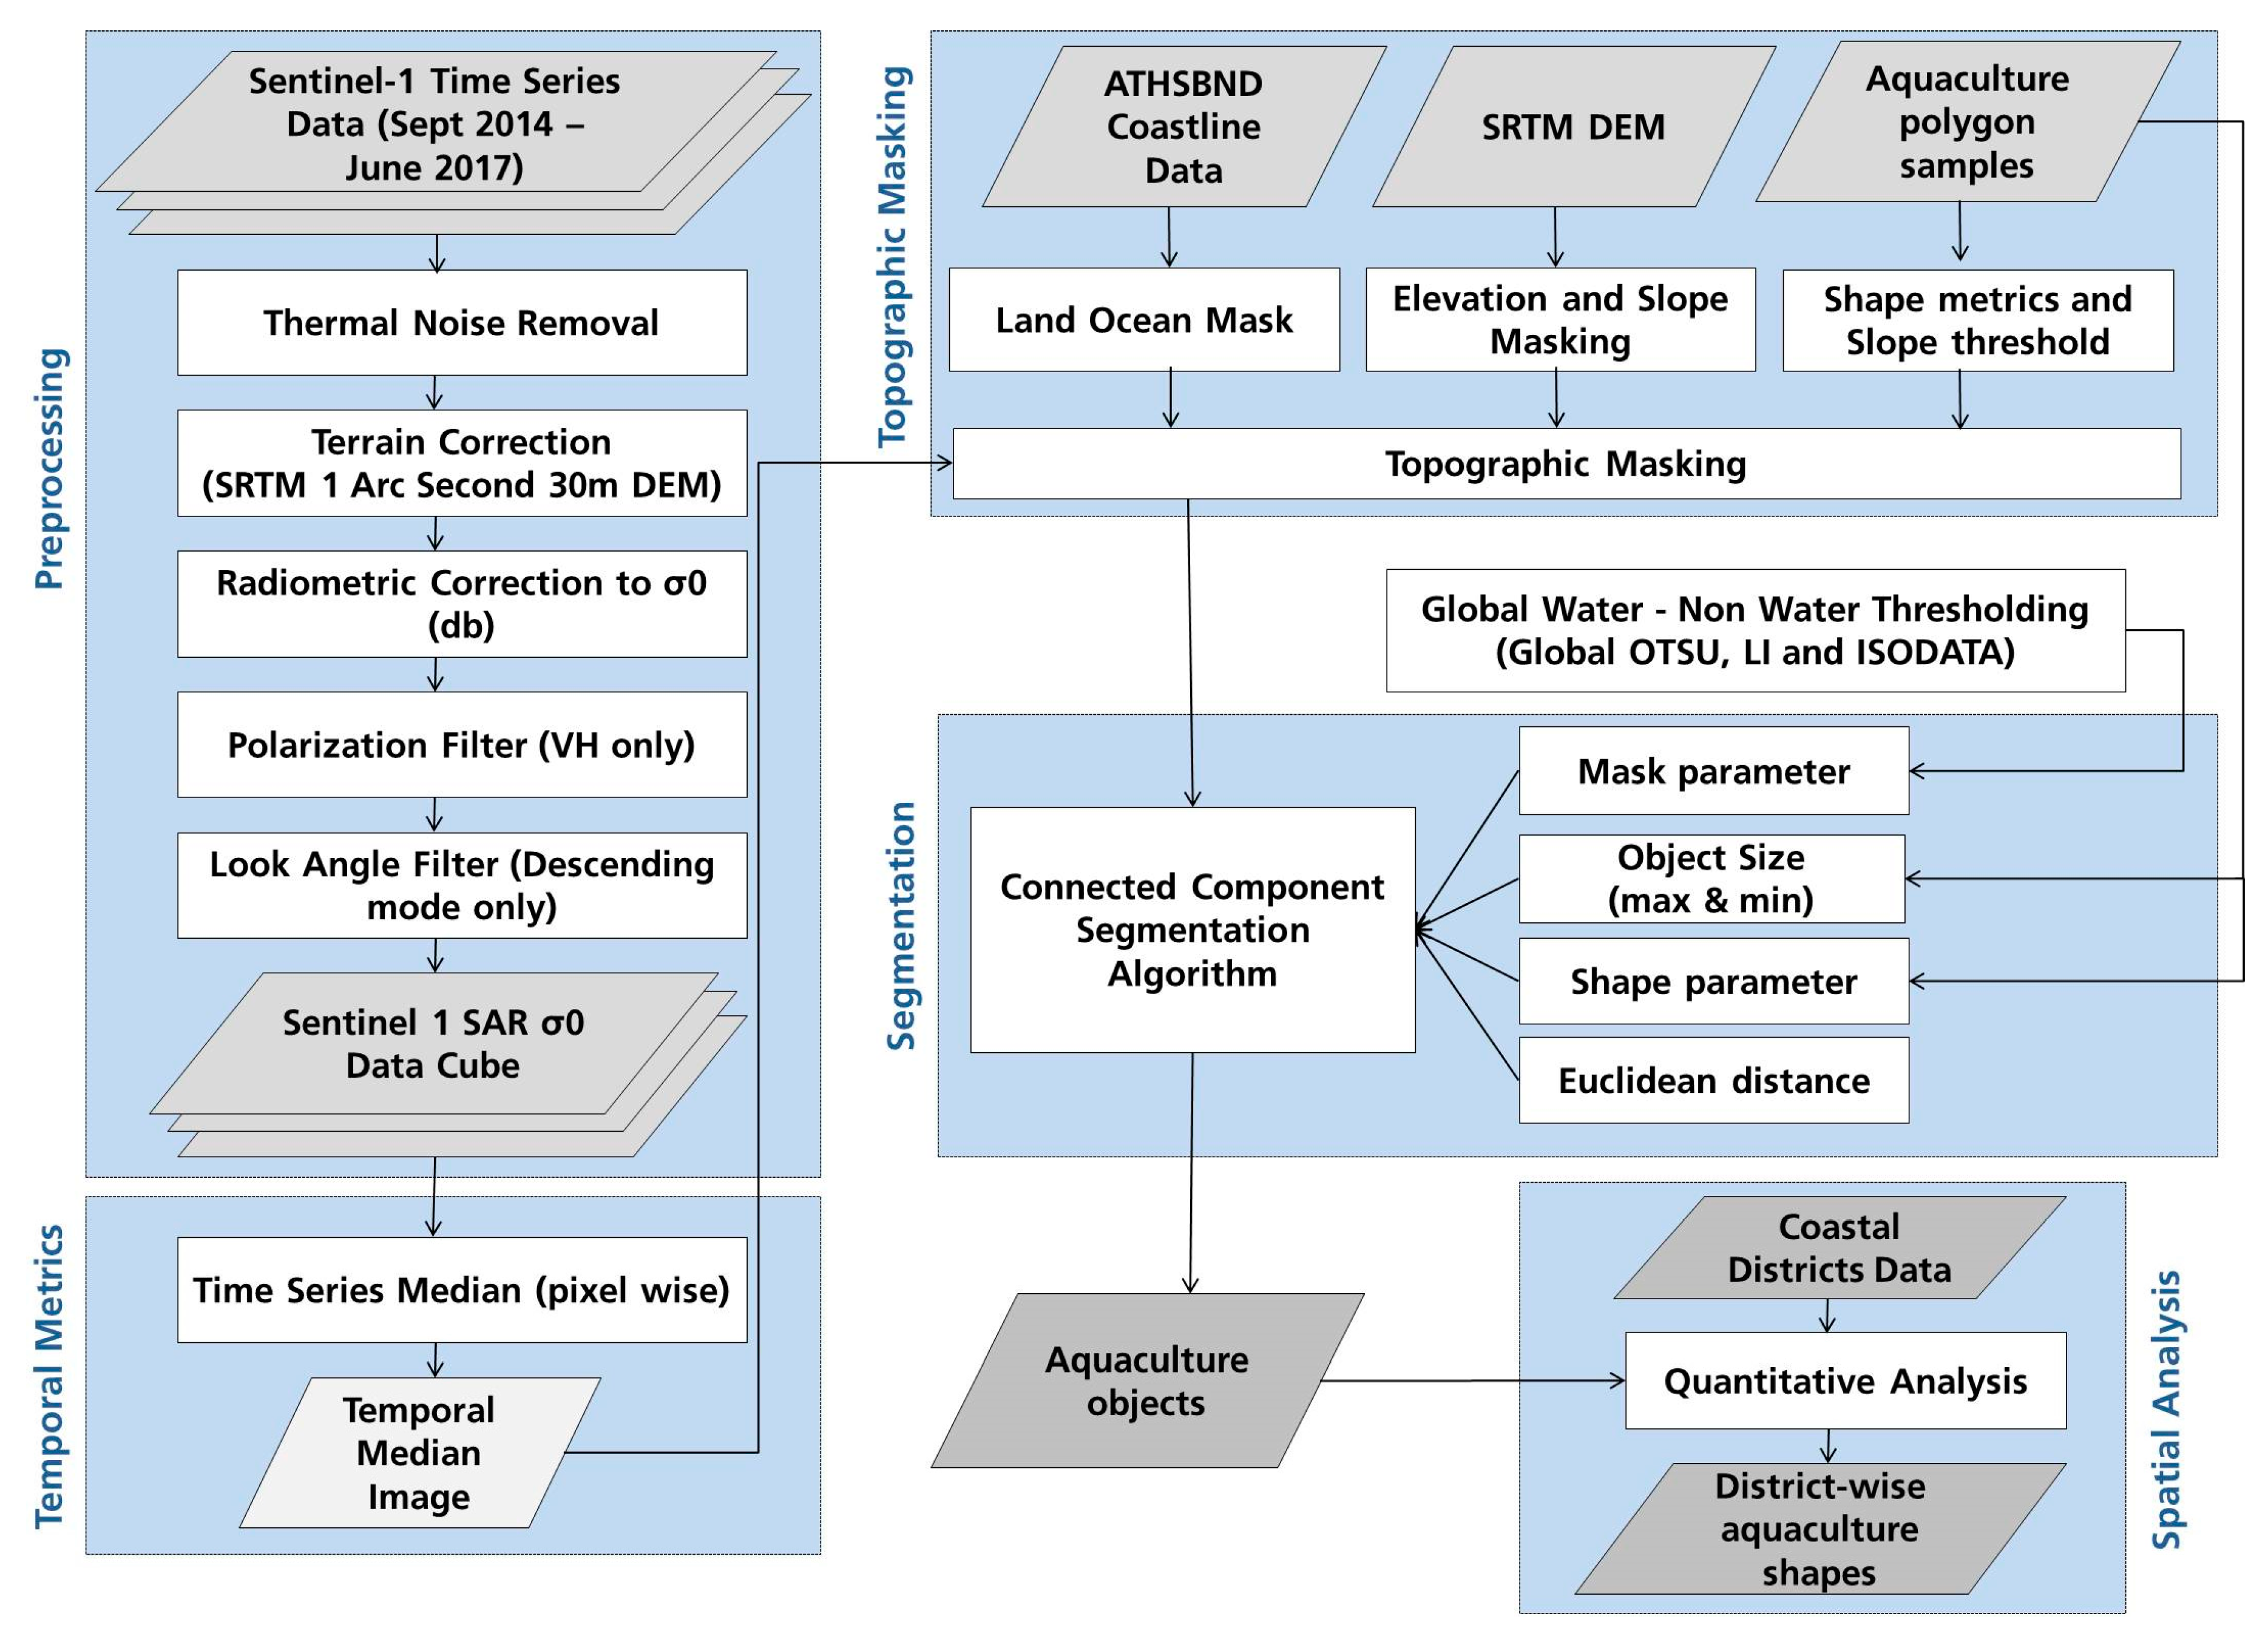
The derivation of aquaculture can be categorized into five main steps, i.e., preprocessing, the calculation of a temporal median layer, topographic masking, segmentation, and spatial analysis (see Figure 3). The object-based classification methodology exploited the very characteristic shape of aquaculture ponds and, for the most part, followed the approach from Reference [1]; therefore, it is only described briefly.
4.1. Processing of Sentinel-1 Data and Masking
All available Sentinel-1A/B data in IW acquisition mode, with descending look angle and GRDH format, were acquired for the coastal zone of India from the Copernicus’ Sentinel scientific data hub and were preprocessed to convert the intensity values to backscatter coefficient sigma naught using the free and open-source Sentinel Application Platform (SNAP). In the first preprocessing step, an orbit file was applied using restituted orbits, and thermal noise was removed. The next step comprised radiometric calibration which converted intensity values to the backscatter coefficient sigma naught. This was followed by correction of terrain distortions using Shuttle Radar Topography Mission (SRTM) 30-m resolution data to correct for layover and foreshortening effects. From a total of 2983 available descending mode data points collected between September 2014 and June 2017, the temporal median of sigma naught in VH polarization was calculated at the pixel level. Although also horizontal-horizontal (HH) polarization is suitable to detect water areas, in a previous study [1], we found that VH polarization was slightly better suited for the differentiation between land and water, due to a more pronounced bimodal distribution of backscatter values in the histogram. By averaging over time, the temporal median reduces the speckle noise significantly which also effectively improves the detection of narrow surface features, such as dams and levees surrounding aquaculture ponds. At the same time, using a synthesized temporal metric, such as the median, the typical temporal characteristics of aquaculture ponds can be exploited in the classification. Aquaculture ponds can be generally described as permanent water bodies, in contrast to, e.g., temporarily inundated rice paddy fields. While aquaculture and rice paddy fields often feature the same form factors, the former appear much darker in the median image due to their persistent water surface throughout the year.
Since aquaculture activities are generally practiced in flat estuarine environments with hardly any slope and low elevation, in the next step, topographic masking was applied based on SRTM DEM data and, the derived slope information was used to exclude mountain areas and rough terrain. In this way, another source of error was eliminated, since hilly areas often feature dark shadows in the down range dimension of SAR images, and they are, therefore, often misclassified as water areas. Furthermore, coastline vector data were used to exclude ocean, rivers, and water bodies since only land-based aquaculture was of interest in this study.
4.2. Aquaculture Reference Samples
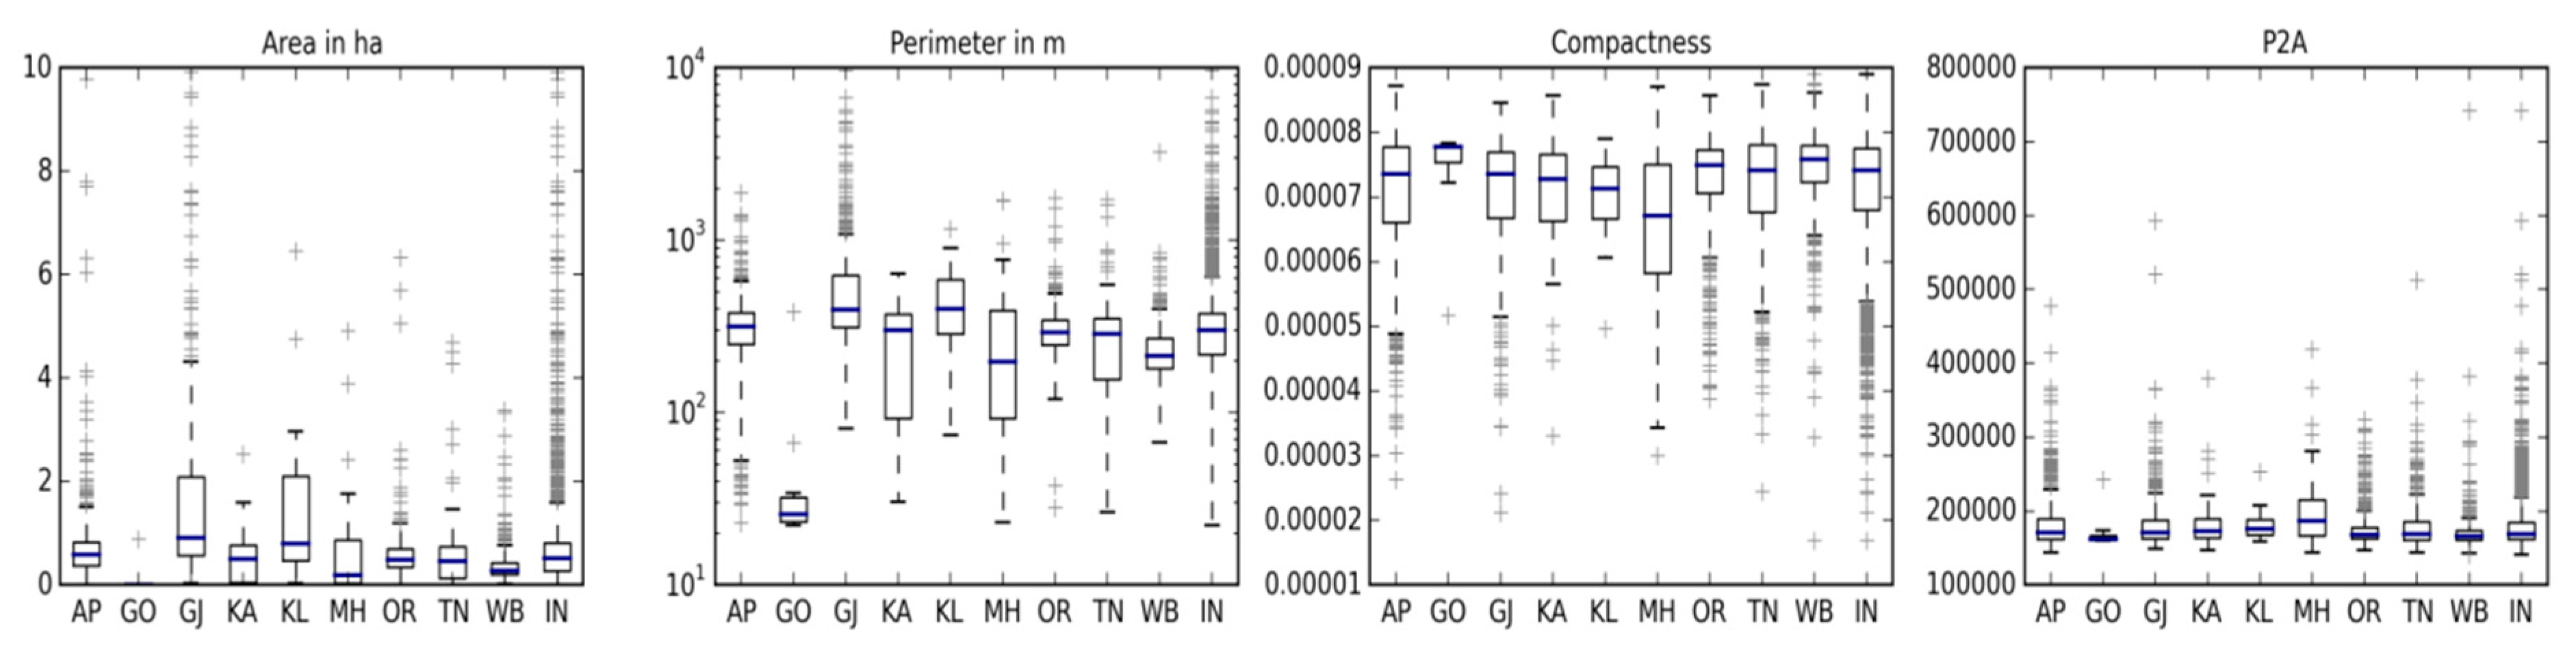
Aquaculture ponds have very characteristic shapes that should be exploited. To delineate aquaculture ponds using an object-based classification approach, representative information on shape parameters is needed. In view of this, we digitized 3123 aquaculture ponds through visually interpreting high-resolution satellite data from Google Earth imagery along the entire coastal zone of India within a 20-km buffer zone from the shoreline. Imagery from before 2014 was not considered. To ensure a representative distribution of samples over the coastal zone, sample points were randomly distributed over the coastal zone, and the nearest pond to each point was selected as a sample. To quantitatively describe the geometry of the sampled aquaculture ponds, we calculated area and their compactness metrics, i.e., area, perimeter, radius, and perimeter/area. Figure 4 shows the shape statistics on digitized pond structures for the nine provinces in India.
4.3. Object-Based Analysis of Sentinel-1 Median Image to Extract Aquaculture Ponds
On the basis of the Sentinel-1 median image, aquaculture ponds were delineated by applying an object-based connected component segmentation algorithm, provided by the Orfeo Toolbox, an open-source library of image-processing algorithms from the CNES (French Space Agency). The connected component segmentation comprised three steps. Firstly, a water mask was applied to select pixels of the image which were to be segmented. The threshold for differentiating between land and water was automatically defined using the Otsu thresholding approach [36]. In order to cope with the large data volumes, and to account for regional differences in data coverage which also affect the temporal median, the coastal zone was divided into 11 sub-regions with approximately equal proportions of land and water areas necessary for meaningful land/water thresholds during the segmentation step [37]. In the second step, the actual connected component segmentation was performed with a user-defined criterion, the so-called Euclidian intensity pixel distance criterion, to decide whether two neighboring pixels belonged to the same segment or not. This threshold was adopted from Reference [1] who iteratively tested different values for the same purpose of segmenting aquaculture ponds. After this, in the final step, an object-based image filtering was applied using shape attributes as criterion reasoning on segment properties. Thereafter, the resulting image objects were filtered according to thresholds of objects and their shape properties (minimum and maximum object area, object elongation, size of the object, and size of the object bounding box) that were defined from the collected aquaculture samples (see Section 4.2).
4.4. Validation of the Results
The validation of derived aquaculture objects was done by creating a reference dataset with two classes—aquaculture and non-aquaculture (all the surface features other than aquaculture within the study area). To ensure a representative distribution of samples over the coastal zone, we generated 200 × 200 km grids and calculated the proportion of derived aquaculture area within each grid. Then 2000 sample points were distributed among the grids using stratified random sampling based on each grid’s share of aquaculture area. The aquaculture and non-aquaculture reference sample points were carefully labeled using very-high-resolution imagery available between September 2014 and June 2017 in Google Earth. Then, a confusion matrix was generated to derive producer and user accuracies for the two classes and the overall accuracy.
Furthermore, a quantitative validation of shape parameters of derived pond objects was performed to have an indicator of the accuracy of the object-based segmentation approach. For this, a total of 432 ponds were randomly selected from our reference dataset. Only objects that were also identified as ponds by our algorithm were selected. Then, for the 432 objects, shape parameters (area, perimeter, and perimeter/area) for both datasets—the dataset with the reference ponds and the dataset with the automatically extracted ponds—were calculated and compared.
4.5. Quantification of Aquaculture Ponds
From the extracted aquaculture ponds, spatial statistics on the relative aquaculture areas were calculated for regular units every 5 km along the coastline to reveal the large-scale patterns of aquaculture production in India, starting from Gujarat in the west to West Bengal in the east. Furthermore, the spatial metric of relative aquaculture proportion was correlated with the relative area of mangrove vegetation. For this, the mangrove dataset from USGS was used as a basis. Along the coastline of India, the major river deltas and major urban centers were also identified and localized within the spatial profile to reveal the influence of urban development on aquaculture pond distribution [9]. Furthermore, the aquaculture ponds were spatially aggregated at the province and district level based on the district vector file to compare the results with the official shrimp production statistics provided by the Marine Products Export Development Authority (MPEDA), Government of India.
5. Results
5.1. Large-Scale Aquaculture Mapping Using Sentinel-1 Time Series
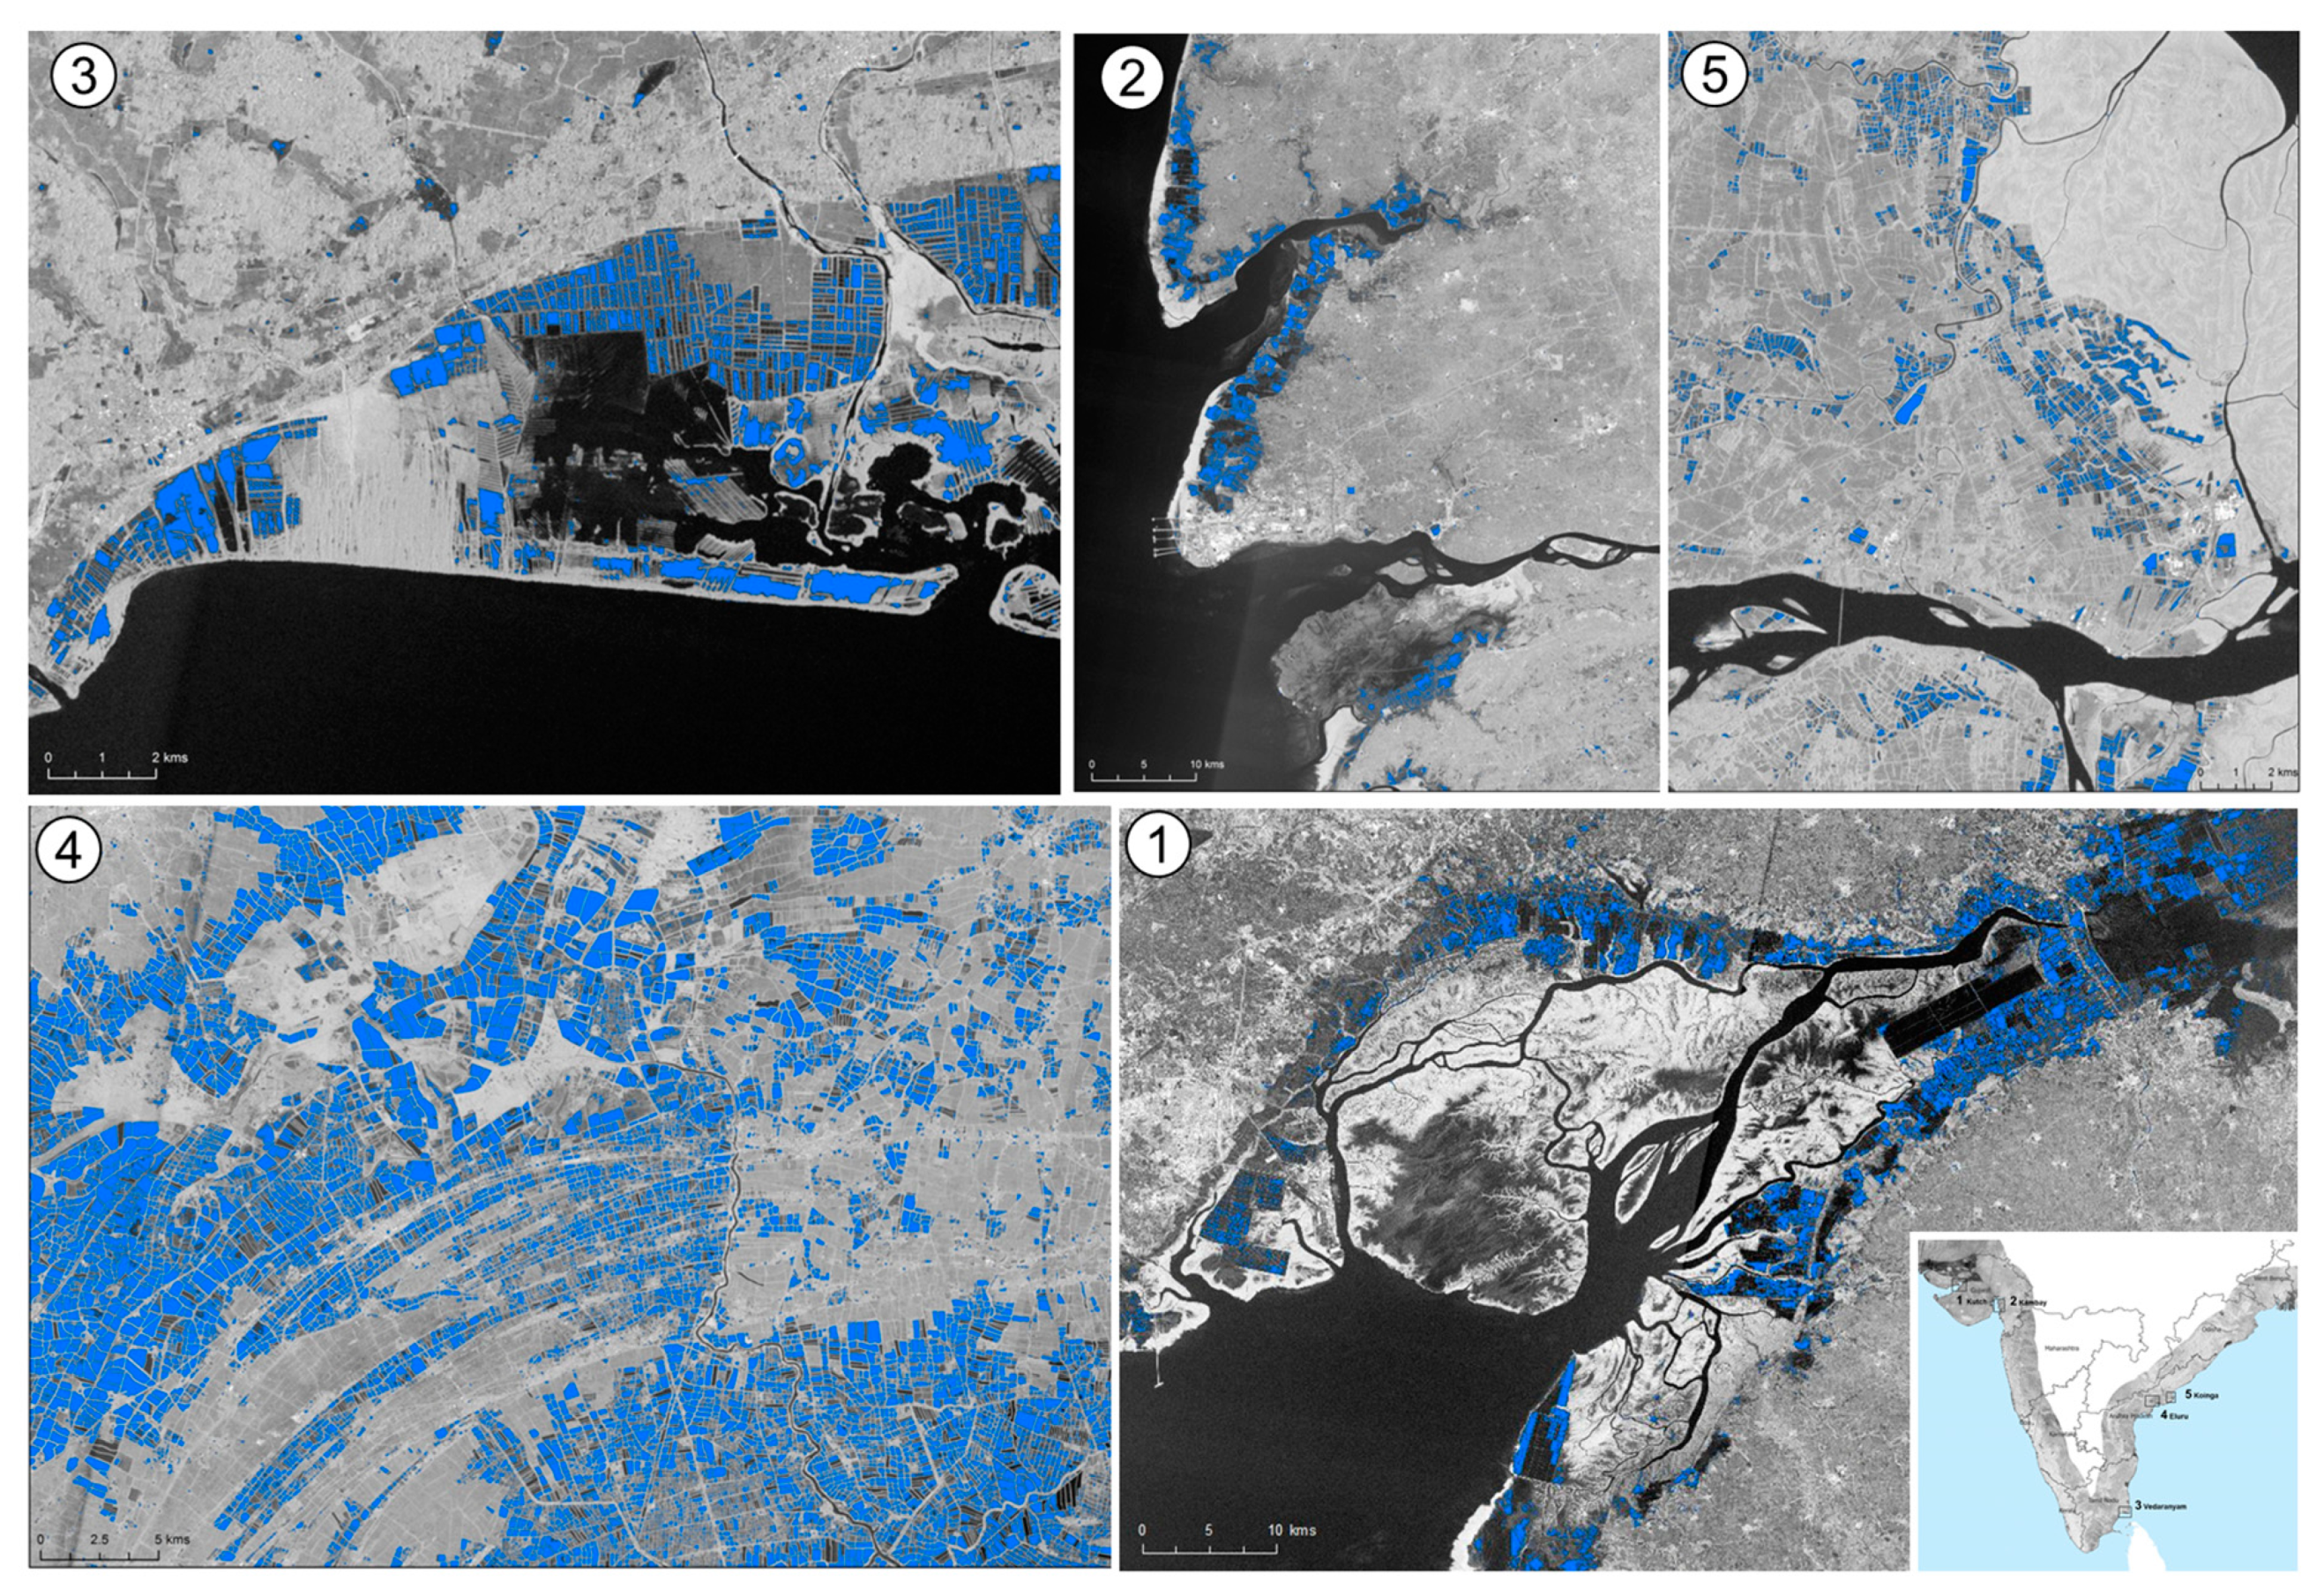
Figure 5 shows spatial subsets of derived aquaculture structures for five subsets along India’s coastal zone, representing dominant areas of aquaculture activity, i.e., (1) Kutch, Gujarat; (2) Kambay, Gujarat; (3) Vedaranyam, Tamil Nadu; (4) Eluru, Andhra Pradesh; and (5) Gangetic Delta, West Bengal. The individual aquaculture objects overlaid on the median SAR backscatter coefficient are clearly visible in dark-blue color. The aquaculture ponds occurred in mostly rectangular compact shapes. The total area of detected aquaculture ponds was about 3200 km2, divided into more than 408,000 single ponds having an average pond size of about 0.8 ha.
The user’s and producer’s accuracy and the overall accuracy were calculated from a total of 1000 test samples to validate the extracted aquaculture ponds (Table 1). In total, 814 of 1000 aquaculture points and 978 of 1000 non-aquaculture points were correctly classified, resulting in an overall accuracy of 89.6% While the developed approach shows generally satisfying results, certain issues related to small-scale aquaculture with ponds too small to be resolved by the Sentinel-1 sensor could be identified. Another problem was the confusion of aquaculture with flat features such as salt pans, which appear as dark features in the SAR image. Also, the discrimination between aquaculture and natural water tanks was difficult in some cases, particularly in southeast India.
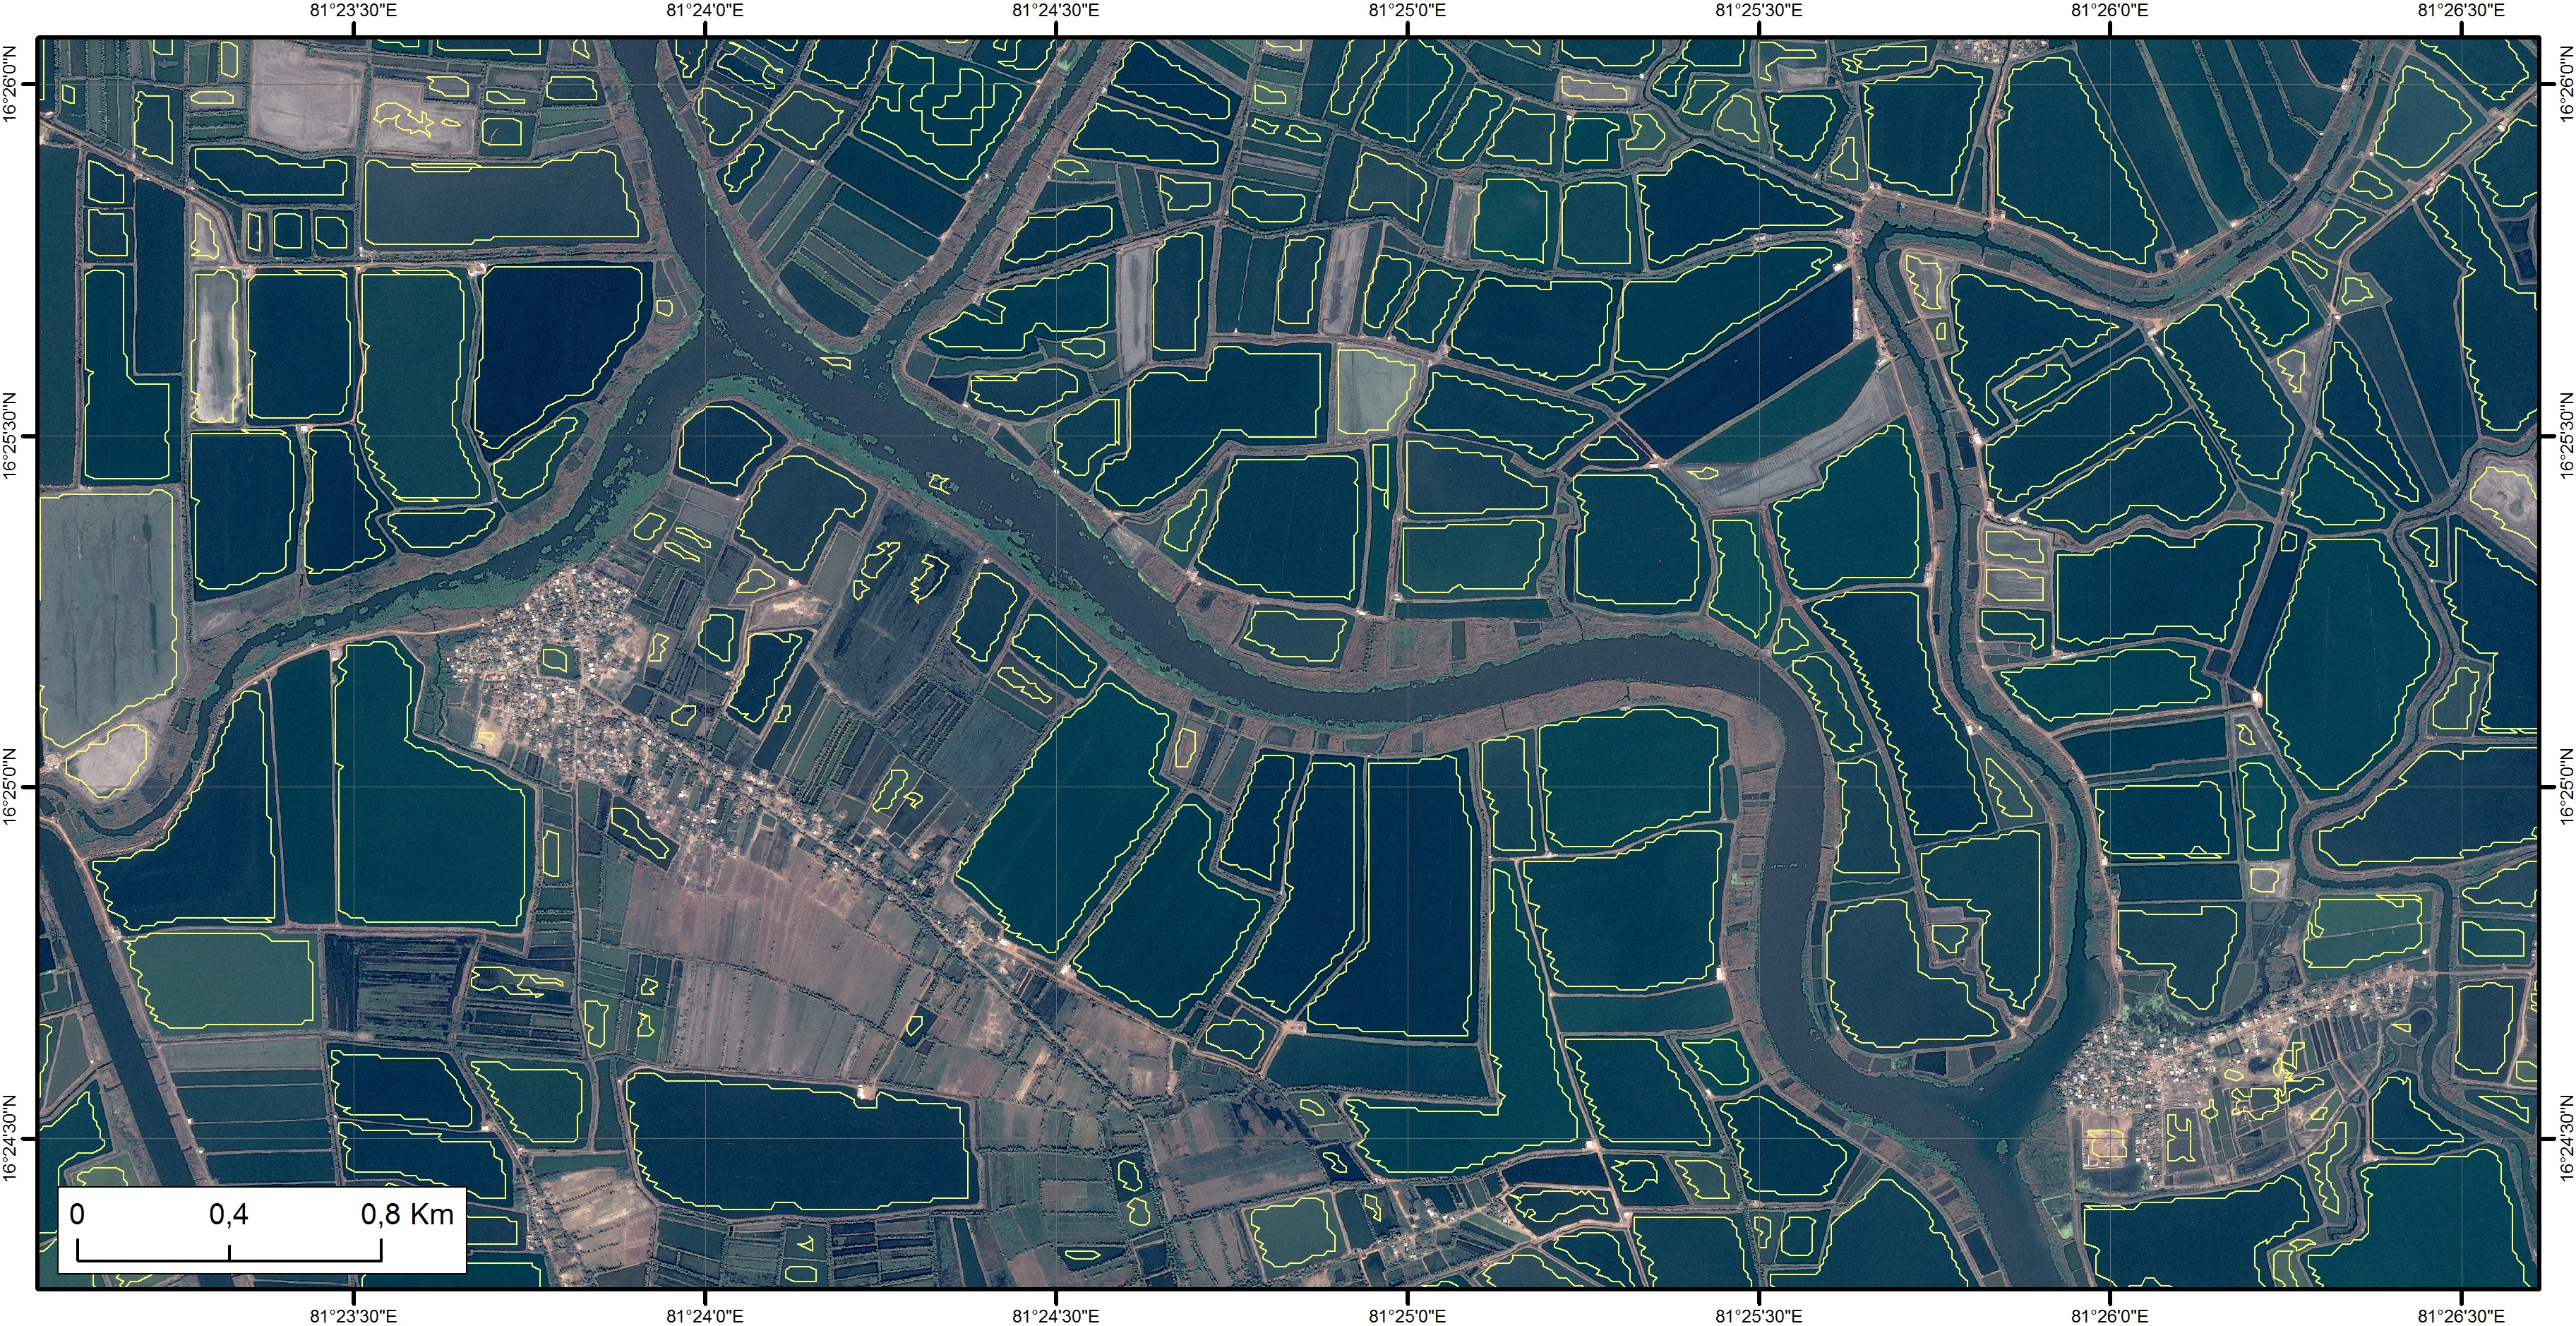
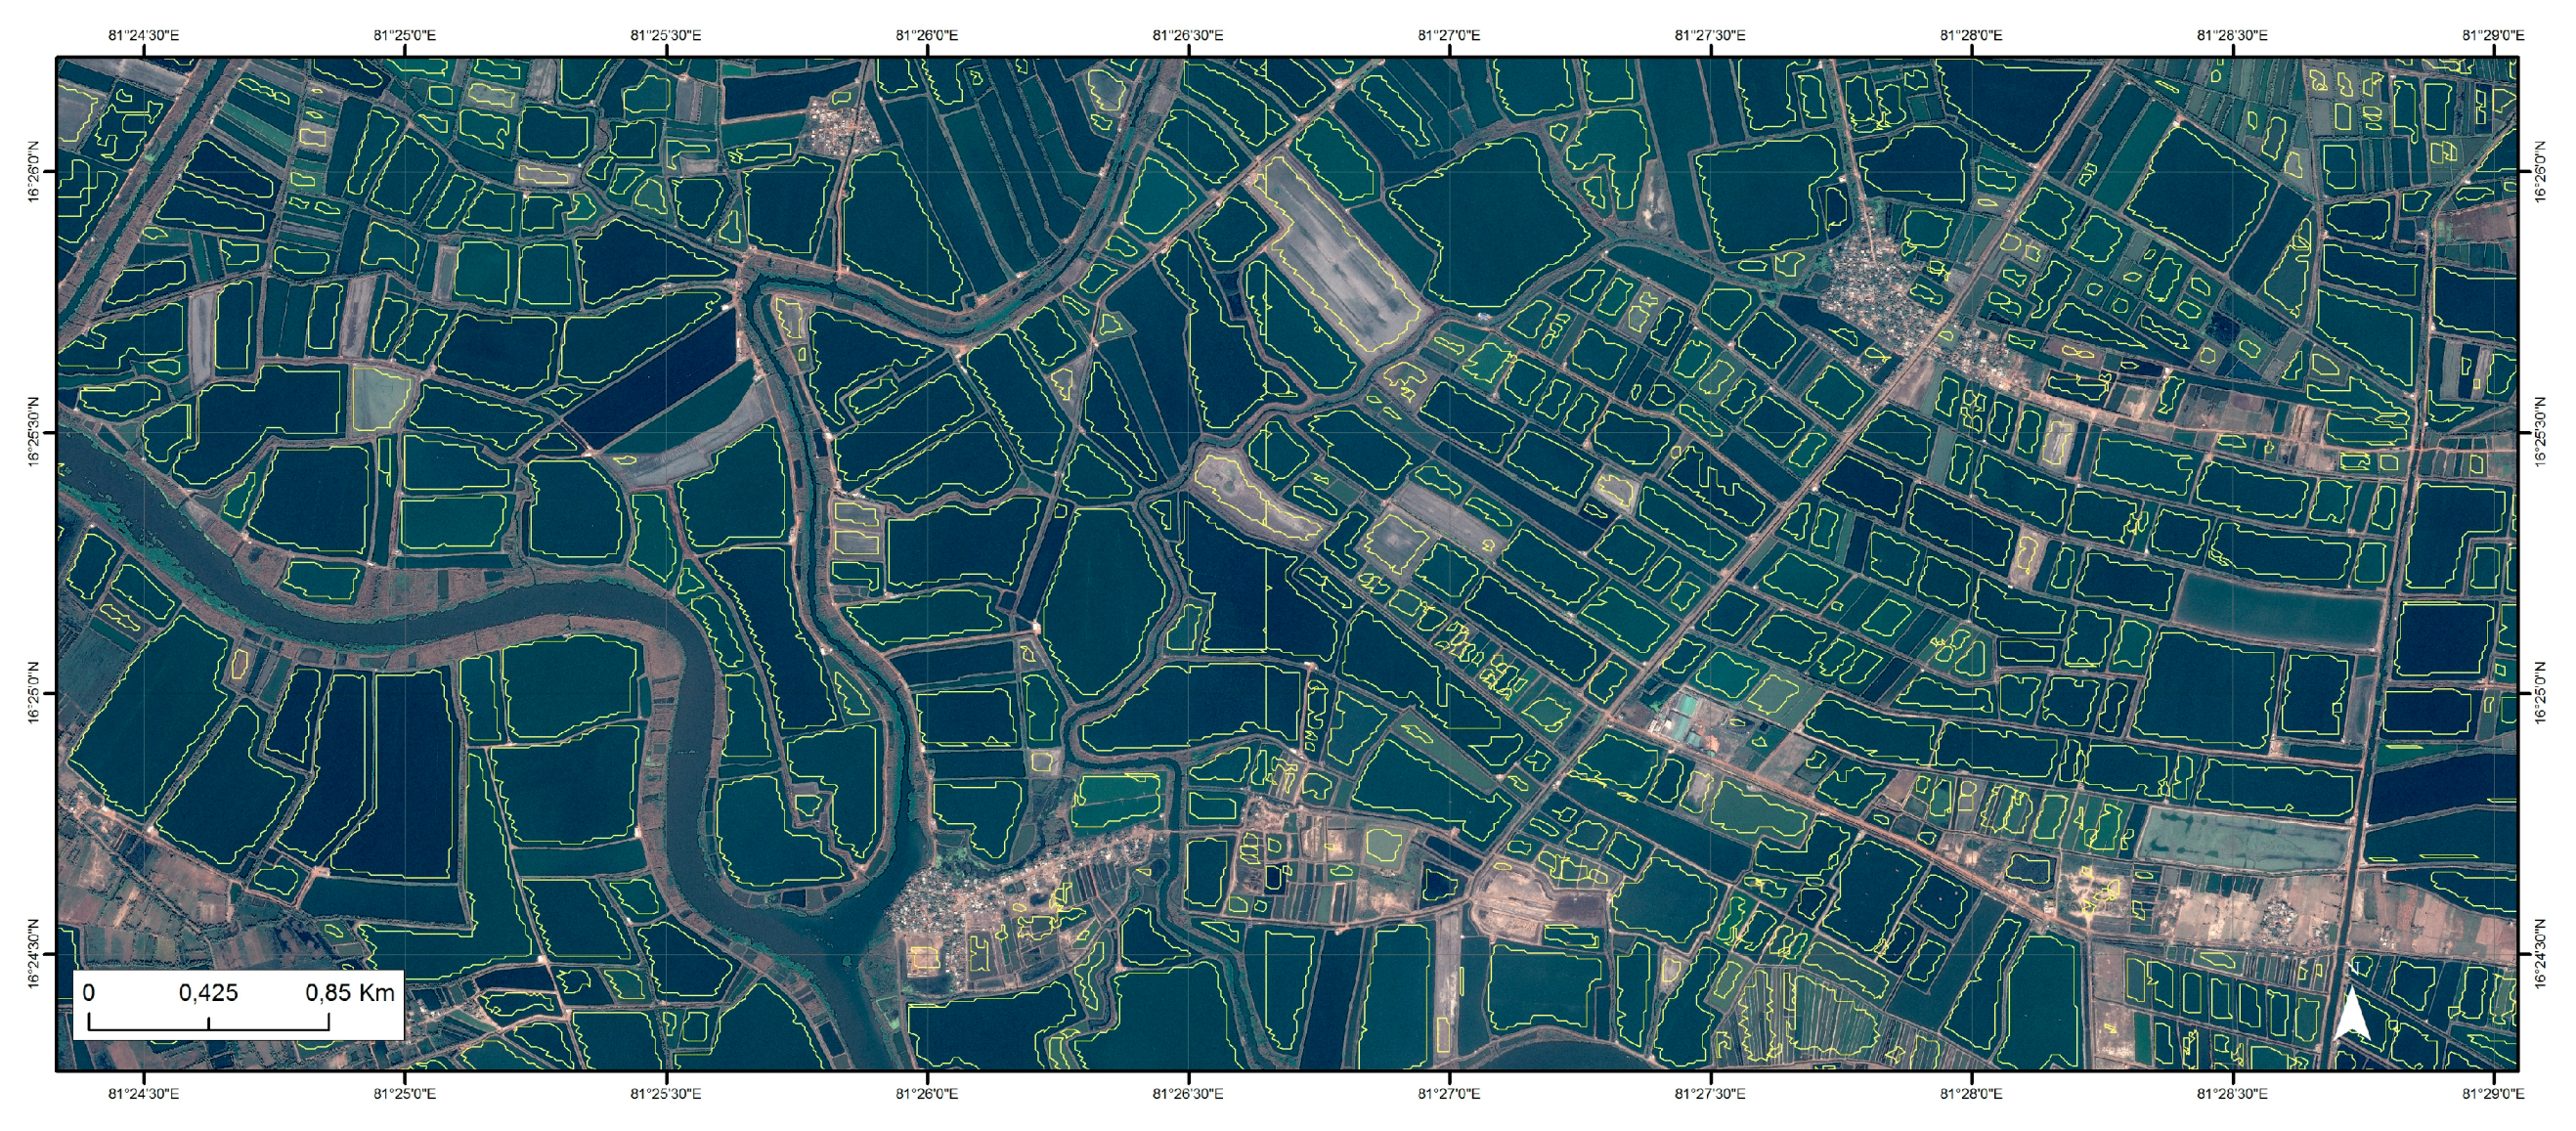
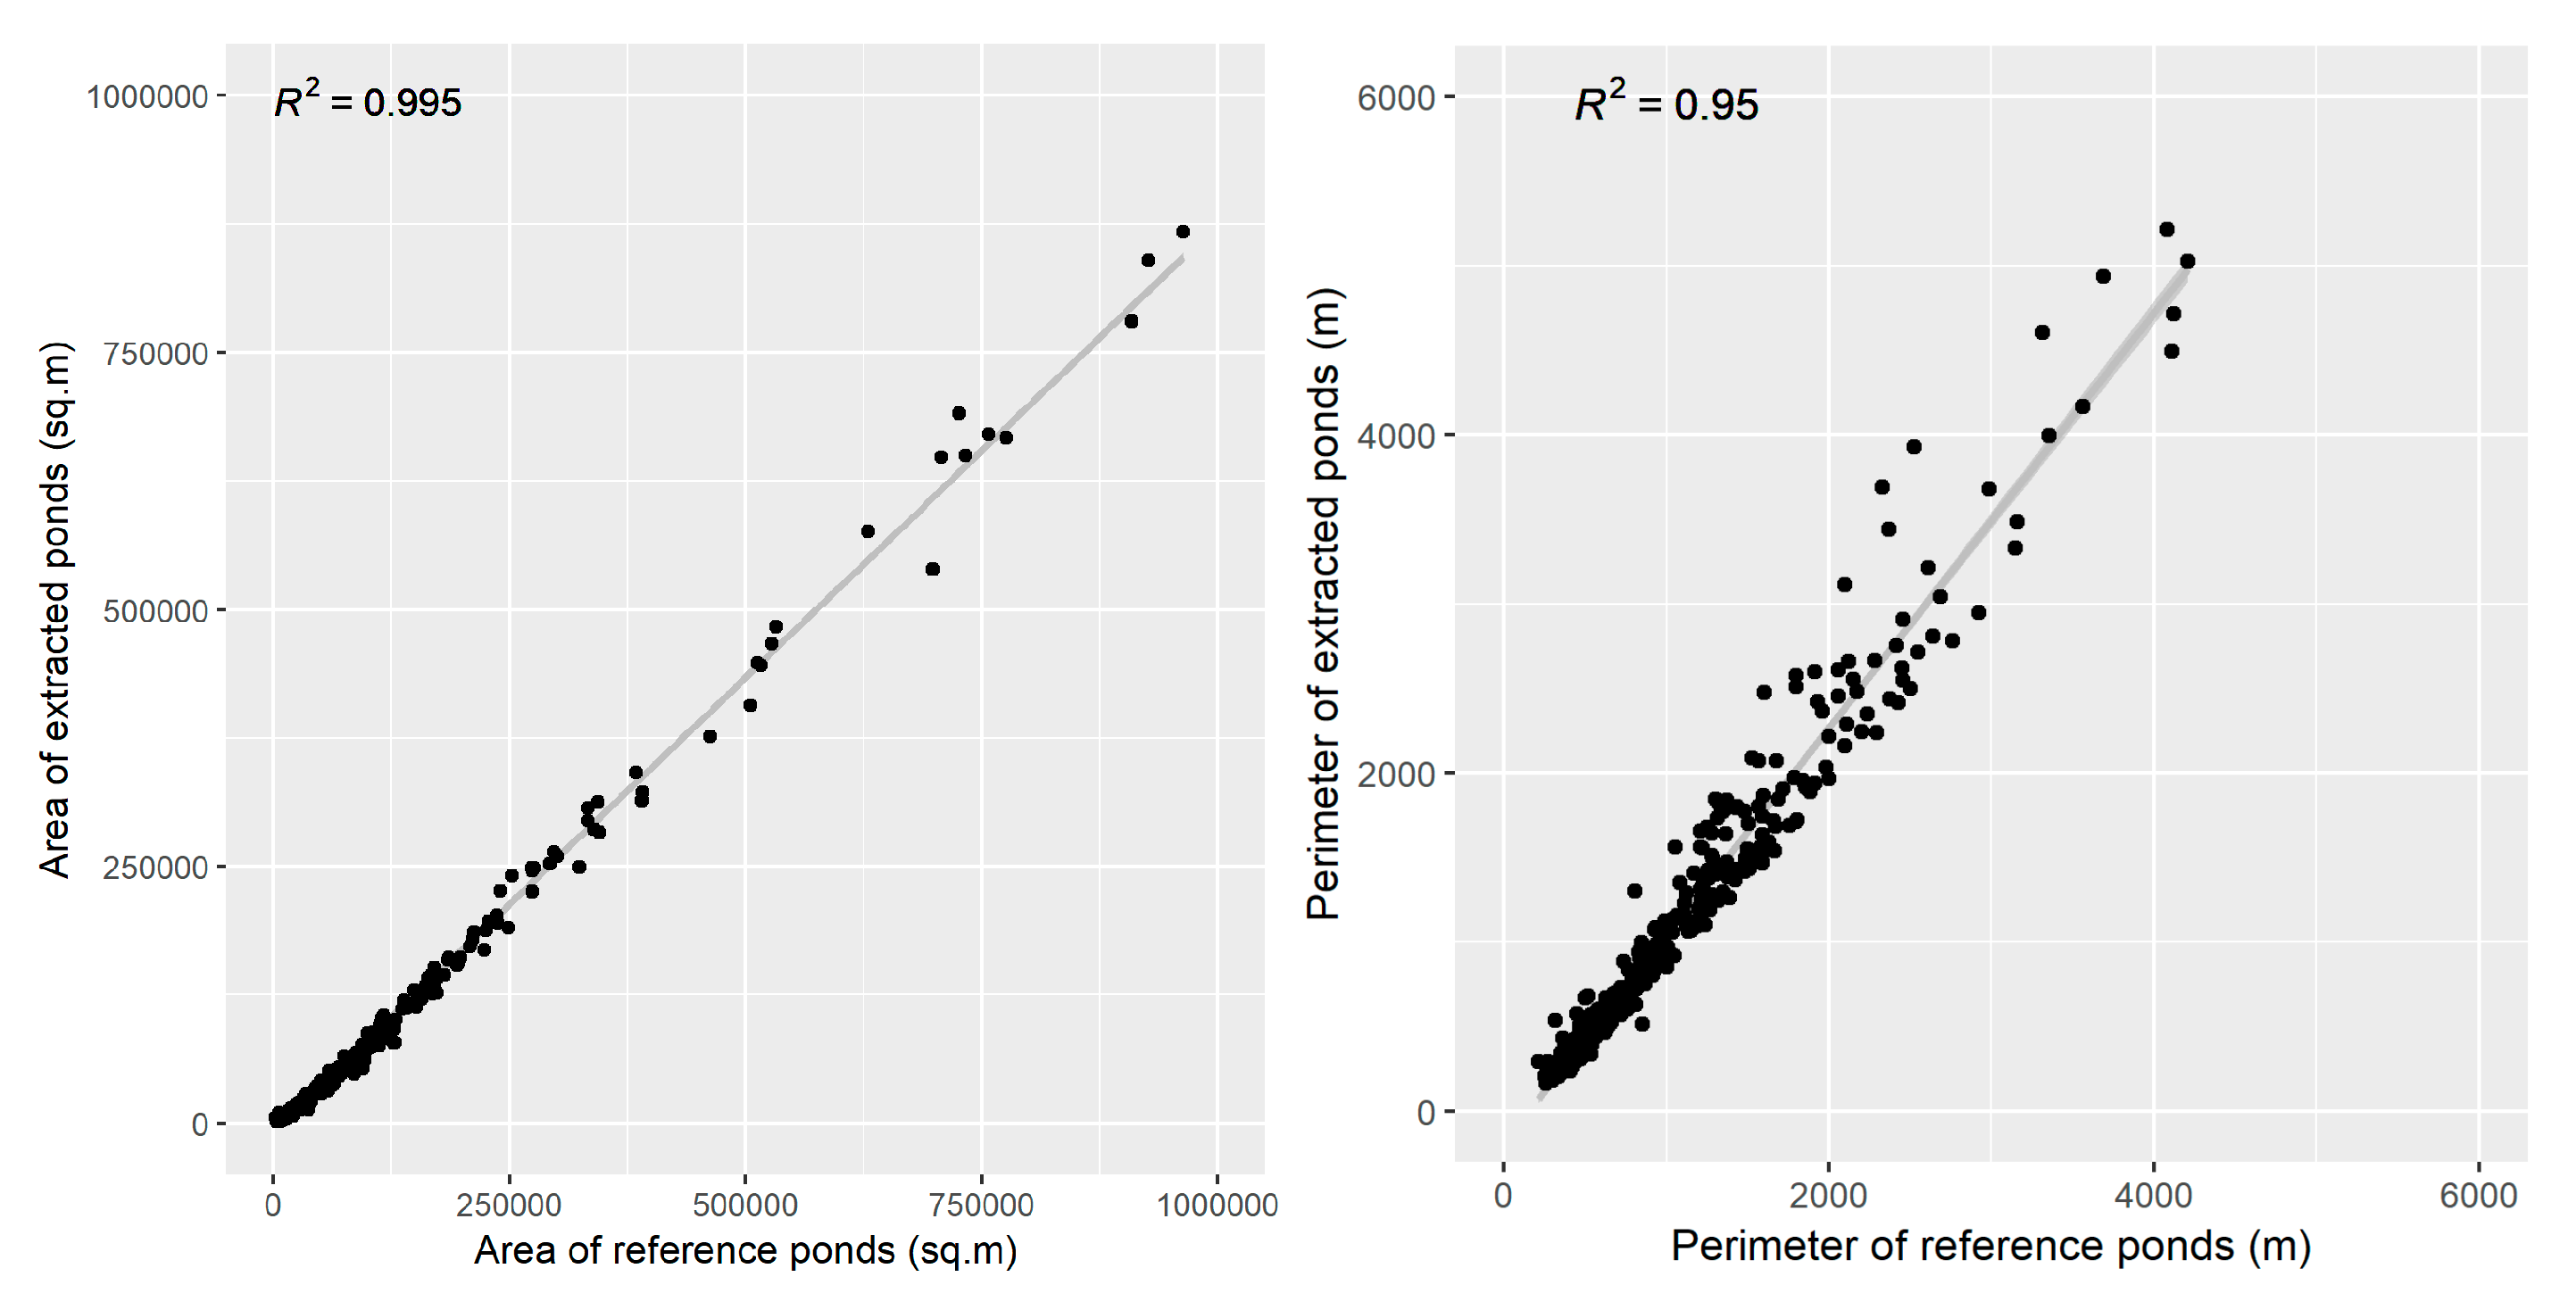
Figure 6 shows detailed pond outlines in comparison to a recent Pleiades image for a spatial subset located in Eluru, Andhra Pradesh (subset 4 of Figure 5). As can be observed, extracted ponds matched well with the ground-truth structures. Next to this qualitative evaluation, a quantitative analysis was performed, whereby shape metrics of 432 derived ponds were compared to manually digitized pond objects, the results of which are illustrated in Figure 7. The comparison of shape attributes for manually and automatically derived objects resulted in R2 values of 0.99 for area and 0.95 for the perimeter of the ponds. On average, the individual polygon area of extracted ponds was a bit smaller, comprising about 88% of the ponds’ original size (see also Figure 6), which can be attributed to a conservative definition of the Euclidian intensity pixel distance criterion in the segmentation process. The average perimeter of extracted ponds, however, was about 30% larger than that of the digitized ponds. This difference can be explained by the more fragmented outlines of the extracted ponds from the 10-m Sentinel-1 data, compared to those of the digitized ponds based on very-high-resolution (VHR) imagery (see also Figure 6), which generally consisted of straight lines connecting vertices located in the ponds’ corners.
5.2. Spatial Patterns of Aquaculture in India’s Coastal Zone
5.2.1. Province/District-Wise Distribution of Aquaculture Ponds
The areal proportion of aquaculture at the district level for all coastal districts in India is shown in Figure 8 and the comparison of the aquaculture area with shrimp production data at the province level for the year 2015–2016 from MPEDA is shown in Figure 9. The state-wise comparison of shrimp production and detected aquaculture area generally revealed corresponding trends, with an R2 of 0.75. As can be seen, states with large areal coverage of detected aquaculture also showed high levels of shrimp production from official statistics. Only the provinces Tamil Nadu and Gujarat showed rather low production rates compared to the detected area of aquaculture.
It is also evident that there are major differences between the individual Indian states with regards to aquaculture area and production, both in terms of current statistics and in terms of traditions and development [38]. Andhra Pradesh, for example, became the main producer of brackish water shrimps as a result of economic reforms, and holds, with about 35% (1108 km2) of total aquaculture area in India, by far the largest share of ponds in the country. As far as the district level is concerned, the Krishna (347 km2) and West Godavari (283 km2) districts of Andhra Pradesh province are dominant in aquaculture production.
5.2.2. Distribution Profile along the Coast
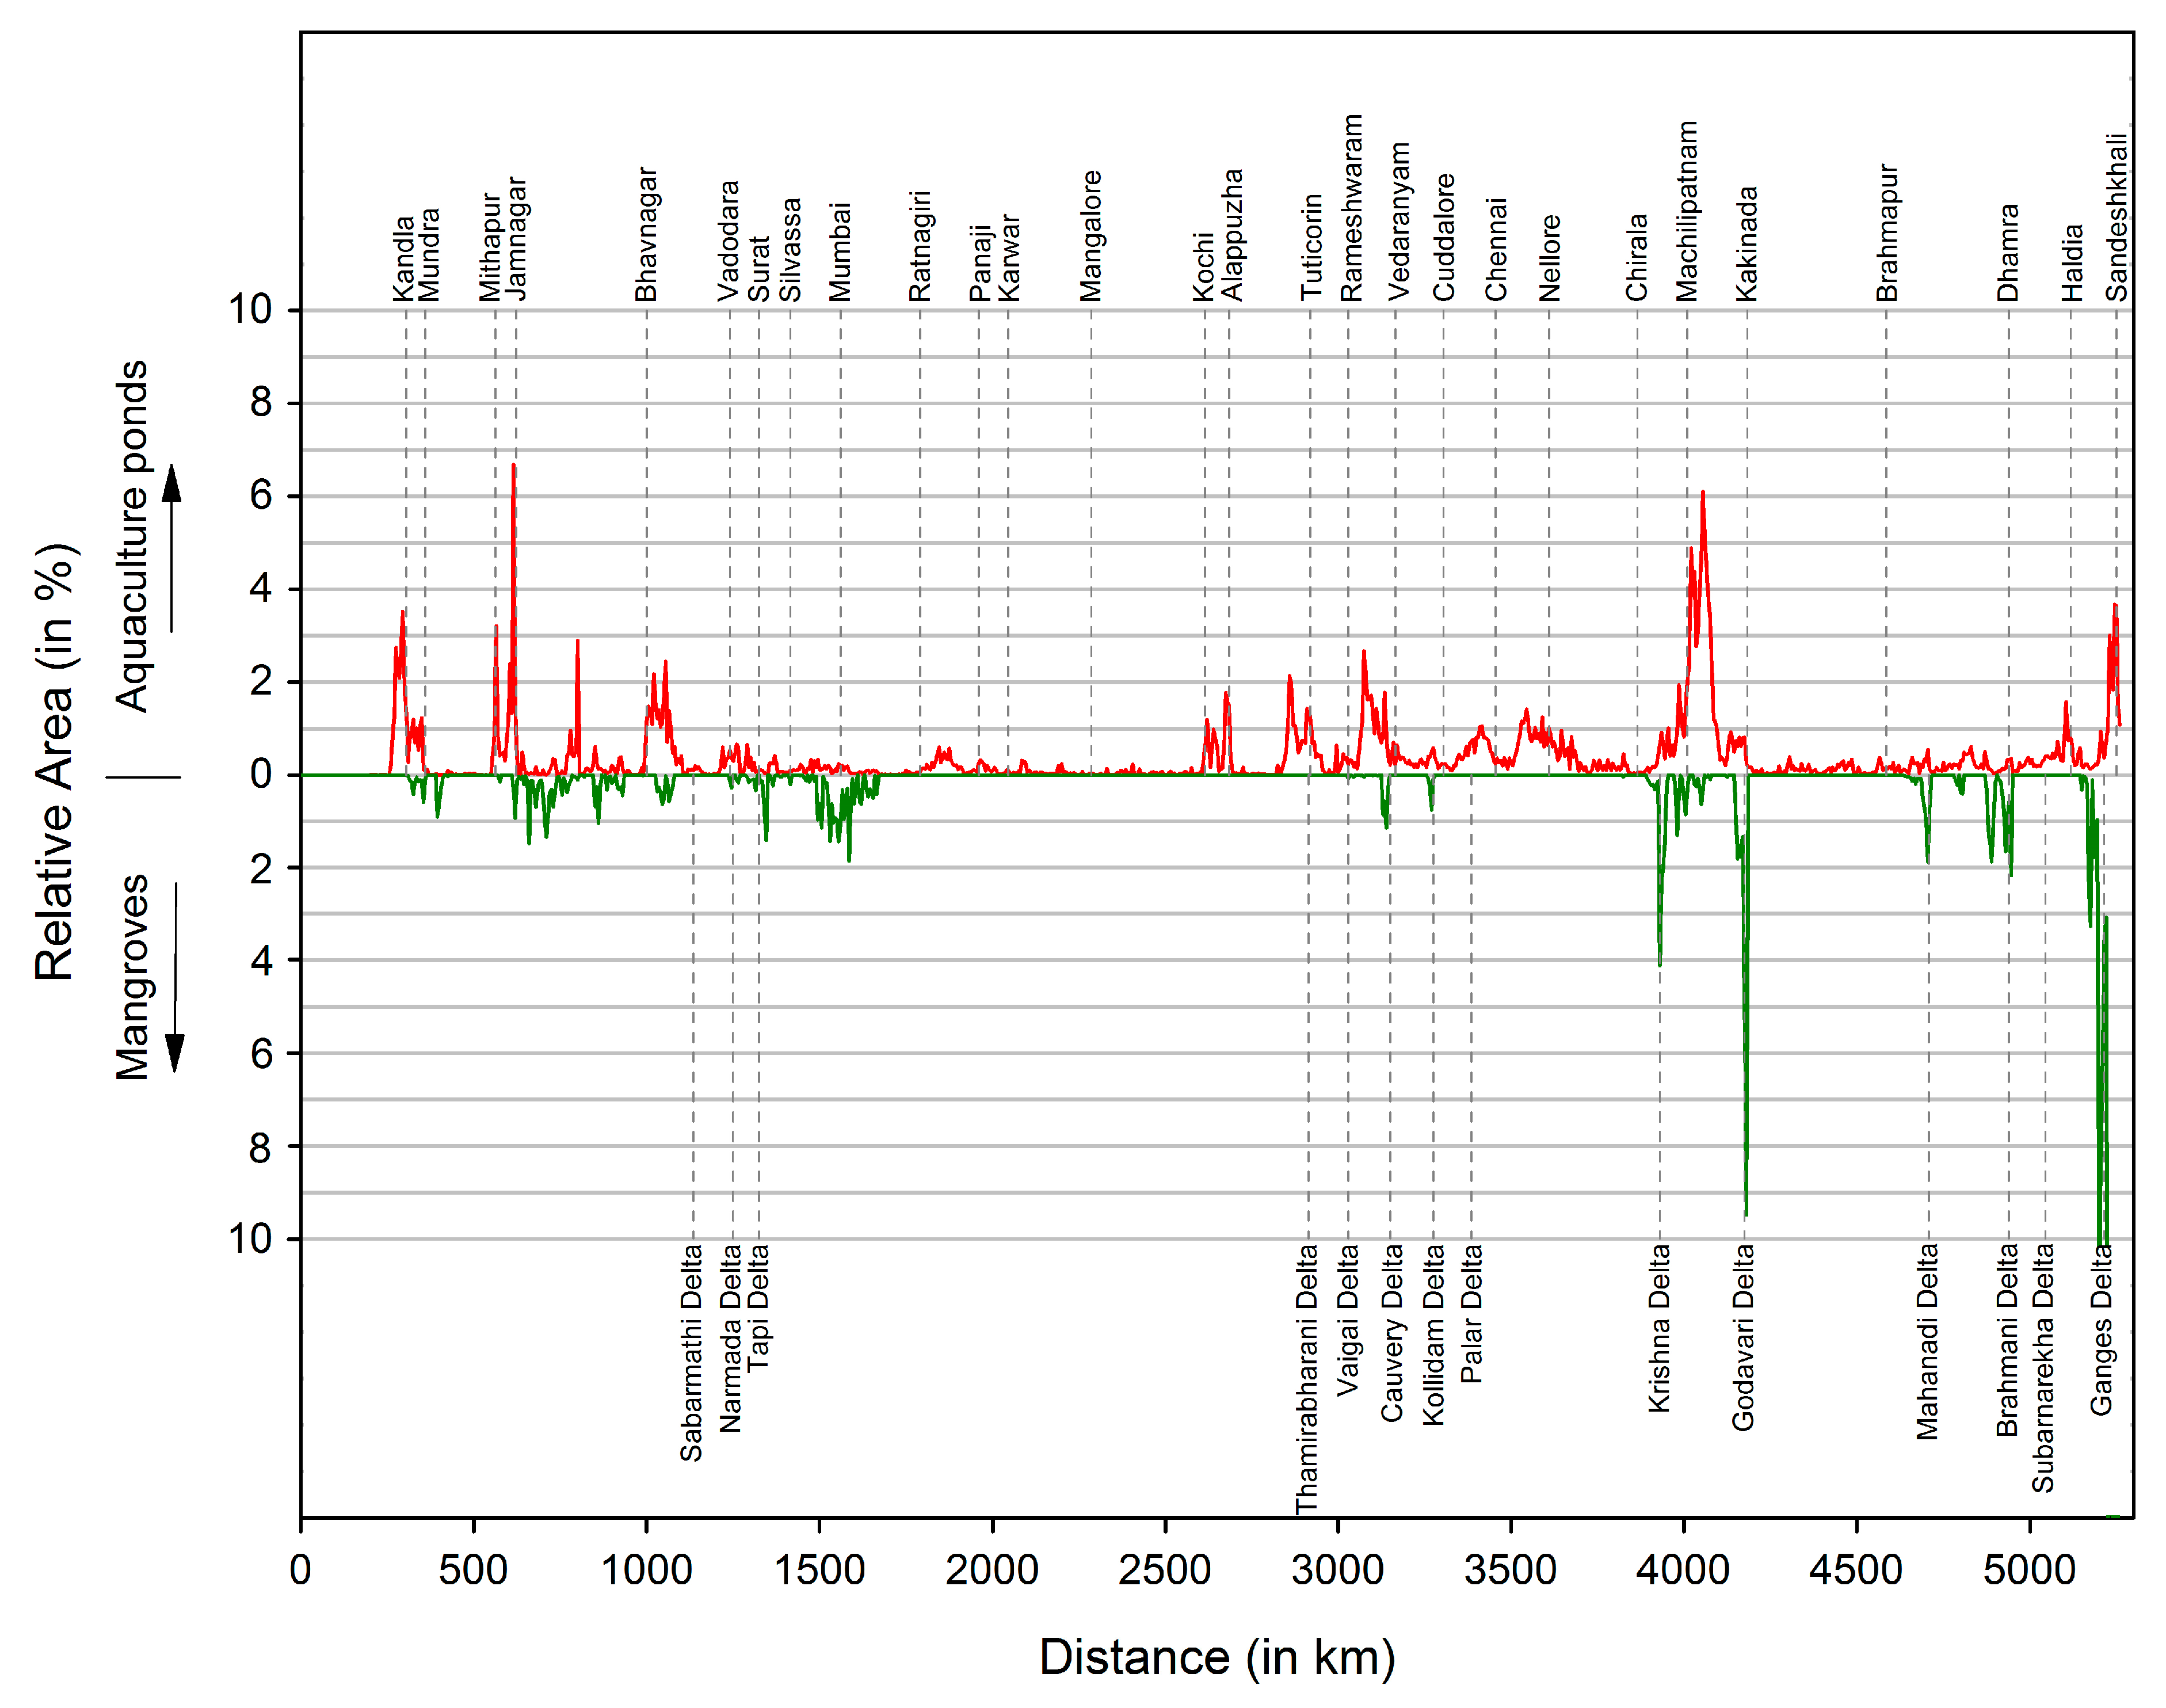
The spatial distribution and concentration of aquaculture and mangroves along the Indian coast was calculated at 5-km intervals along the coastline. The spatial distribution profile of the abundance of aquaculture ponds is shown in Figure 10. The locations of major river deltas and urban centers were identified and are shown in the profile to understand the relationship between their location and aquaculture development. Please refer to Figure 1 and Figure 8 for the location of major river deltas and major urban centers.
From Figure 10, it was understood that, in India, aquaculture is a land-use type typically occurring in concentrated hotspots rather than as a continuous area-wide phenomenon. Furthermore, it is evident that the east coast of India shows a far higher concentration of aquaculture ponds than the west coast. In 2000, Reference [4] identified that India had 1.4 million ha of brackish water area available for coastal aquaculture, in which the eastern provinces, such as West Bengal (48%) and Andhra Pradesh (18%) were expected to develop brackish water aquaculture at a larger scale. Another reason for this might also be the physical conditions. The eastern coastal plain is much broader than the rather narrow western coastal plain, having many lagoons and large rivers emptying into the sea in wide deltas. Some other deltaic regions which show considerable aquaculture concentrations are the Tapi delta, the Cauvery–Kollidam delta, the Mahanadi delta, and the Brahmani delta. Conversely, the Gulf of Kutch in Gujarat is the only major coastal aquaculture region at the western coast and is mainly concentrated with nearby mangrove forests and estuarine regions. Among urban centers, Machilipatnam and Kakinada, located in the Krishna–Godavari delta belt, have the highest distribution of shrimp ponds. Other important urban centers such as Kandla, Mithapur, Bhavnagar, Alappuzha, Vedaranyam, and Sandeshkhali are located near areas having a significant concentration of shrimp aquaculture.
6. Discussion
The present study focused on the mapping of land-based aquaculture in the entire coastal zone of India. We applied the mapping approach developed by Reference [1] with region-specific thresholds, and successfully demonstrated the transferability of this approach to other regions. The objective of our study was the large-scale estimation of aquaculture at the pond level through contemporary SAR time series. With this study, we provide the first high-resolution aquaculture layer at the subcontinental scale.
Although the approach shows satisfactory results with accuracies beyond 80%, there are still more prospects in this research to improve the quality of mapping by minimizing misclassification with other features. Based on the freely available Sentinel-1 SAR data at 10-m spatial resolution, we were able to identify a large number of individual ponds and dikes. The approach worked particularly well in the coastal provinces where shrimp cultivation is practiced at the industrial level in very large ponds, such as in Andhra Pradesh and Kerala. The tendency toward slightly larger ponds can also be observed from the shape statistics in Figure 4. In provinces such as in West Bengal, Maharashtra, or Orissa, a large portion of ponds are owned by small-scale farmers with considerably smaller pond sizes. In such cases the spatial resolution of 10 m is often too coarse for deriving meaningful objects at the pond level, which is the reason why, in some cases, a whole block of ponds was identified as a single object, or the approach failed to identify smaller ponds at all (see also Figure 11a,c). In these cases, very-high-resolution data from SAR (e.g., TerraSAR Spotlight) or optical sensors (e.g., Worldview-2) would be able to extract ponds, as demonstrated by Reference [12].
The large deviations in production statistics and aquaculture area estimates for the two provinces of Gujarat and Tamil might be attributed to several factors. Aquaculture production within these states might focus on other products than shrimp, or these ponds produce at relatively low intensity. This is definitely the case for Gujarat with an average productivity of only 236 kg per ha compared to country’s average of 792 kg per ha [34,39]. Further uncertainty is introduced due to the fact that, in India, traditional aquaculture systems in coastal regions alternate between rice cultivation and shrimp breeding, as still practiced by many farmers today, especially in the states of Kerala, West Bengal, Karnataka, and Goa. India has over 2.3 million ha of deep-water rice plots, where shrimp larvae are washed into the rice fields by coastal waters where they grow and are finally harvested [39]. Since the persistence of inundation throughout the year is a main feature in the applied approach to differentiate aquaculture from rice fields, those aquaculture systems were not identified here.
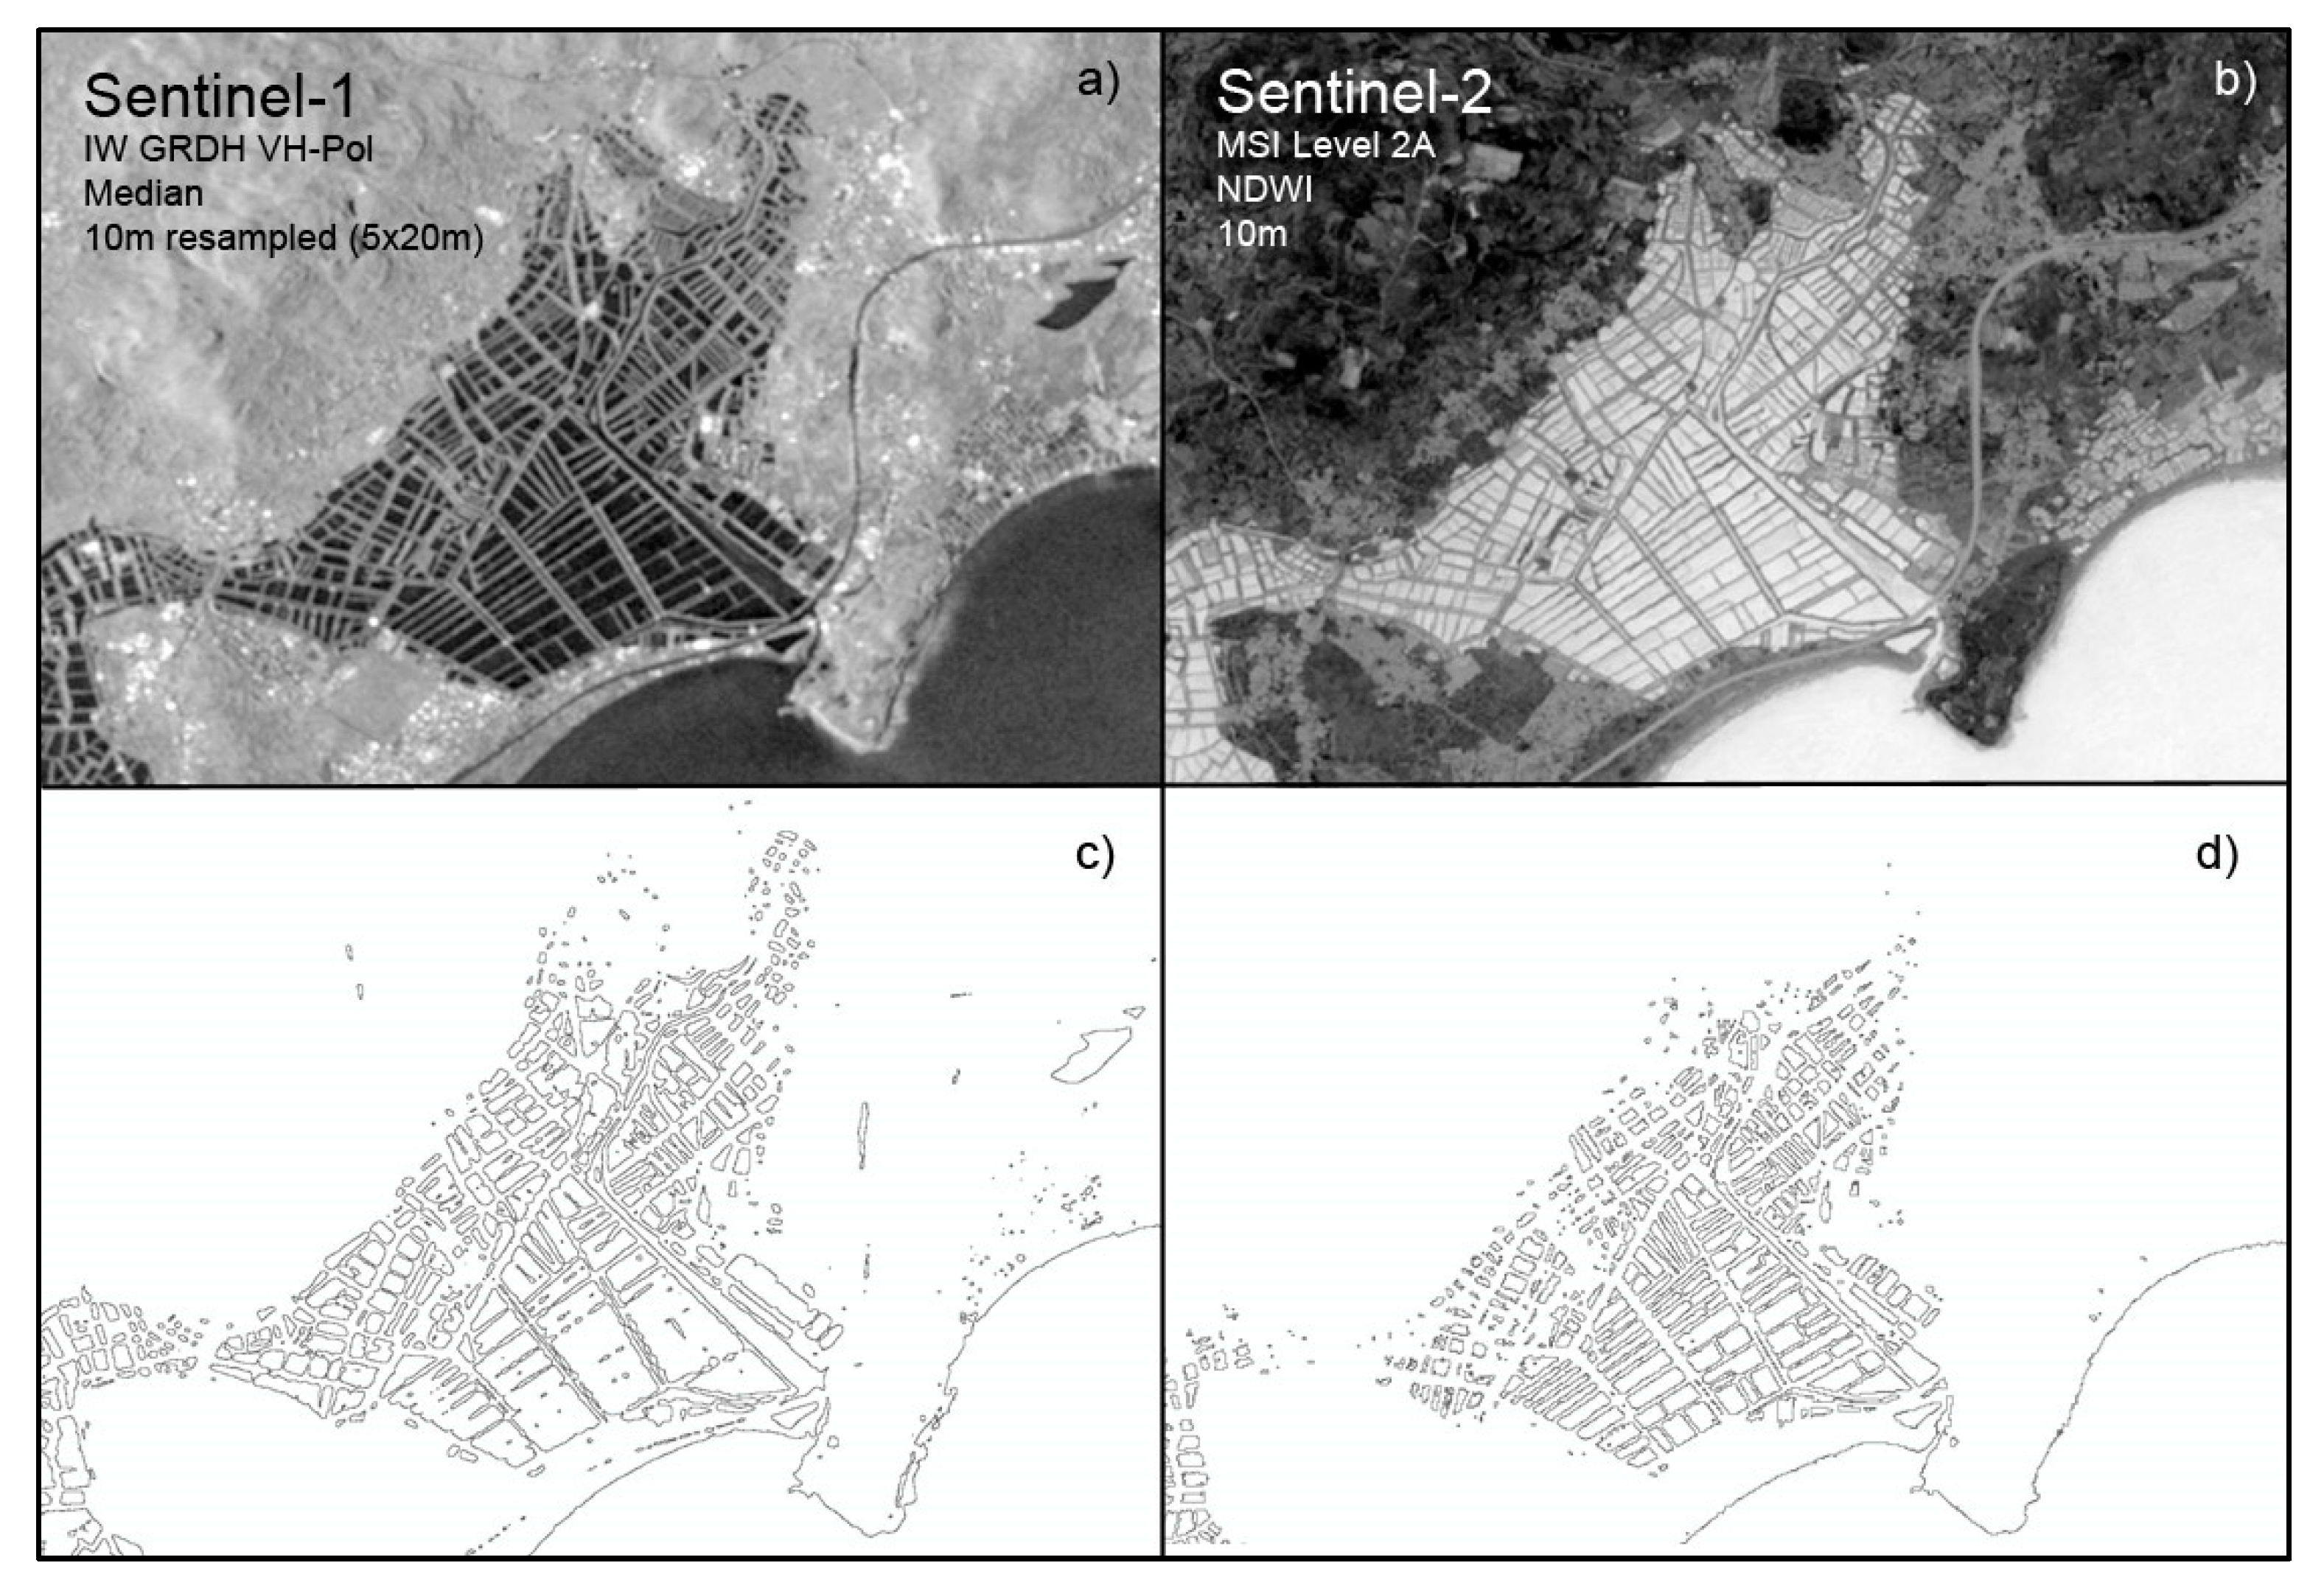
However, with all the advantages of SAR data in cloud-prone regions such as tropical and subtropical costal zones, there are also some limitations related to the application of radar data. In fact, radar data only measure the surface roughness without consideration of spectral properties, which poses some challenges. As can be seen from Figure 11a,c, flat surfaces such as salt panes, roads, or abandoned fields or ponds resulted in the same dark surfaces as water ponds. In view of this, the combination of optical and SAR data, such as combining Sentinel-1 SAR data with high-resolution Sentinel-2 satellite data is ideal to improve the accuracy of the aquaculture mapping results. The additional multispectral information from Sentinel-2 can help to exclude false positives such as salt pans, flat areas of bare soil, backscatter shadows, etc., by incorporating the spectral reflectance characteristics of water bodies. Also, the real 10-m spatial resolution of Sentinel-2 would be an improvement against the native 5 × 20 m spatial resolution, particularly when the number of available Sentinel-1 scenes is so low that the quality of the resulting median backscatter image becomes deteriorated.
Further research, therefore, will focus on the combination of SAR and multispectral information for aquaculture extraction. Furthermore, given the fact that aquaculture rapidly increased, particularly since the 1980s, spatio-temporal information on the historic aquaculture development within coastal zones can be regarded as highly valuable information for coastal managers. To identify trends of aquaculture development, time series assessments of long-term observation periods are needed. In view of this, we are also currently evaluating the potential of the Landsat program with more than three decades of satellite data in combination with high-spatial-resolution Sentinel-1 data to go back in time to assess the status of ponds identified with Sentinel-1.
7. Conclusions
In this study, we extracted land-based aquaculture at the pond level and performed detailed analysis on the underlying spatial patterns at the macroscale for the entire coastal zone of India. The approach originally developed by Reference [1] was, for the first time, applied and tested at the subcontinental scale spanning an area of more than one million km2. We processed nearly 3000 Sentinel-1 scenes of 3 TB in size, and successfully demonstrated the spatial transferability and scaling-up of this approach. The resulting aquaculture layer for India is the first large-scale aquaculture product of its kind, allowing for homogeneous and comparable information on the spatial manifestation of India’s land-based aquaculture sector.
The approach gave satisfying results with an overall accuracy of 89%, with a few quality issues related to either missing out on or aggregating small-sized tightly packed pond structures. Another issue was the confusion of aquaculture with inundated rice paddies or other flat features such as salt pans, which is one of the main sources of uncertainty to the approach in agricultural dominated coastal areas in Asia. Despite these limitations, the results presented are convincing, and the method proved its capability for application at the subcontinental level, which can be considered as a positive test for a global-scale application.
Although aquaculture is produced in all nine coastal provinces of the country, aquaculture is not distributed evenly throughout the coastal zones; rather, it is concentrated in a couple of distinct hotspot zones, with most of them found along the eastern coast of the country. Andhra Pradesh holds a major share of coastal aquaculture in India. Particularly in the Krishna–Godavari delta belt and the Gangetic delta in West Bengal, vast areas of highly concentrated aquaculture ponds could be identified.
In view of the rapid development of the global aquaculture sector, with all its positive and negative effects on prevailing socio-ecological systems, the demonstrated low-cost approach based on open-source data is of high relevance to all aspects, i.e., planning, decision-making, management, and monitoring, of an integrated and sustainable management of the coastal zone.
Author Contributions
Conceptualization, P.L.; methodology, K.A.P. and M.O.; supervision, M.O. and P.L.; validation, K.A.P.; visualization, K.A.P. and C.W.; writing—original draft, K.A.P.; writing—review and editing, M.O. and P.L.
Funding
The work was supported by the International Climate Protection Fellowship of the Alexander von Humboldt-Stiftung with funds from the International Climate Initiative (IKI) by the Federal Ministry of the Environment, Nature Conservation, and Nuclear Safety (BMUB).
Acknowledgments
The authors would like to thank the European Space Agency Copernicus Program for free access to Sentinel-1 SAR data, USGS for providing SRTM DEM data and global mangrove distribution data, IGSNRR for updated coastline data, Datameet.org for India district data, and CNES for providing the OTB CCS algorithm.
Conflicts of Interest
The authors declare no conflict of interest. The funders had no role in the design of the study; in the collection, analyses, or interpretation of data; in the writing of the manuscript, and in the decision to publish the results.
References
- Ottinger, M.; Clauss, K.; Kuenzer, C. Large-Scale Assessment of Coastal Aquaculture Ponds with Sentinel-1 Time Series Data. Remote Sens. 2017, 9, 440. [Google Scholar] [CrossRef]
- Kobayashi, M.; Msangi, S.; Batka, M.; Vannuccini, S.; Dey, M.M.; Anderson, J.L. Fish to 2030: The Role and Opportunity for Aquaculture. Aquac. Econ. Manag. 2015, 19, 282–300. [Google Scholar] [CrossRef]
- Venkataraman, K. Coastal and Marine Wetlands in India. Available online: https://www.researchgate.net/profile/Krishnamoorthy_Venkataraman/publication/303757779_Coastal_and_Marine_Wetlands_in_India/links/57510b5208ae1f765f946684.pdf (accessed on 2 February 2019).
- Gopakumar, K. Indian Aquaculture. J. Appl. Aquac. 2003, 13, 1–10. [Google Scholar] [CrossRef]
- Murthy, T.V.R.; Patel, J.G.; Panigrahy, S.; Parihar, J.S. National Wetland Atlas: Wetlands of International Importance Under Ramsar Convention; Murthy, T.V.R., Patel, J.G., Panigrahy, S., Parihar, J.S., Eds.; Space Application Centre (ISRO): Ahmedabad, India, 2013.
- Primavera, J.H. Global Voices of Science: Mangroves, Fishponds, and the Quest for Sustainability. Science 2005, 310, 57–59. [Google Scholar] [CrossRef] [PubMed]
- Alejandro, C.; Hernandez-Guzma, R.; Ruiz-Luna, A. Impact of Shrimp Farming on Mangrove Forest and Other Coastal Wetlands: The Case of Mexico. Aquac. Environ. 2011. [Google Scholar] [CrossRef] [Green Version]
- Ramasubramanian, R.; Gnanappazham, L.; Ravishankar, T.; Navamuniyammal, M. Mangroves of Godavari—Analysis Through Remote Sensing Approach. Wetland. Ecol. Manag. 2006, 14, 29–37. [Google Scholar] [CrossRef]
- Chaudhuri, P.; Ghosh, S.; Bakshi, M.; Bhattacharyya, S.; Nath, B. A Review of Threats and Vulnerabilities to Mangrove Habitats: With Special Emphasis on East Coast of India. J. Earth Sci. Climat. Chang. 2015. [Google Scholar] [CrossRef]
- Krishnan, M.; Birthal, P.S. Aquaculture development in India: An economic overview with special reference to coastal aquaculture. Aquac. Econ. Manag. 2002, 6, 81–96. [Google Scholar] [CrossRef]
- The State of World Fisheries and Aquaculture 2016. Available online: https://www.un-ilibrary.org/agriculture-rural-development-and-forestry/the-state-of-world-fisheries-and-aquaculture-2016_8e4e0ebf-en (accessed on 3 February 2019).
- Ottinger, M.; Clauss, K.; Kuenzer, C. Aquaculture: Relevance, distribution, impacts and spatial assessments—A review. Ocean Coast. Manag. 2016, 119, 244–266. [Google Scholar] [CrossRef]
- Sridhar, P.N.; Surendran, A.; Ramana, I.V. Auto-extraction technique-based digital classification of saltpans and aquaculture plots using satellite data. Int. J. Remote Sens. 2008, 29, 313–323. [Google Scholar] [CrossRef]
- Hazarika, M.K.; Samarakoon, L.; Honda, K.; Thanwa, J.; Pongthanapanich, T.; Boonsong, K.; Luang, K. Monitoring and Impact Assessment of Shrimp Farming in the East Coast of Thailand Using Remote Sensing and GIS. Archives 2000, XXXIII, 504–510. [Google Scholar]
- Disperati, L.; Virdis, S.G.P. Assessment of land-use and land-cover changes from 1965 to 2014 in Tam Giang-Cau Hai Lagoon, central Vietnam. Appl. Geogr. 2015, 58, 48–64. [Google Scholar] [CrossRef]
- Tsai, B.-W.; Chang, K.-T.; Chang, C.-Y.; Chu, C.-M. Analyzing Spatial and Temporal Changes of Aquaculture in Yunlin County, Taiwan. Prof. Geogr. 2006, 58, 161–171. [Google Scholar]
- Sudarshana, R.; Bhan, S.K.; Siddiqui, M.S.; Vohra, T.P.S.; Prasad, P.N.; Bhat, U.G.; Neelakantan, B. Experiments in site selection for coastal aquaculture using Indian remote sensing satellite: IRS-1A. Int. J. Remote Sens. 1993, 14, 2275–2284. [Google Scholar] [CrossRef]
- Nagabhatla, N.; Pattnaik, C.; Sellamuttu, S.S.; Prasad, S.N.; Wickramasuriya, R.; Finlayson, C. Investigation of aquaculture dynamics at a Ramsar site, using earth observation systems in conjunction with a socio-economic assessment. Lakes Reserv. Res. Manag. 2009, 14, 325–336. [Google Scholar] [CrossRef]
- Jayanthi, M.; Rekha, P.N.; Kavitha, N.; Ravichandran, P. Assessment of impact of aquaculture on Kolleru Lake (India) using remote sensing and Geographical Information System. Aquac. Res. 2006, 3.7, 1617–1626. [Google Scholar] [CrossRef]
- Dwivedi, R.S.; Kandrika, S. Delineation and monitoring of aquaculture areas using multi-temporal space-borne multispectral data. Curr. Sci. 2005, 9, 1414–1421. [Google Scholar]
- Rajitha, K.; Mukherjee, C.K.; Chandran, R.V.; Mohan, M.M.P. Land-cover change dynamics and coastal aquaculture development: A case study in the East Godavari delta, Andhra Pradesh, India using multi-temporal satellite data. Int. J. Remote Sens. 2010, 3.1, 4423–4442. [Google Scholar] [CrossRef]
- Zhang, T.; Yang, X.; Hu, S.; Su, F. Extraction of Coastline in Aquaculture Coast from Multispectral Remote Sensing Images: Object-Based Region Growing Integrating Edge Detection. Remote Sens. 2013, 5, 4470–4487. [Google Scholar] [CrossRef] [Green Version]
- Virdis, S.G.P. An object-based image analysis approach for aquaculture ponds precise mapping and monitoring: A case study of Tam Giang-Cau Hai Lagoon, Vietnam. Environ. Monit. Assess. 2013, 186, 117–133. [Google Scholar] [CrossRef]
- Kuenzer, C.; Guo, H.; Schlegel, I.; Tuan, V.Q.; Li, X.; Dech, S. Varying Scale and Capability of Envisat ASAR-WSM, TerraSAR-X Scansar and TerraSAR-X Stripmap Data to Assess Urban Flood Situations: A Case Study of the Mekong Delta in Can Tho Province. Remote Sens. 2013, 5, 5122–5142. [Google Scholar] [CrossRef] [Green Version]
- Manavalan, R.; Rao, Y.S.; Mohan, B.K. Comparative flood area analysis of C-band VH, VV, and L-band HH polarizations SAR data. Int. J. Remote Sens. 2017, 38, 4645–4654. [Google Scholar] [CrossRef]
- Dwivedi, R.S.; Rao, B.R.M.; Bhattacharya, S. Mapping wetlands of the Sundaban Delta and it’s environs using ERS-1 SAR data. Int. J. Remote Sens. 2010, 20, 2235–2247. [Google Scholar] [CrossRef]
- Greidanus, H.; Santamaria, C. First Analyses of Sentinel-1 Images for Maritime Surveillance. Luxembourg, 2014. Available online: https://core.ac.uk/download/pdf/38629108.pdf (accessed on 7 February 2019).
- Marini, Y.; Emiyati; Prayogo, T.; Hamzah, R.; Hasyim, B. Fishpond Aqiuaculture Inventory in Maros Regency of South Sulawesi Province. Int. J. Remote Sens. Earth Sci. 2013, 10, 25–35. [Google Scholar]
- Travaglia, C.; Profeti, G.; Aguilar-Manjarrez, J.; Lopez, N.A. Mapping Coastal Aquaculture and Fisheries Structures by Satellite Imaging Radar: Case Study of the Lingayen Gulf, the Philippines; FAO: Rome, Italy, 2004. [Google Scholar]
- de Jong, J. Aquaculture in India, Rijksdienst voor Ondernemend Nederland (RVO.nl). Netherlands, 2017. Available online: https://www.rvo.nl/sites/default/files/2017/04/aquaculture-in-india-report-2017.pdf (accessed on 7 February 2019).
- Manoj, V.R.; Vasudevan, N. Functional options for sustainable shrimp aquaculture in India. Rev. Fish. Sci. 2009, 17, 336–347. [Google Scholar] [CrossRef]
- Panigrahy, S.; Murthy, T.V.R.; Patel, J.G.; Singh, T.S. National Wetland Atlas; Space Application Centre (ISRO): Ahmedabad, India, 2011.
- Bassi, N.; Kumar, M.D.; Sharma, A.; Pardha-Saradhi, P. Status of wetlands in India: A review of extent, ecosystem benefits, threats and management strategies. J. Hyd. Reg. Stud. 2014, 2, 1–19. [Google Scholar] [CrossRef] [Green Version]
- Mpeda.gov.in. The Marine Products Exports Development Authority (MPEDA). 2019. Available online: http://mpeda.gov.in/MPEDA/cms.php?id=YXJlYS11bmRlci1jdWx0dXJl# (accessed on 24 January 2019).
- Giri, C.; Ochieng, E.; Tieszen, L.L.; Zhu, Z.; Singh, A.; Loveland, T.; Mašek, J.; Duke, N. Status and distribution of mangrove forests of the world using earth observation satellite data. Glob. Ecol. Biogeog. 2010, 20, 154–159. [Google Scholar] [CrossRef]
- OTB Team OTB CookBook Documentation. 2016. Available online: https://www.orfeo-toolbox.org/packages/OTBCookBook.pdf (accessed on 17 September 2018).
- Klein, I.; Dietz, A.; Gessner, U.; Dech, S.; Kuenzer, C. Results of the Global WaterPack: A novel product to assess inland water body dynamics on a daily basis. Remote Sens. Lett. 2015, 6, 78–87. [Google Scholar] [CrossRef]
- Sinha, M. Inland fisheries development achievements and Destination for Twenty-first century. In National Seminar on Eco-Friendly Management of Resources for Doubling Fish Production Strategies for 21 Century; CICFRI: Barrackpore, Kolkata West Bengal, India, 1999; pp. 25–35. [Google Scholar]
- Henn, H. Entwicklungspolitische Bewertung der Blauen Revolution: Wirkungen der Aquakultur in Indien. Ph.D. Thesis, Freie Universität Berlin, Berlin, Germany, 2002. [Google Scholar]
Figure 1.
India with the study area shown (200-km buffer zone inland from the actual coastline). Major rivers, provincial boundaries, and major urban centers along coastal India are indicated in the figure.
Figure 1.
India with the study area shown (200-km buffer zone inland from the actual coastline). Major rivers, provincial boundaries, and major urban centers along coastal India are indicated in the figure.

Figure 2.
Coverage of VH Sentinel-1 time series data over the study area for the period of September 2014 to June 2017 in descending mode.
Figure 2.
Coverage of VH Sentinel-1 time series data over the study area for the period of September 2014 to June 2017 in descending mode.

Figure 3.
Workflow for aquaculture extraction, adapted from Reference [1].
Figure 3.
Workflow for aquaculture extraction, adapted from Reference [1].

Figure 4.
Box plots showing shape metrics calculated for the aquaculture pond samples from nine state provinces (Andhra Pradesh—AP; Goa—GO; Gujarat—GJ; Karnataka—KA; Kerala—KL; Maharashtra—MH; Orissa—OR; Tamil Nadu—TN; West Bengal—WB; India Coast—IN).
Figure 4.
Box plots showing shape metrics calculated for the aquaculture pond samples from nine state provinces (Andhra Pradesh—AP; Goa—GO; Gujarat—GJ; Karnataka—KA; Kerala—KL; Maharashtra—MH; Orissa—OR; Tamil Nadu—TN; West Bengal—WB; India Coast—IN).

Figure 5.
Temporal median backscatter images derived from the Sentinel-1 interferometric wide-swath (IW) ground range detected high-resolution (GRDH) data overlaid with extracted aquaculture, using the connected component segmentation method; (1) Kutch, Gujarat; (2) Kambay, Gujarat; (3) Vedaranyam, Tamil Nadu; (4) Eluru, Andhra Pradesh; (5) Gangetic Delta, West Bengal.

Figure 6.
Extracted ponds at local scale compared to real pond structure as observed from very-high-resolution (VHR) Pleiades imagery for a spatial subset in Eluru, Andhra Pradesh.
Figure 6.
Extracted ponds at local scale compared to real pond structure as observed from very-high-resolution (VHR) Pleiades imagery for a spatial subset in Eluru, Andhra Pradesh.

Figure 7.
Area and perimeter of automatically extracted ponds compared to manually digitized reference ponds.
Figure 7.
Area and perimeter of automatically extracted ponds compared to manually digitized reference ponds.

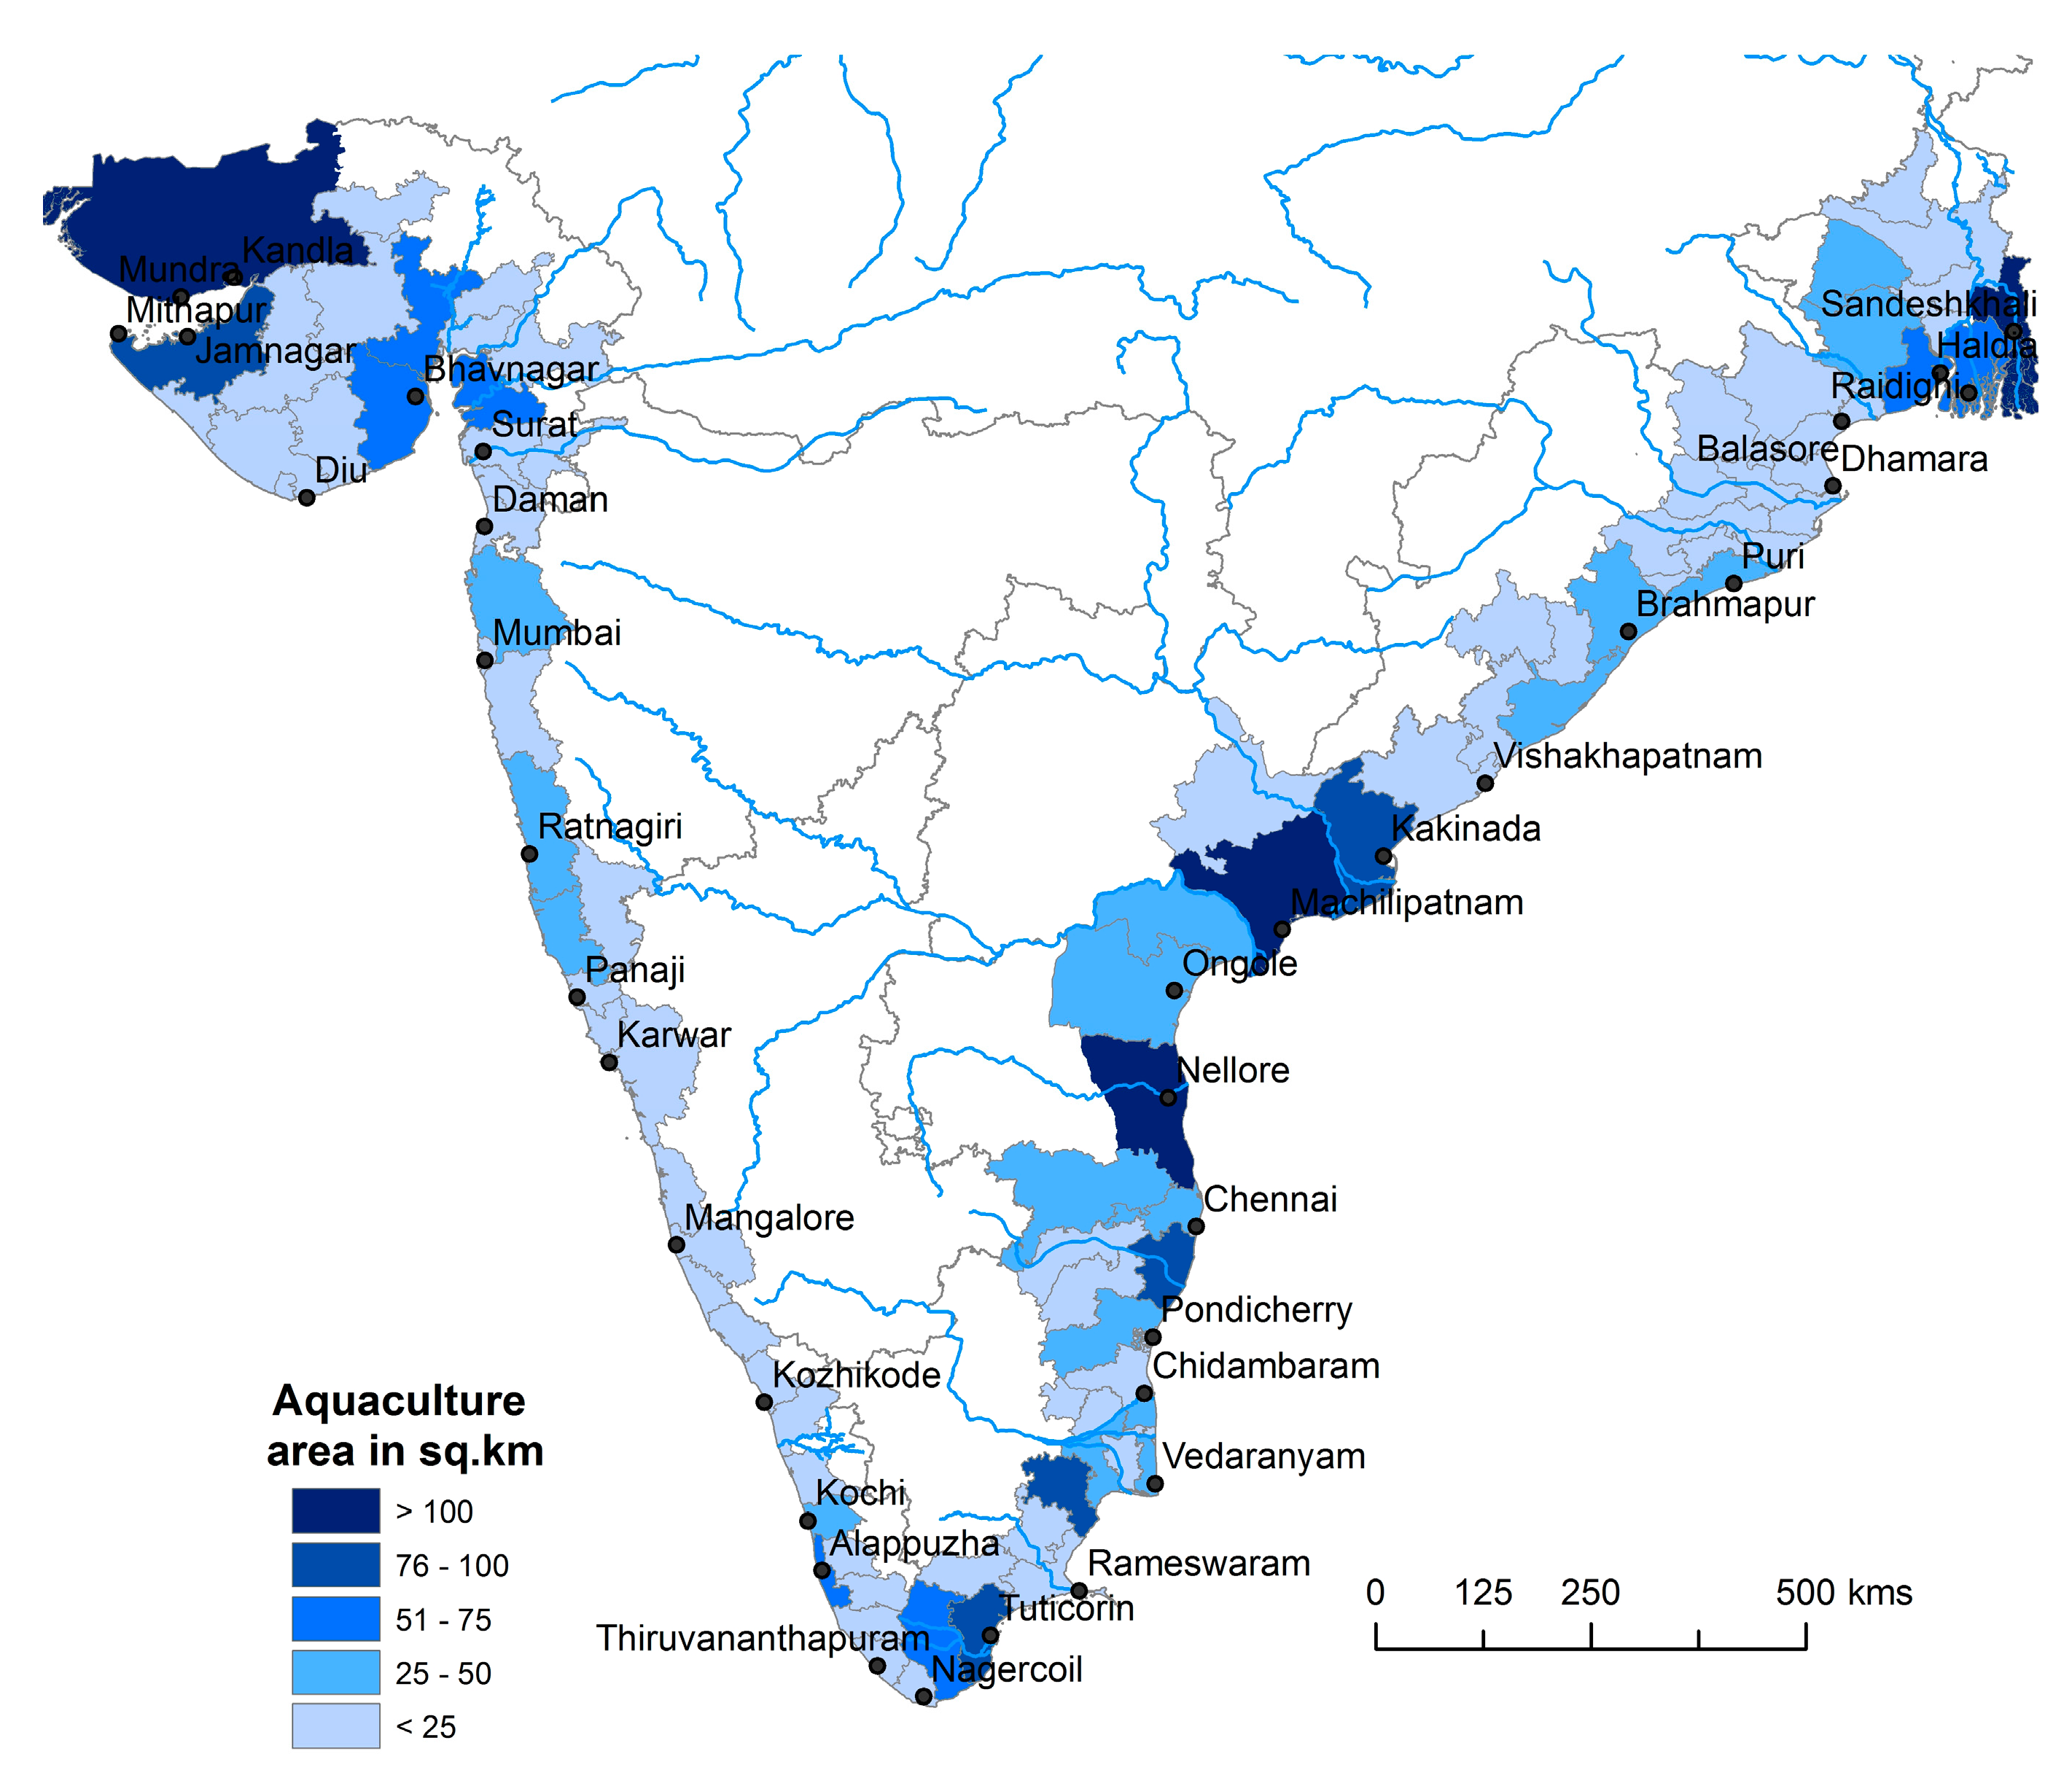
Figure 8.
District-wise spatial distribution of aquaculture ponds along the districts on the Indian coast.
Figure 8.
District-wise spatial distribution of aquaculture ponds along the districts on the Indian coast.

Figure 9.
Province-wise aquaculture pond area calculated from the results of segmentation analysis. Shrimp production (in tons) data for the year 2015–2016 provided by the Marine Products Export Development Authority (MPEDA) are overlaid in the graph.
Figure 9.
Province-wise aquaculture pond area calculated from the results of segmentation analysis. Shrimp production (in tons) data for the year 2015–2016 provided by the Marine Products Export Development Authority (MPEDA) are overlaid in the graph.

Figure 10.
Spatial profile of aquaculture pond distribution along the Indian coast from west to east starting from Gujarat to West Bengal at 5-km intervals.
Figure 10.
Spatial profile of aquaculture pond distribution along the Indian coast from west to east starting from Gujarat to West Bengal at 5-km intervals.

Figure 11.
Aquaculture structures as observed from a median backscatter metric derived from a Sentinel-1 time series (a), and from a normalized difference water index (NDWI) layer derived from a multispectral Sentinel-2 scene (b). Aquaculture objects derived from median backscatter (c), and from a Sentinel-2 NDWI layer (d).


Table 1.
Validation of the accuracy for the two classes obtained using the stratified random sampling method for the study area, India coast.
Table 1.
Validation of the accuracy for the two classes obtained using the stratified random sampling method for the study area, India coast.
| Non-Aquaculture | Aquaculture | Producer Accuracy | |
|---|---|---|---|
| Non-Aquaculture | 978 | 22 | 97.8 |
| Aquaculture | 186 | 814 | 81.4 |
| User Accuracy | 84.02 | 97.36 | 89.6 |
© 2019 by the authors. Licensee MDPI, Basel, Switzerland. This article is an open access article distributed under the terms and conditions of the Creative Commons Attribution (CC BY) license (http://creativecommons.org/licenses/by/4.0/).
Share and Cite
MDPI and ACS Style
Prasad, K.A.; Ottinger, M.; Wei, C.; Leinenkugel, P. Assessment of Coastal Aquaculture for India from Sentinel-1 SAR Time Series. Remote Sens. 2019, 11, 357. https://0-doi-org.brum.beds.ac.uk/10.3390/rs11030357
AMA Style
Prasad KA, Ottinger M, Wei C, Leinenkugel P. Assessment of Coastal Aquaculture for India from Sentinel-1 SAR Time Series. Remote Sensing. 2019; 11(3):357. https://0-doi-org.brum.beds.ac.uk/10.3390/rs11030357
Chicago/Turabian StylePrasad, Kumar Arun, Marco Ottinger, Chunzhu Wei, and Patrick Leinenkugel. 2019. "Assessment of Coastal Aquaculture for India from Sentinel-1 SAR Time Series" Remote Sensing 11, no. 3: 357. https://0-doi-org.brum.beds.ac.uk/10.3390/rs11030357
Note that from the first issue of 2016, this journal uses article numbers instead of page numbers. See further details here.