Article

Satellite Soil Moisture for Agricultural Drought Monitoring: Assessment of SMAP-Derived Soil Water Deficit Index in Xiang River Basin, China

1
School of Civil Engineering, Southeast University, Nanjing 211189, China
2
Institute of Hydrology and Water Resources, College of Civil Engineering and Architecture, Zhejiang University, Hangzhou 310058, China
3
Hydrology and Water Resources Department, Nanjing University of Information Science & Technology, Nanjing 210044, China
4
School of Civil Engineering and Environmental Science, University of Oklahoma, Norman, OK 73019-1024, USA
*
Authors to whom correspondence should be addressed.
Submission received: 29 December 2018 / Revised: 6 February 2019 / Accepted: 9 February 2019 / Published: 11 February 2019
(This article belongs to the Special Issue Microwave Remote Sensing for Hydrology)

Abstract

:
Agricultural drought can have long-lasting and harmful impacts on both the ecosystem and economy. Therefore, it is important to monitor and predict agricultural drought accurately. Soil moisture is the key variable to define the agricultural drought index. However, in situ soil moisture observations are inaccessible in many areas of the world. Remote sensing techniques enrich the surface soil moisture observations at different tempo-spatial resolutions. In this study, the Level 2 L-band radiometer soil moisture dataset was used to estimate the Soil Water Deficit Index (SWDI). The Soil Moisture Active Passive (SMAP) dataset was evaluated with the soil moisture dataset obtained from the China Land Soil Moisture Data Assimilation System (CLSMDAS). The SMAP-derived SWDI (SMAP_SWDI) was compared with the atmospheric water deficit (AWD) calculated with precipitation and evapotranspiration from meteorological stations. Drought monitoring and comparison were accomplished at a weekly scale for the growing season (April to November) from 2015 to 2017. The results were as follows: (1) in terms of Pearson correlation coefficients (R-value) between SMAP and CLSMDAS, around 70% performed well and only 10% performed poorly at the grid scale, and the R-value was 0.62 for the whole basin; (2) severe droughts mainly occurred from mid-June to the end of September from 2015 to 2017; (3) severe droughts were detected in the southern and northeastern Xiang River Basin in mid-May of 2015, and in the northern basin in early August of 2016 and end of November 2017; (4) the values of percentage of drought weeks gradually decreased from 2015 to 2017, and increased from the northeast to the southwest of the basin in 2015 and 2016; and (5) the average value of R and probability of detection between SMAP_SWDI and AWD were 0.6 and 0.79, respectively. These results show SMAP has acceptable accuracy and good performance for drought monitoring in the Xiang River Basin.

Graphical Abstract

1. Introduction

Drought is a natural disaster that occurs with high frequency and which has long-lasting impacts on agriculture production, the ecological environment, and the economy [1]. Agricultural drought can occur in many parts of the world but usually develops slowly and causes widespread devastation and economic loss [2]. During the growing seasons from 1988 to 2001, Canada suffered more than 5 billion dollars in economic losses per year due to agricultural drought [3]. Nebraska, USA, experienced drought at the same time, however, at a different magnitude, duration, and extent, and the agricultural economic sector was the primary sector affected [4]. In the summers of 1998 and 2002, North Carolina and South Carolina, USA, experienced their most severe droughts on record [5]. Some regions of China, such as the Xiang River Basin, have suffered agricultural drought due to climate change in recent years [1,6,7]. In the future, agricultural drought disasters may be further aggravated around the world due to climate change [8]. Therefore, it is urgent and necessary to predict and monitor agricultural drought accurately, for it is of importance to risk management.
Soil moisture plays an important role in agricultural production [9], and it is the key variable for drought monitoring and for the estimation of agricultural drought indices [10,11]. Precipitation-based agricultural drought indices typically do not consider site-specific soil properties, such as soil moisture. Agricultural drought is considered to begin when soil moisture availability reaches such a low level that it negatively affects crop yield. Hence, considering the effects of soil moisture on agricultural output, the availability of soil moisture databases is essential for the prediction of agricultural drought. Conventionally, soil moisture data are derived from observations of in situ soil moisture networks with different depths and various densities throughout the world [12]. However, the sparse and uneven distribution of data on in situ networks and even the unavailable data on in situ networks in some remote regions limits the access to information on soil water content [13]. Moreover, unlike meteorological variables such as air pressure, soil moisture features high uncertainty with large spatial variation, thus it is difficult to obtain accurate drought indices to meet the requirements for drought monitoring.
The development of remote sensing techniques enriched surface soil moisture observations at different temporal and spatial resolutions [14,15,16,17,18,19,20,21]. Satellite-based soil moisture datasets can be used for drought and flood forecasting [22,23,24,25,26], rainfall estimating [27,28], and large-scale hydrological modeling [29,30,31]. The most widely used satellite-based soil moisture datasets include the Soil Moisture and Ocean Salinity (SMOS), the Advanced Microwave Scanning Radiometer (AMSR-E), the Soil Moisture Active Passive (SMAP), and the Advanced Scatterometer (ASCAT) [32,33]. In previous studies, assessment of the accuracy of retrieved remote sensing soil moisture datasets is mainly through comparisons with in situ observations, and the correlation coefficients between them often showed high levels [34,35,36,37,38,39], which indicates that these datasets can be convincing alternatives for in situ observations. Compared with SMOS and AMSR-E, SMAP has advantages in enhancing passive soil moisture [40,41,42]. Some studies have been conducted to utilize SMAP for drought monitoring. Bai et al. [34] evaluated the performance of the soil water deficit index (SWDI) for agricultural drought obtained from the SMAP L3 in China. Their results showed that SMAP performed better on drought prediction in Southern China than in the northern part. Liu et al. [37] used support vector machine (SVM) and data assimilation methods to investigate the efficiency of SMAP soil moisture for drought monitoring and used SWDI to predict agricultural drought in the contiguous United States. Their results showed that SMAP soil moisture can significantly improve the accuracy of drought monitoring when this data was trained in support vector machine.
In regions with available in situ data, SMAP soil moisture can be used in combination with in situ data to improve drought monitoring [12]. However, the remotely sensed datasets (e.g., SMAP) can be the alternative observations for drought prediction in ungauged regions [5]. For example, Rhee et al. [5] combined three remote sensing variables to assess drought conditions in Southeastern United States.
The Yangtze River Basin has suffered frequent drought events since the 1980s. Within this basin, Hunan and Hubei provinces are the regions with the highest incidences of drought. The Xiang River is located in Hunan Province and is one of the eight tributaries of the Yangtze River. The Xiang River Basin (Figure 1), as an important agricultural region in China, is vulnerable to severe and continuous agricultural drought disasters [43]. This basin suffered moderate drought events before the 1990s and has tended to become drier since 2003 [44]. In recent years, a variety of studies have been conducted on drought monitoring in this basin. Tian et al. [1] used the precipitation–evaporation index (SPEI) and soil moisture data to establish a support vector regression model with climate index to predict agricultural drought in the Xiang River Basin. The results showed that the second half of the years studied (from 1963 to 2012) suffered more drought events than the first half for all categories of droughts. By means of mutation analysis, wavelet analysis, variance index, empirical orthogonal functions, and rotated empirical orthogonal functions, Zhang et al. [43] analyzed the changes in drought and flood events in the Xiang River Basin over 48 years from 1961 to 2008. The results showed that the frequency of droughts and floods had declined since the 21st century, and this mutation had begun during the 1980s. Ma et al. [45] studied the past precipitation and temperature trends of the Xiang River Basin, and made future predictions for 2021 to 2050. Their study pointed out that more droughts will possibly occur in the future due to an insignificant increase in precipitation and significant increase in temperature. Therefore, it is of great significance to identify the temporal–spatial distribution characteristics of dry and wet areas and to monitor agricultural drought in the Xiang River Basin for disaster prevention and economic development of this basin as well as the Yangtze River Basin.
Although there are many studies on drought monitoring in the Xiang River Basin, few studies have evaluated the accuracy of SMAP soil moisture using assimilated soil moisture data from the China Land Soil Moisture Data Assimilation System. Moreover, few studies have used the soil water deficit index obtained from SMAP to predict agricultural drought and to reveal the temporal–spatial characteristics of agricultural drought in this basin in the past three years. In addition, although some studies have been conducted to evaluate the efficiency of SMAP on drought monitoring around world [12,37,46], due to the high spatial variation and uncertainty of satellite-based soil moisture data, the potential capability of applying SMAP for drought monitoring on this specific region should be evaluated. Therefore, this study is aimed at investigating the accuracy of SMAP soil moisture data and the efficiency of the soil water deficit index obtained from SMAP used for drought monitoring in the Xiang River Basin. The remaining structure of the paper is organized as follows: the descriptions of in situ observations and SMAP soil moisture data are presented in Section 2; the methodology and evaluation indices are introduced in Section 3; Section 4 provides the results and discussion; and conclusions are drawn in Section 5.

2. Study Area and Data

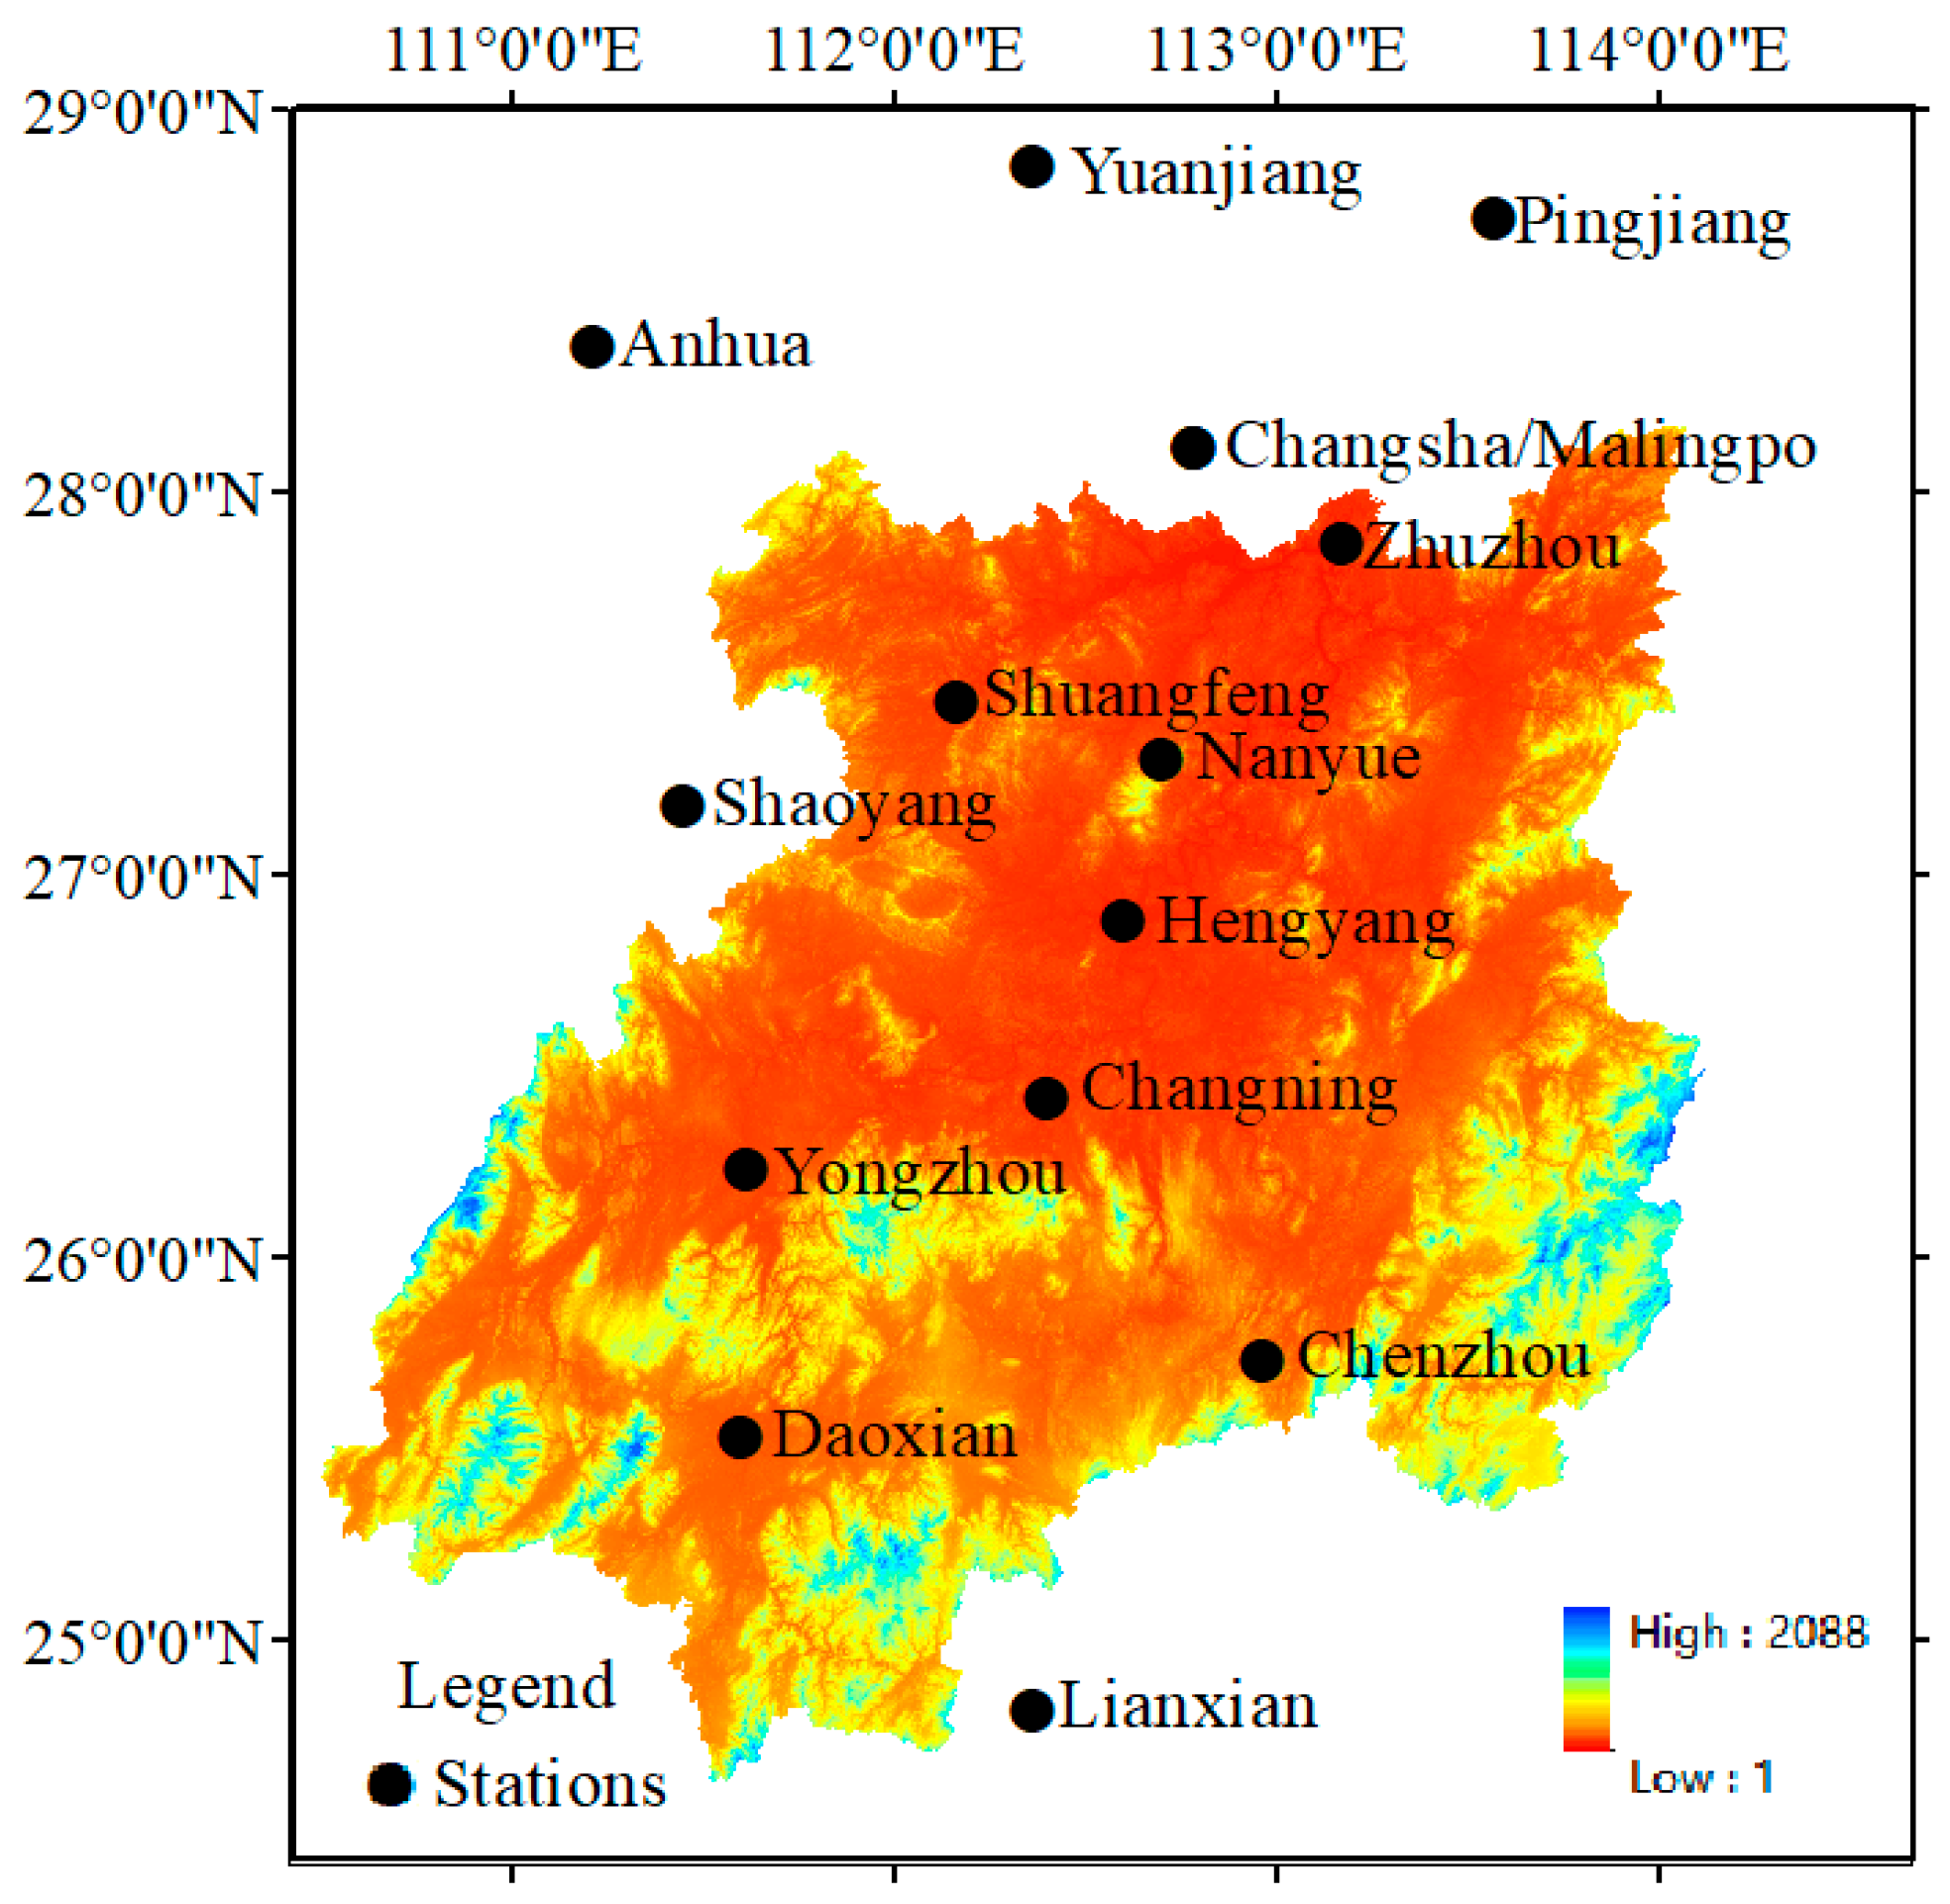
2.1. Study Area and In Situ Data

The Xiang River is one of the largest tributaries of the Yangtze River. This river is located in Southern China (24.5°–28.5°N; 111.0°–114.5°W), which is the largest river in Hunan Province and the Dongting Lake water system. The location of the Xiang River Basin and the distribution of the meteorological stations are shown in Figure 1. The Xiangtan discharge station is the control station of the Xiang River Basin. The surface area of the basin above the Xiangtan Station is about 82,375 km2. The Xiang River Basin is dominated by the Pacific monsoon climate. The average rainfall is 1400–1700 mm and the average temperature is 17 °C [1]. The uneven distribution of rainfall has led to frequent floods and droughts in the Xiang River Basin [1]. The area of cultivated land in the basin is 1.735 million hm2, which is a relatively well-developed agricultural production area in Hunan Province and an important commodity grain base in China [47].
Fourteen meteorological stations in the Xiang River Basin were used and the data were obtained from the National Meteorological Information Center (https://data.cma.cn/site/index.html). Daily precipitation, daily average temperature, max and min daily temperature, average pressure, average relative humidity, and daylight hours from 2015 to 2017 were provided by these stations. The Penman–Monteith equation was employed to calculate the potential evapotranspiration.

2.2. Reference Soil Moisture from China Land Soil Moisture Data Assimilation System

The China Land Soil Moisture Data Assimilation System (CLSMDAS) simulates and calculates soil moisture at different depths (0–5 cm, 0–10 cm, 10–40 cm, 40–100 cm, 100–200 cm) by using the Ensemble Kalman Filtering (EnKF) assimilation method and a land–surface model. The inputs of the land–surface model were comprised mainly of forcing data (i.e., FY-2C precipitation product and FY2C surface incident solar radiation product) and observation data (i.e., Advanced Microwave Scanning Radiometer for EOS (AMSR-E) soil moisture product and station observation soil moisture data). The output of the land–surface model was soil moisture data gridded over China with a spatial resolution of 10 km and temporal resolution of one day. The CLSMDAS soil moisture dataset was validated and the results showed that the assimilated soil moisture and in- situ observations were quite consistent in most parts of China’s southern, eastern, and central regions [48,49,50]. Moreover, the simulated high-quality soil moisture grid-point data can serve as important basic information for monitoring climate changes, including droughts. The CLSMDAS system presents reasonable temporal–spatial distribution of soil moisture and matches well with severe drought events in the southwest part of China [48,49,50]. The soil moisture data derived from CLSMDAS has been widely applied for drought monitoring [48,49,50]. The soil moisture dataset from CLSMDAS has been available since 19 January 2017. Therefore, the 0–5 cm soil moisture data from CLSMDAS in the Xiang River Basin during 1 April to 30 November 2017 were used as a reference, as there were no in situ soil moisture data available for this study. The 0–5 cm soil moisture dataset is provided online by the China Meteorological Data Sharing Service System: http://data.cma.cn/.

2.3. SMAP L2 Soil Moisture
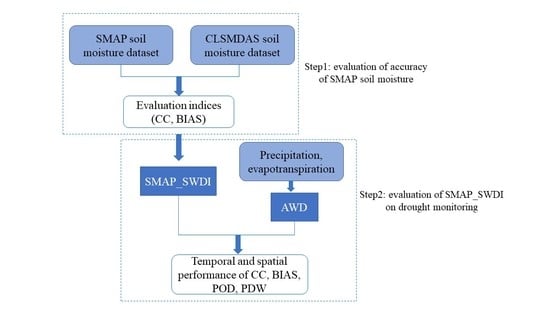
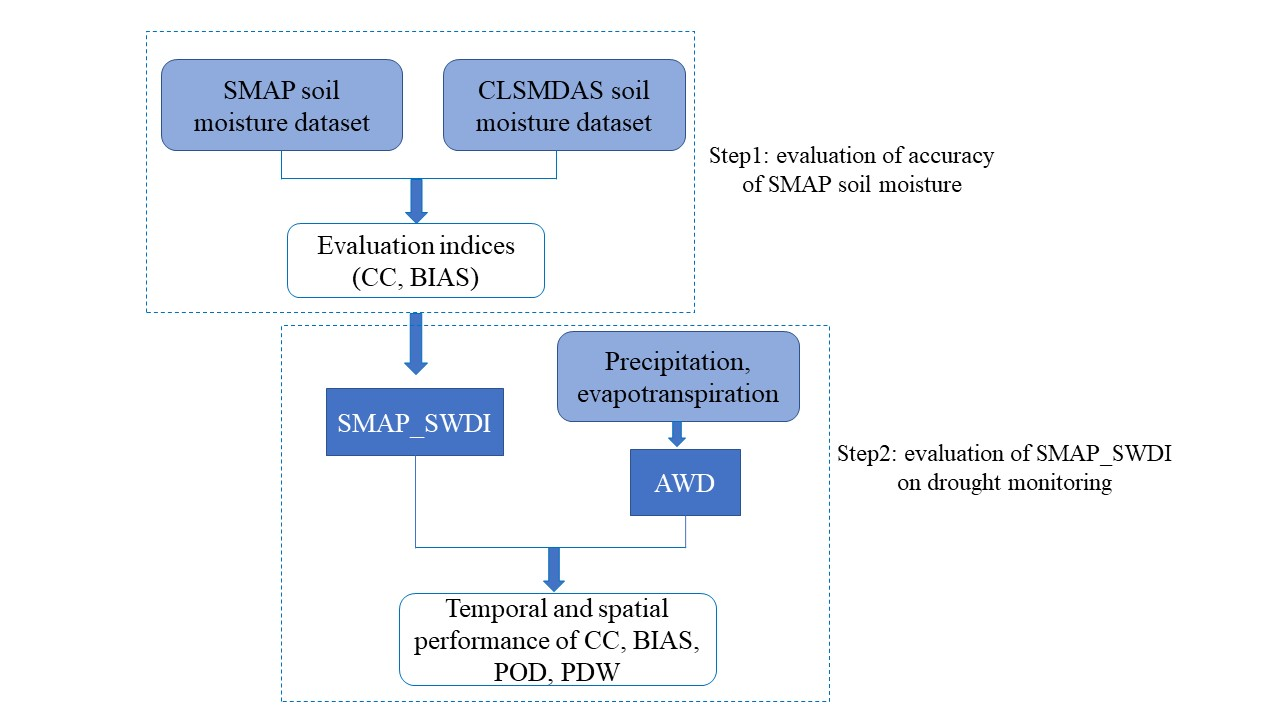
The Soil Moisture Active Passive (SMAP) mission was launched by the National Aeronautics Space Agency (NASA) in January 2015. It provides a global mapping of soil and landscape freeze/thaw states, as well as the net ecosystem exchange of carbon, by coarser resolution (40 km) radiometer observations [51]. The SMAP can provide the top 0–5 cm soil moisture data using the L-band radiometer.
The SMAP satellite mission was used to retrieve the global surface soil moisture information at different levels with a high-target accuracy (0.04 m3m−3) and a revisit of 1–3 days [35]. There are four levels of the SMAP satellite mission. Level 1B and 1C have geolocated instrument measurements within 12 hours of acquisition; Level 2 products are geophysical retrievals of soil moisture on a fixed-Earth grid within 24 hours of acquisition; Level 3 products are actively used for soil moisture data within 50 hours of acquisition; and Level 4 are the products of surface and root zone soil moisture and carbon net ecosystem exchange within 7 and 14 days of acquisition, respectively [13]. Therefore, Level 2 products were used in this study because of there daily temporal resolution. Specifically, the passive SMAP Level 2 L-band radiometer descending soil moisture product (SMAP L2 Radiometer Global Daily 36-km EASE-Grid soil moisture version 1, SMAP_L2_SM_P) was used to analyze drought in the Xiang River Basin. The dataset can be downloaded freely online: https://earthdata.nasa.gov/.

3. Methodology

The 0–5 cm soil moisture data from CLSMDAS was used as a reference dataset to evaluate the performance of 0-5 cm SMAP soil moisture. The atmospheric water deficits (AWD) calculated from meteorological data were used as reference datasets to evaluate the performance of SWDI. After the evaluation, the SMAP-derived soil water deficit index (SMAP_SWDI) was calculated to estimate the drought conditions in the Xiang River Basin. For comparison, AWD was also used to estimate the drought conditions in the basin.
The analysis was accomplished on both temporal and spatial scales. The steps are as follows:
  • Evaluate the accuracy of SMAP soil moisture and SMAP_SWDI;
  • Analyze the temporary and spatial drought conditions in the Xiang River Basin based on SMAP_SWDI;
  • Calculate the AWD values with in situ meteorological data;
  • Compare the performance of AWD and SMAP_SWDI on both temporal and spatial scales.

3.1. Soil Water Deficit Index (SWDI)

The agriculture drought is quantified by SWDI using the top 0–5 cm surface soil moisture. As described in previous studies, SWDI has shown a good performance in defining drought levels and severity; for example, the SWDI calculated using satellite soil moisture data showed very good agreement with the AWD, and the values of SWDI can adequately capture the drought dynamics, especially the intensity [12,52]. The SWDI is calculated as follows:
SWDI = θ θ F C θ A W C × 10
θ A W C = θ F C θ W P
where θ is the time series of SMAP soil moisture (m3/m3) and 0–5 cm soil moisture data from CLSMDAS, θ F C , θ W P and, θ A W C represents the field capacity, wilting point, and available water capacity, respectively. There are several ways to define θ F C and θ W P : (1) the 5th and 95th soil moisture data of the time series denote θ W P and θ F C ; (2) the soil moisture at a soil water potential of −33 kPa and −1500 kPa are considered equal to θ W P and θ F C ; and (3) θ W P and θ F C are calculated by basic soil physical characteristics such as the proportion of clay and sand via pedo-transfer functions [53]. These three methods all show good performance in defining θ W P and θ F C , and the first method is the simplest way for calculation [53,54,55]. Agricultural drought is linked with soil moisture availability during the growing season [53]. Therefore, the 5th and 95th soil moisture data of the selected time series of the growing season (April to November) were used to obtain annual θ W P and θ F C .
The daily SMAP_SWDI was computed based on the time series of every grid of this dataset and then the daily SWDI of grids were averaged for the whole Xiang River Basin. The SWDI was analyzed on a weekly timescale for it is the timescale used in the irrigation schedule [56], therefore, the average daily SWDI would transfer to a weekly SWDI. If the values of the SWDI are negative, it indicates the occurrence of drought in the Xiang River Basin. According to Martinez-Fernandez et al. [53], the values of the SWDI and the corresponding drought categories are shown in Table 1.

3.2. Percentage of Drought Weeks (PDW)

A drought week is defined when severe drought occurs with the values of weekly SMAP_SWDI lower than −5 [12]. The percentage of drought weeks (PDWs) can be represented as the drought conditions of the Xiang River Basin. Percentage of drought weeks can be calculated as:
P = D W × 100 %
where D represents the number of drought weeks and W represents the total study weeks, which were 35 in this study.

3.3. Atmospheric Water Deficit (AWD)

Atmospheric water deficit is the difference between precipitation (P) and potential evapotranspiration ( E T 0 ). Atmospheric water deficit is claimed to be a suitable index to reflect the drought condition related to meteorological parameters [56]. The AWD value is calculated by P minus E T 0 on a weekly scale:
A W D i = P i E T i
where i represents the week of the study period, P i and E T i denotes the sum of precipitation and sum of evapotranspiration (ET) of week i, respectively. The daily ET was computed using the Penman–Monteith equation. The Penman–Monteith equation is useful for computing ET based on temperature, humidity, wind speed, and solar radiation. It is rather stable over large areas, especially uniform surfaces [57]. This index indicates drought when AWD is lower than 0. Extreme drought occurs when AWD is lower than −50 mm [53].

3.4. Evaluation Indices

The Pearson correlation coefficient (R-value), BIAS, ubRMSE, and the drought weeks’ probability of detection (POD) were calculated to evaluate the accuracy and the reliability of the SMAP soil moisture and the performance of SMAP on drought monitoring. The three indices are defined as follows:
R = i = 1 n ( X i X ¯ ) ( Y i Y ¯ ) i = 1 n ( X i X ¯ ) 2 i = 1 n ( Y i Y ¯ ) 2
POD = A A + C
B I A S = i = 1 n ( X i Y i ) i = 1 n X i
ubRMSE = 1 n n i n ( Y i X i ) 2 ( i n ( Y i X i ) ) 2
where X i and Y i represent the in situ dataset and remote sensing dataset, respectively, and X ¯ and Y ¯ represent the mean value of these two datasets, respectively. In Equation (6), A represents the weeks that the droughts are both indicated by AWD and SMAP_SWDI, and C represents the weeks that AWD indicates drought while SMAP_SWDI indicates no drought.
As long as in situ soil moisture data and precipitation or alternative datasets are available, the methodology in this study can be widely applied to evaluate the capability of SMAP on drought monitoring on other regions.

4. Results and Discussion

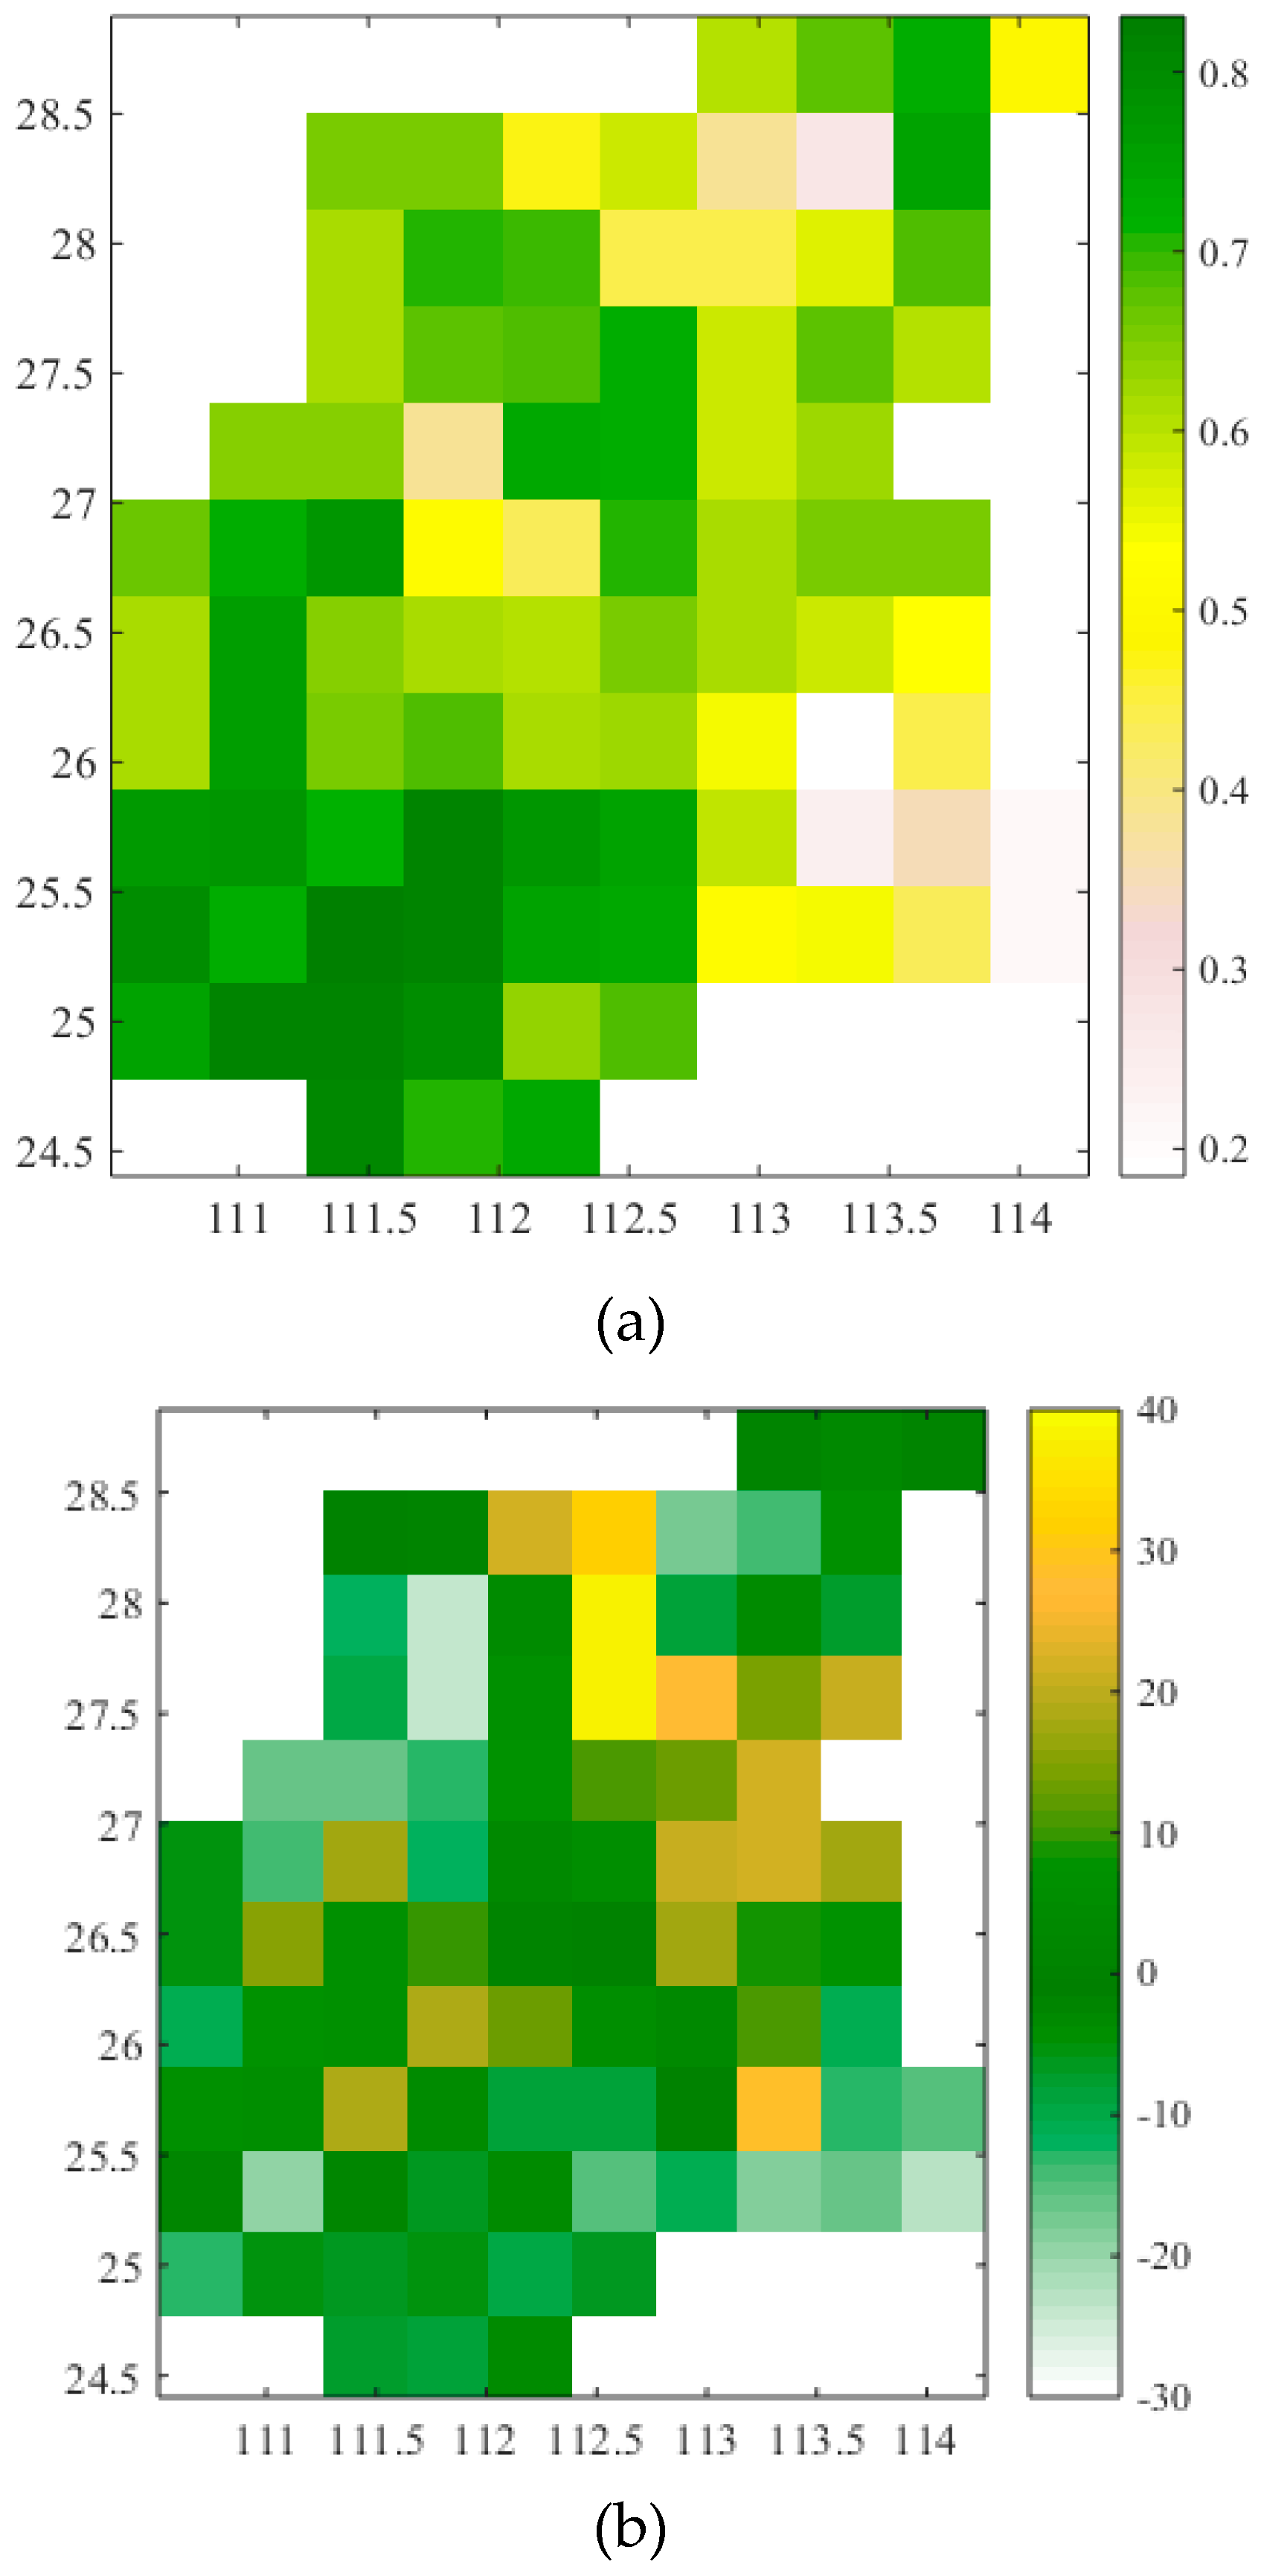
4.1. Evaluation of SMAP Soil Moisture

The grid scale and regional scale were both adopted to evaluate the accuracy of SMAP soil moisture. At the grid scale, 0–5 cm soil moisture data from CLSMDAS and 0–5 cm SMAP soil moisture were used for evaluation. Daily soil moisture on each grid obtained from SMAP and CLSMDAS between 1 April to 30 November 2017 were used for calculation of R-value. As for the regional scale, the average value of SMAP soil moisture was compared with the averaged CLSMDAS soil moisture by averaging all grids of these two datasets over the Xiang river basin.
At the grid scale, the daily CLSMDAS soil moisture and SMAP soil moisture were compared with each other on every grid via R-value (Figure 2a). In terms of R-value, around 70 percent of grids performed well (R-value > 0.6), 20 percent performed fairly (0.4 < R-value < 0.6), and just 10 percent performed poorly (R-value < 0.4). Higher consistency between CLSMDAS and SMAP soil moisture was mostly observed in the southwest part of the Xiang River Basin, which is located in a region with relatively low altitude compared to surrounding regions. Poor performance was mainly illustrated in the eastern basin with the highest altitude. These results suggest that topographic factors play an important role in the performance of SWDI for agricultural drought, and the results are consistent with Paredes-Trejo and Barbosa [9], who showed that agricultural drought indices obtained from satellite soil moisture tends to show poor performance in mountain regions. A possible reason is that the surface water in mountainous regions is limited due to the high potential for infiltration because of complex topography [34,58,59]. In terms of BIAS values (Figure 2b), about 85 percent of grids were between −20 % and 20%, 51 percent were between −10 % and 10%, and only 3.5 percent were over 30%. In addition, the SMAP soil moisture demonstrated good performance with ubRMSE values ranging from 0.03 m3·m−3 to 0.08 m3·m−3.
At the regional scale, the time series of averaged SMAP soil moisture along with the averaged CLSMDAS soil moisture on a daily scale are shown in Figure 3. The R-value, BIAS, and ubRMSE between these two averaged datasets (R-value = 0.62, BIAS = 6.04 %, ubRMSE = 0.033 m3·m−3) for this basin indicates that the SMAP soil moisture has a relatively good performance on capturing the features of CLSMDAS soil moisture. During May, the values of CLSMDAS soil moisture are slightly lower than SMAP soil moisture. Soil moisture from these two datasets show similar variations and features in middle June and July. However, significant difference occurs after August. The values of CLSMDAS soil moisture are higher than that of SMAP soil moisture, even though there are similar variations between these two datasets. A possible reason for the big gaps between these two datasets is that the L-band of SMAP cannot penetrate massive vegetation canopies [60].
Above all, SMAP soil moisture is satisfactory in terms of R-value, BIAS, and ubRMSE for both point scale and regional scale, with acceptable accuracy and relatively good performance in most of the Xiang River Basin.

4.2. Drought Estimation in the Xiang River Basin

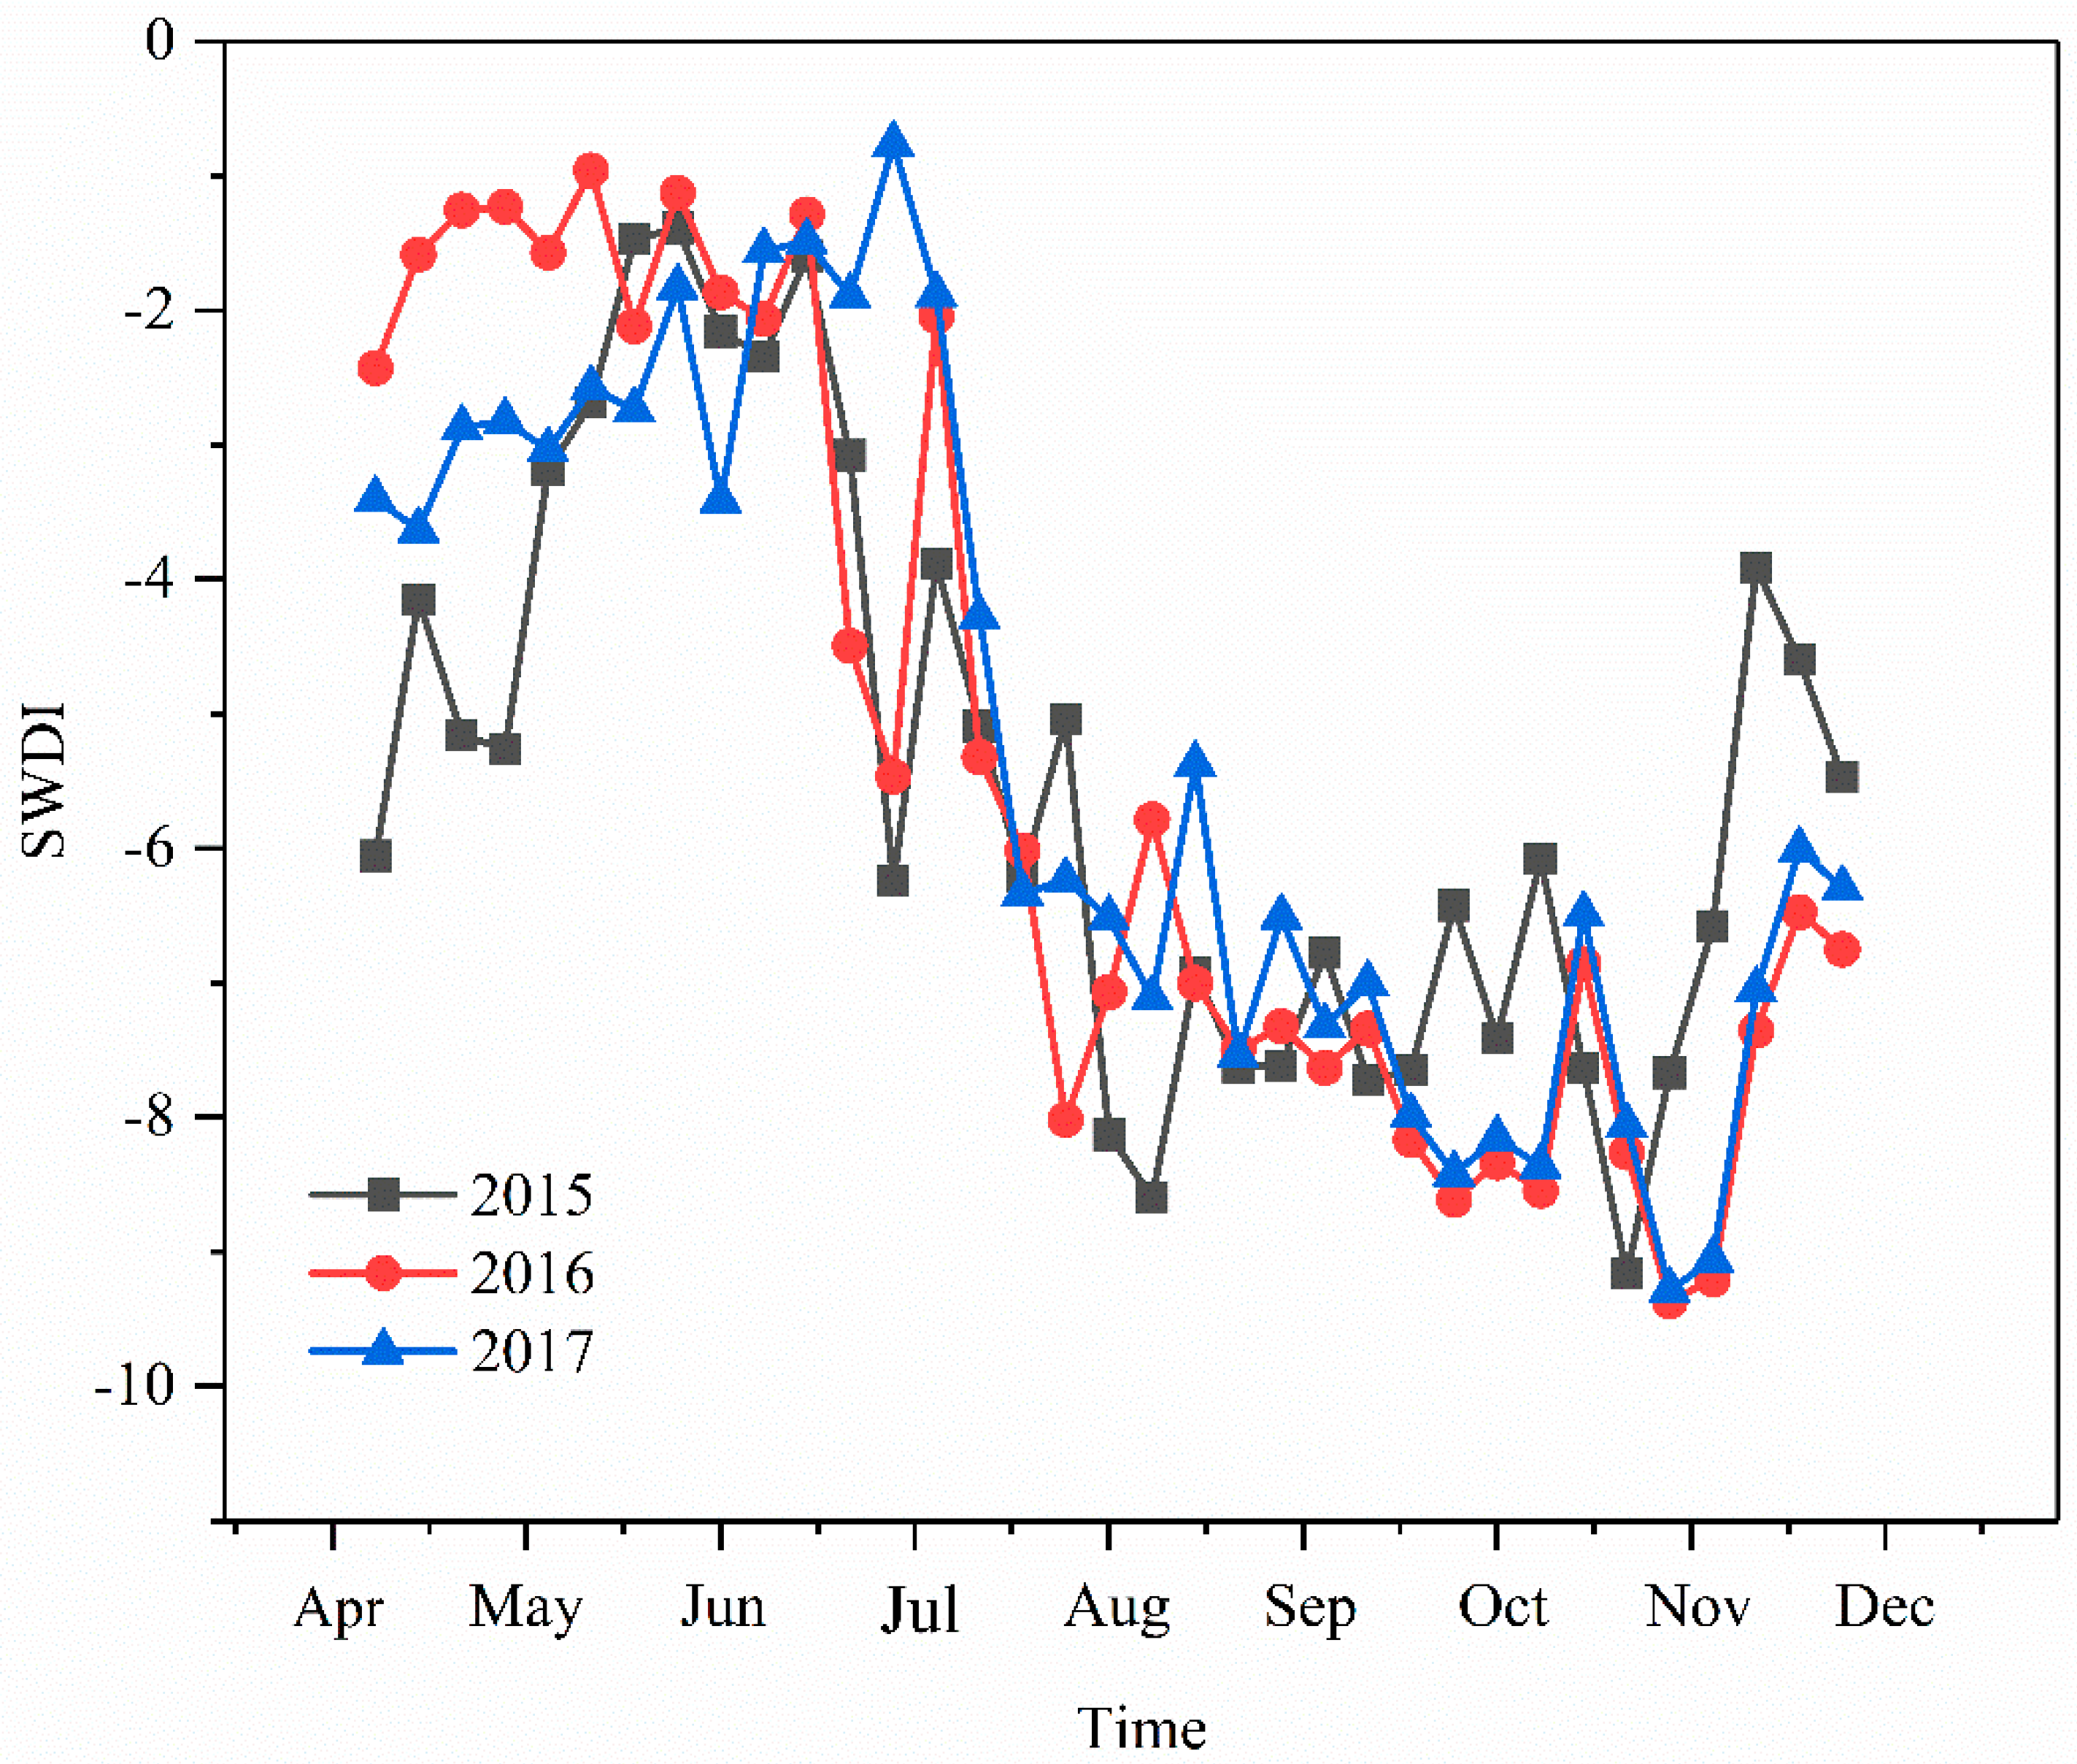
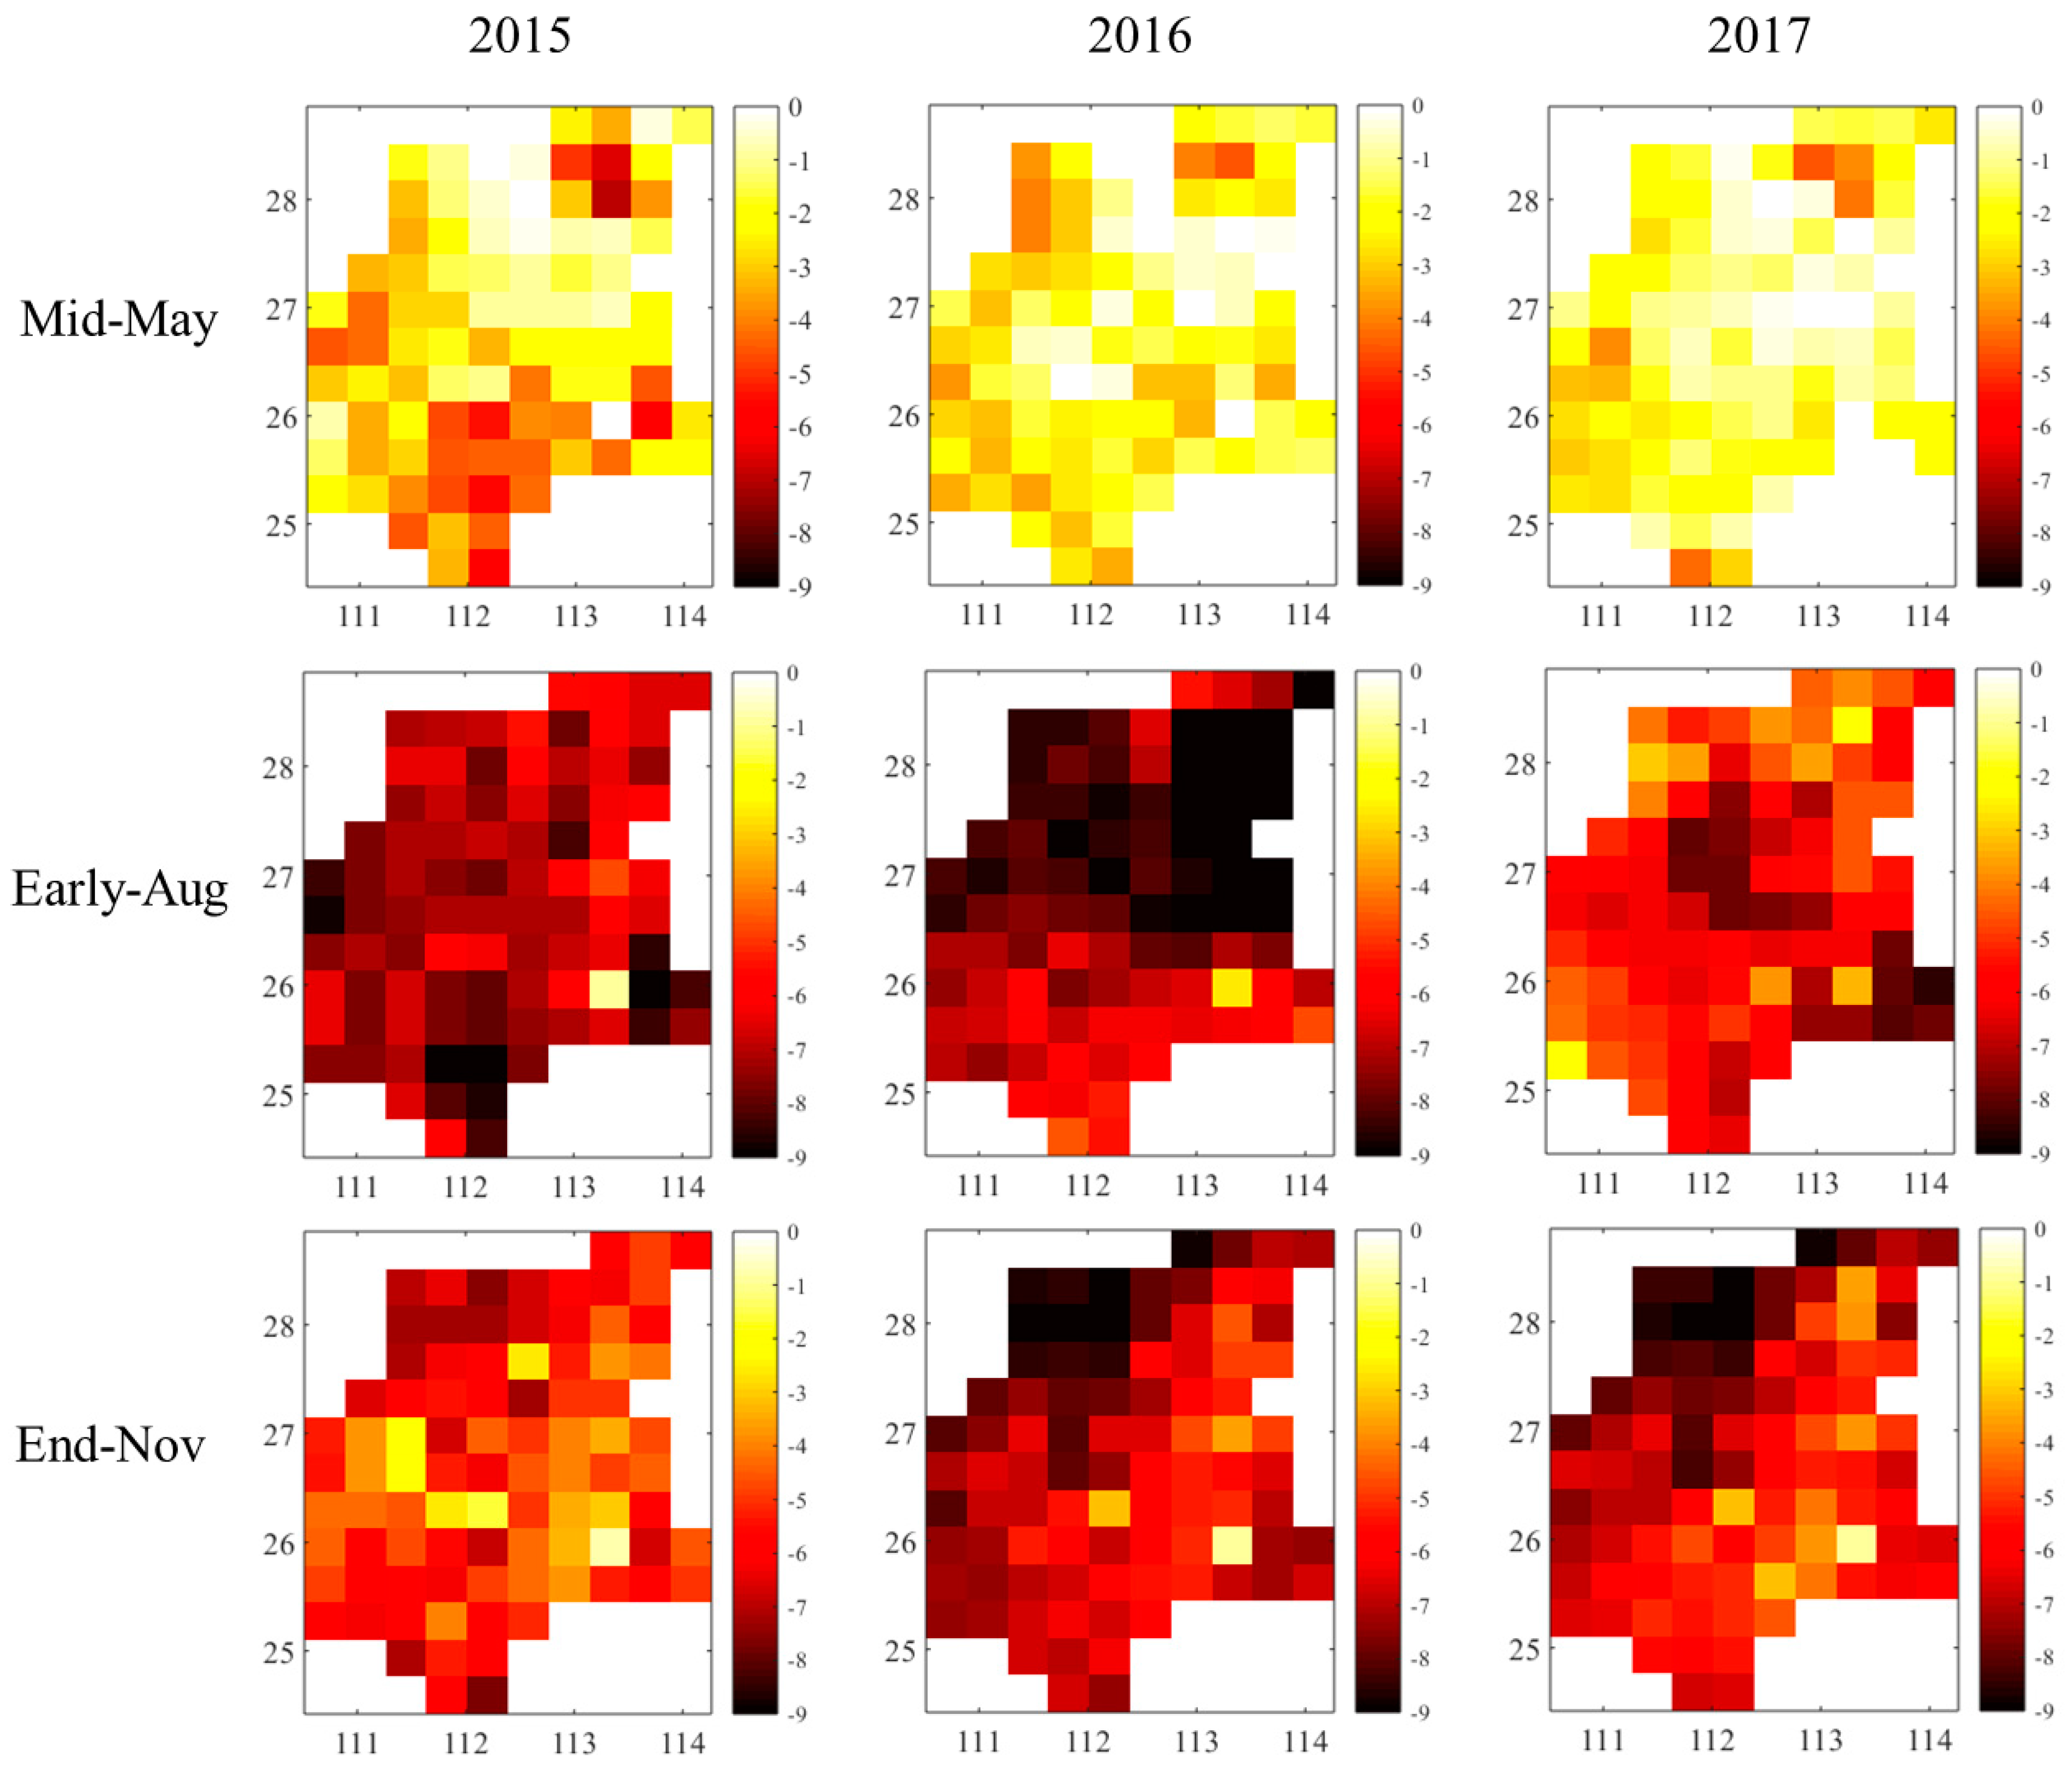
4.2.1. Temporal and Spatial Analysis of SMAP_SWDI

At the temporal sale, the weekly time series of SMAP_SWDI from 2015 to 2017 are presented in Figure 4. Figure 4 illustrates that the weekly time series of SMAP_SWDI of three different years show a similar trend. The values of SMAP_SWDI were within −6 to 0 between April and mid-June, and then rapidly declined to −10 during July and October. After October, these values apparently increased to the range of −4 to −7. Figure 4 presents that the values of SMAP_SWDI were focused on −4 to 0 during April and June of 2016 and 2017. According to Table 1, it indicates that there were no severe droughts in the Xiang River Basin at this stage. It coincides with Reference [61], which suggests that the Xiang River Basin may encounter less risk of drought due to heavy rainfalls during April to June. However, the values of SMAP_SWDI in April of 2015 were lower than that of 2016 and 2017, which suggests that the severity and magnitude of the agricultural drought in 2015 was more serious than that in 2016 and 2017.
There is an apparently dynamic trend where the values of SMAP_SWDI decreased from −1 to −10 during mid-June and August for all three years. Based on Table 1, the corresponding drought category changed from mild drought to severe drought in this period, and the condition of severe drought existed until the end of September. The possible reason for the mutation may be the high air temperature in the basin between June to September and high evaporation from the soil surface as well as high evapotranspiration of crops in the development stage and mid-season stage (Figure 5). Xiao et al. [62] also confirmed that the temperature gradually increased from April to September in the Xiang River Basin, and that there was no significant increase in rainfall in most meteorological stations from June to July. This demonstrates that the Xiang River Basin was threatened by the high risk of agricultural drought during April and September. In terms of interannual changes, the values of SMAP_SWDI in 2015 varied largely from week to week, and the mutation was half a month ahead compared to 2016 and 2017. Such findings indicate that the severity of agricultural drought in 2015 was stronger than 2016 and 2017.
The values of SMAP_SWDI during the three years studied were stable between mid-May and June, August to October, and at the end of November. Therefore, the conditions of agricultural drought in mid-May, early August, and at the end of November in the Xiang River Basin were more representative than other stages. Thus, the spatial distributions of SMAP_SWDI in mid-May, early August, and at the end of November from 2015 to 2017 in this basin were selected to be compared.
As shown in Figure 6, during mid-May, the severity of droughts gradually decreased from 2015 to 2017. Severe droughts (−10 < SWDI < −5) were only detected in the southern and northeastern parts of the basin in 2015, and less moderate droughts occurred in 2016 and 2017.
Early August basically represents the driest period in the Xiang River Basin. Early August of 2016 suffered the most severe and wide range of droughts, with the driest area mainly in the northern part of the basin. However, the same category of drought as 2016 mainly occurred in the southern part of the basin in 2015. During early August of 2017, the severity of agricultural drought in the central region was relieved compared to 2016, but the severe drought was shifted from the north to the eastern part of the basin. The severity of agricultural drought was reduced in both the northeast and southwestern part of the basin in early August of 2017, but there remains a small area with severe drought in the middle basin. As for the period at the end of November during 2015 and 2017, severe drought was mainly concentrated in the northern part of the basin. Drought conditions in 2015 were apparently less severe than that in 2016 and 2017. The distribution of different categories of droughts in 2016 is similar to that of 2017, with severe droughts occurring in the northwest and moderate droughts occurring in the eastern part of the basin.

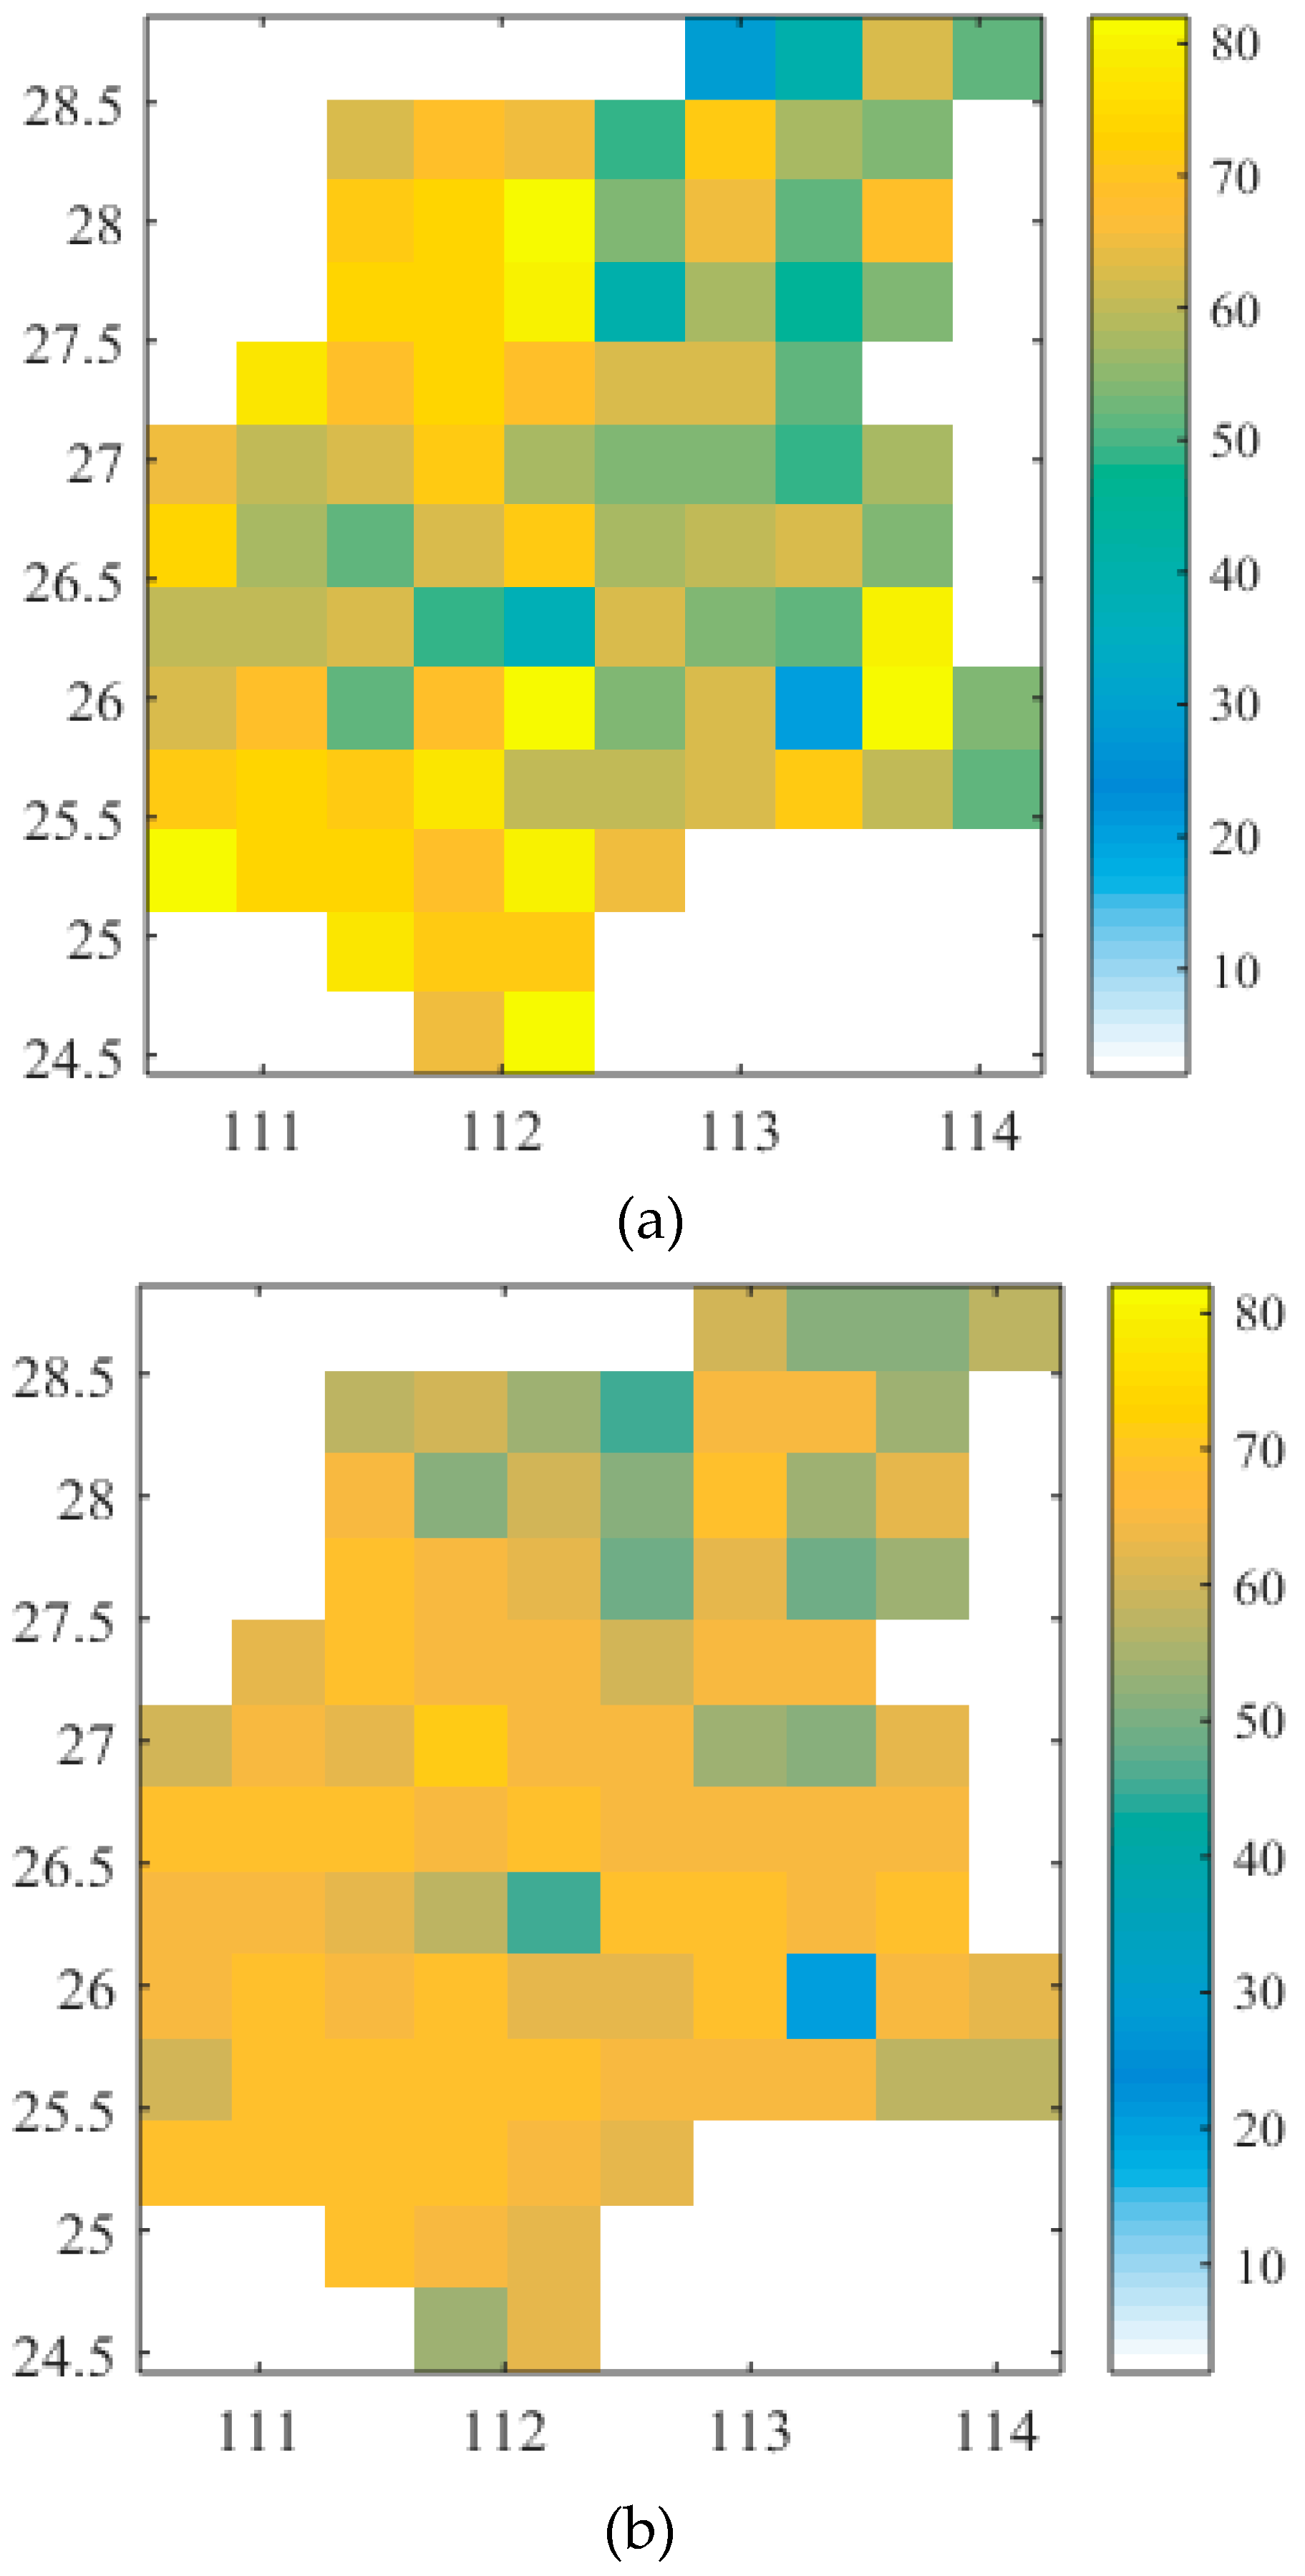
4.2.2. Temporal and Spatial Analysis of PDWs

The annual PDWs of the Xiang River Basin showed a gradual downward trend from 2015 to 2017 (from 65% to 57%) in Figure S1. This downward trend is consistent with Zou and Ren [63] who showed that most river basins in Southern China demonstrated a slightly downward trend in drought in recent years.
After calculating the PDWs of each grid, the spatial change in PDWs can be analyzed from 2015 to 2017 (Figure 7). Figure 7 illustrates that PDWs followed an increasing trend from the northeast to the southwest in 2015 and 2016. Figure 7a shows that the severe conditions of drought weeks mainly occurred in the northwest and southwest of the basin. As for 2016 (Figure 7b), the severity of drought weeks was alleviated in the western region compared to that of 2015, while the condition of drought weeks in the east was more serious than that in 2015. In 2017, the PDW values were reduced over the entire basin, especially the western and southern parts, but there remained some parts of the basin that had high PDW values (Figure 7c). The severe condition of drought weeks in 2017 was mainly in small parts of the northwest and northeast, but the extent of the drought weeks was significantly reduced compared to the previous two years.
From the perspective of the entire basin, the northeastern part of the basin was in a state of fewer drought weeks over the past three years. This result is consistent with the findings of Zhang et al. [7], who claims that the values of Pan evaporation in the Xiang River Basin declined from the southwest to northeast, indicating that the northeast part may not suffer high PDWs compared with the other parts of the basin. Significant changes can be seen in the western and southern parts of the basin, which show a process of progressively weakening PDWs upstream of the basin.
The PDW has four categories: (1) 0~25% (i.e., it represents less than nine weeks of drought events); (2) 25~50%; (3) 50~75%; (4) 75~100% (i.e., it represents more than 26 weeks of drought events). A higher percentage of grids that are located in the intervals of 50%~75% and 75%~100% indicates a higher percentage of drought events [12]. The PDW in four intervals were quantified in the Xiang River Basin. It can be seen from Figure 8 that the percentage of grids in the four intervals present different values of PDWs in each year. Most of the PDW values were between 50% and 75%. In 2015, except for the interval of 50–75%, the percentage of grids in other intervals stayed in a smaller range (Figure 8a). In 2016 and 2017, there are few cases where the proportion of PDWs was more than 75% or less than 50% (Figure 8b,c). These results suggest that the severity of drought weeks have eased in the past three years. However, since most of the PDWs were still in the interval of 50% to 75%, attention should be paid to drought monitoring in the Xiang River Basin in the coming years.

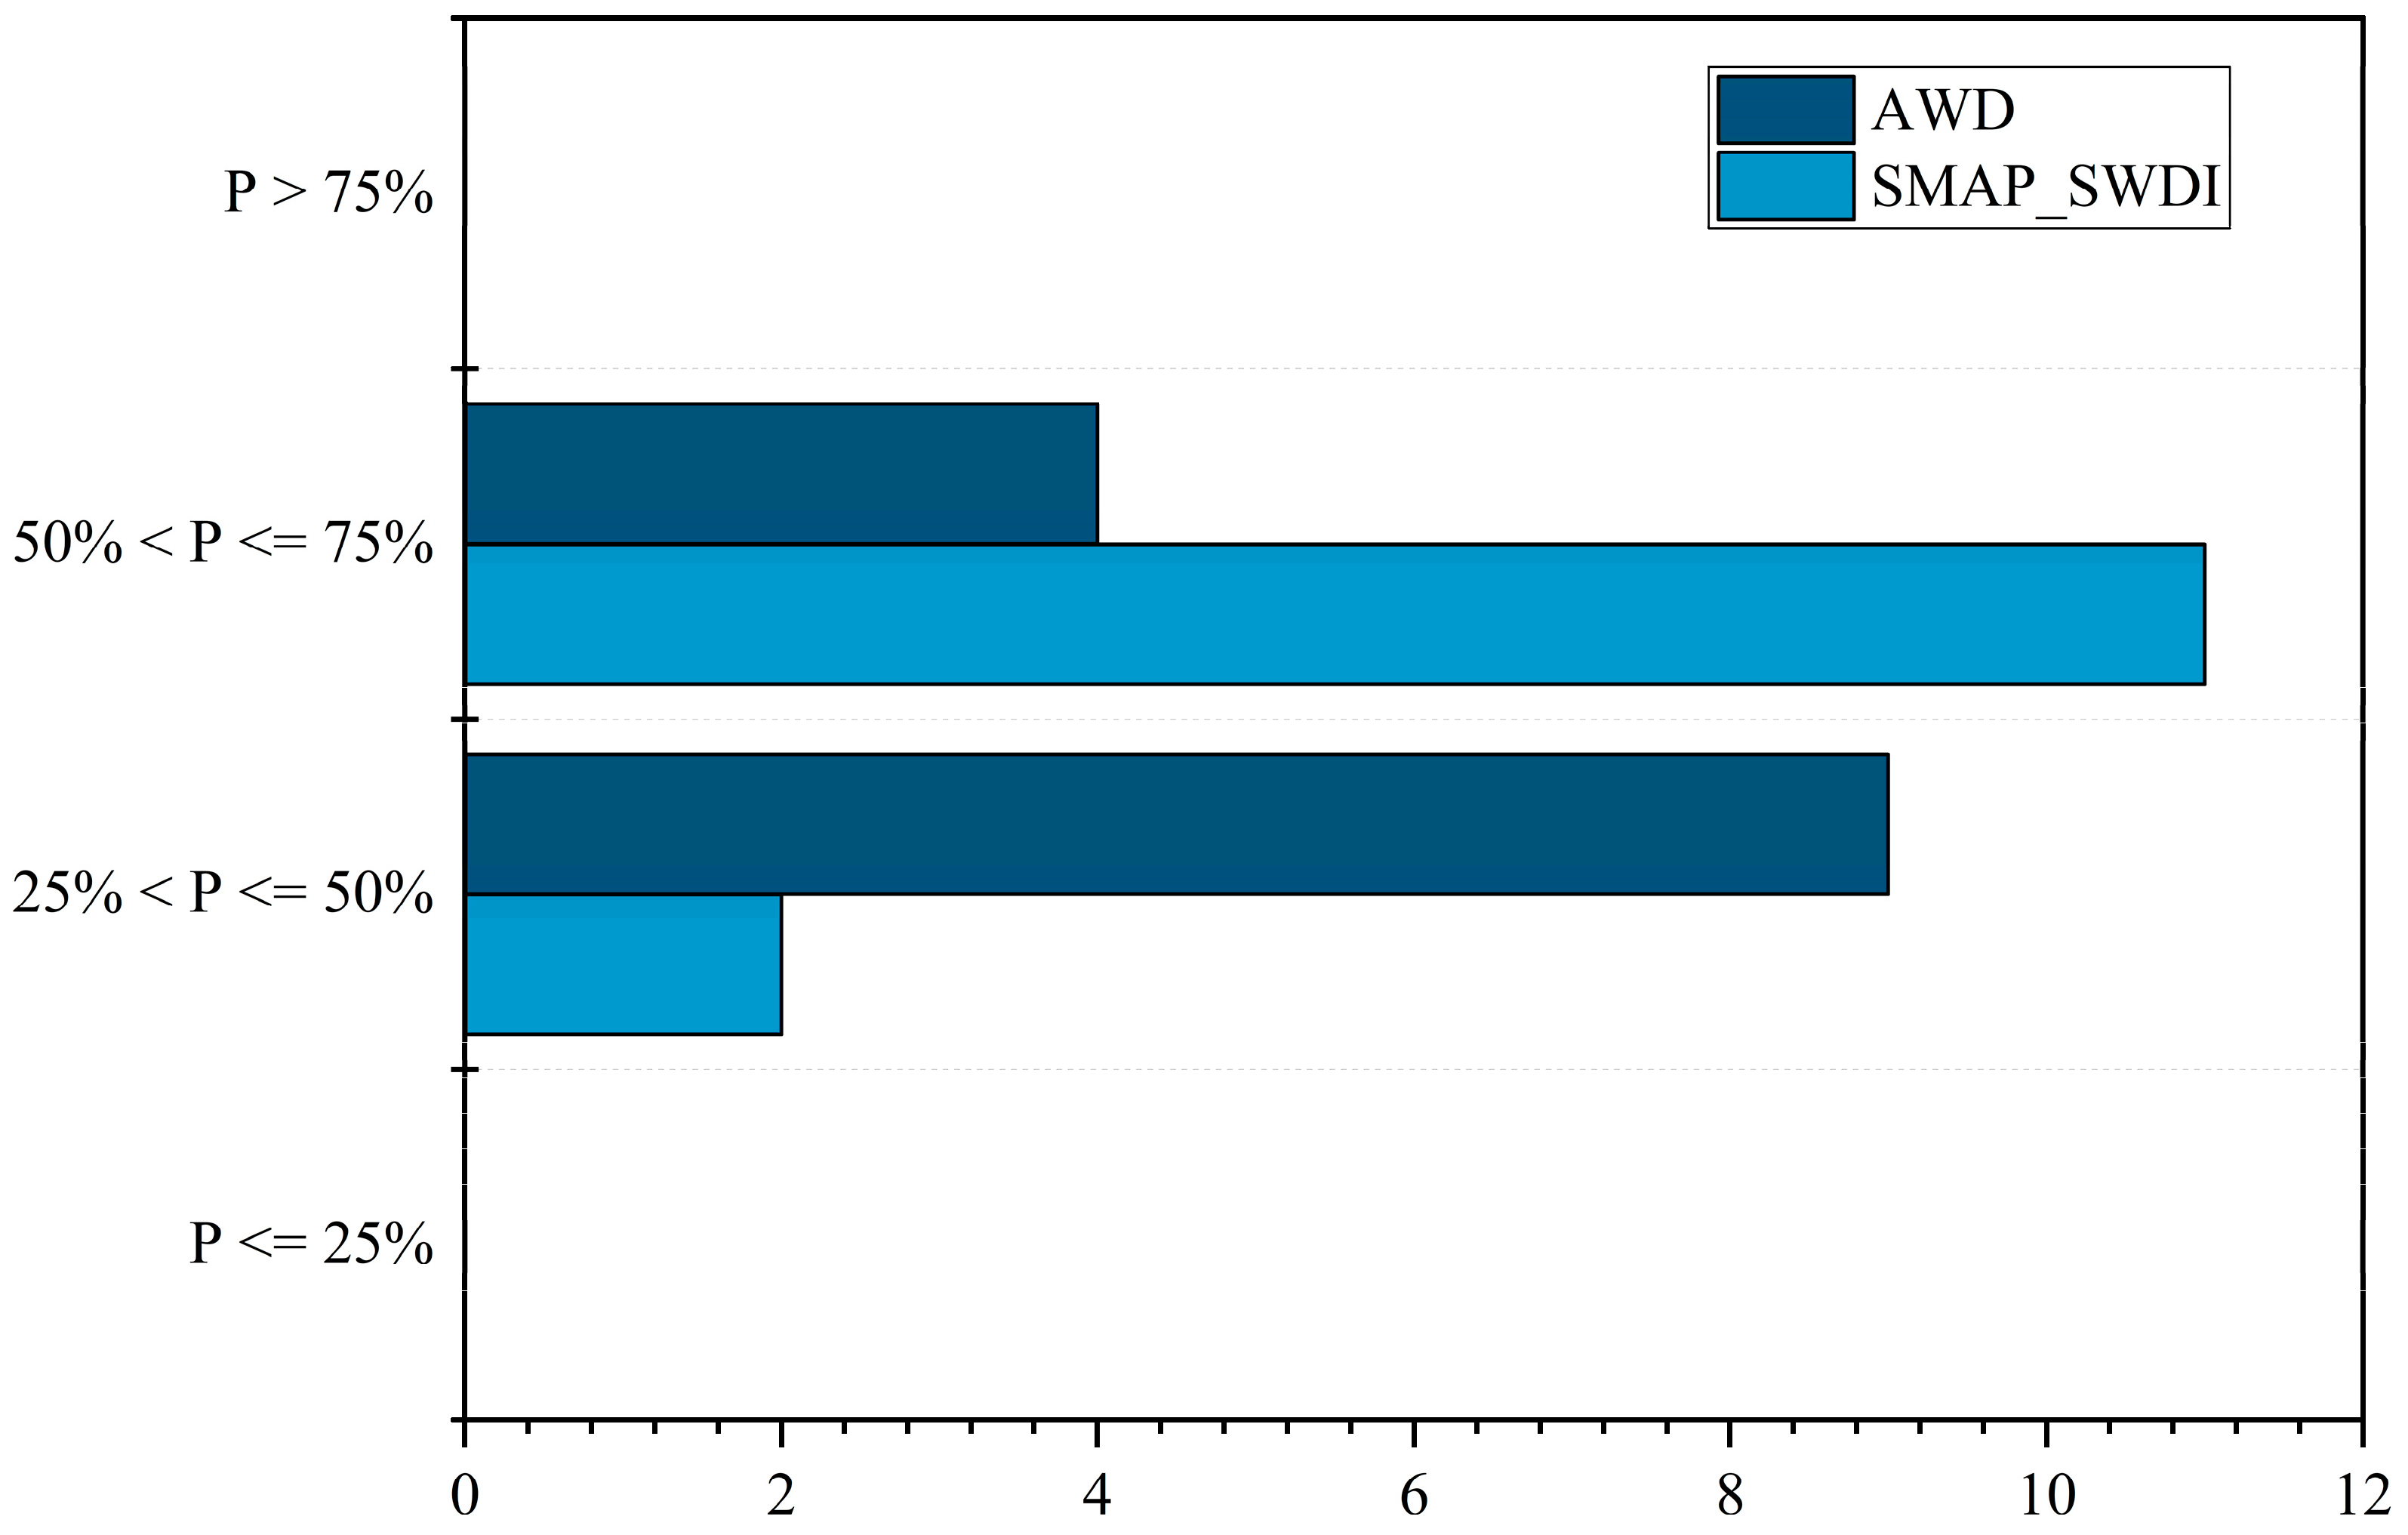
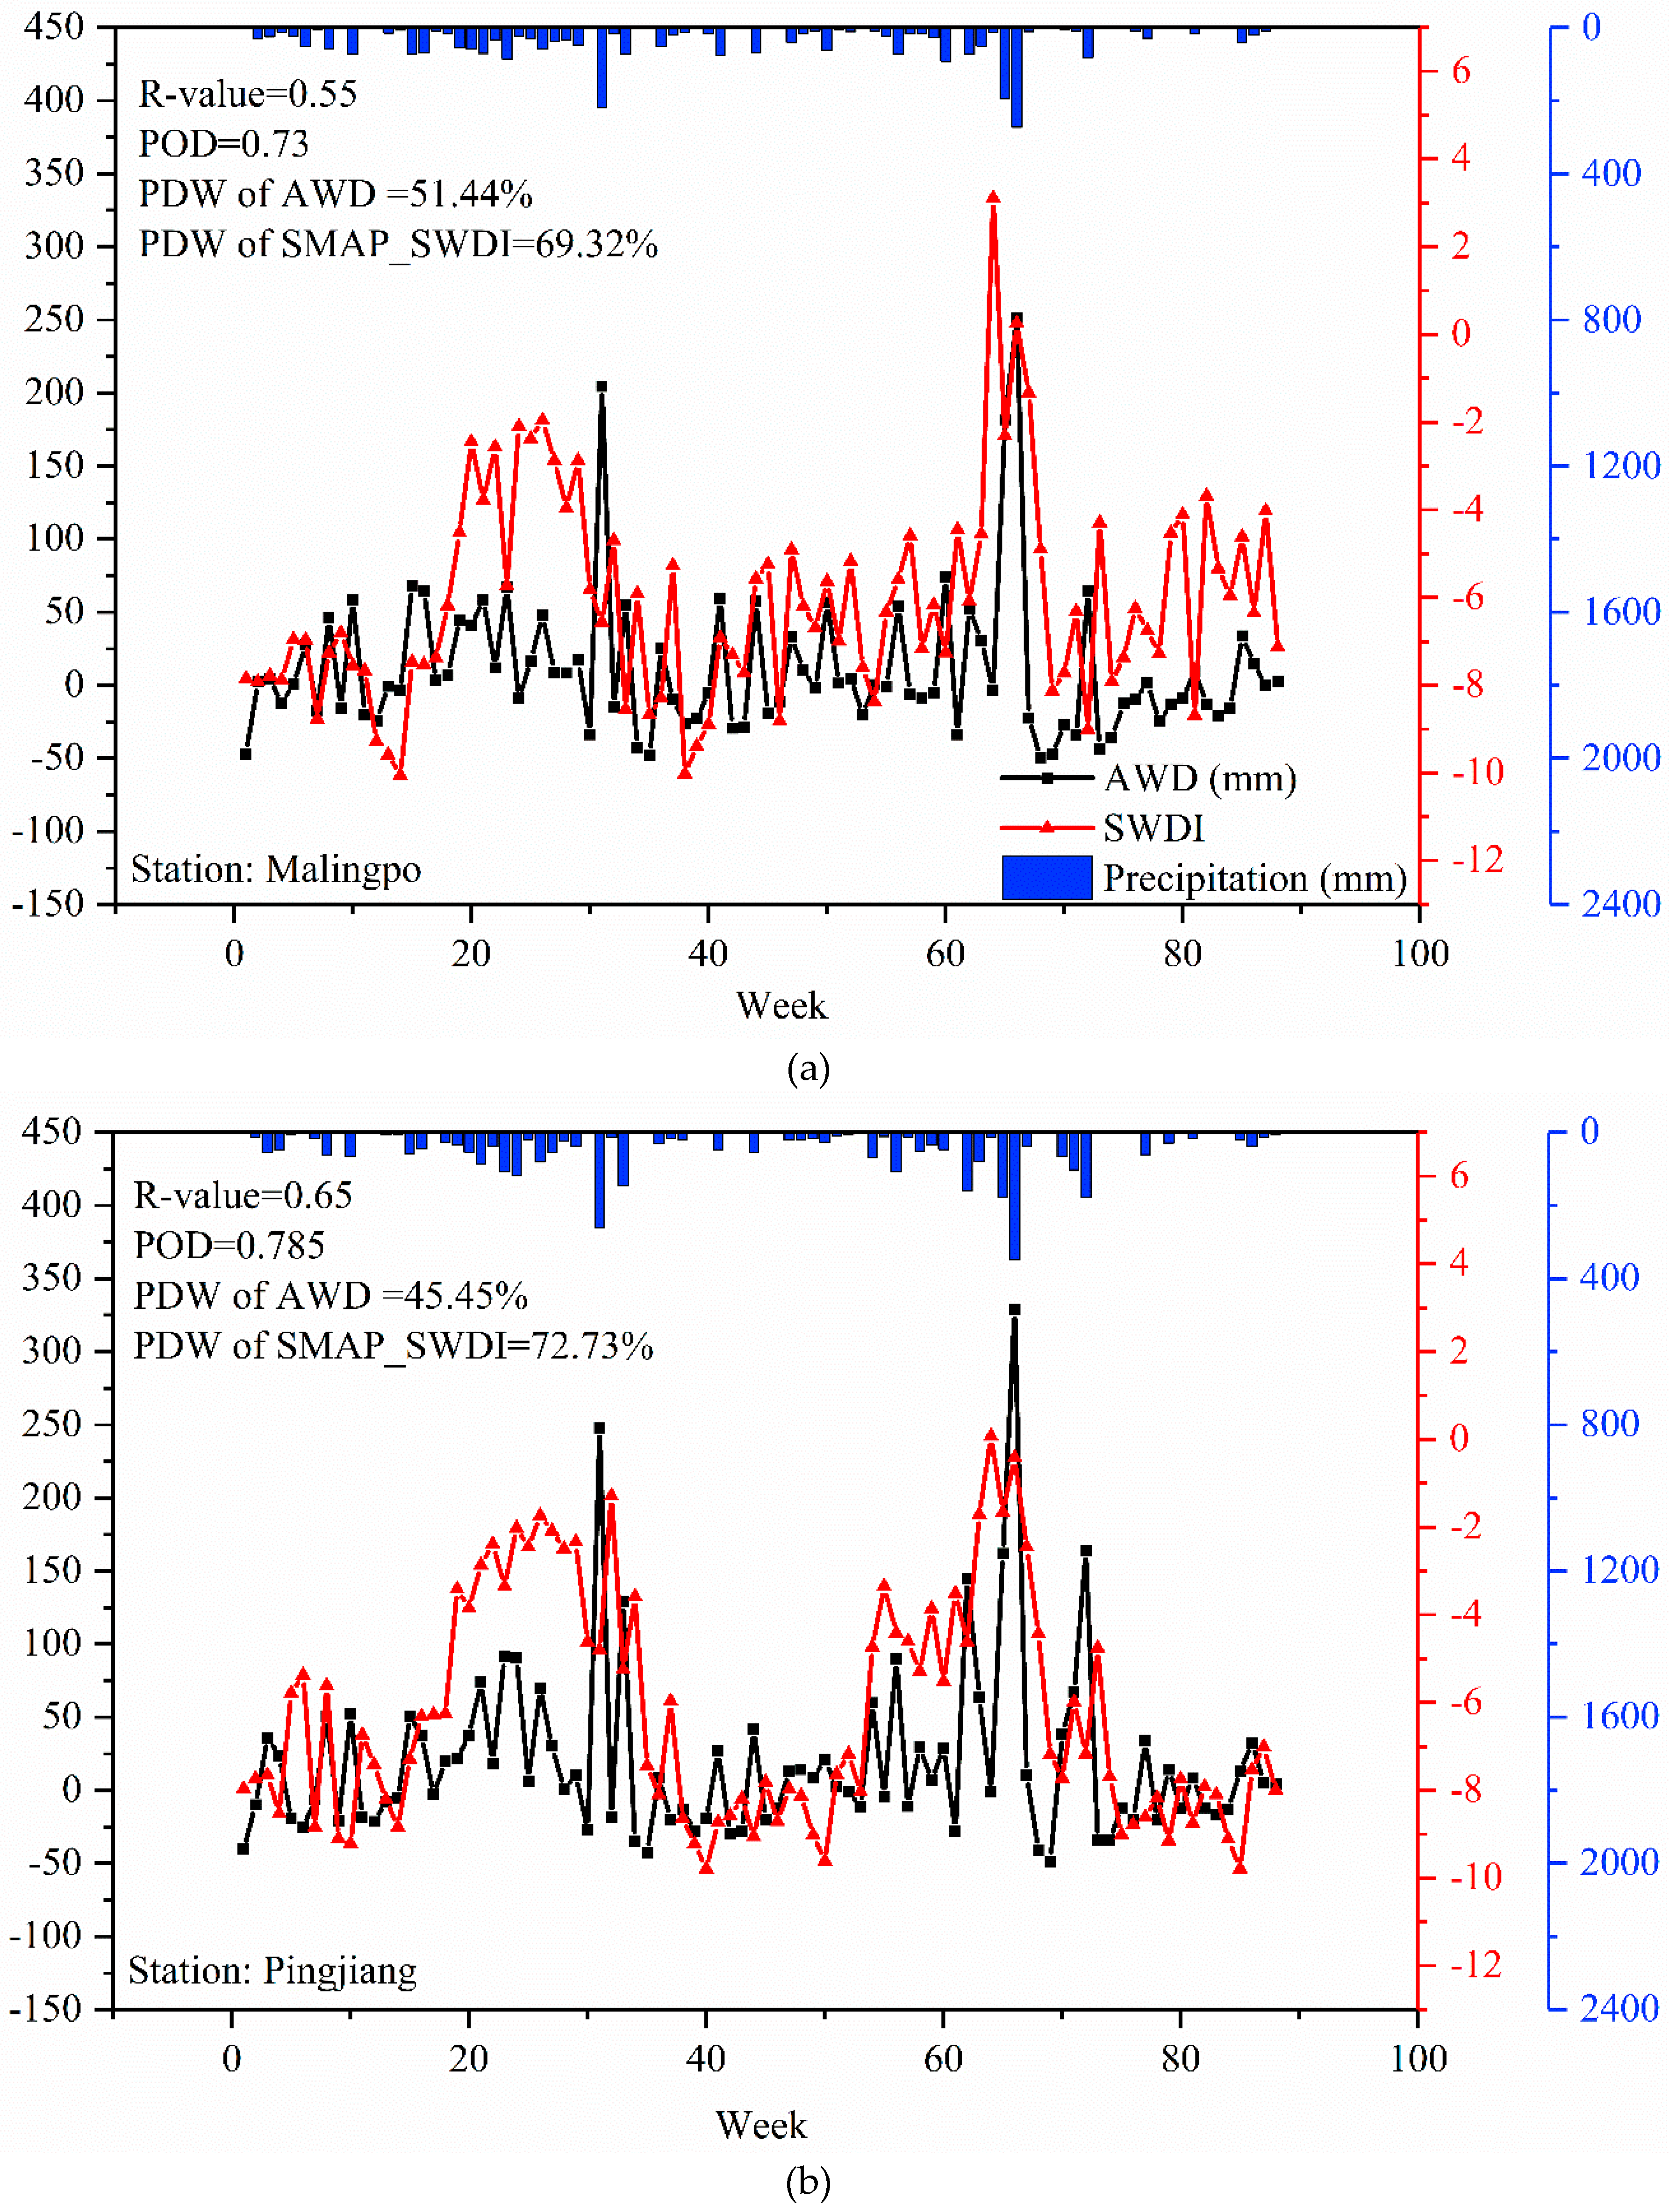
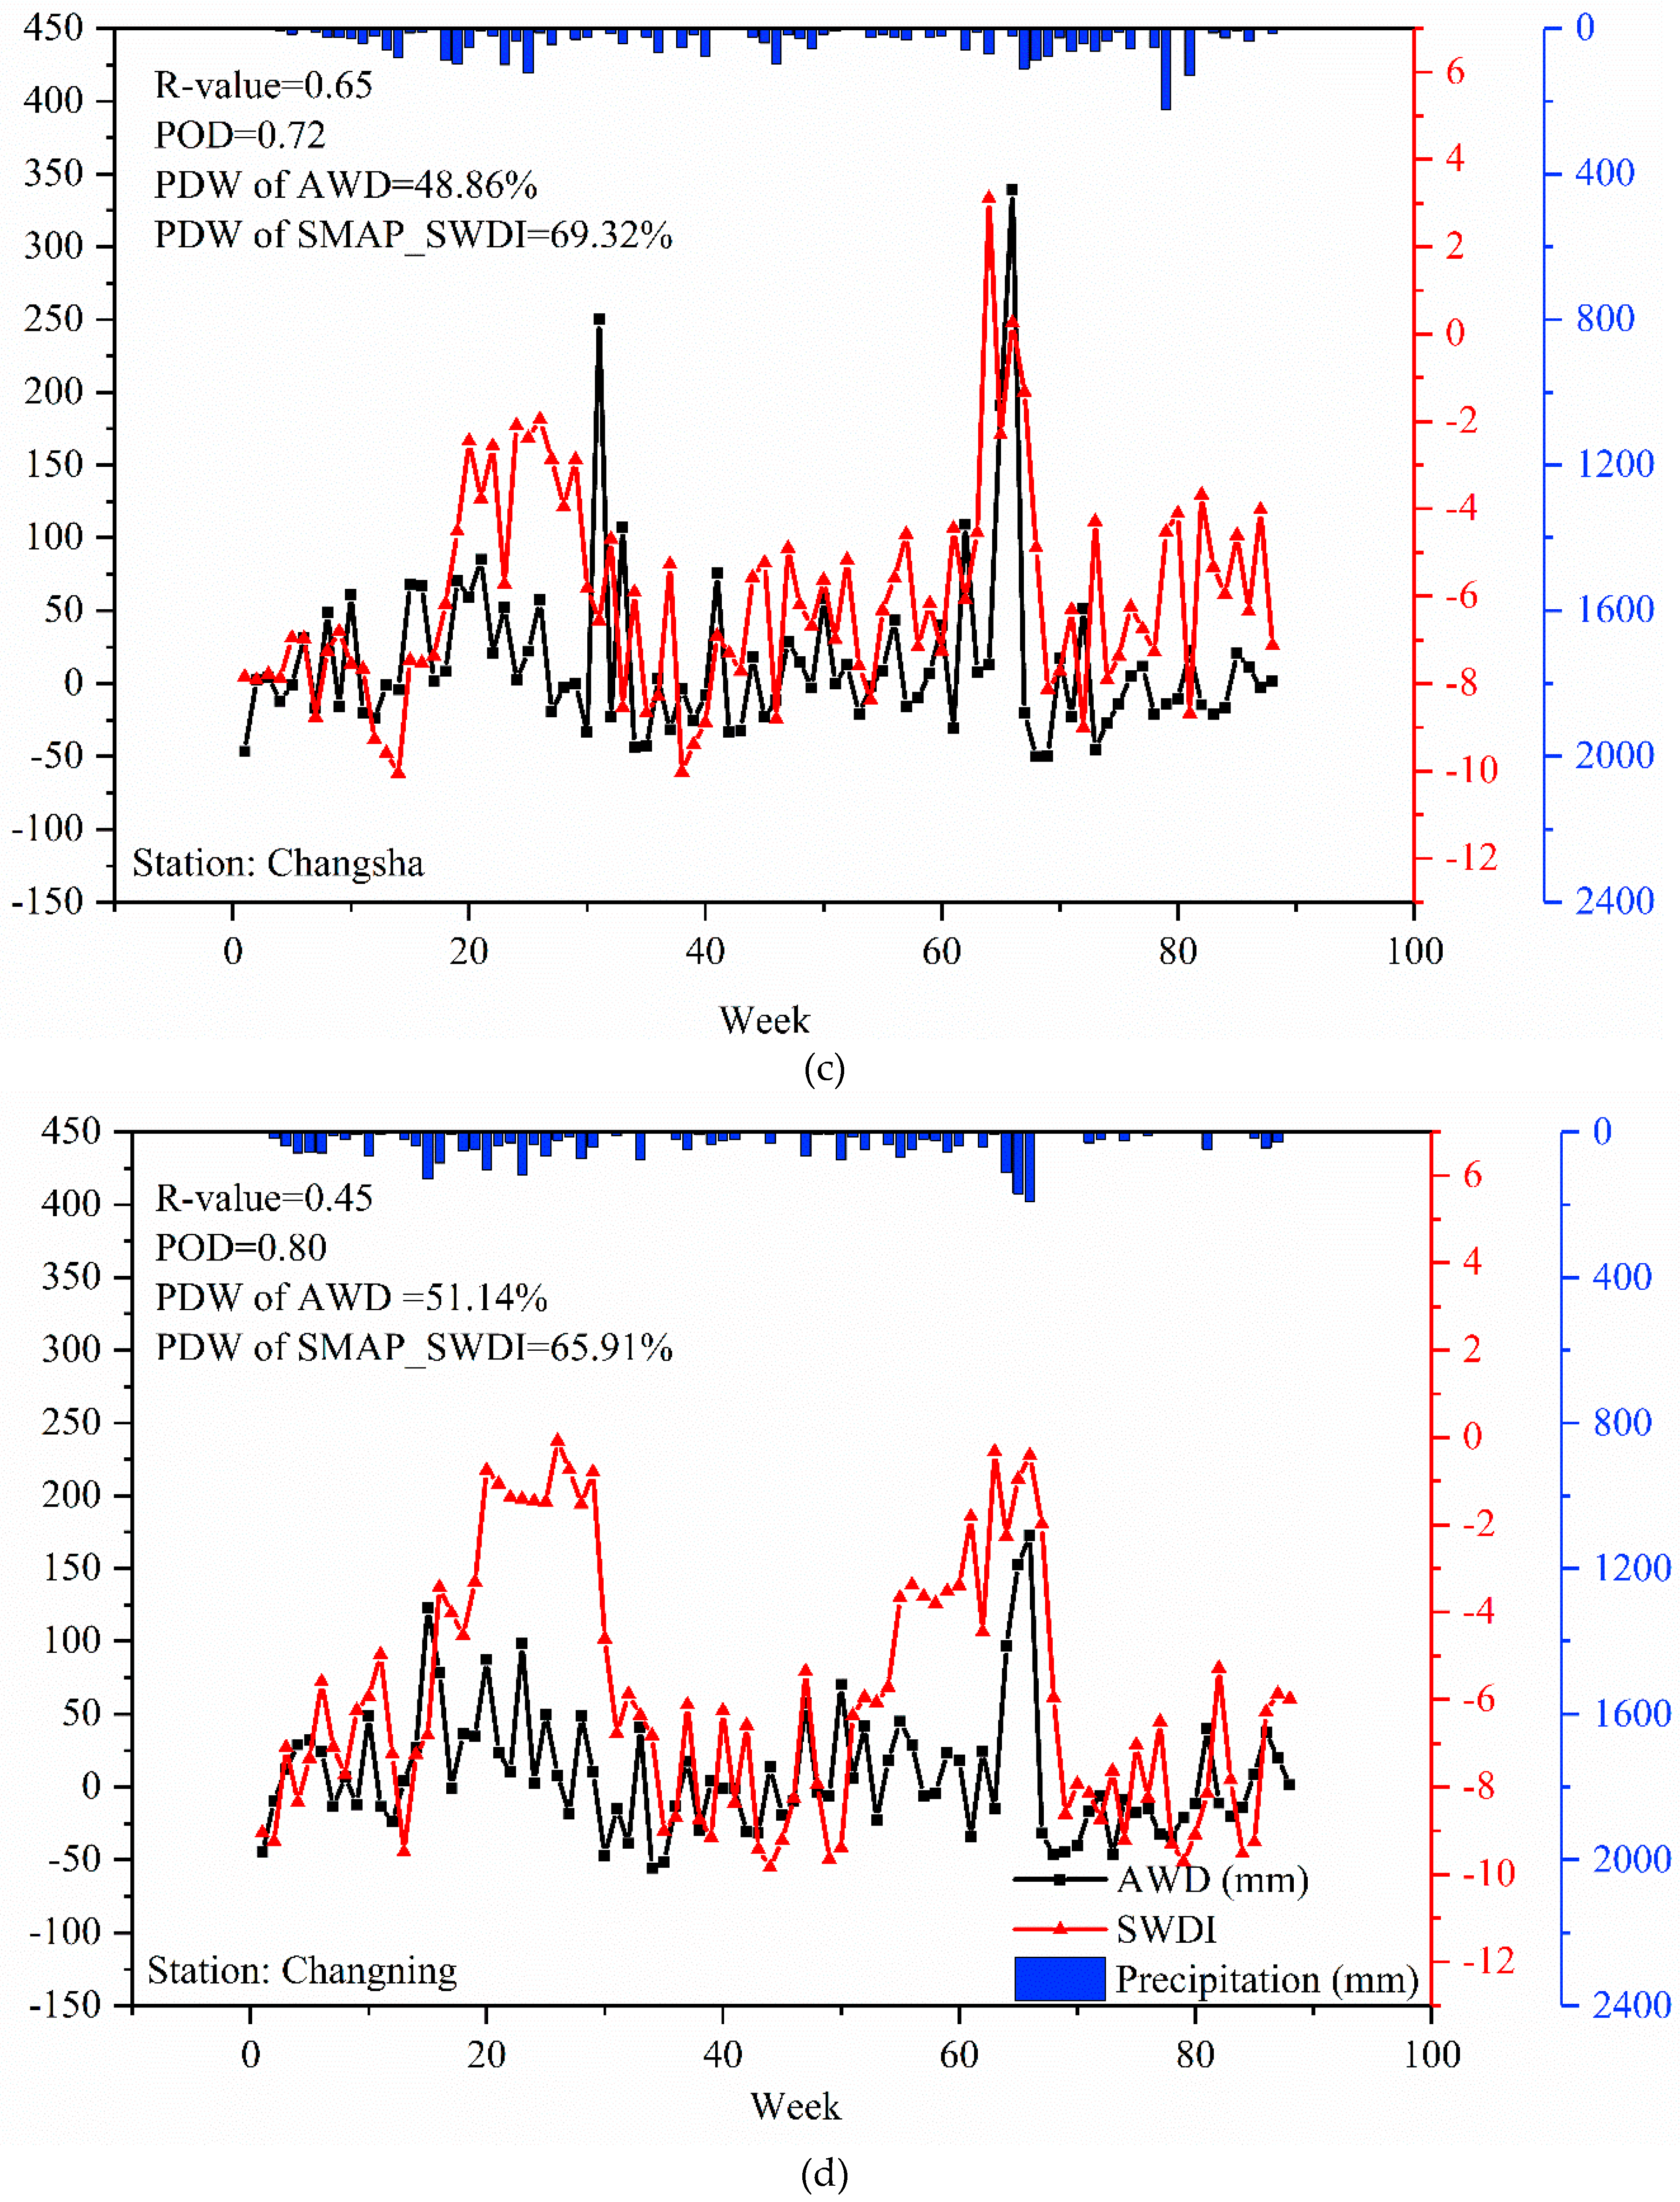
4.3. Comparison between SMAP_SWDI and AWD

To verify the reliability of SMAP_SWDI, a comparison was conducted with the agricultural drought index AWD. On the one hand, the AWD is a widely applied drought index using atmospheric data. On the other hand, the AWD is a suitable tool to capture drought dynamics related to soil water storage [58]. The AWD is used to evaluate the efficiency of soil moisture from SMAP on agricultural drought monitoring. To estimate the fitting relationship between SMAP_SWDI and AWD at the point scale, 13 stations were chosen from the basin. For each station, the values of R, POD, and PDWs of AWD and SMAP_SWDI are shown in Table 2. The values of R between AWD and SMAP_SWDI varied from 0.42 to 0.68 (average R-value = 0.6). Around six stations performed well (R-value > 0.6) and seven stations performed fairly (0.4 < R-value < 0.6), indicating that there is a relatively high agreement between these two indices. The relatively good correlation between SMAP_SWDI and AWD is similar to the results obtained in several previous studies [12,57]. The highest value of R was observed at Yongzhou Station (R-value = 0.68), and its POD was 0.79. The lowest value of R belonged to Yuanjiang (R-value = 0.43) with a very low value of POD (0.23). Almost every station performed reasonably on POD, varying from 0.7 to 0.93, except Chenzhou and Yuanjiang. The best performance was observed at Nanyue Station with the value of 0.93. The results indicate that SMAP_SWDI shows a good capture of AWD in the detection of drought.
In addition, a drought week is defined when SMAP_SWDI is lower than −5 or AWD is lower than 0 mm [12]. It can be observed that the PDWs obtained by SWDI were higher than that obtained by AWD at most stations. This is similar to the conclusions obtained from a previous study [55] From Table 2, about 11 stations show high PDWs with SMAP_SWDI. Figure 9 shows the distribution of the numbers of PDWs of AWD and SMAP_SWDI in four intervals. We can see that the proportion of PDWs obtained by SMAP_SWDI was mainly between 50% and 75%, while that of AWD was between 25% and 50%. These indicate that SMAP may overestimate PDWs compared to in situ AWD.
The weekly evolution of AWD and SMAP_SWDI at randomly selected stations is shown in Figure 10. Stations Malingpo (Figure 10a), Pingjiang (Figure 10b), Changsha (Figure 10c), and Changning (Figure 10d) are selected as examples, with the values of R varying from 0.45 to 0.6. Figure 10 illustrates that SMAP_SWDI and AWD displayed similar seasonal cycles. This result is due to the top 5 cm surface soil moisture being directly related to the atmospheric water content [64].
Among these four sites, Changning (Figure 10d) showed relatively worse performance compared with the other three stations. From Figure 10a–c, the values of weekly SMAP_SWDI and AWD were much higher when the basin experienced weekly heavy rainfall. The values of AWD were more sensitive to heavy rainfall according to Figure 10b,c. The changes of values of SMAP_SWDI and AWD were consistent with rainfall dynamics, especially among the weeks of precipitation peaks and droughts.

5. Conclusions

In this study, the accuracy of satellite-based soil moisture from SMAP was evaluated with the soil moisture from CLSMDAS used as the reference dataset. In addition, the potential applications of SMAP for drought monitoring in the Xiang River Basin was investigated with a specific agricultural drought index (SWDI). A temporal and spatial analysis was conducted by comparing the SMAP_SWDI and the AWD based on meteorological variables. These two indices were estimated weekly and compared in the growing season (April to November) from 2015 to 2017. The main conclusions are as follows:
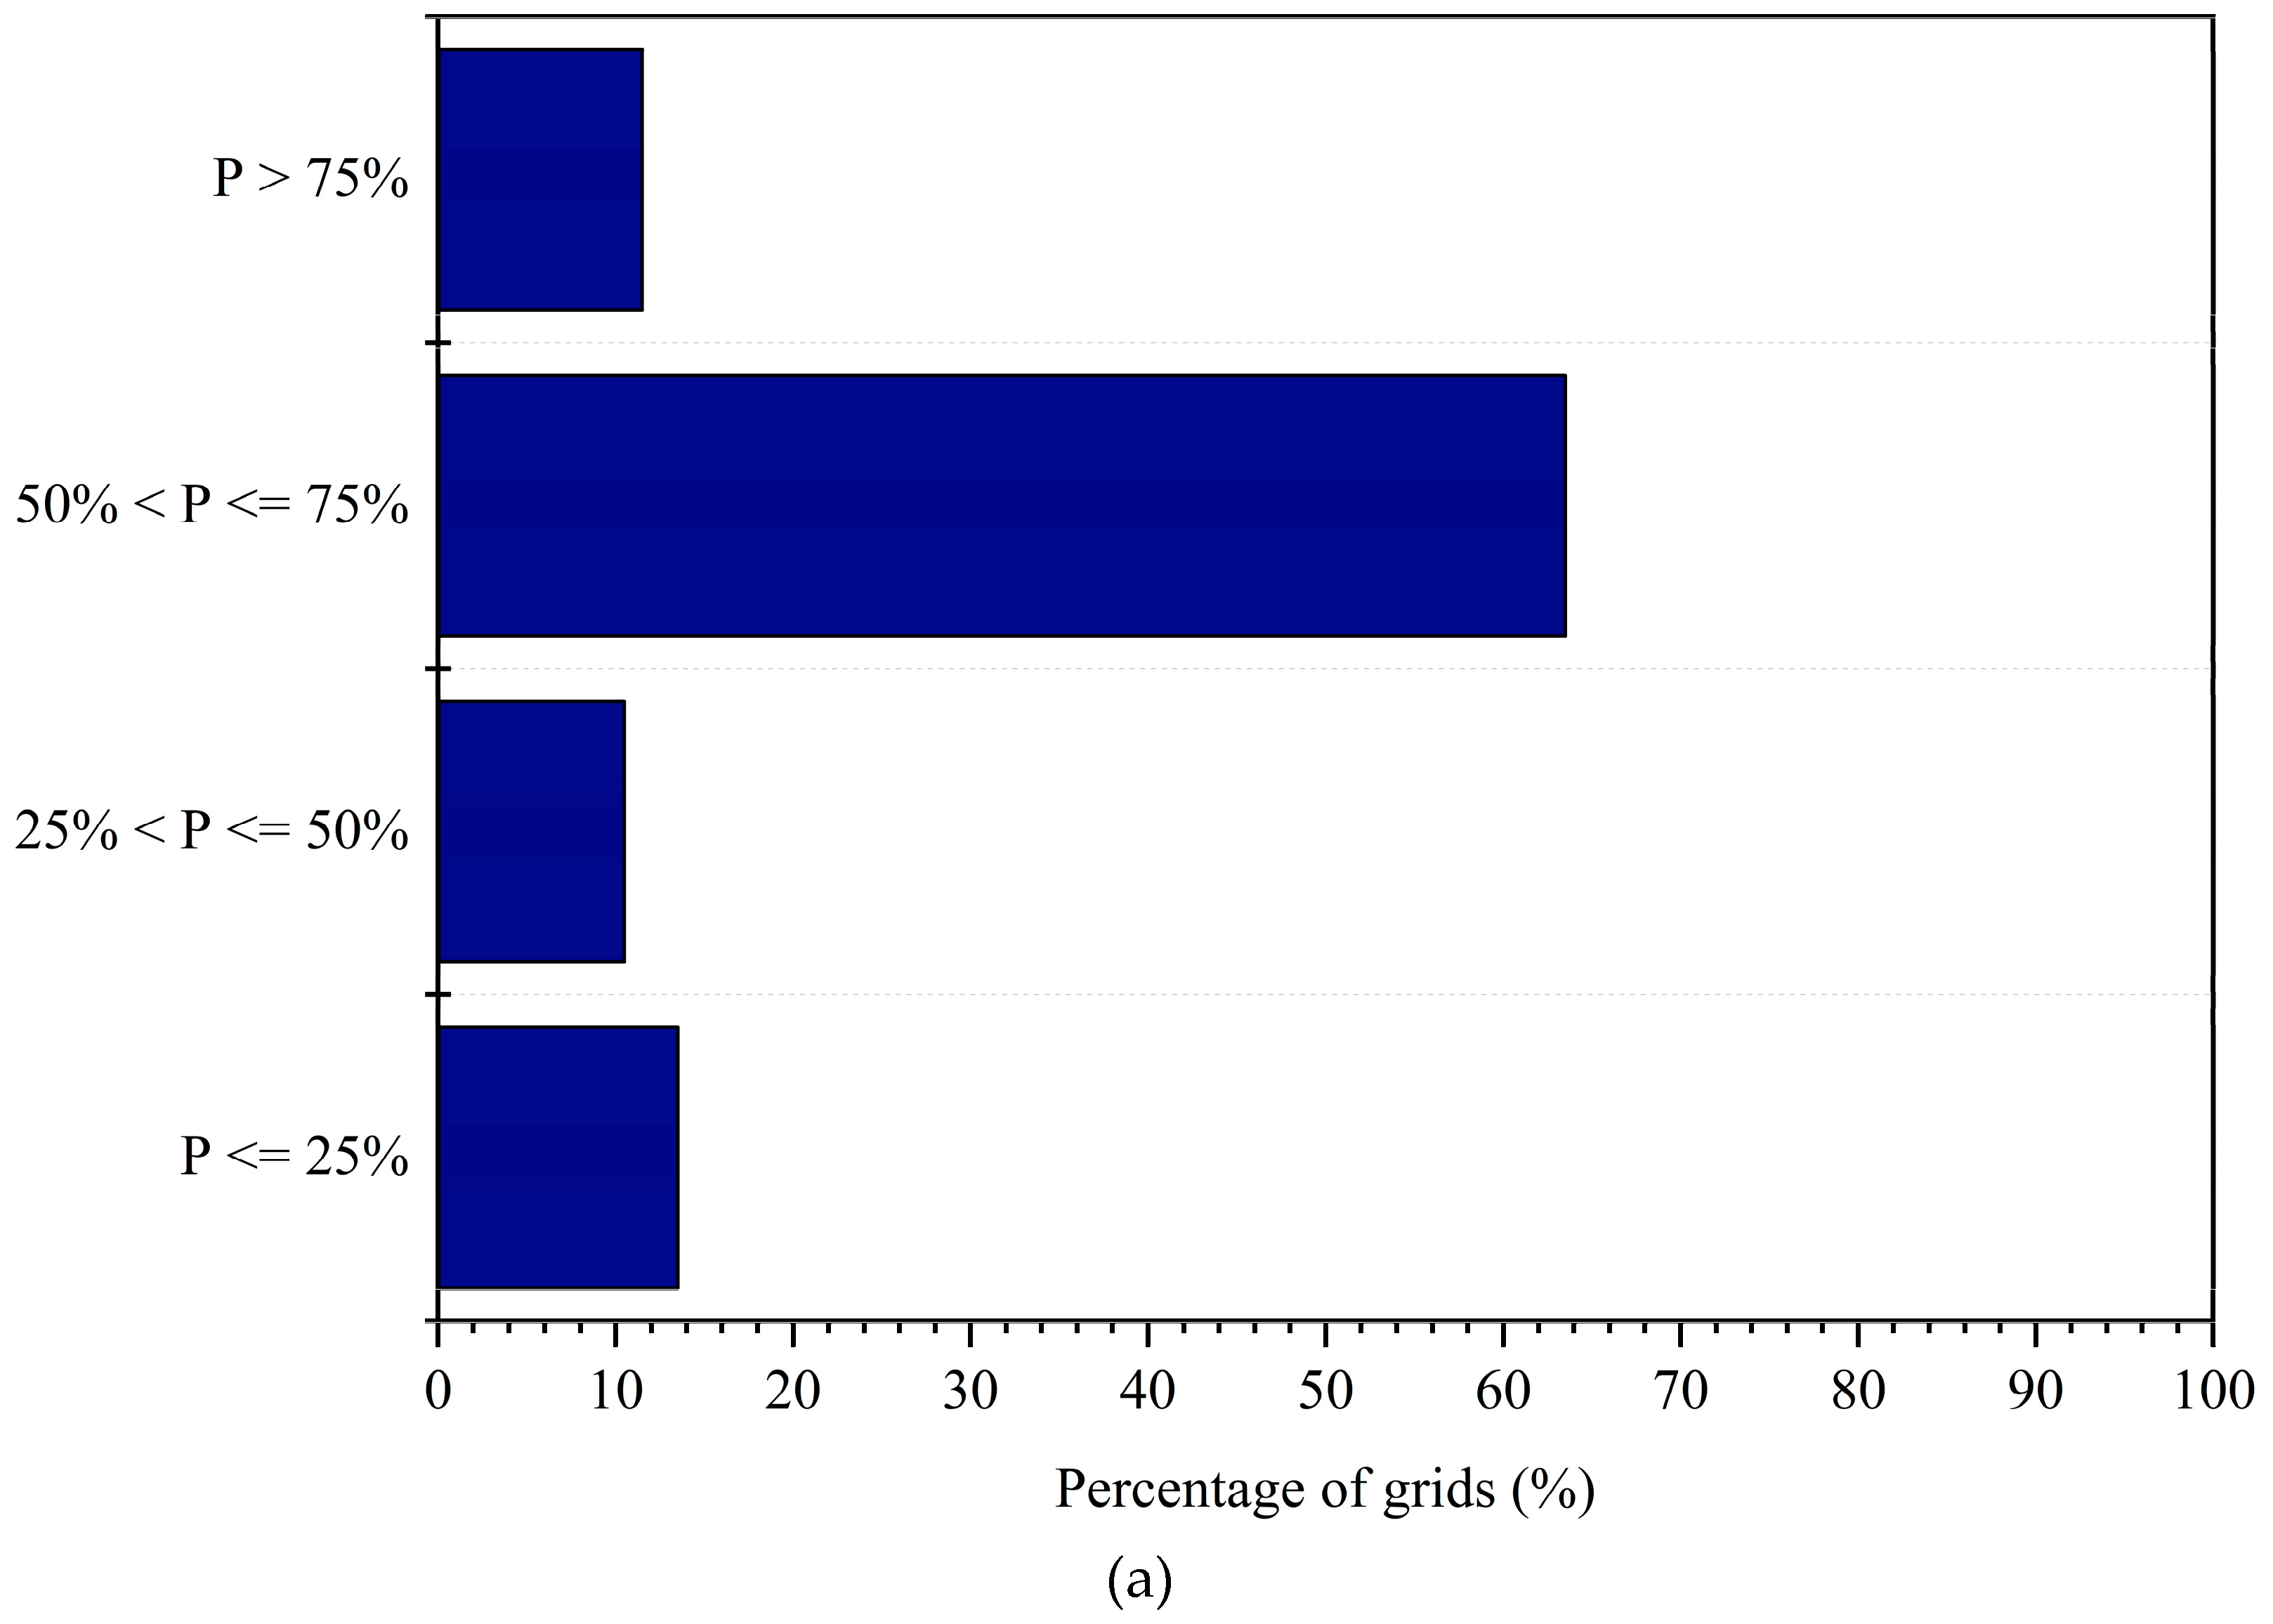
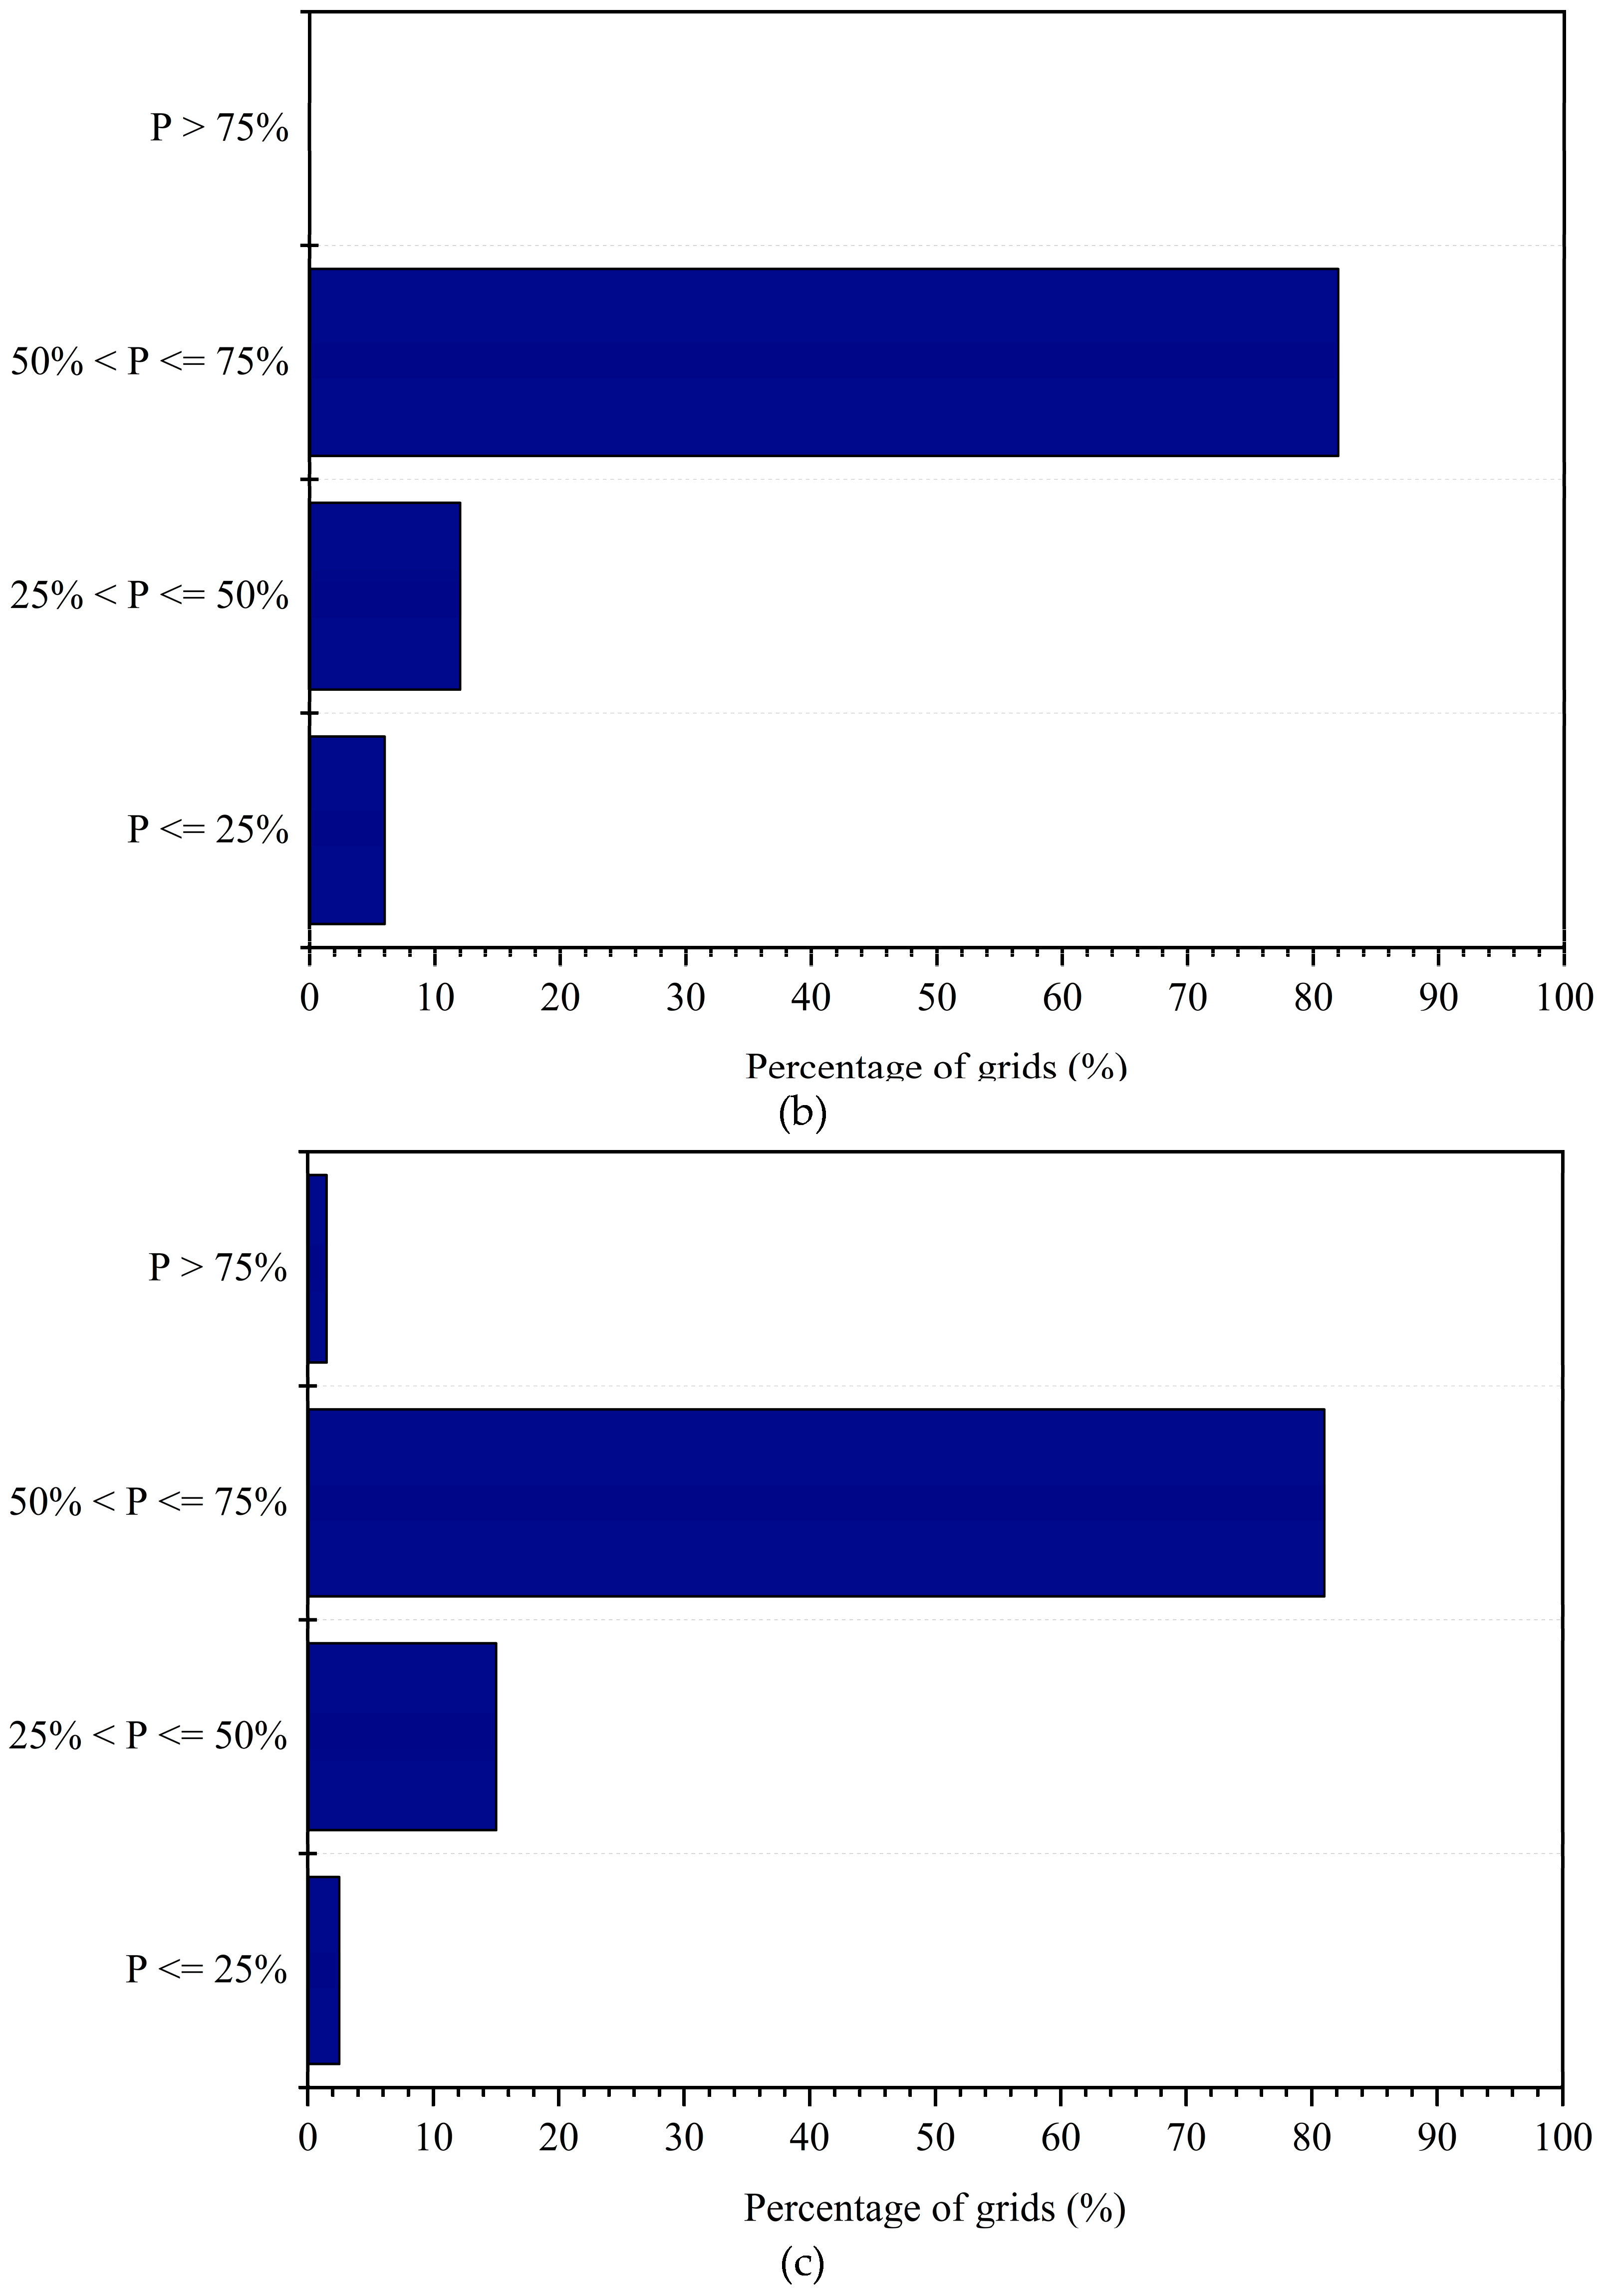
  • The SMAP soil moisture had acceptable accuracy and relatively good performance in most of Xiang River Basin. In terms of R-values between the soil moisture datasets obtained from CLSMDAS and SMAP, around 70% performed well and only 10% performs poorly at the grid sale. At the regional scale, the SMAP soil moisture captured the features of CLSMDAS soil moisture with the R-value 0.62.
  • Severe droughts mainly occurred from mid-June to the end of September. The severity of droughts gradually decreased in mid-May from 2015 to 2016. Severe droughts were only detected in the south and northeast of the Xiang River Basin in 2015. Early August of 2016 suffered the most severe and wide range of droughts, with the driest area mainly concentrated in the northern part of the basin. Severe drought was mainly concentrated in the northern part of the Xiang River Basin at the end of November during 2015 and 2017.
  • The SMAP showed relatively good performance in drought monitoring in the Xiang River Basin with a high Pearson correlation coefficient (mean value equals to 0.6) and high drought weeks probability of detection (vary from 0.7 to 0.9) between SWDI and AWD.

Author Contributions

Conceptualization, Q.Z. and Y.L.; methodology, Y.T.; software, Y.-P.X.; validation, Q.Z., Y.-P.X. and Y.L.; formal analysis, Y.L.; investigation, Q.Z.; resources, Y.T.; data curation, Y.T.; writing—original draft preparation, Y.L.; writing—review and editing, Q.Z.; visualization, Y.T.; supervision, Q.Z.; project administration, Q.Z.; funding acquisition, Q.Z.

Funding

This study was financially supported by the Natural Science Foundation of Jiangsu Province (BK20180403) and the National Key Research and Development Plan “Inter-Government Cooperation in International Scientific and Technological Innovation” (2016YFE0122100).

Acknowledgments

Thank the National Meteorological Information Center of China Meteorological Administration for archiving the observed climate data (http://data.cma.cn/.). Thank the National Aeronautics Space Agency for providing the satellite soil moisture data (https://earthdata.nasa.gov/.). Authors have great thanks to the anonymous reviewers for providing so valuable comments.

Conflicts of Interest

The authors declare no conflict of interest.

References

  1. Tian, Y.; Xu, Y.P.; Wang, G. Agricultural drought prediction using climate indices based on Support Vector Regression in Xiangjiang River basin. Sci. Total Environ. 2018, 622, 710–720. [Google Scholar] [CrossRef] [PubMed]
  2. Zhong, R.; Chen, X.; Lai, C.; Wang, Z.; Lian, Y.; Yu, H.; Wu, X. Drought monitoring utility of satellite-based precipitation products across mainland China. J. Hydro. 2019, 568, 343–359. [Google Scholar] [CrossRef]
  3. Quiring, S.M.; Papakryiakou, T.N. An evaluation of agricultural drought indices for the Canadian prairies. Agric. For. Meteorol. 2003, 118, 49–62. [Google Scholar] [CrossRef]
  4. Wu, H.; Wilhite, D. An Operational Agricultural Drought Risk Assessment Model for Nebraska, USA. Nat. Hazards. 2004, 33, 1–21. [Google Scholar] [CrossRef] [Green Version]
  5. Rhee, J.Y.; Im, J.H.; Carbone, G.J. Monitoring agricultural drought for arid and humid regions using multi-sensor remote sensing data. Remote Sens. Environ. 2010, 114, 2875–2887. [Google Scholar] [CrossRef]
  6. Gao, X.X.; Wei, S.U.; Huang, W.H.; Kui-Dong, L.U.; Gao, S. Integrated Assessment for Agricultural Risk of Drought Disaster in Hunan Province Based on GIS. Hunan Agric. Sci. 2010, 23, 158–162. [Google Scholar]
  7. Zhang, J.M.; Liao, Y.F.; Peng, J.D.; Zhou, J.J.; Tan, X.; Center, H.C.; Bureau, Z.M. Spatial and Temporal Variation of Meteorological Drought Days in Hunan Province. Chin. J. Agrometeorol. 2013, 34, 621–628. [Google Scholar]
  8. Hosseinizadeh, A.; Seyedkaboli, H.; Zareie, H.; Akhondali, A.; Farjad, B. Impact of climate change on the severity, duration, and frequency of drought in a semi-arid agricultural basin. Geoenviron. Disaster. 2015, 2, 1–9. [Google Scholar] [CrossRef]
  9. Paredes-Trejo, F.; Barbosa, H. Evaluation of the SMOS-Derived Soil Water Deficit Index as Agricultural Drought Index in Northeast of Brazil. Water 2017, 9, 377. [Google Scholar] [CrossRef]
  10. Zhang, X.; Tang, Q.; Liu, X.; Leng, G.; Zhe, L. Soil moisture drought monitoring and forecasting using satellite and climate model data over Southwest China. J. Hydrometeorol. 2017, 18, 5–23. [Google Scholar] [CrossRef]
  11. Park, S.; Im, J.; Park, S.; Rhee, J. Drought monitoring using high resolution soil moisture through multi-sensor satellite data fusion over the Korean peninsula. Agric. For. Meteorol. 2017, 237, 257–269. [Google Scholar] [CrossRef]
  12. Mishra, A.; Vu, T.; Valiyaveettil, A.; Entekhabi, D. Drought Monitoring with Soil Moisture Active Passive (SMAP) Measurements. J. Hydrol. 2017, 552, 620–632. [Google Scholar] [CrossRef]
  13. Liu, D.; Mishra, A.K.; Yu, Z. Evaluating uncertainties in multi-layer soil moisture estimation with support vector machines and ensemble Kalman filtering. J. Hydrol. 2016, 538, 243–255. [Google Scholar] [CrossRef] [Green Version]
  14. Njoku, E.G.; Entekhabi, D. Passive microwave remote sensing of soil moisture. Remote Sens. Environ. 1996, 184, 135–151. [Google Scholar] [CrossRef]
  15. Xi, J.; Wen, J.; Hui, T.; Zhang, T. Applicability evaluation of AMSR-E remote sensing soil moisture products in Qinghai-Tibet plateau. Trans. Chin. Soc. Agric. Eng. 2014, 30, 194–202. [Google Scholar]
  16. Zhuang, Y.; Shi, C.; Shen, R.; Jiang, L.; Wang, S. Quality evaluation of multi-microwave remote sensing soil moisture products over China. J. Meteorol. Sci. 2015, 35, 289–296. [Google Scholar]
  17. Chew, C.C.; Small, E.E. Soil Moisture Sensing Using Spaceborne GNSS Reflections: Comparison of CYGNSS Reflectivity to SMAP Soil Moisture. Geophys. Res. Lett. 2018, 45, 4049–4057. [Google Scholar] [CrossRef]
  18. Kim, H.; Lakshmi, V. Use of Cyclone Global Navigation Satellite System (CyGNSS) Observations for Estimation of Soil Moisture. Geophys. Res. Lett. 2018, 45, 8272–8282. [Google Scholar] [CrossRef]
  19. Wang, Q.; Fan, J.; Wang, S.; Yong, C.; Ge, J.; You, W. Application and accuracy of cosmic-ray neutron probes in three soil textures on the Loess Plateau, China. J. Hydrol. 2019, 569, 449–461. [Google Scholar] [CrossRef]
  20. Jakobi, J.; Huisman, J.A.; Vereecken, H.; Diekkrüger, B.; Bogena, H.R. Cosmic Ray Neutron Sensing for Simultaneous Soil Water Content and Biomass Quantification in Drought Conditions. Water Resour. Res. 2018, 54, 7383–7402. [Google Scholar] [CrossRef]
  21. Nguyen, H.H.; Kim, H.; Choi, M. Evaluation of the soil water content using cosmicray neutron probe in a heterogeneous monsoon climate-dominated region. Adv. Water Resour. 2017, 108, 125–138. [Google Scholar] [CrossRef]
  22. Ahlmer, A.K.; Cavalli, M.; Hansson, K.; Koutsouris, A.J.; Crema, S.; Kalantari, Z. Soil moisture remote-sensing applications for identification of flood-prone areas along transport infrastructure. Environ. Earth Sci. 2018, 77. [Google Scholar] [CrossRef]
  23. Bindlish, R.; Crow, W.T.; Jackson, T.J. Role of Passive Microwave Remote Sensing in Improving Flood Forecasts. IEEE Geosci. Remote Sens. Lett. 2009, 6, 112–116. [Google Scholar] [CrossRef]
  24. Feng, Y.; Hao, Q.Z.; Song, L.M.; Jiao, W.Y. Progress in soil moisture estimation from remote sensing data for agricultural drought monitoring. J. Nat. Disaster. 2006, 15, 114–121. [Google Scholar]
  25. Su, Z.; Yacob, A.; Wen, J.; Roerink, G.; He, Y.; Gao, B.; Boogaard, H.; Diepen, C.V. Assessing relative soil moisture with remote sensing data: theory, experimental validation, and application to drought monitoring over the North China Plain. Phys. Chem. Earth. 2003, 28, 89–101. [Google Scholar] [CrossRef]
  26. Zhang, Y.; Hong, Y.; Wang, X.G.; Gourley, J.J.; Gao, J.D.; Vergara, H.J.; Yong, B. Assimilation of Passive Microwave Streamflow Signals for Improving Flood Forecasting: A First Study in Cubango River Basin, Africa. IEEE J. Sel. Top. Appl. Earth Obs. Remote Sens. 2013, 6, 2375–2390. [Google Scholar] [CrossRef]
  27. Brocca, L.; Ciabatta, L.; Massari, C.; Moramarco, T.; Hahn, S.; Hasenauer, S.; Kidd, R.; Dorigo, W.; Wagner, W.; Levizzani, V. Soil as a natural rain gauge: Estimating global rainfall from satellite soil moisture data. J. Geophys. Res. Atmos. 2014, 119, 5128–5141. [Google Scholar] [CrossRef] [Green Version]
  28. Lu, H.; Wang, W.; Tian, F.; Yang, K. In Improving satellite rainfall estimates over Tibetan plateau using in situ soil moisture observation and SMAP retrievals. Geosci. Remote Sens. Sym. 2017. [Google Scholar] [CrossRef]
  29. Brocca, L.; Moramarco, T.; Dorigo, W.; Wagner, W. In Assimilation of satellite soil moisture data into rainfall-runoff modeling for several catchments worldwide. Geosci. Remote Sens. Sym. 2014. [Google Scholar] [CrossRef]
  30. Brocca, L.; Moramarco, T.; Melone, F.; Wagner, W.; Hasenauer, S.; Hahn, S. Assimilation of Surface- and Root-Zone ASCAT Soil Moisture Products Into Rainfall-Runoff Modeling. IEEE Trans. Geosci. Remote Sens. 2012, 50, 2542–2555. [Google Scholar] [CrossRef]
  31. Lopez, P.L.; Wanders, N.; Schellekens, J.; Renzullo, L.J.; Sutanudjaja, E.H.; Bierkens, M.F.P. Improved large-scale hydrological modelling through the assimilation of streamflow and downscaled satellite soil moisture observations. Hydrol. Earth Syst. Sci. 2016, 12, 10559–10601. [Google Scholar] [CrossRef]
  32. Wagner, W.; Hahn, S.; Kidd, R.; Melzer, T.; Bartalis, Z.; Hasenauer, S.; Figa, J.; De, R.P.; Jann, A.; Schneider, S. The ASCAT Soil Moisture Product: A Review of its Specifications, Validation Results, and Emerging Applications. Meteorologische Zeitschrift. 2013, 22, 5–33. [Google Scholar] [CrossRef]
  33. Bartalis, Z.; Wagner, W.; Naeimi, V.; Hasenauer, S.; Scipal, K.; Bonekamp, H.; Figa, J.; Anderson, C. Initial soil moisture retrievals from the METOP-A advanced scatterometer (ASCAT). Geophys. Res. Lett. 2007, 34. [Google Scholar] [CrossRef]
  34. Bai, J.; Cui, Q.; Chen, D.; Yu, H.; Mao, X.; Meng, L.; Cai, Y. Assessment of the SMAP-Derived Soil Water Deficit Index (SWDI-SMAP) as an Agricultural Drought Index in China. Remote Sens. 2018, 10, 1302. [Google Scholar] [CrossRef]
  35. Colliander, A.; Fisher, J.B.; Halverson, G.; Merlin, O.; Misra, S.; Bindlish, R.; Jackson, T.J.; Yueh, S. Spatial Downscaling of SMAP Soil Moisture Using MODIS Land Surface Temperature and NDVI During SMAPVEX15. IEEE Geosci. Remote Sens. Lett. 2017, 99, 1–5. [Google Scholar] [CrossRef]
  36. Gruber, A.; Su, C.H.; Zwieback, S.; Crow, W.; Dorigo, W.; Wagner, W. Recent advances in (soil moisture) triple collocation analysis. Int. J. Appl. Earth Obs. Geoinform. 2016, 45, 200–211. [Google Scholar] [CrossRef]
  37. Liu, D.; Mishra, A.K.; Yu, Z.; Yang, C.; Konapala, G.; Vu, T. Performance of SMAP, AMSR-E and LAI for weekly agricultural drought forecasting over continental United States. J. Hydrol. 2017, 553, 88–104. [Google Scholar] [CrossRef]
  38. Kim, H.; Parinussa, R.; Konings, A.G.; Wagner, W.; Zohaib, M. Global-scale assessment and combination of SMAP with ASCAT (active) and AMSR2 (passive) soil moisture products. Remote Sens. Environ. 2018, 204, 260–277. [Google Scholar] [CrossRef]
  39. Su, C.H.; Ryu, D.; Crow, W.T.; Western, A.W. Beyond triple collocation: Applications to soil moisture monitoring. J. Geophys. Res. Atmos. 2014, 119, 6419–6439. [Google Scholar] [CrossRef] [Green Version]
  40. Cui, C.; Xu, J.; Zeng, J.; Chen, K.-S.; Bai, X.; Lu, H.; Chen, Q.; Zhao, T. Soil Moisture Mapping from Satellites: An Intercomparison of SMAP, SMOS, FY3B, AMSR2, and ESA CCI over Two Dense Network Regions at Different Spatial Scales. Remote Sens. 2018, 10, 33. [Google Scholar] [CrossRef]
  41. Konings, A.G.; Piles, M.; Das, N.; Entekhabi, D. L-band vegetation optical depth and effective scattering albedo estimation from SMAP. Remote Sens. Environ. 2017, 198, 460–470. [Google Scholar] [CrossRef]
  42. Sánchez, N.; Martínez-Fernández, J.; Calera, A.; Torres, E.; Pérez-Gutiérrez, C. Combining remote sensing and in situ soil moisture data for the application and validation of a distributed water balance model (HIDROMORE). Agric. Water Manag. 2010, 98, 69–78. [Google Scholar] [CrossRef]
  43. Zhang, J.; Li, Z.; Zhang, X. Characteristics of Drought and Flood Climate Changes of Xiangjiang River Basin in Recent 50 Years. J. Catastrophol. 2009, 24, 95–101. [Google Scholar]
  44. Zhang, T.; Zhang, X.; Wu, H.; Shen, L. Analysis of Pan Evaporation Trend and Its Influence Factors in Xiangjiang River Basin. Progressus Inquisitiones De Mutatione Climatis. 2013, 9, 35–42. [Google Scholar]
  45. Ma, C.; Pan, S.; Wang, G.; Liao, Y.; Xu, Y.P. Changes in precipitation and temperature in Xiangjiang River Basin, China. Theor. Appl. Climatol. 2016, 123, 1–13. [Google Scholar] [CrossRef]
  46. Velpuri, N.M.; Senay, G.B.; Morisette, J.T. Evaluating New SMAP Soil Moisture for Drought Monitoring in the Rangelands of the US High Plains. Rangelands 2016, 38, 183–190. [Google Scholar] [CrossRef] [Green Version]
  47. Juan, D.U.; Fei, H.E.; Shi, P.J. Integrated flood risk assessment of Xiangjiang River Basin in China. J. Nat. Disaster. 2006, 15, 38–44. [Google Scholar]
  48. Shi, C.X.; Xie, Z.H.; Hui, Q.; Liang, M.L.; Yang, X.C. China land soil moisture EnKF data assimilation based on satellite remote sensing data. Sci. Chin. 2011, 54, 1430–1440. [Google Scholar] [CrossRef]
  49. Chen, Z.; Chunxiang, S.; Lin, X.; Xiaolong, H. Simulation and Assessment of Soil Moisture at Different Depths in China Area. Available online: http://en.cnki.com.cn/Article_en/CJFDTotal-QXKJ201303020.htm (accessed on 10 February 2019).
  50. Shi, C.; Xie, Z. A Time Downscaling Scheme of Precipitation by Using Geostationary Meteorological Satellite Data. Available online: http://en.cnki.com.cn/Article_en/CJFDTotal-DLKJ200804003.htm (accessed on 10 February 2019).
  51. Chen, F.; Crow, W.T.; Colliander, A.; Cosh, M.H.; Jackson, T.J.; Bindlish, R.; Reichle, R.H.; Chan, S.K.; Bosch, D.D.; Starks, P.J. Application of Triple Collocation in Ground-Based Validation of Soil Moisture Active/Passive (SMAP) Level 2 Data Products. IEEE J. Sele. Top. Appl. Earth Obs. Remote Sens. 2017, 10, 489–502. [Google Scholar] [CrossRef]
  52. Martínez-Fernández, J.; González-Zamora, A.; Sánchez, N.; Gumuzzio, A. A soil water based index as a suitable agricultural drought indicator. J. Hydrol. 2015, 522, 265–273. [Google Scholar] [CrossRef]
  53. Martínez-Fernández, J.; González-Zamora, A.; Sánchez, N.; Gumuzzio, A.; Herrero-Jiménez, C.M. Satellite soil moisture for agricultural drought monitoring: Assessment of the SMOS derived Soil Water Deficit Index. Remote Sens. Environ. 2016, 177, 277–286. [Google Scholar] [CrossRef]
  54. Pablos, M.; Martínez-Fernández, J.; Sánchez, N.; González-Zamora, Á. Temporal and Spatial Comparison of Agricultural Drought Indices from Moderate Resolution Satellite Soil Moisture Data over Northwest Spain. Remote Sens. 2017, 9, 1168. [Google Scholar] [CrossRef]
  55. Martínez-Fernández, J.; Sánchez, N.; González-Zamora, Á.; Gumuzzio, Á.; Herrero-Jiménez, C.M. Feasibility of the SMOS soil moisture for agricultural drought monitoring: Assessment with the Soil Water Deficit Index. Geosci. Remote Sens. Sym. 2015, 976–979. [Google Scholar] [CrossRef]
  56. Torres, G.M.; Lollato, R.P.; Ochsner, T.E. Comparison of Drought Probability Assessments Based on Atmospheric Water Deficit and Soil Water Deficit. Agron. J. 2013, 105, 428–436. [Google Scholar] [CrossRef]
  57. Moran, M.S.; Rahman, A.F.; Washburne, J.C.; Goodrich, D.C.; Weltz, M.A. Combining the Penman-Monteith equation with measurements of surface temperature and reflectance to estimate evaporation rates of semiarid grassland. Agric. For. Meteorol. 1996, 80, 87–109. [Google Scholar] [CrossRef]
  58. Liu, W.J.; Liu, C.Q.; Zhao, Z.Q.; Xu, Z.F.; Liang, C.S.; Li, L.B.; Feng, J.Y. Elemental and strontium isotopicgeochemistry of the soil profiles developed on limestone and sandstone in karstic terrain on Yunnan-GuizhouPlateau, China: Implications for chemical weathering and parent materials. J. Asian Earth Sci. 2013, 67, 138–152. [Google Scholar] [CrossRef]
  59. Wang, J.; Zou, B.; Liu, Y.; Tang, Y.; Zhang, X.; Yang, P. Erosion-creep-collapse mechanism of underground soilloss for the karst rocky desertification in Chenqi village, Puding county, Guizhou, China. Environ. Earth Sci. 2014, 72, 2751–2764. [Google Scholar] [CrossRef]
  60. Chan, S.; Bindlish, R.; O’Neill, P.E.; Njoku, E.; Jackson, T.; Colliander, A.; Chen, F.; Burgin, M.; Dunbar, S.; Piepmeier, J.; et al. Assessment of the SMAP Passive Soil Moisture Product. IEEE Trans. Geosci. Remote Sens. 2016, 54, 1–14. [Google Scholar] [CrossRef]
  61. Bo, C.; Fang, W.H.; Fei, H.E.; Shi, P.J. Relationship between flood/waterlogging disaster and rainfall in Xiangjiang River Basin. J. Nat. Disaster. 2008, 17, 92–96. [Google Scholar]
  62. Xiao, Y.; Tang, S.; Chen, H.; Linjuan, H.U. Temporal and spatial trends of precipitation and temperature from 1960 to 2008 in Xiangjiang River Basin. Available online: http://en.cnki.com.cn/Article_en/CJFDTotal-RIVE201303003.htm (accessed on 10 February 2019).
  63. Zou, X.; Ren, G. Droughts Variations in China Based on a Compound Index of Meteorological Drought. Clim. Environ. Res. 2010, 15, 371–378. [Google Scholar]
  64. Srivastava, P.K. Satellite Soil Moisture: Review of Theory and Applications in Water Resources. Water Resour. Management. 2017, 31, 3161–3176. [Google Scholar] [CrossRef]
Figure 1. Xiang River Basin and distribution of the meteorological stations.
Remotesensing 11 00362 g001
Figure 2. R-values (a) and BIAS (b) values between Soil Moisture Active Passive (SMAP) soil moisture and China Land Soil Moisture Data Assimilation System (CLSMDAS) soil moisture datasets.
Remotesensing 11 00362 g002
Figure 3. Regional comparison between SMAP soil moisture and CLSMDAS soil moisture.
Remotesensing 11 00362 g003
Figure 4. Weekly time series of SMAP_SWDI in the Xiang River Basin.
Remotesensing 11 00362 g004
Figure 5. Average monthly temperature and potential evapotranspiration from April to November between 2015 and 2017.
Remotesensing 11 00362 g005
Figure 6. Spatial distribution of SMAP_SWDI during mid-May, early August, and at the end of November in the Xiang River Basin from 2015 to 2017.
Remotesensing 11 00362 g006
Figure 7. Spatial distribution of percentage of drought weeks (PDWs) (%) in 2015 (a), 2016 (b), and 2017 (c), respectively.
Remotesensing 11 00362 g007aRemotesensing 11 00362 g007b
Figure 8. The percentage of grids in the four intervals of PDWs for 2015 (a), 2016 (b), and 2017 (c).
Remotesensing 11 00362 g008aRemotesensing 11 00362 g008b
Figure 9. Distribution of the PDWs of atmospheric water deficit (AWD) and SMAP_SWDI in four intervals.
Remotesensing 11 00362 g009
Figure 10. Time series of weekly rainfall, SMAP_SWDI and AWD for four of the 13 sites.
Remotesensing 11 00362 g010aRemotesensing 11 00362 g010b
Table 1. Classification of soil water deficit index (SWDI) for different drought categories [53].
SWDIDrought Category
>0No drought
0~−2Mild
−2~−5Moderate
−5~−10Severe
<−10Extreme
Table 2. Values of CC, POD, and PDWs of AWD and SMAP_SWDI in different stations.
StationCCPODPDW of AWD (%)PDW of SMAP_SWDI (%)
Malingpo0.550.7351.4469.32
Pingjiang0.600.8545.4572.73
Changsha0.520.7248.8669.32
Shaoyang0.670.9147.7371.59
Nanyue0.570.9330.6868.18
Hengyang0.570.6853.4162.50
Changning0.450.8051.1465.91
Daoxian0.660.8448.8667.05
Chenzhou0.570.3743.1831.82
Lianxian0.630.7852.2767.05
Yuanjiang0.430.2350.0029.55
Shuangfeng0.620.7150.0059.09
Yongzhou0.680.7947.7363.64

