Article

Toward Content-Based Hyperspectral Remote Sensing Image Retrieval (CB-HRSIR): A Preliminary Study Based on Spectral Sensitivity Functions

by
Olfa Ben-Ahmed
*,
Thierry Urruty
,
Noël Richard
and
Christine Fernandez-Maloigne
University of Poitiers, CNRS, XLIM, UMR 7252, F-86000 Poitiers, France
*
Author to whom correspondence should be addressed.
Submission received: 21 January 2019 / Revised: 27 February 2019 / Accepted: 7 March 2019 / Published: 12 March 2019
(This article belongs to the Special Issue Image Retrieval in Remote Sensing)

Abstract

:
With the emergence of huge volumes of high-resolution Hyperspectral Images (HSI) produced by different types of imaging sensors, analyzing and retrieving these images require effective image description and quantification techniques. Compared to remote sensing RGB images, HSI data contain hundreds of spectral bands (varying from the visible to the infrared ranges) allowing profile materials and organisms that only hyperspectral sensors can provide. In this article, we study the importance of spectral sensitivity functions in constructing discriminative representation of hyperspectral images. The main goal of such representation is to improve image content recognition by focusing the processing on only the most relevant spectral channels. The underlying hypothesis is that for a given category, the content of each image is better extracted through a specific set of spectral sensitivity functions. Those spectral sensitivity functions are evaluated in a Content-Based Image Retrieval (CBIR) framework. In this work, we propose a new HSI dataset for the remote sensing community, specifically designed for Hyperspectral remote sensing retrieval and classification. Exhaustive experiments have been conducted on this dataset and on a literature dataset. Obtained retrieval results prove that the physical measurements and optical properties of the scene contained in the HSI contribute in an accurate image content description than the information provided by the RGB image presentation.

Graphical Abstract

1. Introduction

Content-Based Remote Sensing Image Retrieval (CBRSIR) has been an active research field during the last decade [1,2,3,4]. Indeed, data content extraction and quantification are key steps for CBRSIR approaches requiring high quality images and efficient processing methodologies. Traditional RGB-based image representation has been widely used for earth remote sensing scene retrieval and classification [5,6,7]. Nevertheless, such image representation lacks precision that profiles the physical content and properties of the scene.
Hyperspectral Imaging (HSI) is an emerging imaging modality that contains hundreds of contiguous narrow spectral bands covering a wide range of the electromagnetic spectrum from the visible to the infrared domain [8]. Combining the spectral resolution in the visible range (optical properties) and in the infra-red range (physical properties) with a high spatial resolution allows to establish a direct relationship between the spectral image and the physical content of the surface [9] (i.e., vegetation, water, soil, etc.). In fact, the materials of the various components of a scene reflect, absorb, and emit electromagnetic radiation depending of their physical and chemical composition. This radiance measurement data extracted from HSI (here, we consider hyperspectral measurement data as spectral and regular sampling of the captured spectrum, with reduced overlap between the spectral samples/bands, rather than multi-spectral images, which are based on the product of the acquired spectrum by some overlapped spectral functions) requires the use of new methodologies that process and analyze appropriately such massive amount of data. HSI processing techniques have known a rapid development leading to new emerging and active research trends and applications, e.g., remote sensing [10], medical diagnosis [11], and cultural heritage [12]. Therefore, HSI technologies have assisted remote sensing Earth Observation (EO) to stride forward in the past few decades [13].
Extracting deep features from earth remote sensing data has been recently investigated for data classification [14] and retrieval [15]. However, most of the existing approaches were proposed for RGB data description and quantification. Recently, Zhou et al. [16] proposed two deep feature extraction schemes for high-resolution remote sensing image retrieval. In the first scheme, they extracted features from a pre-trained CNN, and in the second one they trained a novel CNN architecture on a large remote sensing dataset in order to learn low dimensional remote sensing features. They concluded that deep features achieve better performance compared to the state-of-the-art hand-crafted features. Deep metric learning for remote sensing image retrieval from large data archives was investigated in [17]. The authors trained a hashing network using a triplet loss for compact binary hash codes representation with a small number of annotated training images. In addition to RGB data, Multispectral data, which involves the acquisition of visible, near infrared, and short-wave infrared images in a relatively small number of spectral bands, has attracted much attention for spectral content extraction from remote sensing data. For example, Li et al. [18] proposed a deep hashing convolutional neural networks to automatically extract the semantic feature for multispectral data. In [19], the authors proposed a content-based retrieval framework for large scale multispectral data. They used a public satellite image dataset, where each image contains four RGB–Near Infrared (NIR) spectral channels on four land cover categories.
However, even if multispectral data provides additional information compared to the RGB data, it usually lacks spectral resolutions necessary to identify chemical and physical structures of a remote sensing scene. Indeed, having a higher level of spectral details in remote sensing images gives better capability to detect such details. Hyperspectral data contains hundreds of spectral bands (varying from the visible to the infrared ranges), hence allowing one to profile materials and organisms that are not available with multispectral data. Recently, when applied to HSI data analysis and description, Deep Neural Networks (DNN) achieved promising results [20]. In order to deal with high-dimensional HSI data and the correlations between spectral bands, a group of traditional approaches start, before learning or extracting features with a Convolutional Neural Network (CNN), by reducing the data dimension or by selecting some bands [21,22,23]. Another group of methods processes the full-band data to extract features from HSI data [20,24,25]. Yet, such band-selection methods lead to important information loss where the full-band ones extend the CNN training time and the feature extraction time.
In the domain of color vision, the process of image content discrimination involves the so-called “Spectral Sensitivity Functions” (SSFs), akin to the animal vision’s system sensitivities [26]. Spectral data projections onto a set of spectral sensitivity functions have been successfully used for HSI data dimensionality reduction and feature extraction [27]. A recent work of Ying et al. [28] designed a CNN-based method, with a selection layer which selects the optimal camera spectral sensitivity functions for HSI data recovery.
In this paper, we present two main contributions: The first one is the study of the discriminating power of spectral sensitivity functions in a content-based hyperspectral image retrieval framework. The first hypothesis to validate is that for a given category, each image content could be better extracted through a specific set of SSFs. The second hypothesis is that the whole spectral range is required for image category recognition. To do so, we take advantage of recent advances in Convolutional Neural Networks [29], and particularly deep feature methods [30] to represent a hyperspectral image as a signature. The second contribution of this paper is the introduction of a new hyperspectral image dataset to the remote sensing community. To evaluate the performance of our proposed framework on our dataset, we first propose to focus our study on a multi-level selection of one SSF. This first study highlights important bandwidths best discriminating to the scene content. The second step of our study consists of building trichromatic images by combining three SSFs. Hence, this makes it possible to use an RGB-based pre-trained CNN for features extraction and also to display a color image for a later result interpretation and understanding. The remainder of the paper is organized as follows: Section 2 gives a brief overview of recent studies linked to our research. Section 3 presents the proposed framework based for HSI data representation and introduces our HSI dataset ICONES-HSI. Section 4 gives the experimental results of our two studies. The first one analyzes the multi level behavior of only one selected SSF. Then, we apply our proposed approach to obtain trichromatic images and study the performance and behaviour of such image representation compared with a retrieval system based on the RGB color space. Finally, Section 5 concludes the paper and gives some perspectives.

2. Related Work

With the development of remote sensing acquisition techniques and the rapid growth of earth observation data, remote sensing image retrieval technology has drawn more and more attention in recent years [31]. Indeed, Content-Based Image Retrieval (CBIR) systems have been developed for archive management of remote sensing data [10]. Several kinds of features have been investigated to represent image content and retrieve remote sensing images from a database, such as spectrum signature [14], texture [32], and spectral pattern [1]. Despite the important progress of CBIR for remote sensing data for R G B imagery and multispectral Imaging [33], few works have addressed the hyperspectral image retrieval problem. Most of the existing works are based on spectral unmixing of the HSI data [34,35]. For instance, Veganzones et al. [36,37] extracted end-members as spectral features by end-member induction algorithms and then defined an end–member based image distance to measure the similarity between two hyperspectral images. Most similar images are retrieved based on the similarity of each end-member based signature pairs from query and target images. They used their own HSI dataset to evaluate the performance of the proposed method. However, this data is not yet available for a public use. Ömrüuzun et al. [38] proposed to describe the image as a bag of end-members image descriptors for similarity retrieval. The latter presented a new dataset for HSI data retrieval: The HSI ANKARA Benchmark (http://bigearth.eu/datasets.html). To the best of our knowledge, only the two aforementioned HSI datasets have been proposed for HSI data retrieval.
Hyperspectral remote sensing images contain both spatial and spectral information. Some recent works proposed to integrate the textural features with spectral [14] or with color features to improve the performance of HSI retrieval. Alber et al. [39] used spectral (mean and variance) and textural (local orientation) features for HSI spatio-spectral data description. The extracted features have been used to retrieve spatial locations of hurricane eyes in GOES satellite images with a relevance feedback loop. Recently, Tekeste et al. [40] presented a comparative study of Local Binary Pattern (LBP) descriptor for remote sensing data retrieval. They adapt properties of LBP variants for different types of remote sensing data (multispectral, hyperspectral, and SAR images). However, extracting both spectral and spatial discriminating features to improve the hyperspectral image retrieval problem is still a challenging task. Recently, deep learning approaches have exploded to deal with this issue and extract more effective deep features for hyperspectral data classification [15,20,24] using both spatial and spectral information. In the work of Zhao et al. [41], Convolutional Neural Networks have also been used to encode pixels’ spectral and spatial information. Santara et al. [21] presented a deep neural network architecture that learns band-specific spectral–spatial features for land cover classification in HSI data, while Mei et al. [23] designed supervised and unsupervised learning models to learn sensor-specific spatial–spectral features from HSI data. The work of Zhang et al. [24] focused on spectral–spatial context modelling in order to address the problem of spatial variability of spectral signatures. Lee et al. [42] proposed a deep CNN that learns local spectral and spatial information embedded in hyperspectral images by using a multi-scale filter bank at the initial stage of the network. In [20], the authors proposed a hyperspectral data classification method using deep features extracted by Stacked Autoencoders. Chen et al. [43] introduced Deep Belief Networks (DBN) to extract the deep and invariant features of hyperspectral data. More recently, in [25], a three-dimensional (3D) CNN model was proposed in order to extract the spectral–spatial features from HSI data.
Deep feature extraction for HSI description is still a challenging problem because of the high dimensional nature of the HSI data, the lack of hyperspectral image datasets, and the spectral correlations that exist between bands in hyperspectral data. In the literature, various works have been carried out to overcome the high-dimensional and highly correlated feature space issues for HSI data classification [44]. Many HSI dimensionality reduction techniques, including Principal Component Analysis (PCA) and Linear Discriminant Analysis (LDA), have been used for spectral band selection and reduction [21,22,23]. For example, Zhao et al. [22] proposed a framework that joins dimension reduction and deep learning for hyperspectral image classification based on spectral–spatial features. However, those linear transformation-based methods are not suitable for analyzing inherently nonlinear hyperspectral data. Some works proposed alternative solutions for band selection by designing a band selection layer neural network architecture. In [45], the authors proposed a supervised CNN architecture based on a Siamese learning loss scheme to learn a reduced HSI data representation. Lee and Kwon [42] proposed a contextual deep CNN, which optimally explores contextual interactions by jointly exploiting local spatial–spectral relationships of neighboring pixels. Specifically, the joint exploitation of spatial–spectral information is achieved by a multi-scale convolutional filter bank.
Most of the aforementioned deep learning works are pixel-based approaches that process each pixel using its reflectance values from different spectral bands. Those approaches perform pixel-wise detection and classification followed by a post-processing step to group pixels or to segment an image into regions. Furthermore, the rich spectral information contained in the hyperspectral image makes them well suited for accurate computer vision tasks like scene understanding or object recognition from remote sensing data. Moreover, the lack of available annotated HSI data could be a challenge for training such CNN from scratch. In addition, most of state-of-the-art CNN architectures are designed and trained for extracting features from RGB data, and hence their direct use for HSI data might lead to sub-optimal results for analyzing the spatial–spectral data.

3. Proposed Framework

In this section, we present the proposed framework for HSI content representation, illustrated by Figure 1. First, we introduce the proposed trichromatic image construction scheme based on the scalar product of the hyperspectral image by three spectral sensitivity functions. Then, we detail the CNN features extraction process from the obtained images. Next, we explain the objective of our study using our HSI representation. Finally, we present our HSI dataset used to evaluate the proposed approach.

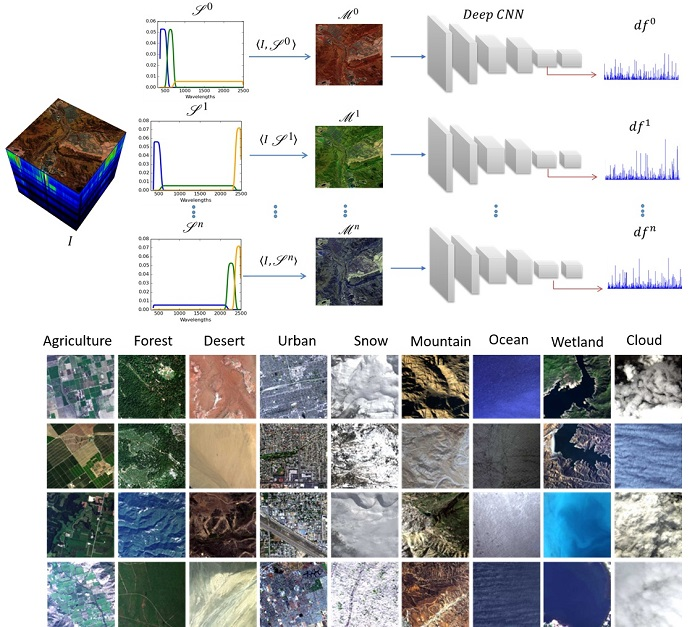
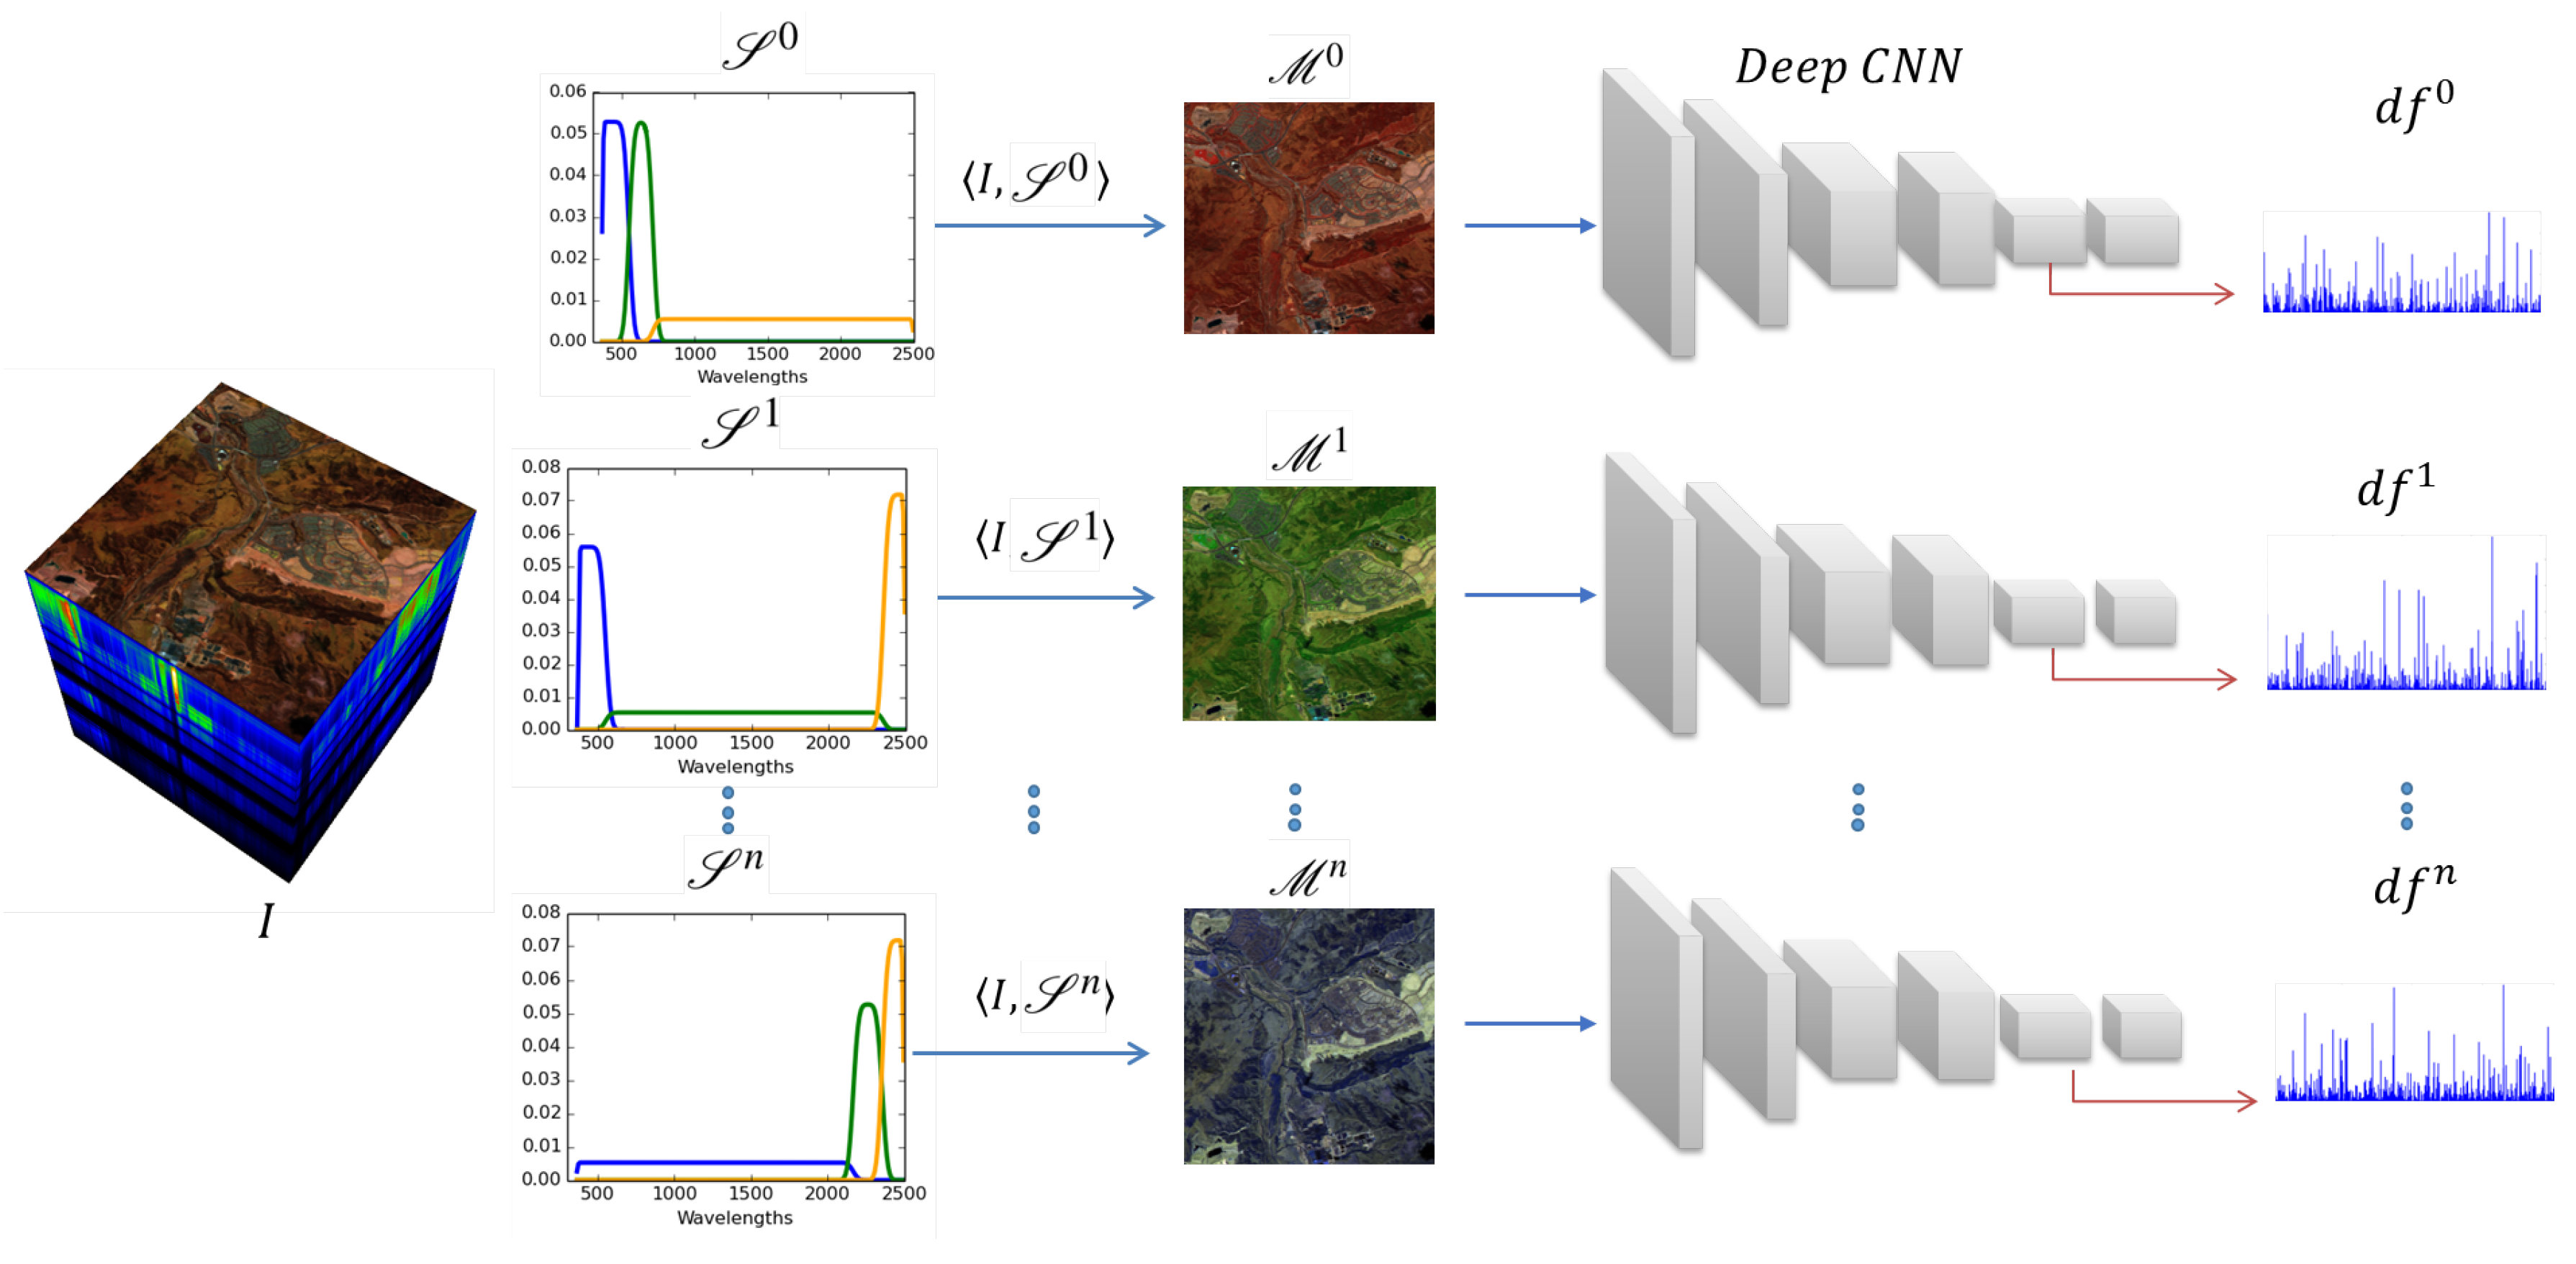
3.1. Spectral Sensitivity Functions-Based HSI Content Representation

A spectrum is mathematically defined as a continuous function f ( λ ) over the wavelengths expressing the acquired energy coming from a surface, a scene, or a source [46]. In the three cases, the spectrum is directly related to the physical and optical properties of the acquired object. In remote sensing, some physical discontinuities are induced by the atmosphere, meaning that f is not continuously differentiable. The Spectral Sensitivity Function (SSF) is at the core of any spectral or color sensor specification and construction. The sensitivity defines the relative efficiency of the sensor for a given wavelength, expressed in percentage. Then, the radiance measurement data associated with a particular spectrum F is defined as the accumulation of energy weighted by the sensitivity s ( λ ) at each wavelength λ (Equation (1)). From signal processing point of view, the SSF can be considered as a spectral sampling function defining the spectral range to acquire and sample. The measure quantity value [47] m is defined by:
m = F , S = λ m i n λ m a x f ( λ ) s ( λ ) d λ
where [ λ m i n , λ m a x ] defines the spectral support of F and S.
For display purposes, the three SSFs are associated with the Red, Green, and Blue channels. The spectral sensitivity functions corresponding to these channels are based on the standard CIE Color Matching Functions (CMF). Nevertheless, the constraints and limits in the sensor fabrication induce the existence of several hundred of different sets of trichromatic functions, and consequently, the same numbers of color spaces.
A hyperspectral image I ( x , λ ) associates to each x pixel location a spectrum F. This spectrum characterizes the sum of signals transmitted by the pixel. We propose to transform the hyperspectral image I ( x , λ ) into a trichromatic measured quantity value M i ( x ) without constraints due to the CMF foundations or limits in the visible range. The trichromatic measured quantity value M i ( x ) is formed by the ordered triplet ( m 0 i ( x ) , m 1 i ( x ) , m 2 i ( x ) ) obtained from a sequence S i of three spectral sensitivity functions ( S 0 i , S 1 i , S 2 i ) using Equation (1). At the end of this process, the hyperspectal image is transformed into a trichromatic image denoted M i .
Deep features F = { d f 0 , d f 1 , , d f n } of the different trichromatic images M i are extracted using a deep features approach based on a CNN (ResNet) [30] pre-trained on ImageNet [48], without the fully connected layer originally tailored for the image classification task. The used pre-trained model itself is a Residual Network architecture. We use the ResNet-50 version, which consists of 16 bottleneck structures, where each one is composed of 3 convolutional layers followed by batch normalization (BN) layers. The output of the last global average pooling layer is used as features for HSI data indexing and retrieval. The obtained signatures are 2048-Dimensional vectors. Euclidean distance is used for computing the similarity between a given pair of image signatures.
To preserve the optical and physical properties, we do not restrict our approach to only three spectral bands among the several hundred acquired ones. In this work, we assume that each category presents a particular spectral response and then can be associated to a particular set of SSFs. Therefore, we are looking for the sequence of N SSFs that achieves best retrieval results for each category. In the current work, we study the use of only one SSF and then we set N to 3 to compare the retrieval results with the RGB-based results.

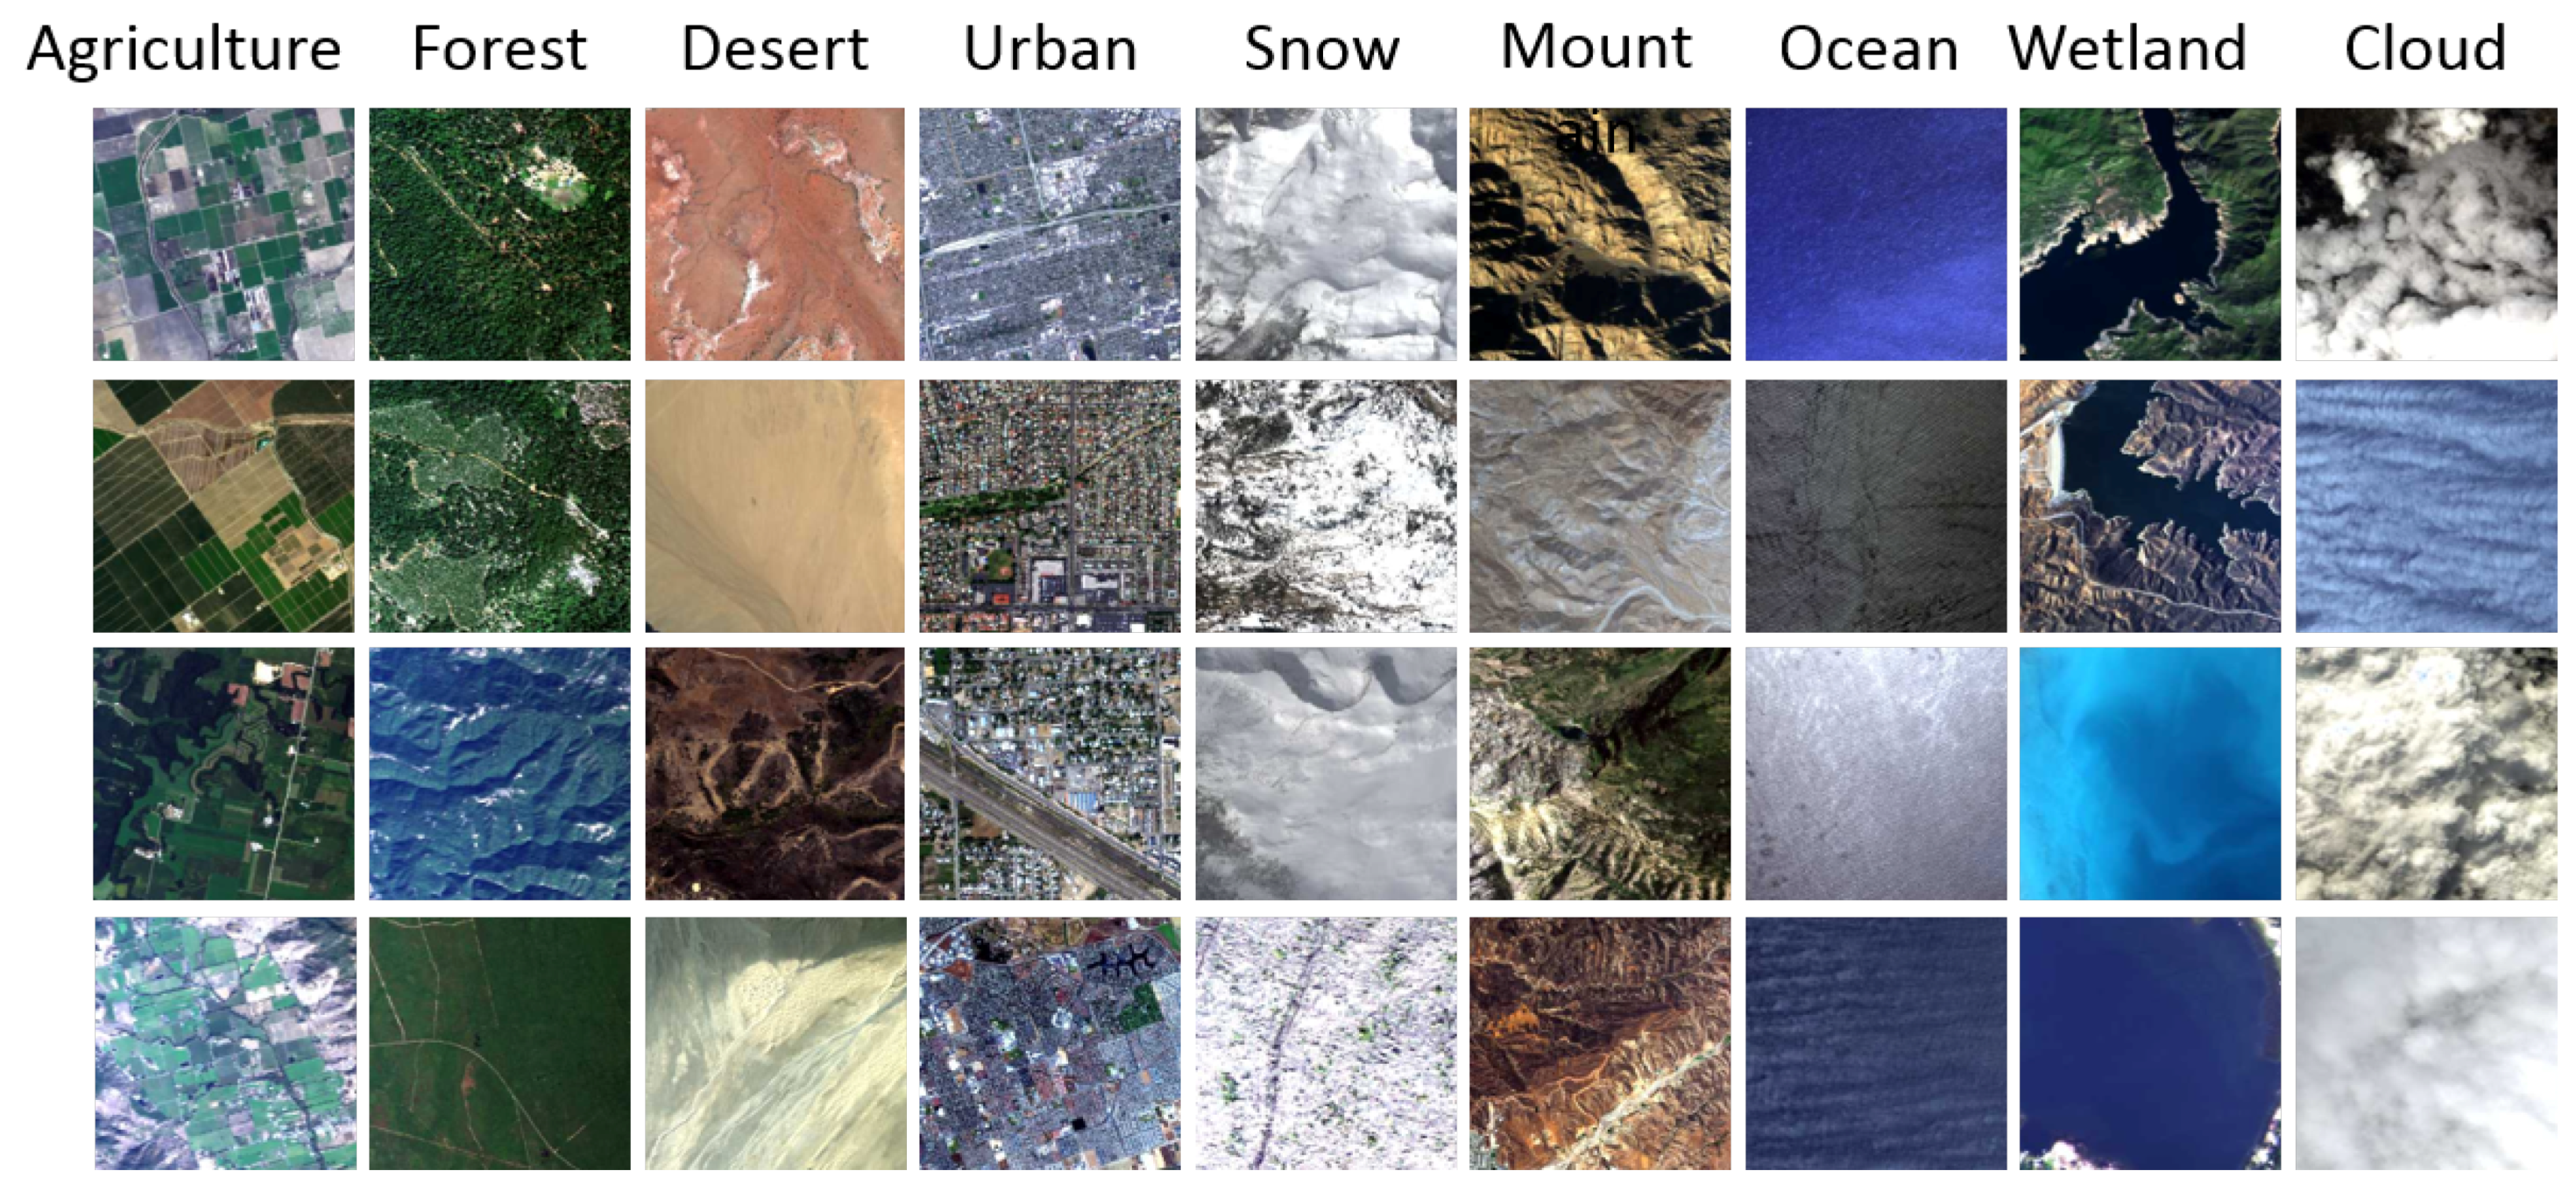
3.2. The ICONES Hyperspectral Satellite Imaging Dataset (ICONES-HSI)

In this paper, we present our dataset of hyperspectral satellite data, the ICONES-HSI. Images were generated from several HSI from the NASA Jet Propulsion Laboratory’s Airborne Visible InfraRed Imaging Spectrometer (AVIRIS) (https://aviris.jpl.nasa.gov/). Spectral radiance measurement data is sampled in 224 contiguous spectral channels (bands) between 365 and 2497 nanometers. We have extracted a dataset of 486 patches of 300 × 300 pixels from AVIRIS data. We grouped the obtained HSI cubes by visual inspection and google maps content verification into 9 categories (Agriculture (50), Cloud (29), Desert (54), Dense-Urban (73), Forest (69), Mountain (53), Ocean (68), Snow (55), and Wetland (35). For all patches, we have added their corresponding RGB images (considered as baseline in our experiments) obtained from the corresponding RGB images provided by AVIRIS.
To ensure the correct annotation of the patches, an interactive interface has been developed. This interface allows to select the patch to annotate. In parallel, with the use of the GPS coordinates included in the AVIRIS metadata and the (x,y) position in the whole image, the interface extracts the local Google map. Thus, aerial views with different angles and Google street views may help the user in annotating correctly each patch. Figure 2 presents some examples of patches from all categories of the ICONES-HSI dataset. The ICONES-HSI also includes an RGB version of all patch images extracted from the AVIRIS RGB full image. The ICONES-HSI dataset is available for download from http://xlim-sic.labo.univ-poitiers.fr/datasets/ICONES-HSI/index.php?lang=en.

4. Experiments and Results

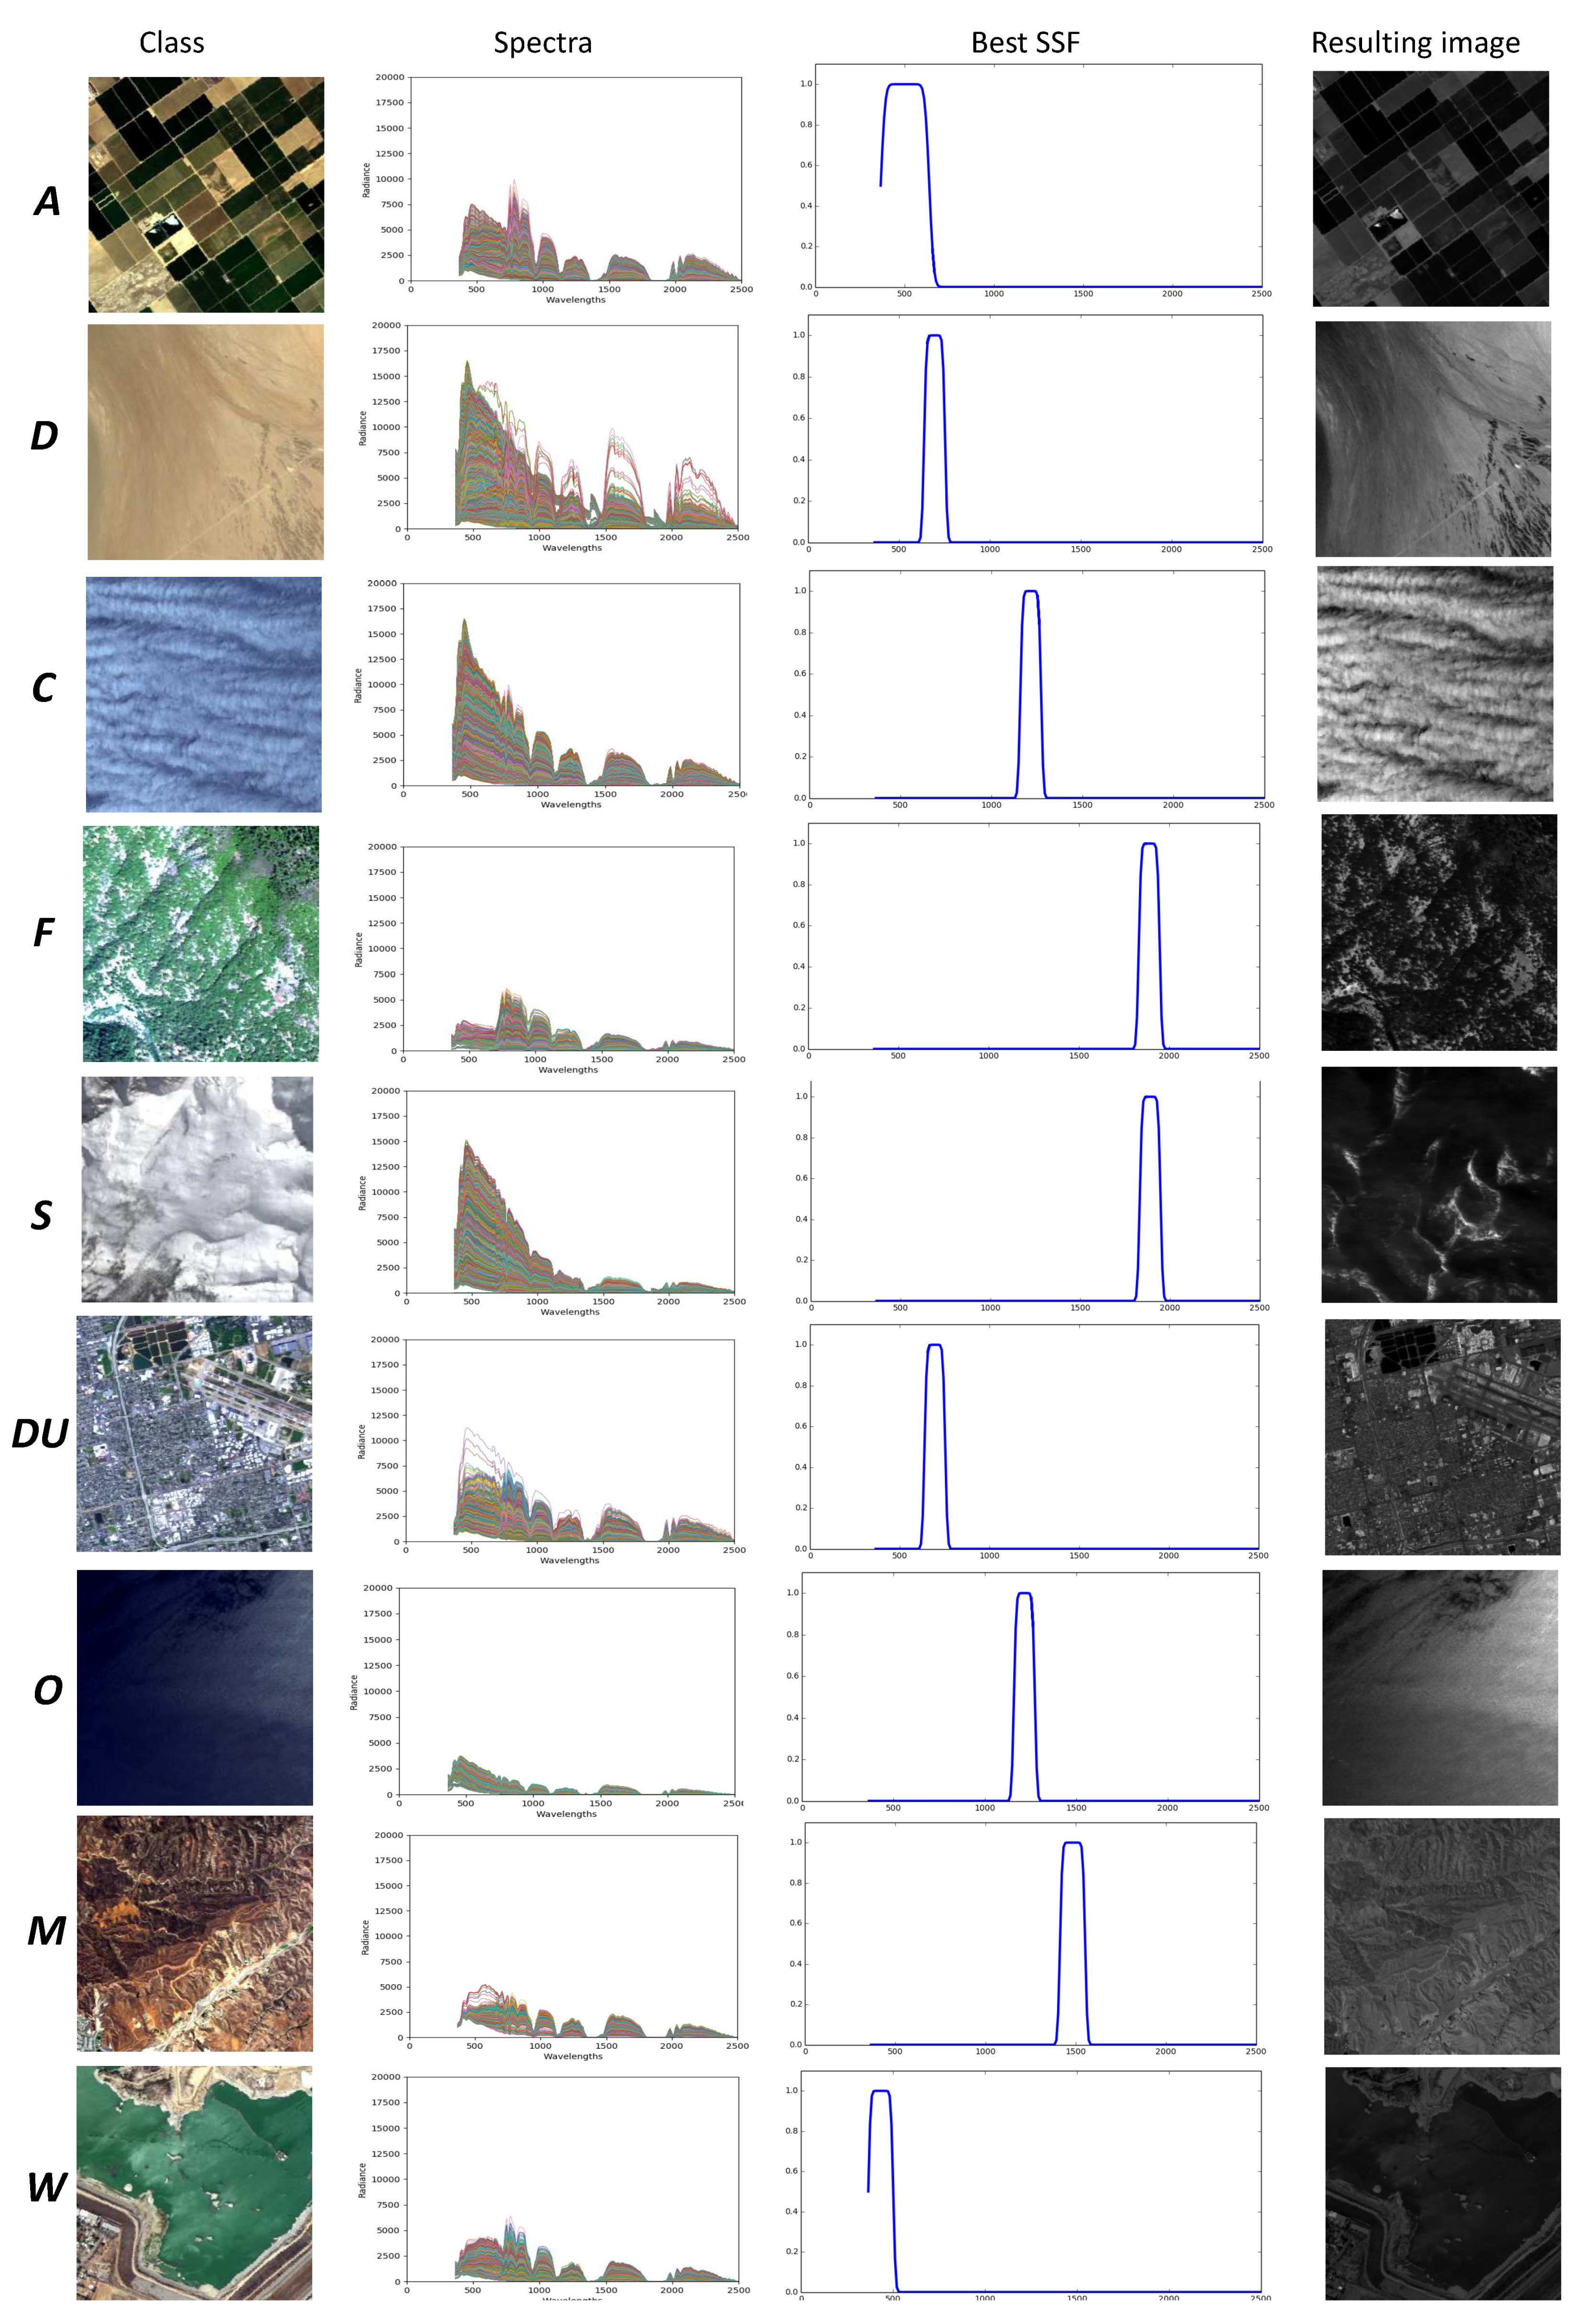
4.1. SSFs Analysis for HSI Content Discrimination: A Multi-Level Study

Before trying to find the best triplet of SSFs that provides the best performance in terms of retrieval accuracy, we first focus our work on the study of each SSF individually using a multi-level analysis scheme.

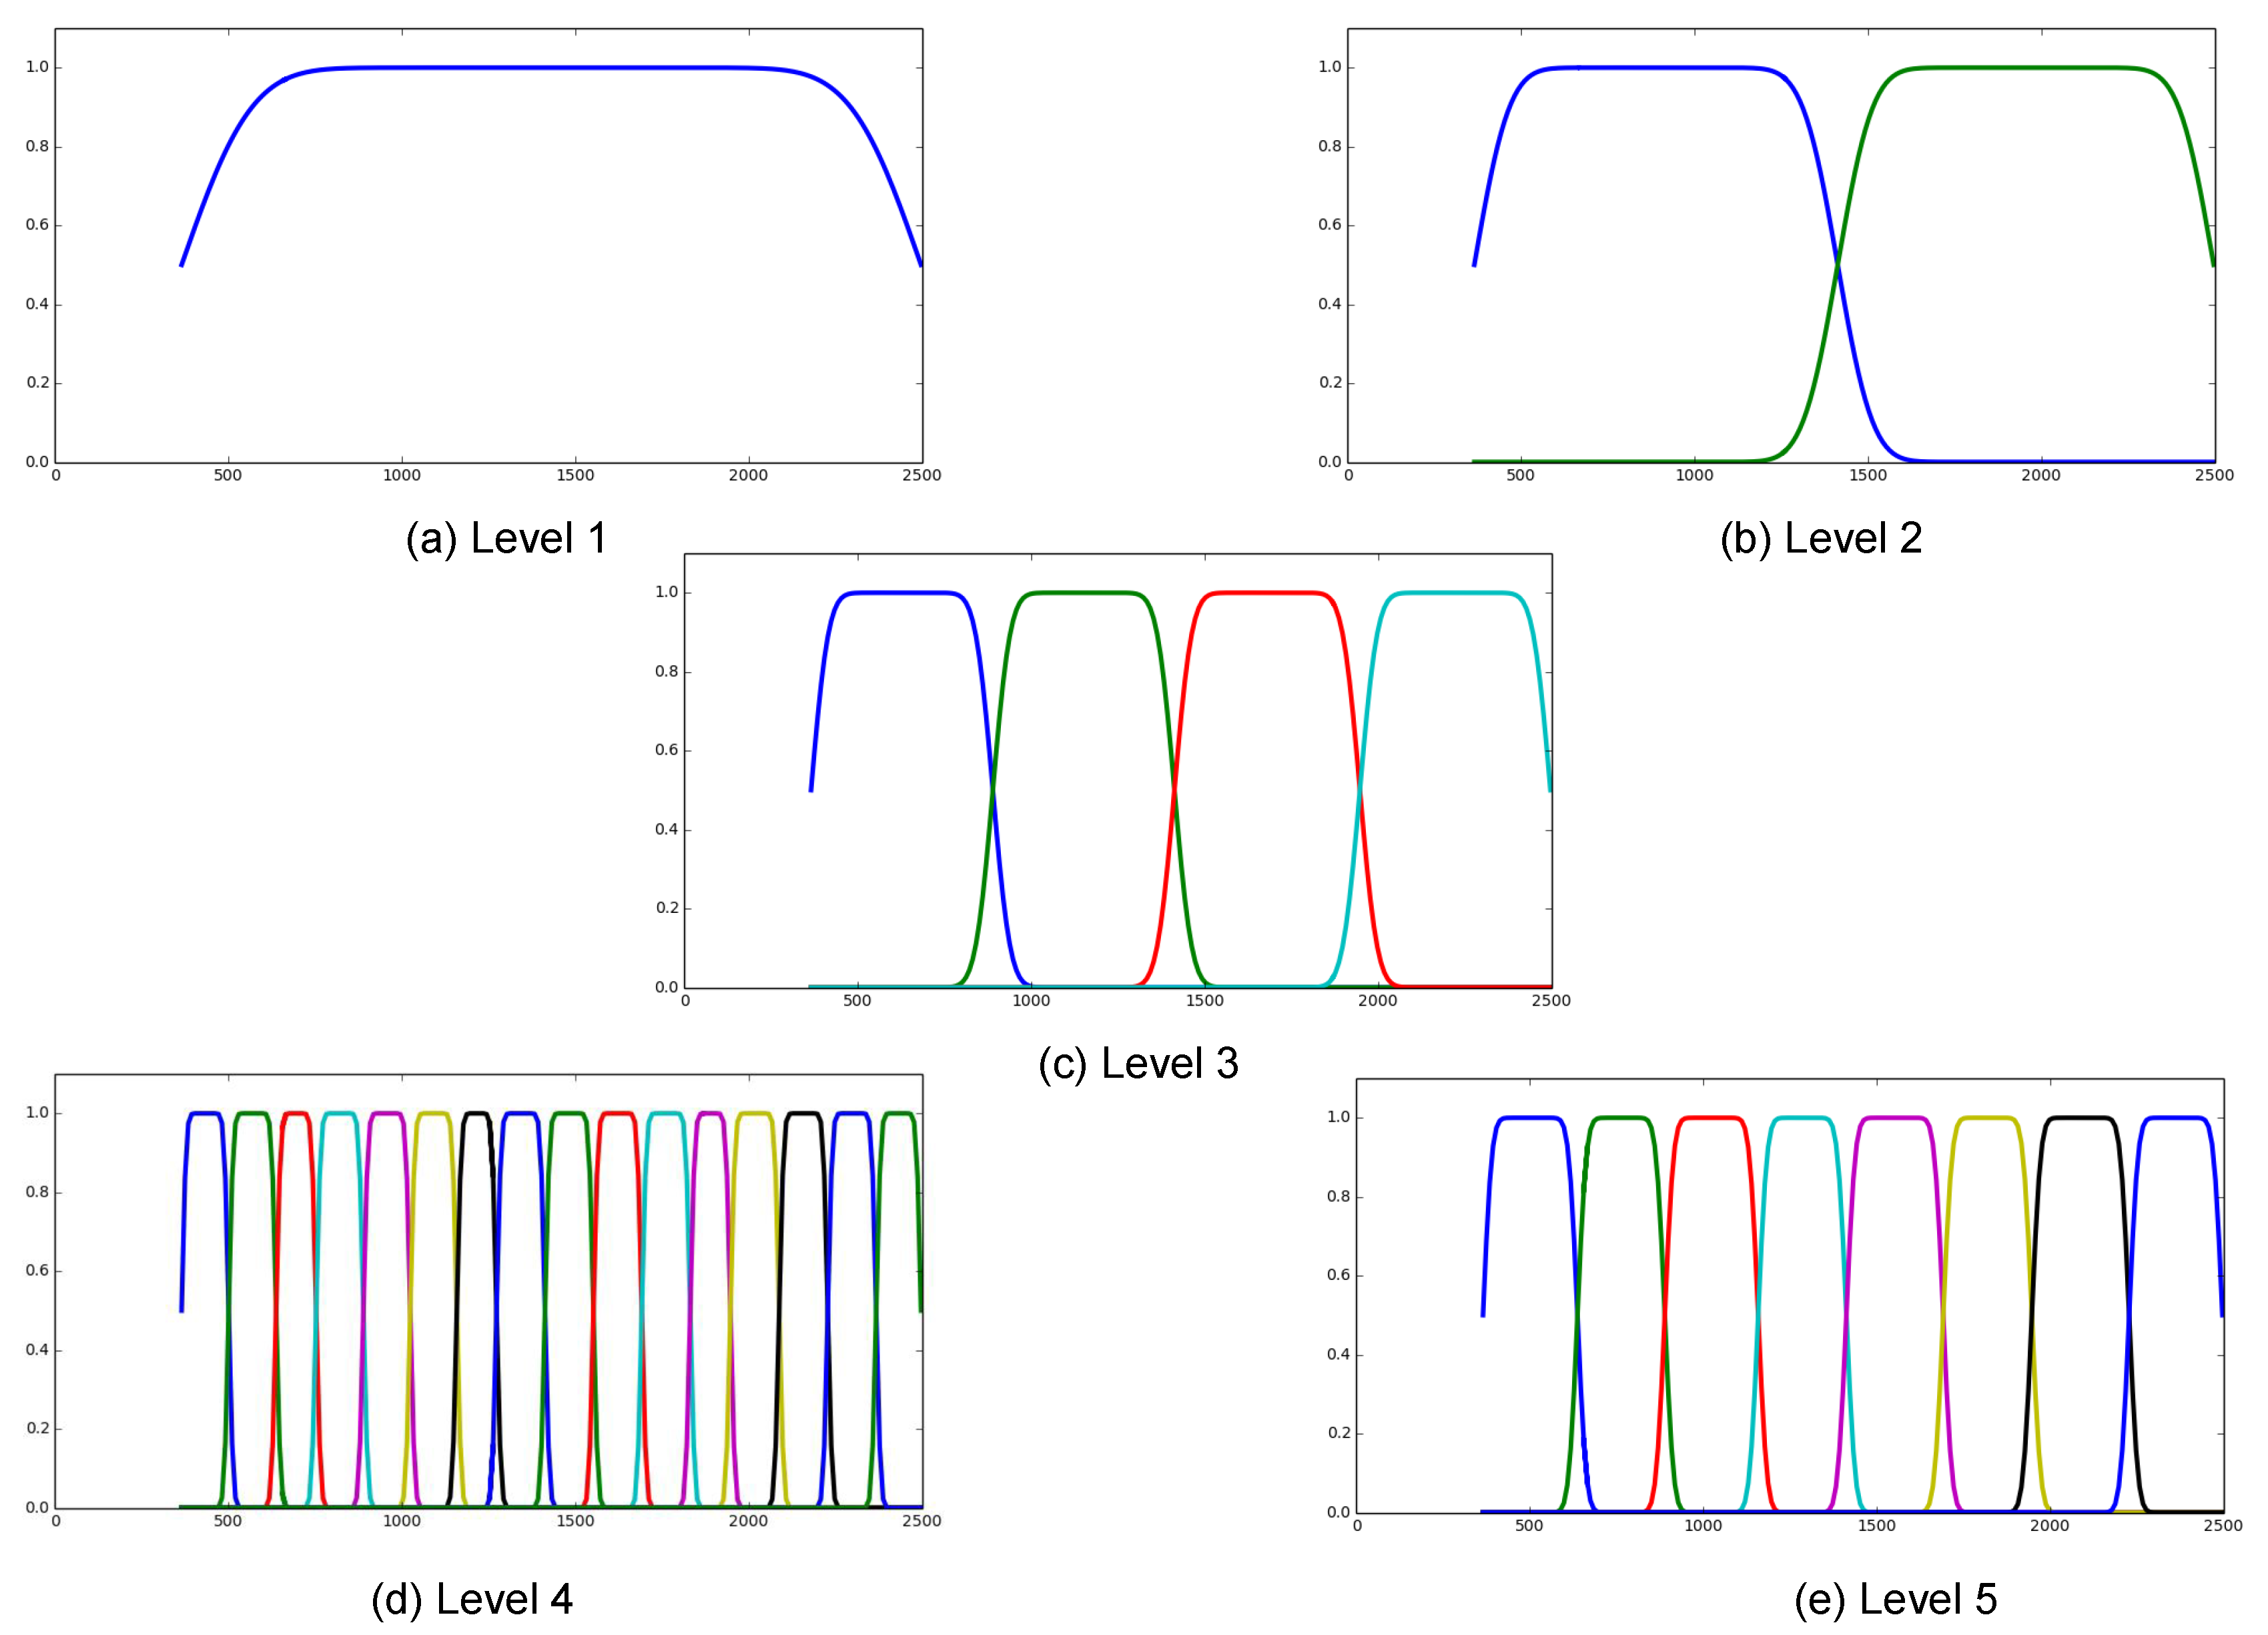
4.1.1. Multi-Level SSFs Construction

To evaluate the image content description on a specific band selection using one SSF, we define the selected spectral bands by Gaussian and Complementary Error function windows along the spectral range. Thus, 5 hierarchical spectral levels with 31 SSFs are used to filter the HSI spectra.
Figure 3 shows the selected SSFs by level. Level 1 contains only one SSF that covers the whole spectral range and other levels are the results of the division by 2 of the higher level. Thus, similarly to first level, the SSFs of other levels, when combined, also cover the whole spectrum range. The goal here is to see if one optimal SSF is enough to build a discriminate and efficient image signature compared to the use of an RGB-based content description approach.

4.1.2. Results and Discussion

Figure 4 presents for each class, the RGB version of the hyperspectral image, its corresponding spectra, the best selected SSF according to the retrieval performance for the category, and the resulting monochromatic image obtained with the best SSF. We note that for most categories, the best SSF is from level 5. It means that the average best descriptive wavelengths for all categories are contained in a small window range, and thus using a wider one produces noise that decreases the accuracy of image description.
Let us focus on some categories and explain the possible reasons of the obtained performance. Only the Agriculture category uses a level 4 SSFs covering the visible range. A focus on patch content of this category may explain this result. First, agriculture fields contain repeated geometric shapes with specific gradients induced by limits of the cultivated fields. Thus, a larger spectral bandwidth is needed to better describe this topological characteristic. Moreover, as acquisitions have been performed during the whole year, the step of germination of field may be different. Thus, multiple colors may be useful for an accurate description of the patches. It of course includes the specific band of minimal absorption of chlorophyll, i.e., the maximum of its reflectance (500 nm). But not only this, as the Agriculture class includes surface with and without vegetation, and a part of the observed spectra are induced by the soil reflectance, which is slightly higher than the chlorophyll reflectance.
To conclude on Agriculture category, we observed that the radiance of the Forest, Ocean, and Snow categories are lowest, and for the others, highest for the specific spectral range of 500 nm. It is also interesting to note that the class Forest is not well represented by the first peak of chlorophyll reflectance at 500 nm, but by the third peak around 1700/1800 nm, establishing probably a difference between cultivated vegetation and forest.
The categories Dense-Urban and Desert are better discriminated by a spectral bandwidth around 600–700 nm, which corresponds to the limit of the “red edge” specific to the chlorophyll concentration modification assessment used in the NDVI criteria (Normalised Difference Vegetation Index). It illuminates that this specific bandwidth allows one to discriminate these categories from others by their lack of vegetation.
Table 1 gives an overview of the retrieval performance. In particular top 20 (P@20) and Mean Average Precision (MAP) for the best studied SSFs with respect to different sampling levels of SSFs. Cells with bold font represent the best results over the different levels. At first glance, we observe that for most categories Level 5 SSFs perform better than the remaining levels. The few observed exceptions have retrieval accuracies very close to the one obtained with SSFs of level 5. We may conclude from this first set of results that a tiny spectral range window contains enough information to achieve better retrieval performance than with a wider range. We may also conclude that the information contained in the rest of the spectrum is misleading or noisy. The reported conclusions are based only on the best SSF by category. However, compared with best level 5 SSF results for each category, the RGB results are clearly better. Average result shows a 11 % increase for the MAP results (see Table 2).
Exceptions appears for Cloud and Wetland categories; for the Cloud category, the best spectral bandwidths to describe the cloud category are located in the infrared bands, and they cannot be captured by the RGB image. For the Wetland category, the retrieval for RGB is tougher as this category covers a large variety of image contents (lake, river, or swamp mixed with a portion of land). More information than RGB is needed for this category to improve the results. All these observations on the result show the importance of using more than one SSF to describe the patches.
In the next section, we show that combining information from the whole spectrum using more spectral sensitivity functions leads to better retrieval performance.

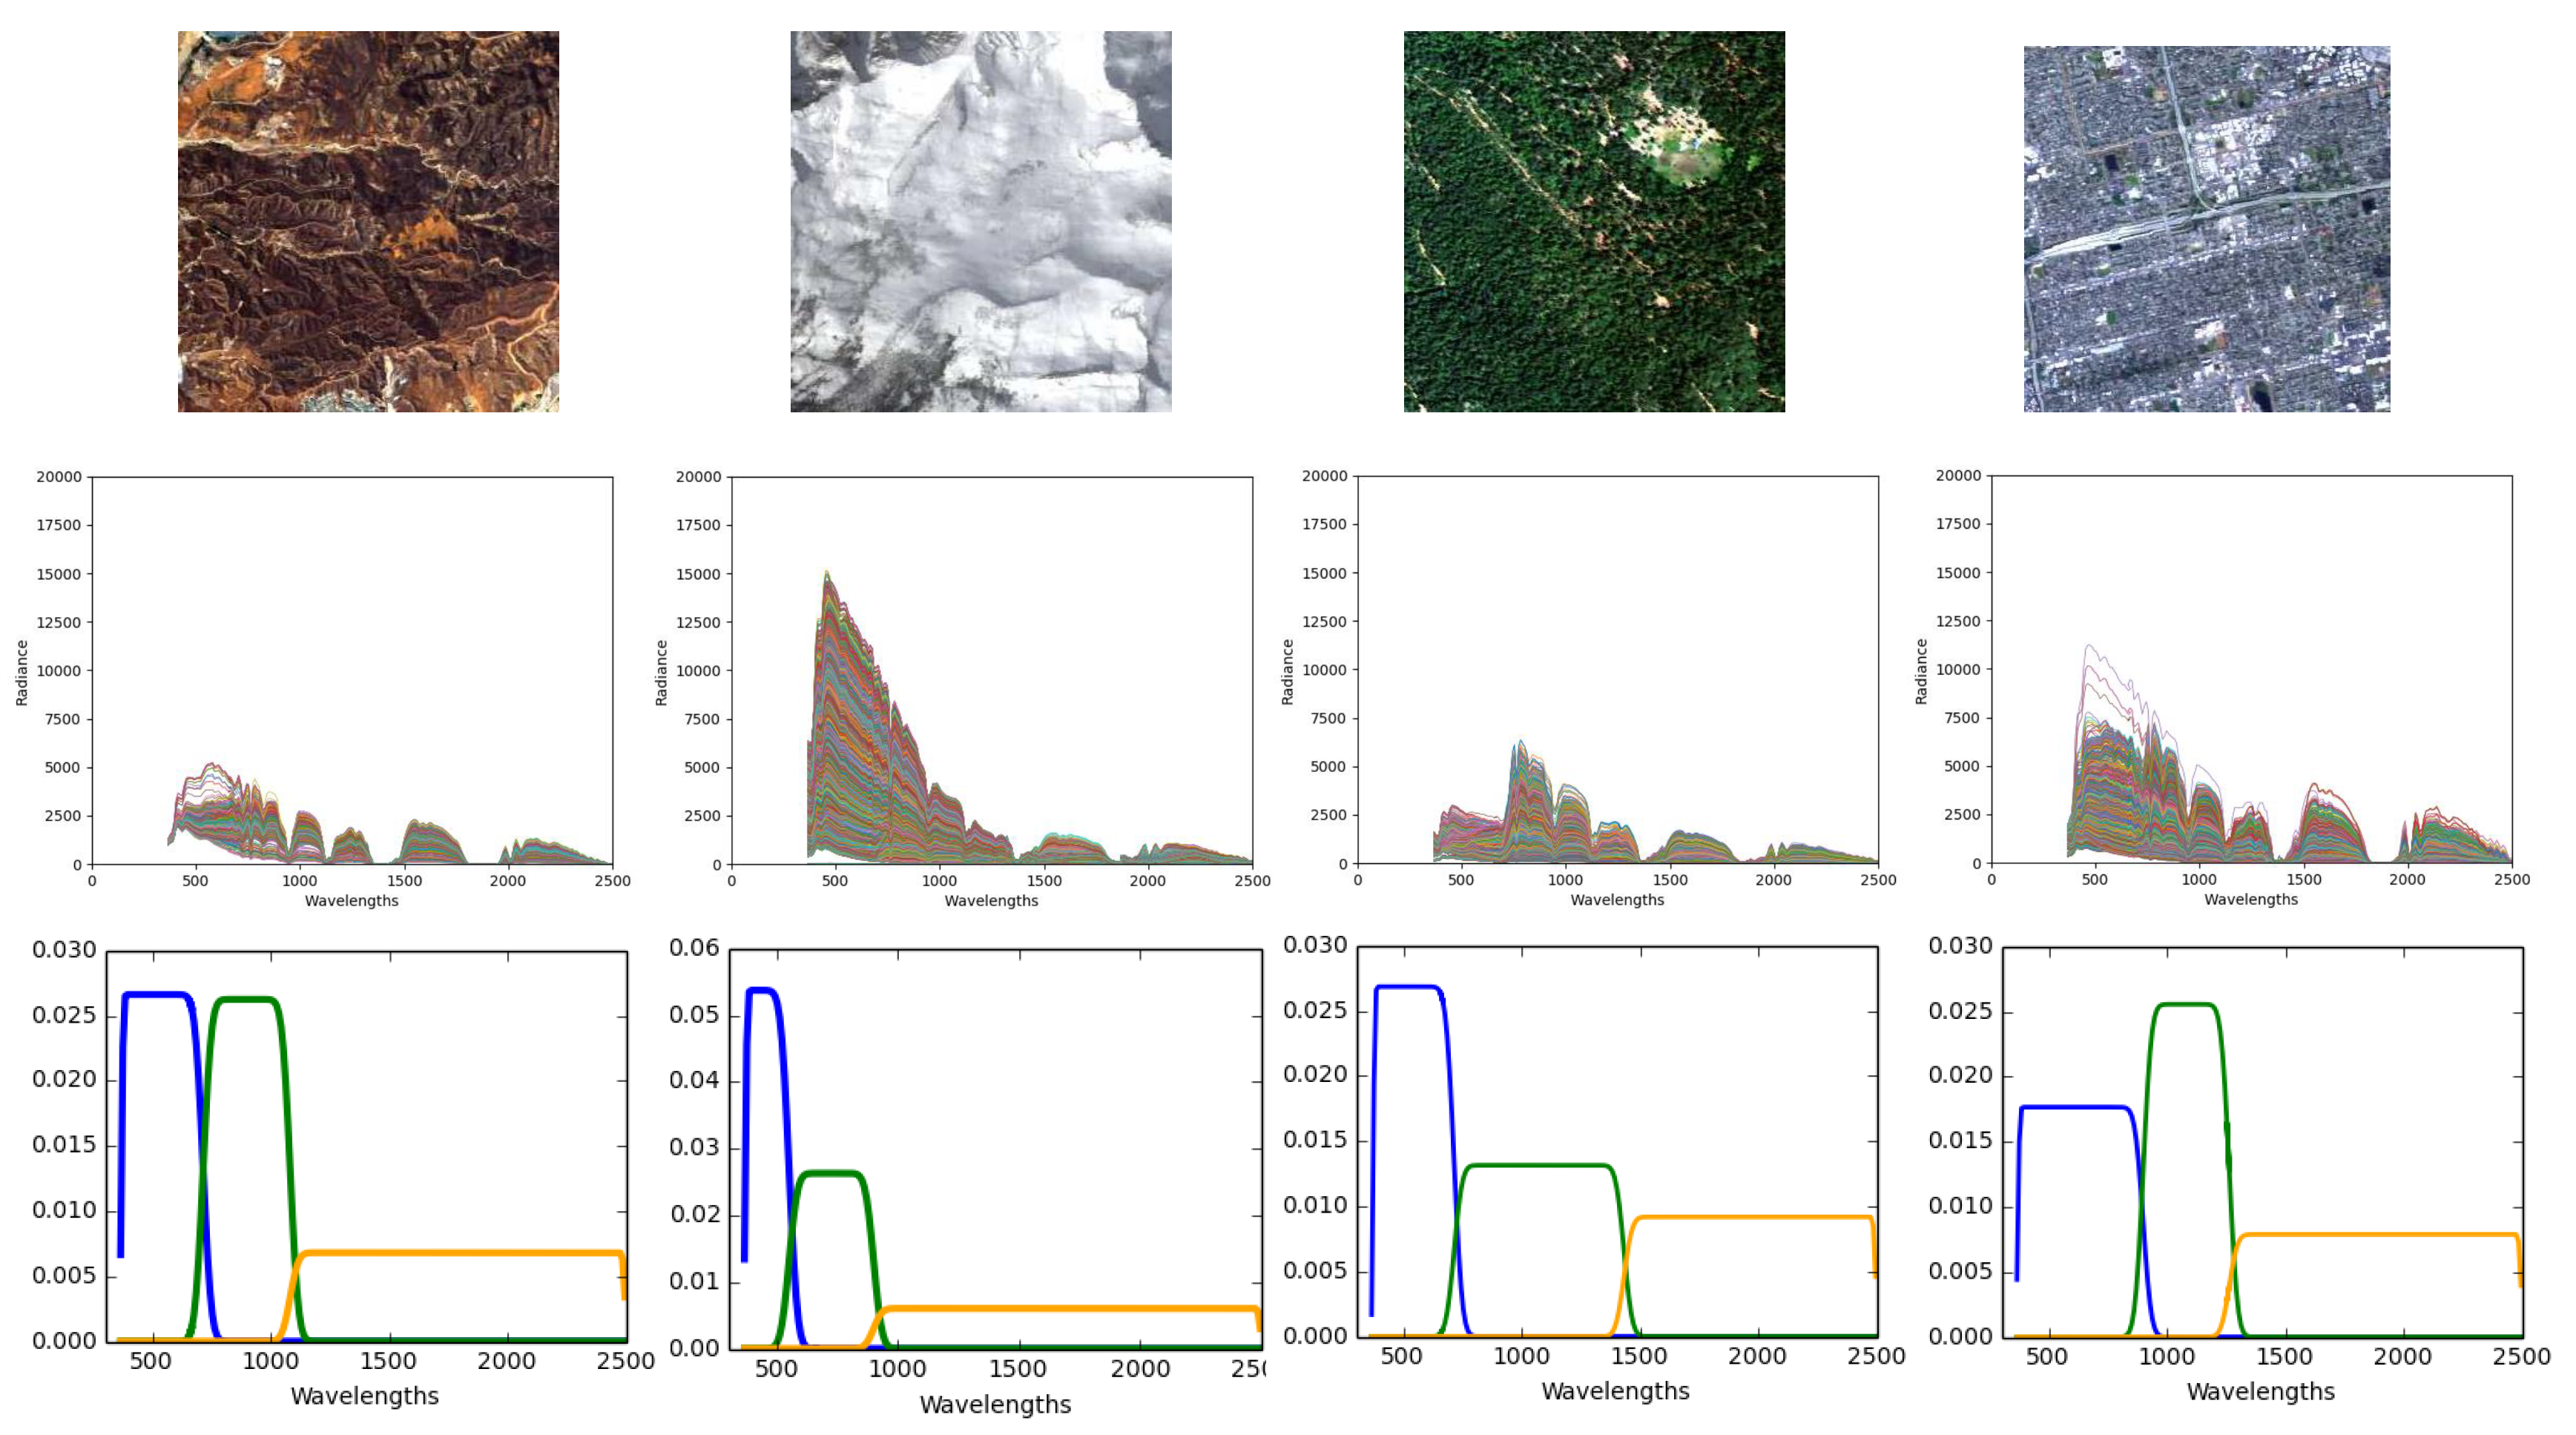
4.2. Trichromatic Image Content Description for HSI Retrieval

In this section we first present our rules to generate a triplet of SSFs, then we detail and discuss our experiment results, which compare the retrieval performance using three SSFs covering the whole spectral range against deep features based RGB images.

4.2.1. Rules of Spectral Sensitivity Function Generation

In order to ensure a complete use of the acquired spectral range we define two constraints for the definition of the SSF. First, the wavelengths must be taken into account. Second, the three selectivity functions must be ordered following their spectral range to construct a trichromatic image preserving the physical and optical properties. We propose to define the sensitivity functions from combinations of Gaussian, Error, and Complementary Error functions [49]. Their combinations construct spectral windows with unitary sensitivity and cut-off based on Gaussian functions. Two spectral sampling cases are considered:
  • Whole spectral range: We consider both the visible and the IR ranges as a whole.
  • Partial spectral range: We reduce the sampling process to a selected spectral range and we consider our study for the visible range and the IR range separately.

4.2.2. Trichromatic Image Content Extraction

From each of the two spectral samplings previously detailed, we obtain a set of triplets of SSFs. The following steps to extract the HSI content representation follow the proposed framework detailed in Section 3. Each possible combination of three SSFs is then used to build all hyperspectral images. Finally, the signatures of those trichromatic images are extracted using the bottleneck layer of the pre-trained CNN ResNet, giving a 2048-dimensional vector by image.

4.2.3. Results and Discussion

To study the discriminating power of the selected sensitivity functions with respect to the data categories, we evaluate their retrieval performance on the presented HSI dataset. Thus, we compute the precision at top N retrieved images, in particular top 10 and top 20 (denoted P@10 and P@20). We also compute the Mean Average Precision (MAP) over the retrieved data. We summarize the obtained results in Table 3. Each cell of this table represents the results obtained for the best triplet of sensitivity functions S i that we compare with the results obtained with the RGB images (considered as a baseline) results. We present our results according to the 3 spectral ranges: Whole, Visible, and InfraRed (IR). Gray cells highlight the best global retrieval results compared to the whole reported results. Cells with bold font represent the best results that outperform the baseline (RGB).
A brief overview of the grey cells of Table 3 highlights the importance of the whole range of spectrum as they contain most of best results. Only two categories have better results in the visible range, in particular, the Agriculture (A) category where the Visible MAP result has a 20 % increase compared to the MAP of Whole. Our hypothesis for this category are that IR range adds noise information and the similarity is mainly based on the visible color shape information of agriculture fields as previously explained. For the Wetland (W) category, the low reported retrieval results do not lead to any conclusion. This would be justified by the fact that this category is very heterogeneous, representing natural scenes containing lake, river, or swamp mixed with a portion of land. The Average line (Avg) of Table 3 presents the best results from a specific triplet of SSF over the whole dataset. For the whole spectral sampling, it corresponds to the one presented in Figure 5. Theses results highlight the fact that many possible triplets of SSFs could contain more discriminative information than RGB image even when using a CNN specifically trained on RGB images as the ResNet. Those experiments also show that the baseline (RGB) result is ranked 7th in the list of possible SSF triplet combinations in terms of average MAP, i.e., there are six sets of three SSFs which outperform the baseline in term of average performance. Values with asterisk (*) in Table 3 denote the best obtained results with IR range compared to the visible range. A closer observation between Visible and IR points out only two categories (Forest (F) and Mountain(M)), where IR presents significantly better results than Visible (marked with a ( ) in Table 3). This observation justifies the need to the IR spectral range.
Figure 5 shows some examples (which are good representative) of the best SSFs with respect to a category. It presents, from left to right, an example of an image from a selected category, its corresponding random set of spectra, and the triplet of SSFs that best discriminates the image in terms of retrieval performance. From Figure 5, we can note that the SSFs triplets are different but mainly contain one function in the visible range, one in the IR range, and the last one in the short-wavelength IR. Hence, in order to obtain a discriminating image representation and thus a good retrieval performance, the whole spectrum is mandatory. Moreover, we note that only one sensitivity function is needed to represent the visible range. Surprisingly, the color information is less relevant compared to the texture and shape content for the proposed retrieval.
In order to evaluate the performance of our method on an external dataset, we perform experiments on the hyperspectral ANKARA archives [38], which is to the best of our knowledge the only available HSI dataset available for CBIR. The dataset contains Land-Use and Land-Cover annotations for respectively multi-class and single class retrieval tasks. Since in our work we are focusing on single label retrieval task, we used the Land-Use annotation to test our approach. The data is composed of 216 images with a size of 63 by 63 pixels organized into 4 Land-Use categories (Rural Area (43), Urban Area (37), Cultivated Land (126), and Forest (10)). Table 4 presents the retrieval results in terms of P@5 and MAP metrics for both RGB and HSI data. We observe that our approach performs well compared to RGB. It is worth noting that the Ankara dataset was originally acquired with 220 bands and only 119 bands have been retrained after noisy bands removing. Hence, due to the lack of information about the wavelength ranges and the spectral ranges (Visible, IR), we cannot perform experiments on the visible and IR ranges. Therefore, we present retrieval results only for the Whole range. The missing information about the wavelengths is also problematic for constructing the SSFs which are made for continuous wavelengths.
From Table 4, one can see an improvement in terms of MAP and P@5 for all categories except for the Forest one. This may be due to the limited number of samples in this category (10). The average results are improved when using the Whole spectral range compared to RGB images ( 81.03 % versus 77.3 % for the P@5 and 66.54 % versus 61.8 % for the MAP). Hence, we note 3.73 % and 4.74 % increases, respectively, for the P@5 and the MAP average results.
One would ask about the performance (in terms of accuracy and computational time) of the proposed SSF-based HSI data description scheme compared to a baseline method in a content-based HSI retrieval task. Hence, to verify the superiority of the presented method (SSF-based deep HSI description), we compare it with a popular method for HSI data transformation enabling deep features extraction: the PCA method which is widely used for HSI data classification [22]. Hence, the original HSI was reduced into a trichromatic image using the first three Principal Components. Then, we use the same retrieval framework including the ResNet deep features extraction from the obtained trichromatic images and the Euclidean distance for the signatures comparison. All the computations have been performed on a system with Intel core i7/16GB RAM with Python. Table 5 presents the retrieval performances obtained by the considered SSF-based image description approach and the related computational time required for HSI signature generation (including the trichcromatic image construction and the deep ResNet feature extraction).
The proposed SSF-based content description approach outperforms the baseline PCA-based approach both in terms of Precision of retrieval and signature generation time. The SSFs approach enables selecting more discriminating information from the HSI data than the PCA method. It is also worth noting that the computed retrieval time is the same for the two approaches and it is equal to 0.3 s/image.

5. Conclusions

In this paper, we have proposed two main contributions: The first one is the study of discriminating the power of spectral sensitivity functions in a content-based hyperspectral image retrieval framework. The second contribution of this paper is the introduction of a new hyperspectral images dataset to the remote sensing community. Our proposed framework focuses on image representation, with the most relevant spectral bands using SSFs. Then, deep features are extracted from the obtained trichromatic representation of HSI data to build a discriminating image signature. A first experiment highlights the best descriptive bandwidths for each category but also shows that one SSF is not enough to represent to scene content. Next, results confirm that the Hyperspectral image retrieval system has to take advantage of the information given by the whole image spectrum to improve its performance. Results also prove that physical measurements and optical properties of the scene contained in the remote sensing HSI better contribute in an accurate image content description than the information provided by the RGB image presentation. Our framework has also been tested on the ANKARA archives, showing its potential compared to other hyperspectral datasets. Further improvement of the proposed approach will include the study of more complex sensitivity functions.

Author Contributions

Main conceptualization, methodology definition and results evaluation O.B.-A., T.U., N.R. and C.F.-M., O.B.-A. wrote the the manuscript. T.U. and N.R. analysed the results and edited the manuscript. Software development and experiments performed by O.B.-A.

Funding

This research was partly supported by the French National Research Agency project DigiPi (ANR-16-CE08-0010) and with the financial participation of the European Union and the region of Nouvelle Aquitaine (ERDF NUMERIC program, action e-Patrimoine).

Acknowledgments

We acknowledge the assistance of Bruno Mercier in creating the Web user interface and uploading the ICONES-HSI Dataset.

Conflicts of Interest

The authors declare no conflict of interest.

References

  1. Bosilj, P.; Aptoula, E.; Lefèvre, S.; Kijak, E. Retrieval of Remote Sensing Images with Pattern Spectra Descriptors. ISPRS Int. J. Geo-Inf. 2016, 5, 228. [Google Scholar] [CrossRef]
  2. Zhang, J.; Chen, L.; Zhuo, L.; Liang, X.; Li, J. An Efficient Hyperspectral Image Retrieval Method: Deep Spectral-Spatial Feature Extraction with DCGAN and Dimensionality Reduction Using t-SNE-Based NM Hashing. Remote Sens. 2018, 10, 271. [Google Scholar] [CrossRef]
  3. Ma, C.; Xia, W.; Chen, F.; Liu, J.; Dai, Q.; Jiang, L.; Duan, J.; Liu, W. A Content-Based Remote Sensing Image Change Information Retrieval Model. ISPRS Int. J. Geo-Inf. 2017, 6, 310. [Google Scholar] [CrossRef]
  4. Li, Y.; Zhang, Y.; Tao, C.; Zhu, H. Content-based high-resolution remote sensing image retrieval via unsupervised feature learning and collaborative affinity metric fusion. Remote Sens. 2016, 8, 709. [Google Scholar] [CrossRef]
  5. Demir, B.; Bruzzone, L. A novel active learning method in relevance feedback for content-based remote sensing image retrieval. IEEE Trans. Geosci. Remote Sens. 2015, 53, 2323–2334. [Google Scholar] [CrossRef]
  6. Chi, M.; Plaza, A.; Benediktsson, J.A.; Sun, Z.; Shen, J.; Zhu, Y. Big data for remote sensing: Challenges and opportunities. Proc. IEEE 2016, 104, 2207–2219. [Google Scholar] [CrossRef]
  7. Demir, B.; Bruzzone, L. Hashing-based scalable remote sensing image search and retrieval in large archives. IEEE Trans. Geosci. Remote Sens. 2016, 54, 892–904. [Google Scholar] [CrossRef]
  8. Chang, C.I. Hyperspectral Data Exploitation: Theory and Applications; John Wiley & Sons: New York, NY, USA, 2007. [Google Scholar]
  9. Galvão, L.S.; Pizarro, M.A.; Epiphanio, J.C.N. Variations in reflectance of tropical soils: Spectral-chemical composition relationships from AVIRIS data. Remote Sens. Environ. 2001, 75, 245–255. [Google Scholar] [CrossRef]
  10. Zhou, W.; Newsam, S.; Li, C.; Shao, Z. PatternNet: A Benchmark Dataset for Performance Evaluation of Remote Sensing Image Retrieval. arXiv, 2017; arXiv:1706.03424. [Google Scholar] [CrossRef]
  11. Lu, G.; Fei, B. Medical hyperspectral imaging: A review. J. Biomed. Opt. 2014, 19, 010901. [Google Scholar] [CrossRef] [PubMed]
  12. Liang, H. Advances in multispectral and hyperspectral imaging for archaeology and art conservation. Appl. Phys. A 2012, 106, 309–323. [Google Scholar] [CrossRef]
  13. Barrett, E.C. Introduction to Environmental Remote Sensing; Routledge: Abingdon, UK, 2013. [Google Scholar]
  14. Zhang, J.; Geng, W.; Liang, X.; Li, J.; Zhuo, L.; Zhou, Q. Hyperspectral remote sensing image retrieval system using spectral and texture features. Appl. Opt. 2017, 56, 4785–4796. [Google Scholar] [CrossRef] [PubMed]
  15. Xia, G.; Tong, X.; Hu, F.; Zhong, Y.; Datcu, M.; Zhang, L. Exploiting Deep Features for Remote Sensing Image Retrieval: A Systematic Investigation. arXiv, 2017; arXiv:1707.07321. [Google Scholar]
  16. Zhou, W.; Newsam, S.; Li, C.; Shao, Z. Learning low dimensional convolutional neural networks for high-resolution remote sensing image retrieval. Remote Sens. 2017, 9, 489. [Google Scholar] [CrossRef]
  17. Roy, S.; Sangineto, E.; Demir, B.; Sebe, N. Deep Metric and Hash-Code Learning for Content-Based Retrieval of Remote Sensing Images. In Proceedings of the IGARSS 2018—2018 IEEE International Geoscience and Remote Sensing Symposium, Valencia, Spain, 22–27 July 2018; pp. 4539–4542. [Google Scholar]
  18. Li, Y.; Zhang, Y.; Huang, X.; Ma, J. Learning source-invariant deep hashing convolutional neural networks for cross-source remote sensing image retrieval. IEEE Trans. Geosci. Remote Sens. 2018, 56, 652–6536. [Google Scholar] [CrossRef]
  19. Li, Y.; Zhang, Y.; Huang, X.; Zhu, H.; Ma, J. Large-Scale Remote Sensing Image Retrieval by Deep Hashing Neural Networks. IEEE Trans. Geosci. Remote Sens. 2018, 56, 950–965. [Google Scholar] [CrossRef]
  20. Chen, Y.; Lin, Z.; Zhao, X.; Wang, G.; Gu, Y. Deep learning-based classification of hyperspectral data. IEEE J. Sel. Top. Appl. Earth Obs. Remote Sens. 2014, 7, 2094–2107. [Google Scholar] [CrossRef]
  21. Santara, A.; Mani, K.; Hatwar, P.; Singh, A.; Garg, A.; Padia, K.; Mitra, P. BASS Net: Band-Adaptive Spectral-Spatial Feature Learning Neural Network for Hyperspectral Image Classification. IEEE Trans. Geosci. Remote Sens. 2017, 55, 5293–5301. [Google Scholar] [CrossRef]
  22. Zhao, W.; Du, S. Spectral–spatial feature extraction for hyperspectral image classification: A dimension reduction and deep learning approach. IEEE Trans. Geosci. Remote Sens. 2016, 54, 4544–4554. [Google Scholar] [CrossRef]
  23. Mei, S.; Ji, J.; Hou, J.; Li, X.; Du, Q. Learning sensor-specific spatial-spectral features of hyperspectral images via convolutional neural networks. IEEE Trans. Geosci. Remote Sens. 2017, 55, 4520–4533. [Google Scholar] [CrossRef]
  24. Zhang, L.; Zhang, L.; Du, B. Deep learning for remote sensing data: A technical tutorial on the state of the art. IEEE Geosci. Remote Sens. Mag. 2016, 4, 22–40. [Google Scholar] [CrossRef]
  25. Chen, Y.; Jiang, H.; Li, C.; Jia, X.; Ghamisi, P. Deep Feature Extraction and Classification of Hyperspectral Images Based on Convolutional Neural Networks. IEEE Trans. Geosci. Remote Sens. 2016, 54, 6232–6251. [Google Scholar] [CrossRef]
  26. Parker, A.R. The diversity and implications of animal structural colours. J. Exp. Biol. 1998, 201, 2343–2347. [Google Scholar]
  27. Caulfield, H.J. Artificial color. Neurocomputing 2003, 51, 463–465. [Google Scholar] [CrossRef]
  28. Fu, J.; Caulfield, H.J.; Wu, D.; Tadesse, W. Hyperspectral image analysis using artificial color. J. Appl. Remote Sens. 2010, 4, 043514. [Google Scholar]
  29. Simonyan, K.; Zisserman, A. Very Deep Convolutional Networks for Large-Scale Image Recognition. arXiv, 2014; arXiv:1409.1556. [Google Scholar]
  30. He, K.; Zhang, X.; Ren, S.; Sun, J. Deep residual learning for image recognition. In Proceedings of the IEEE Conference on Computer Vision and Pattern Recognition, Las Vegas, NV, USA, 26 June–1 July 2016; pp. 770–778. [Google Scholar]
  31. Aksoy, S.; Koperski, K.; Tusk, C.; Marchisio, G.; Tilton, J.C. Learning Bayesian classifiers for scene classification with a visual grammar. IEEE Trans. Geosci. Remote Sens. 2005, 43, 581–589. [Google Scholar] [CrossRef]
  32. Aptoula, E. Remote sensing image retrieval with global morphological texture descriptors. IEEE Trans. Geosci. Remote Sens. 2014, 52, 3023–3034. [Google Scholar] [CrossRef]
  33. Liu, Y.; Zhang, D.; Lu, G.; Ma, W.Y. A survey of content-based image retrieval with high-level semantics. Pattern Recognit. 2007, 40, 262–282. [Google Scholar] [CrossRef]
  34. Plaza, A.J. Content-based hyperspectral image retrieval using spectral unmixing. Proc. SPIE 2011, 8180, 81800O. [Google Scholar]
  35. Plaza, A.; Plaza, J.; Paz, A.; Blazquez, S. Parallel CBIR System for Efficient Hyperspectral Image Retrieval from Heterogeneous Networks of Workstations. In Proceedings of the Ninth International Symposium on Symbolic and Numeric Algorithms for Scientific Computing (SYNASC 2007), Timisoara, Romania, 26–29 September 2007; pp. 285–291. [Google Scholar]
  36. Veganzones, M.A.; Grana, M. A spectral/spatial CBIR system for hyperspectral images. IEEE J. Sel. Top. Appl. Earth Obs. Remote Sens. 2012, 5, 488–500. [Google Scholar] [CrossRef]
  37. Veganzones, M.A.; Datcu, M.; Graña, M. Further results on dissimilarity spaces for hyperspectral images RF-CBIR. Pattern Recognit. Lett. 2013, 34, 1659–1668. [Google Scholar] [CrossRef]
  38. Ömrüuzun, F.; Demir, B.; Bruzzone, L.; Çetin, Y.Y. Content based hyperspectral image retrieval using bag of endmembers image descriptors. In Proceedings of the Workshop on Hyperspectral Image and Signal Processing: Evolution in Remote Sensing, Los Angeles, CA, USA, 21–24 August 2016; pp. 1–4. [Google Scholar]
  39. Alber, I.E.; Farber, M.S.; Yeager, N.; Xiong, Z.; Pottenger, W.M. Retrieval of multi-and hyperspectral images using an interactive relevance feedback form of content-based image retrieval. In Data Mining and Knowledge Discovery: Theory, Tools, and Technology III; International Society for Optics and Photonics: Orlando, FL, USA, 2001; Volume 4384, pp. 56–67. [Google Scholar]
  40. Tekeste, I.; Demir, B. Advanced Local Binary Patterns for Remote Sensing Image Retrieval. In Proceedings of the IGARSS 2018—2018 IEEE International Geoscience and Remote Sensing Symposium, Valencia, Spain, 22–27 July 2018; pp. 6855–6858. [Google Scholar]
  41. Makantasis, K.; Karantzalos, K.; Doulamis, A.; Doulamis, N. Deep supervised learning for hyperspectral data classification through convolutional neural networks. In Proceedings of the 2015 IEEE International Geoscience and Remote Sensing Symposium (IGARSS), Milan, Italy, 26–31 July 2015; pp. 4959–4962. [Google Scholar]
  42. Lee, H.; Kwon, H. Going Deeper With Contextual CNN for Hyperspectral Image Classification. IEEE Trans. Image Process. 2017, 26, 4843–4855. [Google Scholar] [CrossRef] [PubMed]
  43. Chen, Y.; Zhao, X.; Jia, X. Spatial Classification of Hyperspectral Data Based on Deep Belief Network. IEEE J. Sel. Top. Appl. Earth Obs. Remote Sens. 2015, 8, 2381–2392. [Google Scholar] [CrossRef]
  44. Kumar, S.; Ghosh, J.; Crawford, M.M. Best-bases feature extraction algorithms for classification of hyperspectral data. IEEE Trans. Geosci. Remote Sens. 2001, 39, 1368–1379. [Google Scholar] [CrossRef]
  45. Liu, B.; Yu, X.; Zhang, P.; Yu, A.; Fu, Q.; Wei, X. Supervised Deep Feature Extraction for Hyperspectral Image Classification. IEEE Trans. Geosci. Remote Sens. 2018, 56, 1909–1921. [Google Scholar] [CrossRef]
  46. Richard, N.; Helbert, D.; Olivier, C.; Tamisier, M. Pseudo-Divergence and Bidimensional Histogram of Spectral Differences for Hyperspectral Image Processing. J. Imaging Sci. Technol. 2016, 60, 50402. [Google Scholar] [CrossRef]
  47. Köhler, R. The International Vocabulary of Metrology: Basic and General Concepts and Associated Terms. Why? How? In Transverse Disciplines in Metrology; Wiley & Sons: New York, NY, USA, 2009; pp. 233–238. [Google Scholar]
  48. Deng, J.; Dong, W.; Socher, R.; Li, L.J.; Li, K.; Li, F.F. ImageNet: A large-scale hierarchical image database. In Proceedings of the 2009 IEEE Conference on Computer Vision and Pattern Recognition, Miami, FL, USA, 20–25 June 2009; pp. 248–255. [Google Scholar]
  49. Shimano, N. Optimization of spectral sensitivities with Gaussian distribution functions for a color image acquisition device in the presence of noise. Opt. Eng. 2006, 45, 013201. [Google Scholar] [CrossRef]
Figure 1. Block diagram of the proposed framework.
Remotesensing 11 00600 g001
Figure 2. Examples from the ICONES-Hyperspectral Satellite Imaging dataset (RGB-display).
Remotesensing 11 00600 g002
Figure 3. Different levels of Spectral Sensitivity Functions (SSFs).
Remotesensing 11 00600 g003
Figure 4. Best SSF for each class according to the retrieval performance.
Remotesensing 11 00600 g004
Figure 5. Examples of RGB-display images (form left to right) of Mountain, Snow, Forest, and Dense-Urban categories (line 1) with their corresponding spectra (line 2) and best triplet of SSFs (line 3).
Remotesensing 11 00600 g005
Table 1. Retrieval results for different sampling levels of Spectral Sensitivity Functions (SSFs) according to the better spectral sensitivity function for each category from the ICONES-Hyperspectral Satellite Imaging (HSI) dataset.
LevelsLevel 1Level 2Level 3Level 4Level 5
(%)P@20MAPP@20MAPP@20MAPP@20MAPP@20MAP
Class
Agriculture44.331.8347.733.9350.437.0551.339.0749.639.0
Cloud83.9780.3780.8677.7785.8682.5386.0382.0687.7682.98
Desert46.6731.148.6131.8648.2433.4748.5234.2350.6534.87
Dense Urban84.3870.9886.3773.3586.7173.7187.674.859075.41
Forest57.6137.6154.2837.7160.5840.9661.0941.6361.1642.95
Mountain6551.166.4251.6686.215367.4552.4667.3652.64
Ocean75.2262.7275.9661.8978.1663.5378.7566.2977.0667.59
Snow52.2735.4853.1835.8651.3639.7754.6441.6856.4544.17
Wetland49.1739.5446.6738.3345.8339.748.1942.7248.7543.38
Whole dataset59.6146.460.3846.8260.8147.262.0648.0162.548.76
Table 2. RGB image retrieval results (Baseline) compared to level 5 best SSFs by category.
RGBLevel 5 Best SSFs
(%)P@20MAPP@20MAP
Class
Agriculture71.855.3949.639.0
Cloud68.164.0487.7682.98
Desert66.246.5550.6534.87
Dense-Urban94.9383.6350.6534.87
Forest77.0353.269075.41
Mountain68.4957.2467.3652.64
Ocean91.479.5477.0667.59
Snow72.5551.2756.4544.17
Wetland24.4319.8348.7543.38
Whole dataset74.0859.3362.548.76
Table 3. Retrieval results for the original RGB images (baseline), the Partial spectral sampling case (Visible and Infra-red ranges), and the Whole spectral sampling case according to the best set of three spectral sensitivity functions for each category. For some categories, the visible range allows better discrimination, and for others, the infrared range is the dominant one.
RGB (Baseline)VisibleInfraRedWhole
(%)P@10P@20MAPP@10P@20MAPP@10P@20MAPP@10P@20MAP
A82.671.855.488.48168.374.26042.67865.248.9
C80.368.16487.678.869.183.873.665.793.878.666.5
D75.266.246.5806749.380.768.748.880.970.250.7
D-U96.394.983.697.896.887.889.596.784.210097.586.5
F84.87753.379.26948.483.9 73.5 ( ) 52 ( ) 87.980.757.9
M77.968.557.272.161.956.576.5 76.5 ( ) 64.5 ( ) 80.973.164.5
O92.391.479.586.280.468.184.378.464.389.789.983.1
S8672.551.38873.449.278.269.6 49.6 ( ) 8879.357.8
W33.724.419.850.536.527.739.227.522.241.929.723.9
Avg81.574.159.382.473.35980.971.755.283.3174.1859.07
Table 4. Retrieval results for the ANKARA dataset (Land-Use categories).
WholeRGB
Category/MetricP@5 (%)MAP (%)P@5 (%)MAP (%)
Rural Area73.757.3157.1441.85
Urban Area72.7157.3480.156.88
Cultivated Land86.5673.1383.370.3
Forest73.757.3178.058.81
Average81.0366.5477.361.8
Table 5. Performance evaluation of our hyperspectral images content description approach with a method based on Principal Component Analysis (PCA) on the ICONES-HSI dataset.
MethodAverage MAPSignature Generation Time
PCA-based HSI content description51.32%7.2 s/image
Proposed SSFs-based method59.07%1.2 s/image

