Article

Effective Band Ratio of Landsat 8 Images Based on VNIR-SWIR Reflectance Spectra of Topsoils for Soil Moisture Mapping in a Tropical Region

1
Faculty of Geology, VNU University of Science, 334 Nguyen Trai, Thanh Xuan district, Hanoi 10000, Vietnam
2
Center for Consultation and Technology Transfer, College of Land Management and Rural Development, Vietnam National University of Forestry, Xuan Mai town, Chuong My district, Hanoi 10000, Vietnam
3
Department of Urban Management, Graduate School of Engineering, Kyoto University, Katsura C1-2-215, Kyoto 615-8540, Japan
4
VNU Key Laboratory of GEOCRE, VNU University of Science, 334 Nguyen Trai, Thanh Xuan district, Hanoi 10000, Vietnam
*
Author to whom correspondence should be addressed.
Submission received: 19 February 2019 / Revised: 18 March 2019 / Accepted: 20 March 2019 / Published: 25 March 2019
(This article belongs to the Special Issue Remote Sensing of Tropical Environmental Change)

Abstract

:
Effective mapping and monitoring of soil moisture content (SMC) in space and time is an expected application of remote sensing for agricultural development and drought mitigation, particularly in the context of global climate change impact, given that agricultural drought is occurring more frequently and severely worldwide. This study aims to develop a regional algorithm for estimating SMC by using Landsat 8 (L8) imagery, based on analyses of the response of soil reflectance, by corresponding L8 bands with the change of SMC from dry to saturated states, in all 103 soil samples taken in the central region of Vietnam. The L8 spectral band ratio of the near-infrared band (NIR: 850–880 nm, band 5) versus the short-wave infrared 2 band (SWIR2: 2110 to 2290 nm, band 7) shows the strongest correlation to SMC by a logarithm function (R2 = 0.73 and the root mean square error, RMSE ~ 12%) demonstrating the high applicability of this band ratio for estimating SMC. The resultant maps of SMC estimated from the L8 images were acquired over the northern part of the Central Highlands of Vietnam in March 2015 and March 2016 showed an agreement with the pattern of severe droughts that occurred in the region. Further discussions on the relationship between the estimated SMC and the satellite-based retrieved drought index, the Normal Different Drought Index, from the L8 image acquired in March 2016, showed a strong correlation between these two variables within an area with less than 20% dense vegetation (R2 = 0.78 to 0.95), and co-confirms the bad effect of drought on almost all areas of the northern part of the Central Highlands of Vietnam. Directly estimating SMC from L8 imagery provides more information for irrigation management and better drought mitigation than by using the remotely sensed drought index. Further investigations on various soil types and optical sensors (i.e., Sentinel 2A, 2B) need to be carried out, to extend and promote the applicability of the prosed algorithm, towards better serving agricultural management and drought mitigation.

1. Introduction

Soil moisture content (SMC) is a key parameter that needs be monitored in order to provide information for plant growth and crop management, as well as to understand water-associated hazards such as flood and drought [1,2]. Particularly, SMC in the top land layer is changed quickly, due to the changes in climate conditions, such as the magnitude of the solar radiation, precipitation, and evaporation; therefore, monitoring the change in the SMC of the top land layer helps us to better understand the change process, and to accurately forecast climate extreme events [3].
Over recent decades, remote sensing has been used in many studies for rapidly measuring and mapping the surface soil moisture at large spatial scales [4,5,6,7]. Although both optical and microwave remote sensing have been used to estimate SMC, microwave remote sensing is favored, because of its independence of solar illumination and cloud cover conditions [8]. Passive microwave data have coarse spatial resolutions (The Advanced Microwave Scanning Radiometer for EOS, AMSR-E: 5 km; The Soil Moisture and Ocean Salinity, SMOS: 50 km) and are inappropriate for monitoring SMC variation on a local scale. Active microwave data, which provides even better spatial resolutions (10–100 m), are still not suitable for monitoring the SMC during the short dry season in tropical regions, due to its poor temporal resolution and high cost requirements [9,10]. Therefore, finding suitable optical remote sensing data to couple with microwave remote sensing data for effective monitoring of SMC has been encouraged and carried out.
The Landsat program has provided data for satellite-based observations over the last 40 years, particularly changes in anthropogenic activities (e.g., land cover change, urbanization, deforestation, etc.) and natural processes (e.g., changes in hydrological process, aquatic environment, vegetation, coastline, etc.) [11]. Additionally, recent Landsat satellites (TM, ETM+, and OLI) provide adequate spatial and temporal resolution data for the detection of the seasonal variation of objects on the land surface at large scales, free of charge. For soil moisture monitoring purposes, Landsat 5 and 7 have been rarely used to estimate SMC directly from their spectral bands or band ratios [9,12,13,14], but they are more widely estimated through the use of a combination of vegetation-based indices, such as the Normalized Difference Vegetation Index (NDVI), the Temperature Vegetation Dryness Index (TVDI), with the Land Surface Temperature (LST), retrieved from these sensors’ signals [15,16,17,18]. The newest Landsat, Landsat 8 (L8), which was launched recently in 2013, was also explored for SMC estimation [19,20,21]. As with the use of previous Landsats for SMC measurement purposes, the SMC estimation models using L8 were developed in these studies, mostly based on the empirical linear relationship between in situ SMC with vegetation indices, such as the Normalized Difference Tillage Index (NDTI) and TDVI [10], and/or the Normalized Difference Water Index (NDWI) [20] and/or LST [19] and/or NDVI [22]. The spectral response of various SMCs has not been considered and integrated in the model development process, making it difficult to interpret and evaluate the performance of the proposed models. The lack of in situ spectral data of soils at various SMCs presents a weak physical basis for the proposed models for appropriate SMC monitoring, particularly when applying them in a region with different temperature conditions and vegetation coverage characteristics.
The Central Region of Vietnam stretches over approximately 9 degrees of latitude, from 19°N to 10°N in the north–south direction, with a total land area of 150,379 km2 and 25,492,000 residents [23]. The region is highly vulnerable to drought disasters during the dry season, which have led to crop loss and land degradation in recent years [24,25]. Using satellite data to monitor SMC in the region may help local governors and communities to adjust their crop plans and to build solutions for proactive responses to the impacts of drought disaster.
This study aims at investigating the response of soil surface reflectance corresponding to L8 band data to various SMC, using the in situ spectral data of soil samples belonging to six soil types taken from the central region of Vietnam, and proposing a model for estimating the SMC using L8. The model then is applied to estimate SMC in the central region of Vietnam in early April and May 2015, for further discussion on the compatibility of the estimated SMC for drought monitoring. In this study, the superiority of the band ratio in reducing the atmosphere effect of the satellite data was also evaluated through a comparison among the retrieved spectrals and ratios of L8 band 5 (B5), band 7 (B7), and B5/B7 with concurrent in situ radiometric data. The results of this work are described in Section 3 (Results and Discussion) and divided into three parts: (1) the response of soil reflectance to various SMCs, based on the change in the spectral features of the soil samples at 10 various SMCs, from 0% to the saturated state; (2) the regional L8 band-based SMC estimation model that was developed using the curve-fit regression of SMC, and reflectance corresponding to the L8 spectral bands; (3) finally, a discussion is made on the relationship of the estimated SMC and the Normal Difference Drought Index (NDDI) [26] in drought assessment and mapping.

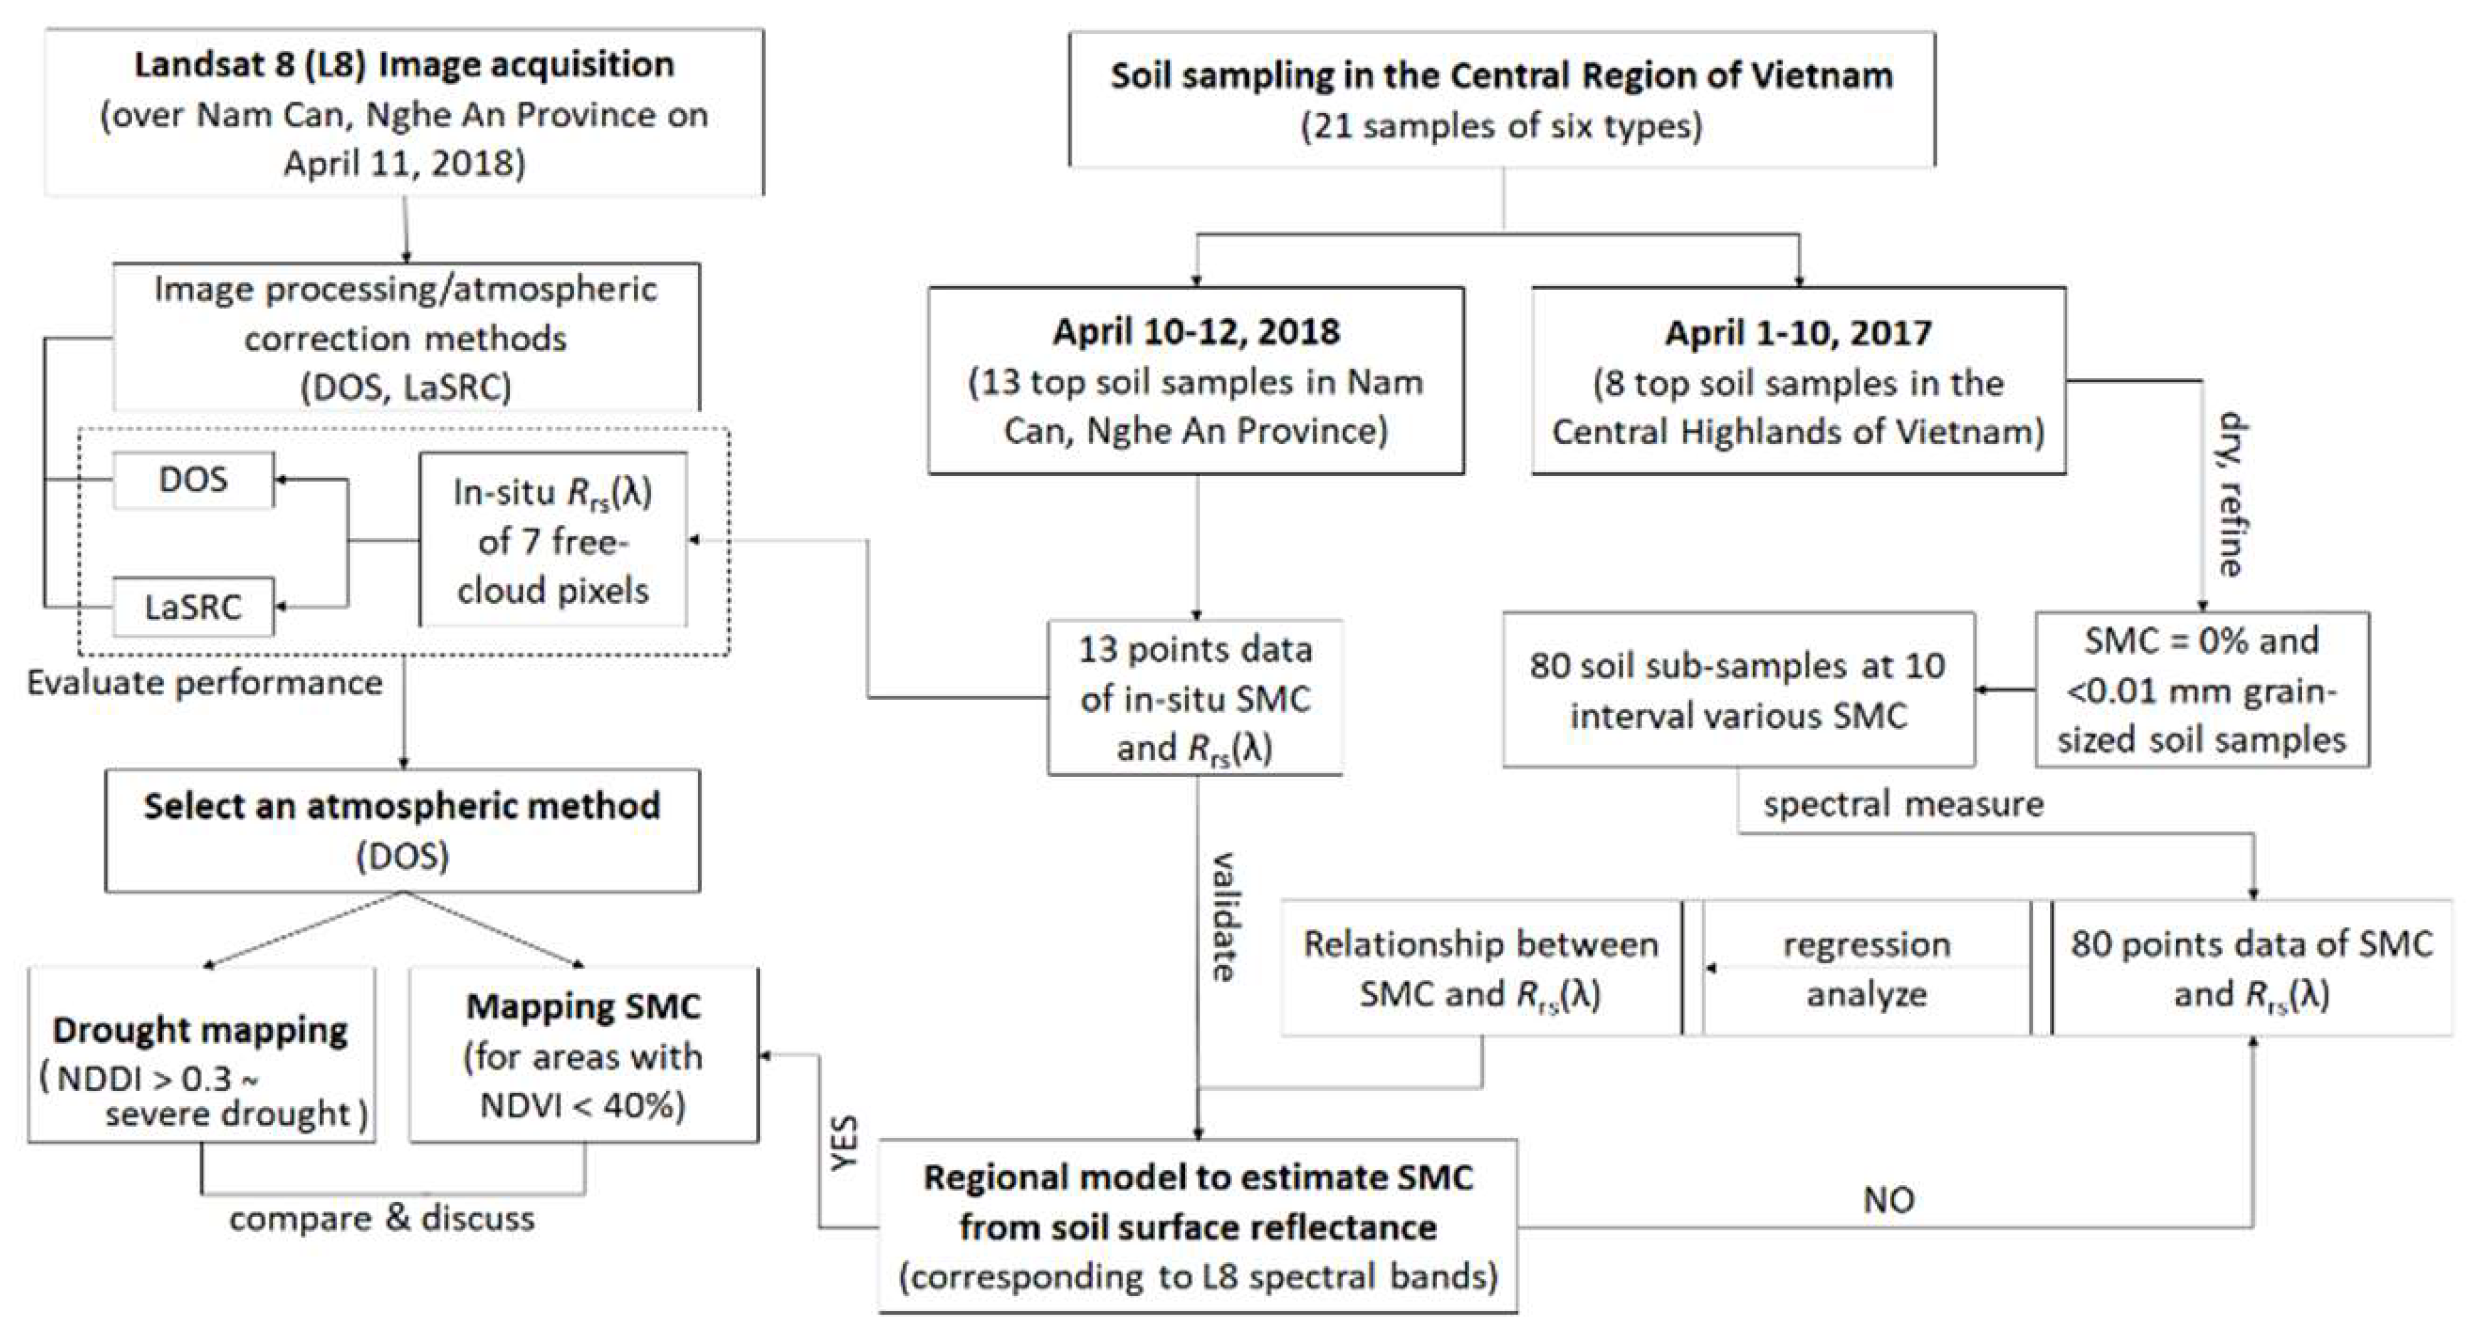
2. Materials and Methods

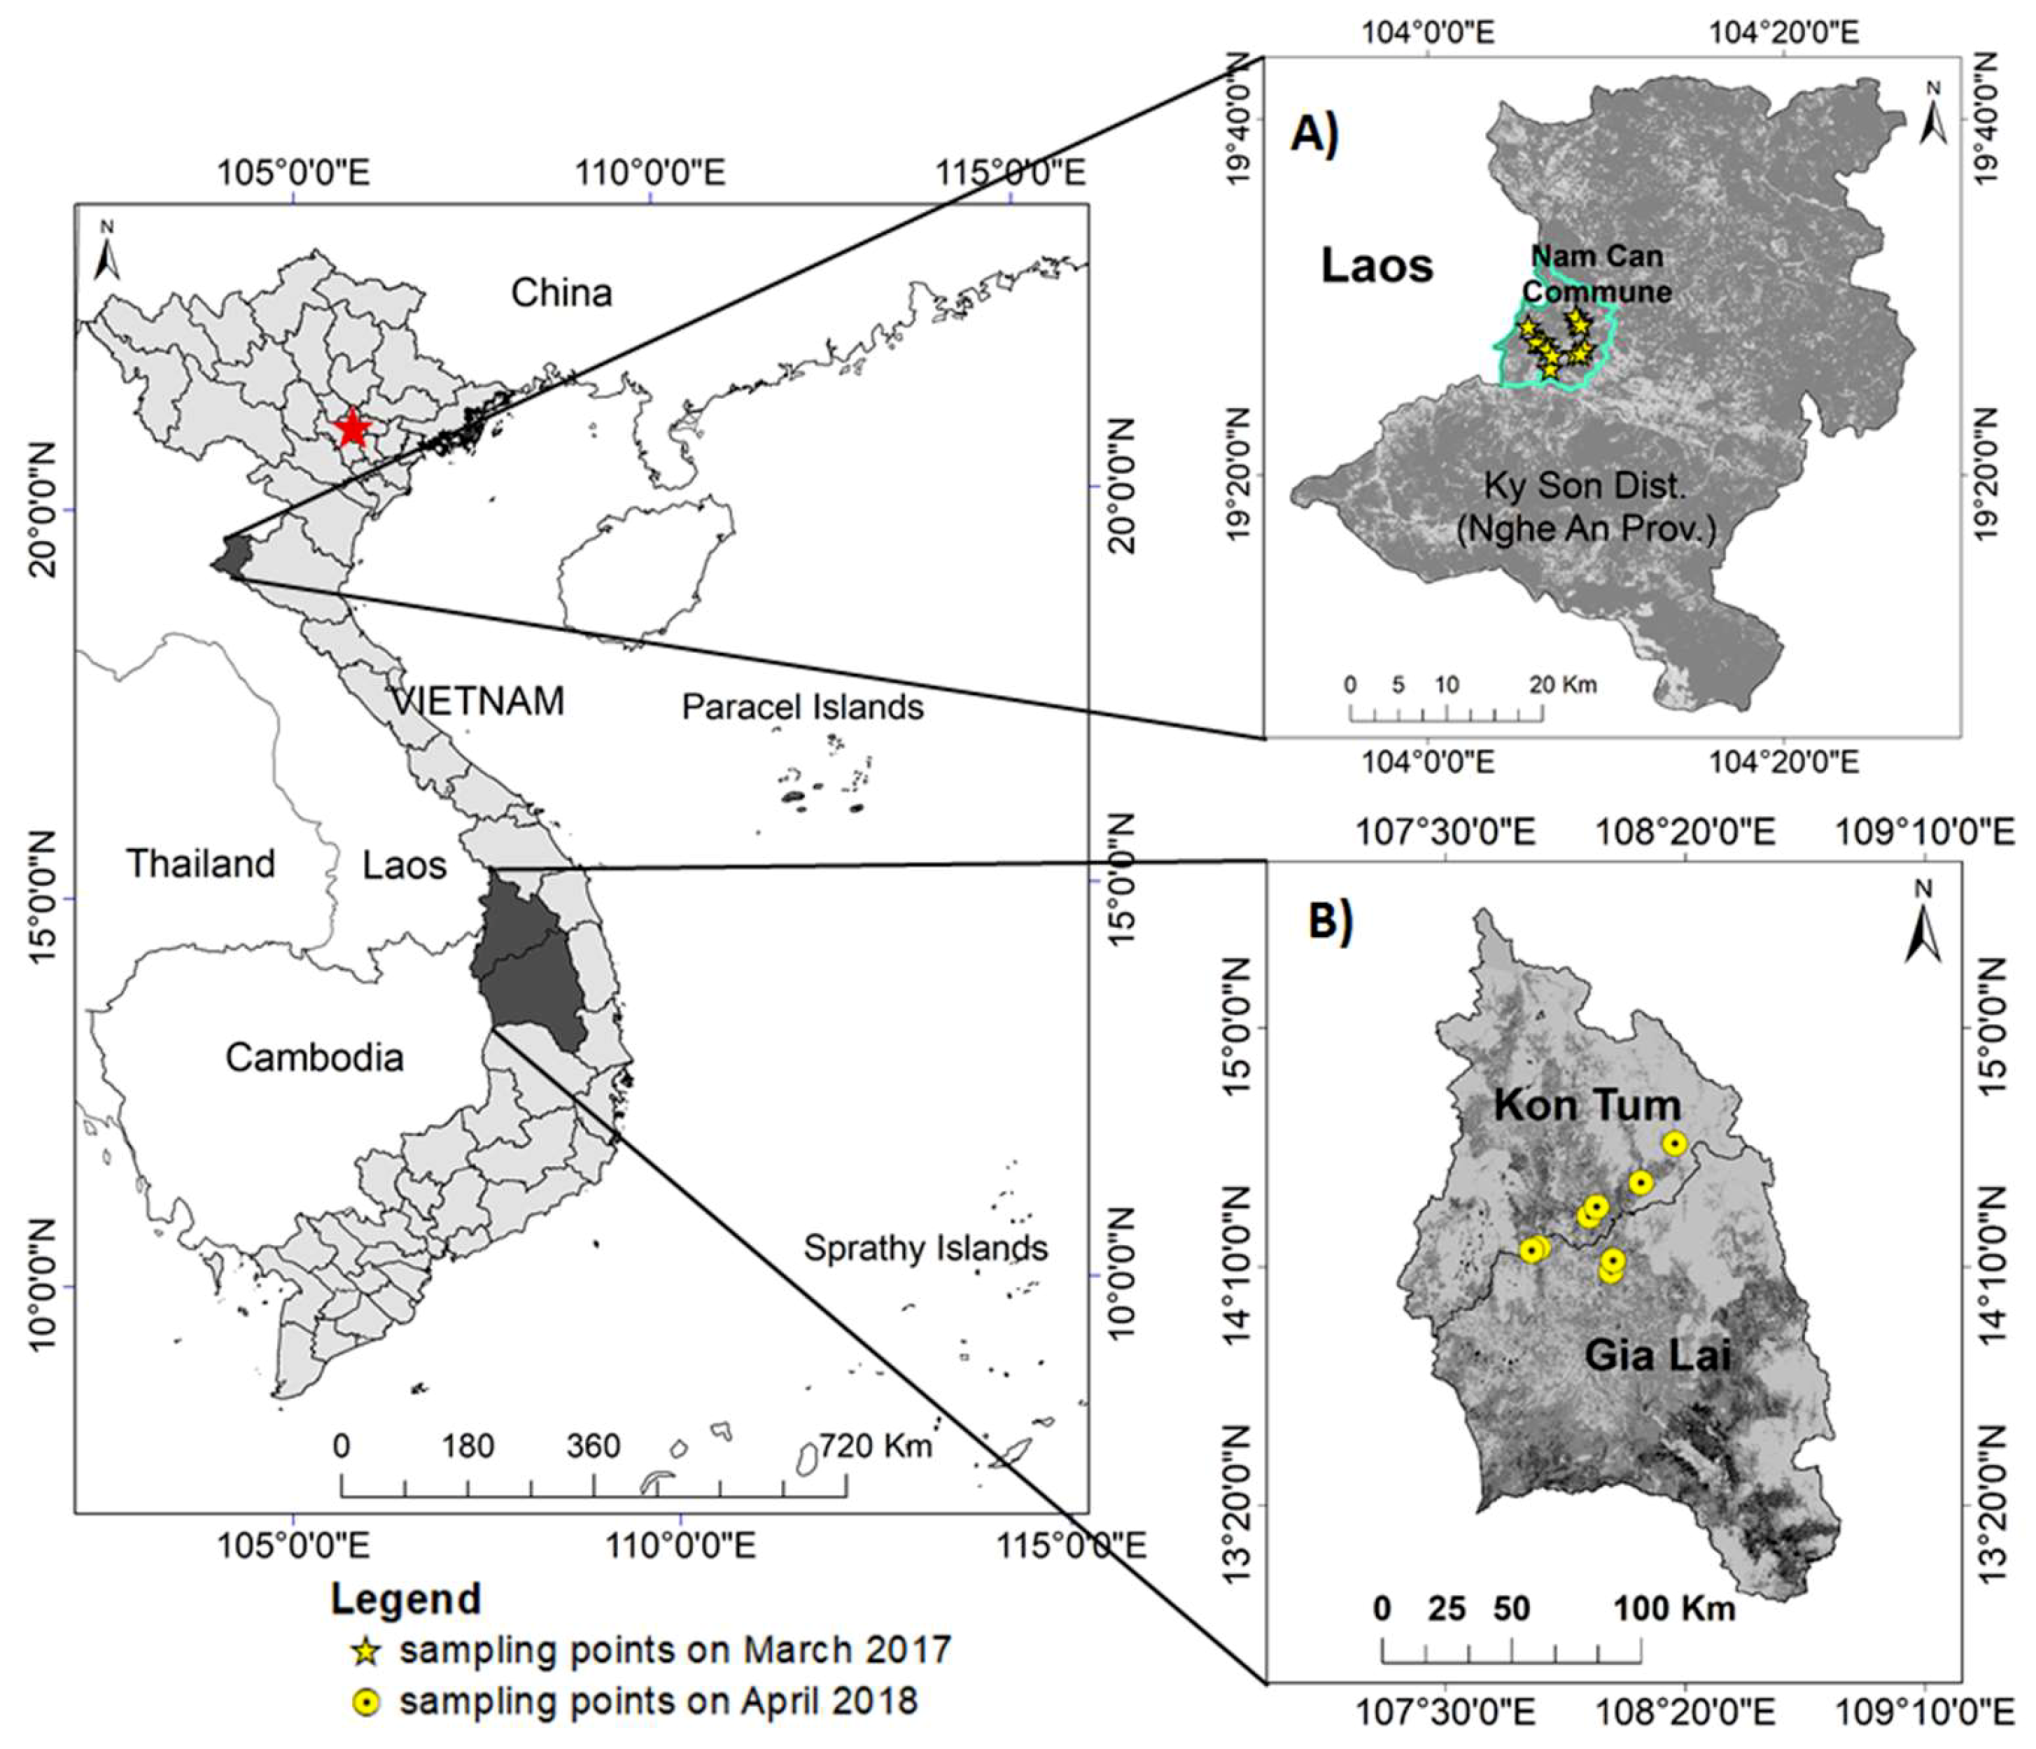
2.1. Soil Sampling and Processing

Top soil samples were taken from 21 points distributed over the Nam Can commune of Nghe An Province in April 2018 (13 topsoil samples) and the northern part of the Central Highlands of Vietnam (eight topsoil samples) in April 2017, as shown in Figure 1A,B, respectively. According to the soil map of Vietnam [27], a total of 21 soil samples (Table 1) were taken from six soil types covering both sampling areas, including: ferric acrisols (15 samples), orthic ferralsols (two samples), rhodic ferralsols (one sample), acric ferralsols (one sample), eutric fluvisols (one sample), and dystric gleysols (one sample).
At each sampling point, the soil sample taken at the land top layer was uncovered by vegetation from 0 to 10 cm depth. Approximately 1 kg of topsoil was collected in a soil sample to ensure the representation of the sample. The locations of soil samples were located by a GPS (the Global Positioning System) receiver and added onto the soil map [27] to identify the soil types and the corresponding characteristics of the soil samples.
Soil samples from the northern part of the Central Highlands of Vietnam were first processed into a dry state at SMC = 0% by oven-drying until the weight remained constant, and then refined to a fine grain size (<0.01 mm), to subtract the effects of the grain size difference on soil reflectance. Each soil sample was then sub-sampled into 10 lots of 20 g samples, to which 10 various amounts of water were added, to create a series of soil samples with 10 various SMC levels. A total of 80 soil samples were created from eight samples taken from the northern part of the Central Highlands of Vietnam (Figure 1b).

2.2. SMC Determination and Spectral Measurement

The spectral reflectance of these 80 soil samples were measured in a controlled laboratory environment, using an ASD FieldSpec 3 Max Portable spectroradiometer (ASD. Inc. Boulder, CO, USA) with fiber optics and an illumination source (ASD Pro Lamp (14.5 V, 50W), Boulder, CO, USA), which had been corrected for indoor environment. The measurement provided reflectance data every 1 nm from 350 to 2500 nm for each soil sample. After spectral measurement, these samples were determined for the SMC by using the standard method [29], where the moisture content (%) is calculated from the sample weight before and after drying, by Equation (1). Also, the datasets of soil reflectance, Rrs(λ), and SMC from these 80 soil samples were curve-fit-analyzed, to construct the model for estimating SMC from the soil surface reflectance:
SMC = (M2/M1) ×100
where the SMC units in %, M2 is the weight of moist soil, and M1 is the weight of dry soil.
Furthermore, 13 soil samples (ferric acrisols soil types) taken from the topsoil layer at 13 points over the Nam Can commune (Figure 1a) were also measured in-laboratory for reflectance, and the SMC was determined. The datasets of Rrs(λ) and SMC from these soil samples were used to examine the performance of the proposed SMC estimation model, derived from the 80 above-mentioned soil samples, and to evaluate the atmospheric correction method for the L8 data obtained concurrently on 11 April 2018.

2.3. L8 Data Extraction and SMC Mapping

The L8 images used in this study (Table 2) were downloaded from the USGS EarthExplorer website at both levels 1 and 2. L8 level 1 data was geometrically corrected, using ground control points (GCPs) and a digital elevation model (DEM) to correct for terrain and view angles. The Landsat 8 Surface Reflectance data used in this study was directly ordered and downloaded from the USGS Earth Explorer, whereas the surface reflectance, Rrs(λ), was retrieved at a 30-m spatial resolution generated from L8 data, through the application of the Landsat Surface Reflectance Code (LaSRC), which uses the Moderate Resolution Imaging Spectroradiometer—Climate Modeling Grid-Aerosol Information as input factors for atmospheric correction [30]. The L8 at level 1 data was radiometrically calibrated into top-of-atmosphere (TOA) reflectance, using the standard method integrated in the ENVI 5.3 routine [31] and then into bottom-of-atmosphere reflectance, Rrs(λ), using the dark object subtraction method, DOS [32]. The L8 satellite-retrieved Rrs(λ) outputted from these two atmospheric correction methods were then evaluated and selected for mapping SMC over the Central Region of Vietnam. A density slice integrated in ENVI 5.3 was applied to each faction map, using the following intervals: 0 to 10%; 10 to 20%; 20 to 30%; 30 to 40%; 40 to 50%; 50 to 60%; 60 to 70%; 70 to 80%; 80 to 90%; >90%. Only low-density vegetation areas on the scenes were applied to the SMC estimation model, and to this classification method.
The process to estimate and map SMC in the Central Region of Vietnam is shown in Figure 2 below, which describes the flowchart of methods used in this work.

3. Results

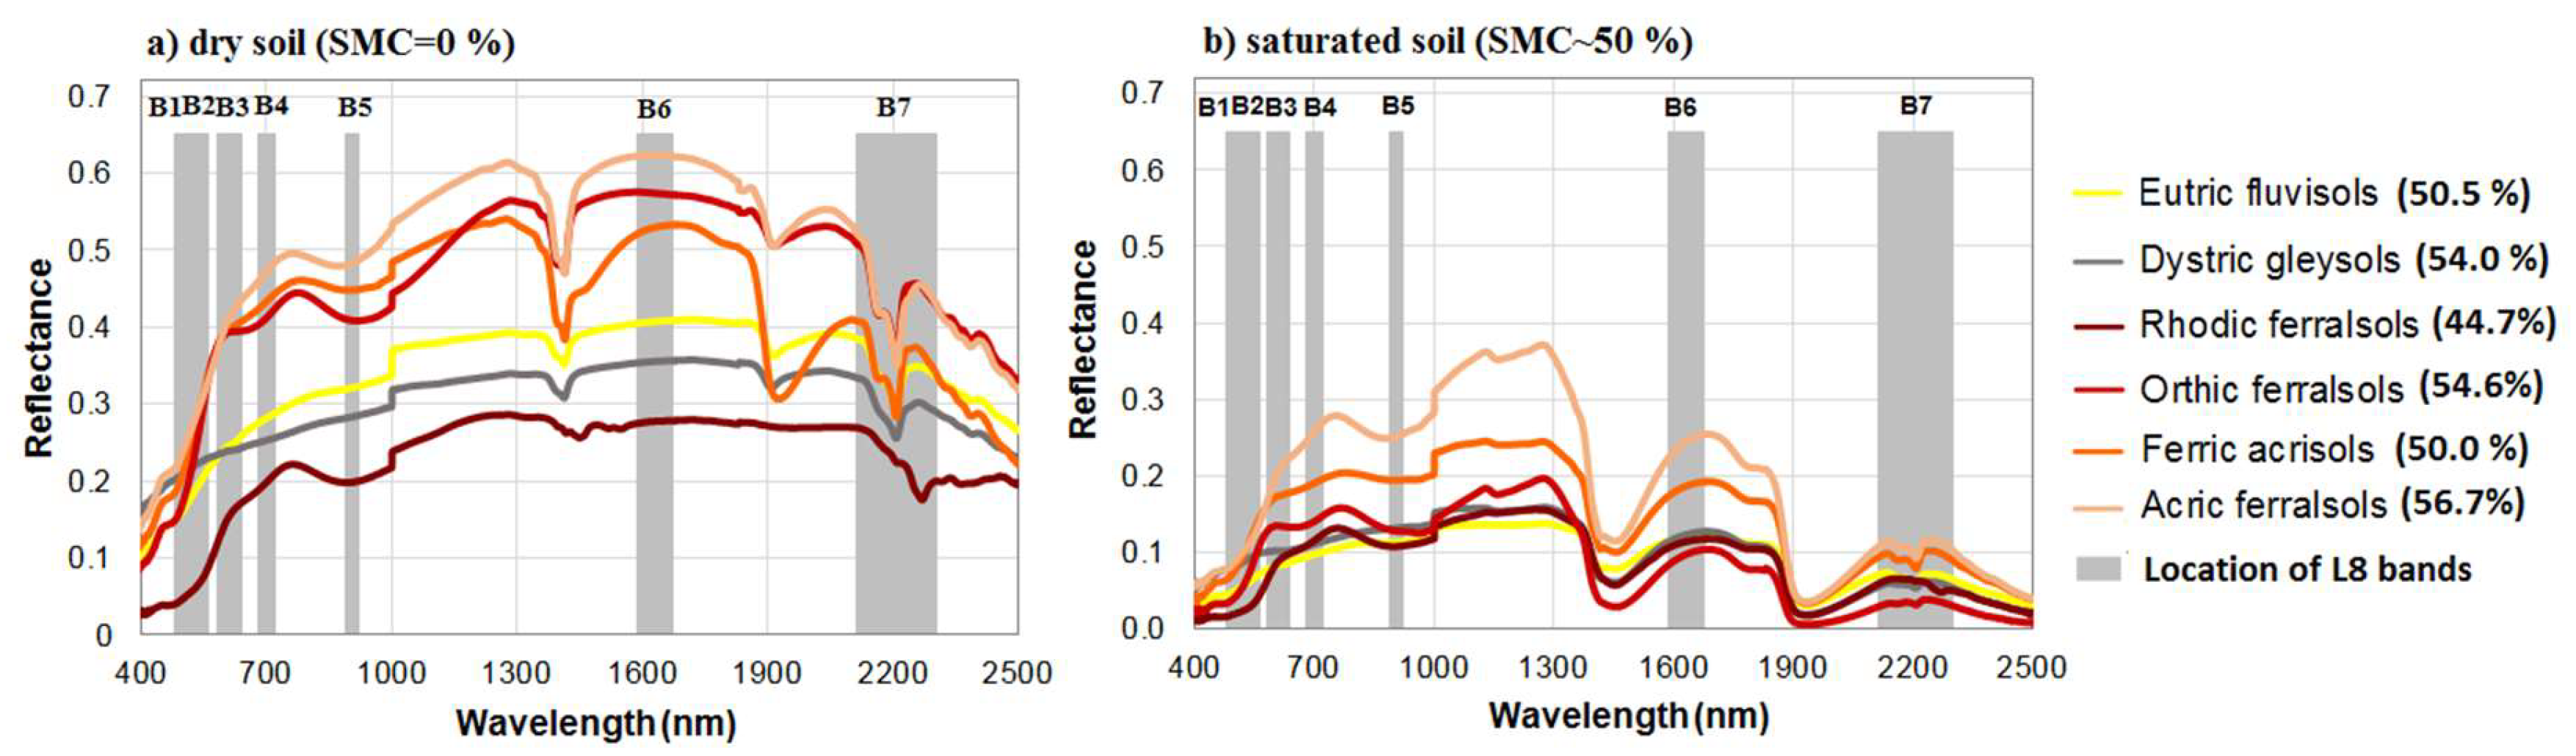
3.1. Spectral Response of SMC

By the experiment described in Section 2.1 and Section 2.2, the results demonstrated that the SMCs at the saturated state of the soil samples were only slightly different among the soil types, ranging from 44.7% for the rhodic ferralsols soil to 56.7% for the acric ferralsols soil, with an average of 51.9% for all six soil types. Figure 3 presents the spectral change of the soil at SMC = 0%, and at the saturation state corresponding to SMC ~51.9%. Accordingly, the mean reflectance, Rrs(λ) of soil with 0% SMC was approximately double to three times higher than the soil at the saturation state. Over the spectrum from 400 nm to 2500 nm, all of the soil spectral lines of both these SMC levels clearly showed a broad peak at the regions corresponding to the location of the L8 short-wave infrared band 1 (band 6: B6), and two negative peaks at the regions corresponding to the locations of L8, B5, and B7, whereas the negative peak located within the B7 spectral range is sharper and more isolated from the surrounding regions than the trough located in B5. In both of the soil states, dry and saturation, acric ferralsols has a higher Rrs(λ) than the other soil types, which may be a consequence of the higher amount of clayish minerals such as kaolinite consisted in this soil types than the others [28]. The rhodic ferralsols soil samples had the lowest Rrs(λ) in the dry state, but it had moderate Rrs(λ) at the saturation state, compared to the others. The sample of rhodic ferralsol soil, which was the highest Fe2O3-containing soil type (approximately 25%) compared to the other soil types [28], was collected in the weathering crust of the eruptive basalt rock that is commonly found in the Central Highlands of Vietnam. In that sense, it can be recognized that it is not only SMC that is affecting the Rrs(λ), but also the physical–chemical properties contributing to the change in the Rrs(λ) of soil.
The response of soil reflectance, Rrs(λ) to the change of SMC was further examined and explored through charts presented in Figure 4. According to these charts, the higher the SMC, the lower the Rrs(λ) obtained. This trend was demonstrated in all six soil samples corresponding to the six investigated soil types. In the spectral lines of acric ferralsols (Figure 4a) and dystric gleysols (Figure 4b), the soil samples rose gradually with the decrease of SMC, and in four other soil-type samples, the spectral lines rose suddenly at various SMC, depending on the soil type, i.e., at SMC = 8.7% of the rhothic ferrasols sample (Figure 4c); at SMC = 17.3% of the eutric fluvisol samples (Figure 4d); at SMC = 33.3% of the orthic ferralsols sample (Figure 4e); at SMC = 25.9% of the ferric acrisol sample (Figure 4f), particularly within the spectral region from near-infrared (NIR) to short-wave infrared (SWIR).
In all of the soil type samples, the spectral trough at the B7 location was clearly presented, and it increased inversely with SMC. Similarly, the trough within B5 was not clearly presented in several cases, i.e., in dystric gleysols (Figure 4b) and eutric fluvisols (Figure 4d) samples, but the inverse trend between Rrs(λ) and SMC was also shown in all cases. The spectral peak located with the same location of B6 was also presented clearly in all cases, but the inverse trend between Rrs(λ) and SMC was apparent in several cases, particularly near the saturation and saturation states of dystric gleysols, rhothic ferrasols, and ferric acrisols soil samples (Figure 4b,c,f). The strong correlations of detected SMC with B5, B6, and B7 in each soil sample from this study (Table 3) can help us to understand why these bands or spectral regions have been used for estimating SMC from satellite data in the preceding works [12].

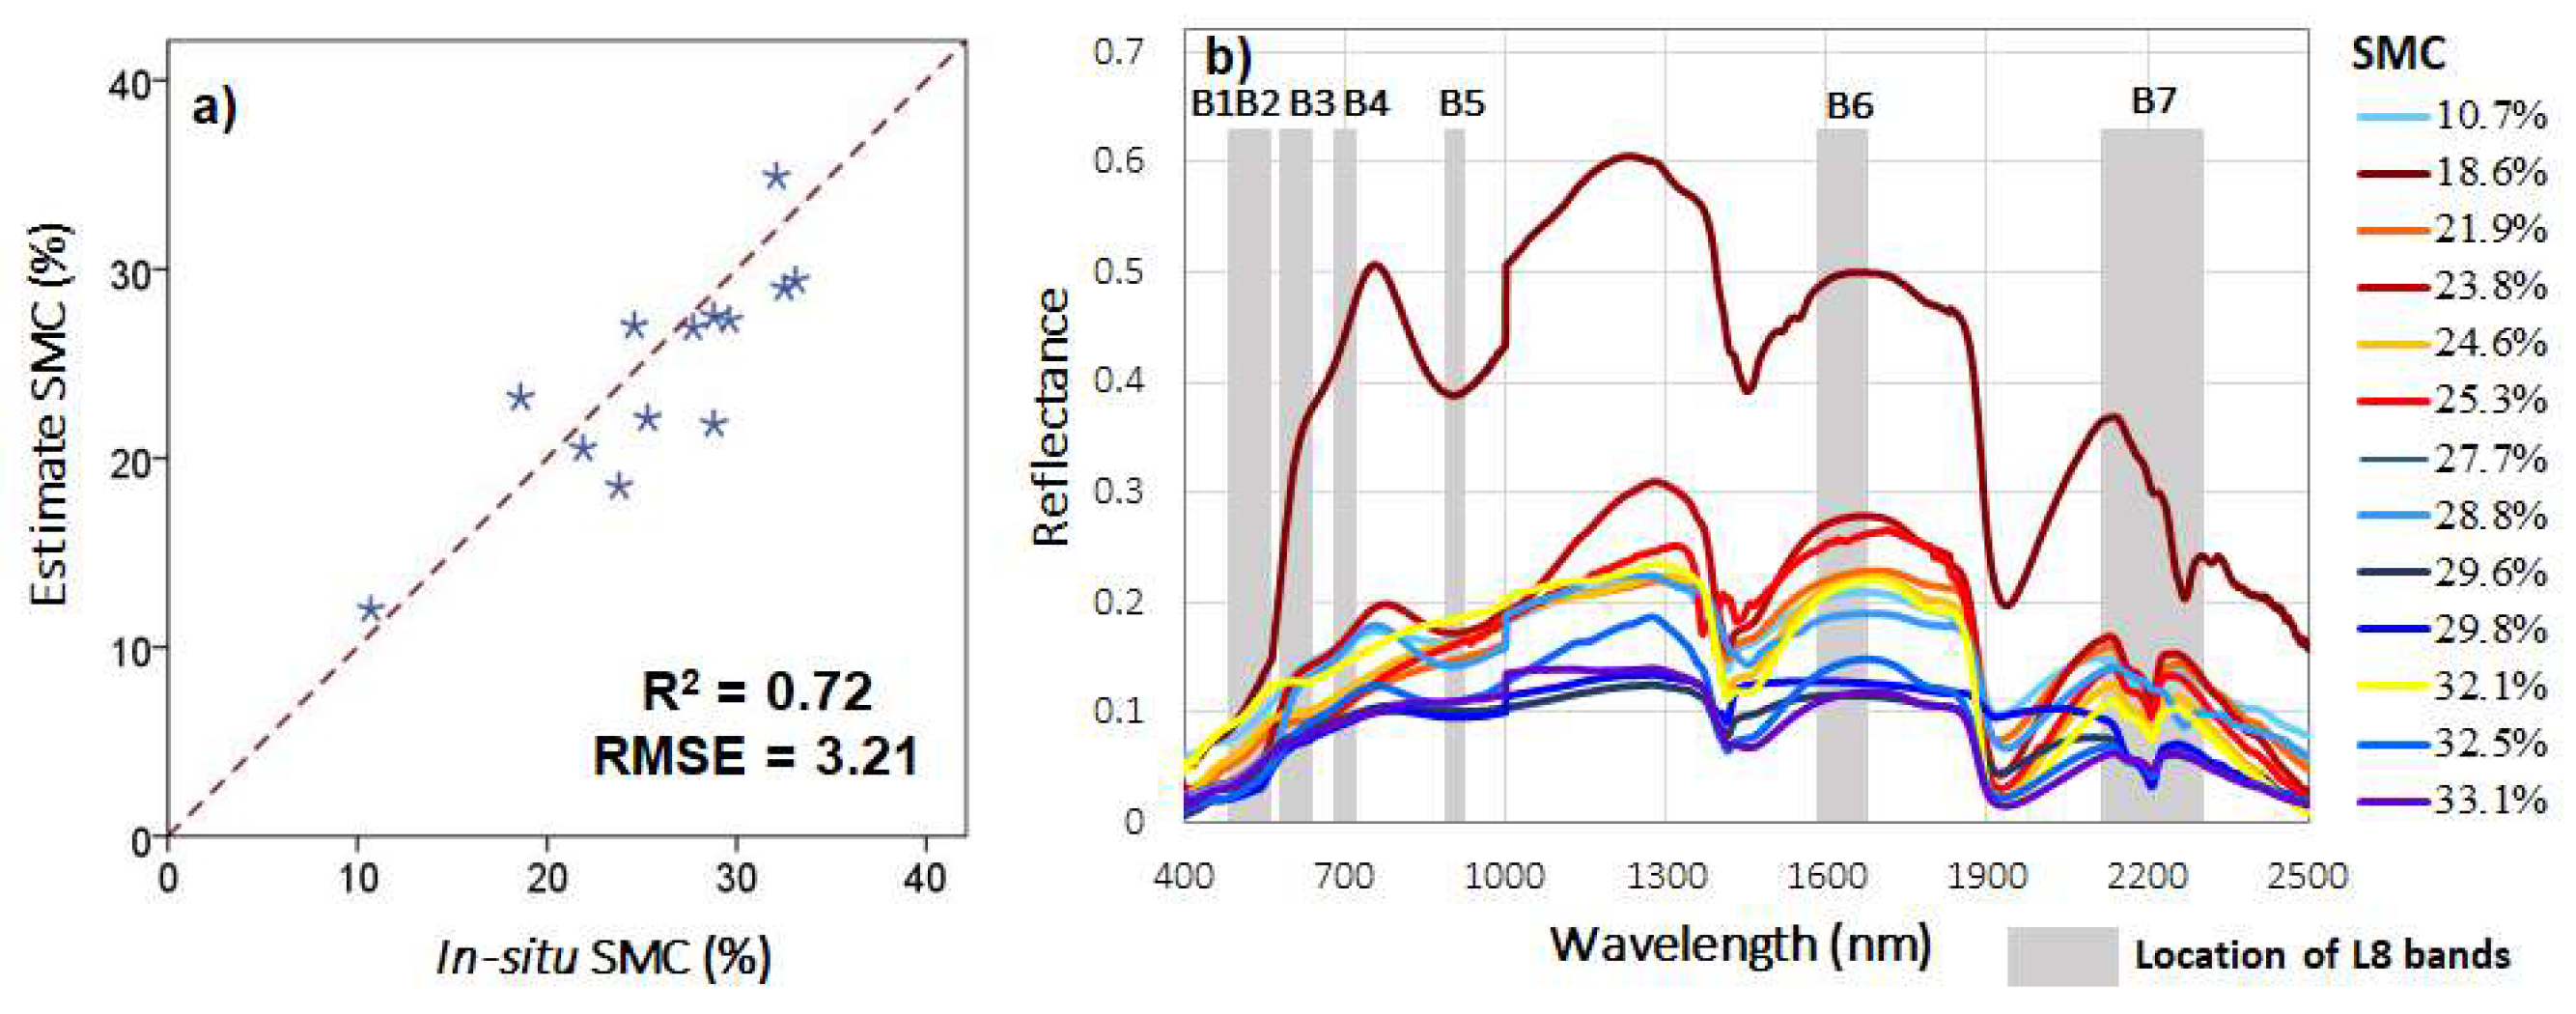
3.2. L8 Band-Based Model for Estimating SMC

To identify the best band and/or band combination for estimating SMC using L8 images, the curve-fit regressions of SMC and the strongest correlated band (B7), and the proposed band ratio and band combinations in preceding studies [9,12,33] were conducted, and results were presented in Table 4, using the total data of 80 soil sub-samples. Accordingly, SMC has the highest correlation, with the ratio of L8 B5 versus B7, B5/B7, (R2 = 0.73), and the smallest error (RMSE = 8.85), indicating the high potential of this band ratio for estimating SMC, using the L8 image. In most regressions, the logarithm function provides the lowest error compared to other functions, such as exponential, linear, and power. Two commonly used indexes for SMC monitoring purposes based on field radiometric data, the Normalized Multi-band Drought Index (NMDI) [34], and the Normalized Difference Soil Moisture Index (NSMI) [35], were also evaluated by using the L8 spectral bands in this work. NSMI, which used the difference of the reflectance at 1800 nm and 2119 nm, corresponded to the difference of the retrieved reflectance of L8, B6, and B7, (B6 − B7)/(B6 + B7), had a moderate correlation with SMC (R2 = 0.51). This was similar, to the correlation of NMDI, which used the difference of the reflectance at NIR (860 nm), corresponding to L8 B5, and the differences of the reflectance at 1640 nm and 2130 nm, corresponding to the differences of B6 and B7, [B5 − (B6 − B7)]/[B5 + (B6 − B7)], and SMC (R2 = 0.34). This result demonstrated the limitation of these two indexes when applying L8 data for quantifying SMC in the tropical region.
To further investigate the cross-relationship between the L8 SWIR band, B5/B7, and NSMI and SMC, scatterplots between SMC and these three variables were created, and they are shown in Figure 3. Accordingly, the use of the SWIR band (B7) was only seen in several cases, particularly at a range of SMC that was lower than 30% (Figure 5a). NSMI was proposed for estimating SMC by using surface reflectance at two wavelengths, 1800 nm and 2119 nm. The difference between the L8 B6 center wavelength (1610 nm) and 1800 nm may be a factor that reduces the correlation of NSMI with SMC (Figure 5b). The fit of the observations with the logarithm curve demonstrated the relationship between SMC and B5/B7 (Figure 5c), providing a scientific base for estimating SMC from the L8 images by the following Equation:
SMC = 8.14 + 40.29 × log(B5/B7)
where SMC units in %, and B5/B7 is the ratio of reflectance corresponding to L8, B5, and B7.
Figure 6A shows the comparison of SMC estimated from Rrs(λ), corresponding to L8 B5/B7, using Equation (2), hereafter referred to as L8RSM, and the in situ SMCs of 13 soil samples taken in the Nam Can commune, Nghe An Province, in April 2018. The SMC of these 13 soil samples ranged from 10.7% to 33.1%, averaging at 26%, indicating the SMC range of the topsoils over Nam Can commune under normal weather conditions in April. The spectral features of the 13 soil samples present in Figure 6B again confirmed the inverse trend of SMC and Rrs(λ). The small difference between these two datasets (RMSE = 3.21, corresponding to approximately 12% of the mean of in situ SMC) confirmed the high accuracy of L8RSM for estimating SMC (Figure 6A). In order to apply L8RSM to the estimation of SMC from the L8 satellite data, the image processing method, i.e., the atmospheric correction method, should be focused upon, to ensure the accuracy of the derived reflectance.

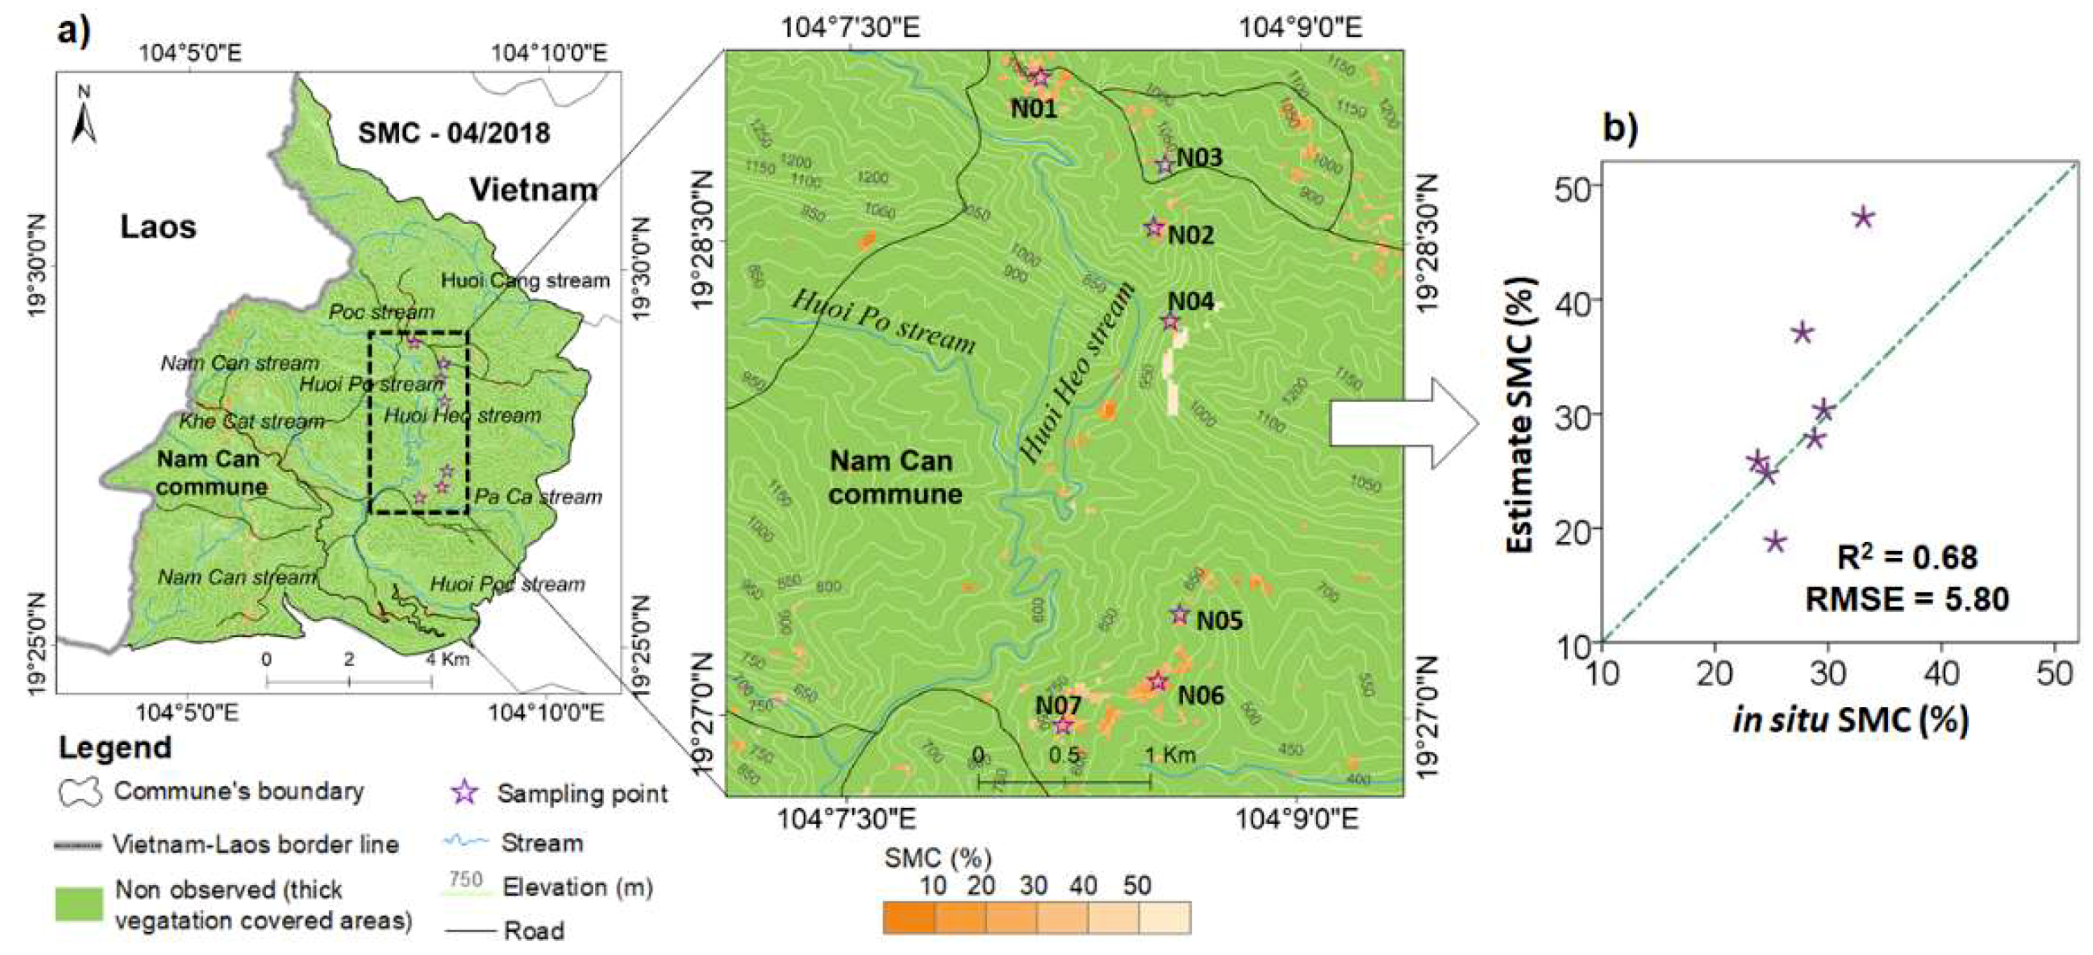
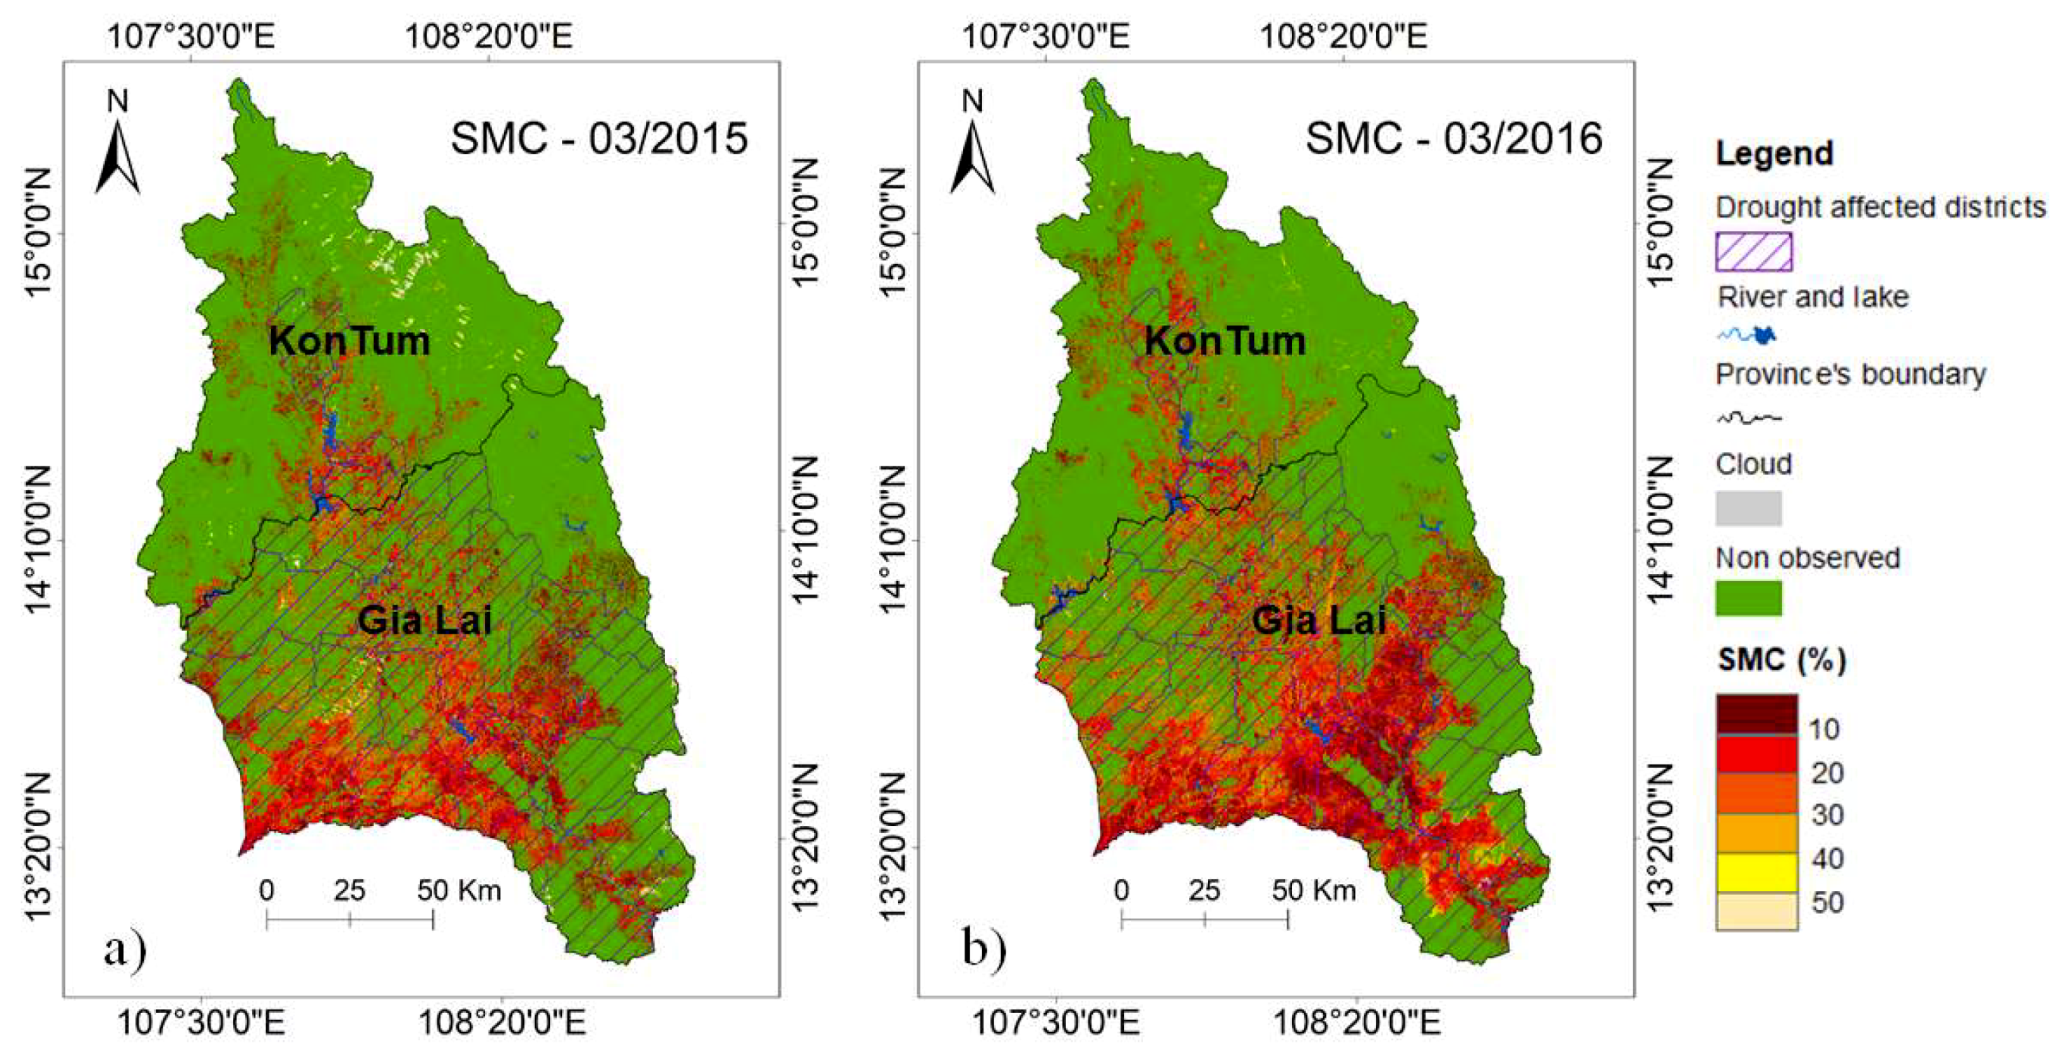
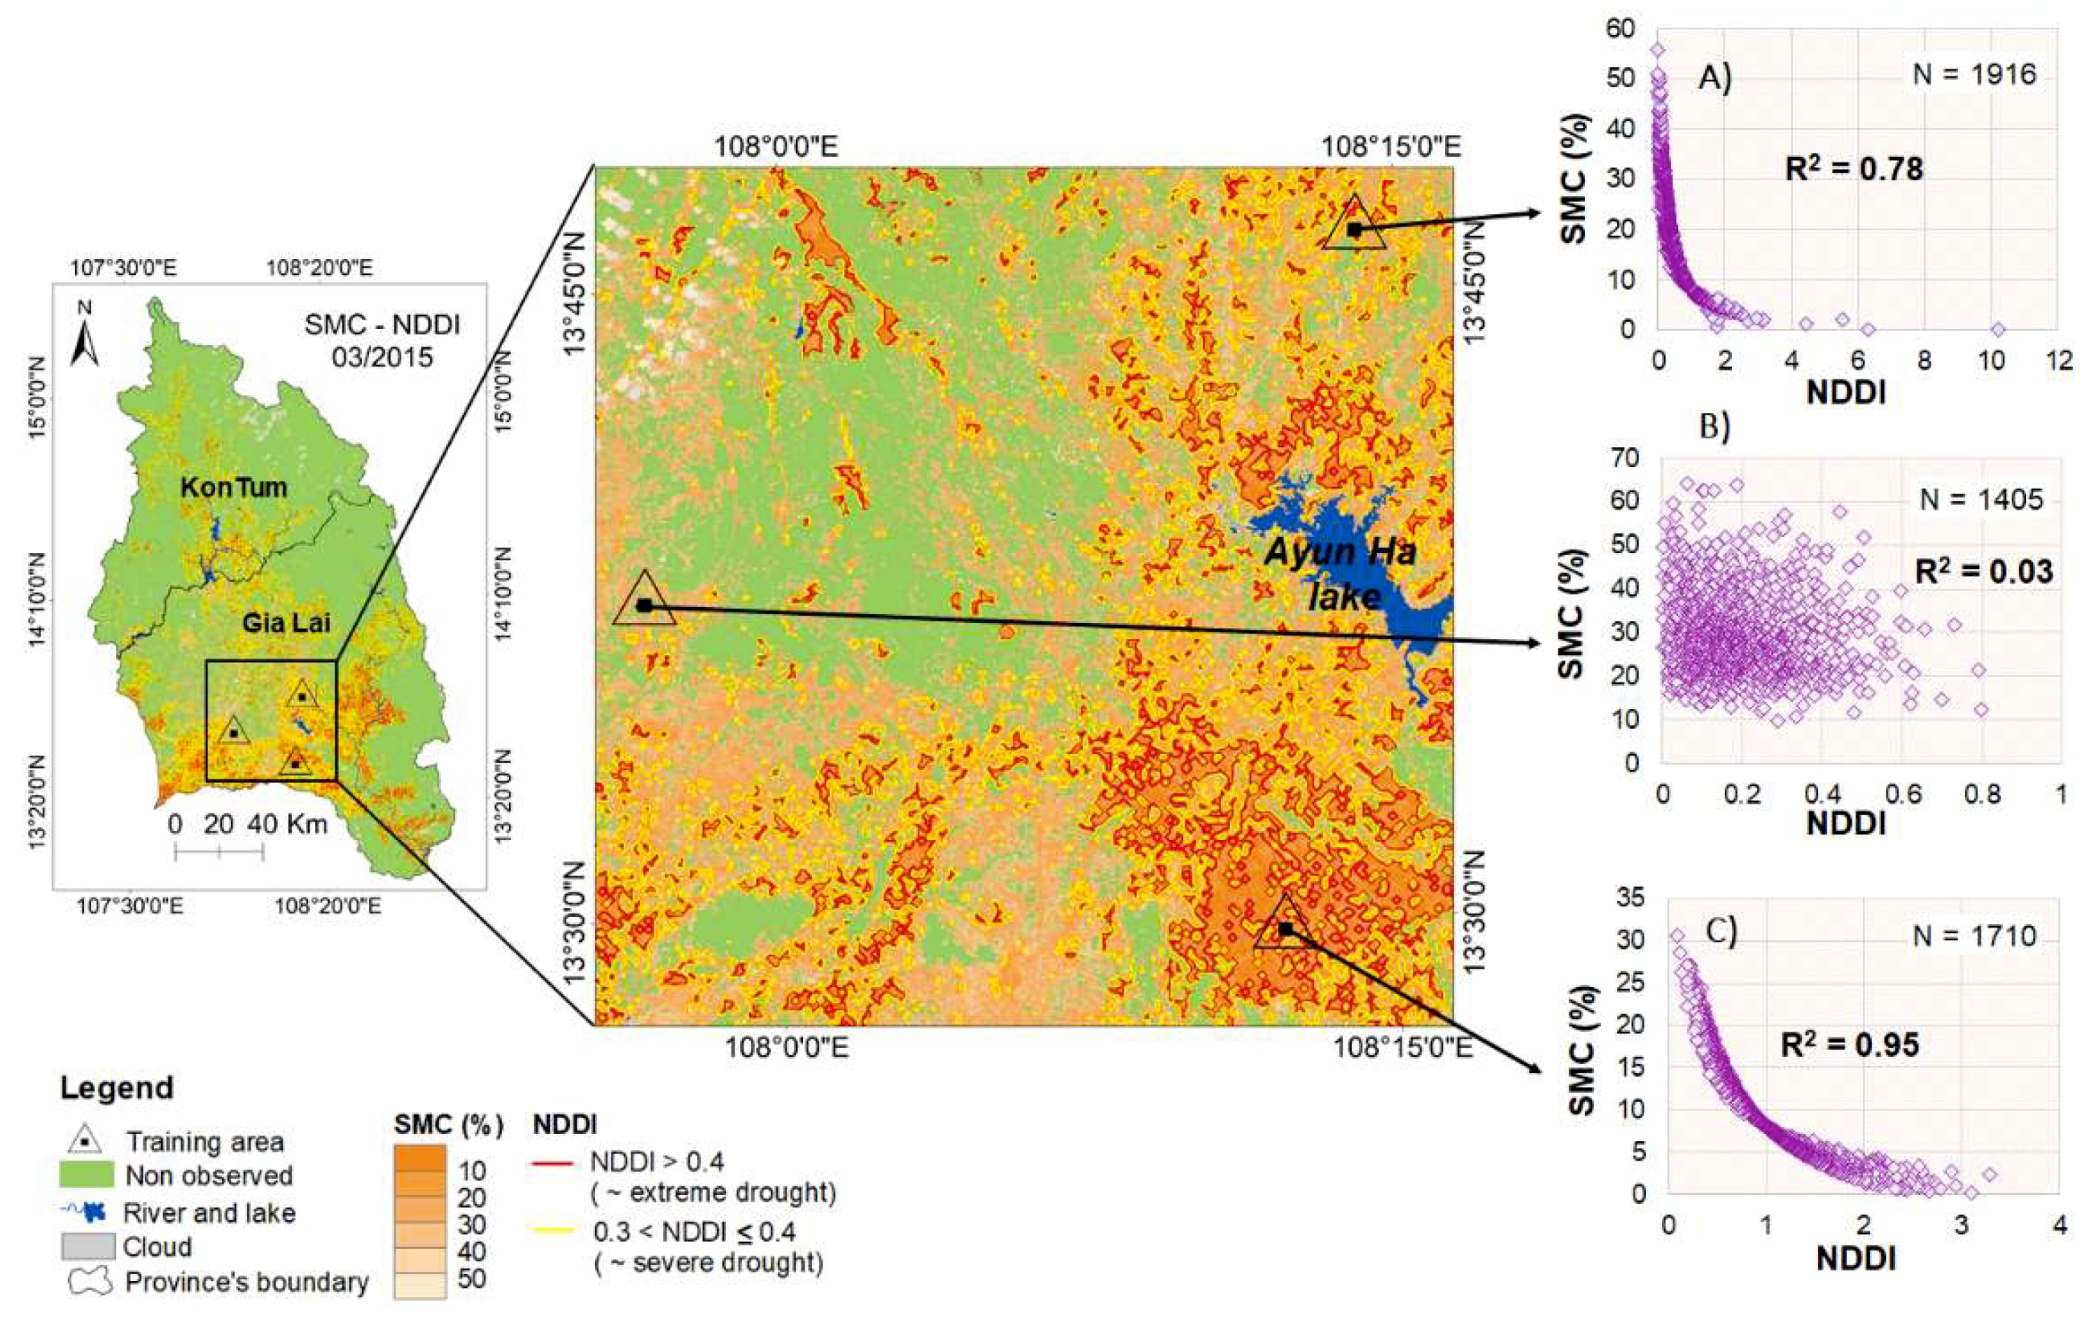
3.3. Mapping SMC Using L8 Images

Mapping SMC in space and time provides useful information for agriculture management, particularly in areas that are frequently affected by drought, such as the Central Highlands of Vietnam. Passive satellite remote sensing uses signals from the emission and reflection of electromagnetic energy by the soil surface, to estimate SMC. The effects of atmosphere, land-cover, surface roughness, and soil texture on these signals are still challenges for estimating and mapping SMC from satellite data [36]. The use of the spectral band ratio, as in this work, has been proven to reduce the effects of not only the atmosphere [37], but also the roughness of the topographic surface [38] on the satellite-derived reflectance. Figure 7 presents an improved accuracy of the spectral band ratio compared to the single spectral bands after processing by two atmospheric correction methods: DOS and LaSRC (Figure 7c), using two datasets of in situ Rrs(λ) measured at seven soil sampling points in the Nam Can commune, and the retrieved Rrs(λ) of seven corresponding free-cloud pixels of the L8 image, acquired concurrently over the commune area on 11 April 2018. Accordingly, L8-retrieved Rrs(λ) from single bands, band 5 (Figure 7a) and band 7 (Figure 7b) were nearly three times higher than in situ Rrs(λ), with the RMSE being 0.02 and 0.03, respectively. The L8-retrieved spectral ratio of band 5 versus band 7 (B5/B7) showed a consistent fit to the range of in situ data (Figure 7c) with a small RMSE (0.20, corresponding to 12% of the mean of in-situ dataset). This implicates that the L8-derived single band reflectance for SMC estimation may be limited due to large uncertainties in the atmospheric correction methods, but the band ratio model is less subject to errors in the atmospheric correction. Therefore, L8RSM is suitable for use in SMC estimation and mapping using the L8 images, which are atmospheric corrected by DOS method.
The estimation of SMC at seven sampling points using the L8 scene, which is taken over Nam Can commune and atmospheric corrected by DOS, and L8RSM was presented in Figure 8. Figure 8a shows the map of sampling point overlaid the estimated SMC result. Figure 8b is the scatterplot showing the validated result of L8RSM for estimating SMC using in situ SMC at seven sampling points in Nam Can commune and estimated SMC from the L8 image presented in Figure 8a. Accordingly, estimated SMC has a highly correlation with in situ SMC (R2 = 0.68) and a reasonable error (RMSE = 5.80) demonstrating the high possibility of L8RSM and studied methods for quantifying and mapping SMC in a tropical region using L8 images.
Figure 9 presents the maps of SMC, as estimated from L8 images (Table 2) acquired over the northern part of the Central Highlands of Vietnam in the late dry season of 2015 and 2016, March 2015 and March 2016, using Equation (2). As mentioned, to subtract the effects of vegetation, only the SMCs of uncovered soils and/or soils covered by thinly vegetated areas where NDVI ranges from 0 to 0.4, corresponding to cropland and non-vegetated lands, such as bare soil and built-up landcover types [39], were estimated and mapped from the L8 images. Areas with dense vegetation (NDVI > 0.4) appeared in these two maps as “not observed” areas, and they are filled in green. The drought-affected districts reported by local provincial governments [40,41,42] and non-governmental organizations, NGOs [43,44], present in these two maps are shown as oblique-lined areas.
The resultant SMC distribution maps in March 2015 and March 2016 showed that almost all soils in the observed areas were characterized by a low SMC level (SMC < 40%), evidence of the occurrence of severe droughts in the area; the drought disaster in 2016 was more severe than the one in 2015, which was manifested through the expansion of the SMC < 40% areas in the 2016 map (Figure 9a), compared to the 2015 map (Figure 9b). From the maps, soils in the northern part of the Central Highlands were under water stress for crop growth, particularly for the growth of popular local farming plants, such as coffee, rice, maize, peanut, soybeans, and greens. According to the Vietnamese Standard published by the Vietnamese Ministry of Agriculture and Rural Development [45], the optimal SMC for these plants growing is the range from 60% to 85%, and at a SMC lower than 40%, all of these plants were shriveled up (Figure 10). The SMC distribution maps provided evidence, and they were conformable to local district reports on the effect of drought disasters in these areas for agricultural activities, particularly in areas where the yields were reported as a dead-loss [41,42].

4. Discussion

The effect of soil moisture on soil spectral feature has been long addressed in preceding studies with two highlighted features: more SMC lowers reflectance but does not change the shape of soil spectral line; clear presence of water absorption at 1400 nm, 1900 nm and 2200 nm [48,49]. The use of reflectance at 2.2 µm to identify clay minerals is constrained by the influence of SMC [50]. The L8 SWIR2 band (band 7) data within 2110–2290 nm has been designed to estimate moisture content of soil and vegetation in thin cloudy condition [51]. The reflectance corresponding to the L8 NIR band has been often used to discriminate between the vegetation covered areas and bare soil areas [52] or to infer plant water stress and subsequent reduction of plant productivities [53]. As mentioned, water strongly absorbs in the middle-infrared region (MIR) and is a major factor controlling the spectral properties of surface materials, thus use of reflectance within the MIR region (the L8 bands 6 and 7) is suggested to estimate the water content in surface materials. Many studies show the appropriateness of using the reflectance within 1550–1650 nm (corresponding the L8 band 6) for estimating the leaf water content [53,54], and in which the reflectance near 820 nm (corresponding L8 NIR band) has been used as a reference factor that helps clearly reflect the change in reflectance within 1550–1650 nm, accompanied by change in leaf water content. Figure 4 shows clearly the effect of SMC to the depth of the negative peak of reflectance at L8 band 7, but no peak related to a strong water absorption at the L8 band 6 (1570–1650 nm) was observed. Therefore, the use of spectral band ratio of band 5 versus band 7 (NIR/SWIR2) reflects more sensitively to the change of SMC, which helps more accurately estimate SMC from reflectance data.
Three drought types are commonly recognized; i.e., meteorological, hydrological, and agricultural drought [55], of which agricultural drought is directly affected by the local economy and by social development. Agricultural drought is defined as the reduction of soil moisture availability to plants at the SMC level, as crop growth is adversely affected, and therefore, crop yield, and hence, agricultural production, is decreased [56]. According to this definition, agricultural drought can be proactively predicted in a reasonable manner by monitoring SMC [57]. The traditional in situ-based drought monitoring method (including ground measurements of hydro-climatic variables such as precipitation, temperature, relative humidity, evaporation and SMC, etc.) provides accurate data at point locations, but not the spatial dynamics over a large area. The requirement for spatial impact of drought leads to the wide use of remote sensing-based drought indices for agriculture management. Several agricultural drought indices that use remote sensing, such as NDDI [26], the vegetation health index (VHI) [58], the Shortwave Infrared Water Stress Index (SIWSI) [59], the Normalized Multiband Drought Index (NMDI) [34], and the Vegetation Temperature Condition Index (VTCI) [60], have been proposed. Among these indices, NDDI, as proposed by Gao [26], has been widely used, because it combines vegetation health and surface wetness conditions, and does not require ground-based data [61,62,63,64].
Figure 11 showcases the relationship between the estimated SMC and NDDI, retrieved from L8 images that were taken over the northern part of the Central Highland of Vietnam in March 2015. Accordingly, the “abnormal dry” level predicted by NDDI approximately corresponded to the SMC range of 30% to 40%, which is a state of water stress in growing plants. The weak point of the NDDI is the low applicability of this index for monitoring of short-term drought [65], due to the lag time between the surface soil and vegetation in the dry state, when a region has been affected by drought. Therefore, direct monitoring and mapping of the estimated SMC from L8 data helps with early forecasting of drought disaster, and management of irrigation activities to mitigate bad impacts from drought. Further investigation of the relationship of SMC and NDDI shows that the estimated SMC is negatively correlated with the NDDI value, particularly in area cover, mostly by NDVI < 0.4, corresponding to medium-to thin vegetation-covered areas (R2 = 0.95; Figure 11c). Along with the increase of areas covered by thick vegetation (NDVI > 0.4), the correlation of SMC and NDDI tends towards a decrease: R2 = 0.78 over the area covered by less than 20% thick vegetation (Figure 11a), and R2 = 0.03 over the area that is covered by more than 40% thick vegetation (Figure 11b). This tendency indicates a lower accuracy of L8RSM in estimating SMC from a pixel, as thick vegetation covers more than a 20% area of the pixel. Figure 11 also indicates that when the estimated SMC is lower than 40% in almost medium-to-thin levels of vegetation cover, the region is affected by severe drought, and furthermore, the richness of vegetation is a vital factor for water retention in the soil.
As mentioned, agricultural drought is closely connected to soil moisture and crop water deficit, and therefore SMC is the most direct and important indicator for assessing and monitoring an agricultural drought event [66]. Remote sensing-based drought indices are mostly developed by using vegetation health conditions such as NDVI, VHI, TVDI, VI, NDDI, NDTI, the vegetation condition index, VCI [58], etc. However, vegetation-based drought indices are reported to fail as early warnings of agricultural drought [65,67], because the time that needs to elapse before leaf greenness is destroyed is much longer than the elapsed time for a decrease in the SMC to a level at which plants are under water stress (SMC < 40%) [68]. The L8RSM proposed in this work helps to directly and frequently estimate SMC, in order to identify the areas in which plants are under water stress, for early warning and proactive planning, in order to respond and mitigate agricultural drought.
L8RSM was also exploited to predict agricultural drought in previous studies through the use of several indices; i.e., Moisture Stress Index [54], Normalized Difference Infrared Index [69], and Surface Water Index [70]; these were proposed for the observation of leaf moisture in densely vegetated areas. In a sense, this spectral ratio was demonstrated to be suitable for estimating the moisture content of the top-surface materials by using satellite data, despite differences in the soil components of various soil types (six soil types as mentioned in this study) or the canopy values of the leaves. More investigations and analyses on the hyperspectral features of the leaves at various moisture contents, and/or hyperspectral features of SMC in other top-soil types should be carried out, to evaluate the performance of this spectral ratio for estimating the moisture content of the land surfaces, and for prediction of drought effects.

5. Conclusions

Literature review indicates the rare use of optical satellite data, such as Landsat, for directly estimating SMC in the topsoil, instead of indirectly estimating the moisture of other land cover types (i.e., the leaf moisture content, the moisture of dense vegetation cover), by proposing several vegetation and/or water indices. An addition to the challenge comes from the diversity of the landcover types, and knowledge of the principle responses of the reflectance spectra to various SMC is still limited. This study demonstrates the appropriateness of the spectral ratio of the L8 band NIR-to-SWIR2 for estimating the SMC, L8RSM, through analyses of the spectral response corresponding L8 band data, with various SMC over various soil types, which are obtained from in-laboratory measurements of Rrs(λ) and SMC (R2 = 0.73 and RMSE ~ 12%). The hyperspectral features of a total of 103 soil samples taken from the Central Region of Vietnam clearly show the adverse effects of SMC on Rrs(λ), particularly within the NIR-SWIR region. The appropriateness of the spectral ratio of the L8 band NIR-to-SWIR2 for estimating the SMC observed in this study provides a physical base and explains why this ratio has been used in previous studies for the estimation of surface moisture content when using remote optic data. The resultant maps of the spatial distribution of the estimated SMCs from L8 images acquired in March 2015 and March 2016 over the northern part of the Central Highlands of Vietnam were conformable to the practical droughts occurring in the region at the same time. The spatial relationship between the estimated SMCs and the retrieved NDDI, a widely used remote sensing index for agricultural drought monitoring, from L8 images in March 2016, presents a strong correlation for these two variables, when they are obtained within areas with less than 20% dense vegetation coverage. Directly estimating SMC from the L8 images is better for the management of irrigation during the drought occurrence period, compared to NDDI, because of the large time-lag between the decrease of SMC and decrease of leaf greenness. With a view towards effectively monitoring SMC by using optical satellite data, more investigations into the response of Rrs(λ) to different SMC over various soil types or landcovers should be carried out in the near future. Other optical data, such as Sentinel 2A and 2B, should also be exploited to shorten the observation period, in order to perform better drought disaster mitigation.

Author Contributions

Conceptualization, N.T.T.H. and D.N.T.; methodology, D.N.T., N.T.T.H. and K.K.; validation, D.N.T., Q.T.D. and N.M.T.; investigation, D.N.T., N.T.T.H. and K.K.; writing—original draft preparation, D.N.T.; writing—review and editing, N.T.T.H. and K.K.; project administration, Q.T.D. and N.M.T.; funding acquisition, Q.T.D. and N.M.T.

Funding

This research was funded by the National Science and Technology Program for Sustainable Development of Vietnam’s Northwest Region, project code: KHCN-TB.19C/13-18.

Acknowledgments

The authors gratefully acknowledge partial support from the project code KHCN-TB.19C/13-18 of the National Science and Technology Program for Sustainable Development of Vietnam’s Northwest Region. The authors also would like to thank the Power Engineering Consulting Joint Stock Company 1 (PECC1), and the U.S. Geological Survey and NASA for providing the raw soil samples and the Landsat 8 Surface Reflectance data, respectively.

Conflicts of Interest

The authors declare no conflict of interest.

References

  1. Komma, J.; Blöschl, G.; Reszler, C. Soil moisture updating by Ensemble Kalman Filtering in real-time flood forecasting. J. Hydrol. 2008, 357, 228–242. [Google Scholar] [CrossRef]
  2. Loew, A.; Schwank, M.; Schlenz, F. Assimilation of an L-band microwave soil moisture proxy to compensate for uncertainties in precipitation data. IEEE Trans. Geosci. Remote Sens. 2009, 47, 2606–2616. [Google Scholar] [CrossRef]
  3. Seneviratne, S.I.; Corti, T.; Davin, E.L.; Hirschi, M.; Jaeger, E.B.; Lehner, I.; Teuling, A.J. Investigating soil moisture–climate interactions in a changing climate: A review. Earth-Sci. Rev. 2010, 99, 125–161. [Google Scholar] [CrossRef]
  4. Dubois, P.C.; Van Zyl, J.; Engman, T. Measuring soil moisture with imaging radars. IEEE Trans. Geosci. Remote Sens. 1995, 33, 915–926. [Google Scholar] [CrossRef]
  5. Neusch, T.; Sties, M. Application of the Dubois-model using experimental synthetic aperture radar data for the determination of soil moisture and surface roughness. ISPRS J. Photogramm. Remote Sens. 1999, 54, 273–278. [Google Scholar] [CrossRef]
  6. Patel, N.R.; Anapashsha, R.; Kumar, S.; Saha, S.K.; Dadhwal, V.K. Assessing potential of MODIS derived Temperature/Vegetation Condition Index (TVDI) to infer soil moisture status. Int. J. Remote Sens. 2009, 30, 23–39. [Google Scholar] [CrossRef]
  7. Prakash, R.; Singh, D.; Pathak, N.P. A fusion approach to retrieve soil moisture with SAR and optical data. IEEE J. Sel. Top. Appl. Earth Obs. Remote Sens. 2012, 5, 196–206. [Google Scholar] [CrossRef]
  8. Barrett, B.W.; Dwyer, E.; Whelan, P. Soil moisture retrieval from active spaceborne microwave observations: An evaluation of current techniques. Remote Sens. 2009, 1, 210–242. [Google Scholar] [CrossRef]
  9. Rijal, S.; Zhang, X.; Jia, X. Estimating surface soil water content in the Red River Valley of the North using Landsat 5 TM data. Soil Sci. Soc. Am. J. 2013, 77, 1133–1143. [Google Scholar] [CrossRef]
  10. Li, B.; Ti, C.; Zhao, Y.; Yan, X. Estimating soil moisture with Landsat data and its application in extracting the spatial distribution of winter flooded paddies. Remote Sens. 2016, 8, 38. [Google Scholar] [CrossRef]
  11. Chander, G.; Markham, B.L.; Helder, D.L. Summary of current radiometric calibration coefficients for Landsat MSS, TM, ETM+, and EO-1 ALI sensors. Remote Sens. Environ. 2009, 113, 893–903. [Google Scholar] [CrossRef]
  12. Musick, H.B.; Pelletier, R.E. Response of some Thematic Mapper band ratios to variation in soil water content. Photogramm. Eng. Remote Sens. 1986, 52, 1661–1668. [Google Scholar]
  13. Hatanaka, T.; Nishimune, A.; Nira, R.; Fukuhara, M. Estimation of available moisture holding capacity of upland soils using Landsat TM data. Soil Sci. Plant Nutr. 1995, 41, 577–586. [Google Scholar] [CrossRef]
  14. Shih, S.F.; Jordan, J.D. Use of Landsat thermal-IR data and GIS in soil moisture assessment. J. Irrig. Drain. Eng. 1993, 119, 868–879. [Google Scholar] [CrossRef]
  15. Sandholt, I.; Rasmussen, K.; Andersen, J. A simple interpretation of the surface temperature/vegetation index space for assessment of surface moisture status. Remote Sens. Environ. 2002, 79, 213–224. [Google Scholar] [CrossRef]
  16. Gao, Z.; Gao, W.; Chang, N.B. Integrating temperature vegetation dryness index (TVDI) and regional water stress index (RWSI) for drought assessment with the aid of LANDSAT TM/ETM+ images. Int. J. Appl. Earth Obs. Geoinf. 2011, 13, 495–503. [Google Scholar] [CrossRef]
  17. Chen, S.; Wen, Z.; Jiang, H.; Zhao, Q.; Zhang, X.; Chen, Y. Temperature vegetation dryness index estimation of soil moisture under different tree species. Sustainability 2015, 7, 11401–11417. [Google Scholar] [CrossRef]
  18. Shafian, S.; Maas, S.J. Index of soil moisture using raw Landsat image digital count data in Texas high plains. Remote Sens. 2015, 7, 2352–2372. [Google Scholar] [CrossRef]
  19. Mobasheri, M.R.; Amani, M. Soil moisture content assessment based on Landsat 8 Red, Near-Infrared, and Thermal channels. J. Appl. Remote Sens. 2016, 10, 026011. [Google Scholar] [CrossRef]
  20. Burapapol, K.; Nagasawa, R. Mapping Soil Moisture as an Indicator of Wildfire Risk Using Landsat 8 Images in Sri Lanna National Park, Northern Thailand. J. Agric. Sci. 2016, 8, 107. [Google Scholar] [CrossRef]
  21. Amani, M.; Parsian, S.; MirMazloumi, S.M.; Aieneh, O. Two new soil moisture indices based on the NIR-red triangle space of Landsat-8 data. Int. J. Appl. Earth Obs. Geoinf. 2016, 50, 176–186. [Google Scholar] [CrossRef]
  22. Roy, D.P.; Kovalskyy, V.; Zhang, H.K.; Vermote, E.F.; Yan, L.; Kumar, S.S.; Egorov, A. Characterization of Landsat-7 to Landsat-8 reflective wavelength and normalized difference vegetation index continuity. Remote Sens. Environ. 2016, 185, 57–70. [Google Scholar] [CrossRef]
  23. General Statisitic Office of Vietnam. Statistical Yearbook of Viet Nam 2015; Statistical Publishing House: Hanoi, Vietnam, 2015; 948p. Available online: http://www.gso.gov.vn /default_en.aspx?tabid=515&idmid=&ItemID=16052 (accessed on 5 November 2018).
  24. Anh, D.T.N.; Phi, N.Q.; Son, N.H. Research methods agricultural drought warning in downstream of Ca River. Vietnam J. Water Resour. Environ. Eng. 2017, 56, 24–33. (In Vietnamese) [Google Scholar]
  25. Ha NT, T.; Nhuan, M.T.; Canh, B.D.; Thao NT, P. Mapping Droughts over the Central Highland of Vietnam in El Niño Years Using Landsat Imageries. VNU J. Sci. 2016, 32, 255–263. [Google Scholar]
  26. Gao, B.C. NDWI—A normalized difference water index for remote sensing of vegetation liquid water from space. Remote Sens. Environ. 1996, 58, 257–266. [Google Scholar] [CrossRef]
  27. ADB. Asian Development Bank/Environment Operations Center (www.gms-eoc.org) based on UN FAO Digital Soil Map of the World V. 3.6 (www.fao.org/geonetwork). 2016. Available online: https://vietnam.opendevelopmentmekong.net/vi/dataset/?id=soil-types-invietnam&search_query=P3M9c29pbA== (accessed on 15 November 2018).
  28. FAO; UNESCO. Soil Map of the World; United Nations Educational, Scientific and Cultural Organization: Paris, France, 1979; Available online: http://www.fao.org/soils-portal/soil-survey/soil-maps-and-databases/faounesco-soil-map-of-the-world/en/ (accessed on 8 December 2018).
  29. Vietnam Institute for Building Scirnce and Tẹhnology—IBST. TCVN 4196:2012 The Vietnam National Standards on Soils—Laboratory Methods for Determination of Moisture and Hydroscopic Water Amount; Vietnam Ministry of Science and Technology: Hanoi, Vietnam, 2012. Available online: http://tieuchuan.mard.gov.vn/ViewDetails.aspx?id=7942&lv=8&cap=1 (accessed on 22 November 2018).
  30. Vermote, E.; Justice, C.; Claverie, M.; Franch, B. Preliminary analysis of the performance of the Landsat 8/OLI land surface reflectance product. Remote Sens. Environ. 2016, 185, 46–56. [Google Scholar] [CrossRef]
  31. Exelis Visual Information Solutions. ENVI Services Engine 5.3 User Guide; Harris Geospatial Solutions, Inc.: Boulder, CO, USA, 2015; 102p, Available online: https://www.harrisgeospatial.com/docs/pdf/ESE_help.pdf (accessed on 5 December 2018).
  32. Chavez, P.S., Jr. An improved dark-object subtraction technique for atmospheric scattering correction of multispectral data. Remote Sens. Environ. 1988, 24, 459–479. [Google Scholar] [CrossRef]
  33. Welikhe, P.; Quansah, J.E.; Fall, S. Elhenney WMc. Estimation of Soil Moisture Percentage Using LANDSAT-based Moisture Stress Index. J Remote Sens. Gis 2017, 6, 2. [Google Scholar]
  34. Wang, L.; Qu, J.J. NMDI: A normalized multi-band drought index for monitoring soil and vegetation moisture with satellite remote sensing. Geophys. Res. Lett. 2007, 34. [Google Scholar] [CrossRef]
  35. Haubrock, S.N.; Chabrillat, S.; Lemmnitz, C.; Kaufmann, H. Surface soil moisture quantification models from reflectance data under field conditions. Int. J. Remote Sens. 2008, 29, 3–29. [Google Scholar] [CrossRef]
  36. Petropoulos, G.P.; Ireland, G.; Barrett, B. Surface soil moisture retrievals from remote sensing: Current status, products & future trends. Phys. Chem. Earth 2015, A/B/C 83, 36–56. [Google Scholar]
  37. Pham, Q.; Ha, N.; Pahlevan, N.; Oanh, L.; Nguyen, T.; Nguyen, N. Using Landsat-8 Images for Quantifying Suspended Sediment Concentration in Red River (Northern Vietnam). Remote Sens. 2018, 10, 1841. [Google Scholar] [CrossRef]
  38. Holben, B.; Justice, C. An examination of spectral band ratioing to reduce the topographic effect on remotely sensed data. Int. J. Remote Sens. 1981, 2, 115–133. [Google Scholar] [CrossRef]
  39. Zaitunah, A.; Ahmad, A.G.; Safitri, R.A. Normalized Difference Vegetation Index (NDVI) analysis for land cover types using landsat 8 OLI in besitang watershed, Indonesia. IOP Conf. Ser. Earth Environ. Sci. 2018, 126, 012112. [Google Scholar] [CrossRef]
  40. People’s Committee of Kon Tum Province. Decision No. 2735/KH-UBND dated November 23rd 2014 on the Annoucement of Plan for Drought Disaster Prevention and Mitigation during Winter-Spring Crop in 2015–2016 Affected by El Niño of Kon Tum Province. 2015. Available online: https://thuvienphapluat.vn/van-ban/Tai-nguyen-Moi-truong/Ke-hoach-2735-KH-UBND-phong-chong-han-vu-Dong-xuan-Kon-Tum-2015-2016-305023.aspx (accessed on 15 December 2018).
  41. People’s Committee of Kon Tum Province. Decision No. 240/QĐ-UBND dated March 16th 2016 on “The Announcement of the Most Severe Level Drought Disaster Occurred in Kon Tum Province”. 2016. Available online: http://kontum.gov.vn/tintuc /Lists/Posts/Post.aspx?List=2fa21aca-fe02-41ba-bc47-77d530847b32&ID=12706 (accessed on 15 December 2018).
  42. People’s Committee of Gia Lai Province. Decision No. 2735/QĐ-UBND Dated March 3rd 2016 on “The Announcement of the Most Severe Level Drought Disaster Occurred in Gia Lai Province. 2016. Available online: http://gialai.gov.vn (accessed on 16 December 2018).
  43. DMC—Disaster Management Policy and Techlonogy Center. Drought in 05 Provinces Contains the Central Highlands and South Central Coast (Ninh Thuan, Binh Thuan & Khanh Hoa). Available online: http://dmc.gov.vn/chi-tiet-thien-tai/han-han-tai-05-tinh-tay-nguyen-va-cac-tinh-duyen-hai-nam-trung-bo-ninh-thuan-binh-thuan-va-khanh-hoa-nam-2016-dis166.html?lang=vi-VN (accessed on 14 December 2018).
  44. CGIAR Research Centers in Southeast Asia. The Drought Crisis in the Central Highlands of Vietnam Assessment Report.Kon Tum, Gia Lai, Dak Lak, Vietnam. 2016. Available online: https://cgspace.cgiar.org/rest/bitstreams/78532/retrieve (accessed on 15 December 2018).
  45. The Center for Water research and Engineering application. TCVN 8641: 2011 The Vietnam National Standards on Hydraulic Structures—Irrigation and Drainage Techniques for Provisions Crops; Vietnam Ministry of Agriculture and Rural Development: Hanoi, Vietnam, 2011. Available online: http://tieuchuan.mard.gov.vn/Documents/Uploads/TCVN%208641-2011.doc (accessed on 22 December 2018).
  46. Gia Lai: 6000 Hectares of Coffee Burned by Drought (Gia Lai: 6000 hecta cà phê khô cháy vì nắH-UBND dated November 23rd 2014 on the Annoucement of Plan for Drought Disaster Prng hạn). To Quoc. Available online: http://toquoc.vn/gia-lai-6000-hecta-ca-phe-kho-chay-vi-nang-han-99143818.htm (accessed on 15 January 2019).
  47. Gia Lai: Drought Damaged Approximately 373 Billion VND (Gia Lai: Hạn hán gây thiệt hại gần 373 tỷ đồng). Tai nguyen va Moi Truong. Available online: https://baotainguyenmoitruong.vn/moi-truong/gia-lai-han-han-gay-thiet-hai-gan-373-ty-dong-1056745.html (accessed on 15 January 2019).
  48. Bowers, S.A.; Hanks, R.J. Reflection of radiant energy from soils. Soil Sci. 1965, 100, 130–138. [Google Scholar] [CrossRef]
  49. Skidmore, E.L.; Dickerson, J.D.; Schimmelpfennig, H. Evaluating Surface-Soil Water Content by Measuring Reflectance. Soil Sci. Soc. Am. J. 1975, 39, 238–242. [Google Scholar] [CrossRef]
  50. Lobell, D.B.; Asner, G.P. Moisture effects on soil reflectance. Soil Sci. Soc. Am. J. 2002, 66, 722–727. [Google Scholar] [CrossRef]
  51. Amatya, D.; Williams, T.; Bren, L.; de Jong, C. Forest Hydrology: Processes, Management and Assessment; CABI: Oxfordshire, UK, 2016. [Google Scholar]
  52. Yoshioka, H.; Miura, T.; Demattê, J.A.; Batchily, K.; Huete, A.R. Soil line influences on two-band vegetation indices and vegetation isolines: A numerical study. Remote Sens. 2010, 2, 545–561. [Google Scholar] [CrossRef]
  53. Tucker, C.J. Remote sensing of leaf water content in the near infrared. Remote Sens. Environ. 1980, 10, 23–32. [Google Scholar] [CrossRef]
  54. Hunt, E.R., Jr.; Rock, B.N. Detection of changes in leaf water content using near-and middle-infrared reflectances. Remote Sens. Environ. 1989, 30, 43–54. [Google Scholar]
  55. Mishra, A.K.; Singh, V.P. A review of drought concepts. J. Hydrol. 2010, 391, 202–216. [Google Scholar] [CrossRef]
  56. Panu, U.S.; Sharma, T.C. Challenges in drought research: Some perspectives and future directions. Hydrol. Sci. J. 2002, 47, S19–S30. [Google Scholar] [CrossRef]
  57. Allen, R.G.; Pereira, L.S.; Raes, D.; Smith, M. Crop Evapotranspiration—Guidelines for Computing Crop Water Requirements-FAO Irrigation and Drainage Paper 56; FAO: Rome, Italy, 1998; Volume 300, p. D05109. [Google Scholar]
  58. Kogan, F. World droughts in the new millennium from AVHRR-based vegetation health indices. EOS Trans. Am. Geophys. Union 2002, 83, 557–563. [Google Scholar] [CrossRef]
  59. Fensholt, R.; Sandholt, I. Derivation of a shortwave infrared water stress index from MODIS near-and shortwave infrared data in a semiarid environment. Remote Sens. Environ. 2003, 87, 111–121. [Google Scholar] [CrossRef]
  60. Wang, P.X.; Li, X.W.; Gong, J.Y.; Song, C. Vegetation temperature condition index and its application for drought monitoring. In Proceedings of the IEEE 2001 International Geoscience and Remote Sensing Symposium, IGARSS’01, Sydney, Australia, 9–13 July 2001. [Google Scholar]
  61. Gu, Y.; Brown, J.F.; Verdin, J.P.; Wardlow, B. A five-year analysis of MODIS NDVI and NDWI for grassland drought assessment over the central Great Plains of the United States. Geophys. Res. Lett. 2007, 34. [Google Scholar] [CrossRef]
  62. Cheng-lin, L.; Jian-jun, W. Crop drought monitoring using MODIS NDDI over mid-territory of China. In Proceedings of the IEEE International Geoscience and Remote Sensing Symposium, IGARSS 2008, Boston, MA, USA, 7–11 July 2008. [Google Scholar]
  63. Gulácsi, A.; Kovács, F. Drought monitoring with spectral indices calculated from MODIS satellite images in Hungary. J. Environ. Geogr. 2015, 8, 11–20. [Google Scholar] [CrossRef]
  64. Du TL, T.; Bui, D.D.; Nguyen, M.D.; Lee, H. Satellite-Based, Multi-Indices for Evaluation of Agricultural Droughts in a Highly Dynamic Tropical Catchment, Central Vietnam. Water 2018, 10, 659. [Google Scholar]
  65. Hazaymeh, K.; Hassan, Q.K. Remote sensing of agricultural drought monitoring: A state of art review. AIMS Environ. Sci. 2016, 3, 604–630. [Google Scholar] [CrossRef]
  66. Nam, W.H.; Choi, J.Y.; Yoo, S.H.; Jang, M.W. A decision support system for agricultural drought management using risk assessment. Paddy Water Environ. 2012, 10, 197–207. [Google Scholar] [CrossRef]
  67. Liu, X.; Zhu, X.; Pan, Y.; Li, S.; Liu, Y.; Ma, Y. Agricultural drought monitoring: Progress, challenges, and prospects. J. Geogr. Sci. 2016, 26, 750–767. [Google Scholar] [CrossRef]
  68. Jacobson, A.B.; Starman, T.W.; Lombardini, L. Substrate moisture content effects on growth and shelf life of Angelonia angustifolia. HortScience 2015, 50, 272–278. [Google Scholar] [CrossRef]
  69. Hardisky, M.A.; Klemas, V.; Smart, R.M. The influence of soft salinity, growth form, mad leaf moisture on the spectral reflectance of Spartina alterniflora canopies. Photogramm. Eng. Remote Sens. 1983, 49, 77–83. [Google Scholar]
  70. Xiao, X.; Hollinger, D.; Aber, J.; Goltz, M.; Davidson, E.A.; Zhang, Q.; Moore, B., III. Satellite-based modeling of gross primary production in an evergreen needleleaf forest. Remote Sens. Environ. 2004, 89, 519–534. [Google Scholar] [CrossRef]
Figure 1. Locations of the soil sampling sites in Vietnam: (A) Locations of the 13 sampling points in Nam Can commune, Ky Son district, Nghe An Province; (B) locations of eight sampling points in the Kon Tum and Gia Lai Provinces, the northern part of the Central Highlands of Vietnam.
Remotesensing 11 00716 g001
Figure 2. Flowchart of the methodology to estimate and map the soil moisture content (SMC) over the Central Region of Vietnam, using Landsat 8 (L8) images.
Remotesensing 11 00716 g002
Figure 3. Spectral features of dry soil (SMC = 0%) and saturated soil (SMC ~ 51.9%) of six investigated soil types laid over the band locations of the L8 multispectral bands. The difference of soil reflectance, Rrs(λ), at both soil states, (a) dry and (b) saturation, indicates the effect of not only the SMC, but also other soil components on Rrs(λ).
Remotesensing 11 00716 g003
Figure 4. Images of the soil sub-samples, and charts presenting the spectral response to various SMC of six soil samples taken from the northern part of the Central Highlands of Vietnam, indicate the trend showing a lower Rrs(λ) with higher SMC. The six soil samples in the experiment correspond to the six investigated soil types: (a) Acric ferralsols; (b) Dystric gleysols; (c) Rhothic ferrasols; (d) Eutric fluvisols; (e) Orthic ferralsols; (f) Ferric acrisols.
Remotesensing 11 00716 g004
Figure 5. The fit-curve regressions of SMC and Rrs(λ) corresponding to: (a) the L8 SWIR-2 band, B7; (b) NSMI (calculated by (B6−B7)/(B6+B7)); c) the L8 spectral ratio of the NIR band (B5) versus the SWIR-2 band, B5/B7, using data measured from 80 soil sub-samples. The best fit of the exponential curve to the relationship of SMC and B5/B7, which is (c) indicates the appropriateness of this band ratio for estimating SMC by using L8 data.
Remotesensing 11 00716 g005
Figure 6. (a) Scatterplot showing the validated result of L8RSM for estimating SMC, using SMC estimated from Rrs(λ) corresponding to L8 B5/B7, and the in situ SMCs of 13 soil samples taken in Nam Can Commune; (b) the features of Rrs(λ) for these 13 soil samples. The error of L8RSM (RMSE = 3.21) corresponds to approximately 12% of the mean of the in situ SMC.
Remotesensing 11 00716 g006
Figure 7. Comparisons of in situ Rrs(λ) and retrieved Rrs(λ) corresponding to (a) the L8 NIR band (band 5: B5), (b) the L8 SWIR-2 band (band 7: B7), and (c) the spectral ratio corresponding to B5/B7, obtained via two atmospheric correction methods: DOS and LaSRC. While the retrieved Rrs(λ) of B5 and B7 indicates significant biases with respect to in situ Rrs(λ), the retrieved B5/B7 (c) demonstrates a smaller dependency of the data on atmospheric correction, and it is consistent with in situ data, and therefore suitable for use in SMC estimation.
Remotesensing 11 00716 g007
Figure 8. Validation result of L8RSM for estimating SMC using in situ SMC and estimating SMC of seven sampling points in Nam Can Commune: (a) Locations of seven sampling points overlaid the estimated SMC map obtained from using the L8RSM and L8 scene taken over the Nam Can Commune on sampling date, 11 April 2018; (b) scatterplot showing the comparison of in situ and estimated SMC at seven sampling points. The reasonable error (RMSE = 5.8) corresponding to 20% of the mean of the in situ SMC indicating the suitability of L8RSM for estimating and mapping SMC using the L8 images.
Remotesensing 11 00716 g008
Figure 9. Maps of SMC estimated from the L8 images acquired over the northern part of the Central Highlands of Vietnam in March 2015 (a) and March 2016 (b), showing that almost all of the observed land areas were covered by soils with SMC < 40%, which nearly fit the drought-affected districts reported by the local government and management (the oblique lined pattern areas).
Remotesensing 11 00716 g009
Figure 10. Images of agricultural products damaged by the drought in March 2016: (a) Coffee trees in a farm in the Ia Grai district, Gia Lai Province were shriveled up, due to a lack of irrigation during the drought [46]; and (b) a farmer in Gia Lai Province on his rice farm with yield losses [47].
Remotesensing 11 00716 g010
Figure 11. Map of the retrieved NDDI-overlaid estimated SMC from L8 images acquired over the northern part of the Central Highlands of Vietnam in March 2015, which demonstrates the spatial relationship between these two variables: (A) within the area, 20–30% is dense vegetation coverage; (B) within the area, more than 40% is dense vegetation coverage; (C) within the area with lower than 20% dense vegetation coverage.
Remotesensing 11 00716 g011
Table 1. Features of soil samples and soil types in the study basing the description of FAO [28].
Kind of SoilNo. of Sample CollectionRepresentative ColorIndicator FeaturesSoil Characteristics
Rhodic ferralsols1 Remotesensing 11 00716 i001 Remotesensing 11 00716 i002Highest iron, strong acidity and low phosphorus, rarely affected by erosion, very few reserves of available minerals, easily lost topsoil organic matter, low resilience and moderate sensitivity
Orthic ferralsols2 Remotesensing 11 00716 i003High iron, strong acidity and low phosphorus, rarely affected by erosion, very few reserves of available minerals, easily lost topsoil organic matter, low resilience and moderate sensitivity
Acric ferralsols1 Remotesensing 11 00716 i004Moderate iron, strong acidity and low phosphorus, rarely affected by erosion, very few reserves of available minerals, easily lost topsoil organic matter, low resilience and moderate sensitivity
Ferric acrisols15 Remotesensing 11 00716 i005Acid, low base status (< 50% base saturation) and strongly leached, poor in nutrient, easily soil degradation with agricultural practices
Eutric fluvisols1 Remotesensing 11 00716 i006Suitable for intensive agriculture, high resilience and low sensitivity
Dystric gleysols1 Remotesensing 11 00716 i007Most fertile soils, organic matter decrease due to easily eroded, moderate resilience and moderate to low sensitivity.
Table 2. Landsat images used to calculate SMC in this study.
No.Scene ID.Date (mm/dd/yy)
1LC81240502015065LGN0103/06/2015
2LC81240512015065LGN0103/06/2015
3LC81250502015088LGN0103/29/2015
4LC81240502016068LGN0103/08/2016
5LC81240512016068LGN0103/08/2016
6LC81250502016091LGN0203/31/2016
7LC81280462018101LGN0004/11/2018
Table 3. Correlations (R, Pearson coefficient) of Rrs(λ) corresponding to L8 band (from visible to SWIR2, B1 to B7) signals and SMC in each soil type sample, and in all cases.
Soil Type SampleRB1RB2RB3RB4RB5RB6RB7
Acric ferralsols−0.76−0.77−0.76−0.68−0.70−0.90−0.91
Dystric gleysols−0.74−0.75−0.74−0.75−0.75−0.83−0.85
Rhothic ferrasols−0.70−0.67−0.57−0.56−0.56−0.66−0.69
Eutric fluvisols−0.69−0.70−0.71−0.73−0.75−0.81−0.81
Orthic ferralsols−0.70−0.70−0.64−0.65−0.68−0.86−0.85
Ferric acrisols−0.83−0.82−0.80−0.78−0.79−0.90−0.91
All soil types−0.46−0.47−0.46−0.48−0.50−0.66−0.73
Table 4. Performance of the band, band ratios, and the combinations used for estimating SMC, using the dataset of SMC and Rrs(λ) corresponding to the L8 bands of 80 soil sub-samples taken from the central region of Vietnam.
Band/Band Ratios/ Band CombinationsMinimumMaximumMeanStd. DeviationR2RMSEModel
SMC (%)0.0056.6625.0816.71
B5 − B1 [9]0.050.290.130.070.1515.81Logarithmic
B5 − B2 [9]0.040.260.120.050.1316.00Logarithmic
B7 − B1 [9]−0.010.250.080.070.5811.09Linear
B5/B7 (proposed in this work)0.833.911.630.620.738.85Logarithmic
B6/B7 [12]1.182.641.760.360.5611.43Logarithmic
(B7 − B1)/(B7+B1) [9]−0.080.750.360.180.3413.94Linear
The Normalized Difference Soil Moisture Index, NSMI [35]0.010.440.200.110.5111.94Logarithmic
The Normalized Multi-band Drought Index, NMDI [34]0.180.900.450.190.3413.88Logarithmic

