NDVI Identification and Survey of a Roman Road in the Northern Spanish Province of Álava


1
MOLA (Museum of London Archaeology), Mortimer Wheeler House, 46 Eagle Wharf Road, London N1 7ED, UK
2
Research Group in Heritage and Cultural Landscapes—University of Basque Country, Centro de Investigación Micaela Portilla, C/Justo Vélez de Elorriaga, 1, 01006 Vitoria-Gasteiz, Spain, [email protected]
*
Author to whom correspondence should be addressed.
Remote Sens. 2019, 11(6), 725; https://0-doi-org.brum.beds.ac.uk/10.3390/rs11060725
Submission received: 1 March 2019
/
Revised: 21 March 2019
/
Accepted: 22 March 2019
/
Published: 26 March 2019
(This article belongs to the Section Remote Sensing Image Processing)
Abstract
:The Iter 34 (Antonine Itinerary XXXIV) is the name of the Roman road that crosses the province of Álava from west to east. Since no specific path was officially recognized before our study, the remains of the road did not benefit from heritage protection. In 2017, we made a project to determine the course of the road through rural Álava. In addition to traditional archaeological excavation and prospecting techniques, we used UAVs (unmanned aerial vehicle) to produce NDVI (normalized difference vegetation index) orthomosaic plans of ten cultivated areas through which the road is conjectured to pass. NDVI orthomosaics let us see crop marks better than with conventional photography, allowing us to detect the crop marks during times of the year and in places where conventional photography would fail to show them. Thanks to the NDVI orthomosaics, remains of the road were identified not only in places where we knew it existed, but also in previously unknown locations. Furthermore, other archaeological features were identified close to the roadway. This technique heralds a great advance in non-invasive methods of archaeological surveying. By using precision farming techniques we have identified the course of the Roman road Iter 34 in several locations in a short period of time and with few resources.

1. Introduction
During the past two decades, satellite images have been used for archaeological surveying, laying the foundations of remote sensing for archaeology. In most cases the spatial resolution of satellite images is not sufficient to allow archaeological features to be shown [1,2,3,4,5] the new generations of satellites as the World View 2 with a spatial resolution of up to 2.5 m per pixel are starting to produce good results in archaeological surveys [6,7]. Low aerial photographs taken from UAVs have a much higher spatial resolution, such us the photographs used in this study case which are around 3.2 cm per pixel. The lower quality of UAV images compared to satellite-borne images is compensated for by the advantages of taking the photographs at low altitude and at the precise moment they are needed; so the limited spatial resolution of the satellite photographs that renders them useless for archaeological purposes in most cases is resolved with the use of UAVs [8,9].
More recently, the appearance of UAVs has put low aerial photography at reach of almost any archaeologist [10]. The development of photogrammetry softwares, which are able to process pictures taken with general purpose cameras, has brought about a revolution in archaeological recording, which in conjunction with the appearance of UAVs (which can accurately follow pre-programed missions), has allowed archaeologists to produce accurate surveys and 3D models easily and quickly [11,12,13]. The high sensitivity of digital cameras to near infrared wavelengths makes them perfect for recording this part of the light spectrum [14,15,16,17]. The general development of Geographic Information System (GIS) allows the management of geographic information from old and new maps, aerial photographs, site surveys, orthomosaics, etc., making them easy to work with, and an invaluable tool in heritage protection and management [18]. Precision agriculture techniques are creating software and workflows that use remote sensing principles to asses crops health. All these elements are drastically changing the panorama of aerial archaeology, whereby aerial images obtained from UAVs are now widely used for survey, recording and publication [19,20,21,22,23,24,25,26].
Multi-and hyperspectral images have been successfully used to document architectural heritage [27], and to study small finds [14]. Remote sensing techniques and indexes have been used to identify buried archaeological remains, but at present there is no general consensus about which wavebands and indexes such as NIR, NDVI, SR, BAI, TCARI, red edge are better for enhancing the visibility of cropmarks [3,4,7,15,16,28]. There is no single answer to this question as it will probably depend on the particular conditions of each field, crops season and the type of archaeological remains. With so many options available, we decided to investigate the most popular method. NDVI is one of the more frequently used indexes in precision agriculture, and almost any drone operator is able to produce NDVI orthomosaics similar to those shown in this article. A large amount of information is obtained every day for agricultural purposes which may also be of archaeological use. Learning to identify the kinds of anomalies produced by archaeological features one can expect to see in NDVI is a much needed first step towards the full exploitation of these new resources, and forms the basis of our study. One could argue that other indexes and wavelengths may be better suited to archaeological survey, but the greater availability of NDVI makes it essential that we learn to utilize it.
A Roman road has a standard form that should be easy to identify, enabling us to offer a clear example of how a feature of this type appears in NDVI. It is a long, linear feature that crosses the study areas, measuring 4–6 metres wide and flanked by roadside ditches. It is a considerable structure that is much easier to identify than the walls of buildings, which means we could fly higher and cover larger areas of terrain than if we were looking for walls measuring only half a metre wide. The road is fairly horizontal, and although the pavement may have broken up and the stones may have scattered or fallen into the roadside ditches, we would not expect it to be buried under the rubble of its own collapse as would happen with the walls of a buried building [29]. For all these reasons we thought that a Roman road was the perfect subject for this experiment. Once we have learned to identify Roman roads easily and quickly in NDVI, it will be very useful tool in furthering our understanding of the organization of territory anywhere in the Roman Empire. The Iter 34 road met these requirements:
The Iter 34 is referred to in the 3rd-century AD Antonine Itinerary but locating the route of this Roman road has been a historical and archaeological conundrum for the past 200 years. Since the first conjecture of the route was made at the end of the 18th century, there have been numerous suggestions for its course [30,31,32,33]. These proposals suffered from two main problems: Firstly, the failure to identify the mansiones (lodging-places) referred to in the Antonine Itinerary [32,33,34,35,36,37,38] and, secondly, the lack of a comprehensive study method for its search and identification, even though the basis of this had been proposed since at least the 1990s [38] and work had already been done in this regard during the first decade of the 21st century [29].
The first problem was solved at the beginning of the 21st century. The locations of these mansiones have now been pin-pointed with archaeological data that goes beyond mere hypothesis (Figure 1). In this matter, the stand-out studies are those of Varón in Arce-Mirapérez/Deobriga [39,40]; in Iruña-Veleia the works of Gil and Filloy made between 1994–2008 [41] and followed by the ongoing works of Núñez which began in 2010 [42,43,44,45,46]. In Arkaia/Suestatio, the works of Loza, Loza and Niso [47]; in Alegría-Dulantzi/Tullonium, the works in San Martín de Dulantzi [48]; and finally, the works carried out in Albeiurmendi/Alba by Gil [49]. The results of these various studies have allowed us to theorize about the likely corridors through which the Iter 34 could have run. Regarding the locations of the mansiones, we can add the excavation of a mutatio (changing-station) and remains of the road at Mariturri in Vitoria-Gasteiz by Núñez and Saénz de Urturi [50].
We tried to tackle the second problem with the study we carried out in 2017. Our multi-faceted study included reviewing the historical sources and archaeological investigations made during the past 30 years. 18th and 19th century maps and plans which illustrate the road were verified [51,52], and we conducted an exhaustive toponymic study of both current and ancient place names mentioned in the medieval written sources, especially those dating from the 9th‒12th centuries [53], we examined sets of vertical aerial photographs dating from 1932 to the present day [54] as well as the most recent low-level photographs [29,55]. We examined the pictures from Landsat and SPOT satellites in panchromatic photographs and produced NDVI indexes with the multispectral images. Where possible we analyzed the area with LiDAR, carried out field walking and opened archaeological test pits [56]. At this point we had several areas where we suspected the road existed though there was no evidence for it. We therefore decided to survey those areas in NDVI with low altitude photographs taken from UAVs hoping to confirm the presence of the Roman road there.
The main aims of this experiment were to identify the course of the Roman road Iter 34 in 10 study areas so it can be legally protected, and to assess the suitability of the NDVI index for identifying crop marks to the point where it may be used as a method of archaeological prospection in its own right. The method we developed for this study is of great importance in the field of cultural heritage as it allows for a quick, non-invasive and inexpensive survey of buried remains. We used it to find new evidence of the Roman road, resulting in its legal protection, and it also has wider applications in the heritage industry. For instance, it could be used to monitor sites year after year, thereby contributing to the management and conservation of buried heritage by local authorities and stake holders. The ability to survey large areas quickly would also be of great benefit in the early stages of the planning process.
This article is an extended version of a lecture given at the annual meeting of the CAA UK (Computer Applications and Quantitative Methods in Archaeology, United Kingdom) at Edinburgh on October 2018 [57] in Supplementary Materials.
2. Study Area
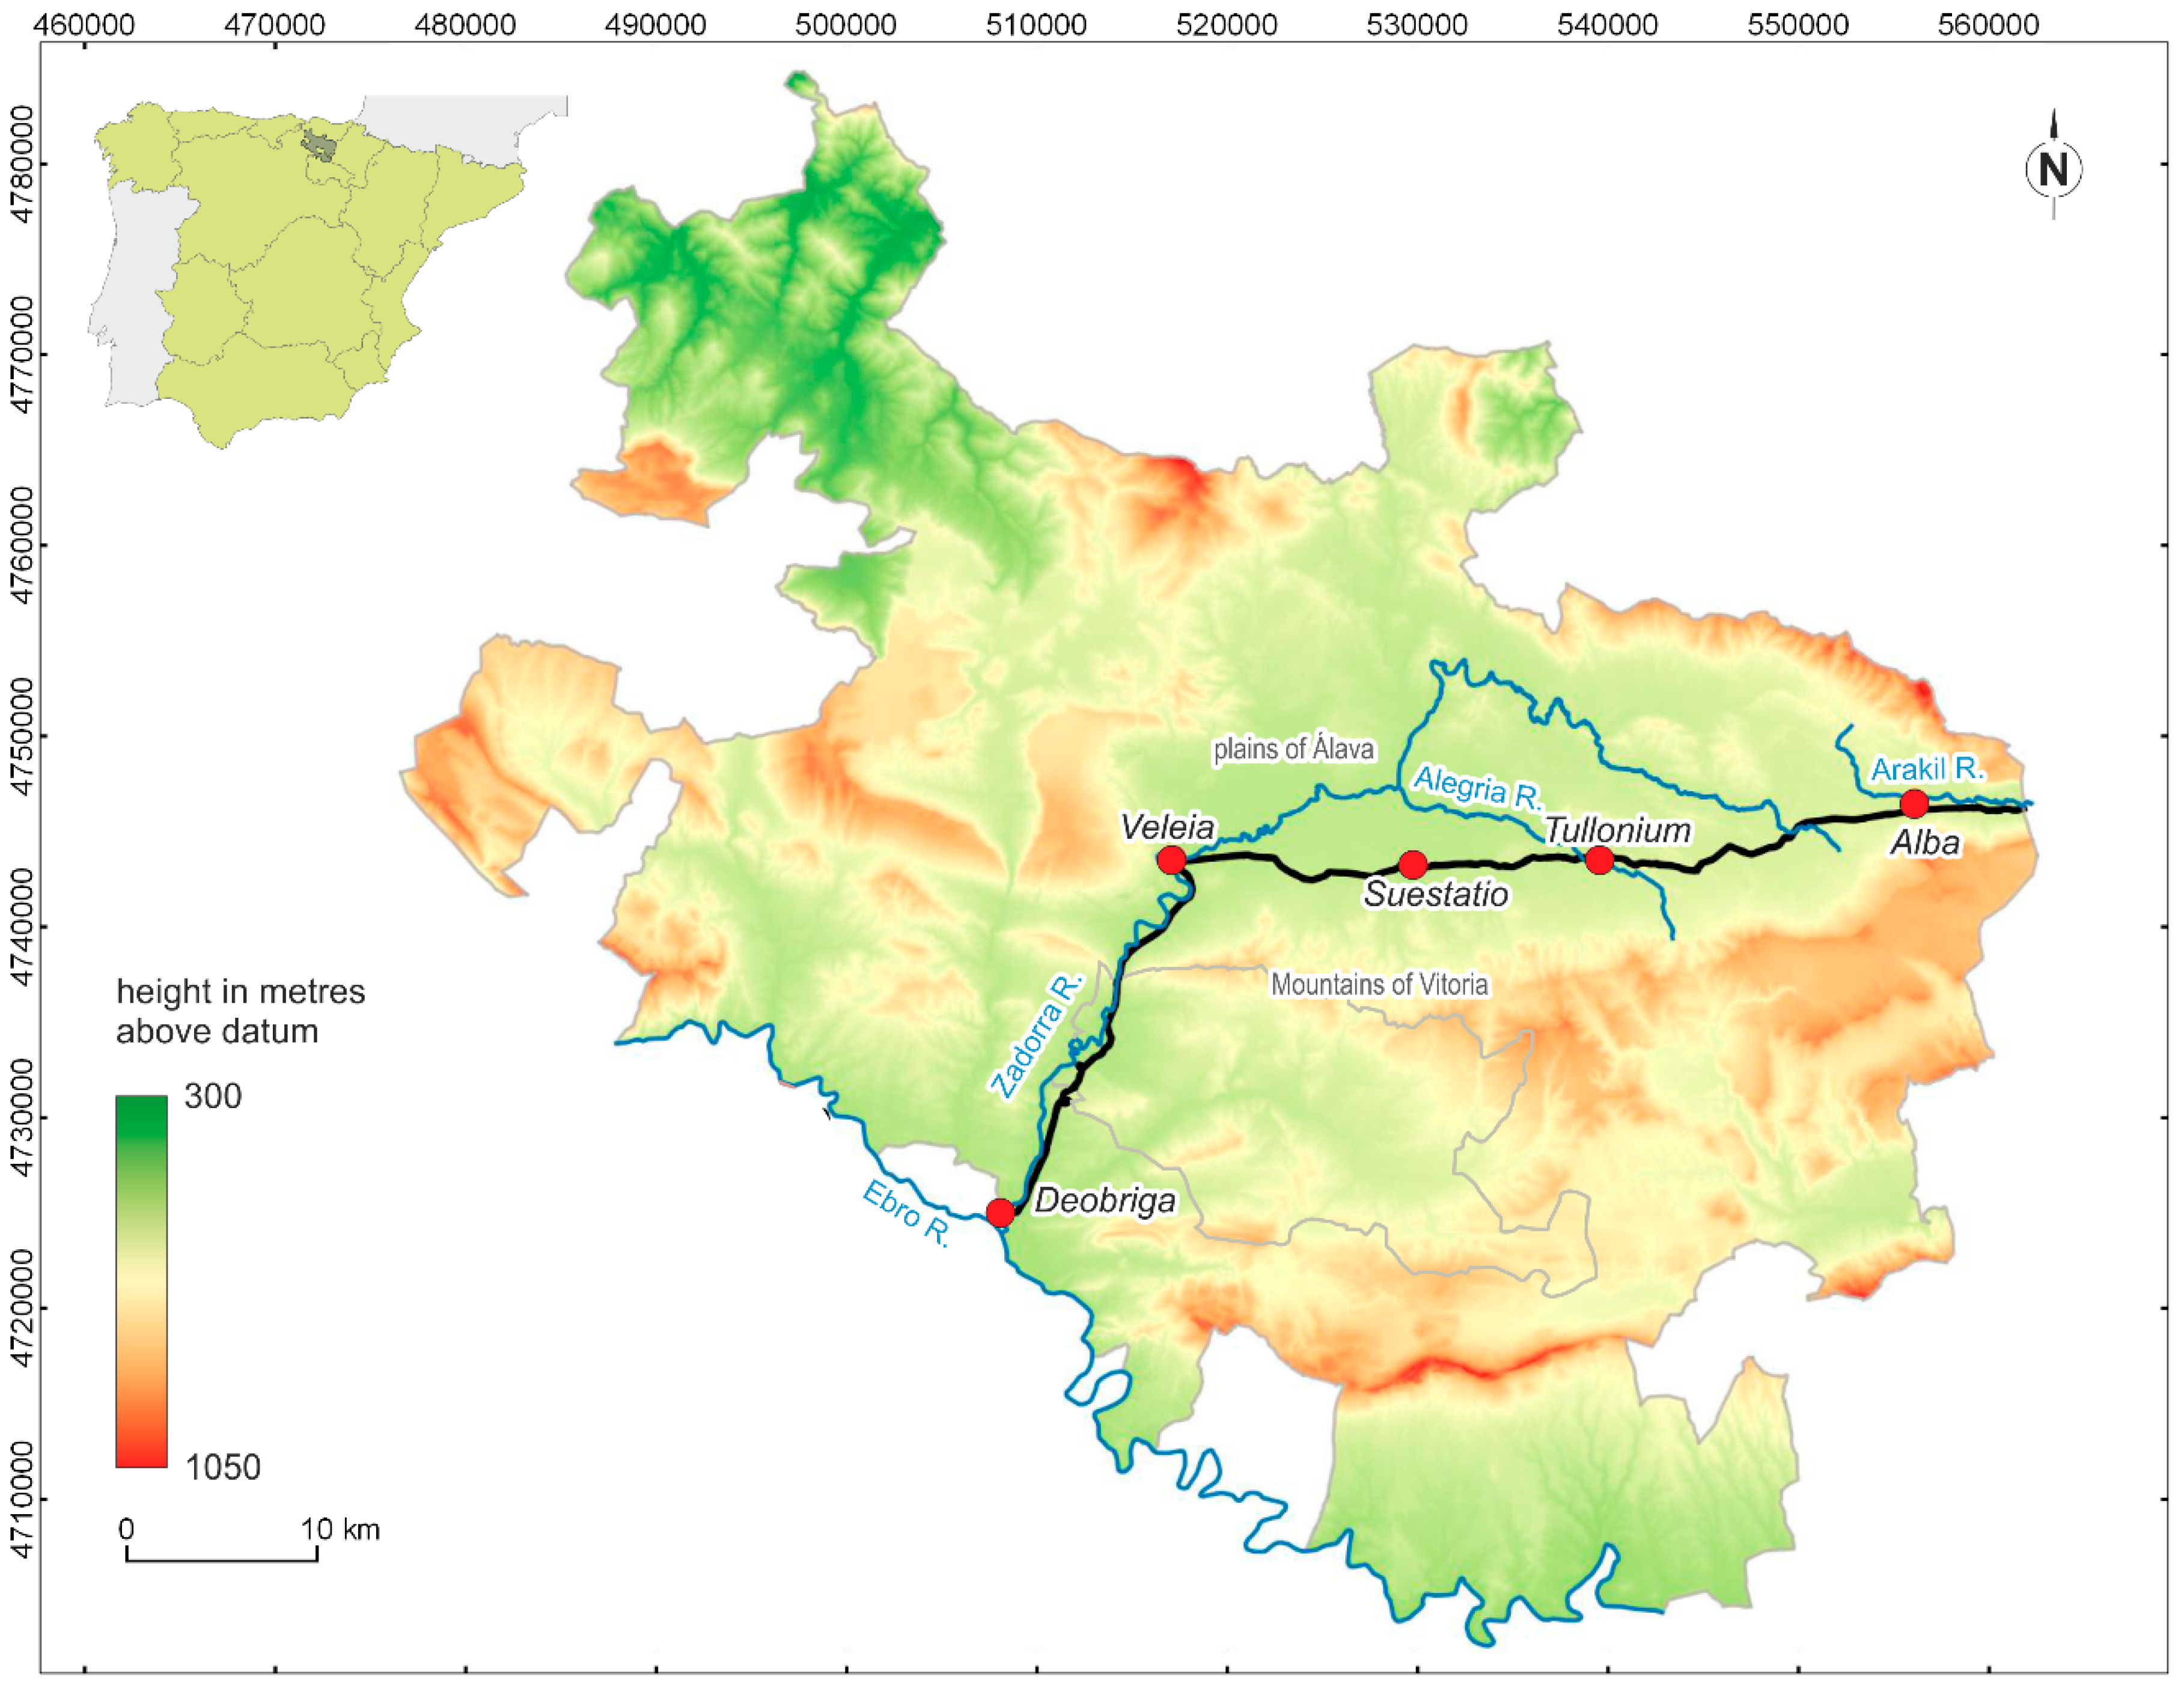
The province of Álava is part of the autonomous community of the Basque Country in the north of Spain. Our study area is located approximately in the central strip of this territory and extends from east to west. The orography of this area is characterized by the Ebro-Treviño basin in the west and the plains of Álava which lies in the east, separated by the Mountains of Vitoria. The extremes of the region lie at 460 and 570 metres above sea level, with some mountain peaks between them reaching 800 metres in altitude. Geologically, the Ebro basin consists of tertiary clays and marls and some deposits of sands and gravels, whereas the plains of Álava is composed of Cretaceous loams covered by Quaternary alluvial deposits. In both cases, the surfaces of these areas are suitable for cultivation [58].
The main rivers in this area are the Ebro, Zadorra, Alegría and Arakil, which have gently sloping, longitudinal profiles that have actively shaped the landscape, creating the flat expanse of the valleys [58].
The region is a climatically transitional area between the Atlantic climate of the north of the province, which lies closer to the Bay of Biscay, and the Mediterranean climate of the neighbouring region of La Rioja to the south. It experiences rain in autumn and winter, with some intense rainfall in spring and drought in summer; the average annual temperature is 12 °C, reaching extremes of 19 °C in summer and 4–4.5 °C in winter [59].
3. Materials and Methods
Our financial resources permitted ten areas to be surveyed using UAVs equipped with infrared cameras that allow the application of NDVI. These ten zones covered significant parts of the route, adding up to a total of more than 88 hectares. This covered areas where the route of the Iter 34 was determined to be either secure, probable or undocumented.
The inclusion of the securely identified routes was necessary in order to confirm that the results obtained were reliable; they were, so to speak, control samples. This occurred in two places where the road had been previously identified archaeologically through field walking and in test pits: Area 4, in Iruña-Veleia [41] and Area 5 in Arkaia/Suestatio [43] (Figure 2).
In the zones where the route was considered probable, there were five cases for which the historiographical works suggest the Iter 34 ran through those areas or nearby, though there was no reliable evidence for the road. This occurred in Areas 1, 2 and 3 in Armiñón, Estavillo/Burgueta and Iruña-Veleia respectively [38], in Area 9 around the Hospital of San Lázaro and Magdalena in Agurain-Salvatierra [59] and Area 10 in Albeiz [33].
Regarding the places where the road is undocumented, we found three areas in which the precise course of the road has never been identified in the local historiography, in Areas 6, 7 and 8.
We therefore hoped to determine the validity of this method to recognize buried remains and, in addition, to find a viable solution for the sections in which traditional research tools had not been used or were not working well (Areas 1, 2, 3, 6, 7, 8, 9 and 10).
The photographs were taken with three Canon Power Shot S 100 cameras, two of which were modified; one to take photos in NIR over 760 nm (wavelength in namometers), and the other to take photographs for pseudo NDVI with a Kodak Wratten 25a filter (longpass filter blocking below 580 nm). Other studies have used cameras made for agricultural NDVI as well as action cameras. Currently these are not good enough for this kind of analysis [21], although the quality of these cameras is constantly improving so we hope that they should soon be able to produce results as good as the cameras we used.
We selected the best lightweight camera we could find that fitted our drones and that would not cut into the flight time too much due to its weight. We chose the Canon PowerShot S100 mainly for the size and the quality of its sensor. This camera produces pictures of 12 MP (megapixel) size at full resolution and has a CMOS sensor of 1/1.7” with a pixel pitch (distance between the center of the pixels in the sensor) of 1.87 µm (micrometres) [21]. This means this camera has a sensor 3 to 5 times larger than the average action and NDVI cameras, and has more sensitivity to colour and to light gradations. The weight of the Canon PowerShot S100 is about 180 grams and it has inbuilt GPS which makes the processing of the pictures by photogrametric software easier.
The cameras were carried by Yuneec Typhoon, DJI Inspire and Walkera Scout drones flown at heights of 120 m, 75 m and 25 m. The height of the flight depends on the size of the plots. For practical reasons the best option was to fly at a height of 75 m. The flights at 120 m height did not have enough spatial resolution, obtaining pictures of 4.38 cm per pixel. The flights at 25 m height gave a spatial resolution of 0.91 cm per pixel, but the creation of the orthomosaic was extremely difficult as there were many pictures that only showed plants that were indistinguishable from each other without any other points of reference such as roads, hedgerows, buildings or trees that would help stitch one picture to the other. The flights at 75 m height produced pictures of 2.74 cm per pixel of spatial resolution. The quality and spatial resolution were sufficient and almost every picture had enough reference points to create the orthomosaic easily. Only Area 8 had flights taken at the higher altitude of 110 m due to its larger size which comprised three plots of land. Flying at 75 m height would not have picked up enough reference points in each picture to match them properly.
We tried taking photographs in visible, NIR and Wratten 25a settings and finally settled on the Wratten 25a filter. This allowed us to generate the NDVI index from a simple set of multispectral pictures where the blue channel records the infrared wavelengths, and the red channel the visible wavelengths. In order to take advantage of the crops at their full height, the pictures were taken between the 25th May to 13th June. All the areas except Area 1 were planted with wheat and oat crops which at that time measured around 1 m high. We wanted the crops to be at their full height with deep roots so that any features buried in the ground would be reflected in the health of the plants.
The pictures were then processed in Drone Deploy, and the resulting orthomosaics were imported in Qgis 2.14 Essen to create the NDVI images and to analyze the results. The resulting orthomosaics were not automatically analyzed; we looked at the NDVI orthomosaics and compared them with historical photographs and maps to try to find traces of the Roman road.
The orthomosaics were rendered in greyscale which highlighted the differences in plant health clearly. The higher the NDVI index, the whiter it will appear in the photographs, corresponding with healthier plants which are performing photosynthesis better. Areas with lower NDVI index indicate less healthy plants or those with lower levels of photosynthesis, which in this colour scheme appear darker.
Once we chose what UAV to use, what height to fly at and with which filter and software, this method was quite efficient from a financial point of view. It took several test runs to decide what was best for this survey, but once this was done the flights were carried out quickly. It would certainly be of interest to return at different times of the agricultural season to survey these areas again and compare the results, but the lack of time and resources did not allow for this. It would also be desirable to survey more areas and to extend the study areas where archaeological features were found.
4. Results
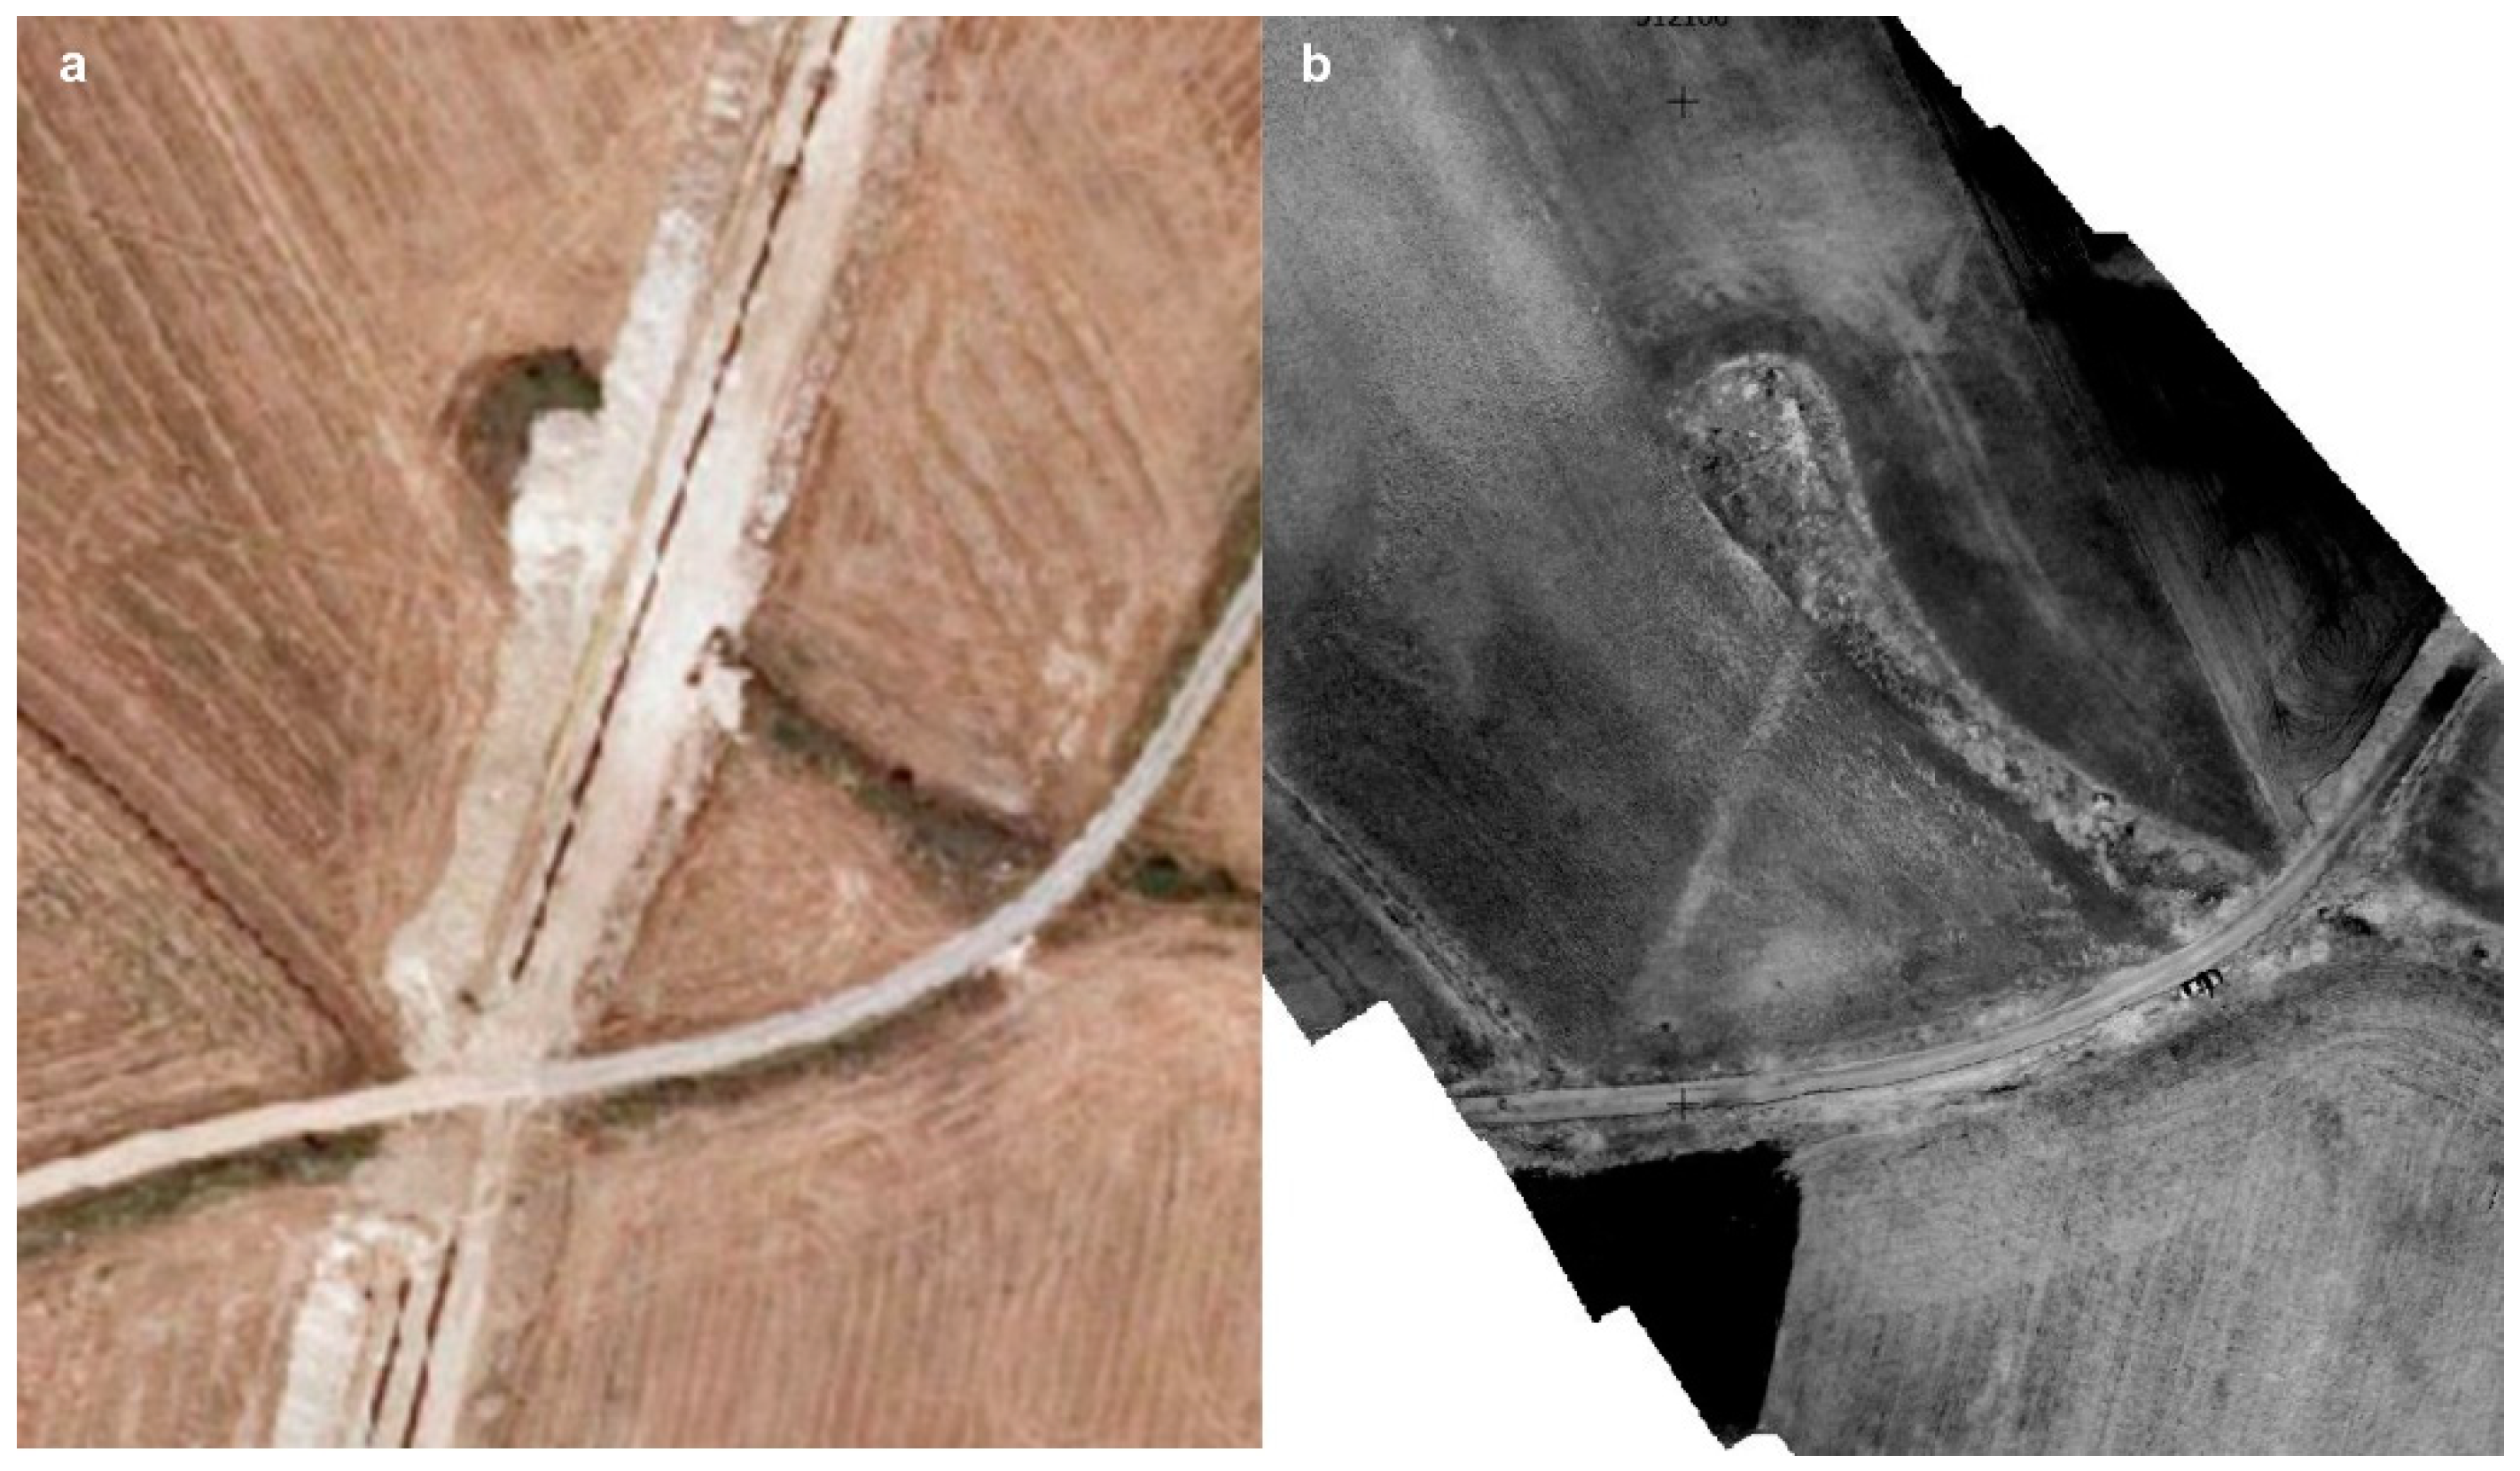
Comparing the results of the flights we made in 2017 with historic photographs from geoEuskadi proved informative. We were able to see some standing structures in the photographs before they had been buried so it was easy to identify the structures causing some of the anomalies detected in the NDVI orthomosaics. Positive archaeological features are deposits or structures added to the stratigraphy such as floors and walls, whereas negative or cut archaeological features have removed deposits from the stratigraphy, such as ditches and wells. Positive archaeological features leave negative or darker marks in NDVI due to the stress caused in the crops by the buried remains. Conversely, negative archaeological features leave positive marks in NDVI, showing the healthier crops above them as whiter in colour [60] (Figure 3).
4.1. Identification of the Roman Road
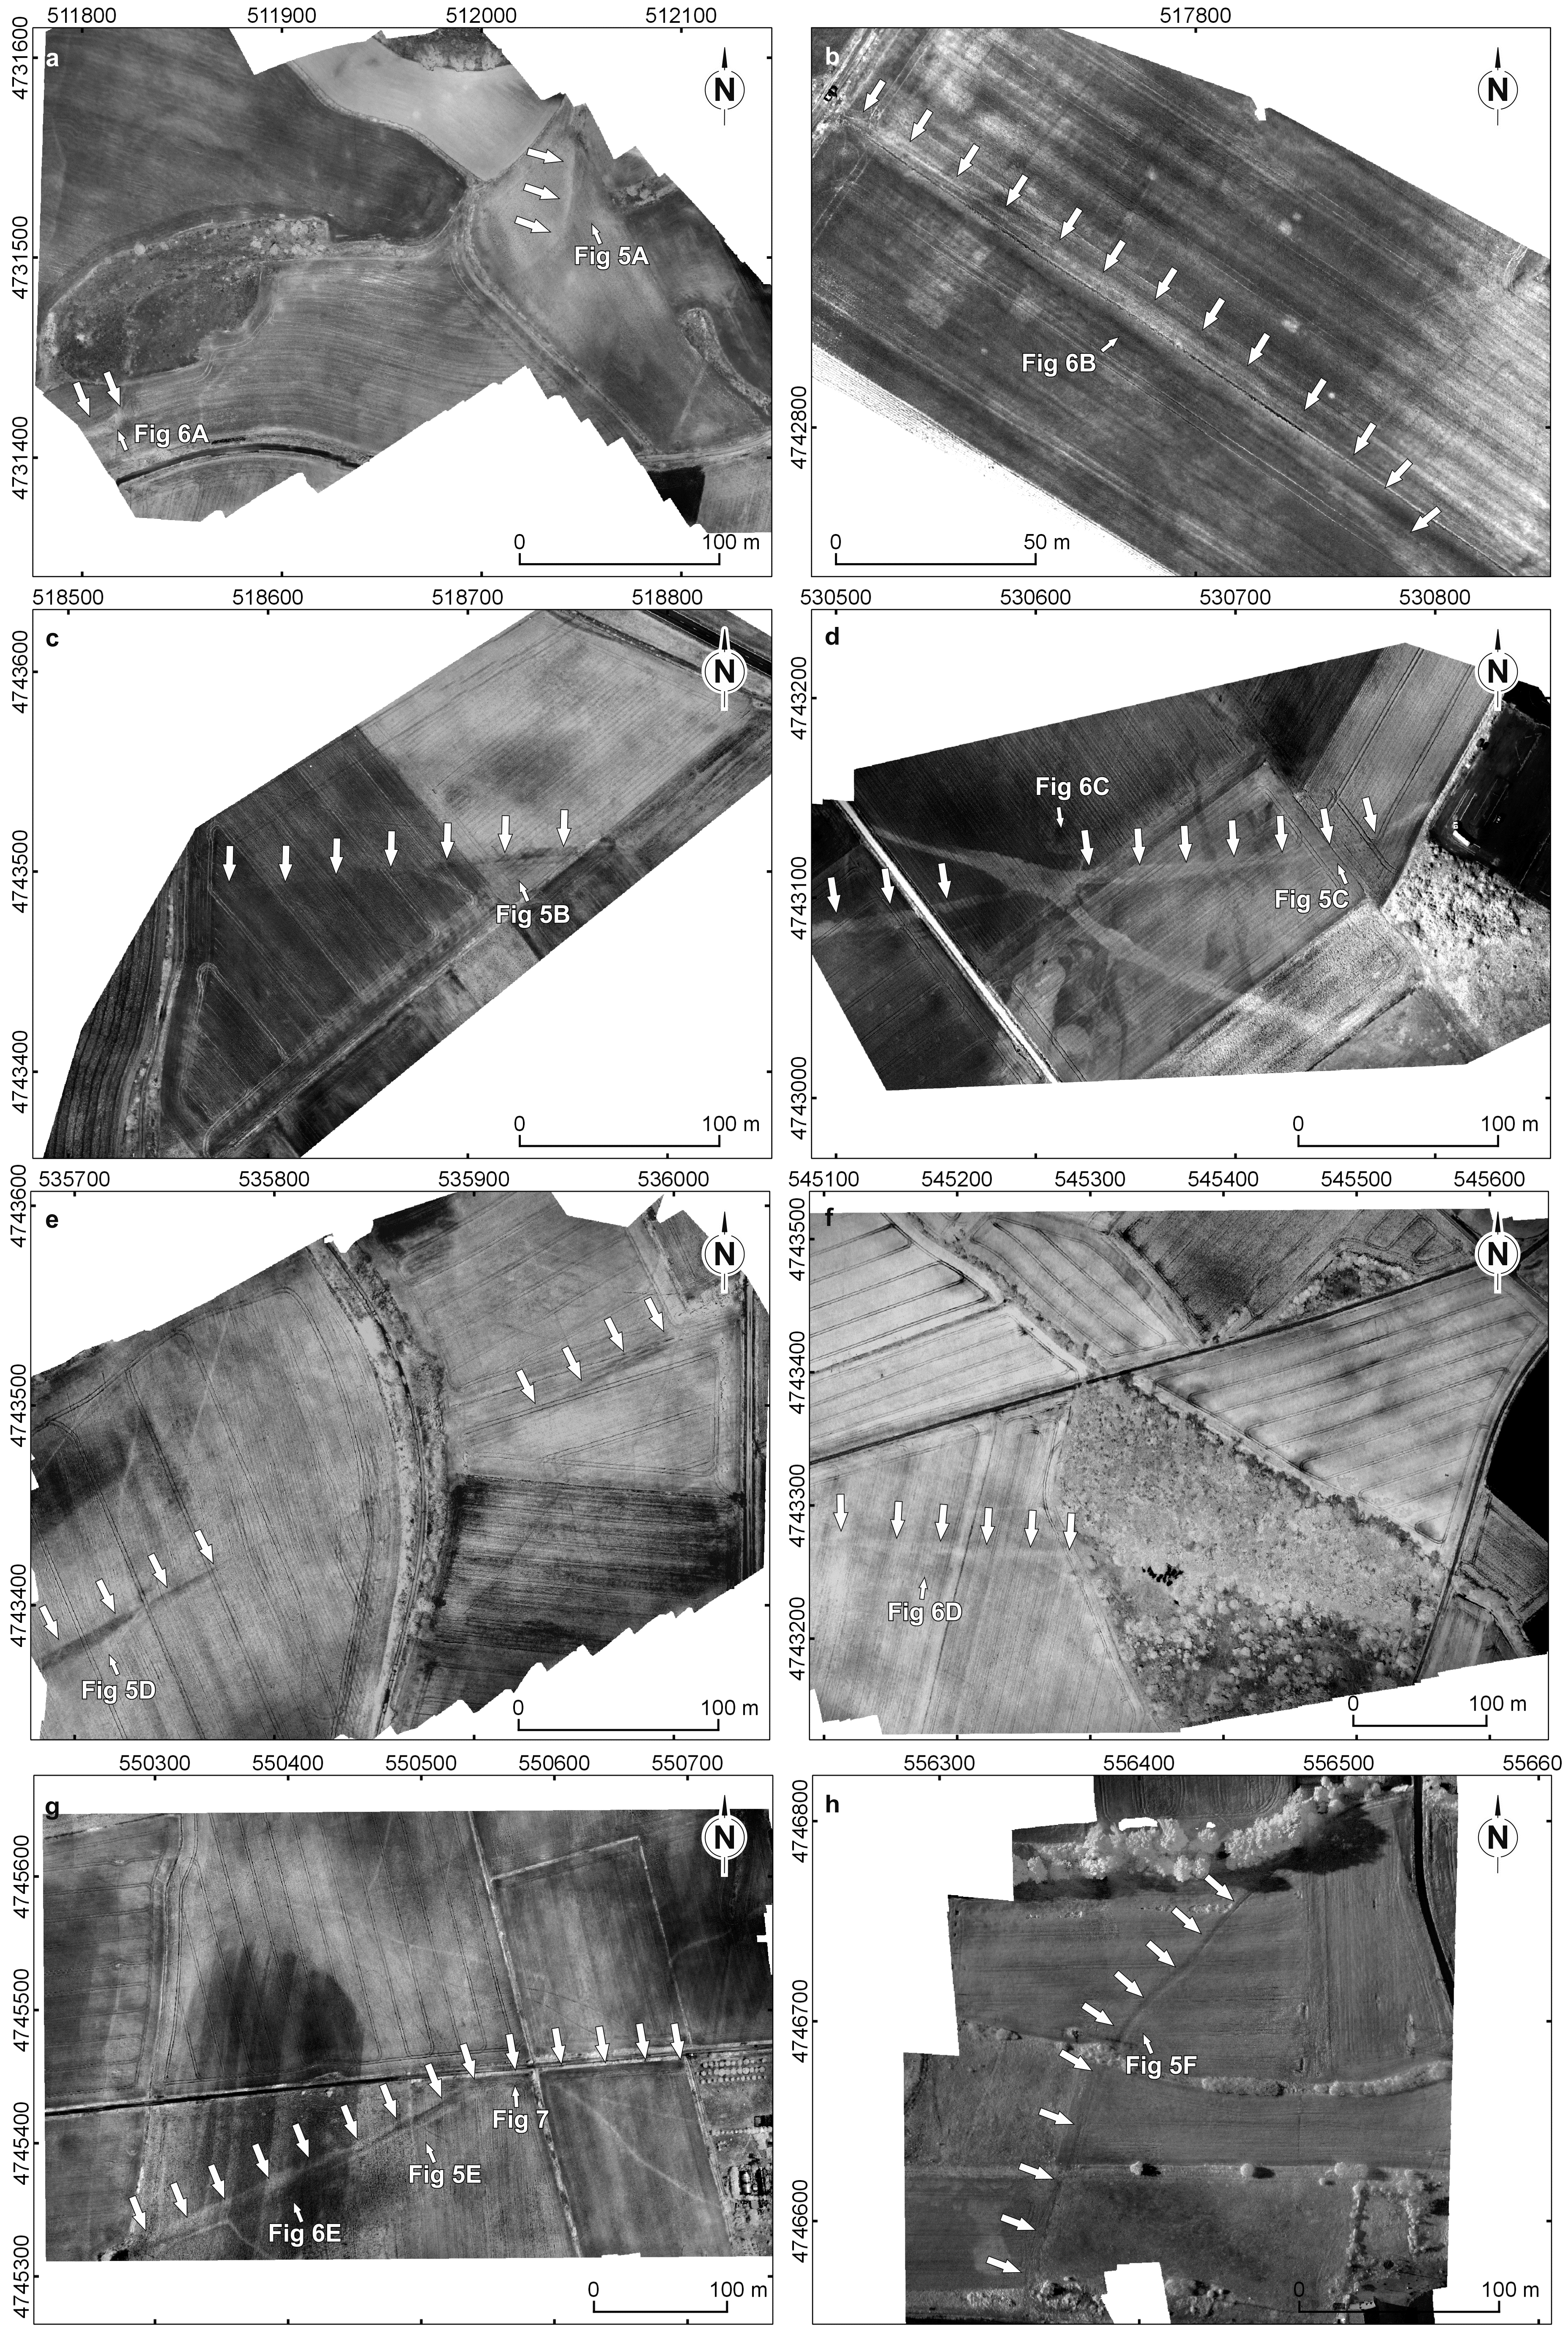
In the ten areas surveyed in our experiment, we found linear anomalies that correspond to the Roman road in eight zones (Areas 2, 3, 4, 5, 6, 8, 9 and 10). In most cases, these are aligned with the conjectured course of the road through the area and had a width and form that strongly suggest that they are caused by the buried road (Figure 4). We identified the features by analyzing the orthomosaics, comparing the features we identified in them with historic photographs and maps, looking specifically for a linear structure that matches the width of the known sections of the Iter 34.
No traces of the road were found in Areas 1 and 7. In Area 1, the soil had been recently ploughed so there was no vegetation to analyze. Although we were able to make out some positive features in Area 7, probably channels relating to water management, we were not able to positively identify any anomalies that correspond to a road in this area.
4.2. Characterization of a Roman Road
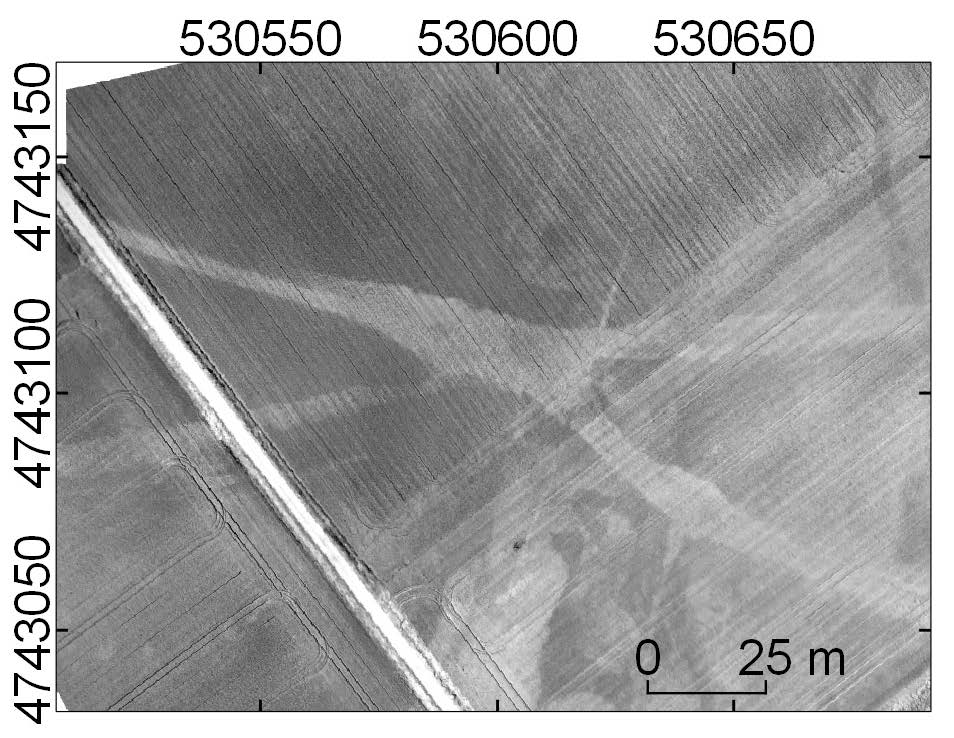
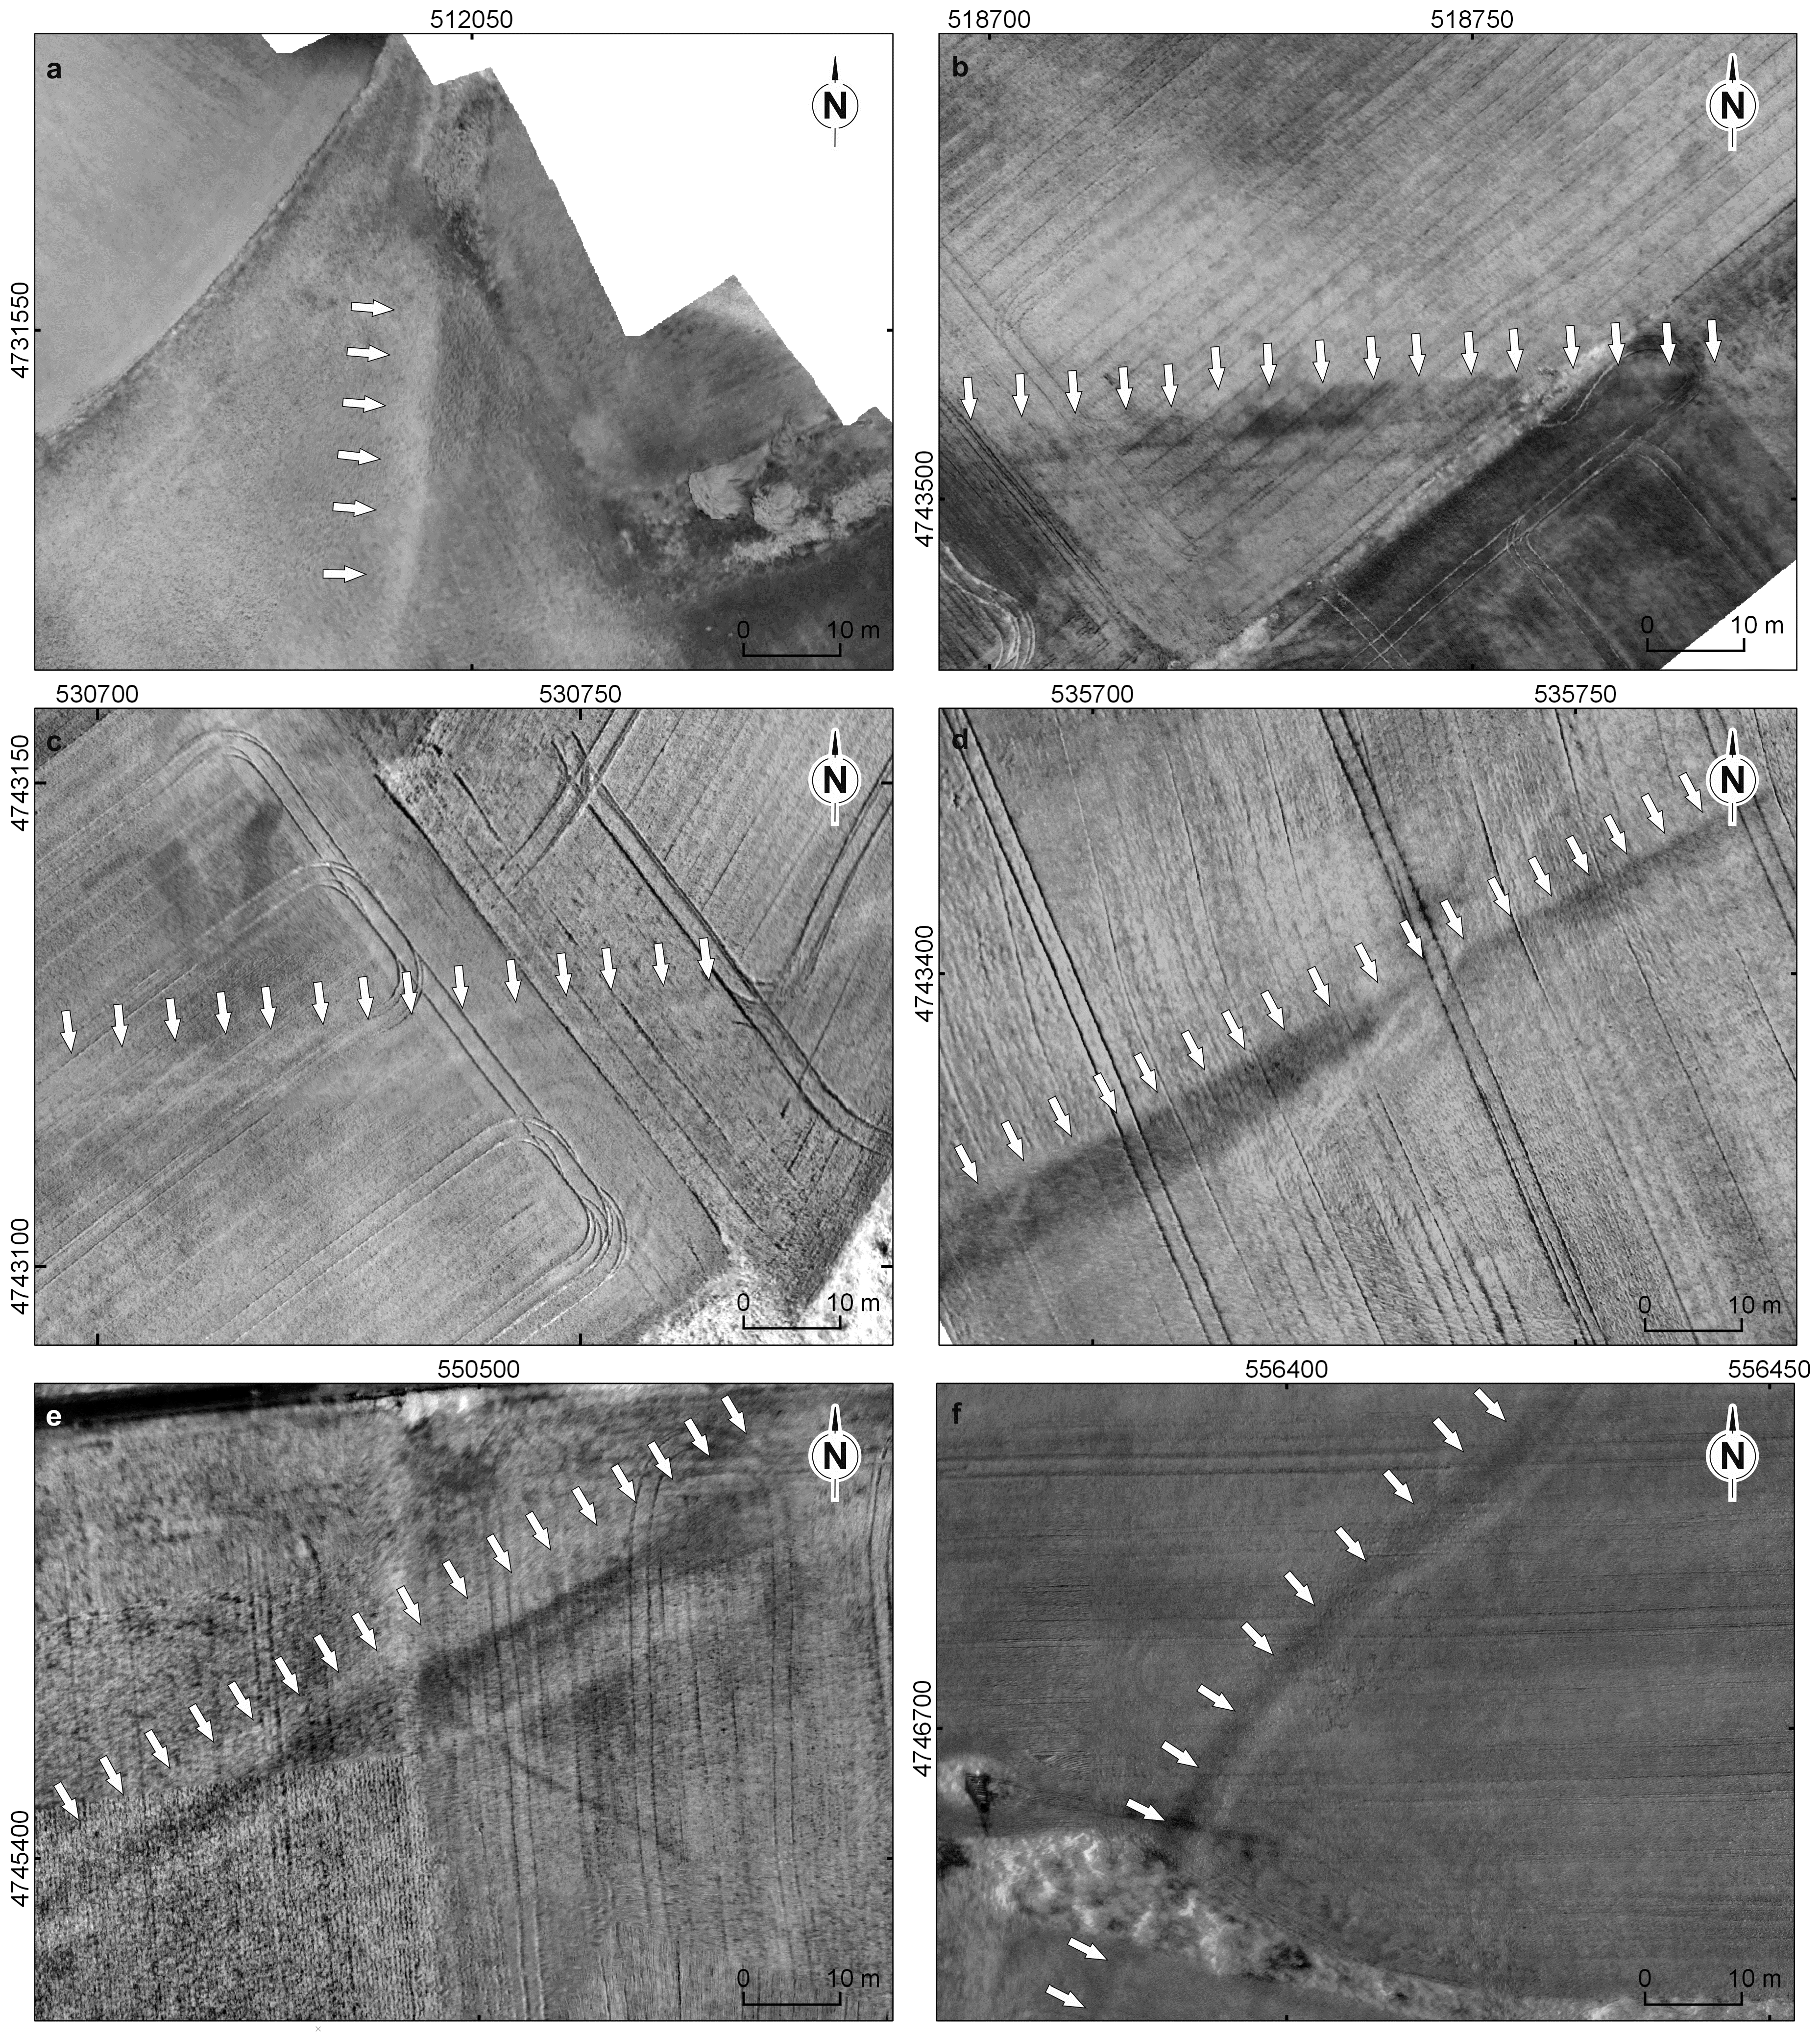
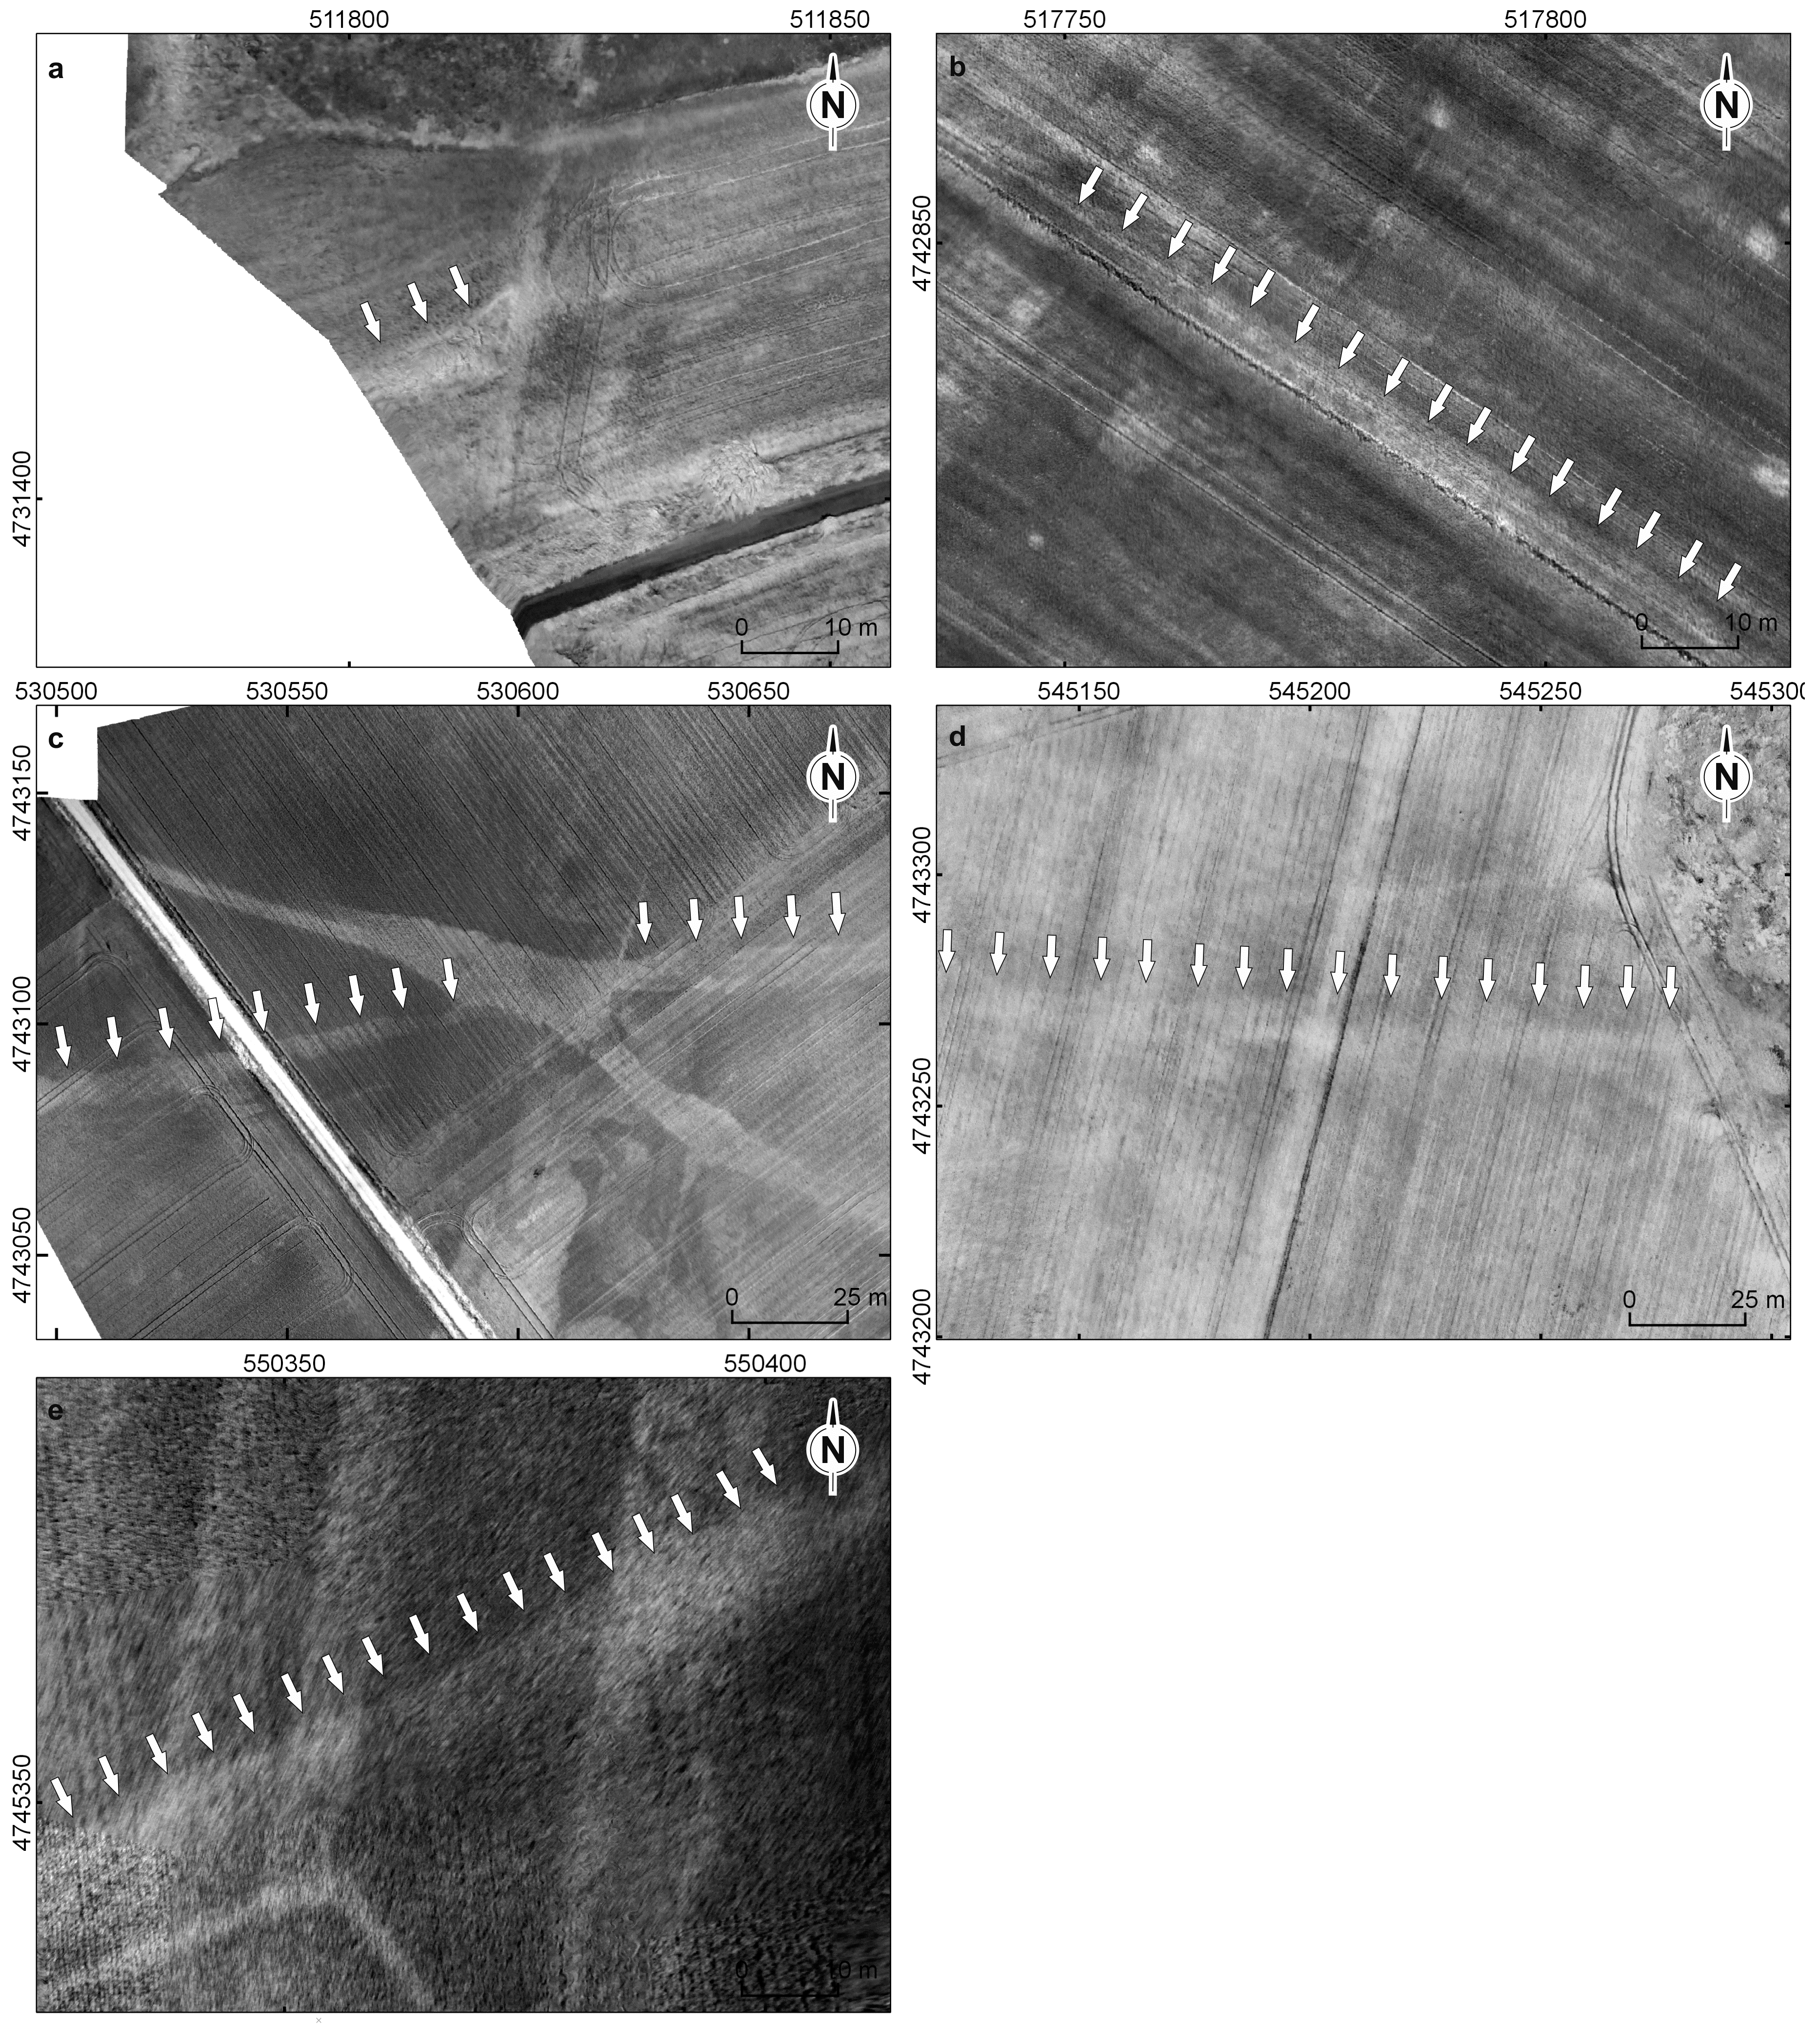
We would expect a feature like a Roman road to be seen in NDVI as a wide, dark or negative linear anomaly corresponding to the buried cobbled surface of the road pavement flanked by two lighter or positive narrow bands representing the roadside ditches, and this is the appearance it has in six of the study areas (Figure 5). In some places the road has not been build but cut into the bedrock and in these areas the road appears lighter in colour where the NDVI reading is more positive; we can see this construction technique in five zones (Figure 6).
Both kinds of road, built and cut, coexist in three areas (Areas 2, 5 and 9) as alternating cut and build methods were needed to keep the inclination of the road level in areas where the bedrock lies very close to the surface. We were able to differentiate the roadside ditches in the built sections of the Roman road, but not in the cut sections where the complete structure, including the road surface and roadside ditches, is a cut feature in the rock.
Where the road is a built structure, the pavement measured an average of 4.2 m; 8 m including the roadside ditches (Areas 2, 4, 9 and 10). In two cases the pavement was narrower, measuring between 2.5–3.0 m with a total width of 8 m including the roadside ditches (Areas 5 and 6). In the areas where the road had been cut, the width of the road is more consistent than in the built areas, perhaps because it is better preserved. Not only is it more consistent within each area, but also between the different areas. The cut parts of the road vary in width between 7.7–8 m. This corresponds closely with the total width of the built sections of the road including the roadside ditches.
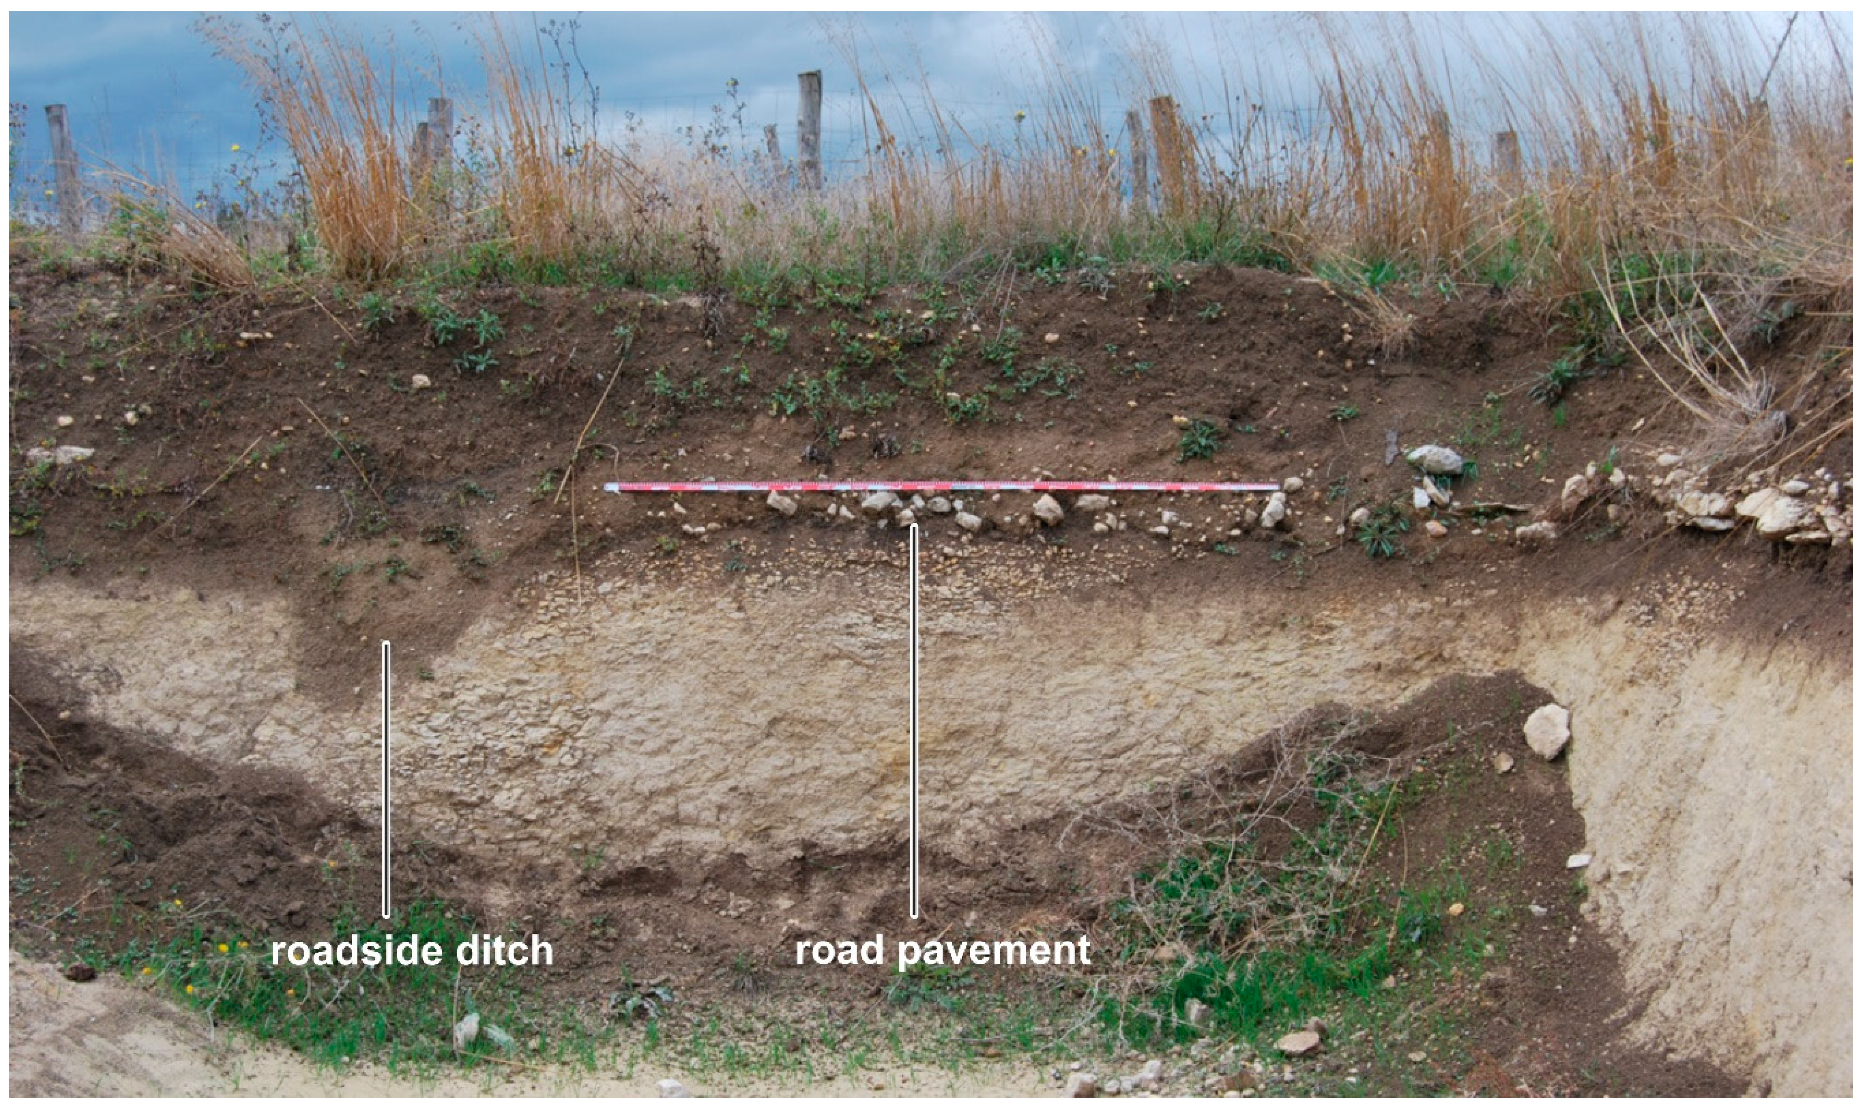
Sometime after we finished this study, a trench for construction work was excavated in Area 9, in a location we had identified in NDVI as a built section of the Roman road. This clearly exposed the paved road surface and one of the roadside ditches in the side of the trench (Figure 7).
4.3. Other Archaeological Features
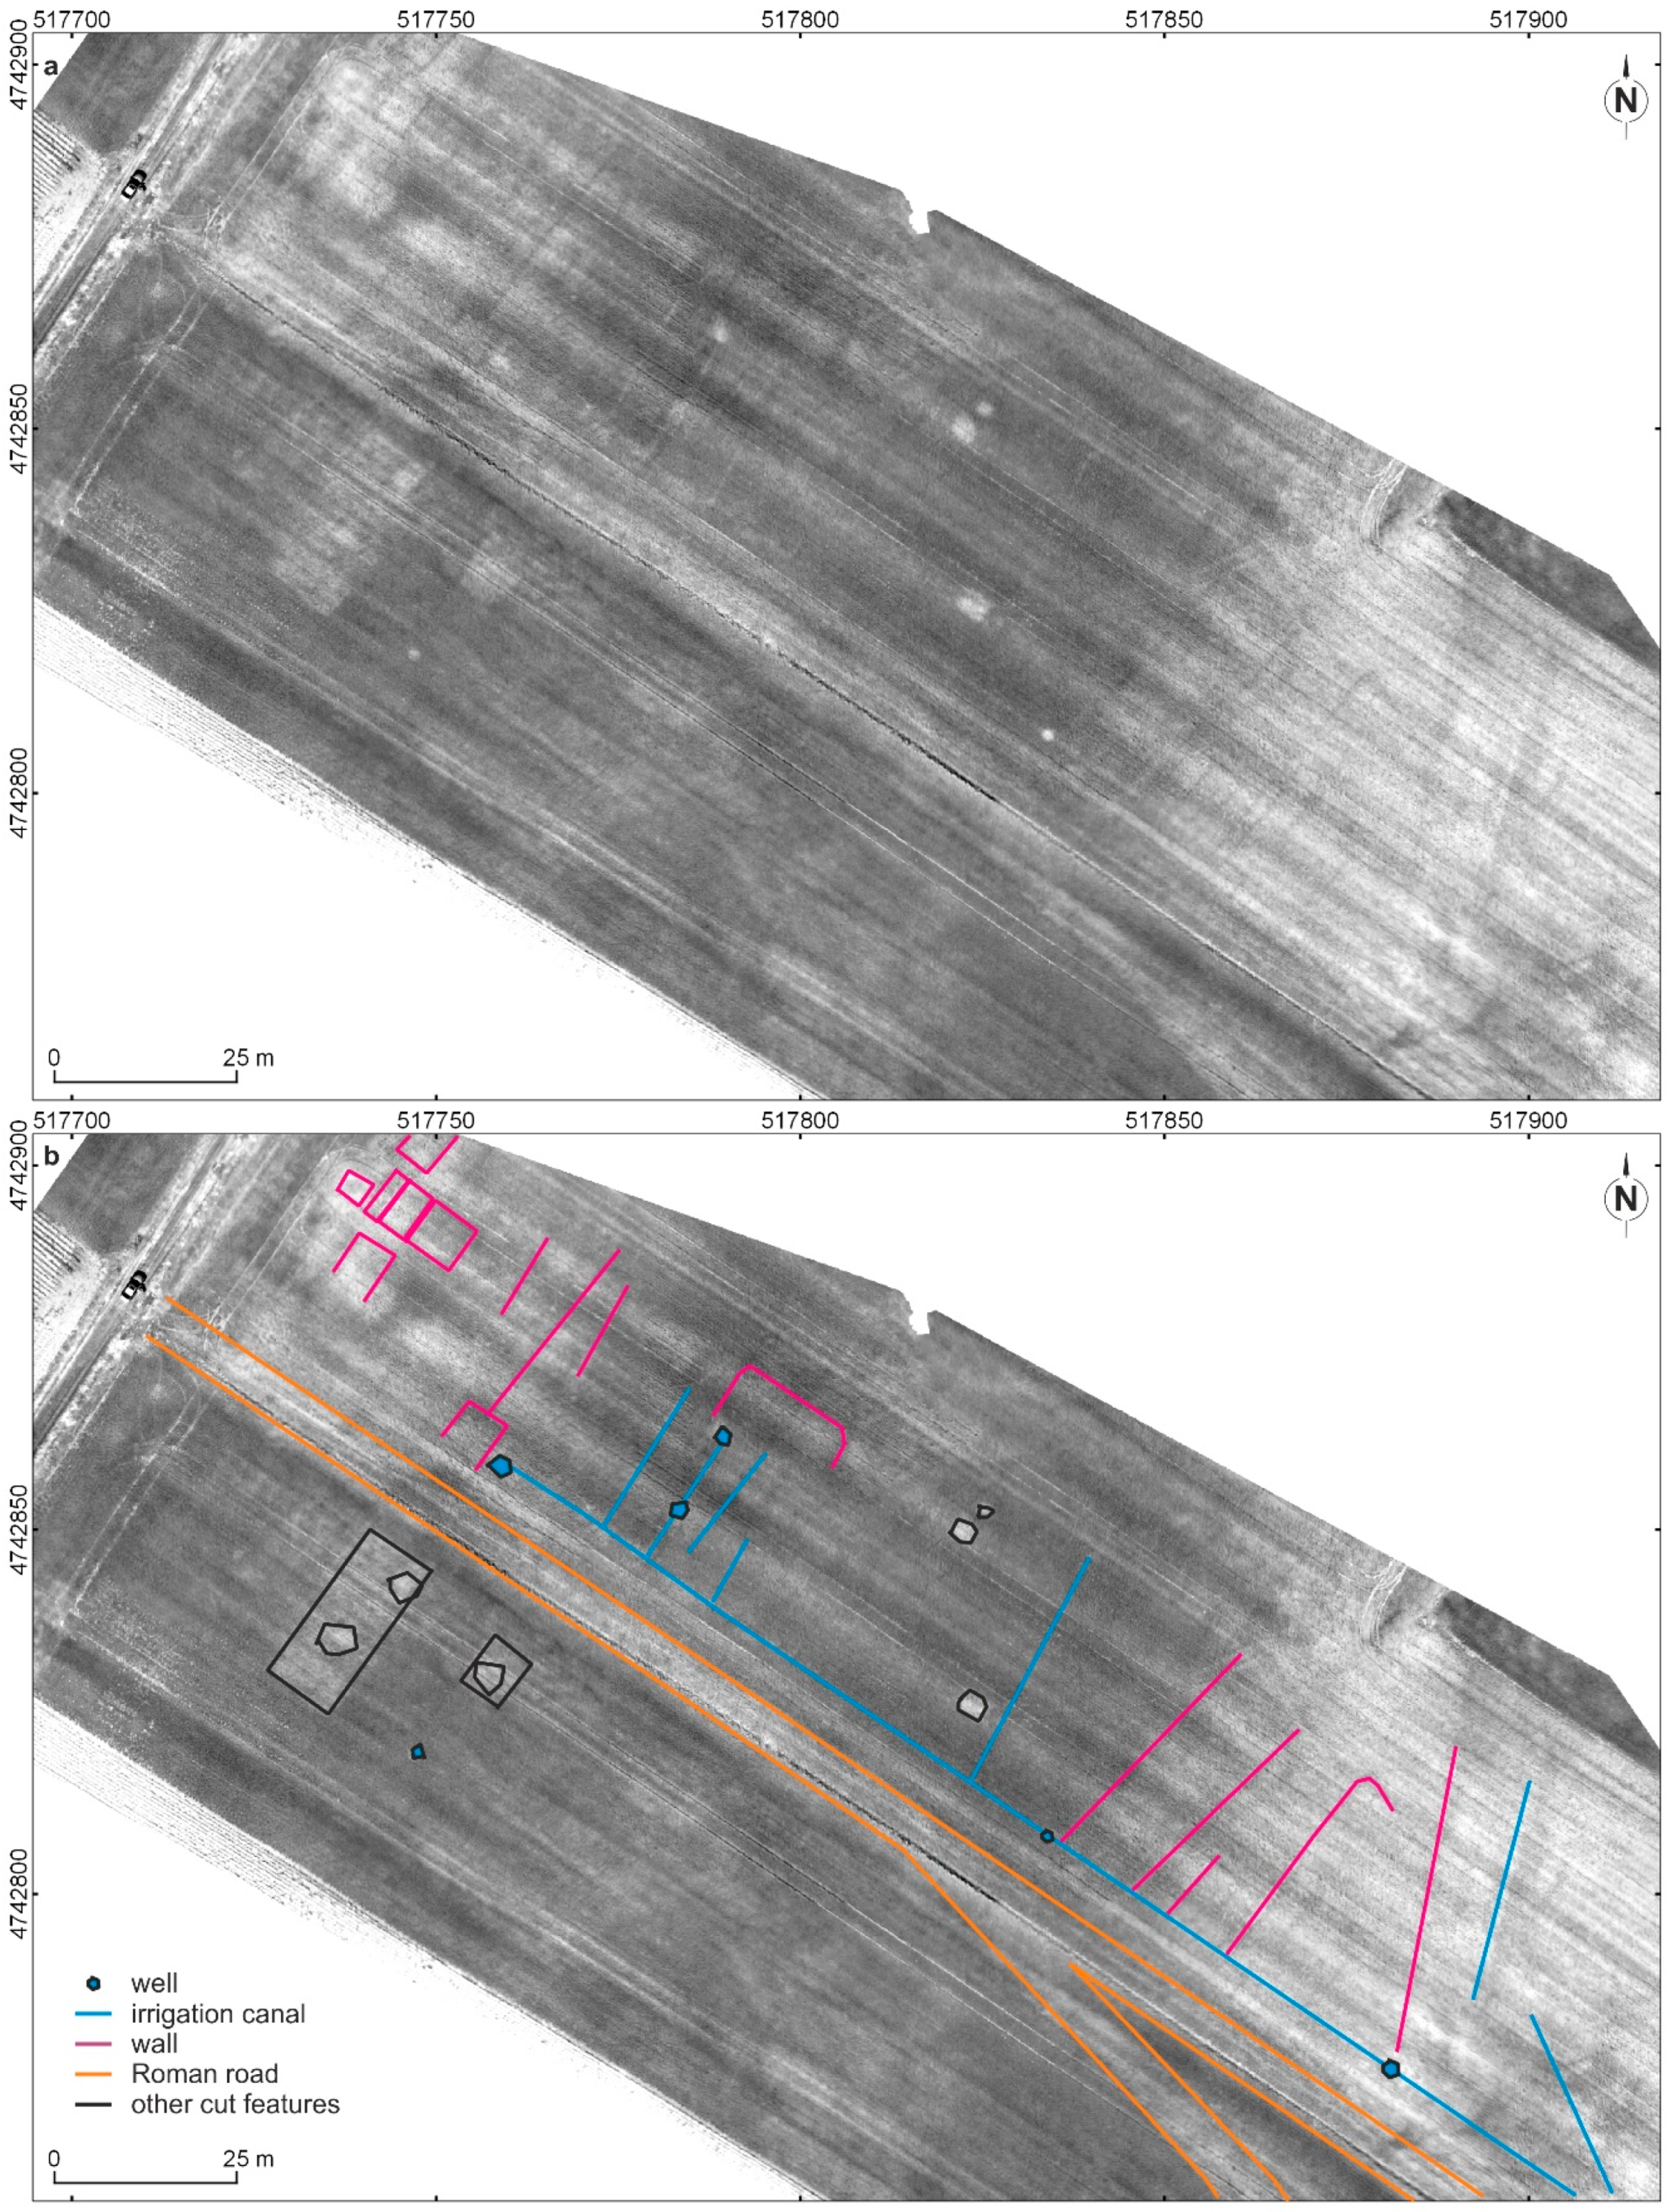
In addition to the Roman road, a considerable number of archaeological features were found in this study. Some of the most interesting cases are described here: Area 3 contained a large number of negative NDVI anomalies which we identified as the walls or foundations of buildings and land divisions (Figure 8). The image shows some circular positive anomalies that may be wells and/or soakaways, as many of these features are connected through a system of narrow and linear positive anomalies we believe to be an irrigation system associated with the nearby Roman city of Iruña-Veleia. Should our interpretation be confirmed archaeologically, this single orthomosaic provides very valuable information regarding field management and irrigation systems in Roman times in the Basque Country.
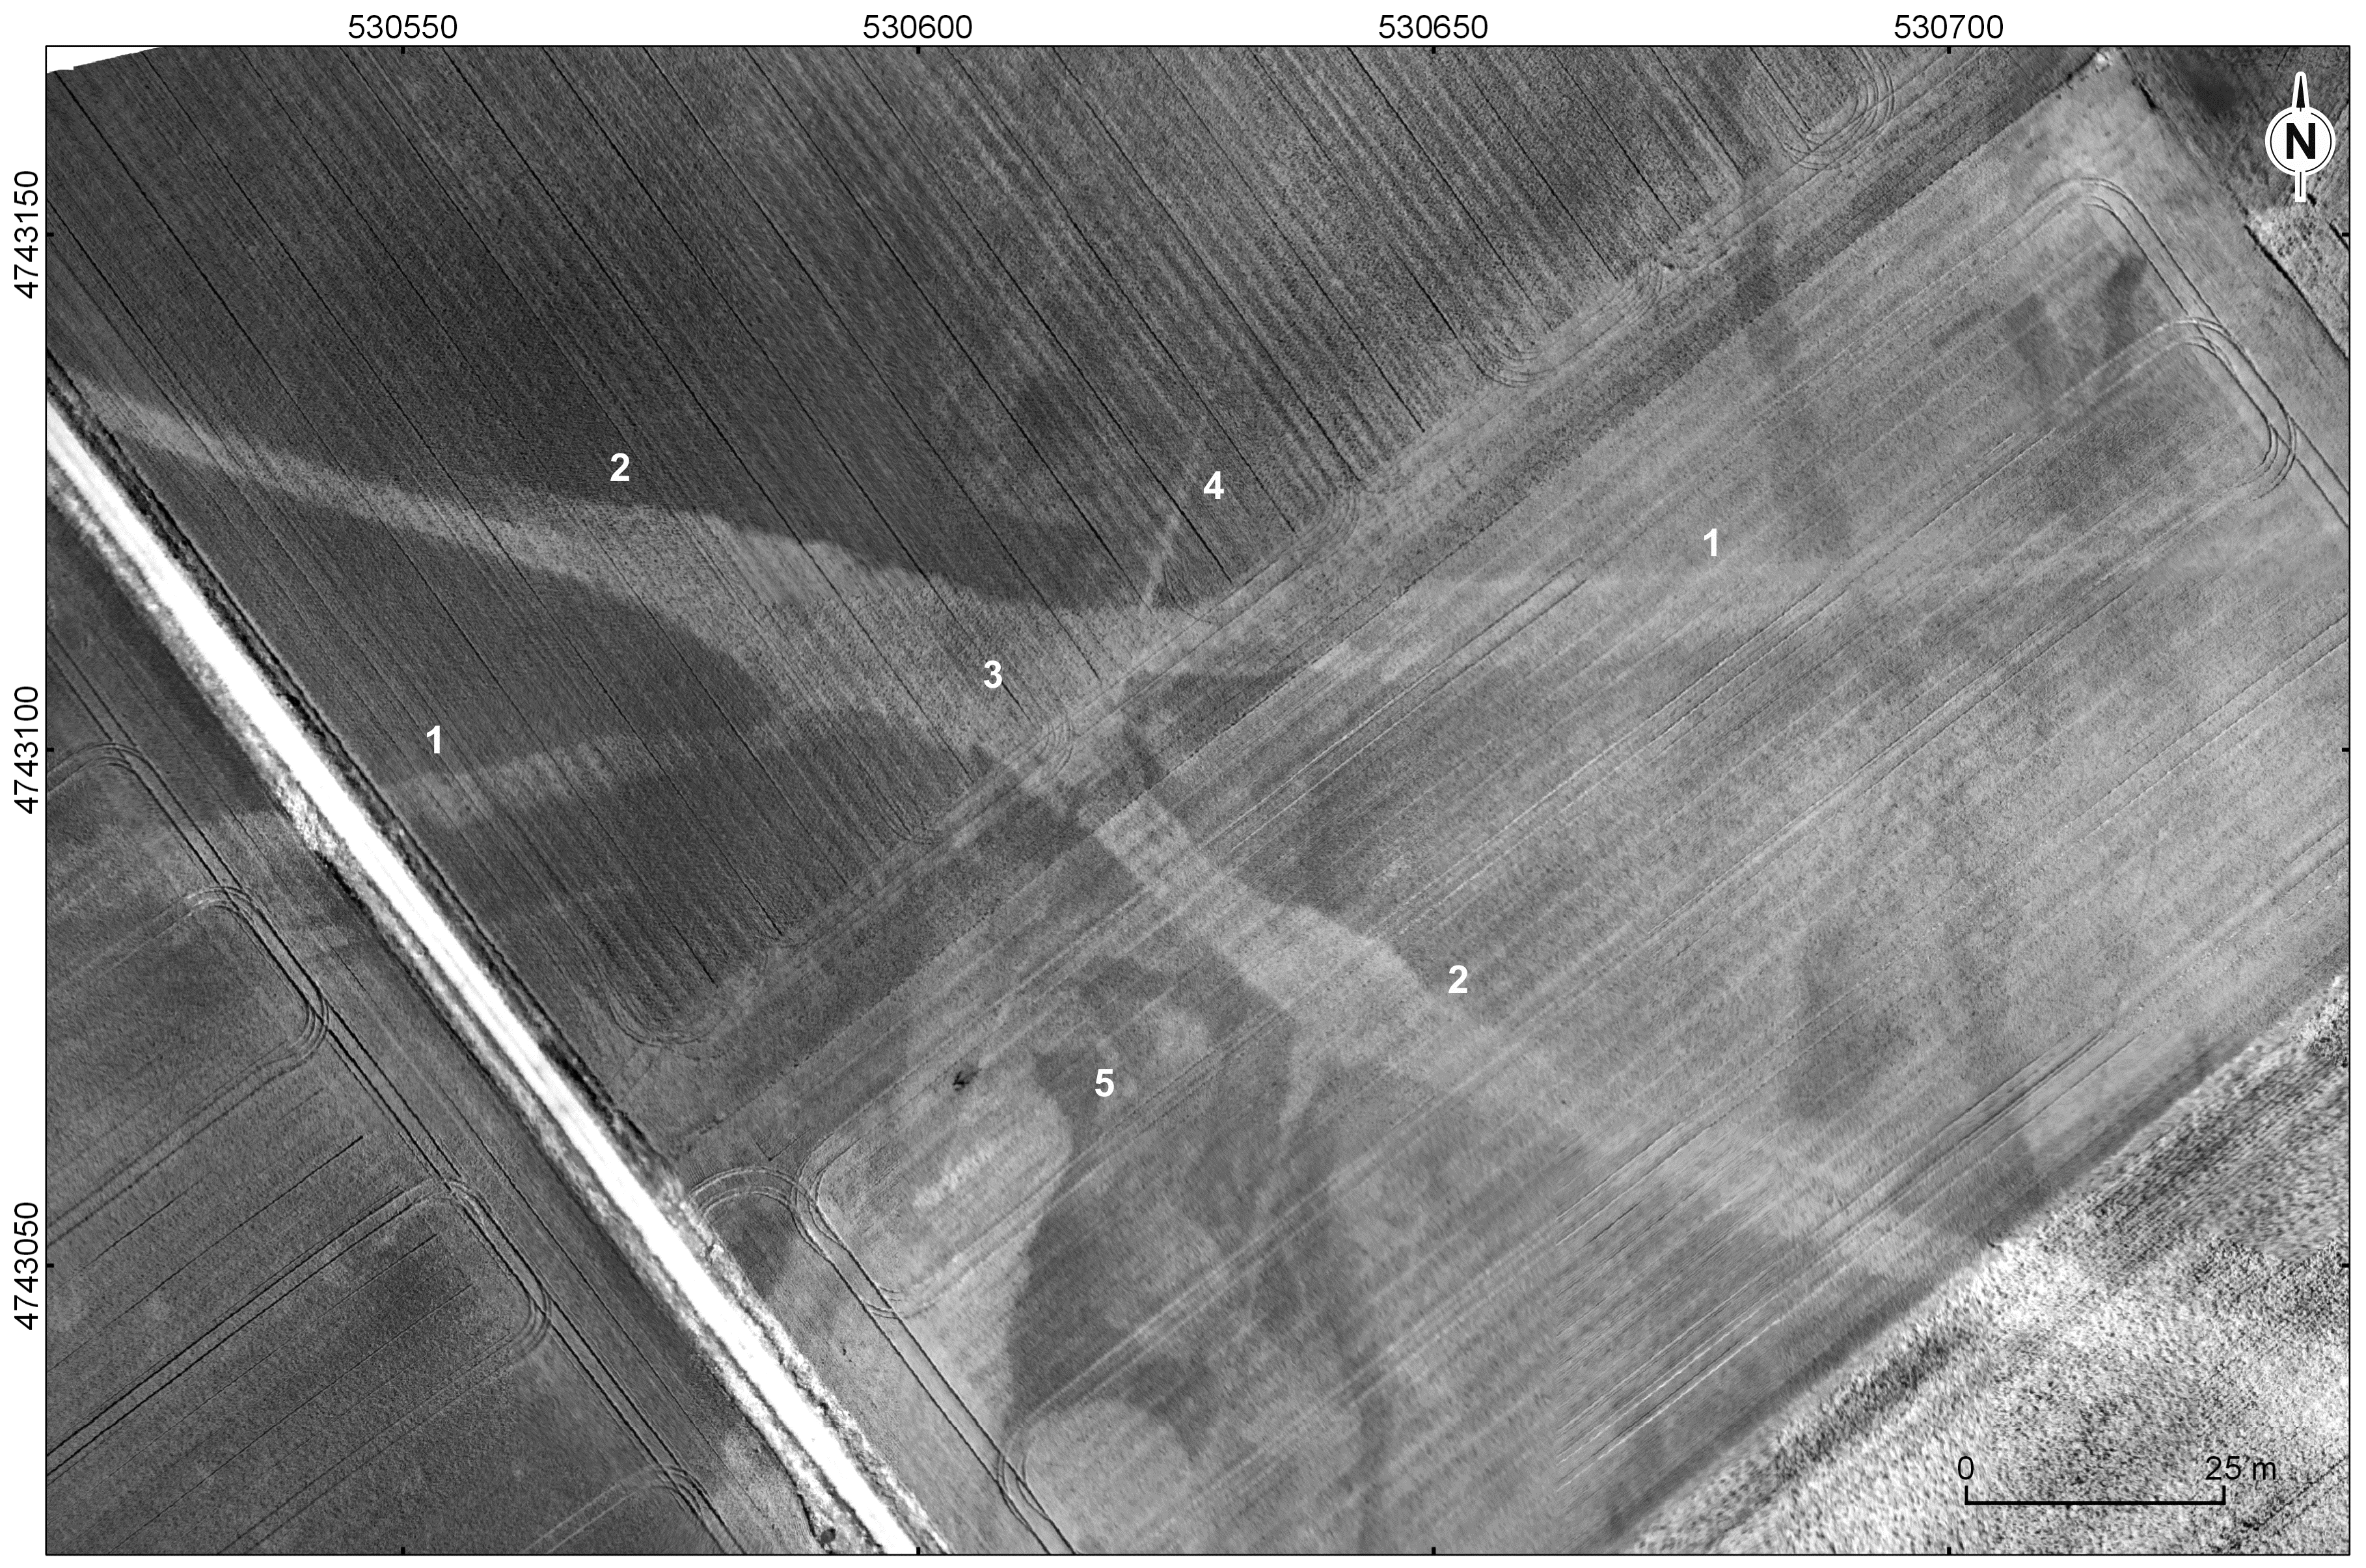
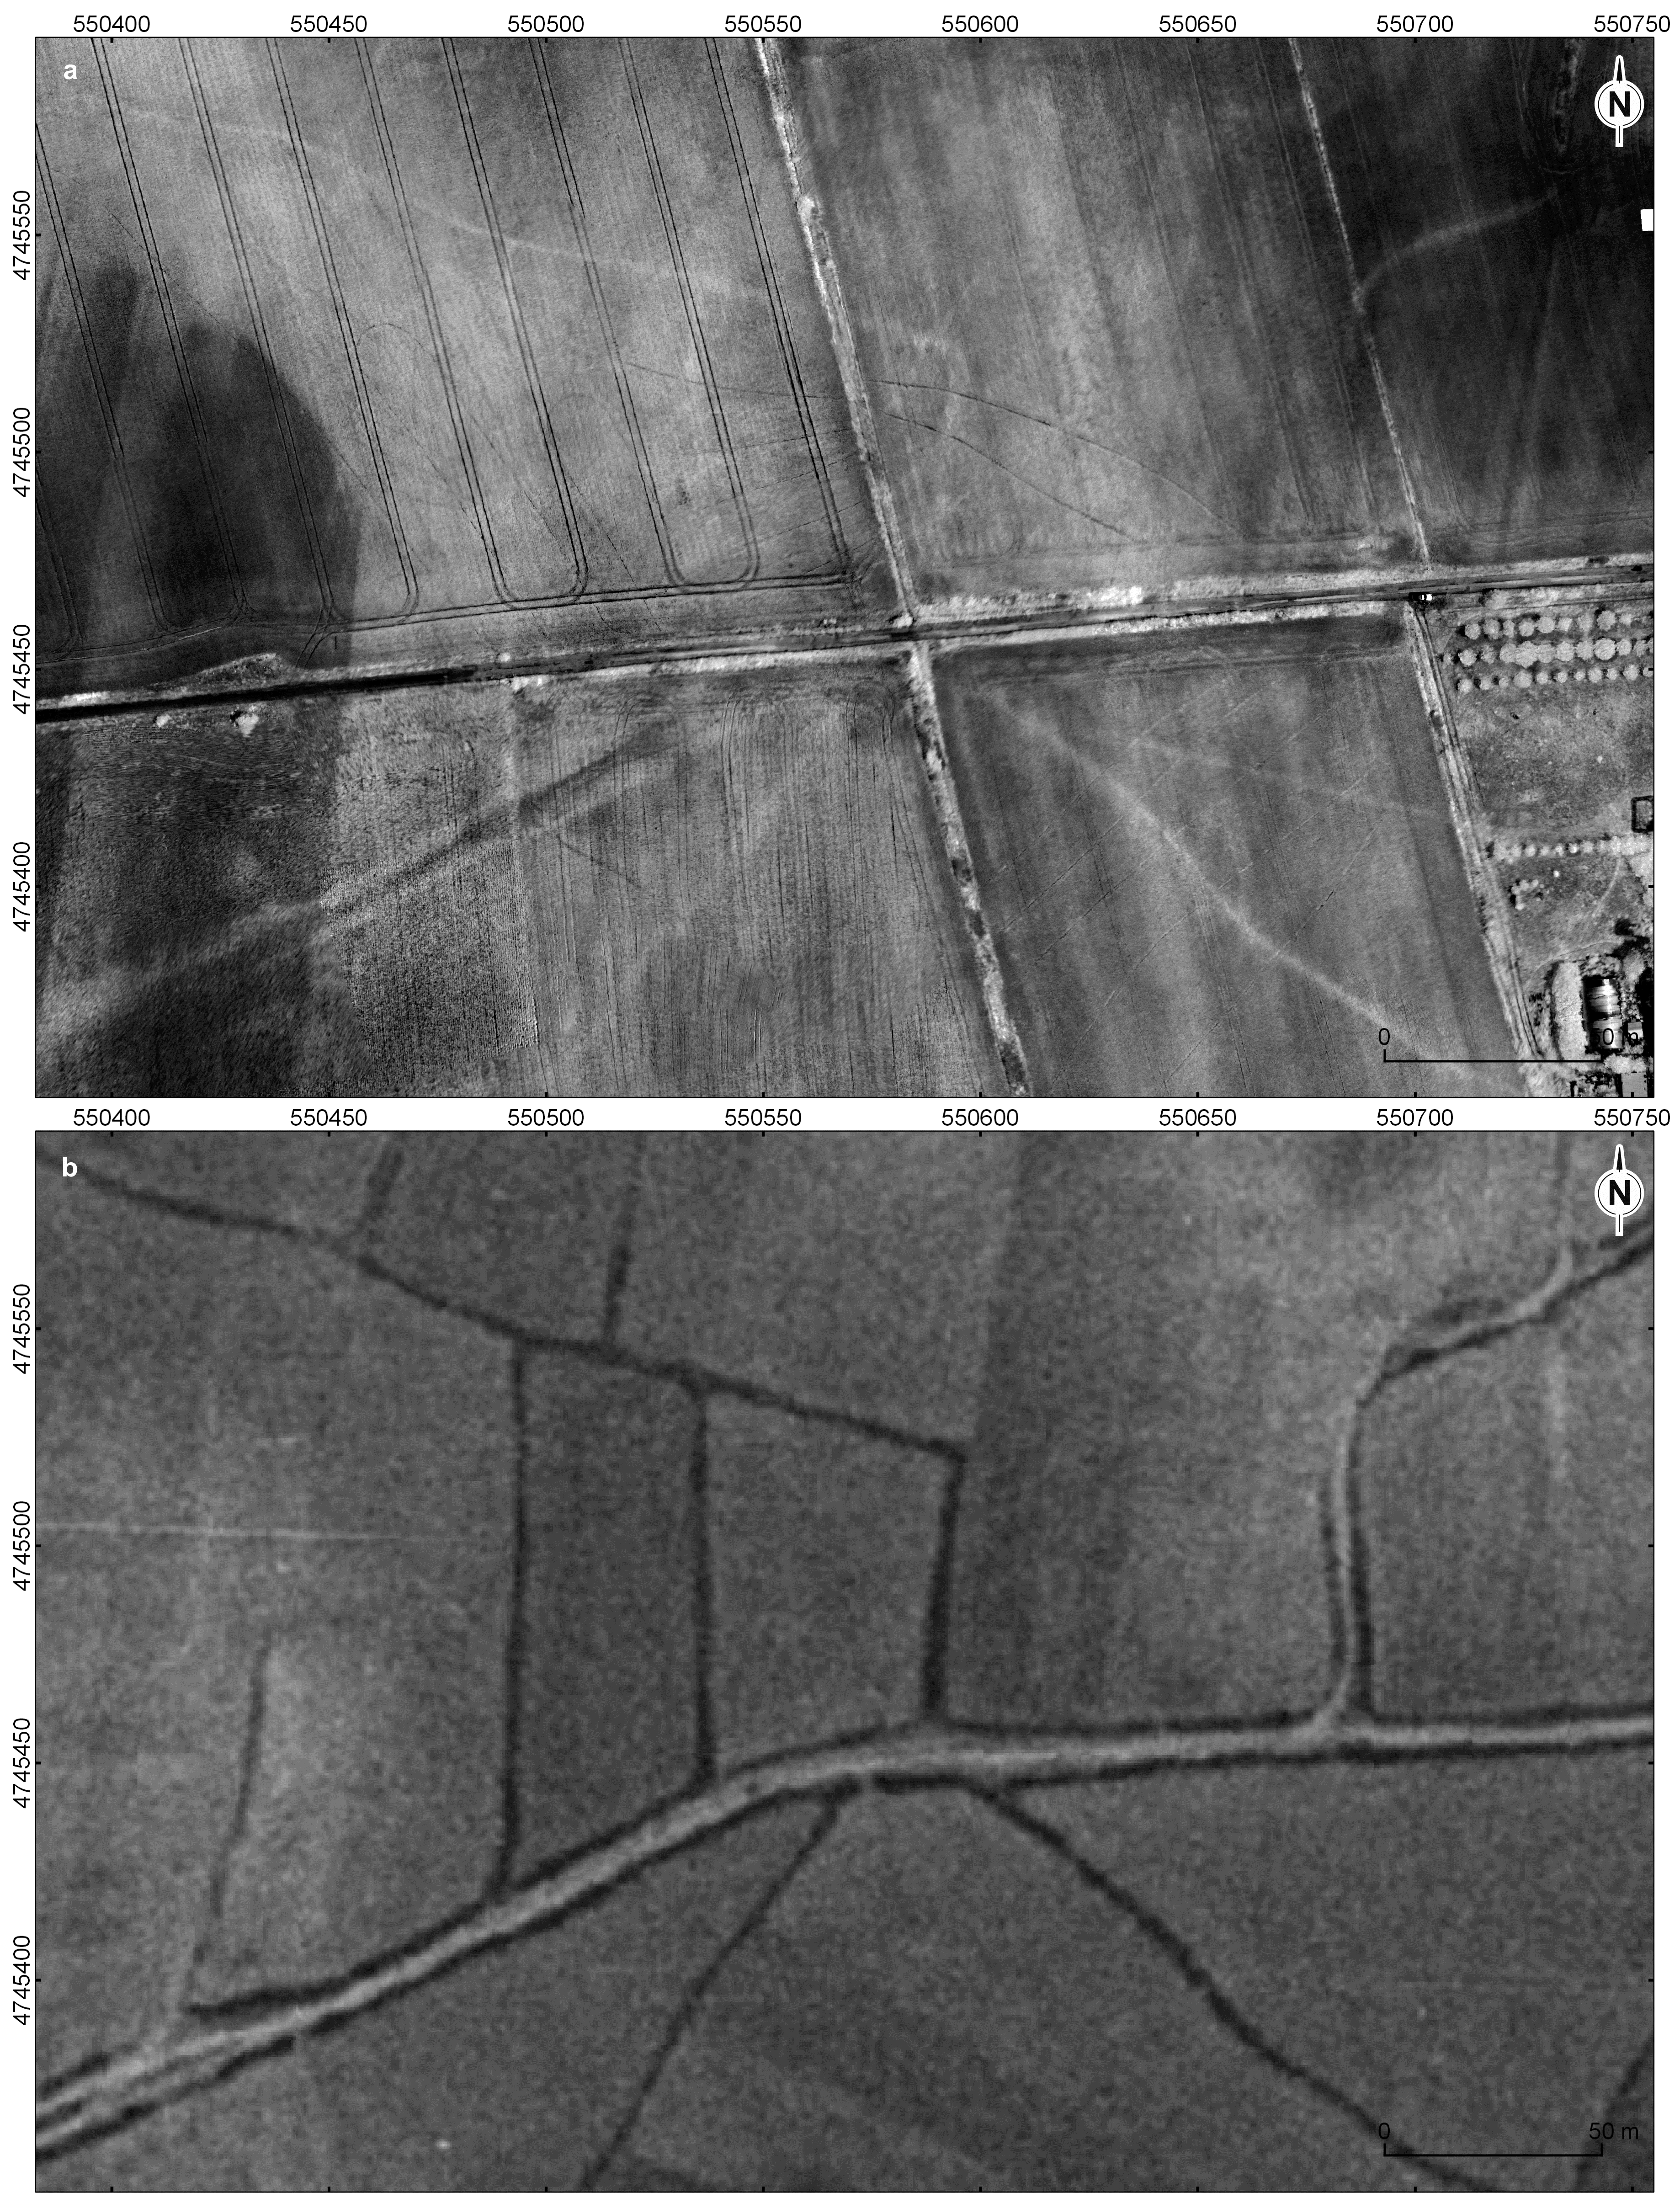
In Area 5, it appears that it is not only the Roman road running from west to east, but also the post-medieval road running northwest to southeast (Figure 9). The remains of an old stream lie near the intersection of these two roads. This stream has now been canalized, and we can clearly identify the modern structure in the image. There is no historical evidence for the existence of a bridge in this location, but the coincidence of the two road crossings at the same location may suggest this was a natural fording point in the stream.
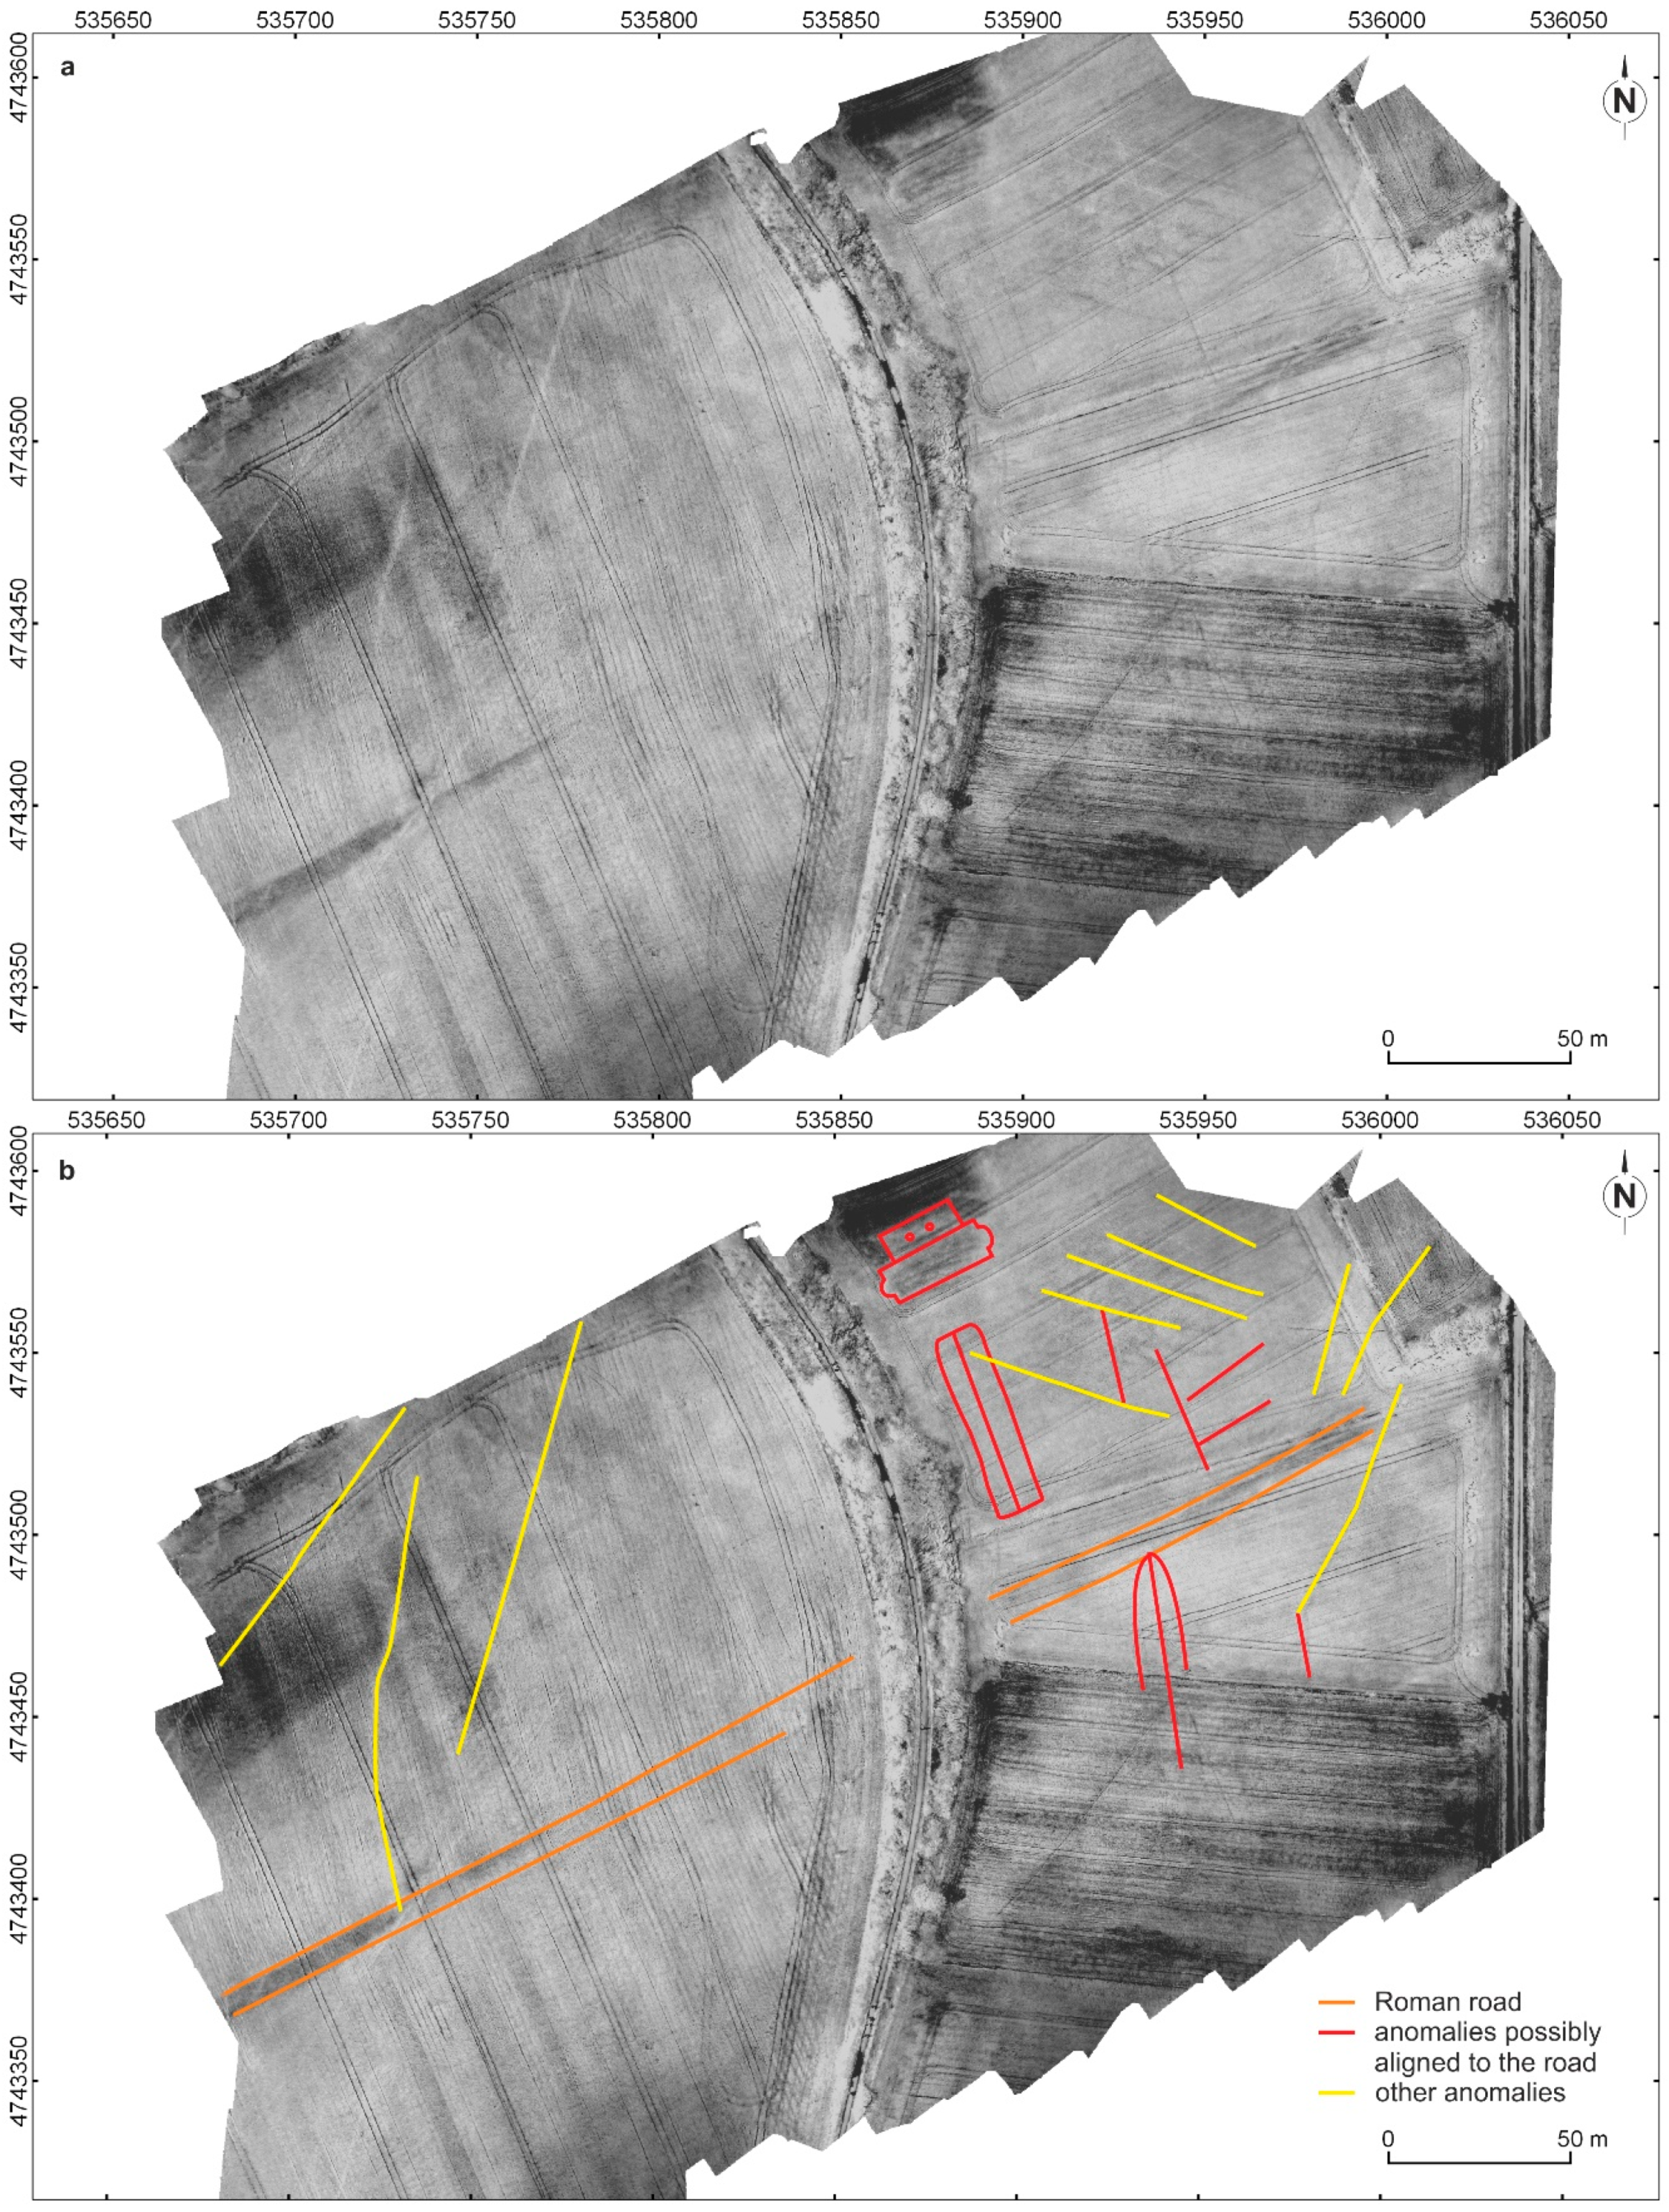
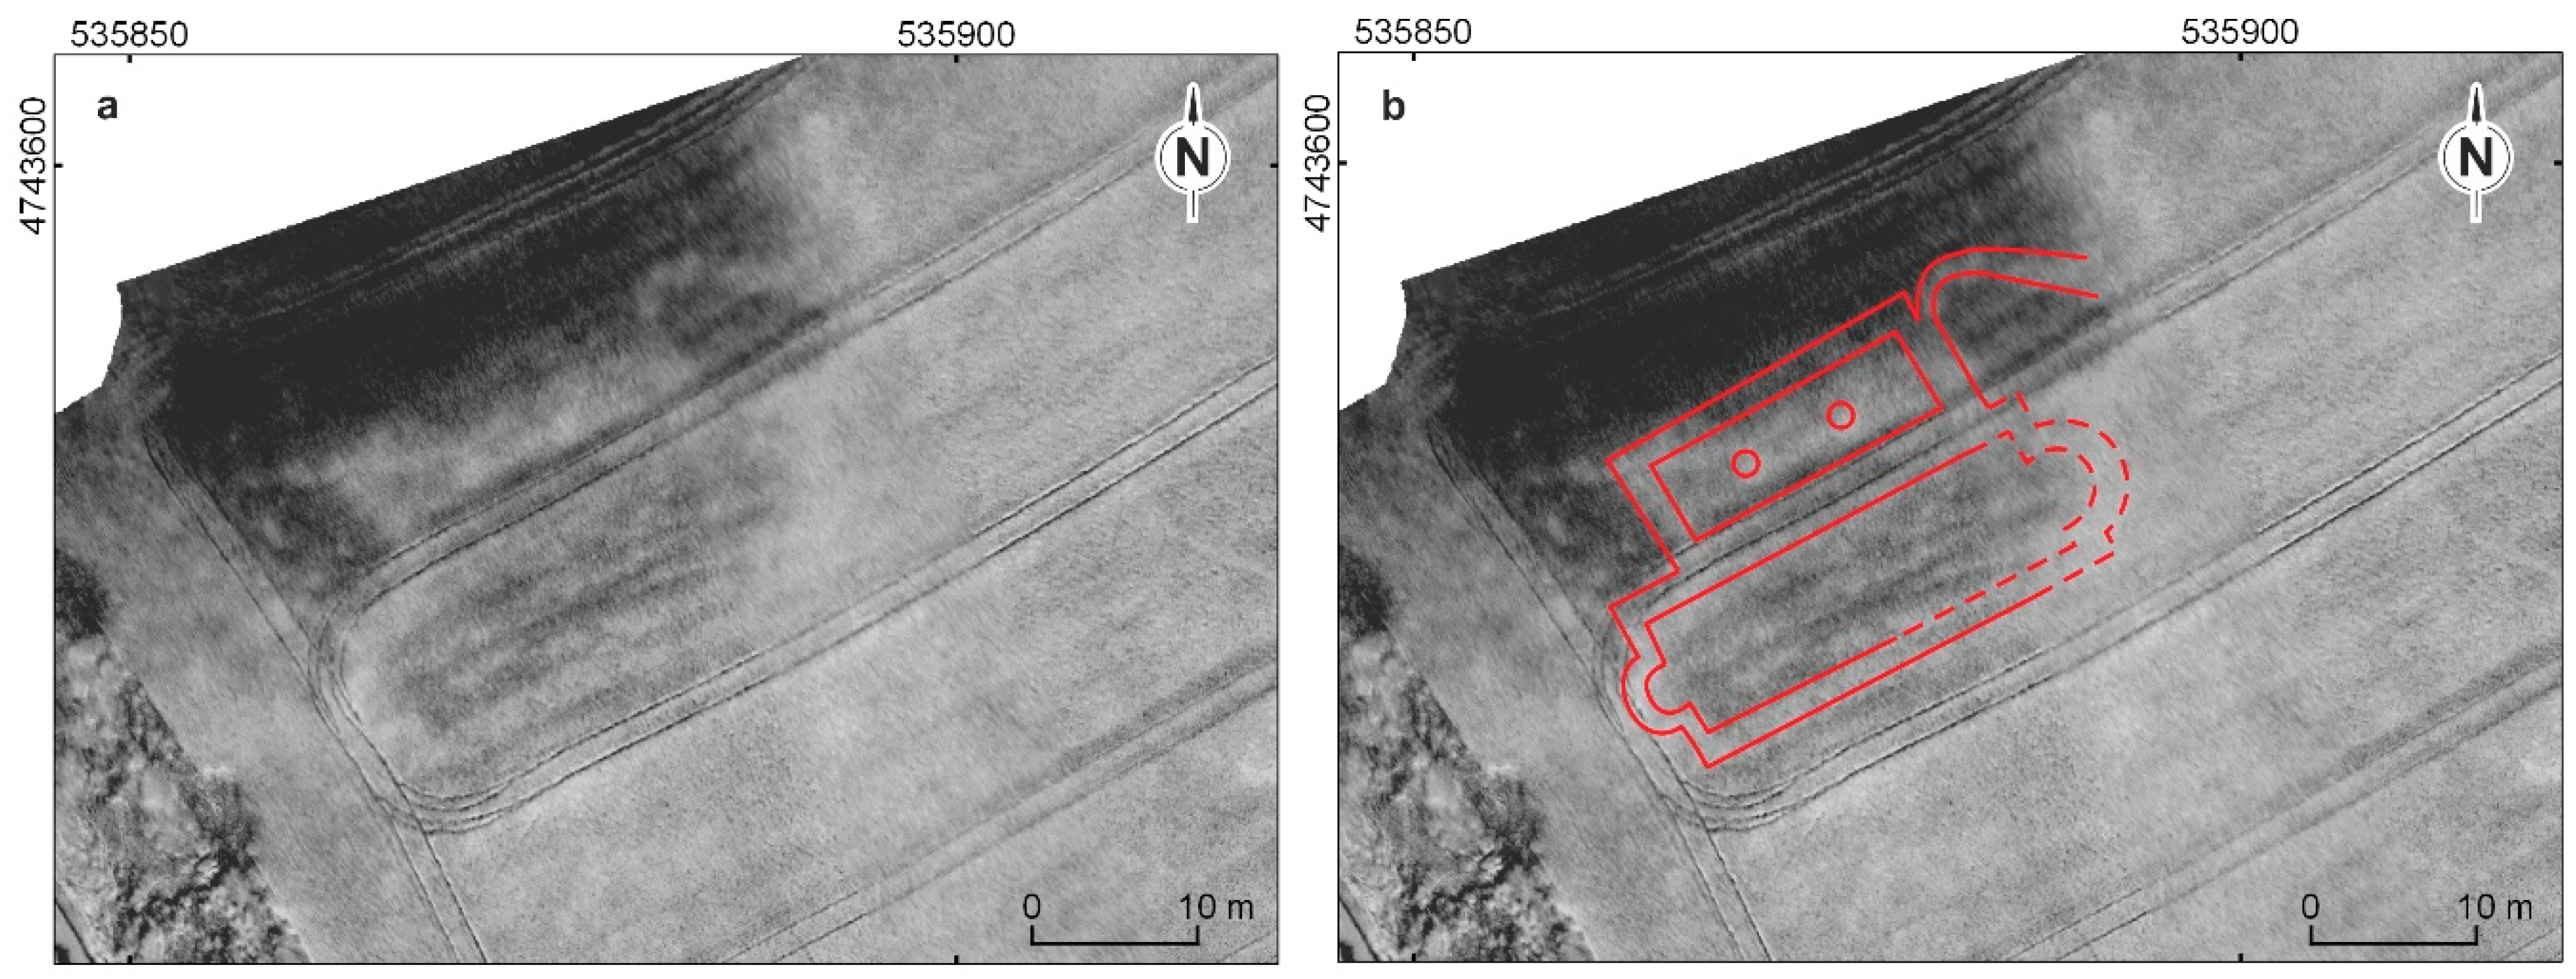
In Area 6 there are many anomalies in addition to the Roman road. These anomalies follow two alignments, perhaps corresponding to two different periods of occupation (Figure 10). Of particular interest is a group of positive anomalies cutting a negative anomaly located in the northern edge of the area which may be interpreted as robber trenches cutting through the walls of a masonry building (Figure 11). All the other anomalies appear to be field boundaries and agricultural related features.
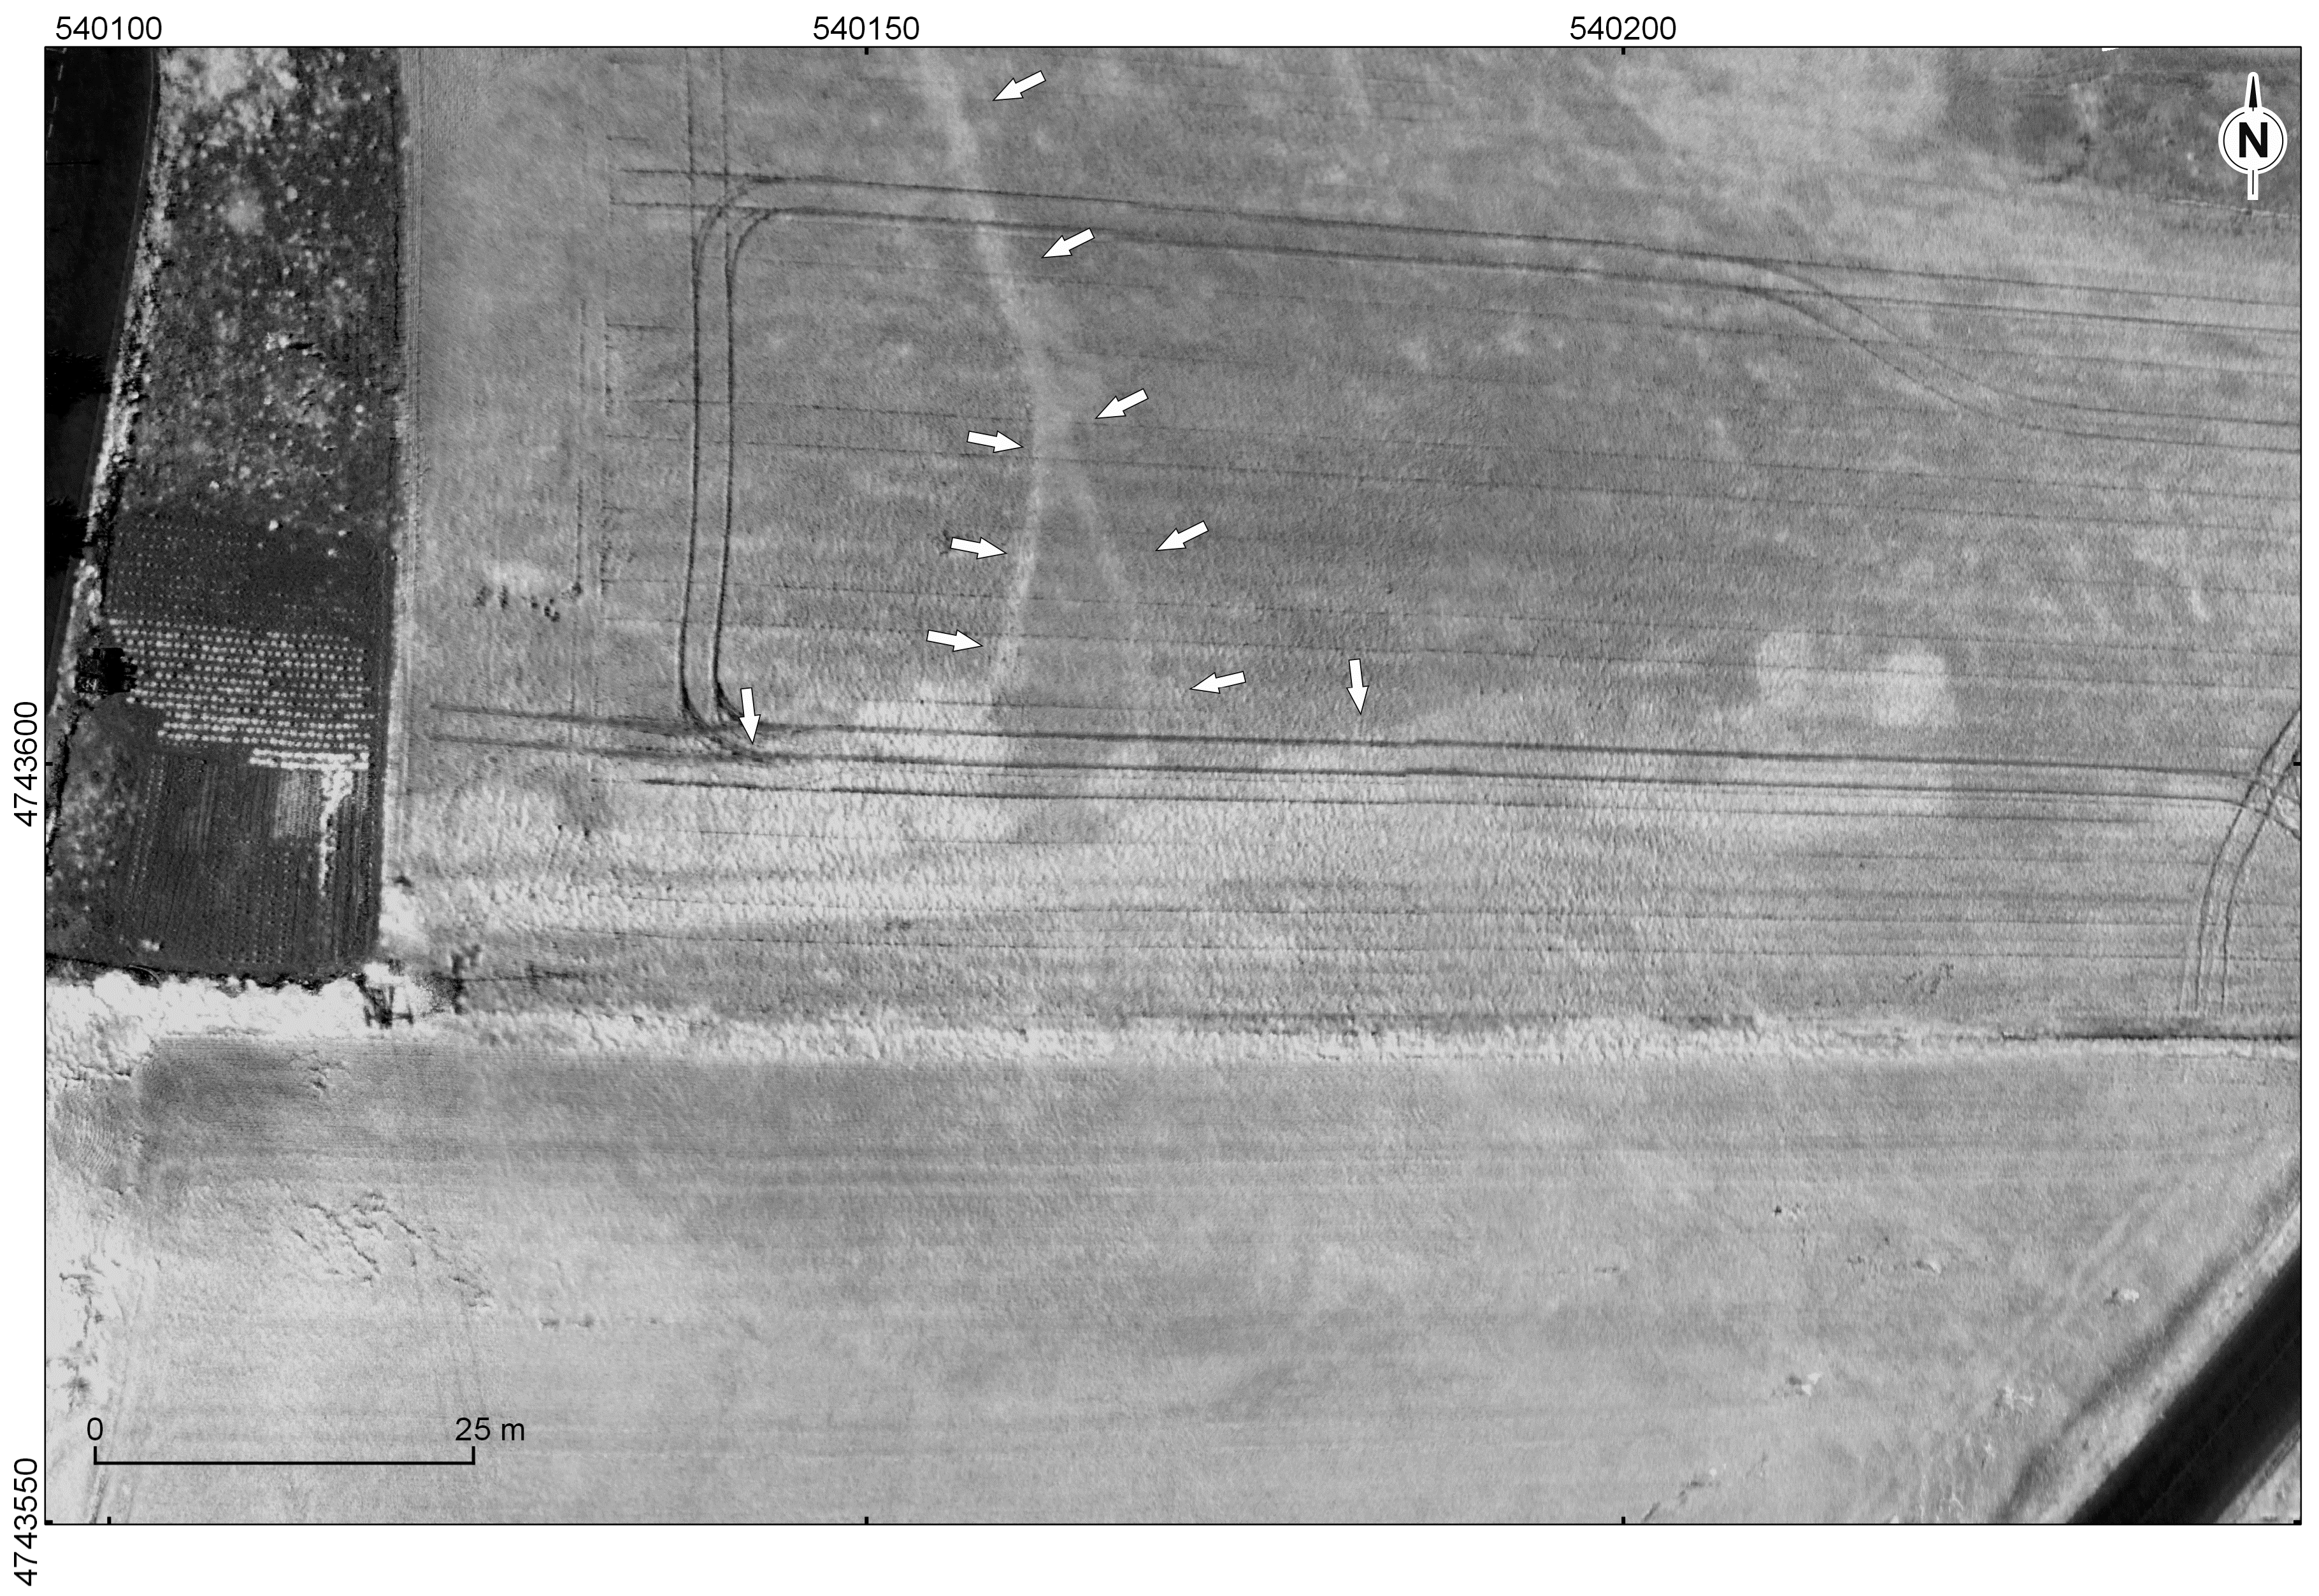
Area 7 is the only zone in the study in which no traces of the Roman road were identified. Most of the features in this area appear to be narrow channels, possibly water channels, each measuring about 80 cm wide, far less than the Roman road identified elsewhere (Figure 12).
In Area 9, in addition to the Roman road, there is a series of field boundaries predating the land enclosure. The boundaries are visible in the 1945 aerial photographs which show the fields before the current boundaries (Figure 13).
5. Discussion
The experiment was very successful and we achieved far more than our primary objectives, so we do not hesitate to rate this method as highly satisfactory. The validity of the method has been demonstrated as far as the exploration of archaeological remains is concerned, and we succeeded in increasing the identified sections of the buried road and believe we can define how a Roman road would appear in NDVI.
Where the course of the road was known in the zones used as controls for the experiment, the anomalies detected by the NDVI correspond fully with the observations made with other methods. This worked particularly well with vertical aerial photography at high altitude and with oblique aerial photography at low level. These correspond to the surrounding mansiones and civitates of Veleia and Suestatio identified in Areas 4 and 5.
Out of the five zones considered as probable locations of the road, four obtained results compatible with the course of Iter 34 and/or other old roads in Areas 2, 3, 9 and 10, with one negative result in Area 1. In the undocumented sites, positive results were recorded in two of the three zones (Areas 6 and 8) and a negative result in Area 7.
The two negative results obtained are due to two different reasons. In the first case, the absence of crops did not provide NDVI information, so the result was as expected. In the second case, this occurred because there were no archaeological remains. From a methodological point of view this was a success because no remains were recorded in a place where it was very unlikely there would be any. In this way we have tested the experiment against false positives (Figure 14).
With regard to the positive results, it is clear that the results were better than expected. If our aim was to determine whether it is possible to identify the course of a Roman road with this method and to improve our knowledge of it, then we have achieved far more than our initial goals. In three areas we identified more remains than just those of the road. In Area 5, in Arkaia, the detected anomalies may be of a geological nature and perhaps also archaeological. These results should be tested with other methods.
In addition to the course of the road, anomalies were observed in the crops in two other areas that are compatible with built structures. To date, these have not been observed with other techniques. Area 3, in Iruña-Veleia, revealed building remains which may be identified as structures associated with the urban or suburban areas of the mansio and civitas of Veleia.
In the case of Zone 6, the possible structural remains found might represent structures associated with the deserted medieval settlement of Garonna/Garaona, documented in 1025 AD and which disappeared during the 13th century [61].
Whilst some of the areas would benefit from further study with flights at lower altitude, and perhaps also with photographs taken in different wavelengths, we have demonstrated that a spatial resolution of 3 cm per pixel in NDVI is enough to identity a buried Roman road, to assess its state of preservation and even to identify masonry walls and ditches measuring merely 0.5 m wide.
In our opinion we should try to identify the appearance of different kinds of archaeological features in different spectral bands and indexes. NDVI index should be a priority due to its wide availability. Our study has contributed the first steps in identifying a Roman road, or indeed any buried historic road.
6. Conclusions
The study has achieved our goals of determining the existence and identification of the Roman road in the study areas and we have also defined how a Roman road appears in NDVI. We have established that flying at a height of 75 m with a spatial resolution of 3 cm per pixel is enough to see a buried Roman road with a minimum width of 2.5 m and furthermore it allows us to identify masonry walls and ditches measuring 0.5 m wide, though that is right at the limit of what we can see in the photographs. The quantity of information we can obtain about ancient landscapes with these techniques is incredible. Being able to use inexpensive and efficient modern landscape management tools to see and analyze ancient landscapes will revolutionize landscape archaeology.
It is evident that NDVI studies made for agricultural purposes may contain large amounts of archaeologically useful data, and we must learn to take advantage of this widely available resource.
We believe we have shown that gambling on this method has helped us solve a very complex problem in the Heritage of Álava which has led to the legal protection of the parts of the Roman road that were unknown until this experiment. Furthermore, we have demonstrated beyond doubt that this tool offers very high potential for both extensive and intensive archaeological research, obtaining significant results in a fast, efficient and non-invasive way. This is a novel method utilizing state-of-the-art technology that can easily be applied to any grassland or cereal crops areas.
Supplementary Materials
The lecture read at CAA UK 2018 “The application of precision agricultural techniques to archaeological survey, The NDVI index applied to the study of the Iter XXXIV Roman road in the province of Álava (Spain)” which forms the basis of this article is available online at: https://goo.gl/aZN432.
Author Contributions
F.R.V.H. is responsible for the study project of the Roman road and carried out the historical research and archaeological investigations; he authored the parts of this article concerning the project and historic background and the study area. J.J.F.G. conceptualized and carried out the NDVI survey with UAVs; he authored the parts of this article concerning remote sensing, NDVI methodology and results analysis. The discussion and conclusions were written by both authors.
Funding
This research was funded by The Basque Language, Culture and Sports Department of the Basque Government. BOPV nº 245 30/11/2016, orden 5553, 002-KOI-2016.
Acknowledgments
The authors wish to thank José Ignacio Fuldain González (Full Drone) for carrying out the drone flights of the areas studied for this article, and J.A Quiros Castillo for his academic support. We are grateful to Antonietta Lerz for translating this paper from the original Spanish.
Conflicts of Interest
The authors declare no conflict of interest.
References
- Verhoeven, G. Are We There Yet? A Review and Assessment of Archaeological Passive Airborne Optical Imaging Approaches in the Light of Landscape Archaeology. Geosciences 2017, 7, 86. [Google Scholar] [CrossRef]
- Verhoeven, G. Multispectral and Hyperspectral Imaging; The Encyclopedia of Archaeological Sciences; John Wiley & Sons, Inc.: Hoboken, NJ, USA, 2018; pp. 1–4. [Google Scholar] [CrossRef]
- Agapiou, A.; Alexakis, D.D.; Hadjimitisis, D.G. Spectral Sensitivity of ALOS, ASTER, IKONOS, LANDSAT and SPOT Satellite Imagery Intended for the Detection of Archaeological Crop Marks. Int. J. Dig. Eartha 2014, 7, 351–372. [Google Scholar] [CrossRef]
- Agapiou, A.; Hadjimitsis, D.G.; Alexakis, D.D.; Papadavid, G. Examining the Phenological Cycle of Barley (Hordeum vulgare) Using Satellite and in situ Spectroradiometer Measurements for the Detection of Buried Archaeological Remains. GISci. Remote Sens. 2012, 49. [Google Scholar] [CrossRef]
- Rejas, J.G.; Burillo, F. Teledetección Aplicada a la Arqueología; Mínguez, M.d.C., Capdevilla, E., Eds.; Manual de Tecnologías de la Información Geográfica aplicadas a la Arqueología; Comunidad de Madrid, Museo Arqueológico Regional, Ilustre Colegio Oficial de Licenciados en Filosofía y Letras y en Ciencias de la Comunidad de Madrid: Madrid, Spain, 2016; pp. 241–270. [Google Scholar]
- Gupta, E.; Das, S.; Rajani, M. Archaeological Exploration in Srirangapatna and Its Environ Through Remote Sensing Analysis. J. Indian Soc. Remonte Sens. 2017, 46. [Google Scholar] [CrossRef]
- Lasaponara, R.; Masini, N. Identification of Archaeological Buried Remains Based on the Normalized Difference Vegetation Index (NDVI) from QuickBird Satellite Data. Geosi. Remote Sens. Lett. 2006, 3, 325–328. [Google Scholar] [CrossRef]
- Angás, J.; Uribe, P.; Bea, M. Método y Técnica de Aplicación de Sistemas Drones o RPAS en la Investigación Arqueológica; Lorenzo, J.I., Rodanés, J.M., Eds.; I Congreso CAPA Arqueología Patrimonio Aragonés; Colegio Oficial de Doctores y Licenciados en Filosofía y Letras y en Ciencias de Aragón: Zaragoza, Spain, 2016; pp. 540–549. [Google Scholar]
- Cowley, D.; Moriarty, C.; Geddes, G.; Brown, G.; Wade, T.; Nichol, C. UAVs in Context: Archaeological Airborne Recording in a National Body of Survey and Record. Drones 2017, 2, 2. [Google Scholar] [CrossRef]
- Verhoeven, G.; Loenders, J.; Vermuelen, F.; Docter, R. HelikiteAerial Photography—A Versatile Means of Unmanned, Radio Controlled, Low-Altitude Aerial Archaeology. Archaeol. Prospect. 2009. [Google Scholar] [CrossRef]
- Crespo, Á.; Díaz, M.Á.; Farjas, M.; Martínez Pardo, G.; Alfonso, E.; Ruíz, C. Aplicación de Nuevas Tecnologías al Estudio de Posiciones de la Guerra Civil Española en Pinto (Madrid). Revis. Otarq 2016, 1, 301–310. [Google Scholar]
- Mayoral, V. (Ed.) La Revalorización de Zonas Arqueológicas Mediante el Empleo de Técnicas no Destructivas; Anejo de Archivo Español de Arqueología; CSIC: Mérida, Spain, 2016; Volume LXXV.19. [Google Scholar]
- Verhoeven, G.; Sevara, C.; Karel, W.; Ressl, C.; Doneus, M.; Briese, C. Undistorting the Past: New Techniques for Orthorectifi catión of Archaeological Aerial Frame Imagery; Corsi, C., Ed.; Good Practice in Archaeological Diagnostics. Natural Science in Archaeology; Springer International Publishing: Cham, Switzerland, 2013. [Google Scholar] [CrossRef]
- Verhoeven, G. Imaging the Invisible Using Modified Still Cameras for Straightforward and Low-Cost Archaeological Near-infrared Photography. J. Archaeol. Sci. 2008, 35, 3087–3100. [Google Scholar] [CrossRef]
- Verhoeven, G. Near-Infrared Aerial Crop Mark Archaeology: From its Historical Use to Current Digital Implementations. J. Archaeol Method Theory 2012, 19, 132–160. [Google Scholar] [CrossRef]
- Verhoeven, G.; Smet, P.F.; Poelman, D.; Vermeulen, F. Spectral Caracterization of a Digital Still Camera´s NIR Modification to Enhance Archaeological Observation. Trans. Geosci. Remote Sens. 2009, 47, 3456–3468. [Google Scholar] [CrossRef]
- Sukor, S.; Ahmad, A. Evaluation of Low Cost Digital Cameras for Producing Photogrammetric Output from UAV. Int. J. Eng. Technol. 2018, 7, 792. [Google Scholar] [CrossRef]
- Usmanov, B.; Nicu, I.C.; Gainullin, I.; Khomyakov, P. Monitoring and Assessing the Destruction of Archaeological Sites from kuibyshev Reservoir Coastline, Tatarstan Republic, Russian Federation. A Case Study. J. Coast. Conserv. 2018, 22, 417–429. [Google Scholar] [CrossRef]
- Cao, S.; Danielson, B.; Clare, S.; Koenig, S.; Campos-Vargas, C.; Sanchez-Azofeifa, A. Radiometric Calibration Assessments for UAS-Borne Multispectral Cameras: Laboratory and Fiel Protocols. J. Photogram. Remote Sens. 2019, 149, 132–145. [Google Scholar] [CrossRef]
- García, M. Las Pozas (Casaseca de las Chanas, Zamora): Dos Nuevos Recintos de Fosos Calcolíticos en el Valle del Duero. Trabajos de Prehistoria 2013, 70–71, 175–184. [Google Scholar] [CrossRef]
- Garzonio, R.; Di Mauro, B.; Colombo, R.; Cogliati, S. Surface Reflectance and Sun-Induced Fluorescence Spectroscopy Measurements Using a Small Hiperspectral UAS. Remote Sens. 2017, 9, 472. [Google Scholar] [CrossRef]
- Gregorio Rejas, J.; Farjas, M. Exploración Multisensor para la Detección de Anomalías del Terreno y Análisis Espectral en y Bajo Superficie. Revis. Cienc. Espaciales 2017, 10, 5–21. [Google Scholar] [CrossRef]
- Grady, D. Aerial Reconnaissance; Management of Research Project in the Historic Environment: PPN 5; Historic England: Swindon, UK, 2008.
- Webber, H.; Heyd, V.; Horton, M.; Bell, M.; Matthews, W.; Chadburn, A. Precision Farming and Archaeology. Archaeol. Anthropol. Sci. 2017, 11, 727–734. [Google Scholar] [CrossRef]
- Uribe, P.; Angás, J.; Pérez-Cabello, F.; Vicente, J.; Ezquerra, B. The Potential of Drones and Sensors to Enhance Detection of Archaeological Cropmark: A Comparative Study Between Multi-Spectral and Thermal Imagery. Drones 2018, 2, 29. [Google Scholar] [CrossRef]
- Uribe, P.; Angas, J.; Pérez-Cabello, F.; de la Riva, J.; Bea, M.; Serreta, A.; Magallón, M.A.; Sáenz, C.; Martín-Bueno, M. Aerial Mapping and Multi-Sensors Approaches from Remote Sensing Applied to the Roman Archaeological Heritage. Int. Arch. Photogramm. Remote Sens. Spat. Inf. Sci. 2015, XL-5W4, 461–467. [Google Scholar] [CrossRef]
- Lerma, J.L.; Askasheh, T.; Haddad, N.; Cabrelles, M. Multispectral Sensors in Combination with Recording Tools for Cultural Heritage Documentation. Chang. Over Time 2011, 1, 236–250. [Google Scholar] [CrossRef]
- Bennet, R.; Welham, K.; Hill, R.A.; Ford, A. The Application of Vegetation Indices for the Prospection of Archaeological Features in Grass-dominated Environments. Archaeol. Prospect. 2012, 19, 209–218. [Google Scholar] [CrossRef]
- Moreno, I. Vías Romanas en Castilla y León. Available online: http://www.viasromanas.net/ (accessed on 13 February 2019).
- González de Echávarri, V. Alaveses Ilustres, Vol. I.; Imprenta Provincial: Vitoria, Spain, 1900. [Google Scholar]
- De Miguel, A.R. Las Comunicaciones de Época Romana en Álava, Navarra y La Rioja. Trabajos de Arqueología Navarra 1991, 10, 337–363. [Google Scholar]
- Fatás Cabeza, G. Tabula Imperii Romani. Hoja K–30, Madrid, Caesaraugusta, Clunia; Instituto Geográfico Nacional: Madrid, Spain, 1993.
- Roldán, J.M.; Caballero, C. Itineraria Hispana. Estudio de las Vías Romanas en Hispania a partir del Itinerario de Antonino, el Anónimo de Ravena y los Vasos de Vicarello. El Nuevo Miliario 2014, 17, 10–253. [Google Scholar]
- Magallón, M.A. La Red Viaria Romana en el País Vasco. Isturitz 1997, 8, 207–231. [Google Scholar]
- Gil, E.; Filloy, I. La Romanización en Álava; Diputación Foral de Álava: Vitoria–Gasteiz, Spain, 2000.
- García González, J.J. La Cuenca de Miranda de Ebro en la Transición de la Antigüedad a la Edad Media. In Miranda de Ebro en la Edad Media; Peña, F.J., Ed.; Ayuntamiento de Miranda de Ebro: Miranda de Ebro, Spain, 2002; pp. 29–126. [Google Scholar]
- Sáenz de Buruaga, A. Observaciones en Torno al Trazado de la Vía Astorga–Burdeos por Álava a Partir de los Monumentos Epigráficos. Estudios de Arqueología Alavesa 2006, 23, 101–126. [Google Scholar]
- Abásolo, J.A. El Conocimiento de las Vías Romanas. Un Problema Arqueológico. In Simposio Sobre la red viaria en la Hispania Romana; Institución Fernando el Católico: Zaragoza, Spain, 1990; pp. 7–20. [Google Scholar]
- Varón Hernández, F.R. Arce–Mirapérez Visto desde el Aire. Una Nueva Ciudad Romana en Miranda de Ebro (Burgos). Estud. Mirandeses 2008, 28–A, 5–41. [Google Scholar]
- Varón Hernández, F.R. Avance de las Excavaciones Arqueológicas de 2010 en Arce–Mirapérez/Deobriga: El Fin del Mundo Indígena. In Simposio sobre Celtíberos. Nuevos Hallazgos, Nuevas Interpretaciones; Burillo, F., Chorda, M., Eds.; Centro de Estudios Celtibéricos de Segeda: Teruel, Spain, 2014; Volume VII, pp. 475–483. [Google Scholar]
- Diputación Foral de Álava. Plan Director de Iruña–Veleia 2010–2020. Available online: https://goo.gl/zFsktn (accessed on 13 February 2019).
- Núñez, J. Informe de las Intervenciones Realizadas en el Yacimiento Arqueológico de Iruña/Veleia (Iruña de Oca, Álava). Campaña 2010. Available online: https://goo.gl/ck6Db6 (accessed on 13 February 2019).
- Núñez, J. Informe Preliminar de las Intervenciones Realizadas en el Yacimiento de Iruña–Veleia (Iruña de Oca, Álava). Campaña 2011. Available online: https://goo.gl/UZD2gF (accessed on 13 February 2019).
- Núñez, J. Memoria de las Intervenciones Realizadas en el Yacimiento de Iruña–Veleia (Iruña de Oca, Álava). Año 2012. Available online: https://goo.gl/kYctP2 (accessed on 13 February 2019).
- Núñez, J. Informe de las Intervenciones Realizadas en el Yacimiento de Iruña–Veleia. IV Campaña—2013. Available online: https://goo.gl/q6Wpeb (accessed on 13 February 2019).
- Núñez, J. Informe de las Intervenciones Realizadas en el Yacimiento arqueológico de Iruña–Veleia. V Campaña–2014. Available online: https://goo.gl/2psX1j (accessed on 13 February 2019).
- Loza Lengarán, R.; Loza Uriarte, M.; Niso, J. Las Termas Romanas de Arcaya/Suestatium. Memoria de las Intervenciones Arqueológicas en Otazibarra (1976–1982); Diputación Foral de Álava: Vitoria–Gasteiz, Spain, 2015.
- Loza Uriarte, M.; Niso, J. Yacimiento de San Martín de Dulantzi. Arkeoikuska 2012, 2011, 35–57. Available online: https://goo.gl/U8895p (accessed on 13 February 2019).
- Gil, E. Albeiurmendi. Arkeoikuska 1990, 1990, 41–44. Available online: https://goo.gl/ECi1cf (accessed on 13 February 2019).
- Núñez, J.; Sáenz de Urturi, P. Una Mutatio de la Vía Ab Asturica Burdigalam en Mariturri (Vitoria/Álava). Archivo Español de Arqueología 2005, 78, 189–207. [Google Scholar] [CrossRef]
- Nicu, I.C. Cultural Heritage Assessment and Vulnerability Using Analytic Hierarchy Process and Geographic Information Systems (Valea Oii Catchment, North-eastern Romania). An Approach to Historical Maps. Int. J. Disaster Risk Reduct. 2016, 20, 103–111. [Google Scholar] [CrossRef]
- Flórez Santasusana, M.; Palet Martínez, J.M. Análisis Arqueomorfológico y Dinámica Territorial en el Vallés Oriental (Barcelona) de la Protohistoria (s. VI-V a.C.) a la Alta Edad Media (s. IX-X). Archivo Español de Arqueología 2012, 85, 167–192. [Google Scholar] [CrossRef]
- García González, J.J.; Peterson, D.; García Izquierdo, I.; García Aragón, L. Introducción al Conocimiento de la Viaria Romana de la Cuenca del Duero a través de la Documentación Altomedieval; Congreso de las Obras Públicas Romanas. Vol. 5. Las Técnicas y las Construcciones en la Ingeniería Romana; Fundación de la Ingeniería Técnica de Obras Públicas: Madrid, Spain, 2010; pp. 135–163. [Google Scholar]
- Gobierno Vasco, GeoEuskadi, Infraestructura de Datos Espaciales (IDE) de Euskadi. Available online: http://www.geo.euskadi.eus/s69-15375/es/ (accessed on 13 February 2019).
- Didierjean, F. Investigaciones sobre la Llamada “Vía Aquitana”: Algunos Avances. In Medio Siglo de Arqueología en el Cantábrico Oriental y su Entorno: Actas del Congreso Internacional; Llanos Ortiz de Landaluze, A., Ed.; Instituto Alavés de Arqueología: Vitoria-Gasteiz, Spain, 2007; pp. 963–976. [Google Scholar]
- Varón Hernández, F.R.; Fuldain González, J.J. Determinación del Trazado del Iter XXXIV a su paso por Álava. Arkeoikuska 2018, 2018, 209–215. Available online: https://goo.gl/9TsrTh (accessed on 25 March 2019).
- Fuldain, J.J.; Varón Hernández, F.R. The Application of Precision Agricultural Techniques to Archaeological Survey. The NDVI Index Applied to the Study of the Iter XXXIV Roman Road in the Province of Álava (Spain); In CAAUK Edimburg. 27 October 2018. Available online: https://goo.gl/aZN432 (accessed on 1 January 2019).
- Ruiz Alonso, M. Evolución y Explotación de los Recursos Vegetales desde el Tardiglaciar en la Vertiente Mediterránea del País Vasco: Datos Antracológicos, Universidad del País Vasco/Euskal Herriko Unibersitatea. 2014. Available online: https://www.educacion.gob.es/teseo/mostrarRef.do?ref=353700 (accessed on 13 February 2019).
- Hernández Beloqui, B. Los Paisajes Medievales del Norte Peninsular: Registros Paleopalinológicos de la Llanada Alavesa y la Cuenca de Treviño; Universidad del País Vasco/Euskal Herriko Unibersitatea: Vitoria-Gasteiz, Spain, 2015. [Google Scholar]
- Fuldain González, J.J.; Fuldain González, J.I. Prospección Arqueológica en NDVI con Drones. El Uso de Geoeuskadi Como Herramienta de Ponderación de un Nuevo Método. Revista Mapp. 2018, 27, 24–29. [Google Scholar]
- Portilla, M.J. Por Álava a Compostela; Diputación Foral de Álava: Vitoria-Gasteiz, Spain, 1991.
Figure 1.
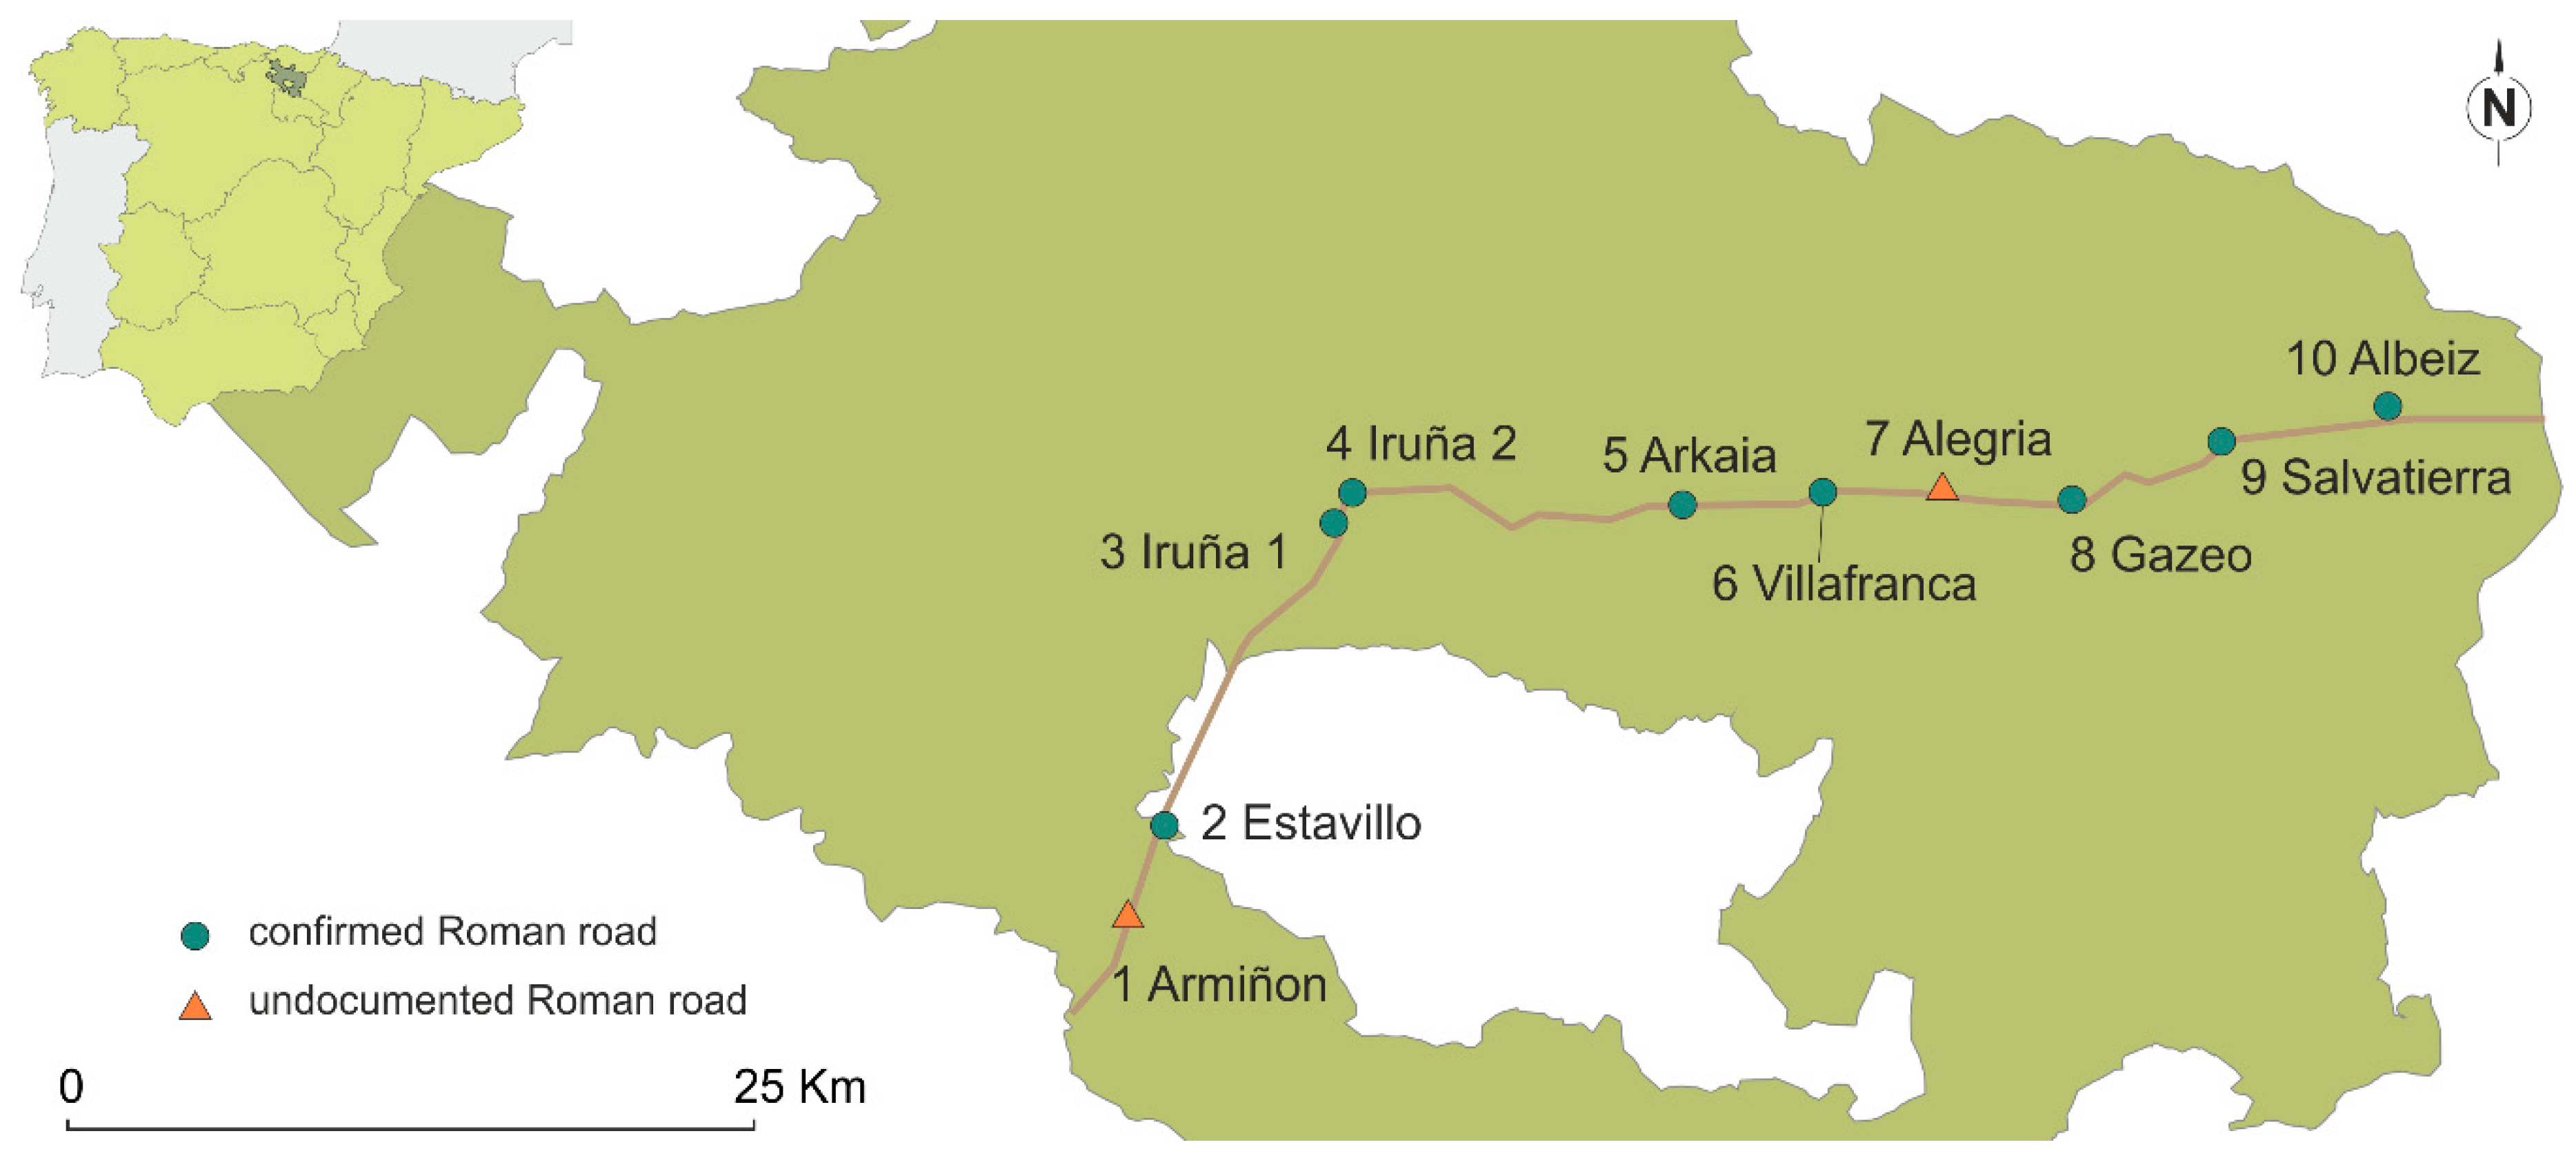
Relief map of the province of Álava indicating the route of the Roman road Iter 34 and the roadside lodging places (mansiones) referred to in the Antonine Itinerary.
Figure 1.
Relief map of the province of Álava indicating the route of the Roman road Iter 34 and the roadside lodging places (mansiones) referred to in the Antonine Itinerary.

Figure 2.
The areas surveyed in the study indicating the state of knowledge of the Roman road before the NDVI survey.
Figure 2.
The areas surveyed in the study indicating the state of knowledge of the Roman road before the NDVI survey.

Figure 3.
(a) The NDVI positive anomaly created by the service trench. (b) The 2005 service trench seen in the geoEuskadi aerial photograph [60].
Figure 3.
(a) The NDVI positive anomaly created by the service trench. (b) The 2005 service trench seen in the geoEuskadi aerial photograph [60].

Figure 4.
Areas where the Roman road was found, in (a) Area 2, (b) Area 3, (c) Area 4, (d) Area 5, (e) Area 6, (f) Area 8, (g) Area 9, (h) Area 10.
Figure 4.
Areas where the Roman road was found, in (a) Area 2, (b) Area 3, (c) Area 4, (d) Area 5, (e) Area 6, (f) Area 8, (g) Area 9, (h) Area 10.

Figure 5.
Details of the areas with the built road: (a) Area 2, (b) Area 4, (c) Area 5, (d) Area 6, (e) Area 9 and (f) Area 10.
Figure 5.
Details of the areas with the built road: (a) Area 2, (b) Area 4, (c) Area 5, (d) Area 6, (e) Area 9 and (f) Area 10.

Figure 6.
Details of the areas with the cut road: (a) Area 2, (b) Area 3, (c) Area 5, (d) Area 8 and (e) Area 9.
Figure 6.
Details of the areas with the cut road: (a) Area 2, (b) Area 3, (c) Area 5, (d) Area 8 and (e) Area 9.

Figure 7.
Trench showing the roadside ditch and part of the pavement of the Iter 34 Roman road in Area 9.
Figure 7.
Trench showing the roadside ditch and part of the pavement of the Iter 34 Roman road in Area 9.

Figure 8.
(a) NDVI orthomosaic of Area 3 and (b) interpretation of some of the archaeological features observed in Area 3.
Figure 8.
(a) NDVI orthomosaic of Area 3 and (b) interpretation of some of the archaeological features observed in Area 3.

Figure 9.
Area 5 in NDVI showing the Roman road (1), a post-medieval road (2), a conjectured brook crossing (3), modern canalization of the brook (4) and water marks created by former course of the brook (5).
Figure 9.
Area 5 in NDVI showing the Roman road (1), a post-medieval road (2), a conjectured brook crossing (3), modern canalization of the brook (4) and water marks created by former course of the brook (5).

Figure 10.
(a) Area 6 in NDVI and (b) the two different alignments of the observed features.

Figure 11.
(a) Detail of the features in Area 6 in the NDVI orthomosaic and (b) the conjectured shape of the building causing the NDVI marks.
Figure 11.
(a) Detail of the features in Area 6 in the NDVI orthomosaic and (b) the conjectured shape of the building causing the NDVI marks.

Figure 12.
Possible water works in Area 7.

Figure 13.
Area 9 shown in (a) NDVI orthomosaic indicating the Roman Road and field boundaries before the field enclosure and (b) the 1945 photo from the American Flight (http://www.geo.euskadi.eus) showing the same road and field boundaries.
Figure 13.
Area 9 shown in (a) NDVI orthomosaic indicating the Roman Road and field boundaries before the field enclosure and (b) the 1945 photo from the American Flight (http://www.geo.euskadi.eus) showing the same road and field boundaries.

Figure 14.
Map showing the current state of knowledge of the Iter 34 Roman road in the ten areas surveyed for the NDVI study.
Figure 14.
Map showing the current state of knowledge of the Iter 34 Roman road in the ten areas surveyed for the NDVI study.

© 2019 by the authors. Licensee MDPI, Basel, Switzerland. This article is an open access article distributed under the terms and conditions of the Creative Commons Attribution (CC BY) license (http://creativecommons.org/licenses/by/4.0/).
Share and Cite
MDPI and ACS Style
Fuldain González, J.J.; Varón Hernández, F.R. NDVI Identification and Survey of a Roman Road in the Northern Spanish Province of Álava. Remote Sens. 2019, 11, 725. https://0-doi-org.brum.beds.ac.uk/10.3390/rs11060725
AMA Style
Fuldain González JJ, Varón Hernández FR. NDVI Identification and Survey of a Roman Road in the Northern Spanish Province of Álava. Remote Sensing. 2019; 11(6):725. https://0-doi-org.brum.beds.ac.uk/10.3390/rs11060725
Chicago/Turabian StyleFuldain González, Juan José, and Félix Rafael Varón Hernández. 2019. "NDVI Identification and Survey of a Roman Road in the Northern Spanish Province of Álava" Remote Sensing 11, no. 6: 725. https://0-doi-org.brum.beds.ac.uk/10.3390/rs11060725
Note that from the first issue of 2016, this journal uses article numbers instead of page numbers. See further details here.