An Improved Spatial–Temporal Downscaling Method for TRMM Precipitation Datasets in Alpine Regions: A Case Study in Northwestern China’s Qilian Mountains

 , ,
, ,
Abstract
:
1. Introduction
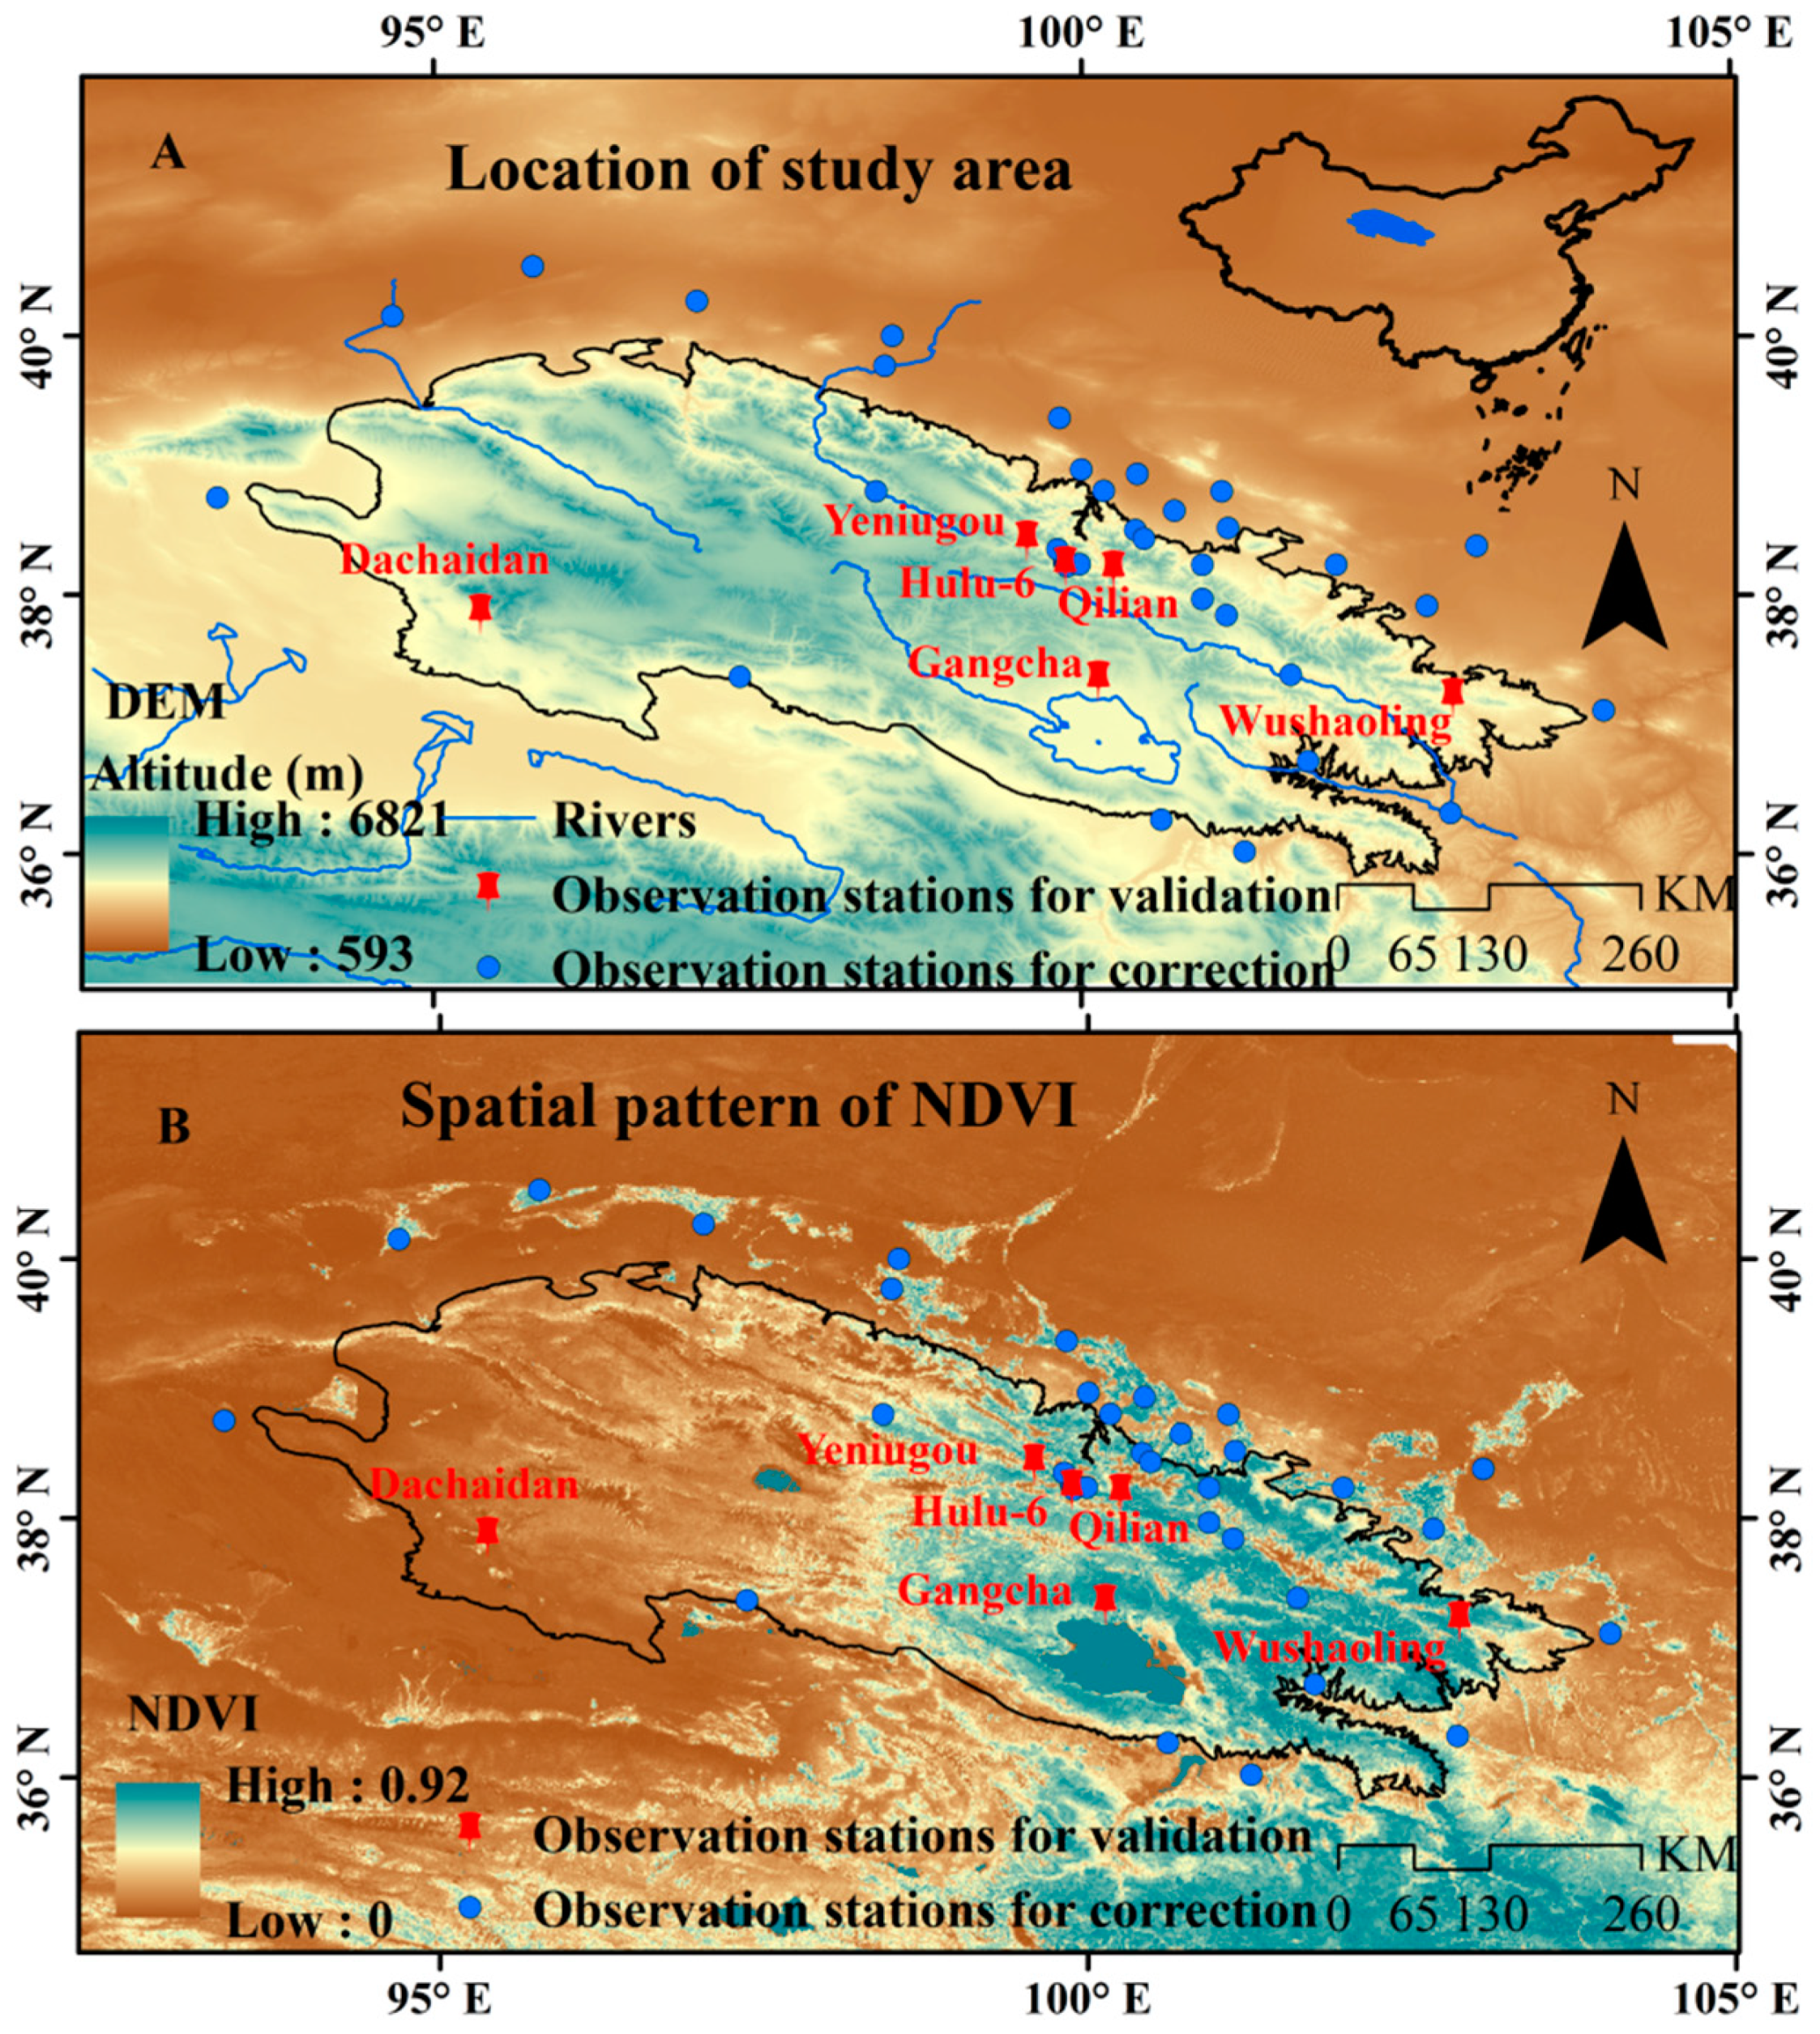
2. Study Areas
3. Datasets and Methodology
3.1. Datasets
3.1.1. Point Observation Data
3.1.2. TRMM
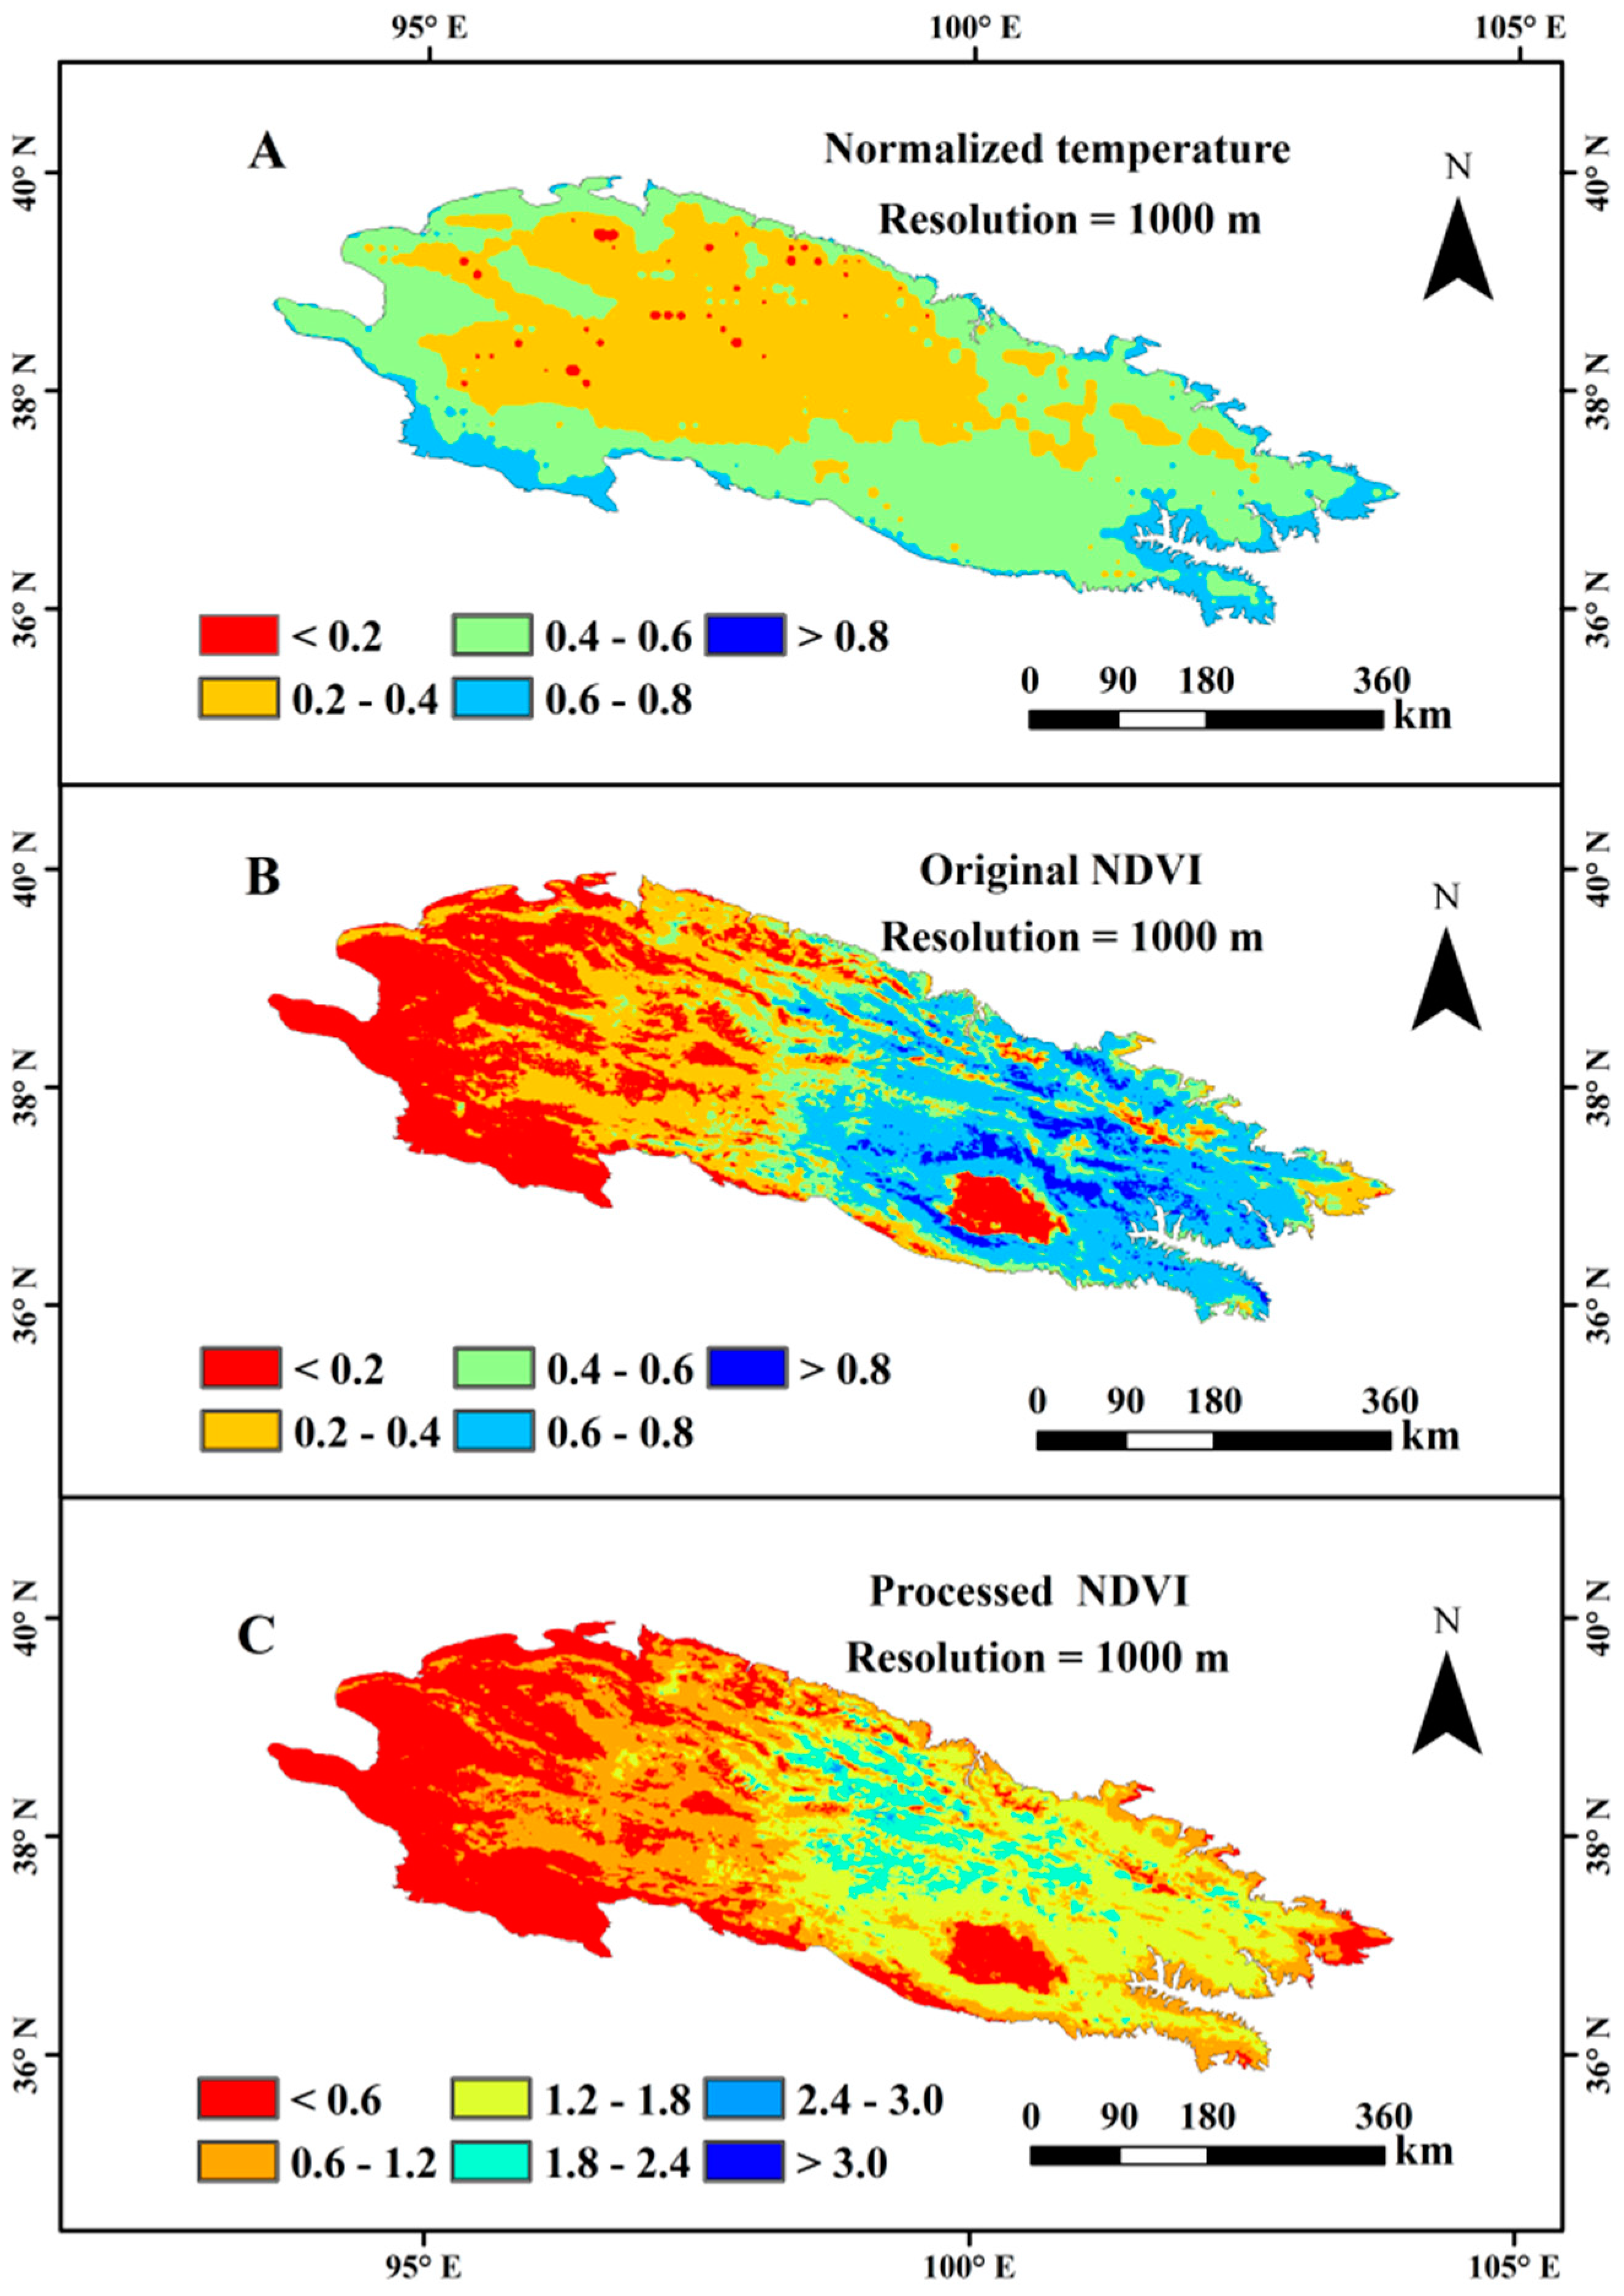
3.1.3. NDVI Datasets
3.1.4. Digital Elevation Models
3.2. Methodology
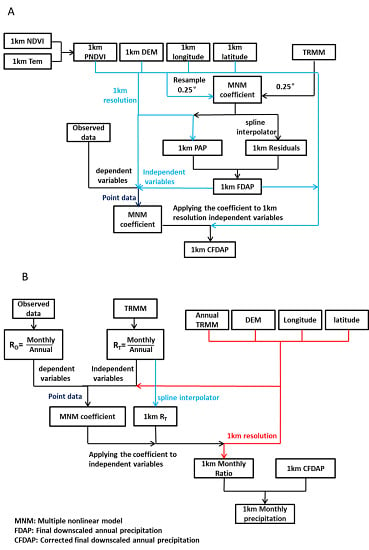
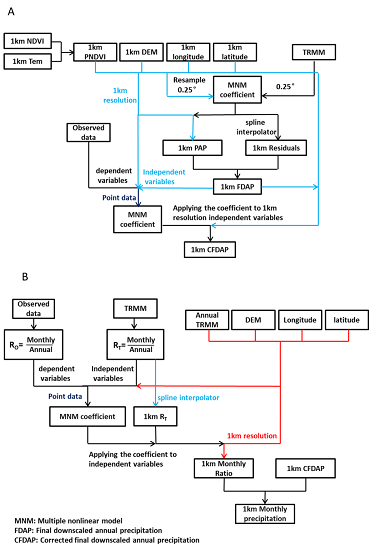
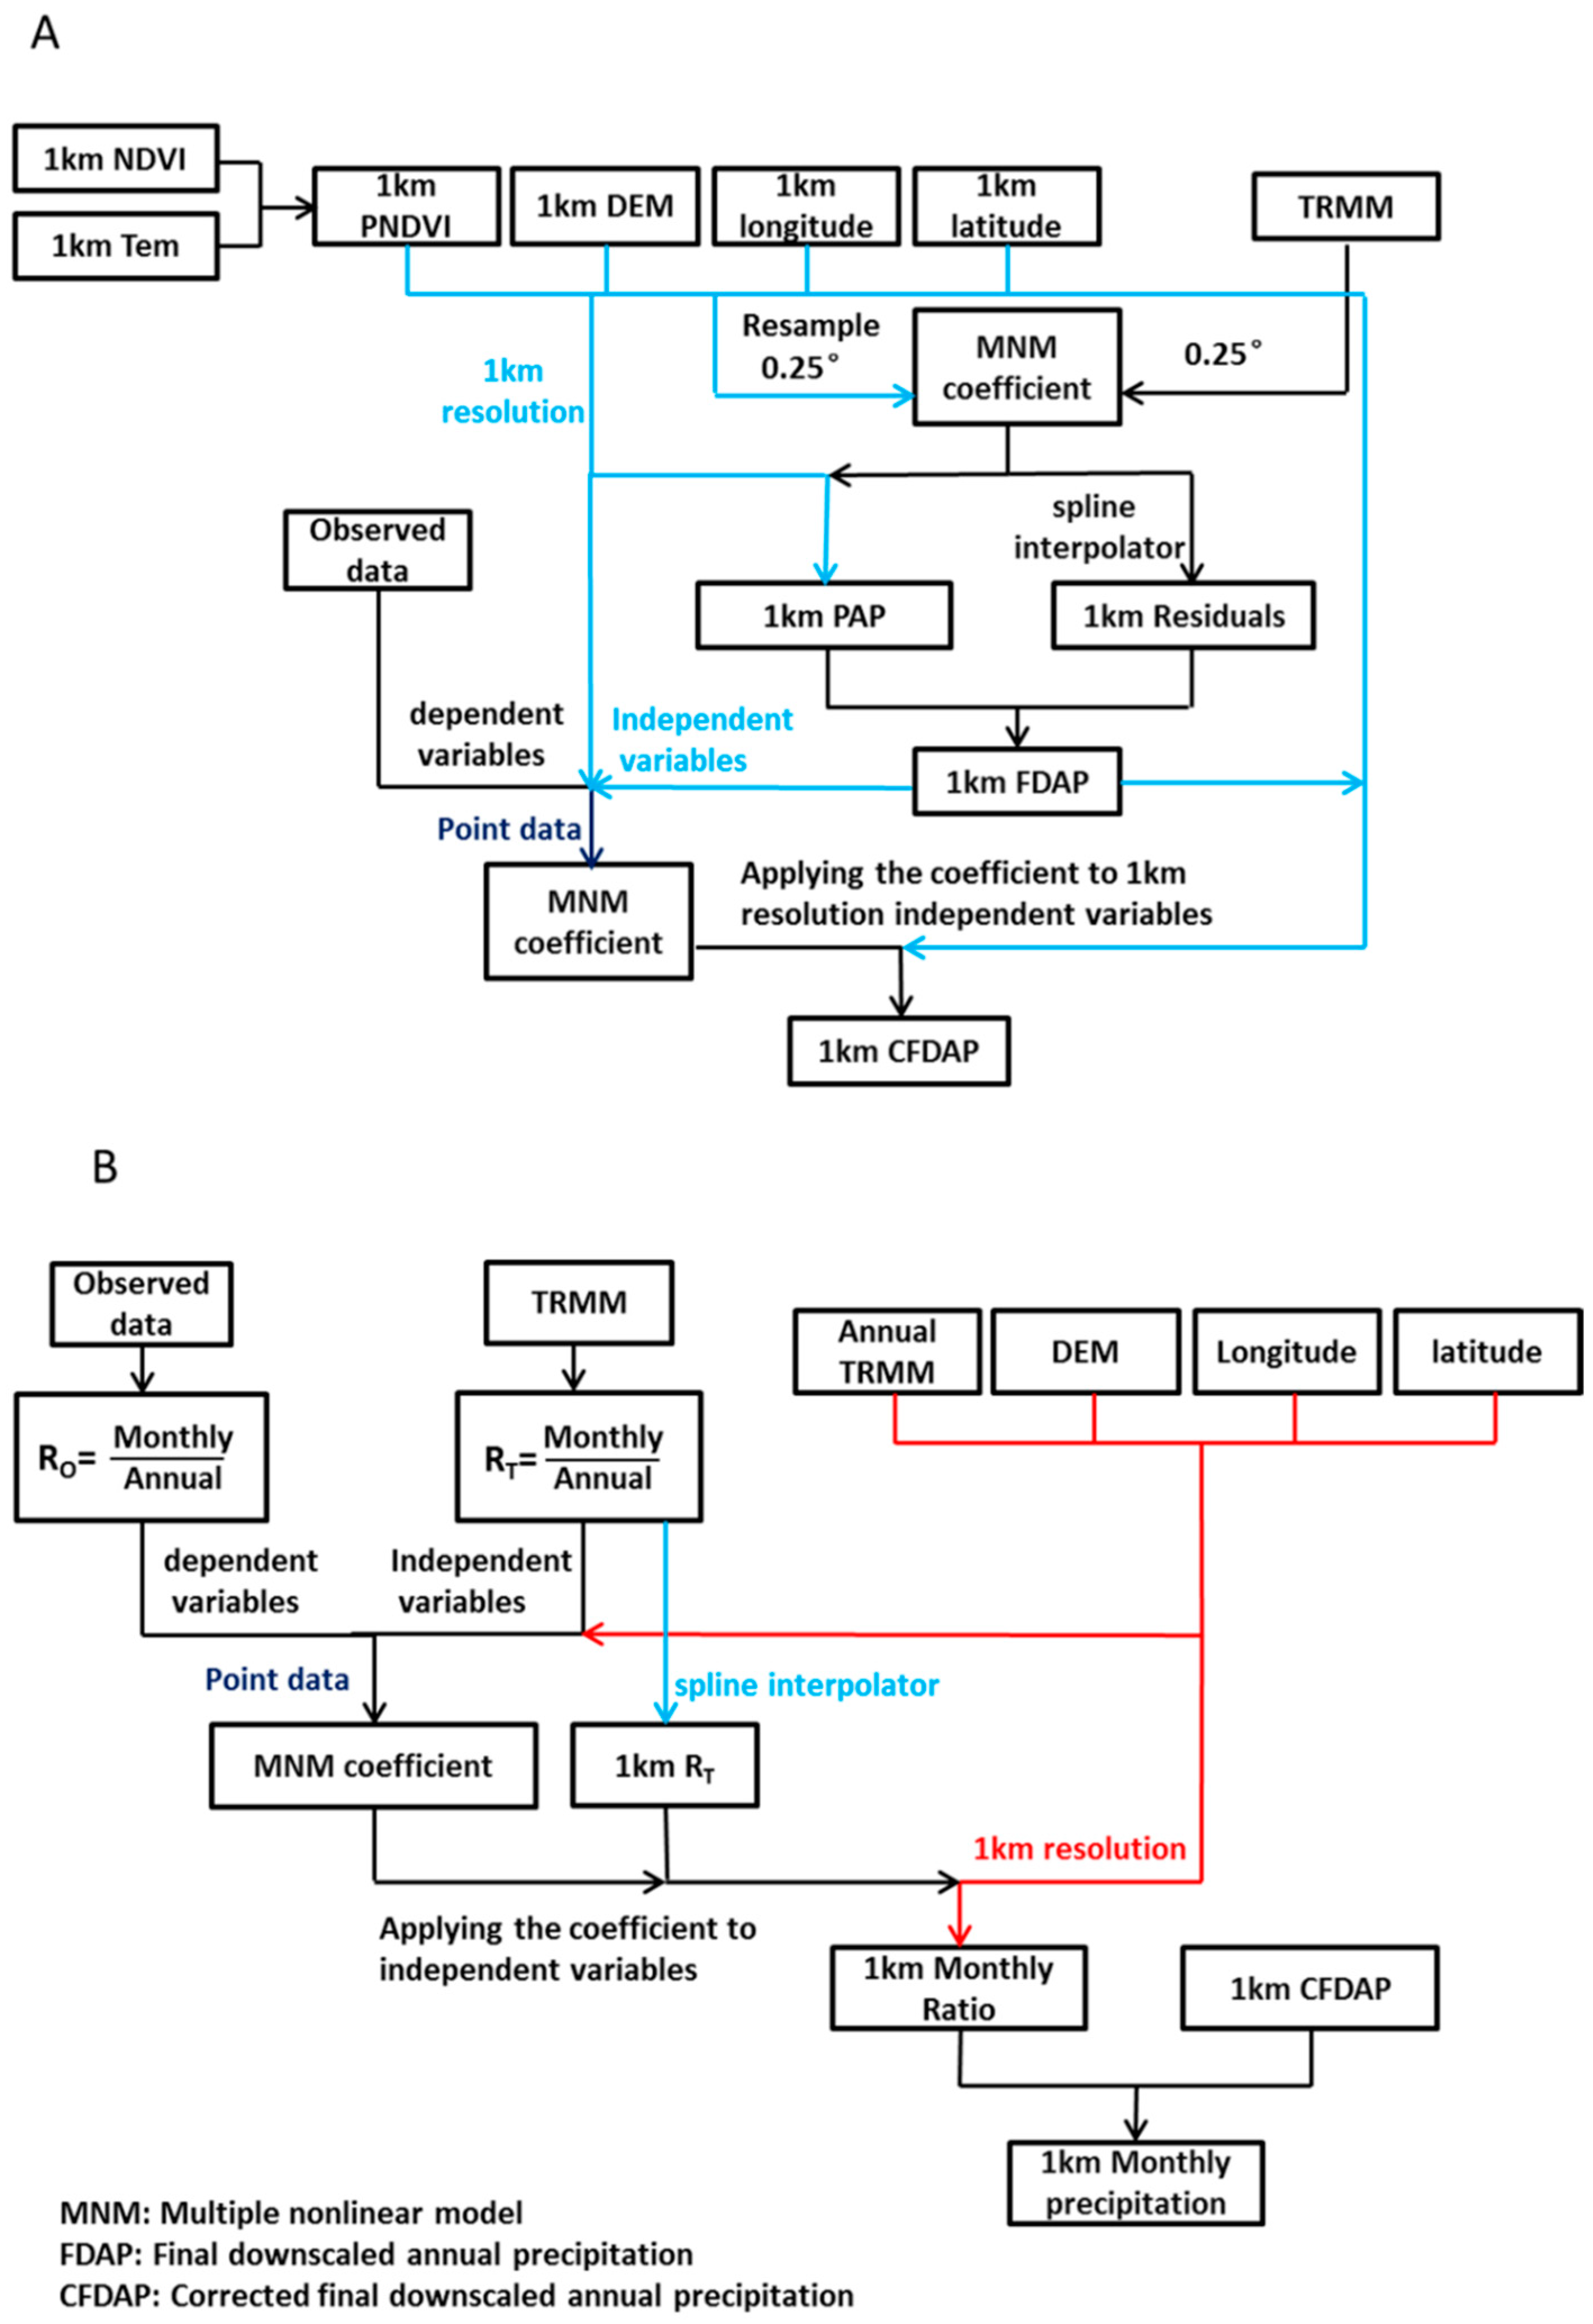
3.2.1. Downscaling
3.2.2. Validation
4. Results
4.1. Downscaling Procures
4.2. Downscaled Annual Precipitation and Validation
4.3. Downscaled Monthly Precipitation and Validation
4.4. Error Analysis of Downscaled Precipitation
5. Discussion
5.1. The Advantages and Disadvantages of the Model
5.2. Necessity for and Feasibility of Corrected Downscaled Data
5.3. The Future of Downscaling Research
6. Conclusions
- (1)
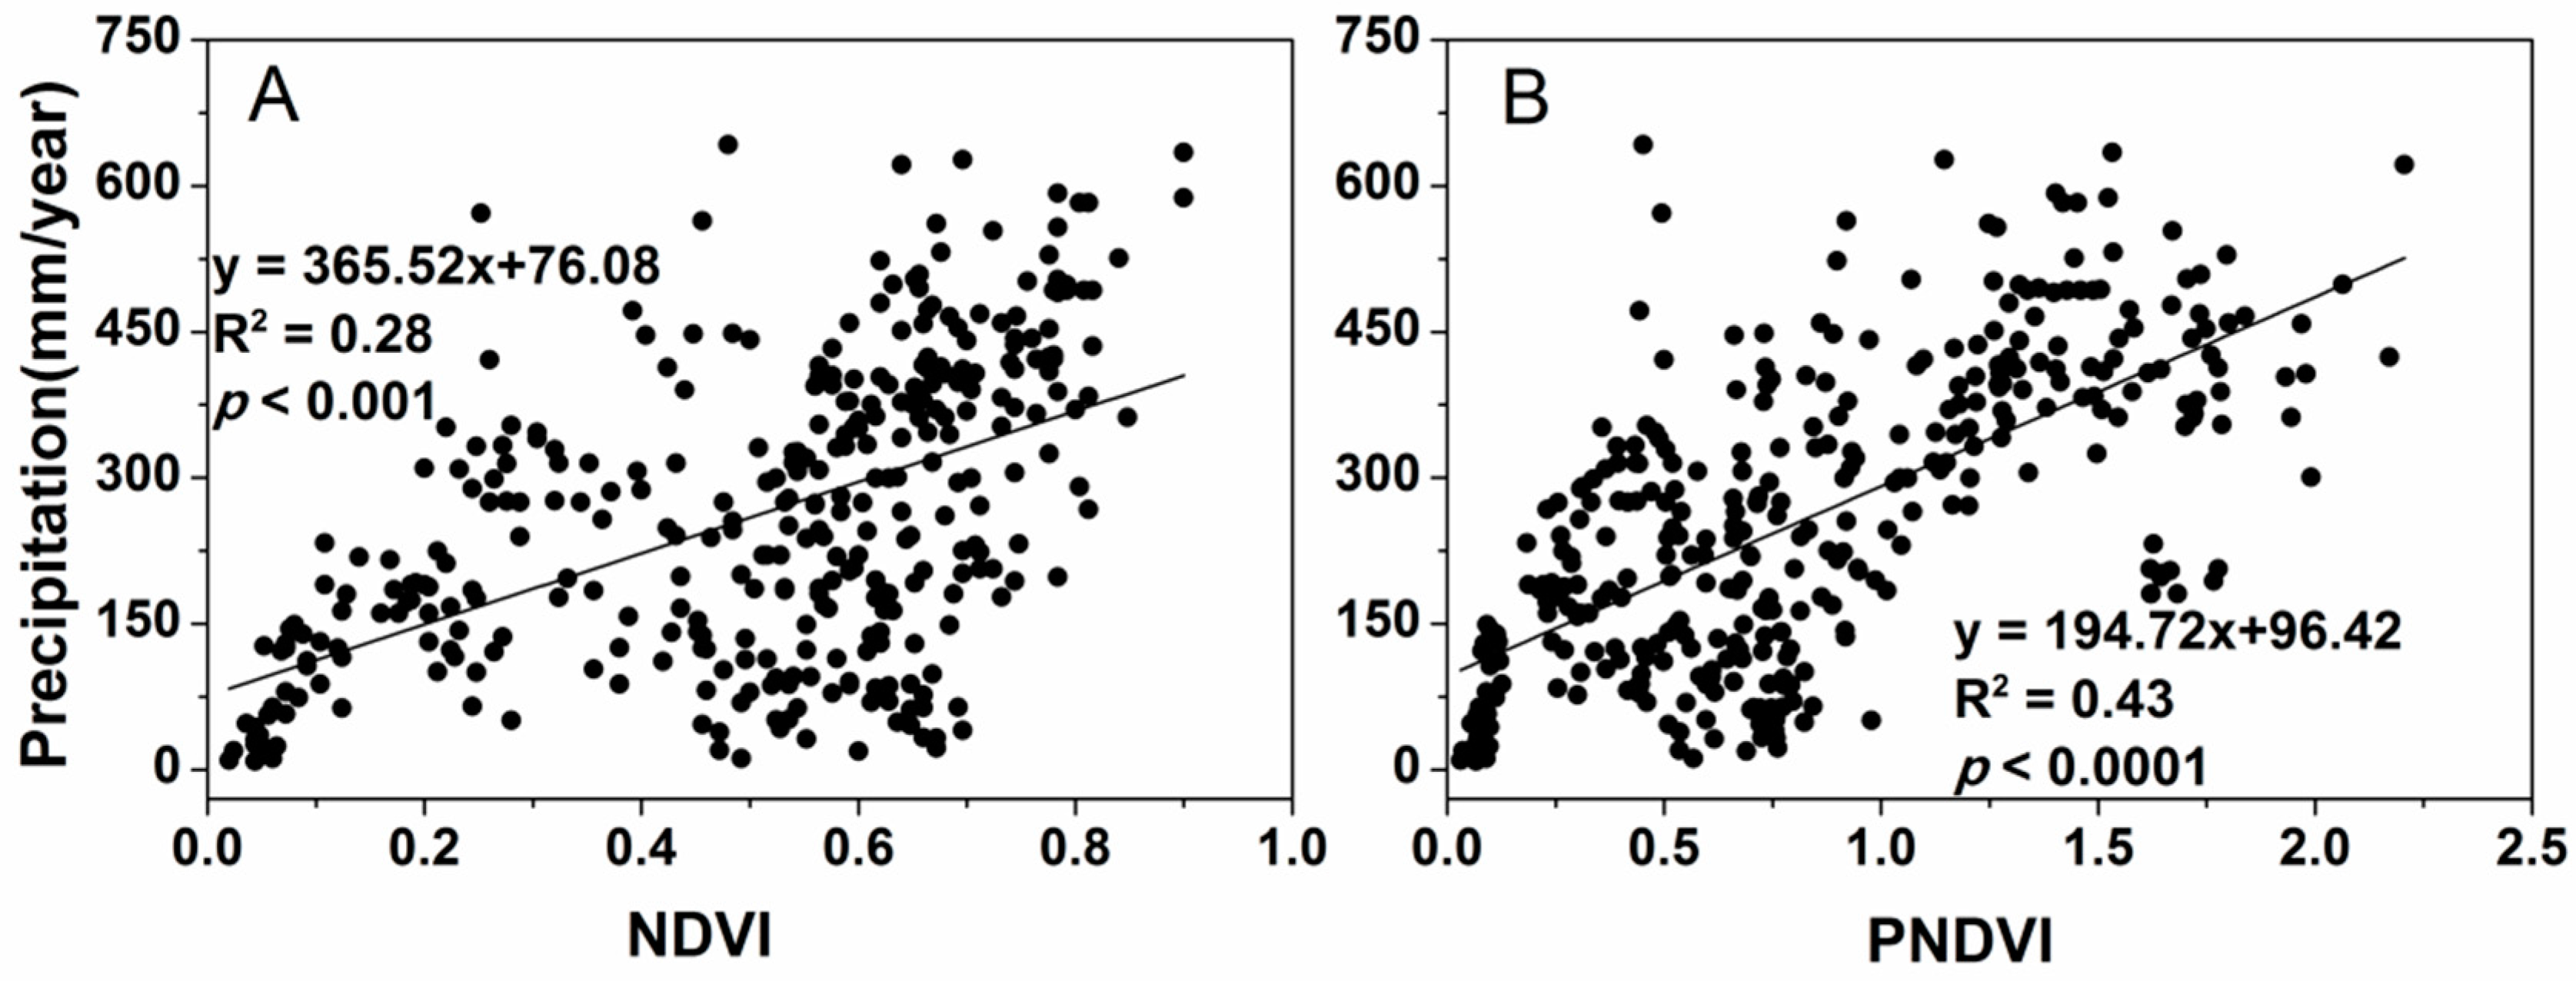
- The correlation between precipitation and PNDVI was higher than the correlation between precipitation and NDVI.
- (2)
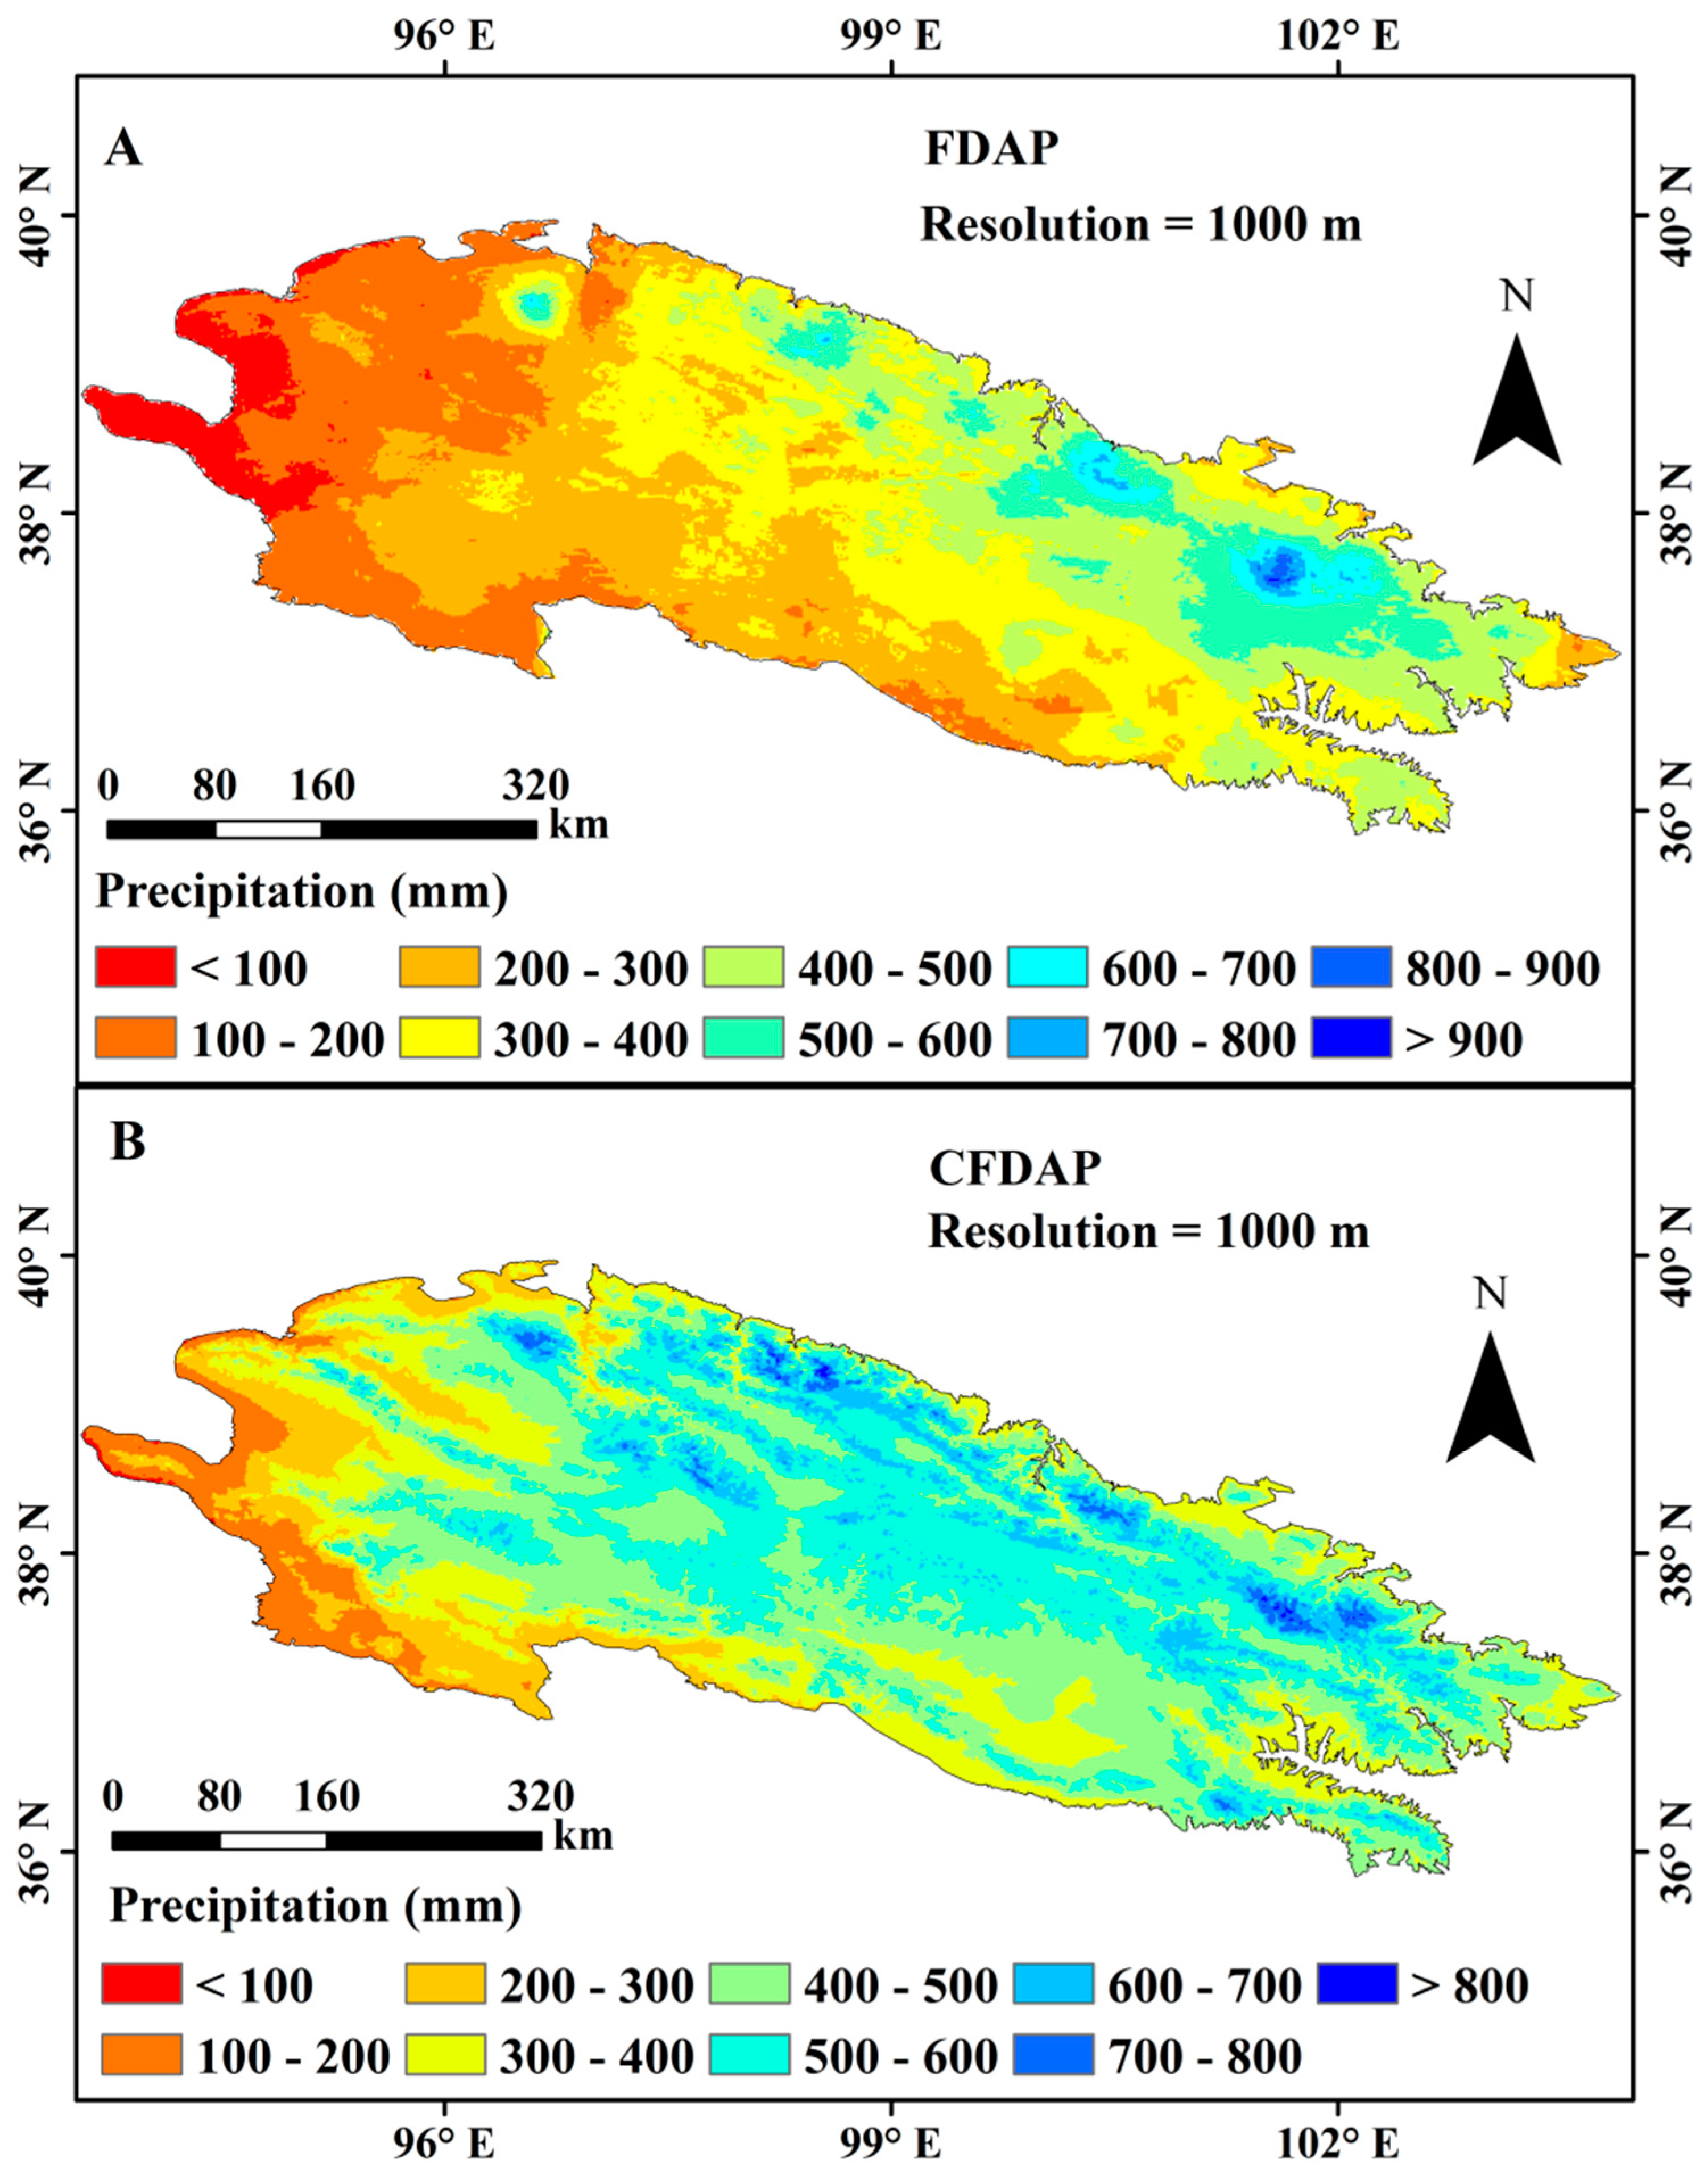
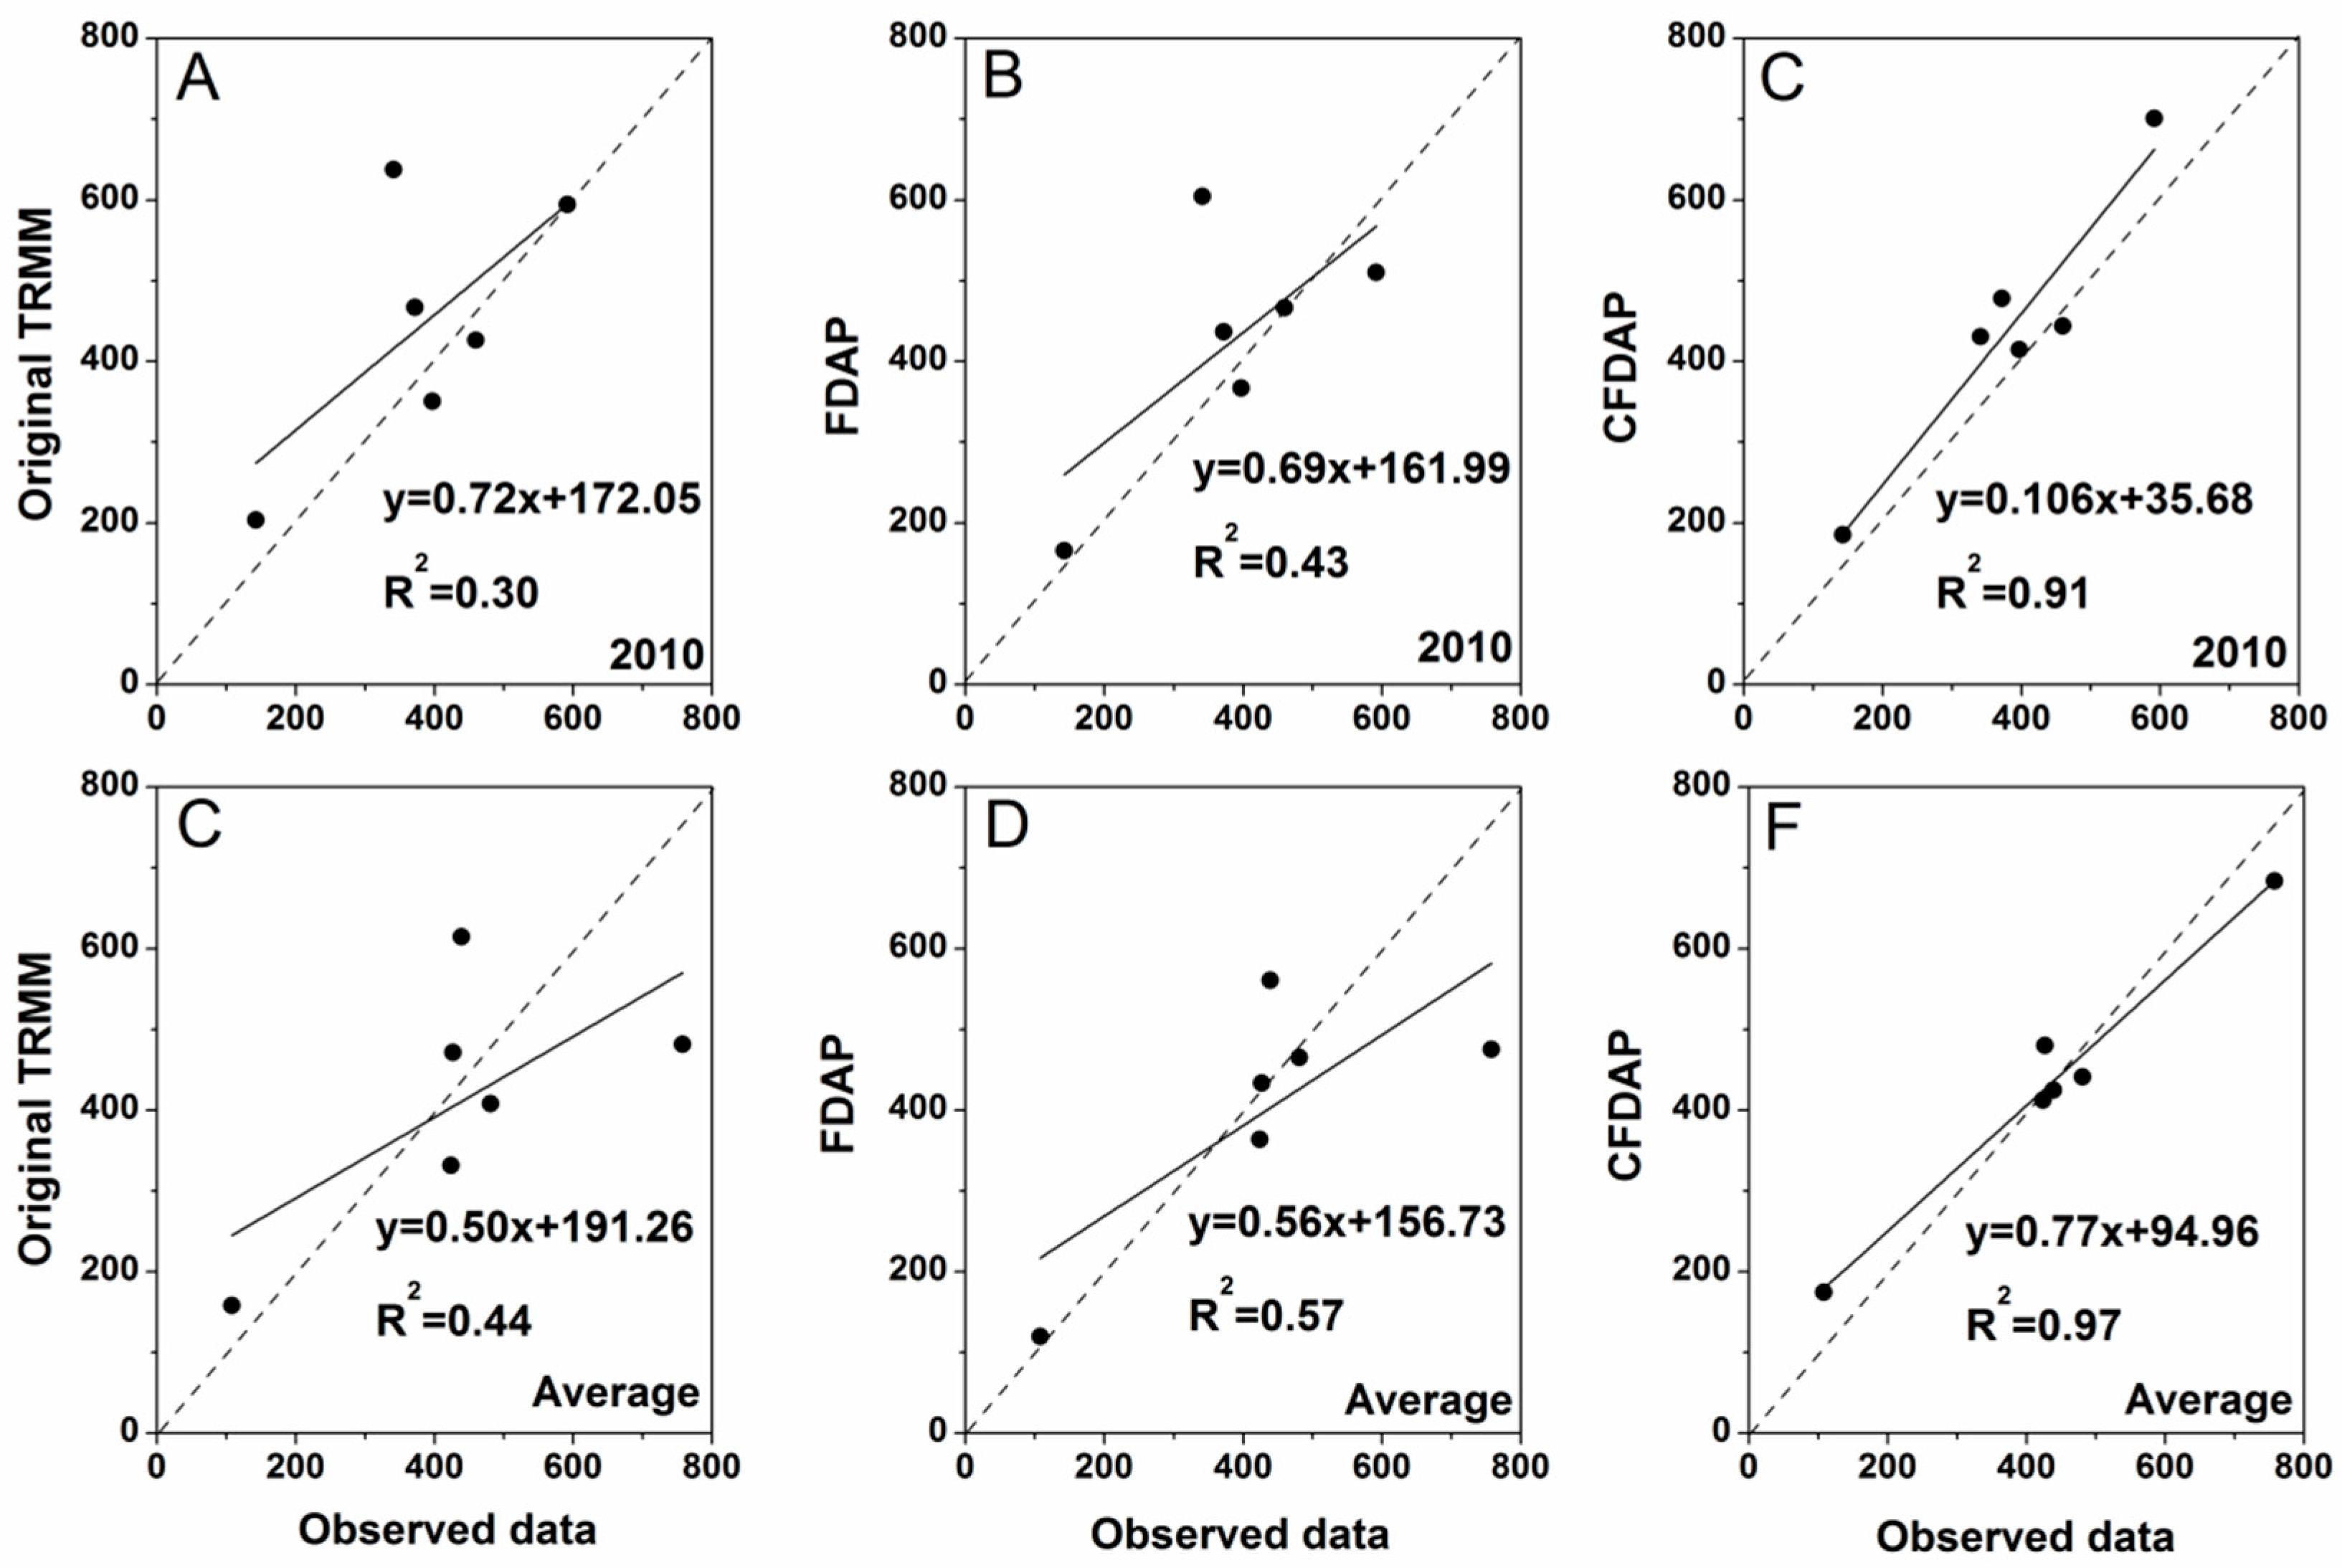
- The accuracy of FDAP and CFDAP in the improved method was higher than that of the downscaled data obtained from the previous method which was based on relationships between precipitation and NDVI, DEM, longitude, and latitude. The RMSE of precipitation decreased on average by 13.63 and 80.11 mm, respectively, for FDAP and CFDAP.
- (3)
- The accuracy of CFDAP was significantly higher than that of FDAP based solely on land surface characteristics. Average RMSE from 2006 to 2015 of the corrected downscaled dataset was 66.48 and 83.07 mm less than that of the downscaled results without correction (80.91 vs. 147.39 mm) and original TRMM data (80.91 vs. 163.98 mm).
- (4)
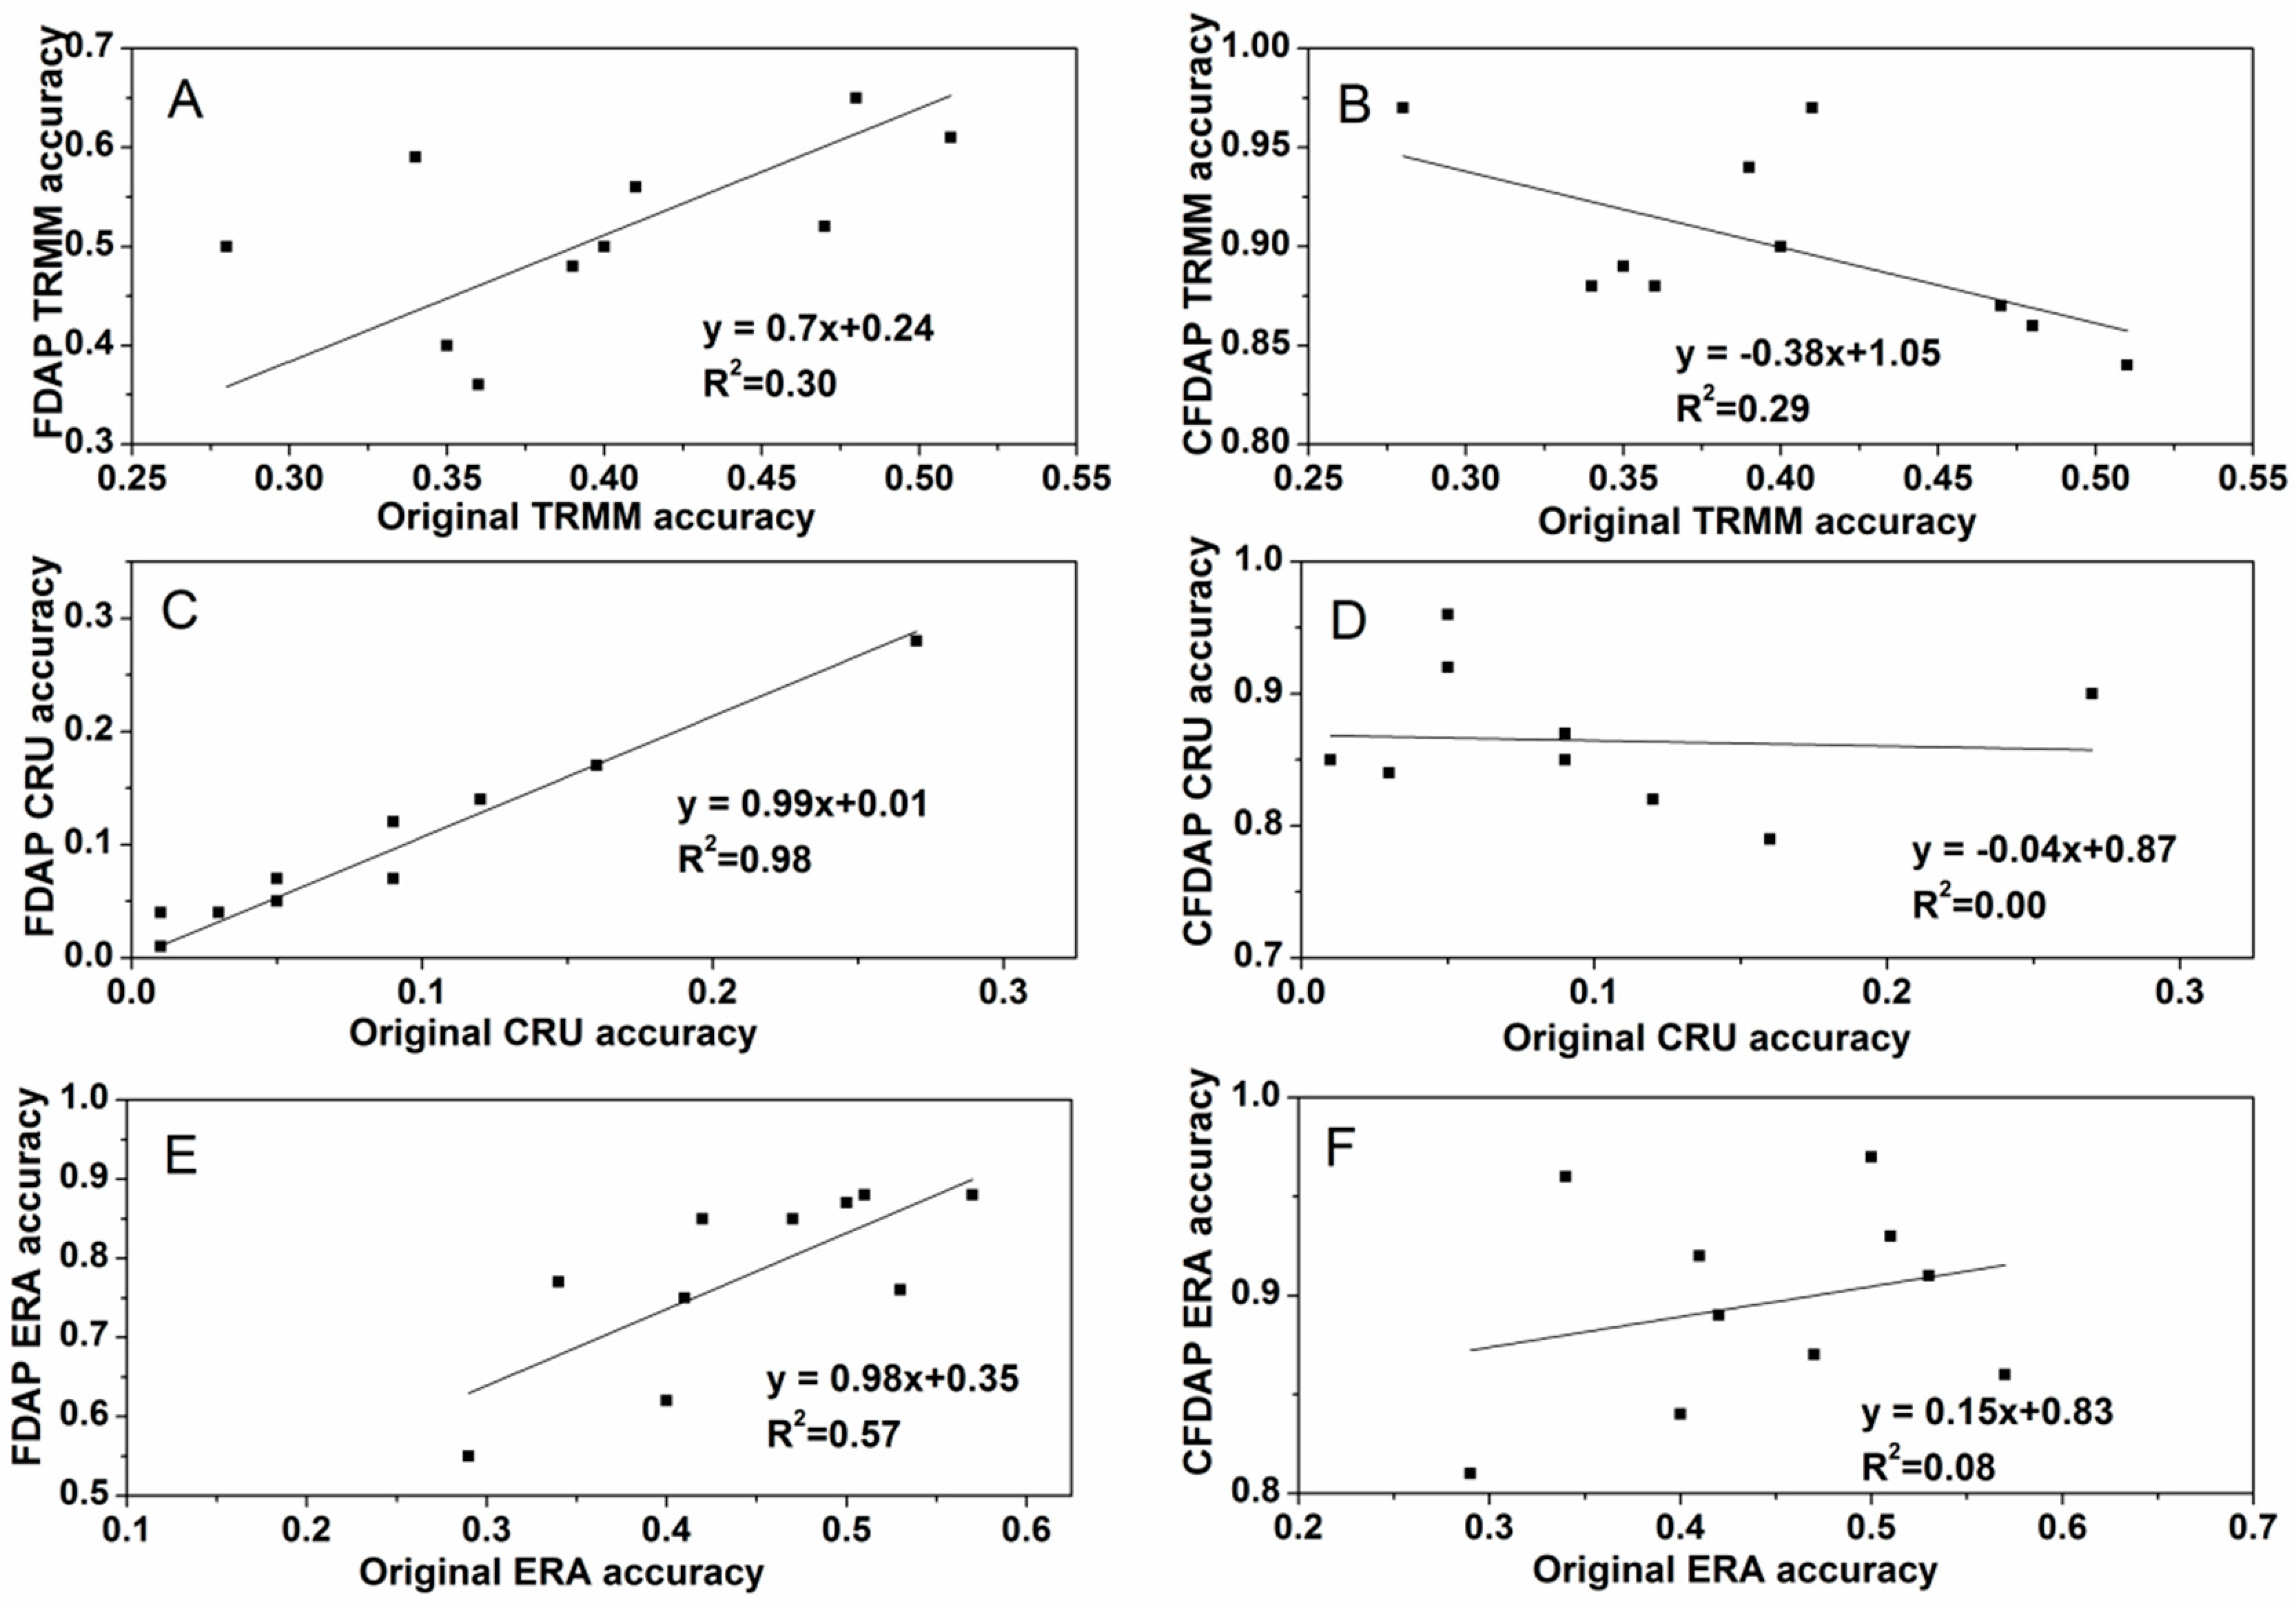
- The accuracy of the original satellite data affected FDAP results but had no significant effects on CFDAP results.
- (5)
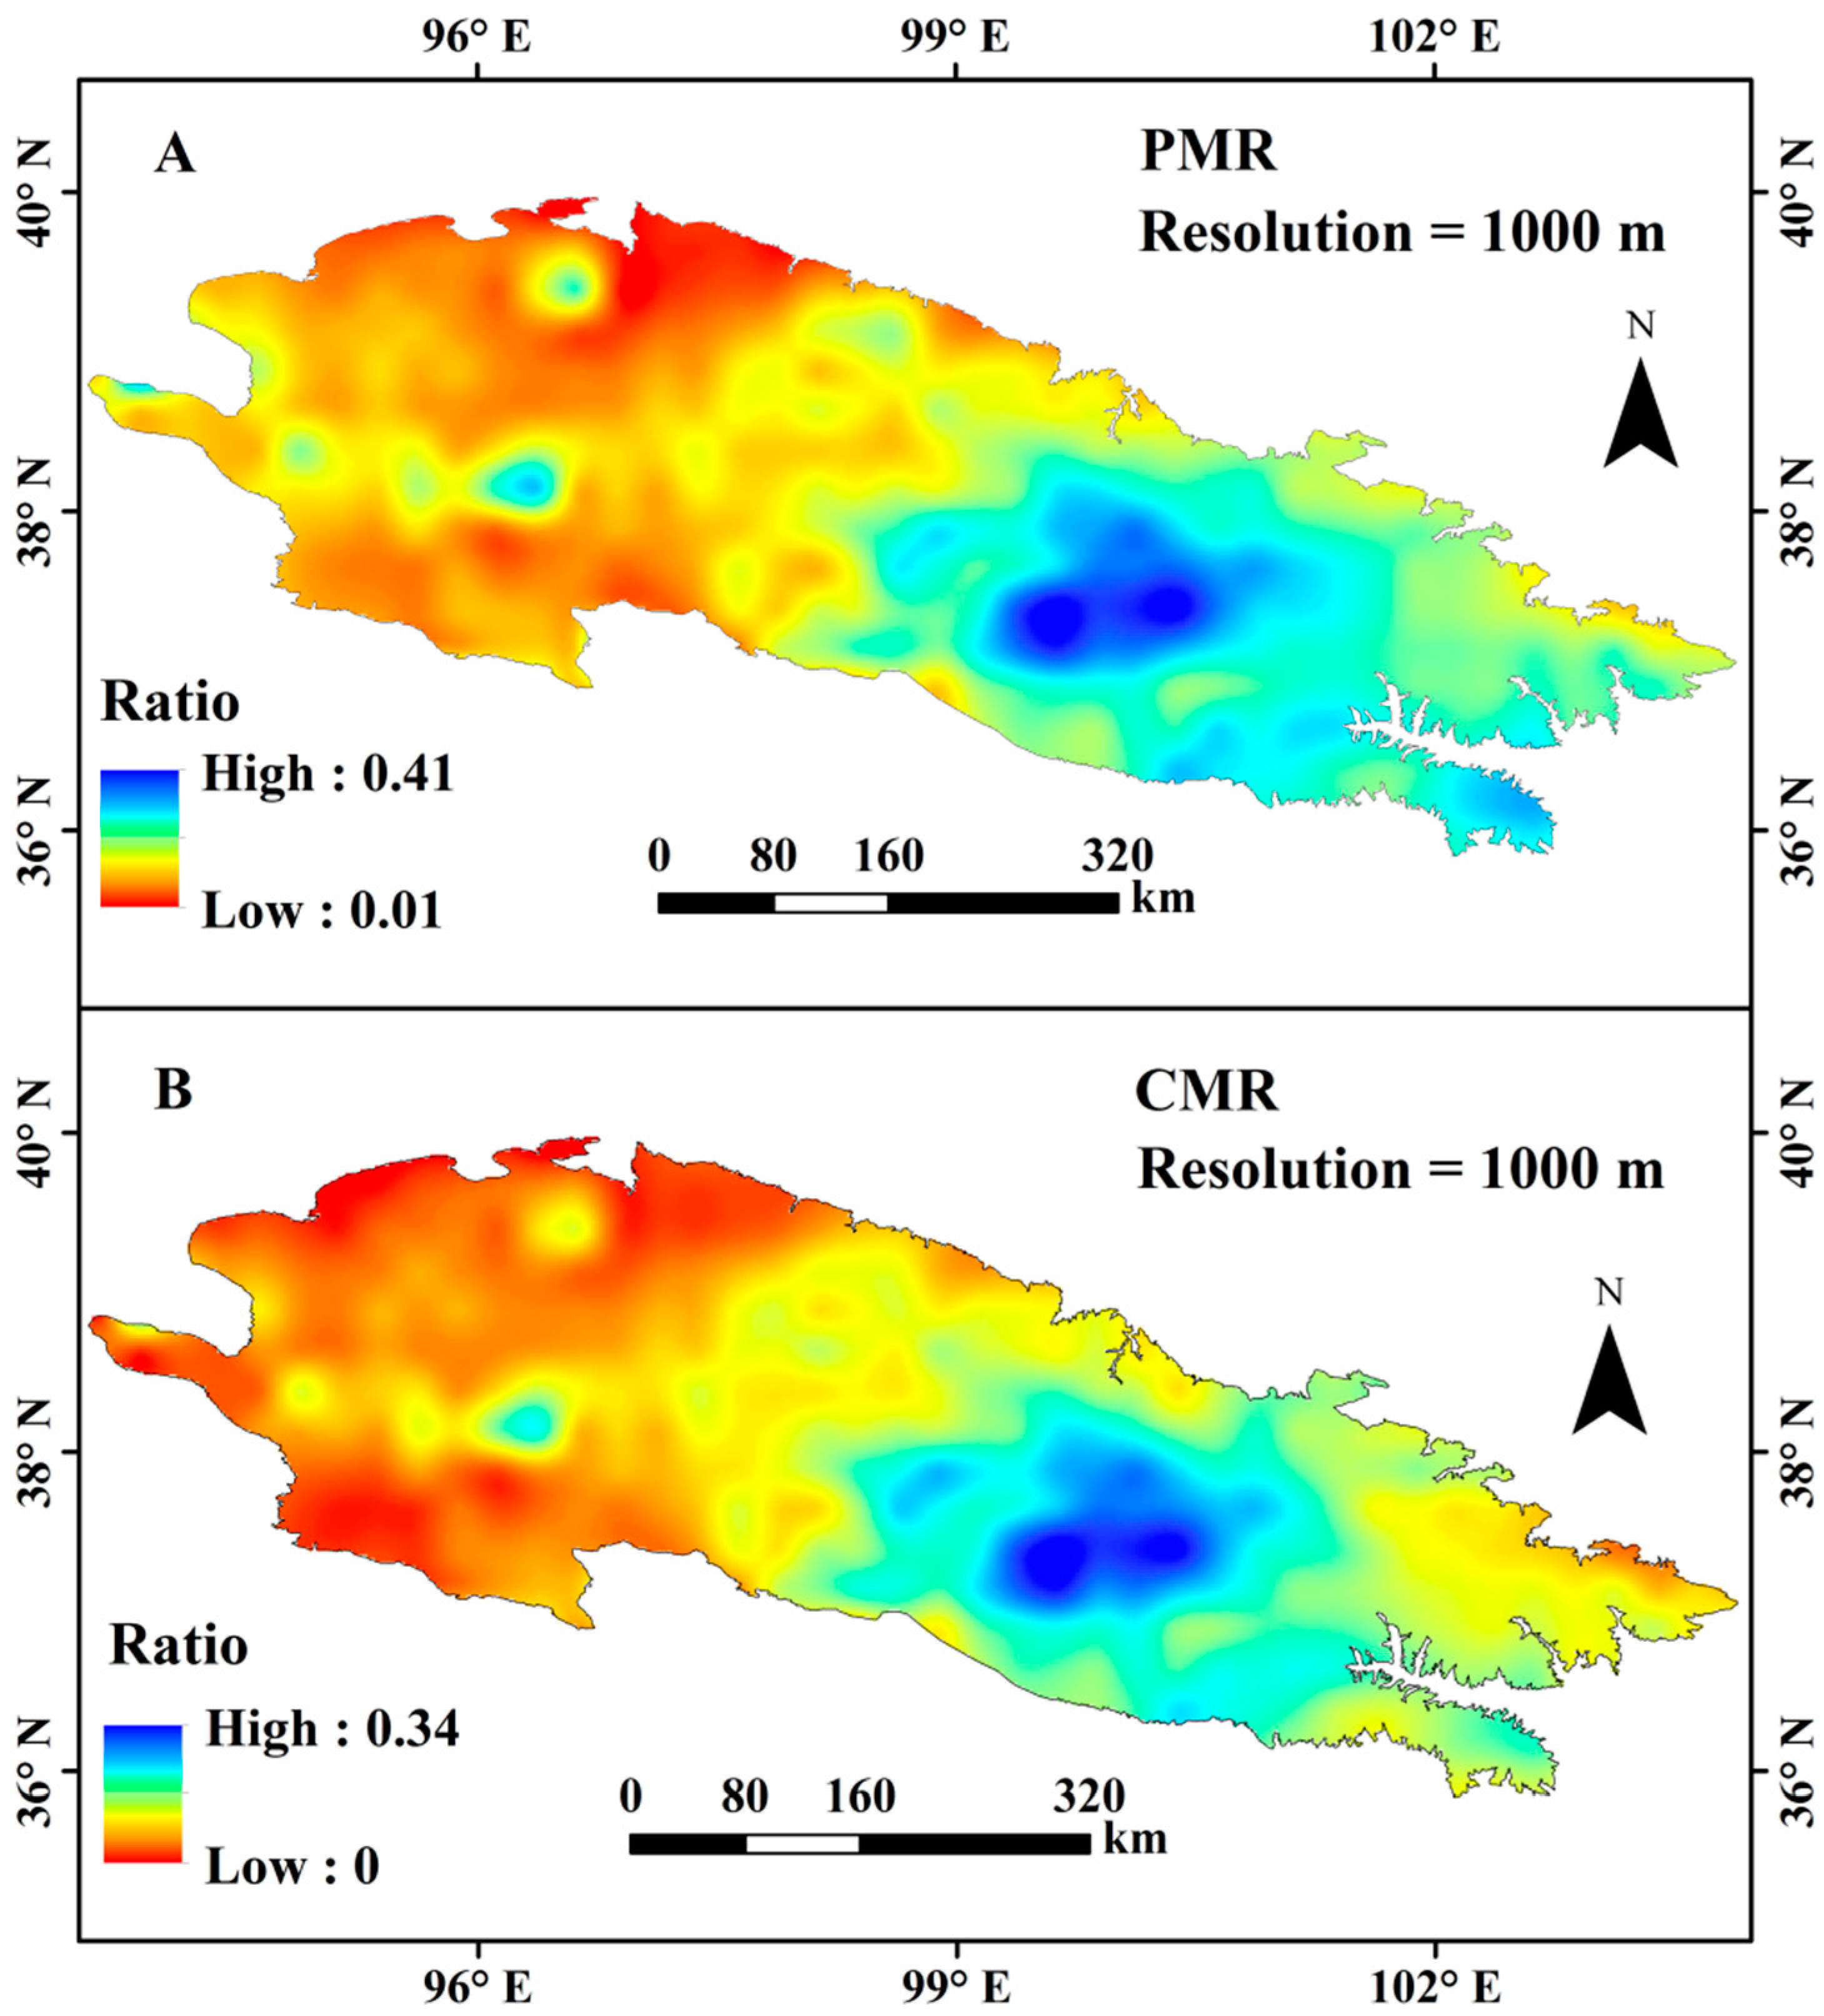
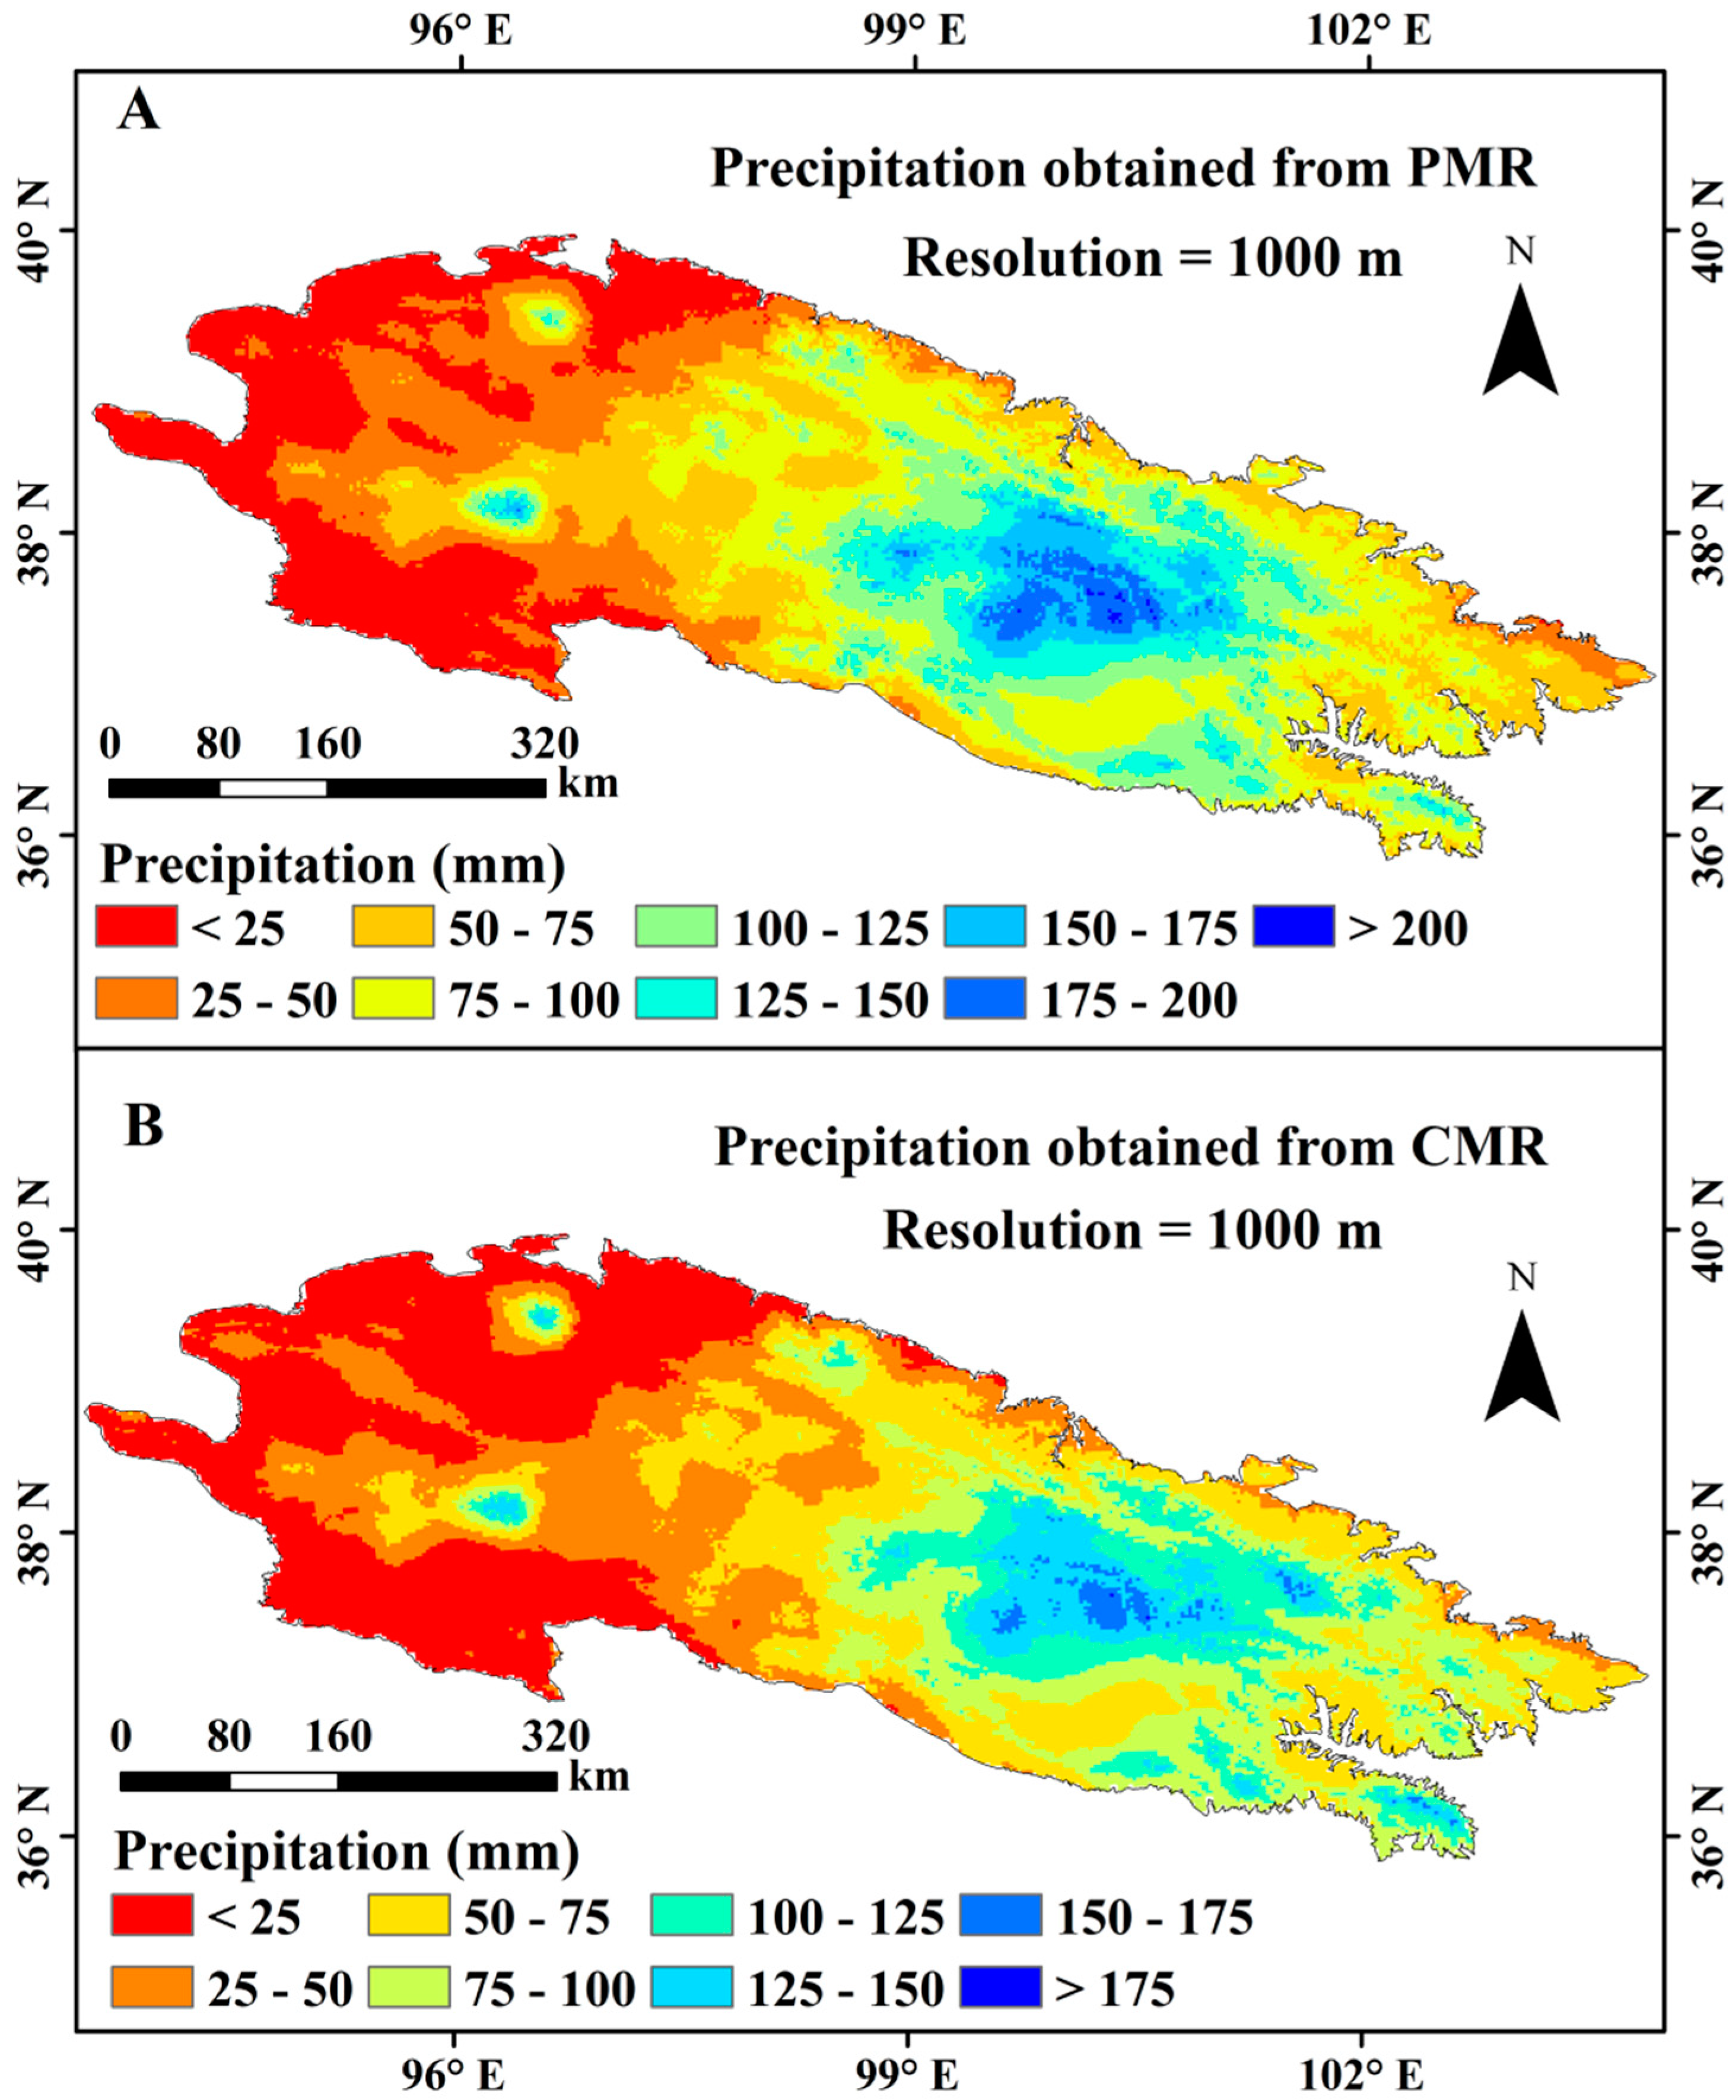
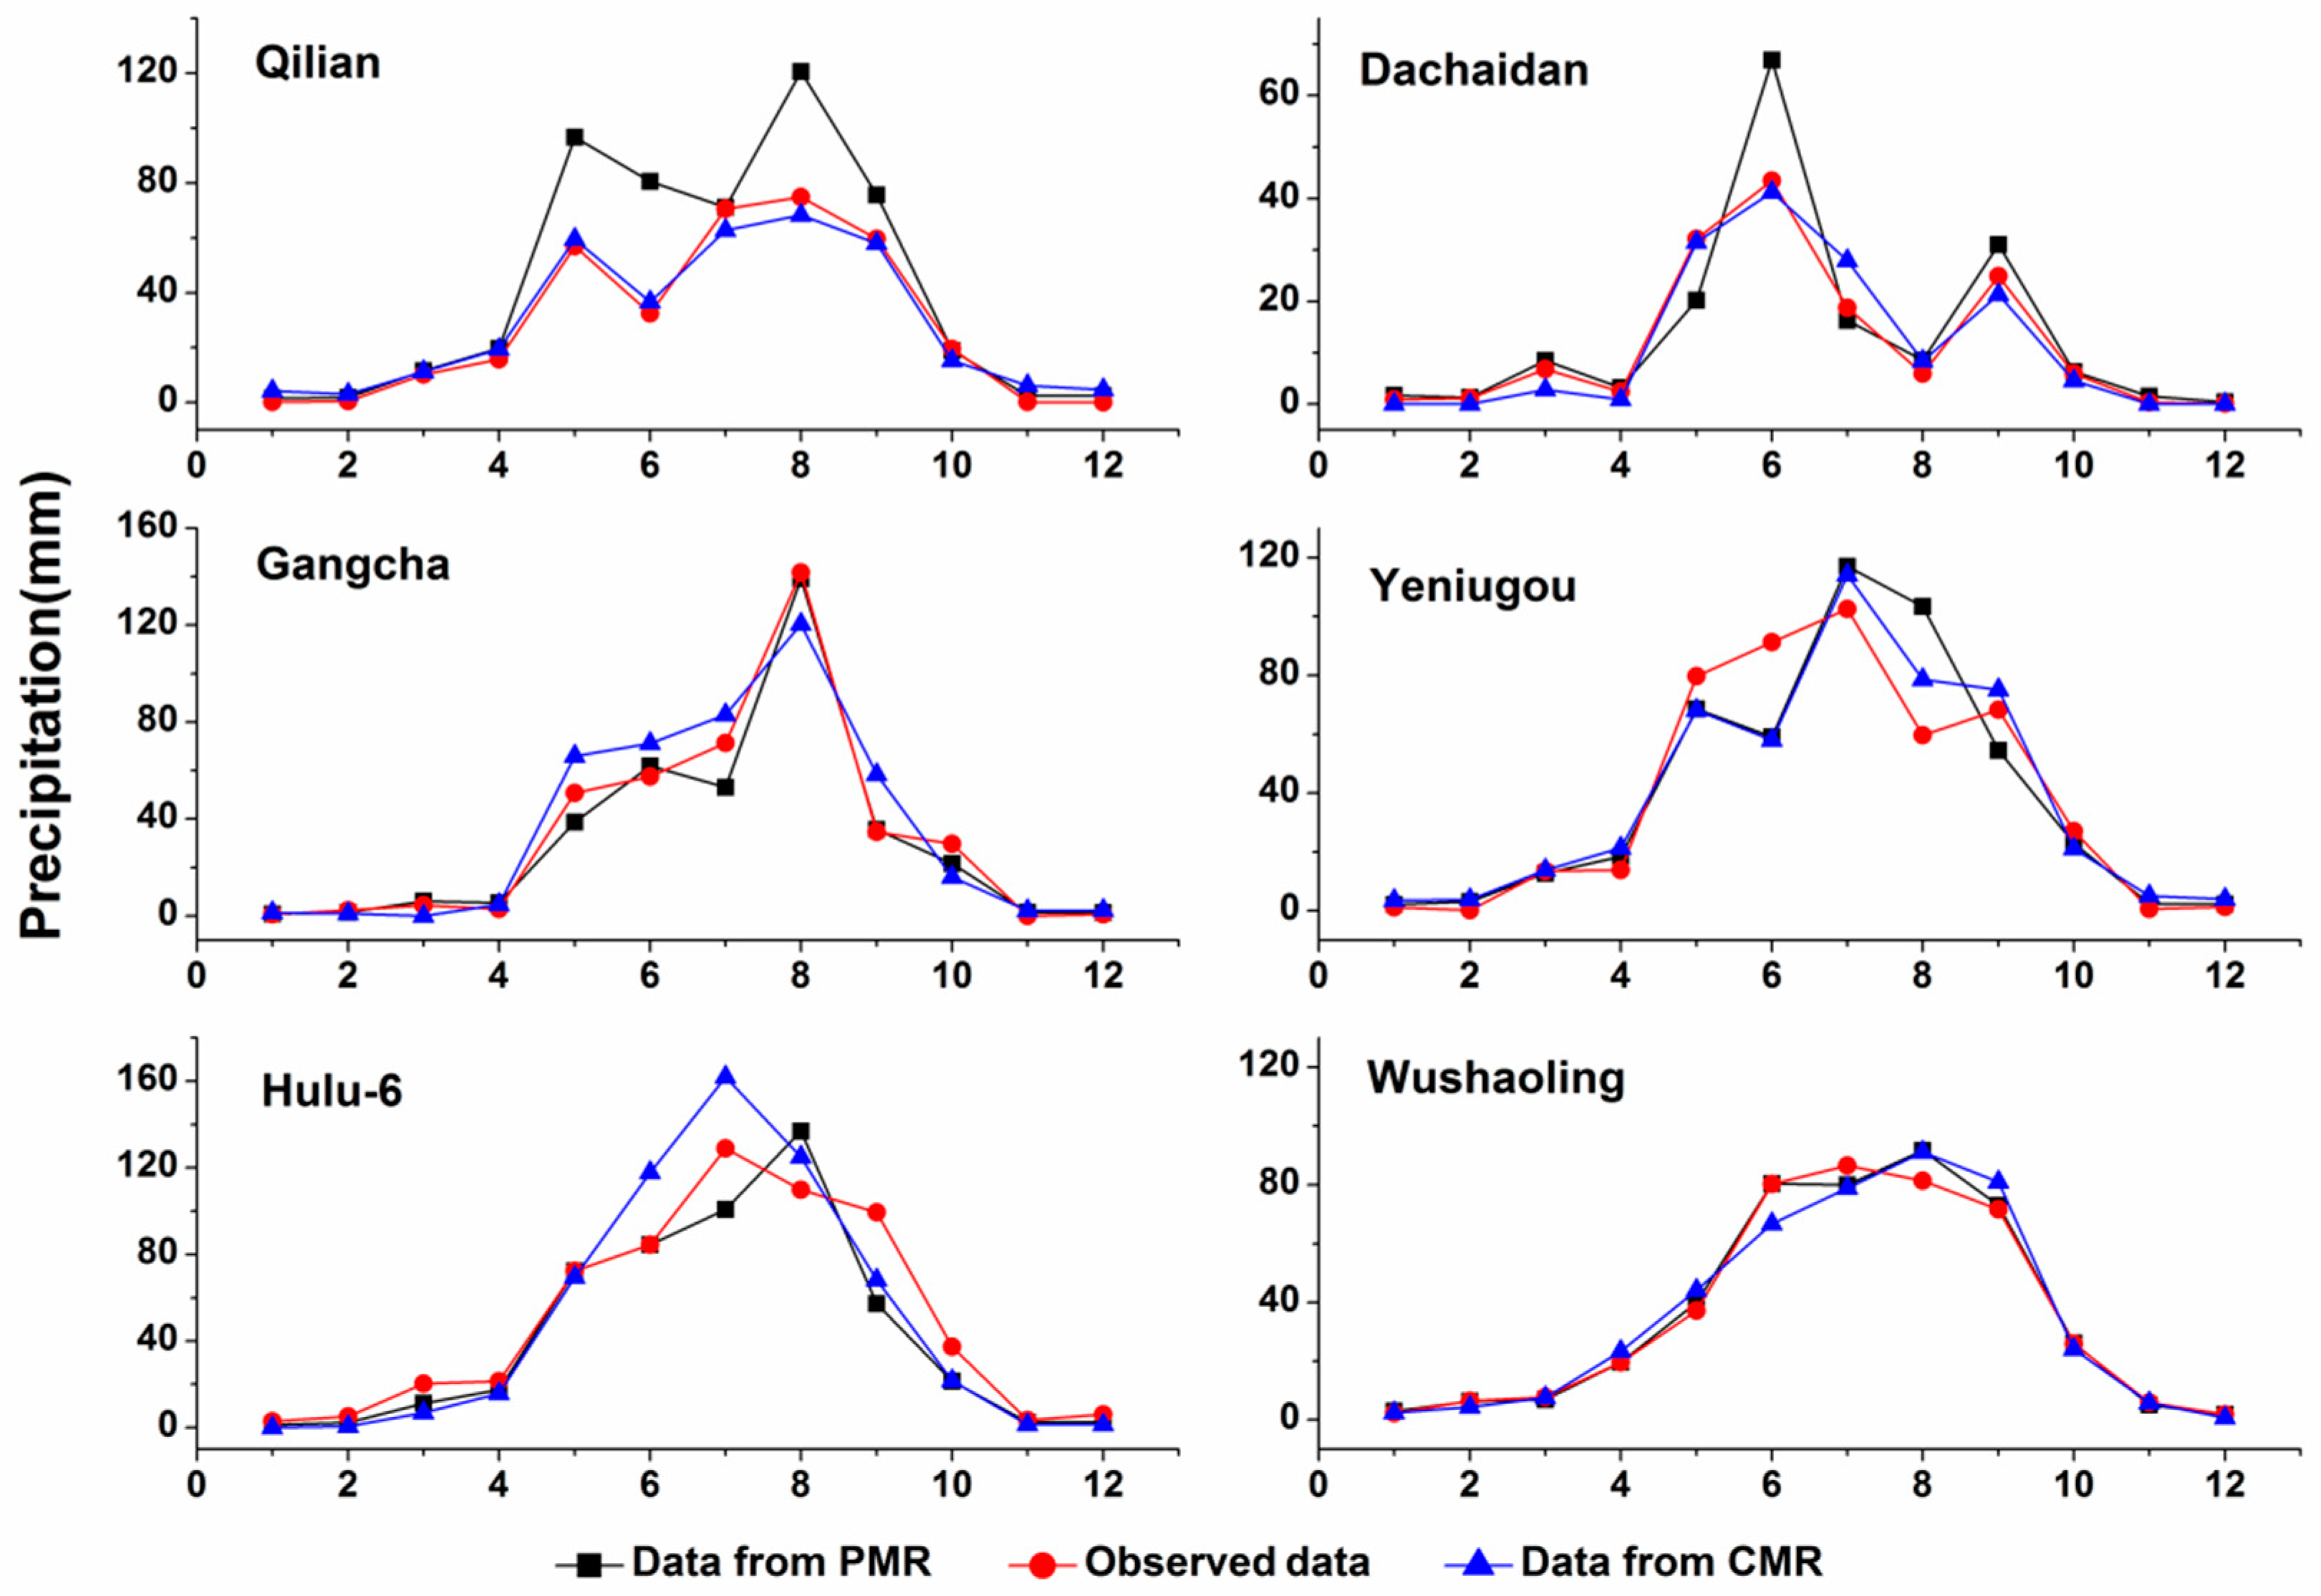
- Monthly precipitation obtained with the CMR was higher than that obtained with the PMR. The average RMSE of the former was 4.93 mm lower each month than that of the latter (11.42 vs. 16.35 mm).
Author Contributions
Funding
Acknowledgments
Conflicts of Interest
References
- Sevruk, B. Regional dependency of precipitation-altitude relationship in the Swiss Alps. In Climatic Change at High Elevation Sites; Springer: Dordrecht, The Netherlands, 1997; pp. 123–137. [Google Scholar]
- Bhatt, B.C.; Nakamura, K. Characteristics of monsoon rainfall around the Himalayas revealed by TRMM precipitation radar. Mon. Weather Rev. 2005, 133, 149–165. [Google Scholar] [CrossRef]
- Daly, C.; Smith, J.W.; Smith, J.I.; McKane, R.B. High-resolution spatial modeling of daily weather elements for a catchment in the Oregon Cascade Mountains, United States. J. Appl. Meteorol. Climatol. 2007, 46, 1565–1586. [Google Scholar] [CrossRef]
- Joyce, R.J.; Janowiak, J.E.; Arkin, P.A.; Xie, P.P. CMORPH: A method that produces global precipitation estimates from passive microwave and infrared data at high spatial and temporal resolution. J. Hydrometeorol. 2004, 5, 487–503. [Google Scholar] [CrossRef]
- Michaelides, S.; Levizzani, V.; Anagnostou, E.; Bauer, P.; Kasparis, T.; Lane, J.E. Precipitation: Measurement, remote sensing, climatology and modeling. Atmos. Res. 2009, 94, 512–533. [Google Scholar] [CrossRef]
- Guo, J.; Liang, X.; Leung, L.R. Impacts of different precipitation data sources on water budgets. J. Hydrol. 2004, 298, 311–334. [Google Scholar] [CrossRef]
- Smith, M.B.; Koren, V.I.; Zhang, Z.; Reed, S.M.; Pan, J.J.; Moreda, F. Runoff response to spatial variability in precipitation: An analysis of observed data. J. Hydrol. 2004, 298, 267–286. [Google Scholar] [CrossRef]
- Immerzeel, W.W.; Rutten, M.M.; Droogers, P. Spatial downscaling of TRMM precipitation using vegetative response on the Iberian Peninsula. Remote Sens. Environ. 2009, 113, 362–370. [Google Scholar] [CrossRef]
- Jia, S.; Zhu, W.; Lű, A.; Yan, T. A statistical spatial downscaling algorithm of TRMM precipitation based on NDVI and DEM in the Qaidam Basin of China. Remote Sens. Environ. 2011, 115, 3069–3079. [Google Scholar] [CrossRef] [Green Version]
- Retalis, A.; Tymvios, F.; Katsanos, D.; Michaelides, S. Downscaling CHIRPS precipitation data: An artificial neural network modelling approach. Int. J. Remote. Sens. 2017, 38, 3943–3959. [Google Scholar] [CrossRef]
- Zhang, T.; Li, B.; Yuan, Y.; Gao, X.; Sun, Q.; Xu, L.; Jiang, Y. Spatial downscaling of TRMM precipitation data considering the impacts of macro-geographical factors and local elevation in the Three-River Headwaters Region. Remote Sens. Environ. 2018, 215, 109–127. [Google Scholar] [CrossRef]
- Alexakis, D.D.; Tsanis, I.K. Comparison of multiple linear regression and artificial neural network models for downscaling TRMM precipitation products using MODIS data. Environ. Earth Sci. 2004, 75, 1077. [Google Scholar] [CrossRef]
- Chen, C.; Zhao, S.; Duan, Z.; Qin, Z. An improved spatial downscaling procedure for TRMM 3B43 precipitation product using geographically weighted regression. IEEE J. Sel. Top. Appl. Earth Obs. Remote Sens. 2015, 8, 4592–4604. [Google Scholar] [CrossRef]
- Xu, S.; Wu, C.; Wang, L.; Gonsamo, A.; Shen, Y.; Niu, Z. A new satellite-based monthly precipitation downscaling algorithm with non-stationary relationship between precipitation and land surface characteristics. Remote Sens. Environ. 2015, 162, 119–140. [Google Scholar] [CrossRef]
- Zhan, C.; Han, J.; Hu, S.; Liu, L.; Dong, Y. Spatial Downscaling of GPM Annual and Monthly Precipitation Using Regression-Based Algorithms in a Mountainous Area. Adv. Meteorol. 2018, 2018, 1–13. [Google Scholar] [CrossRef]
- Jing, W.; Yang, Y.; Yue, X.; Zhao, X. A spatial downscaling algorithm for satellite-based precipitation over the Tibetan plateau based on NDVI, DEM, and land surface temperature. Remote Sens. 2016, 8, 655. [Google Scholar] [CrossRef]
- Ma, Z.; Shi, Z.; Zhou, Y.; Xu, J.; Yu, W.; Yang, Y. A spatial data mining algorithm for downscaling TMPA 3B43 V7 data over the Qinghai–Tibet Plateau with the effects of systematic anomalies removed. Remote Sens. Environ. 2017, 200, 378–395. [Google Scholar] [CrossRef]
- Chen, Y.; Huang, J.; Sheng, S.; Mansaray, L.R.; Liu, Z.; Wu, H.; Wang, X. A new downscaling-integration framework for high-resolution monthly precipitation estimates: Combining rain gauge observations, satellite-derived precipitation data and geographical ancillary data. Remote Sens Environ. 2018, 214, 154–172. [Google Scholar] [CrossRef]
- Liu, X.; Zhang, M.; Wang, S.; Wang, J.; Zhao, P.; Zhou, P. Assessment of diurnal variation of summer precipitation over the Qilian Mountains based on an hourly merged dataset from 2008 to 2014. J. Geogr. Sci. 2017, 27, 326–336. [Google Scholar] [CrossRef]
- Chen, H.; Li, Y.; Yang, Z.; Shen, Z. Research on the Relationship Between Terrain Factors and Precipitation. Res. Soil Water Conserv. 2007, 14, 119–122. [Google Scholar]
- Duan, L.; Fan, K.; Li, W.; Liu, T. Spatial downscaling algorithm of TRMM precipitation based on multiple high-resolution satellite data for Inner Mongolia, China. Theor. Appl. Climatol. 2007, 135, 15–59. [Google Scholar] [CrossRef]
- Liu, J.; Zhang, W.; Nie, N. Spatial Downscaling of TRMM Precipitation Data Using an Optimal Subset Regression Model with NDVI and Terrain Factors in the Yarlung Zangbo River Basin, China. Adv. Meteorol. 2018, 2018, 1–13. [Google Scholar] [CrossRef] [Green Version]
- Hu, G.; Jin, X.; Wang, L.; Cai, X. The relationship between vegetation growth and the combination of water and heat in the Qilian Mountains. J. Arid Land Resour. Environ. 2009, 23, 17–20. [Google Scholar]
- Wang, J.; Chang, X.; Ge, S.; Miao, Y.; Chang, Z.; Zhang, H. Vertical distribution of vegetation and water and heat conditions of Qilian Mountains (Northern slope). J. Northw. For. Univ. 2001, 16, 1–3. [Google Scholar]
- Duan, Z.; Bastiaanssen, W.G.M. First results from Version 7 TRMM 3B43 precipitation product in combination with a new downscaling–calibration procedure. Remote Sens. Environ. 2013, 131, 1–13. [Google Scholar] [CrossRef]
- McVicar, T.R.; Körner, C. On the use of elevation, altitude, and height in the ecological and climatological literature. Oecologia 2013, 171, 335–337. [Google Scholar] [CrossRef]
- Zhang, Q.; Yu, Y.X.; Zhang, J. Characteristics of water cycle in the Qilian Mountains and the oases in Hexi inland river basins. J. Glaciol. Geocryol. 2008, 30, 907–913. [Google Scholar]
- Xu, J.J.; Wang, K.L.; Jiang, H.; Li, Z.G.; Sun, J.; Luo, X.P.; Zhu, Q.L. A numerical simulation of the effects of Westerly and Monsoon on precipitation in the Heihe River basin. J. Glaciol. Geocryol. 2010, 32, 489–496. [Google Scholar]
- Chen, R.; Han, C.; Liu, J.; Yang, Y.; Liu, Z.; Wang, L.; Kang, E. Maximum precipitation altitude on the northern flank of the Qilian Mountains, northwest China. Hydrol. Res. 2018, 49, 1696–1710. [Google Scholar] [CrossRef]
- Li, Y. Study and Analysis of Climate Characteristics of Precipitation and Its Causes over Qilian Mountains. Ph.D. Thesis, Lanzhou University, Lanzhou, China, 2008. [Google Scholar]
- Xu, J.; Zhang, B.; Zhu, Y.; Sun, R. Distribution and geographical analysis of altitudinal belts in the Altun Qilian Mountains. Geogr. Res. 2006, 25, 977–985. [Google Scholar]
- Tian, Q.; He, Z.; Xiao, S.; Du, J.; Peng, X.; Chen, L.; Lin, P.; Zhu, X.; Ding, A. Growing Season Stem Water Status Assessment of Qinghai Spruce through the Sap Flow and Stem Radial Variations in the Qilian Mountains of China. Forests 2018, 9, 2. [Google Scholar] [CrossRef]
- Jain, Y.K.; Bhandare, S.K. Min max normalization based data perturbation method for privacy protection. Int. J. Comput. Commun. Technol. 2011, 2, 45–50. [Google Scholar]
- Holben, B.N. Characteristics of maximum-value composite images from temporal AVHRR data. Int. J. Remote Sens. 1986, 7, 1417–1434. [Google Scholar] [CrossRef] [Green Version]
- Agam, N.; Kustas, W.P.; Anderson, M.C.; Li, F.; Neale, C.M.U. A vegetation index based technique for spatial sharpening of thermal imagery. Remote Sens. Environ. 2007, 107, 545–558. [Google Scholar] [CrossRef]
- Lin, Z. Orographic Precipitation Climatology; Science Press: Beijing, China, 1995; pp. 6–45. [Google Scholar]
- Ichii, K.; Kawabata, A.; Yamaguchi, Y. Global correlation analysis for NDVI and climatic variables and NDVI trends: 1982–1990. Int. J. Remote Sens. 2002, 23, 3873–3878. [Google Scholar] [CrossRef]
- Sun, P.S.; Liu, S.R.; Jiang, H.; Lu, Y.L.; Liu, J.T.; Lin, Y.; Liu, X. Hydrologic effects of NDVI time series in a context of climatic variability in an upstream catchment of the Minjiang River. J. Am. Water Resour. Assoc. 2008, 44, 1132–1143. [Google Scholar] [CrossRef]
- Wang, N.; He, J.; Jiang, X.; Song, G.; Pu, J.; Wu, X.; Chen, L. Study on the zone of maximum precipitation in the north slope of the central Qilian Mountains. J. Glaciol. Geocryol. 2009, 31, 395–403. [Google Scholar]
- Wang, L.; Chen, R.; Song, Y.; Yang, Y.; Liu, J.; Han, C.; Liu, Z. Precipitation–altitude relationships on different timescales and at different precipitation magnitudes in the Qilian Mountains. Theor. Appl. Climatol. 2018, 134, 875–884. [Google Scholar] [CrossRef]
- Sun, W.; Qin, X.; Du, W.; Liu, W.; Liu, Y.; Zhang, T.; Xu, Y.; Zhao, Q.; Wu, J.; Ren, J. Ablation modeling and surface energy budget in the ablation zone of Laohugou glacier No. 12, western Qilian mountains, China. Ann. Glaciol. 2014, 55, 111–120. [Google Scholar] [CrossRef] [Green Version]
- Guo, S.; Chen, R.; Liu, G.; Han, C.; Song, Y.; Liu, J.; Yang, Y.; Liu, Z.; Wang, X.; Liu, X.; et al. Simple parameterization of aerodynamic roughness lengths and the turbulent heat fluxes at the top of midlatitude August-one glacier, Qilian Mountains, China. J. Geophys. Res. Atmos. 2018, 123, 12–066. [Google Scholar] [CrossRef]
- Fan, L.; Fu, C.; Chen, D. Review on creating future climate change scenarios by statistical downscaling techniques. Adv. Earth Sci. 2015, 20, 320–329. [Google Scholar]
- Ren, L. Downscaling Research on Multi-source Remote Sensing Precipitation Data in Qinba Mountainous Area of Shaanxi Province; Shaanxi Normal University: Shaanxi, China, 2018. [Google Scholar]
- Dong, G.; Fan, D.; Yang, T.; Xu, H.; Zhou, J.; Dang, S.; Cheng, C. Analysis on the Applicability of GPM and TRMM Precipitation Data in the Yellow River Basin. Res Soil Water Conserv. 2018, 25, 81–87. [Google Scholar]
- Ceccherini, G.; Ameztoy, I.; Hernández, C.; Moreno, C. High-resolution precipitation datasets in South America and West Africa based on satellite-derived rainfall, enhanced vegetation index and digital elevation model. Remote Sens. 2015, 7, 6454–6488. [Google Scholar] [CrossRef]
- Zhang, Q.; Shi, P.; Singh, V.P.; Fan, K.; Huang, J. Spatial downscaling of TRMM-based precipitation data using vegetative response in Xinjiang, China. Int. J. Climatol. 2017, 37, 3895–3909. [Google Scholar] [CrossRef]
- Ma, Z.; Zhou, Y.; Hu, B.; Liang, Z.; Shi, Z. Downscaling annual precipitation with TMPA and land surface characteristics in China. Int. J. Climatol. 2017, 37, 5107–5119. [Google Scholar] [CrossRef]
- Sharifi, E.; Saghafian, B.; Steinacker, R. Downscaling Satellite Precipitation Estimates with Multiple Linear Regression, Artificial Neural Networks and Spline Interpolation Techniques. J. Geophys. Res. Atmos. 2019, 124, 789–805. [Google Scholar] [CrossRef]
- Shi, Y.; Song, L.; Xia, Z.; Lin, Y.; Myneni, R.; Choi, S.; Wang, L.; Ni, X.; Lao, C.; Yang, F. Mapping annual precipitation across mainland China in the period 2001–2010 from TRMM3B43 product using spatial downscaling approach. Remote Sens. 2015, 7, 5849–5878. [Google Scholar] [CrossRef]
- Zhang, Y.; Li, Y.; Ji, X.; Luo, X.; Li, X. Fine-Resolution Precipitation Mapping in a Mountainous Watershed: Geostatistical Downscaling of TRMM Products Based on Environmental Variables. Remote Sens. 2018, 10, 119. [Google Scholar] [CrossRef]
- Xu, X.; Lin, Z.; Xue, F.; Zeng, Q. Correlation analysis between meteorological factors and the ratio of vegetation cover. Acta Ecol. Sin. 2003, 23, 221–230. [Google Scholar]
- Chuai, X.W.; Huang, X.J.; Wang, W.J.; Bao, G. NDVI, temperature and precipitation changes and their relationships with different vegetation types during 1998–2007 in Inner Mongolia, China. Int. J. Climatol. 2013, 33, 1696–1706. [Google Scholar] [CrossRef]
- Jing, W.; Yang, Y.; Yue, X.; Zhao, X. A comparison of different regression algorithms for downscaling monthly satellite-based precipitation over North China. Remote Sens. 2016, 8, 835. [Google Scholar] [CrossRef]
- Hou, A.Y.; Kakar, R.K.; Neeck, S.; Azarbarzin, A.A.; Kummerow, C.D.; Kojima, M.; Oki, R.; Nakamura, K.; Iguchi, T. The global precipitation measurement mission. Bull. Am. Meteorol. Soc. 2004, 95, 701–722. [Google Scholar] [CrossRef]


| Station Name | Longitude | Latitude | Elevation (m) | Land Cover | Mean Annual Precipitation (mm) | Mean Annual Temperature (°C) |
|---|---|---|---|---|---|---|
| Qilian | 100.25 | 38.18 | 2787.4 | Steppe and forests | 411.5 | 1.18 |
| Wushaoling | 102.87 | 37.20 | 3045.1 | Steppe and Forests | 402.7 | 0.37 |
| Dachaidan | 95.37 | 37.85 | 3173.2 | Bare soil | 89.4 | 2.07 |
| Gangcha | 100.13 | 37.33 | 3301.5 | Steppe | 388.4 | 0.04 |
| Yeniugou | 99.58 | 38.42 | 3320.0 | Steppe | 420.6 | −0.39 |
| Hulu-6 | 99.88 | 38.22 | 4484.0 | Moraine-talus | 762.6 | −7.2 |
| 2006 | 2007 | 2008 | 2009 | 2010 | 2011 | 2012 | 2013 | 2014 | 2015 | ||
|---|---|---|---|---|---|---|---|---|---|---|---|
| Original TRMM | RMSE | 176.61 | 191.68 | 164.59 | 144.59 | 128.57 | 147.63 | 153.11 | 115.87 | 241.16 | 176.01 |
| B | 0.06 | −0.07 | 0.10 | 0.14 | −0.08 | 0.11 | 0.08 | −0.06 | 0.41 | 0.23 | |
| NSE | 0.01 | −0.29 | 0.41 | 0.42 | 0.30 | 0.42 | 0.37 | 0.69 | 0.05 | 0.27 | |
| R2 | 0.30 | 0.26 | 0.48 | 0.51 | 0.30 | 0.44 | 0.40 | 0.76 | 0.46 | 0.46 | |
| FDAP | RMSE | 140.75 | 141.11 | 146.52 | 133.99 | 122.73 | 132.00 | 146.82 | 123.58 | 213.76 | 172.76 |
| B | 0.05 | −0.08 | 0.13 | 0.17 | −0.03 | 0.15 | 0.10 | 0.16 | 0.38 | 0.21 | |
| NSE | 0.37 | 0.30 | 0.54 | 0.50 | 0.36 | 0.54 | 0.42 | 0.65 | 0.25 | 0.29 | |
| R2 | 0.44 | 0.45 | 0.61 | 0.66 | 0.43 | 0.43 | 0.47 | 0.78 | 0.68 | 0.46 | |
| CFDAP | RMSE | 40.71 | 57.72 | 92.43 | 71.64 | 90.32 | 59.16 | 68.24 | 64.59 | 164.75 | 99.60 |
| B | 0.01 | −0.01 | 0.13 | 0.09 | −0.03 | 0.04 | 0.05 | −0.02 | 0.30 | 0.14 | |
| NSE | 0.95 | 0.88 | 0.82 | 0.86 | 0.65 | 0.91 | 0.87 | 0.90 | 0.55 | 0.77 | |
| R2 | 0.97 | 0.89 | 0.96 | 0.94 | 0.97 | 0.97 | 0.94 | 0.97 | 0.95 | 0.91 |
| 2006 | 2007 | 2008 | 2009 | 2010 | 2011 | 2012 | 2013 | 2014 | 2015 | ||
|---|---|---|---|---|---|---|---|---|---|---|---|
| Previous method | RMSE | 130.81 | 153.58 | 147.69 | 121.88 | 100.37 | 138.82 | 152.82 | 144.56 | 253.06 | 266.73 |
| B | 0 | 0.2 | 0.03 | 0.01 | 0.14 | −0.09 | −0.14 | −0.13 | −0.24 | −0.29 | |
| NSE | 0.52 | 0.19 | 0.5 | 0.58 | 0.49 | 0.5 | 0.31 | 0.45 | 0.02 | −0.16 | |
| R2 | 0.52 | 0.48 | 0.5 | 0.59 | 0.65 | 0.56 | 0.5 | 0.61 | 0.4 | 0.36 | |
| Improved methods FDAP | RMSE | 140.75 | 141.11 | 146.52 | 133.99 | 122.73 | 132 | 146.82 | 123.58 | 213.76 | 172.76 |
| B | 0.05 | −0.08 | 0.13 | 0.17 | −0.03 | 0.15 | 0.1 | 0.16 | 0.38 | 0.21 | |
| NSE | 0.37 | 0.3 | 0.54 | 0.5 | 0.36 | 0.54 | 0.42 | 0.65 | 0.25 | 0.29 | |
| R2 | 0.44 | 0.45 | 0.61 | 0.66 | 0.43 | 0.43 | 0.47 | 0.78 | 0.68 | 0.46 | |
| Improved methods CFDAP | B | 0.01 | −0.01 | 0.13 | 0.09 | −0.03 | 0.04 | 0.05 | −0.02 | 0.3 | 0.14 |
| RMSE | 40.71 | 57.72 | 92.43 | 71.64 | 90.32 | 59.16 | 68.24 | 64.59 | 164.75 | 99.6 | |
| NSE | 0.95 | 0.88 | 0.82 | 0.86 | 0.65 | 0.91 | 0.87 | 0.9 | 0.55 | 0.77 | |
| R2 | 0.97 | 0.89 | 0.96 | 0.94 | 0.97 | 0.97 | 0.94 | 0.97 | 0.95 | 0.91 |
| Jan. | Feb. | Mar. | Apr. | May. | Jun. | Jul. | Aug. | Sept. | Oct. | Nov. | Dec. | ||
|---|---|---|---|---|---|---|---|---|---|---|---|---|---|
| Monthly data by PMR | B | 2.00 | 0.54 | 0.64 | 0.31 | 0.24 | 0.07 | 0.09 | 0.11 | 0.22 | 0.12 | 1.50 | 1.74 |
| RMSE | 4.34 | 4.94 | 8.01 | 13.26 | 23.26 | 28.98 | 31.07 | 32.48 | 26.06 | 11.36 | 7.53 | 4.98 | |
| NSE | −0.17 | −0.09 | −0.14 | 0.09 | 0.17 | 0.16 | 0.41 | 0.50 | 0.32 | 0.75 | −0.12 | −0.07 | |
| Monthly data by CMR | B | 0.28 | 0.19 | 0.20 | 0.00 | 0.15 | 0.00 | −0.10 | 0.02 | 0.02 | 0.08 | 0.24 | 0.12 |
| RMSE | 4.54 | 4.12 | 5.16 | 8.70 | 12.85 | 13.56 | 25.84 | 30.44 | 14.55 | 6.80 | 6.28 | 4.21 | |
| NSE | −0.24 | 0.23 | 0.44 | 0.17 | 0.66 | 0.75 | 0.39 | 0.55 | 0.77 | 0.90 | 0.14 | 0.21 |
© 2019 by the authors. Licensee MDPI, Basel, Switzerland. This article is an open access article distributed under the terms and conditions of the Creative Commons Attribution (CC BY) license (http://creativecommons.org/licenses/by/4.0/).
Share and Cite
Wang, L.; Chen, R.; Han, C.; Yang, Y.; Liu, J.; Liu, Z.; Wang, X.; Liu, G.; Guo, S. An Improved Spatial–Temporal Downscaling Method for TRMM Precipitation Datasets in Alpine Regions: A Case Study in Northwestern China’s Qilian Mountains. Remote Sens. 2019, 11, 870. https://0-doi-org.brum.beds.ac.uk/10.3390/rs11070870
Wang L, Chen R, Han C, Yang Y, Liu J, Liu Z, Wang X, Liu G, Guo S. An Improved Spatial–Temporal Downscaling Method for TRMM Precipitation Datasets in Alpine Regions: A Case Study in Northwestern China’s Qilian Mountains. Remote Sensing. 2019; 11(7):870. https://0-doi-org.brum.beds.ac.uk/10.3390/rs11070870
Chicago/Turabian StyleWang, Lei, Rensheng Chen, Chuntan Han, Yong Yang, Junfeng Liu, Zhangwen Liu, Xiqiang Wang, Guohua Liu, and Shuhai Guo. 2019. "An Improved Spatial–Temporal Downscaling Method for TRMM Precipitation Datasets in Alpine Regions: A Case Study in Northwestern China’s Qilian Mountains" Remote Sensing 11, no. 7: 870. https://0-doi-org.brum.beds.ac.uk/10.3390/rs11070870