Ten Priority Science Gaps in Assessing Climate Data Record Quality

 ,
,
Abstract
:1. Introduction
2. User Requirements and QA Information
2.1. User Survey and Results
- There is a strong need for consolidated, short, simple guidance documents about the products, their quality metrics and how to interpret the quality metrics;
- All documentation should be easily accessible and frequently updated to contain the most current information;
- Traceability chains, developed as part of the QA4ECV project [3], were highly regarded by all users because they enable a quick and relatively complete understanding of the product algorithm;
- Evidence that the product has been independently validated is key criteria for most data users;
- Inter-comparison results are well used and considered very important in understanding the advantages and disadvantages of the data products relative to each other;
- Access to maps and statistics at in situ measurement sites are considered very useful since access to this information can help users identify causes of discrepancies in data and understand typical seasonality in a location;
- Most data users use pixel level quality flag information or would use them if provided;
- Known issues or problems registers for data products were requested to allow users to understand the consistency of the product over time; and
- Use cases and reasons for data products being produced are highly desired.
2.2. ECV Product Inventory
3. EQC Framework Development
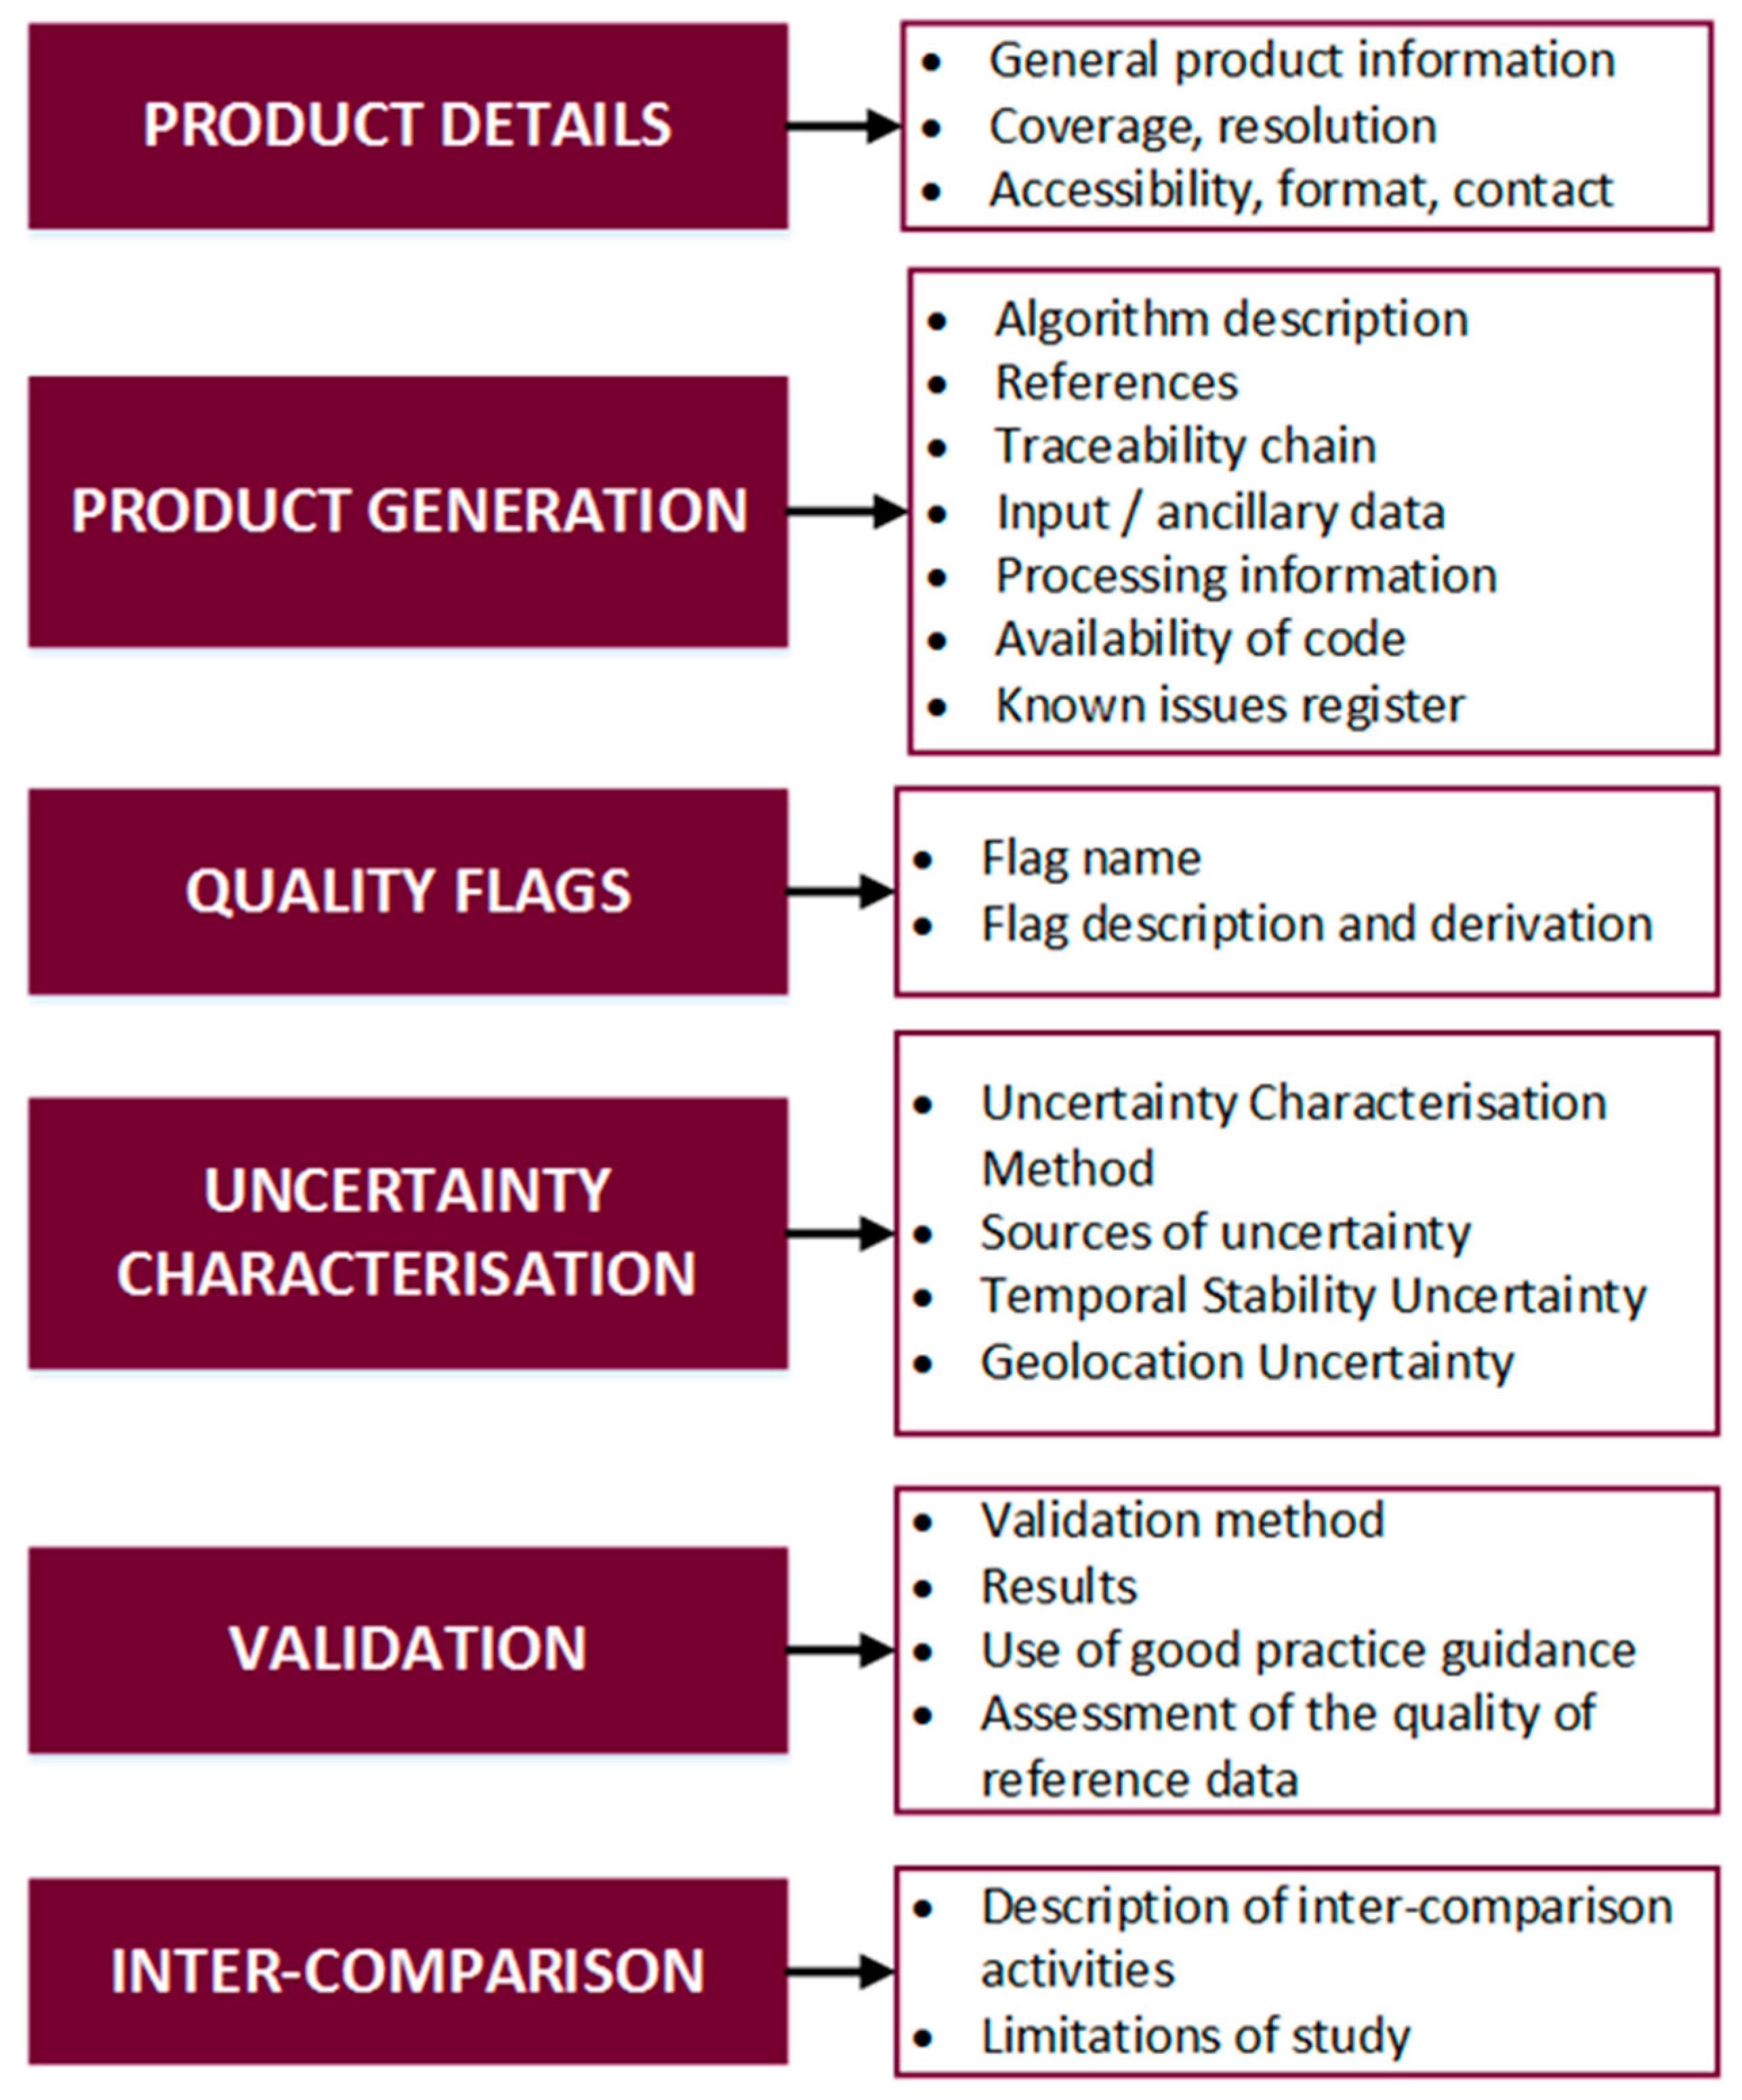
3.1. QAT Development
- Product Details;
- Product Generation;
- Quality Flags;
- Uncertainty Characterisation;
- Validation; and
- Inter-Comparison.
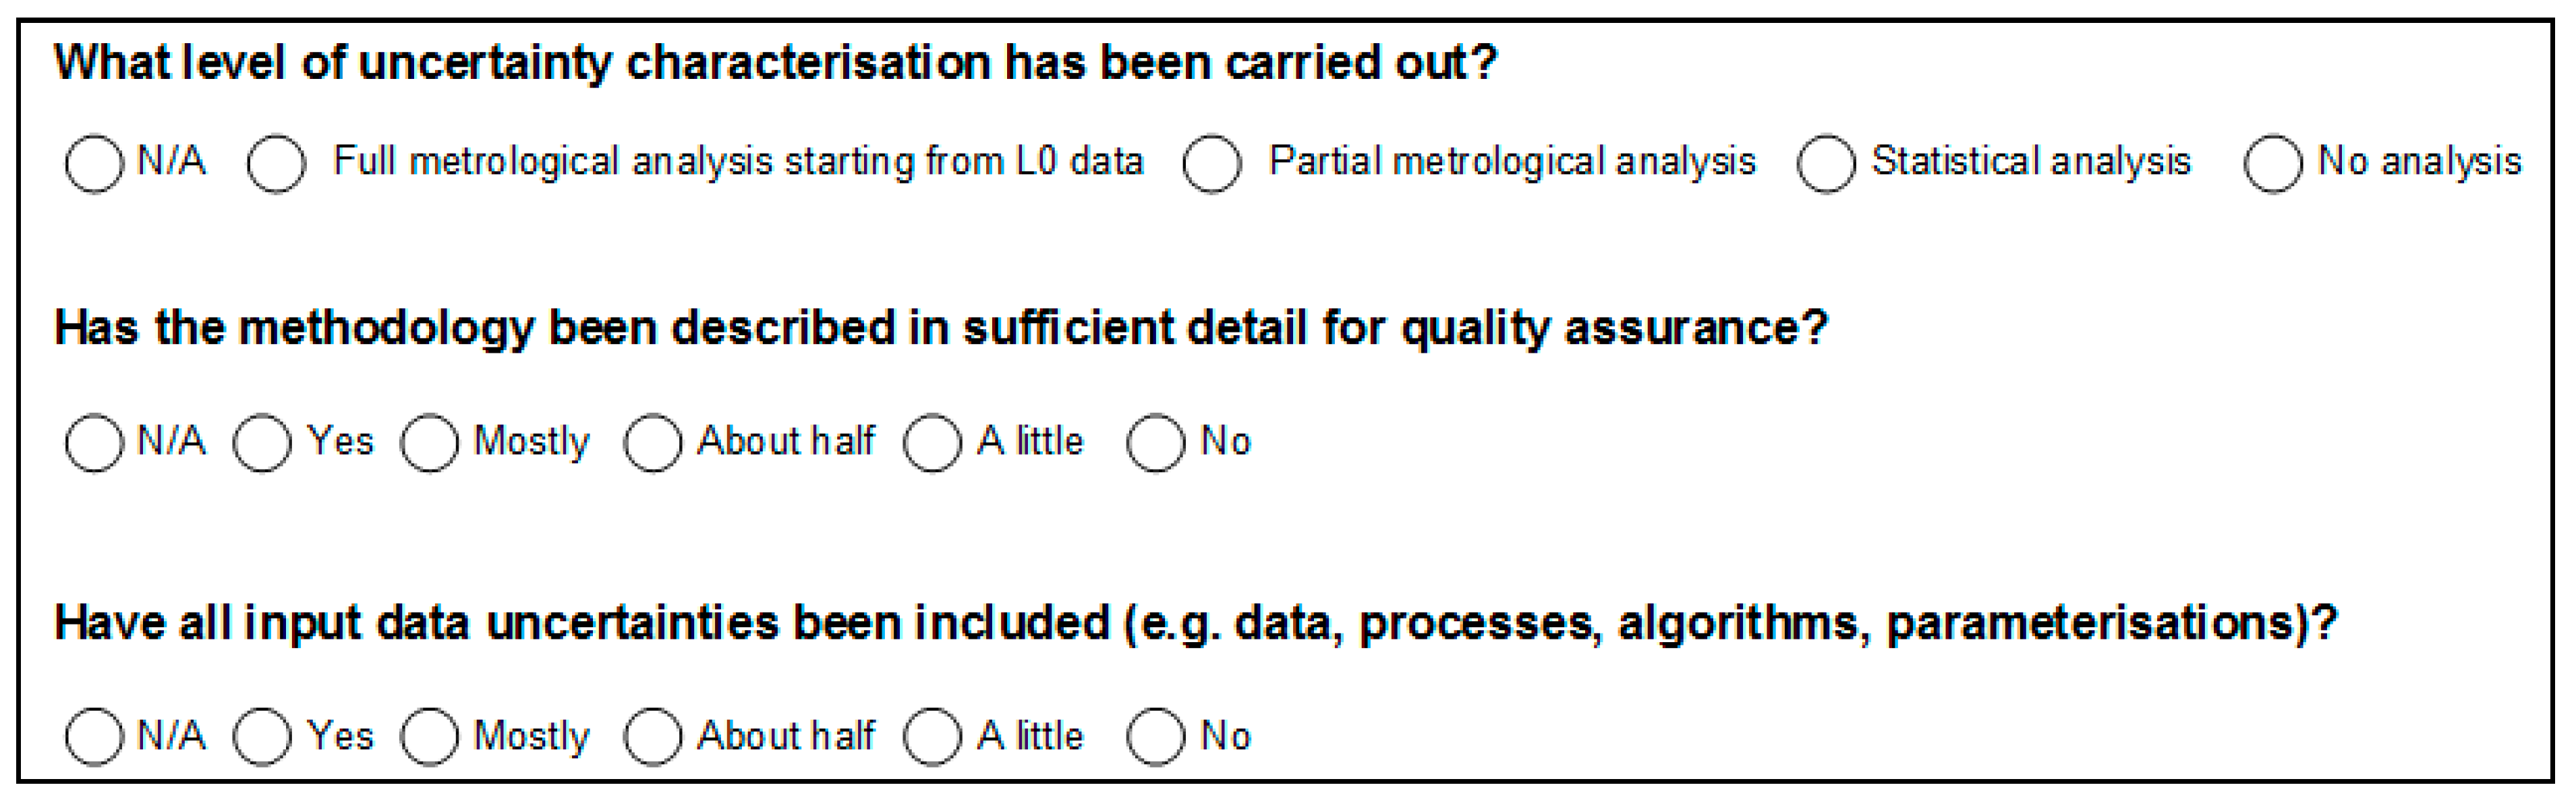
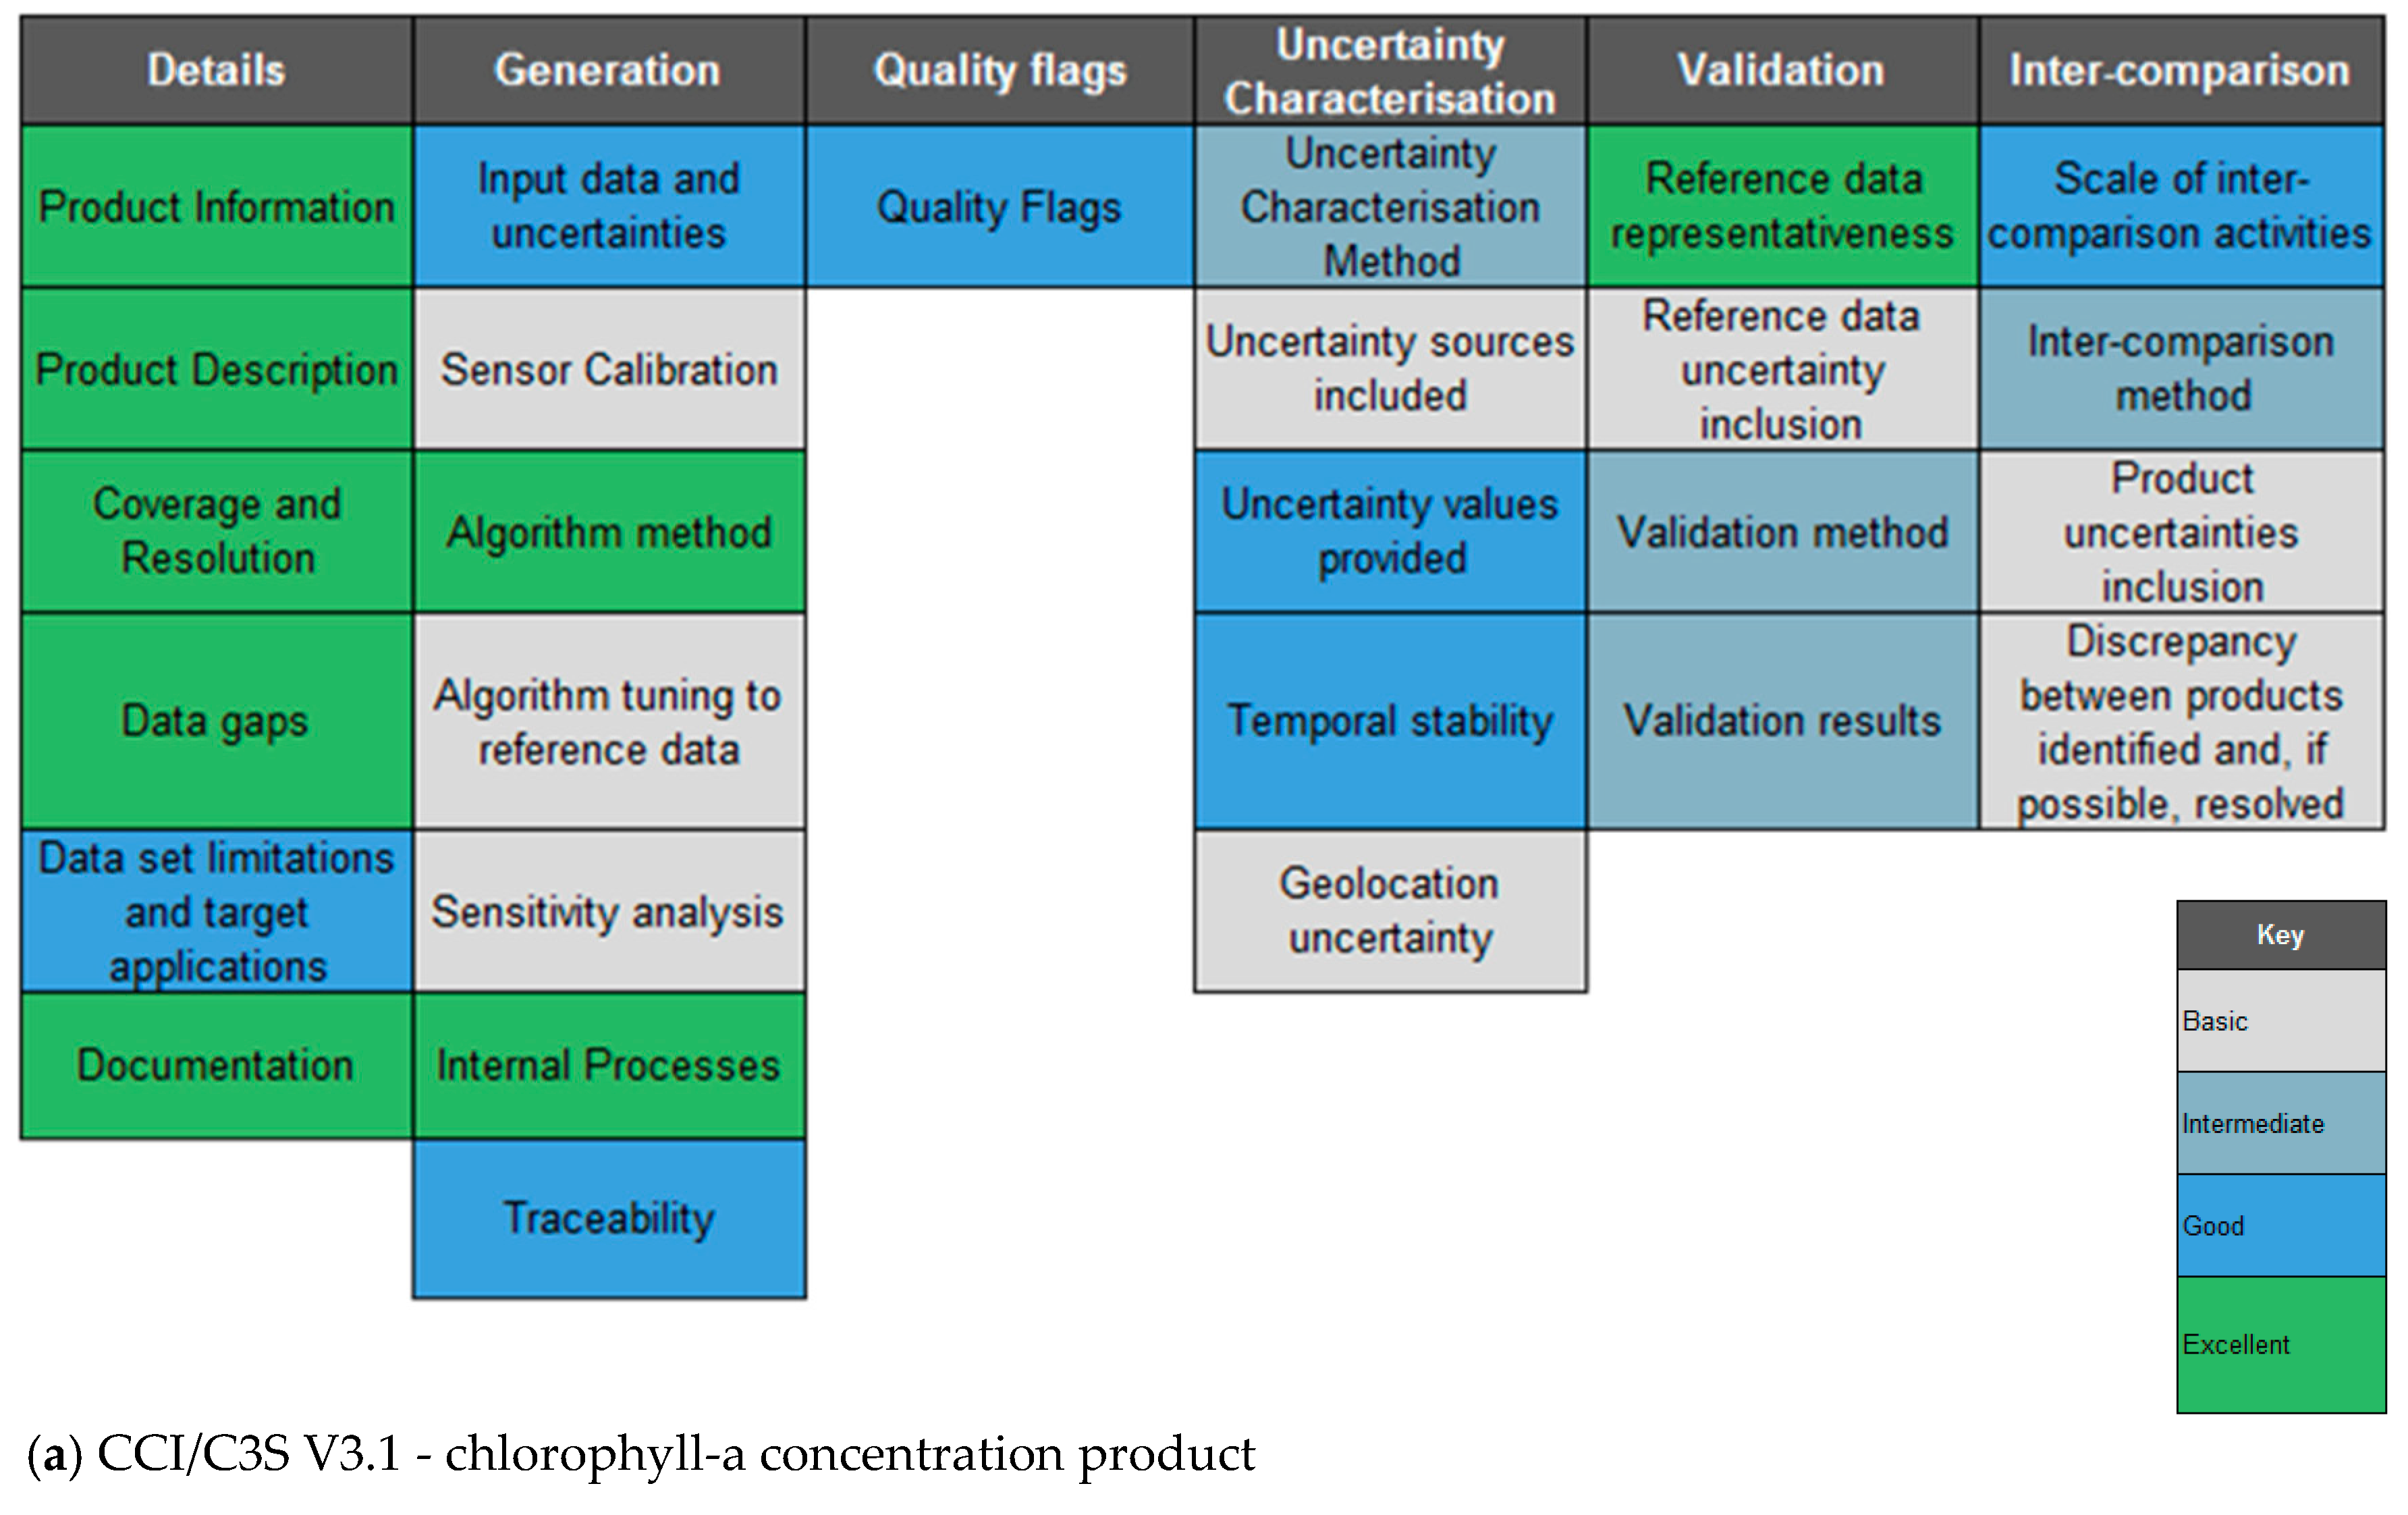
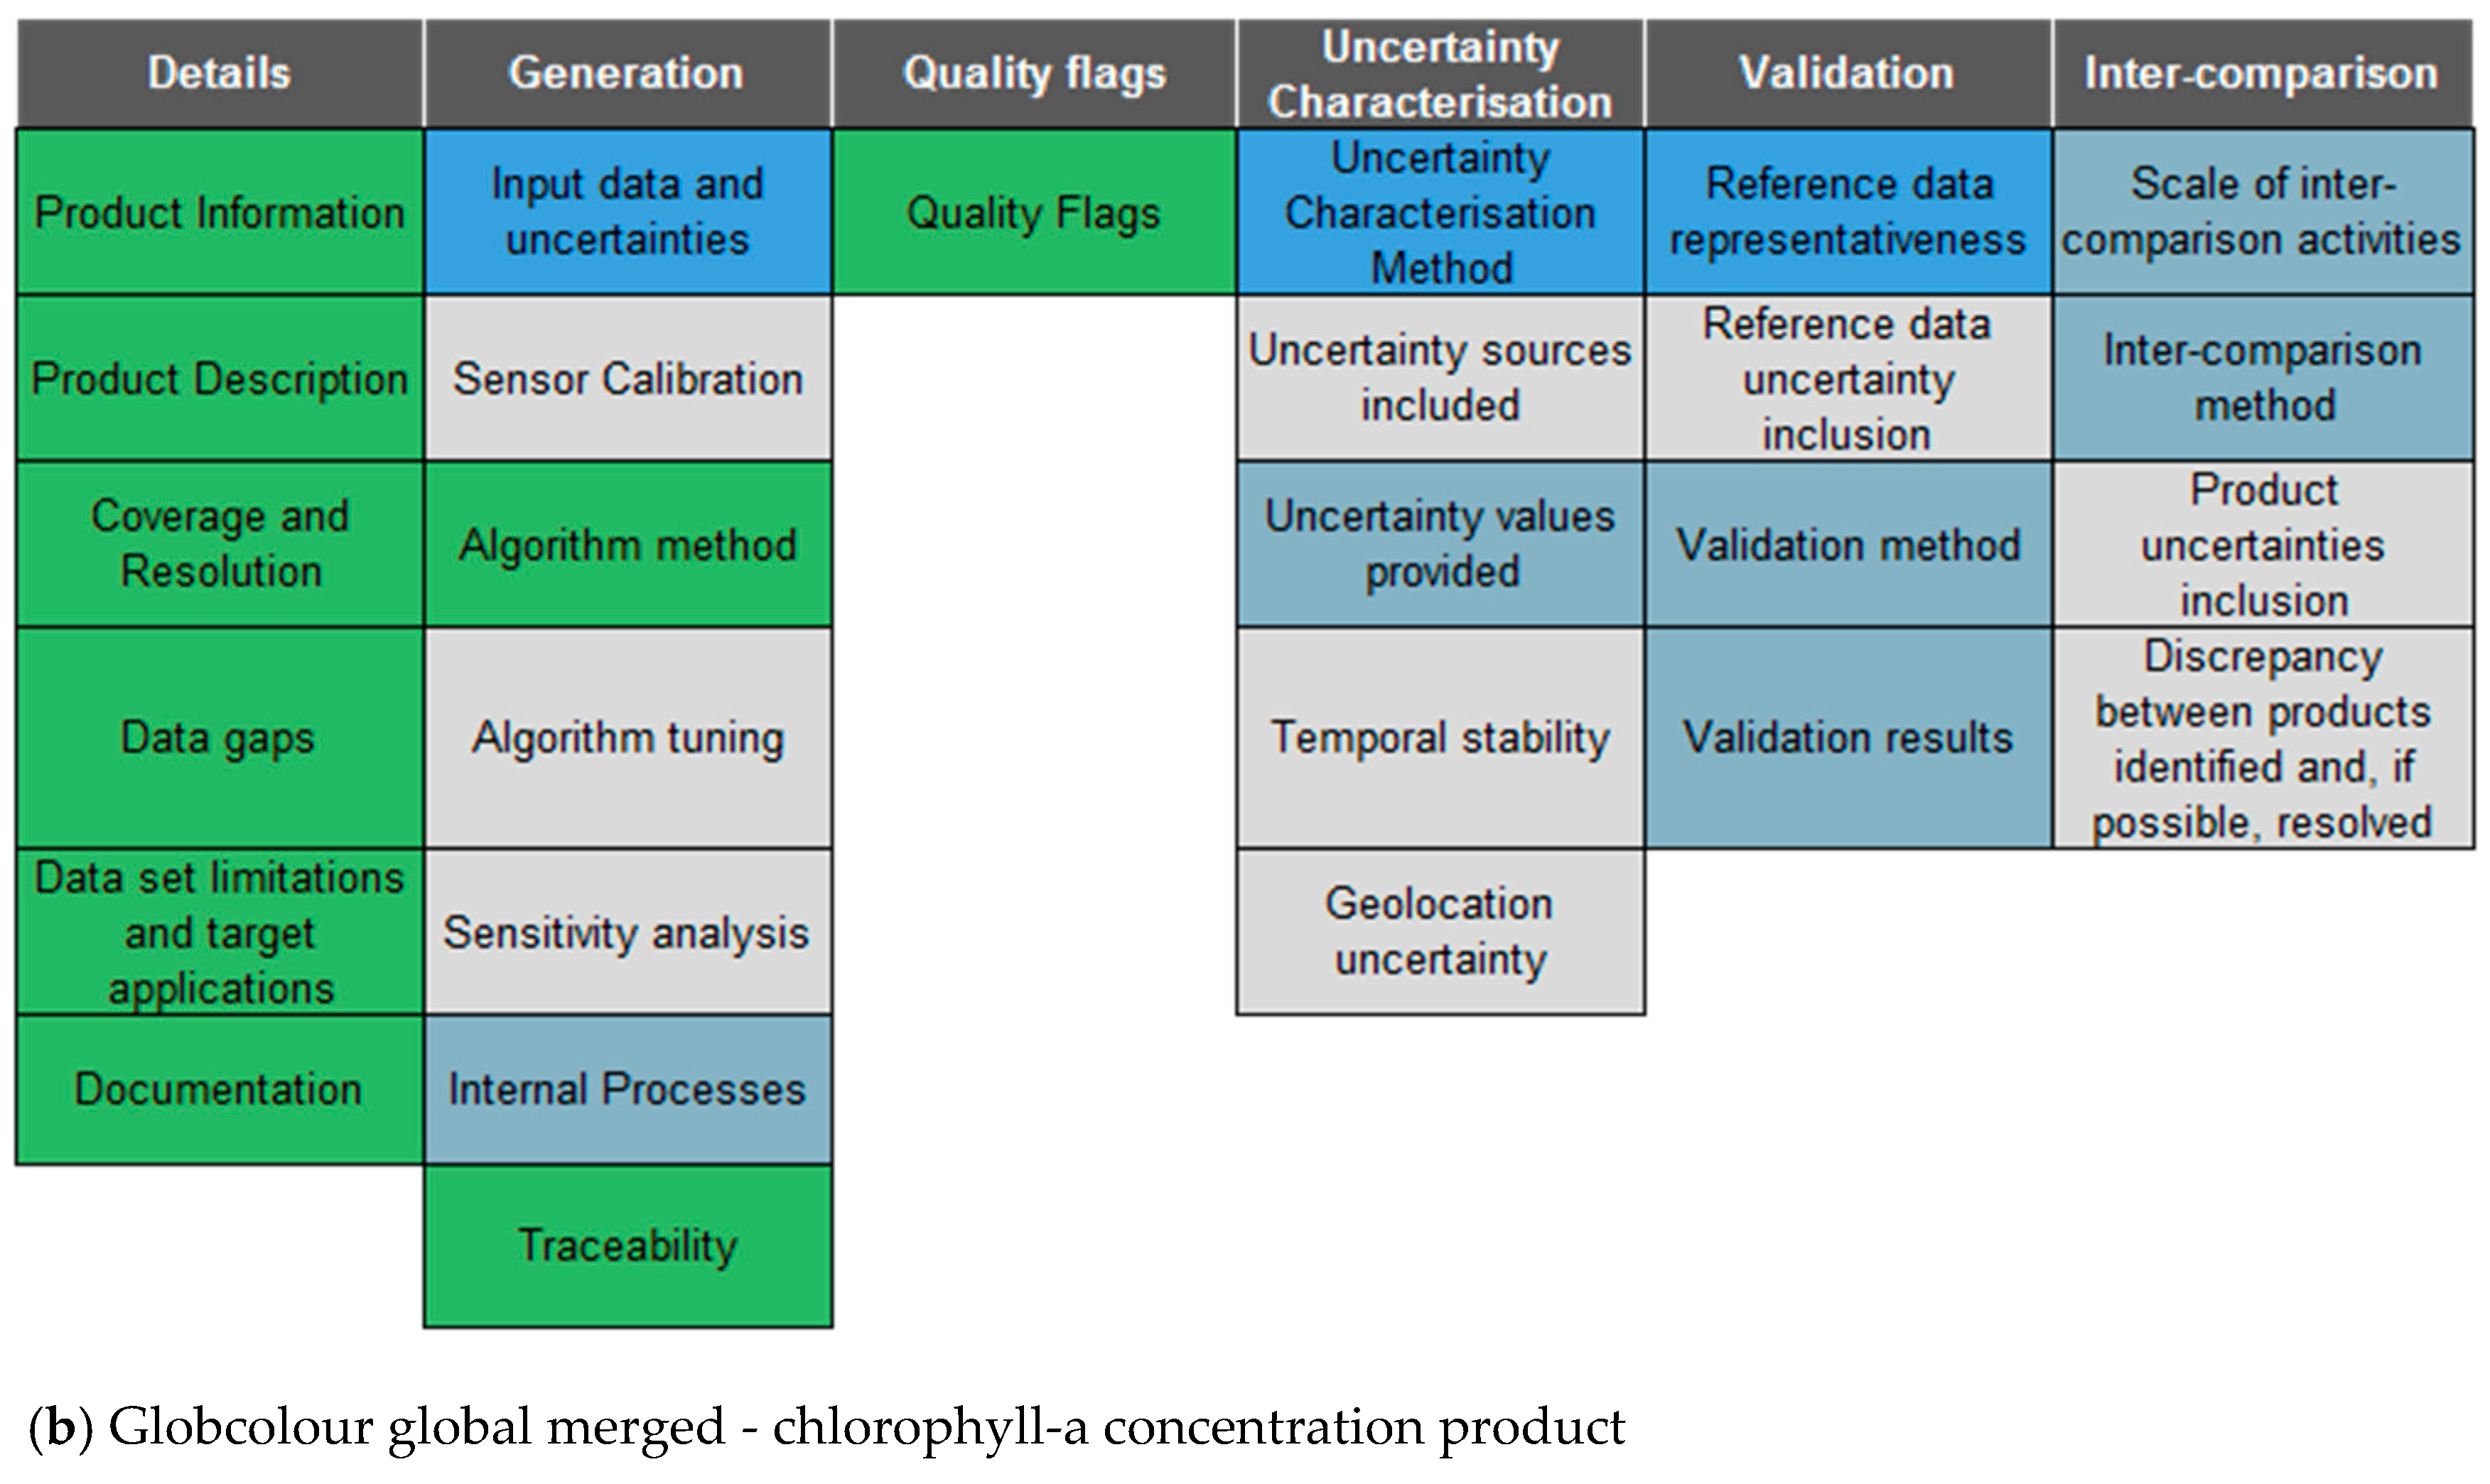
3.2. QA Evaluation
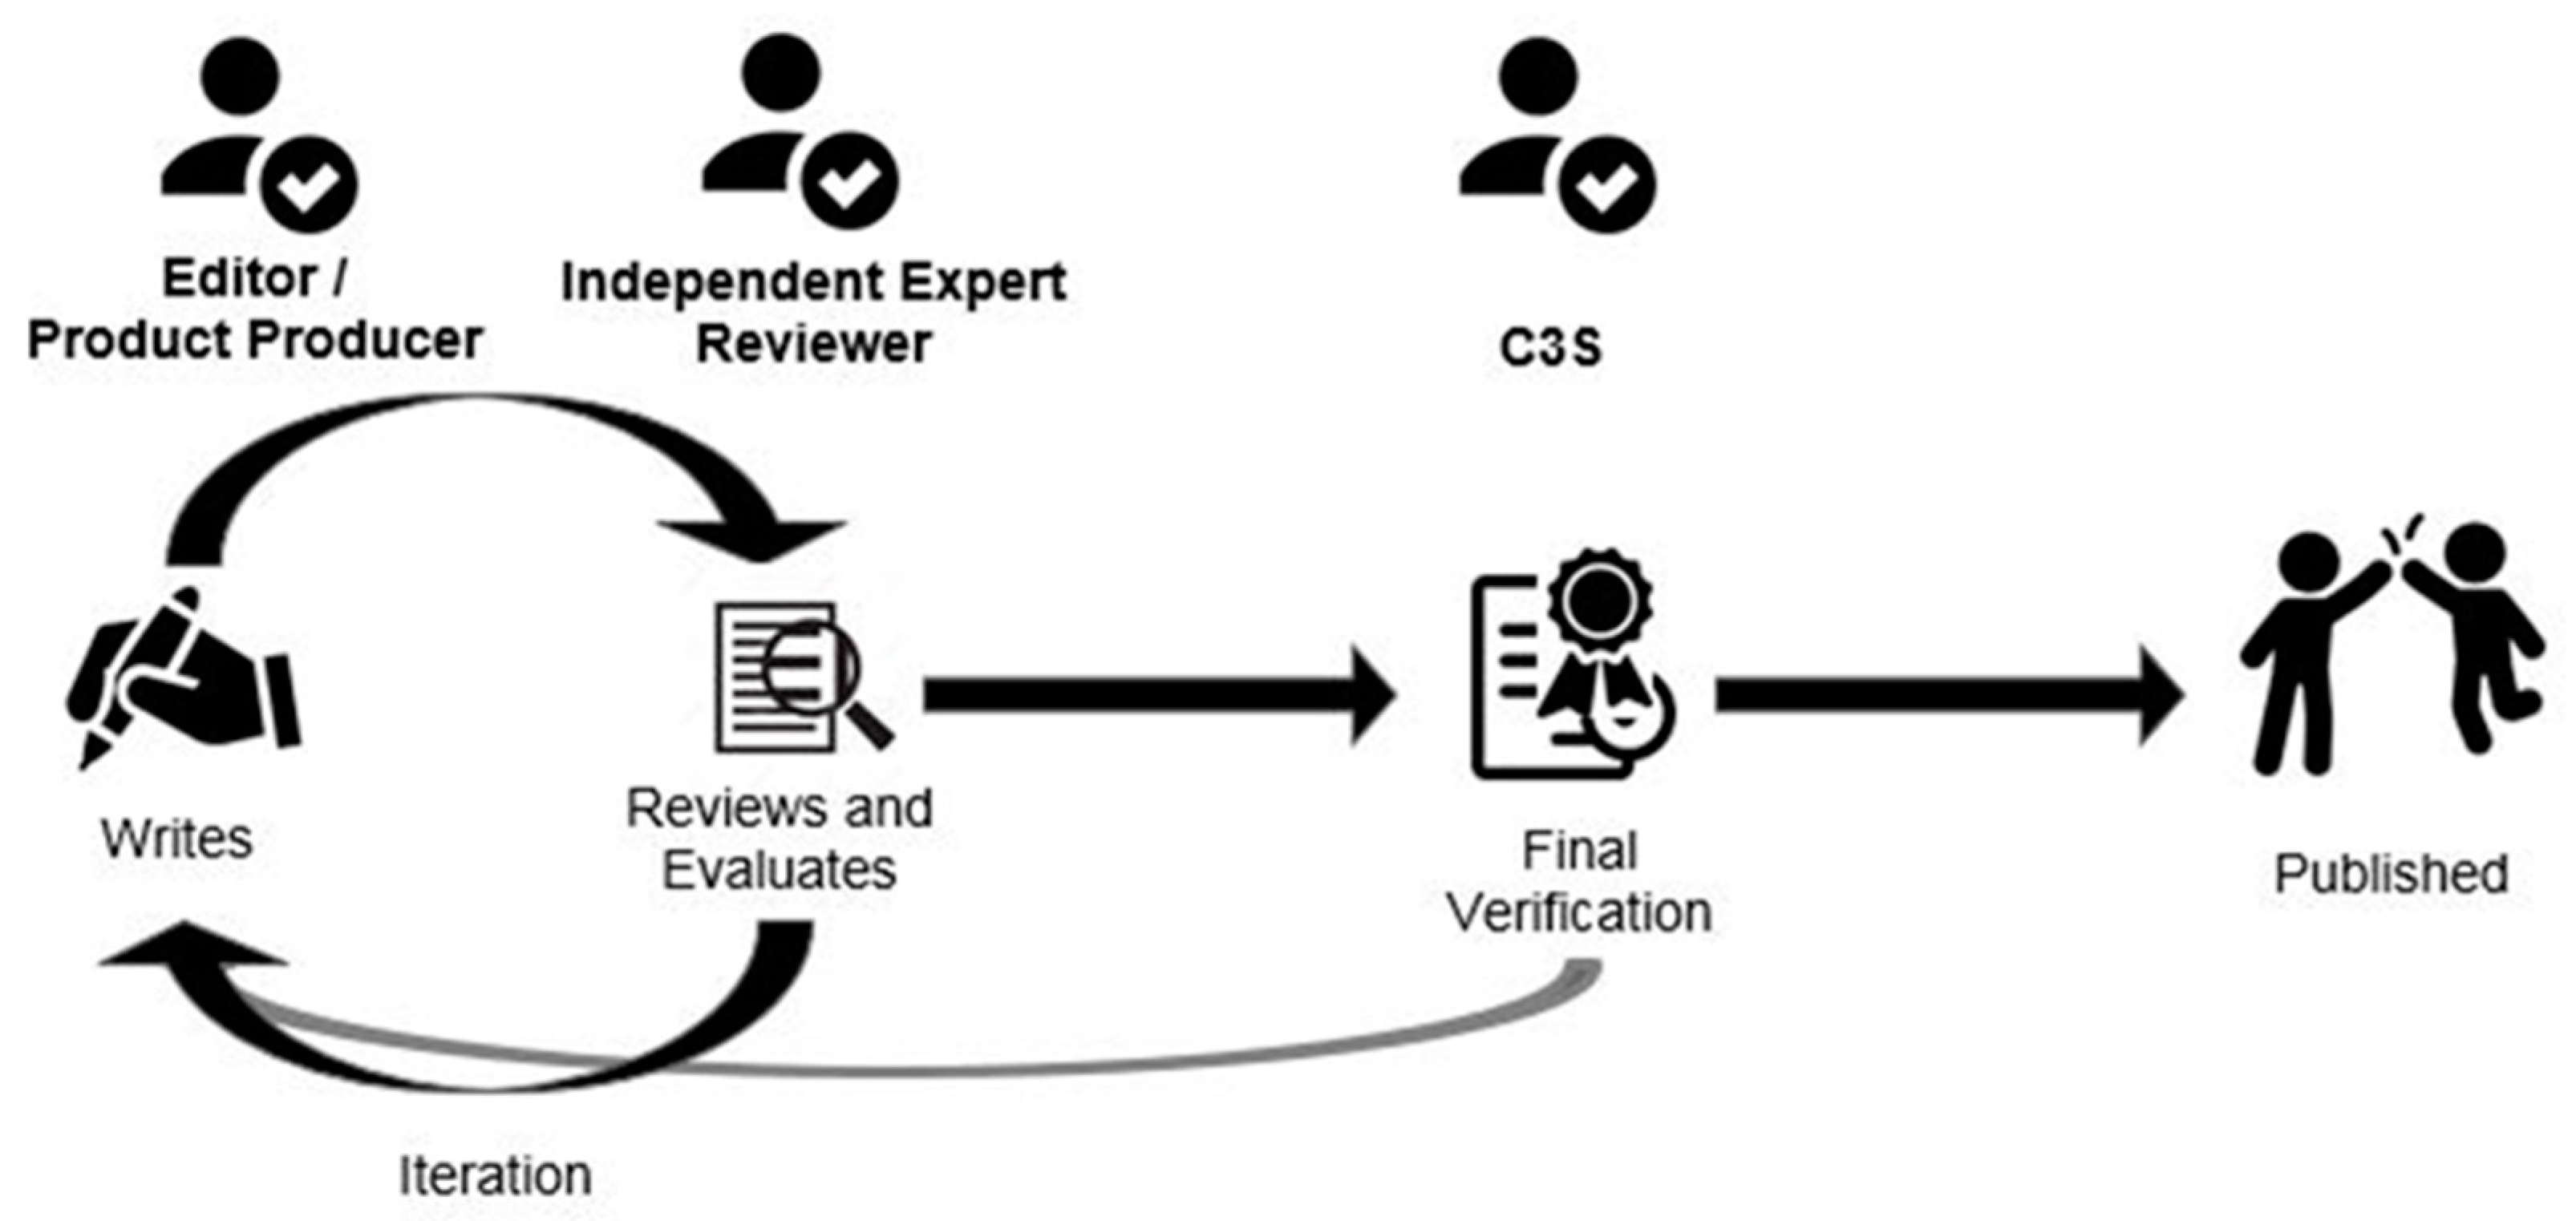
3.3. EQC Content Management System
- Editors, product producers who are responsible for filling out a QAT for their data product;
- Reviewers, domain scientific experts who evaluate the QAR information completed by the Editors; and
- Approvers, C3S representatives who provide a final check that the information is credible before the product QAR is issued publicly.
4. Scientific Gap Analysis
4.1. Recommendation 1—Standardised Metrological Vocabulary
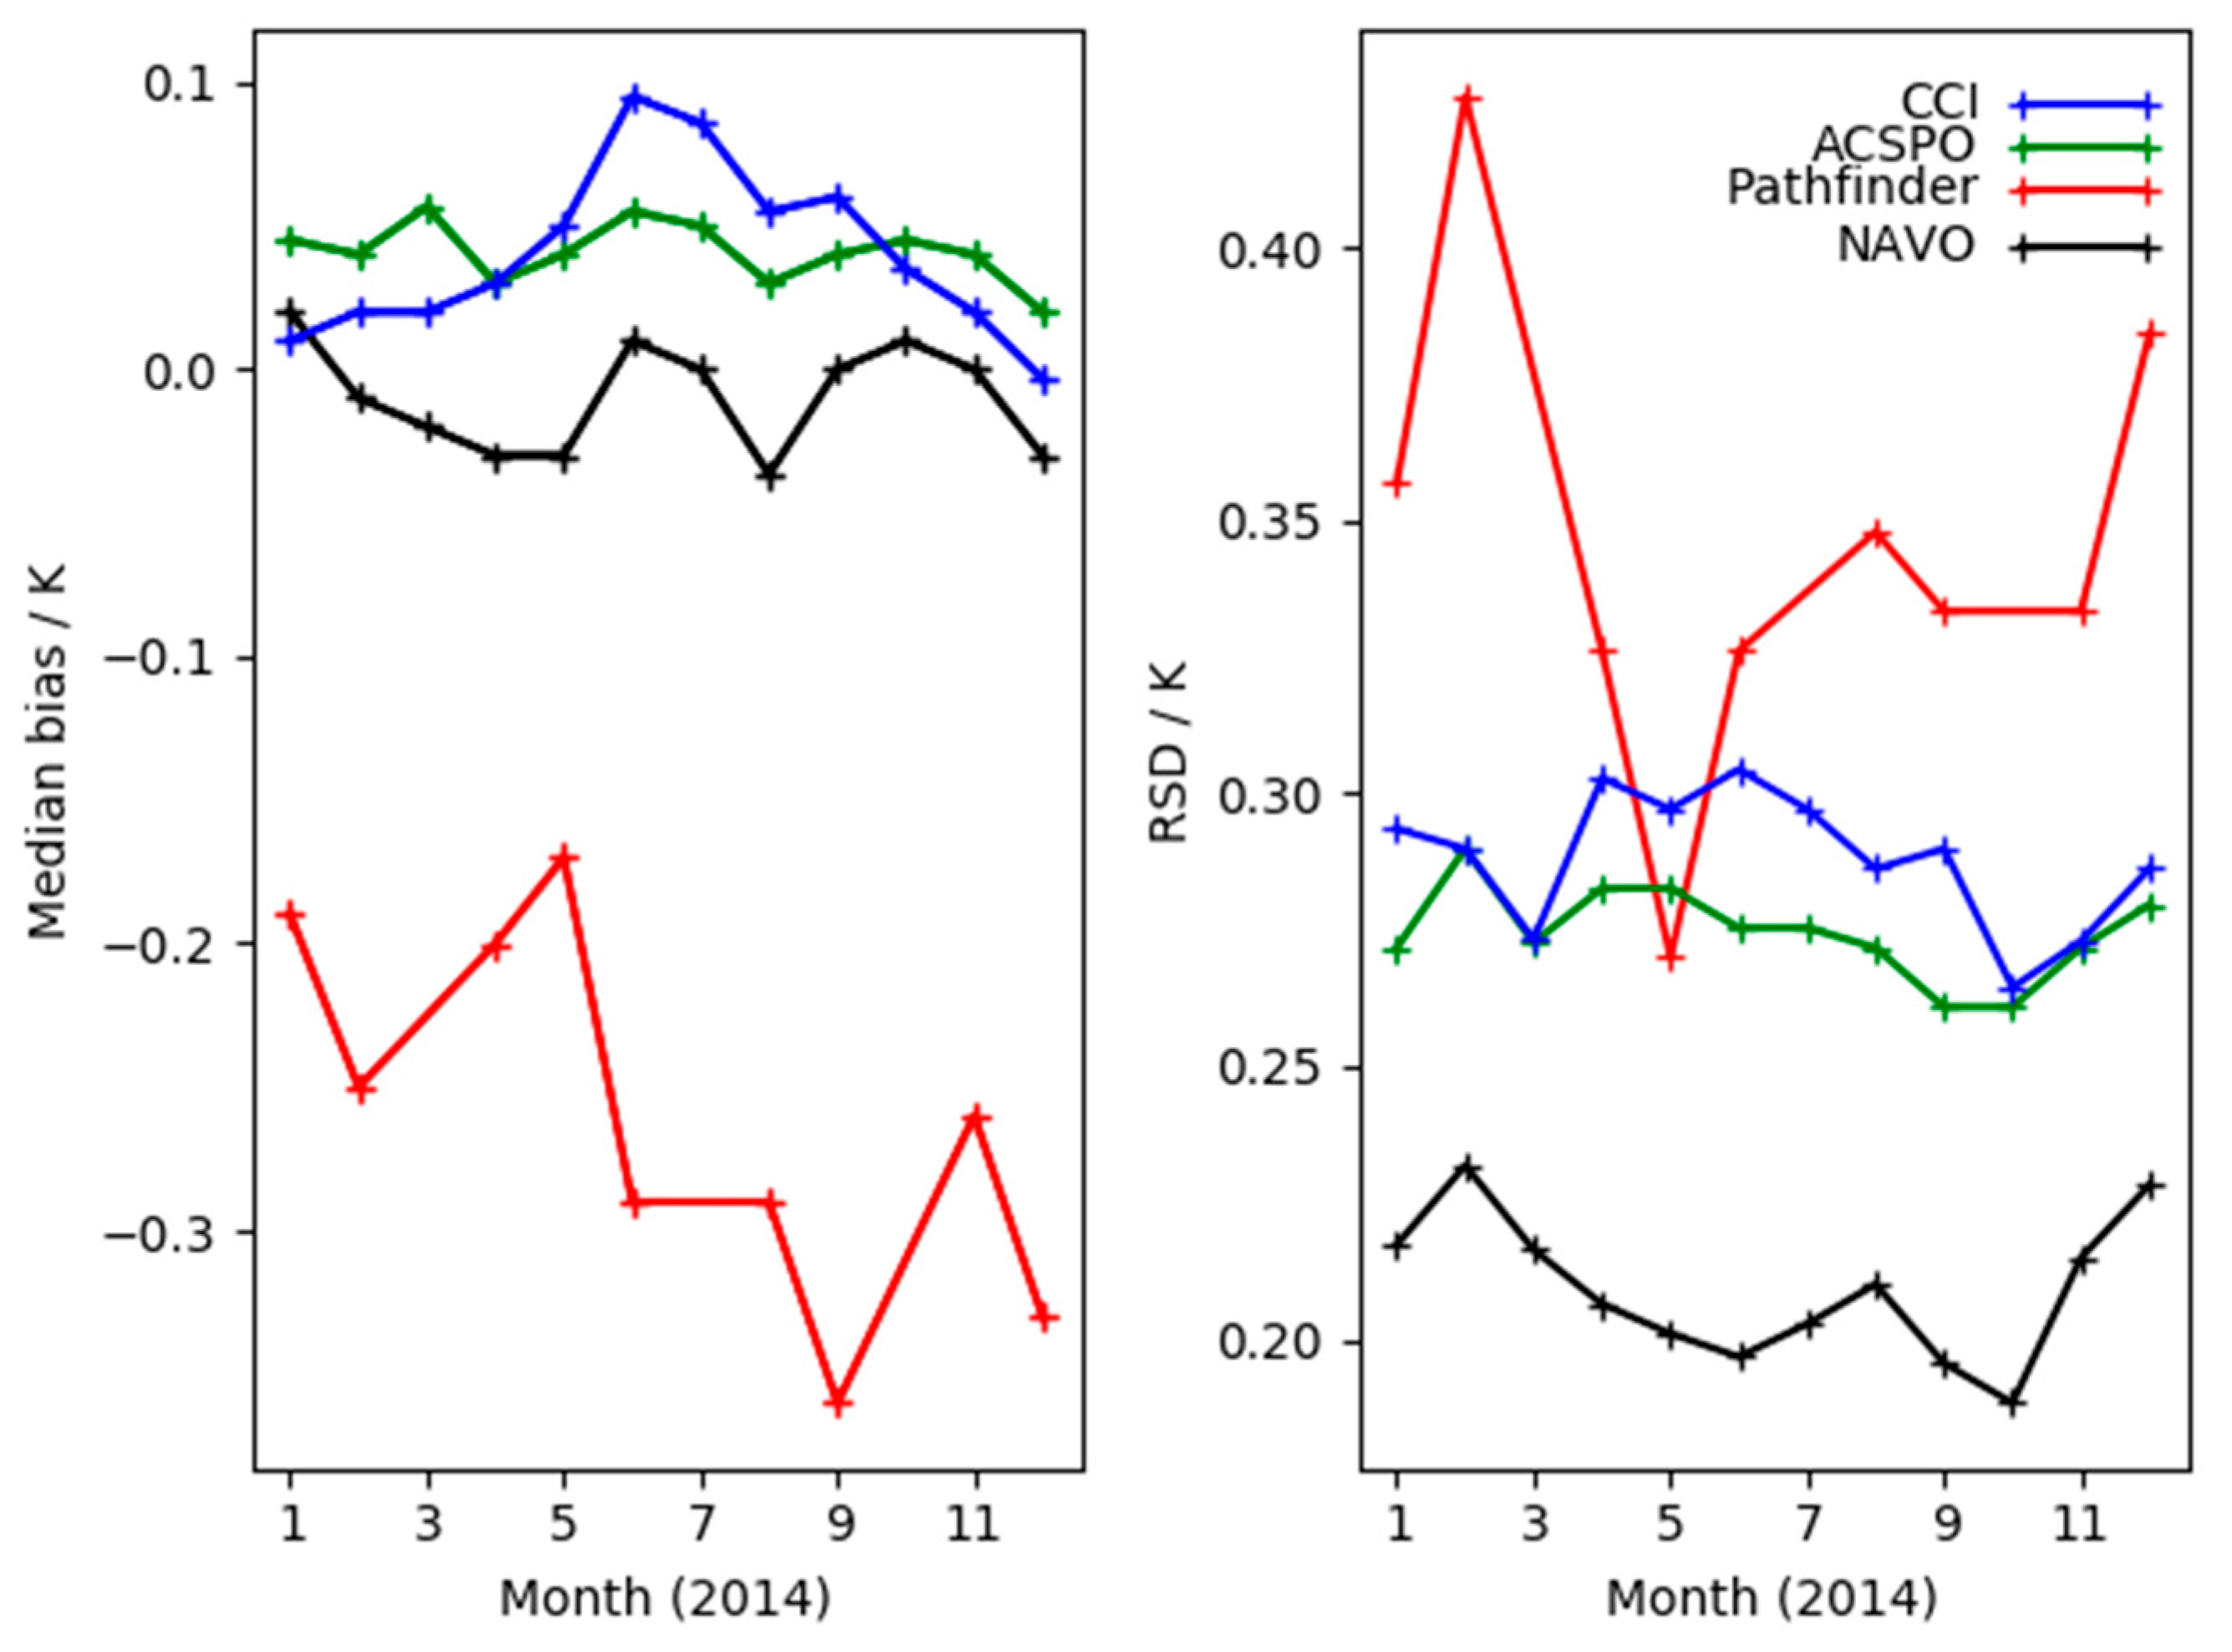
4.2. Recommendation 2—Sensor-to-Sensor Consistency in Merged Products
4.3. Recommendation 3—Validation Data and Methods
4.4. Recommendation 4—Radiative Transfer Models
4.5. Recommendation 5—Traceable Assessment of Level-1 Data
4.6. Recommendation 6—Implementing End-to-End Metrological Traceability
4.7. Recommendation 7—Retrieval Algorithm Round-Robin Comparisons
4.8. Recommendation 8—Quality of all Ancillary Input Data
- For the Soil Moisture CCI passive retrieval, an old model [38] is used. More modern models have been shown to outperform this model, so an update should be implemented; and
- Many processes use climatological data as input to their retrieval. Care needs to be taken that the optimum data is used. For example, the CCI/C3S Aerosol product uses a Chlorophyll concentration climatology based on Coastal Zone Color Scanner Experiment (CZCS) data (a very old instrument) where there is almost certainly better data available.
4.9. Recommendation 9—Consistent Quality Flags
4.10. Recommendation 10—Cloud Masks and Classification Routines
5. Summary and Future Recommendations
5.1. Further Development of the EQC Functionality
5.1.1. Implementation
- A QAT to be completed;
- An independent assessment of the QAT information; as well as
- A CDS placeholder for the dataset.
5.1.2. Maintaining and Improving Quality Assurance
5.1.3. Additional Functionalities
Author Contributions
Funding
Acknowledgments
Conflicts of Interest
References
- UNFCCC. The Paris Agreement—2015. Available online: http://unfccc.int/paris_agreement/items/9485.php (accessed on 21 April 2019).
- Raoult, B.; Bergeron, C.; Alos, A.L.; Thepaut, J.-N.; Dee, D. Climate service develops user-friendly data store. In Meteorology; ECMWF: Reading, UK, 2017; pp. 24–27. [Google Scholar]
- Nightingale, J.; Boersma, K.F.; Muller, J.-P.; Compernolle, S.; Lambert, J.-C.; Blessing, S.; Giering, R.; Gobron, N.; de Smedt, I.; Coheur, P.; et al. Quality assurance framework development based on six new ECV data products to enhance user confidence for climate applications. Remote Sens. 2018, 10, 21. [Google Scholar] [CrossRef]
- ESA. Earth Observation Science Strategy for ESA: A New Era for Scientific Advances and Societal Benefits; ESA Communications: Noordwijk, The Netherlands, 2015. [Google Scholar]
- Loew, A.; Bell, W.; Brocca, L.; Bulgin, C.; Burdanowitz, J.; Calbert, X.; Donner, R.; Ghent, D.; Gruber, A.; Kaminski, T.; et al. Validation practices for satellite-based Earth observation data across communities. Rev. Geophys. 2017, 779–817. [Google Scholar] [CrossRef]
- Zeng, Y.; Su, Z.; Calvet, J.-C.; Manninen, T.; Swinnen, E.; Schulz, J.; Roebeling, R.; Poli, P.; Tan, D.; Riihela, A.; et al. Analysis of current validation practices in Europe for space-based climate data records of essential climate variables. Int. J. Appl. Earth Obs. Geoinf. 2015, 42, 150–161. [Google Scholar] [CrossRef]
- CDS, C.S. C3S Climate Data Store. Available online: https://cds.climate.copernicus.eu (accessed on 21 April 2019).
- Bojinski, S.; Verstraete, M.; Peterson, T.; Richter, C.; Simmons, A.; Zemp, M. The concept of essential climate variables in support of climate research, applications, and policy. Am. Meteorol. Soc. 2014, 1431–1443. [Google Scholar] [CrossRef]
- Widlowski, J.-L. Conformity testing of satellite-derived quantitative surface variables. Environ. Sci. Policy 2015, 51, 149–169. [Google Scholar] [CrossRef]
- QA4ECV. Quality Assurance for Essential Climate Variables. Available online: http://www.qa4ecv.eu/ (accessed on 21 April 2019).
- GAIA-CLIM. Gap Analysis for Integrated Atmospheric ECV CLImate Monitoring. Available online: http://www.gaia-clim.eu/ (accessed on 21 April 2019).
- FIDUCEO. FIDelity and Uncertainty in Climate data records from Earth Observations. Available online: http://www.fiduceo.eu/ (accessed on 21 April 2019).
- CLIM-RUN. Climate Local Information in the Mediterranean Region Responding to User Needs. Available online: http://www.climrun.eu/ (accessed on 21 April 2019).
- EUPORIAS. European Provision of Regional Impacts Assessments on Seasonal and Decadal Timescales. Available online: http://www.euporias.eu/ (accessed on 21 April 2019).
- CLIP-C. Climate Information Portal. Available online: http://www.clipc.eu/ (accessed on 21 April 2019).
- GLOBTEMP. GlobTemperature. Available online: http://www.globtemperature.info/ (accessed on 21 April 2019).
- CORE-CLIMAX. COordinating Earth Observation Data Validation for RE-Analysis for CLIMAte ServiceS. Available online: https://cordis.europa.eu/project/rcn/106564/reporting/en/ (accessed on 21 April 2019).
- Merchant, C.J.; Paul, F.; Popp, T.; Ablain, M.; Bontemps, S.; Defourny, P.; Hollmann, R.; Lavergne, R.; Laeng, A.; de Leeuw, G.; et al. Uncertainty information in climate data records from Earth observation. Earth Syst. Sci. Data 2017, 9, 511–527. [Google Scholar] [CrossRef] [Green Version]
- JCGM. International Vocabulary of Metrology––Basic and General Concepts and Associated Terms (VIM); JCGM: Paris, France, 2012. [Google Scholar]
- JCGM-100. Evaluation of Measurement Data—Guide to the Expression of Uncertainty in Measurement; JCGM: Pavillon de Breteuil, France, 2008. [Google Scholar]
- Justice, C.; Belward, A.; Morisette, J.; Lewis, P.; Privette, J.; Baret, F. Developments in the validation of satellite sensor products for the study of the land surface. Int. J. Remote Sens. 2000, 21, 3383–3390. [Google Scholar] [CrossRef]
- Fernandes, R.; Plummer, S.; Nightingale, J.; Baret, F.; Camacho, F.; Fang, H.; Garrigues, S.; Gobron, N.; Lang, M.; Lacaze, R.; et al. Global Leaf Area Index Product Validation Good Practices; Version 2.0; CEOS: Frascati, Italy, 2014. [Google Scholar]
- Guillevic, P.; Göttsche, F.; Nickeson, J.; Hulley, G.; Ghent, D.; Yu, Y.; Trigo, I.; Hook, S.; Sobrino, J.A.; Remedios, J.; et al. Land Surface Temperature Product Validation Best Practice Protocol; Version 1.1; CEOS: Frascati, Italy, 2018. [Google Scholar]
- ESA. Fiducial Reference Measurements: FRM. 2019. Available online: https://earth.esa.int/web/sppa/activities/frm (accessed on 21 April 2019).
- RAMI. RAdiation Transfer Model Intercomparison. Available online: http://rami-benchmark.jrc.ec.europa.eu/HTML/ (accessed on 21 April 2019).
- Parkinson, C.; Ward, A.; King, M. Earth Science Reference Handbook: A Guide to NASA’s Earth Science Program and Earth Observing Satellite Missions; National Aeronautics and Space Administration: Washington, DC, USA, 2006.
- Wu, X.; Sullivan, J.; Heidinger, A.K. Operational calibration of the Advanced Very High Resolution Radiometer (AVHRR) visible and near-infrared channels. Can. J. Remote Sens. 2010, 36. [Google Scholar] [CrossRef]
- Mittaz, J.; Bali, M.; Harris, A. The calibration of broad band infrared sensors: Time variable biases and other issues. In Proceedings of the EUMETSAT Meteorological Satellite Conference, Vienna, Austria, 16–20 September 2013. [Google Scholar]
- Mittaz, J.; Harris, A. A physical method for the calibration of the AVHRR/3 thermal IR channels. Part II: An in-orbit comparison of the AVHRR longwave thermal IR channels on board MetOp-A with IASI. J. Atmos. Ocean. Technol. 2011, 28, 16. [Google Scholar] [CrossRef]
- Mittaz, J.; Harris, A.; Sullivan, J. A physical method for the calibration of the AVHRR/3 thermal IR channels 1: The prelaunch calibration data. J. Atmos. Ocean. Technol. 2009, 26, 996–1019. [Google Scholar] [CrossRef]
- Woolliams, E.; Mittaz, J.; Merchant, C.J.; Hunt, S.; Harris, P. Applying metrological techniques to satellite fundamental climate data records. J. Phys. Conf. Ser. 2018, 972, 012003. [Google Scholar] [CrossRef]
- Mittaz, J.; Merchant, C.J.; Woolliams, E.R. Applying principles of metrology to historical earth observations from satellites. Metrologia 2019. [Google Scholar] [CrossRef]
- Ichoku, C.; Chu, D.A.; Mattoo, S.; Kaufman, Y.; Remer, L.; Tanre, D.; Slutsker, I.; Holben, B. A spatio-temporal approach for global validation and analysis of MODIS aerosol products. Geophys. Res. Lett. 2002, 29, 1616–1619. [Google Scholar] [CrossRef]
- GHRSST. Group for High Resolution Sea Surface Temperature. Available online: www.ghrsst.org (accessed on 21 April 2019).
- Merchant, C.; Harris, R. Toward the elimination of bias in satellite retrievals of sea surface temperature: 2. comparison with in situ measurements. JGR Oceans 1999, 104, 23579–23590. [Google Scholar] [CrossRef]
- Monahan, E.; Muircheartaigh, I. Optimal power-law description of oceanic whitecap coverage dependence on wind speed. J. Phys. Oceanogr. 1980, 19, 2094–2099. [Google Scholar] [CrossRef]
- Albert, M.; Anguelova, M.; Manders, A.; Schaap, M.; de Leeuw, G. Parameterization of oceanic whitecap fraction based on satellite observations. Atmos. Chem. Phys. 2016, 16, 13725–13751. [Google Scholar] [CrossRef] [Green Version]
- Wang, J.R.; Schmugge, T.J. An empirical model for the complex dielectric permittivity of soils as a function of water content. IEEE Trans. Geosci. Remote Sens. 1980, 18, 288–295. [Google Scholar] [CrossRef]
- Harris, I.; Jones, P.; Osborn, T.; Lister, D. Updated high-resolution grids of monthly climatic observations-the CRU TS3.10 Dataset. Int. J. Climatol. 2014, 34, 623–642. [Google Scholar] [CrossRef]
- Huete, A.; Didan, K.; Shimabukuro, Y.; Ratana, P.; Saleska, S.; Hutyra, L.; Yang, W.; Nemani, R.; Myneni, R. Amazon rainforests green-up with sunlight in dry season. Geophys. Res. Lett. 2006, 33, L06405. [Google Scholar] [CrossRef]
- Saleska, S.; Didan, K.; Huete, A.; da Rocha, H. Amazon forests green-up during 2005 drought. Science 2007, 318. [Google Scholar] [CrossRef]
- Samanta, A.; Ganguly, S.; Hashimoto, H.; Devadiga, S.; Vermote, E.; Knyazikhin, Y.; Nemani, R.; Myneni, R. Amazon forests did not green-up during the 2005 drought. Geophys. Res. Lett. 2010, 37. [Google Scholar] [CrossRef] [Green Version]
- Hilker, T.; Lyapustin, A.; Hall, F.; Myneni, R.; Knyazikhin, Y.; Wang, Y.; Tucker, C.; Sellers, P. On the measurability of change in Amazon vegetation from MODIS. Remote Sens. Environ. 2015, 166, 233–242. [Google Scholar] [CrossRef]


| ECV | Total Number of Products Found | Number of Products after Climate Relevance Filtering |
|---|---|---|
| Precipitation (in situ) 1 | 53 | 14 |
| Surface Air Temperature (in situ) 1 | 72 | 27 |
| LAI | 33 | 21 |
| fAPAR | 30 | 22 |
| Soil Moisture | 25 | 14 |
| SST | 72 | 27 |
| Ocean Colour | 40 | 28 |
| Ozone | 105 | 78 |
| Aerosols | 100 | 68 |
| ECV | Product Name | Provider |
|---|---|---|
| Precipitation | Climatic Research Unit Timeseries (CRU TS) 4.0a | University of East Anglia |
| Precipitation | Global Historical Climatology Network (GHCN) Daily and Monthly Precipitation Product version 2 | National Center for Atmospheric Research (NCAR) |
| Surface Air Temperature | GHCN daily and monthly V3 surface air temperature | NCAR |
| Surface Air Temperature | Goddard Institute for Space Studies Surface Temperature Analysis (GISTEMP) monthly 2° anomaly data | National Aeronautics and Space Administration (NASA) |
| LAI and fAPAR | C3S GEOV1 LAI | VITO, Belgium |
| LAI and fAPAR | National Oceanic and Atmospheric Administration (NOAA) National Center for Environmental Information (NCEI) LAI v4 (AVH15) | NASA/NOAA NCEI |
| LAI and fAPAR | Meteosat Second Generation (MSG)/ Spinning Enhanced Visible and InfraRed Imager (SEVIRI)—Land Surface Analysis (LSA)-Satellite Application Facility (SAF) | European Organisation for the Exploitation of Meteorological Satellites (EUMETSAT) |
| Soil moisture | C3S Soil Moisture—combined active and passive | ESA, Vienna University of Technology (TU Wien) |
| Soil moisture | Soil Moisture Ocean Salinity (SMOS)-L3-Global | Barcelona Expert Centre |
| SST | Advanced Very High Resolution Radiometer (AVHRR) SST Level 3 Pathfinder version 5.3 | NOAA NCEI |
| SST | CCI/C3S Along Track Scanning Radiometer (ATSR) Level 3 Sea Surface Temperature version 1.1 | European Space Agency (ESA) |
| Ocean Colour | Globcolour global merged—chlorophyll-a concentration | ACRI-ST, France |
| Ocean Colour | ESA Climate Change Initiative (CCI)/C3S V3.1—chlorophyll-a concentration | ESA, Plymouth Marine Laboratory |
| Ozone | Total Ozone (C3S Ozone CCI) Level-2, OMI/Aura | Royal Belgian Institute for Space Aeronomy (IASB-BIRA) |
| Ozone | Total Ozone (NASA Goddard Space Flight Center (GSFC)) Level-3, Solar Backscatter Ultraviolet Radiometer (SBUV) v8.6 | NASA |
| Aerosol | NASA Moderate Resolution Imaging Spectroradiometer (MODIS) Terra/Aqua Deep Blue Level 3 version 6.1 | NASA |
| Aerosol | CCI (A)ATSR/ Sea and Land Surface Temperature Radiometer (SLSTR) Dual/Single View Algorithm (ADV/ASV) Level 2 version 2.31 | ESA |
| Albedo 2 | QA4ECV Spectral Albedo | European Union funded Quality Assurance for Essential Climate Variables (EU QA4ECV) |
| Albedo 2 | QA4ECV Broadband Albedo | EU QA4ECV |
| Formaldehyde (HCHO) 2 | QA4ECV HCHO ECV Precursor Product | EU QA4ECV |
| Nitrogen Dioxide (NO2) 2 | QA4ECV NO2 ECV Precursor Product | EU QA4ECV |
| Science Knowledge Gap | Recommendation | Action | Importance | Research to Operations Timeframe | |
|---|---|---|---|---|---|
| 1. | Application of consistent and metrologically sound vocabulary to describe data and product quality. | The C3S EQC should encourage the consistent use of standardised vocabulary by providing a vocabulary list along with examples. This should be consistent with those being defined through international coordination bodies for satellite and in situ observations 3. | C3S and EQC operators to establish and encourage use of terminology. | Very High Importance | Short term. (12 months) |
| 2. | Sensor-to-sensor consistency in merged products from Level-1 data products onwards. | Development of procedures to apply metrologically-traceable methods of product stabilisation (e.g., harmonisation) that mutually also returns updated radiance calibration coefficients of sensor series. | Space agencies to ensure calibration coefficients are provided for development of downstream products. | Very High Importance | Harmonisation of a large number of sensors should be medium to long term goal (>5 years) |
| 3. | Lack of long term in situ measurements and field-based campaigns globally that are specifically designed for satellite data/product validation and have documented evidence of metrological traceability. | Errors and uncertainties associated with the validation process need to be addressed and should include estimates of the reference data uncertainty and methodology (spatial/temporal/scaling) employed. The use of internationally endorsed good practice guidance should be encouraged if available. For example, these concepts are being developed through the ESA FRM (Fiducial Reference Measurement) projects. | Funding bodies to commission research and ensure adoption and coordination of good practices and guidance documentation. | High Importance | Adopting and developing further internationally endorsed good practice guidance is required in the medium term (2–5 years) |
| 4. | Understanding uncertainties and error correlation associated with using Radiative Transfer Models (RTM) for ECV product generation. | Good practice guides should be developed to help ECV producers to use the optimum RTM/associated models for their application. | Data Provider and Research Community to develop good practice guidance. | High Importance | Guides should be produced in the medium term (2–5 years) |
| 5. | Traceable assessment of Level-1 data in active and passive sensors. | Development of a framework for the metrological characterisation of satellite instruments that encompasses exploitation of ongoing pre-flight and post-launch calibration activities. | Funding bodies to commission research and ensure adoption. | High Importance | Research and operational understanding over the medium term (2–5 years) |
| 6. | Implementation of end-to-end metrological traceability. | All Level-1 satellite-derived data records must have appropriate uncertainties included. These would be derived using a metrological approach to ensure that instrumental biases will also be reduced. | Funding bodies to commission research and ensure adoption. | High Importance | Research commissioning and operational understanding over the medium term. (>5 years) |
| 7. | Retrieval algorithm cross-comparisons (round-robins) are required given the large number of data products and algorithms (Table 1). | Retrieval algorithm cross-comparisons activities should be funded in order to understand the relative performance and strengths of different methods. | Funding bodies to commission research and ensure adoption. | Medium Importance | Selected ECVs should begin in the short term. Ongoing in the medium term. (2–5 years) |
| 8. | Quantification and assessment of the quality of all ancillary data utilised in ECV product generation. | Data providers should justify the use of ancillary data and models in their products to ensure that results can be defended. If data is being used that is out of date but it is too complex to switch due to assumptions built into the processing scheme, then a sensitivity analysis of the consequences of including such data should then be performed. | C3S EQC to request justification in the EQC process. | Medium Importance | Requested justifications for existing products should be provided in the short term and operationalised into the future. |
| 9. | Development of consistent quality flags for each ECV product group. | Consistent and standardised quality flags will facilitate unbiased cross-comparison of the same ECV from different data providers. This will require coordination between product producers to agree on a set of consistent quality flags for their ECV product group. | C3S and funding bodies to coordinate a collaboration between ECV data providers. | Medium Importance | Collaboration set up in the short term. May be conducted within round-robin exercises. (R7). (<12 months) |
| 10. | Assessment of the implications for use of differing cloud masks, classification routines and gridding schemes used in all ECV products. | Cross-comparisons activities should be funded to address effects of cloud masking techniques, classification routines and gridding schemes as well as the evaluation of uncertainties in the process. | Funding bodies to commission research and ensure adoption. | Medium Importance | Recommended to be carried out in the medium term. (2–5 years) |
© 2019 by the authors. Licensee MDPI, Basel, Switzerland. This article is an open access article distributed under the terms and conditions of the Creative Commons Attribution (CC BY) license (http://creativecommons.org/licenses/by/4.0/).
Share and Cite
Nightingale, J.; Mittaz, J.P.D.; Douglas, S.; Dee, D.; Ryder, J.; Taylor, M.; Old, C.; Dieval, C.; Fouron, C.; Duveau, G.; et al. Ten Priority Science Gaps in Assessing Climate Data Record Quality. Remote Sens. 2019, 11, 986. https://0-doi-org.brum.beds.ac.uk/10.3390/rs11080986
Nightingale J, Mittaz JPD, Douglas S, Dee D, Ryder J, Taylor M, Old C, Dieval C, Fouron C, Duveau G, et al. Ten Priority Science Gaps in Assessing Climate Data Record Quality. Remote Sensing. 2019; 11(8):986. https://0-doi-org.brum.beds.ac.uk/10.3390/rs11080986
Chicago/Turabian StyleNightingale, Joanne, Jonathan P.D. Mittaz, Sarah Douglas, Dick Dee, James Ryder, Michael Taylor, Christopher Old, Catherine Dieval, Celine Fouron, Guillaume Duveau, and et al. 2019. "Ten Priority Science Gaps in Assessing Climate Data Record Quality" Remote Sensing 11, no. 8: 986. https://0-doi-org.brum.beds.ac.uk/10.3390/rs11080986