Article

Quantitative Aerosol Optical Depth Detection during Dust Outbreaks from Meteosat Imagery Using an Artificial Neural Network Model

by
Stavros Kolios
* and
Nikos Hatzianastassiou
Laboratory of Meteorology, Physics Department, University of Ioannina, 45110 Ioannina, Greece
*
Author to whom correspondence should be addressed.
Submission received: 14 March 2019 / Revised: 20 April 2019 / Accepted: 25 April 2019 / Published: 30 April 2019

Abstract

:
This study presents the development of an artificial neural network (ANN) model to quantitatively estimate the atmospheric aerosol load (in terms of aerosol optical depth, AOD), with an emphasis on dust, over the Mediterranean basin using images from Meteosat satellites as initial information. More specifically, a back-propagation ANN model scheme was developed to estimate visible (at 550 nm) aerosol optical depth (AOD550 nm) values at equal temporal (15 min) and spatial (4 km) resolutions with Meteosat imagery. Accuracy of the ANN model was thoroughly tested by comparing model estimations with ground-based AOD550 nm measurements from 14 AERONET (Aerosol Robotic NETwork) stations over the Mediterranean for 34 selected days in which significant dust loads were recorded over the Mediterranean basin. Using a testbed of 3076 pairs of modeled and measured AOD550 nm values, a Pearson correlation coefficient (rP) equal to 0.91 and a mean absolute error (MAE) of 0.031 were found, proving the satisfactory accuracy of the developed model for estimating AOD550 nm values.

Graphical Abstract

1. Introduction

Dust and sand storms originating from Earth’s major arid and semi-arid desert areas can significantly affect the climate system and health. Such dust events create hazardous air quality conditions and increase mortality (e.g., [1,2,3]). On the other hand, dust is ascertained to have significantly affected past climate (e.g., [4,5]) and also affects present climate and weather conditions on a regional to global scale, but there is still high uncertainty of dust’s total impact on ongoing climate change [6]. The climatic effect of dust is exerted through modification of the shortwave and longwave radiation budget (e.g., [7,8,9]). Dust also has indirect and a semidirect effects on climate, which consist of modification of cloud and precipitation properties and influence general circulation of the atmosphere (e.g., [10,11]). Besides, feedback between dust and atmospheric carbon dioxide or ocean biochemistry and productivity have also been documented (e.g., [12,13]). Apart from these, dust can also have other effects, namely on transportation (e.g., aviation), space exploration, and solar photovoltaic power [14]. For all these reasons, the identification and detection of dust, especially at large spatiotemporal scales and high resolutions, is very important.
Significant is the role of numerical modelling to detect and forecast dust loadings. More specifically, numerical dust transport models have been widely used for simulating and forecasting the concentration of dust aerosols, such as the Community Aerosol and Radiation Model for Atmospheres (CARMA) [15], the NCEP (National Centers for Environmental Prediction) regional atmospheric model [16], the Dust REgional Atmospheric (DREAM) Model [17,18], the NMMB/BSC-Dust multi-scale dust model [18,19], and the Weather Research and Forecasting/Chemistry Model (WRF/Chem) model [20,21]. Although these models perform quite satisfactorily in predicting dust events, there are still significant uncertainties in the final forecasts (e.g., [22]). Moreover, it should be noted that large differences exist between global dust models in terms of reproducing the dust cycle [23].
On the other hand, dust detection and monitoring, as well as dust load estimation from satellite observations, is an efficient alternative solution, which has the advantage of providing extended spatial coverage. Indeed, remote sensing has been shown to be a valuable tool for detecting, mapping, and forecasting dust events (e.g., [24,25,26]), while it is also used for real-time dust detection (e.g., [27,28,29]). Methodologies for dust storm detection and tracking using satellite imagery have already been developed in response to the high demand for distinguishing and forecasting severe dust outbreaks. Furthermore, use of satellite remote sensing for dust monitoring and nowcasting is also useful in providing long-term and global observations. Nevertheless, the majority of existing approaches for dust detection and monitoring are still based on simple thresholding of multispectral satellite imagery [30,31,32]. More specifically, brightness temperature differences (BTDs) at 8.7, 10.8, and 12 μm are being commonly used to discriminate atmospheric dust from clouds (e.g., [33,34,35,36]), since dust particles absorb more thermal radiation at shorter infrared wavelengths, opposed to ice and/or liquid water particles that induce higher absorption at longer wavelengths of thermal infrared radiation (e.g., [37,38]). However, several factors can affect BTD values, such as intense surface temperature inversion and the existence of high water vapor concentration, which hamper detection of “dusty” pixels [39].
It should also be noted that a common practice to detect dust storms is the use of remote sensing indices (e.g., [38,40,41]). A key study by Legrand et al. [40] developed the infrared difference dust index (IDDI). Also, Zhao et al. [38] proposed a multichannel imager (MCI) algorithm for detecting dust aerosols, over both land and water, based on universal thresholds. In a more recent study [28], dust detection and quantification were performed using BTDs among four channels in the visible and infrared regions of the Himawari-8 satellite as well as two dust indices.
In the last decade, new methodologies based on satellite imagery have been developed for the detection and tracking of dust storms by applying machine learning techniques (e.g., [42,43,44]). In spite of the quite satisfactory performances of these methodologies for detecting dust that have been documented in several studies, the majority of them do not provide operational tools; instead they use data from polar-orbiting satellite instruments such as the MODIS (moderate resolution imaging spectroradiometer). Nevertheless, polar-orbiting satellite measurements provide limited temporal resolutions, opposite to the higher resolution ensured by geostationary satellites like Meteosat, Himawari, or geostationary operational environmental satellites (GOESs). For example, Meteosat offers a temporal resolution of 15 min, which is essential for real-time or near real-time dust detection (dust nowcasting) applications.
To date, there are few studies making combined use of datasets from geostationary satellites and ANN (artificial neural network) schemes, but they mainly focus on classification of different rainfall types and estimation of rainfall intensity (e.g., [45,46]). Similar studies focusing on atmospheric dust detection and monitoring [28,47] still remain scarce, while they do not provide quantitative outputs for dust loading at high temporal resolutions, which is critical information for many applications.
This study presents a machine learning methodology for identifying/isolating patterns of dust storms from Meteosat second generation (MSG) imagery over the greater Mediterranean basin, which is an ideal study region for such applications since it is located near the world’s largest deserts in Africa and the Middle East. The main advantage of the present study is that the developed methodology exclusively uses multispectral initial information from the abovementioned geostationary satellites, and through an ANN scheme, provides final outputs depicting dust spatiotemporal patterns at high temporal (15 min) and spatial (about 4 km over the study area) resolutions of the Meteosat satellite images. Moreover, the developed Meteosat-ANN based model is able to provide quantitative estimations of dust loading, in terms of AOD at 550 nm (hereinafter “AOD550 nm”) on a Meteosat pixel (4 km × 4 km) basis. Efficiency of the developed model is tested by comparing its outputs against corresponding AOD products from 14 AERONET (Aerosol Robotic NETwork) stations distributed over the Mediterranean basin.

2. Initial Data and Study Area

Three different types of data were used in this study. The first type of data was AOD products derived from AERONET (Aerosol Robotic NETwork) ground-based stations. AERONET is a federation of ground-based remote sensing aerosol networks established to provide long-term, continuous, and readily accessible datasets of optical, microphysical, and radiative properties for aerosol research and characterization as well as for validation of satellite retrievals (https://aeronet.gsfc.nasa.gov/). The AERONET parameter used in this study was AOD at 550 nm. More specifically, cloud-screened and quality-controlled Level 1.5 AOD data from 14 AERONET stations in the central and the eastern Mediterranean basin were used. The greater area of central and eastern Mediterranean (Figure 1) was selected as the domain of the study because of the frequent dust outbreaks originating mainly from northern Africa (Sahara Desert). In Figure 1, the exact location of the selected AERONET stations used in this study is shown.
The second type of data was multispectral satellite images from the SEVIRI (Spinning Enhanced Visible InfraRed Imager) instrument onboard the MSG platform (Meteosat-10 and Meteosat-11). More specifically, the brightness temperatures (BTs) at pixel level for the channels with spectral centers at 8.7, 10.8, and 12 μm were used. In addition, two BT differences, BTD (12.0μm-10.8μm) and BTD (10.8μm-8.7μm), were also computed and used. It was documented that all the abovementioned SEVIRI channels and their differences could be combined to efficiently identify the dust load at different atmospheric levels either during the day or at night (e.g., [31,48,49]). Moreover, BT at pixel level for water vapor (WV) channels with spectral centers at 6.2, 7.3, and as their difference, BTD (6.2μm-7.3μm), were used to mask optically thick cloud patterns and humid atmospheric layers, as explained in Section 3. It was noted that all Meteosat satellite images in every one of the abovementioned channels with temporal resolutions of 15 min were collected for selected time periods during which five notable episodes of dust transportation occurred over the greater Mediterranean basin (20–26 February 2017, 17–22 March 2017, 10–15 May 2017, 1–8 February 2018, and 20–25 March 2018). Five case study periods with notable dust episodes were selected applying a specific statistical threshold based on the total frequency distribution of all stations’AOD550 nm values. More specifically, the aforementioned periods were considered periods with dust outbreaks if the distribution of AOD550 nm values for all used stations had a 95th percentile value larger than 0.5 (i.e., if at least 5% of the total number of recorded AOD550 nm values from all used stations during every case study period exceeded the threshold of 0.5). As shown in Figure 2, the specific criterion were met in the five selected cases. It should be clarified that the AOD550 nm values of the distributions of Figure 2 were filtered with the “cloud mask” criterion (explained in Section 3.1). At this point, it was noted that from a statistical point of view, the 95th and 5th percentiles were typical thresholds for defining outliers from the main distribution of values, while AOD values larger than 0.5 were indicative of notable dust transport in the Mediterranean atmosphere [24].
Finally, for assessing the performance of the ANN model, satellite-based data products from the MODIS instrument (onboard the Terra/Aqua satellite platforms) were also used. More specifically, daily Level-3 MODIS AOD 1° × 1° gridded data [50] were used and compared to the AOD outputs of the ANN model.

3. Methodology

All the collected datasets described in Section 2 were automatically analyzed through an algorithm that was developed with an aim (among others) to monitor AOD550 nm in real-time using Meteosat multispectral imagery. More analytically, an internal programming module of the algorithm was developed in order to automatically perform a spatiotemporal correlation between ground-based AOD550 nm data from the 14 AERONET stations and pixel BT and BTD values from SEVIRI satellite images. Data used in this spatiotemporal correlation came from the case studies in Figure 2. The created sample of paired values was necessary for training and evaluating the ANN model, since it related station ground-based AOD550 nm measurements with Meteosat pixel-level spectral BT and BTD values. This actually defined the relationship between the dependent variable (AOD550 nm) and the independent variables (BTs and BTDs). In conclusion, through this procedure, a final dataset with correlated sets of pixel-level values of AOD550 nm, BT, and BTD (specified in the previous section) was created. As abovementioned, the final dataset consisted of values for the selected five case study periods for 34 days in total. In this way, 10,254 paired values were collected and analyzed (this number of values represents the total number of cases that are presented in Figure 2).

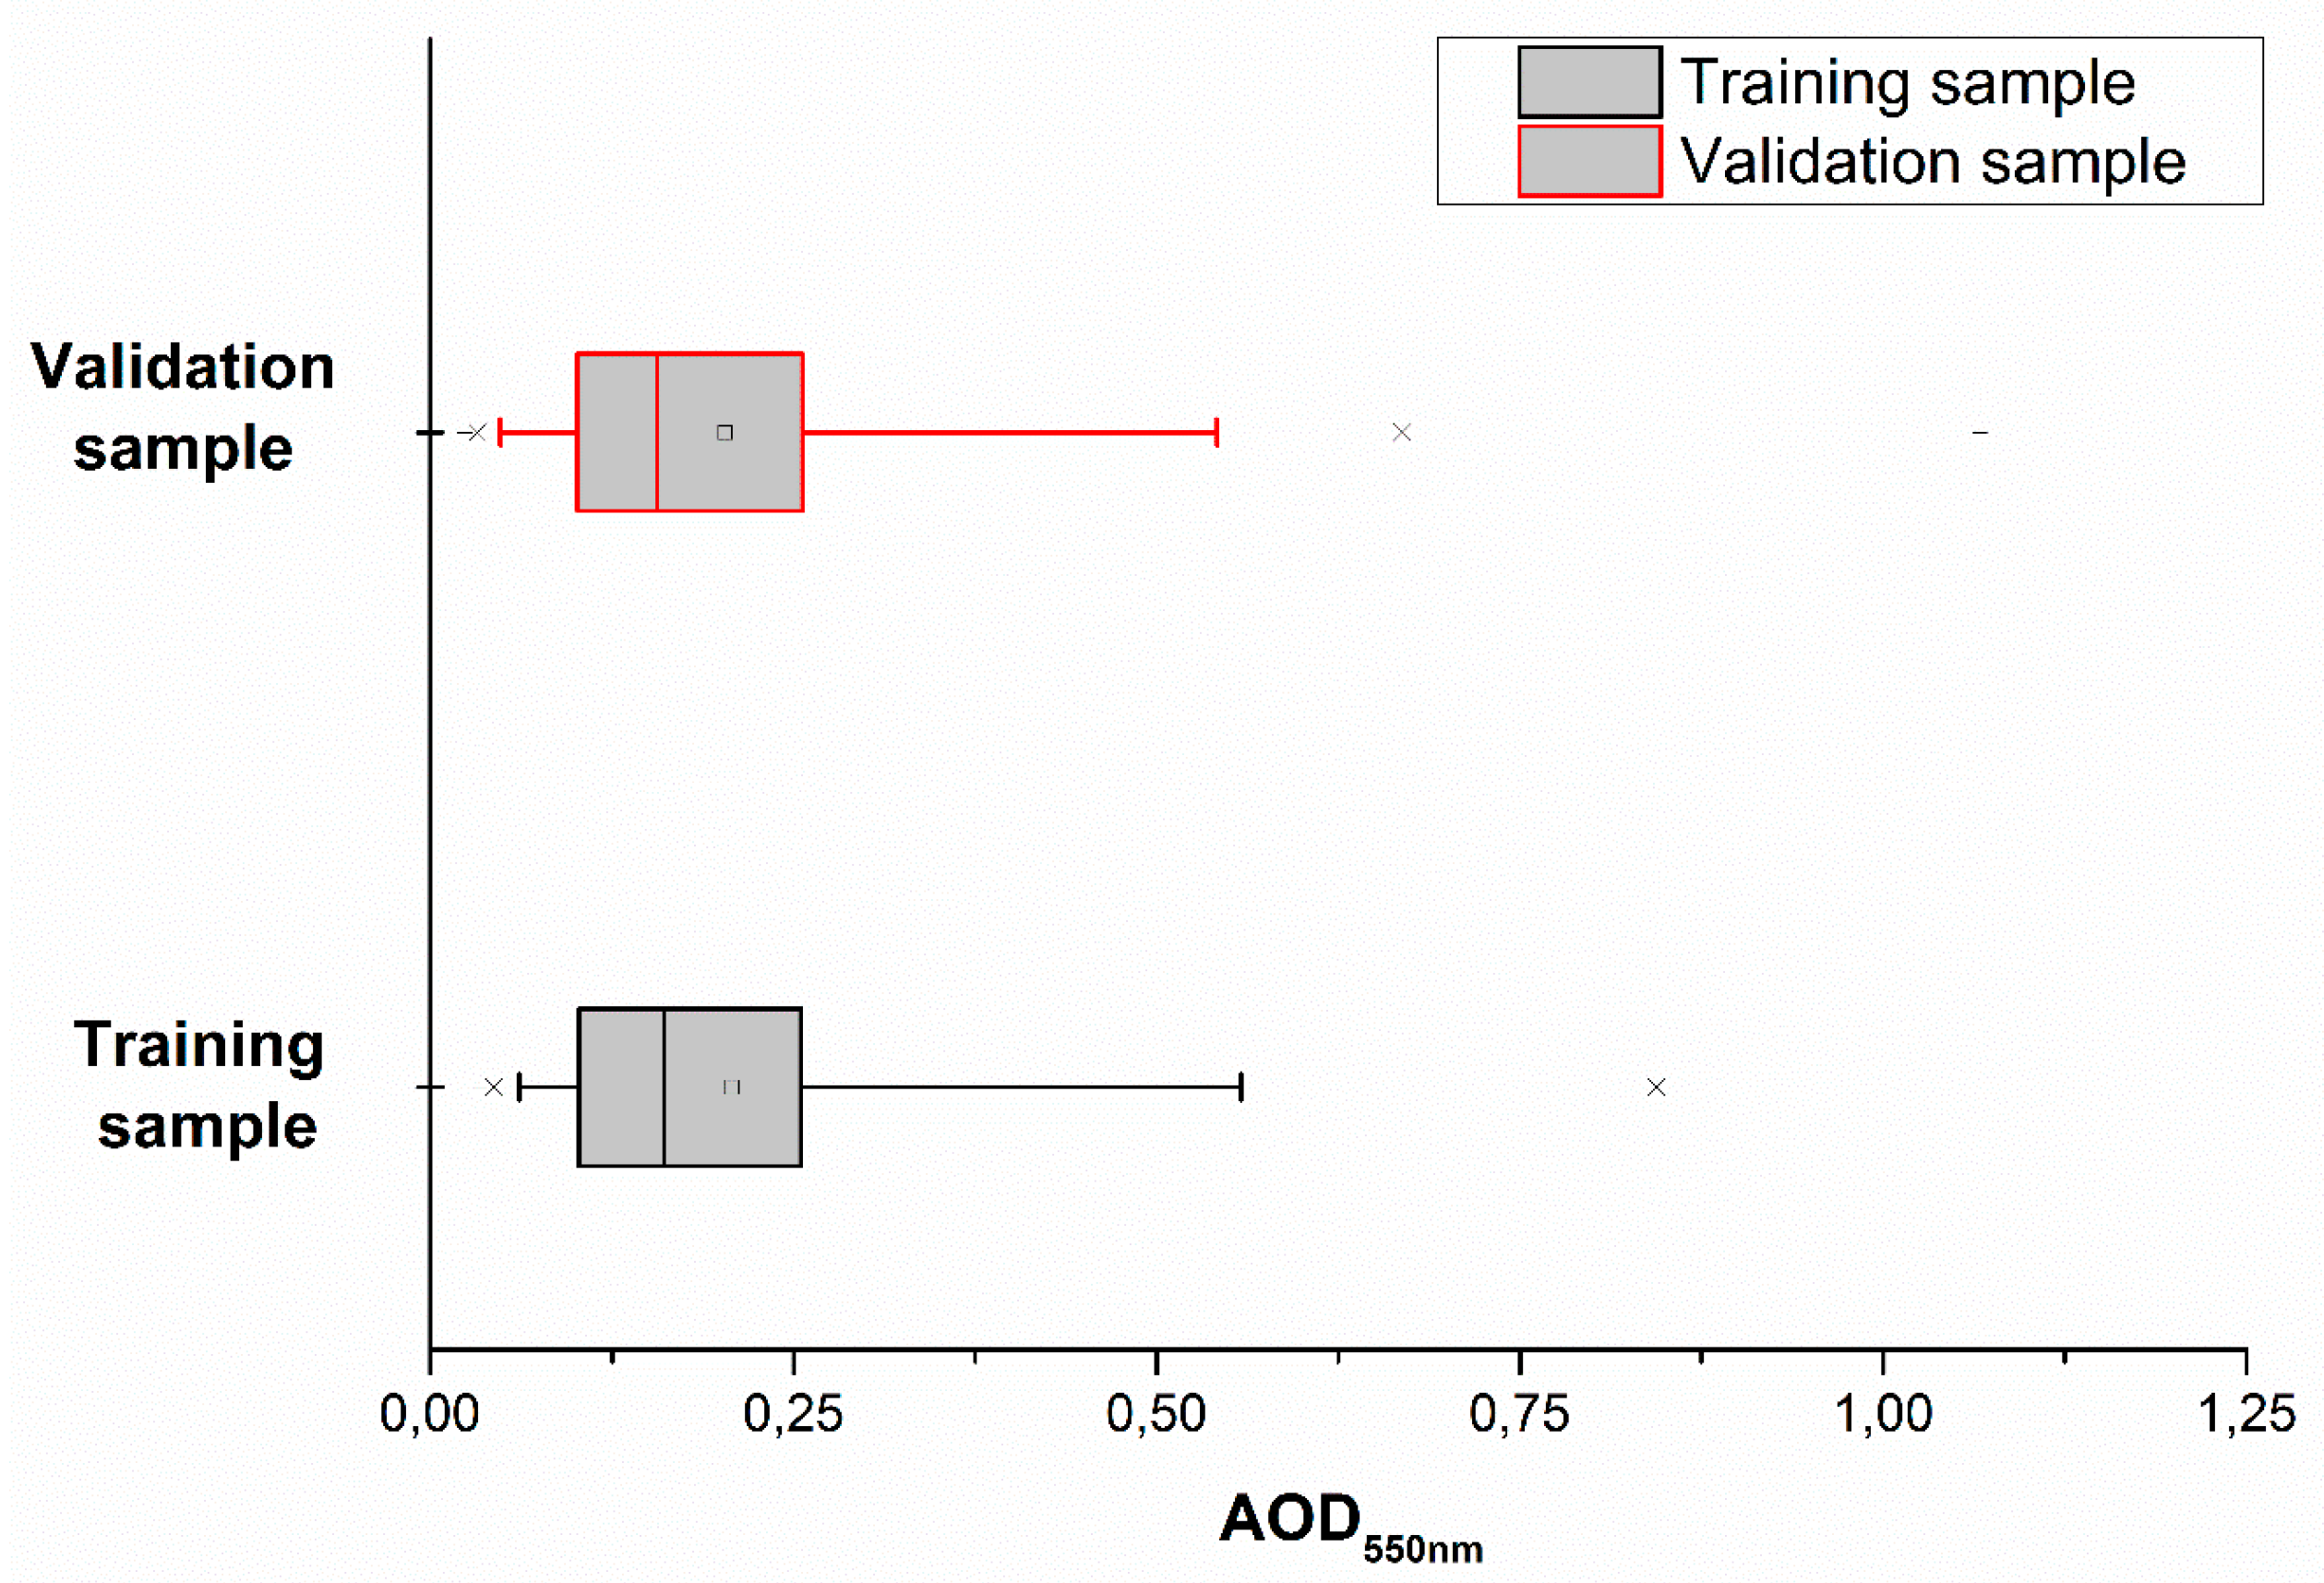
3.1. Data Pre-Processing and Filtering

Before the spatiotemporal correlation of the two types of datasets, the BT and BTD data were filtered by applying a simple thresholding procedure, which played the role of a mask for excluding optically thick cloud patterns as well as humid atmospheric areas. This procedure aimed at excluding cases with a presence of water vapor content in the atmosphere, which prevented observation of dust from the satellites. It is known that atmospheric water vapor along with cloudiness have a significant effect on the detection of airborne dust (e.g., [51,52]), and that the BTD of SEVIRI water vapor (WV) channels can efficiently delineate thick and humid cloud patterns like convective systems. Therefore, SEVIRI WV channels of 6.2 and 7.3 μm were used here in order to isolate relatively dry atmospheric regions without cloudiness. The same channels are widely used given their efficiency in detecting moisture at different atmospheric levels (e.g., [53]). More specifically, pixels with BTD(6.2μm-7.3μm) lower than −15 °C and BT7.3μm larger than −15 °C were considered valid pixels. Τhe choice of these threshold values was made based on the study of Kolios and Stylios [54], where the same channels and similar thresholds were found to appropriately delineate unstable and humid air masses. Application of the specific threshold values enabled exclusion of humid patterns and delineated dry and cloud-free atmospheric areas.
After spatiotemporal correlation between the two types of datasets, the final created dataset (total sample of data), consisting of 10,254 paired values, was split into two subsamples. One subsample (yielding 70% of the final dataset, randomly selected), which hereinafter is called “training sample”, was used to train a back-propagation ANN model, while the second subsample (yielding 30% of the final dataset, randomly selected), hereinafter called “validation sample”, was used to evaluate the accuracy of the ANN model. At this point it was also noted that the ANN model was developed as an independent internal module of the algorithm [55]. It was parametrized through a “trial and error” procedure until the optimal accuracy statistics according to Table 1 were achieved, thus ensuring the best possible reliable estimations of AOD550 nm loads based on SEVIRI multispectral satellite imagery.
It should be noted that random selection of training and validation samples ensured necessary similarity of their shape distributions and range of values. This similarity guaranteed that the ANN model was trained adequately (representatively). In this way, during the validation procedure, it was ensured that ANN model estimations could cover the whole range of values of the reference dataset (validation sample). In order to examine if the training and validation samples in the present study were statistically different or similar (regarding the shape of its distribution and the range of values), the Mann–Whitney–Wilcoxon statistical test [56,57] was performed. The result of this statistical test confirmed that the distributions of values of the training and validation datasets were not different at the 0.01 level of statistical significance (99% statistical confidence). Figure 3, displays the boxplot diagrams of the training and validation samples, showing their great similarity.
At this point it was noted that from a statistical point of view, the values of the 95th and 5th percentiles were classic thresholds to discriminate outliers from the main distribution of values, while an AOD value of 0.5 could be considered clear indication of notable dust transportation in the atmosphere [24].

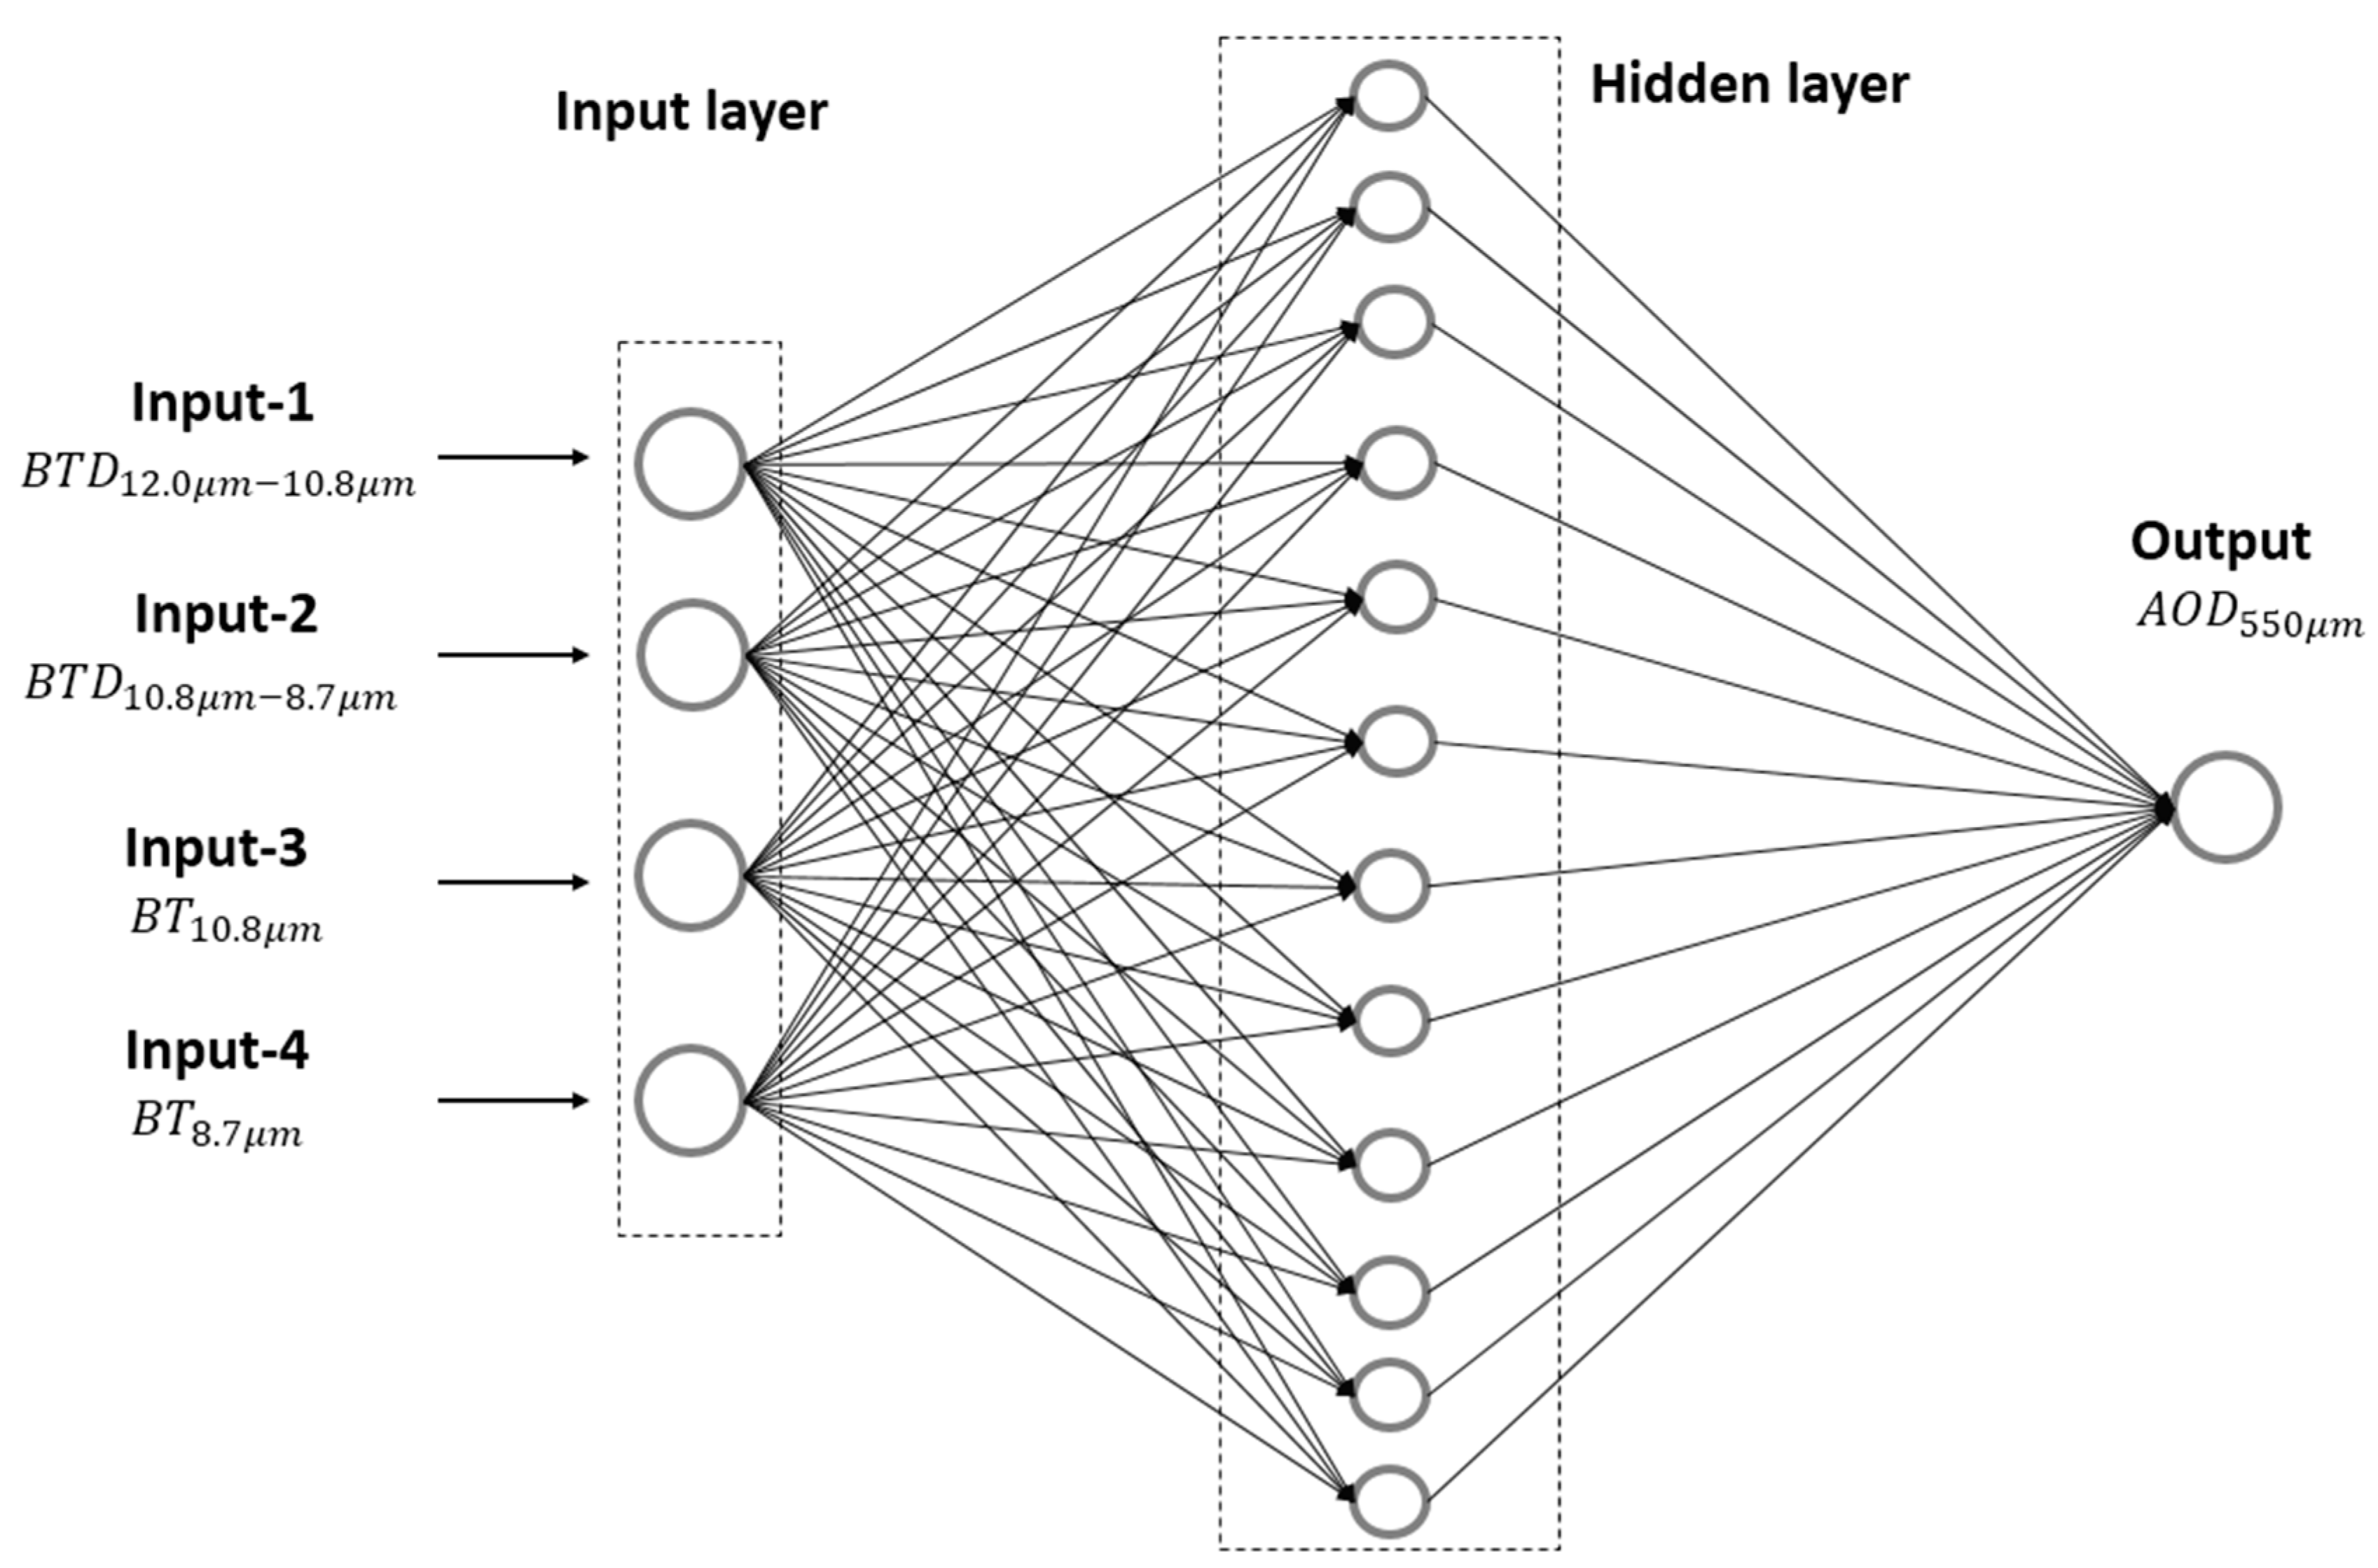
3.2. The Artificial Neural Network (ANN) Model

The developed back-propagation ANN model estimated AOD550 nm values using four (4) types of information (input nodes) from SEVIRI multispectral imagery (Figure 4). More specifically, the ANN model was designed to have four input nodes, which referred to the normalized pixel values of BTD(12.0μm-10.8μm), BTD(10.8μm-8.7μm), BT(10.8μm), and BT(8.7μm). The specific input nodes were selected because, as abovementioned, the information provided from these spectral regions was widely used to discriminate dust in the satellite imagery. Other than the four selected input nodes, such as elevation or visible radiances could also be used in the algorithm. However, use of four input nodes was decided in order to keep a relatively small number of inputs. Fast training of the ANN model and quick provision of its data products were desired since the ANN model was intended to produce final outputs at the same high temporal (15 min) and spatial (4 km) resolutions of Meteosat satellites. A larger number of input nodes containing information for an extended geographical region, like the Mediterranean in such a high spatial and temporal resolution, would significantly increase the response time of the ANN model and make the whole algorithm unable to provide outputs at the required spatiotemporal resolution.
After multiple tests for finding optimal parametrization, in terms of accuracy of the estimated AOD550 nm values, the final learning rate of ANN was set to 0.01, the number of iterations was 10,000, and the non-linear softplus function [58] was used as activation function, while the hidden layer consisted of 12 different nodes (Figure 3). Having this parametrization, the ANN model ran and provided estimations (output node) of pixel-level AOD550 nm values that corresponded to the real AOD550 nm values. These ANN outputs were compared to the validation sample of AOD550 nm. It should be mentioned that the term “learning rate” referred to a parameter that scaled the magnitude of ANN weight updates in order to minimize final bias of the outputs. Usually, a slow learning rate makes the ANN training procedure progress slowly as it makes small updates to the weights of the ANN, while a high learning rate can cause undesirable divergent behavior in the final outputs. The learning rate must be set carefully, after thoroughly checking the different values of this parameter as well as the produced final outputs for each learning rate. The term “hidden layer” (Figure 4) referred to a layer between input layers and output layers, where all the artificial neurons took in a set of weighted inputs in order to produce outputs through an activation function. The activation function was applied in each of the ANN nodes and defined the output of that node, or "neuron," given the set of inputs. The activation function helped the neurons of the ANN decide which outputs would be produced.

4. Model Evaluation

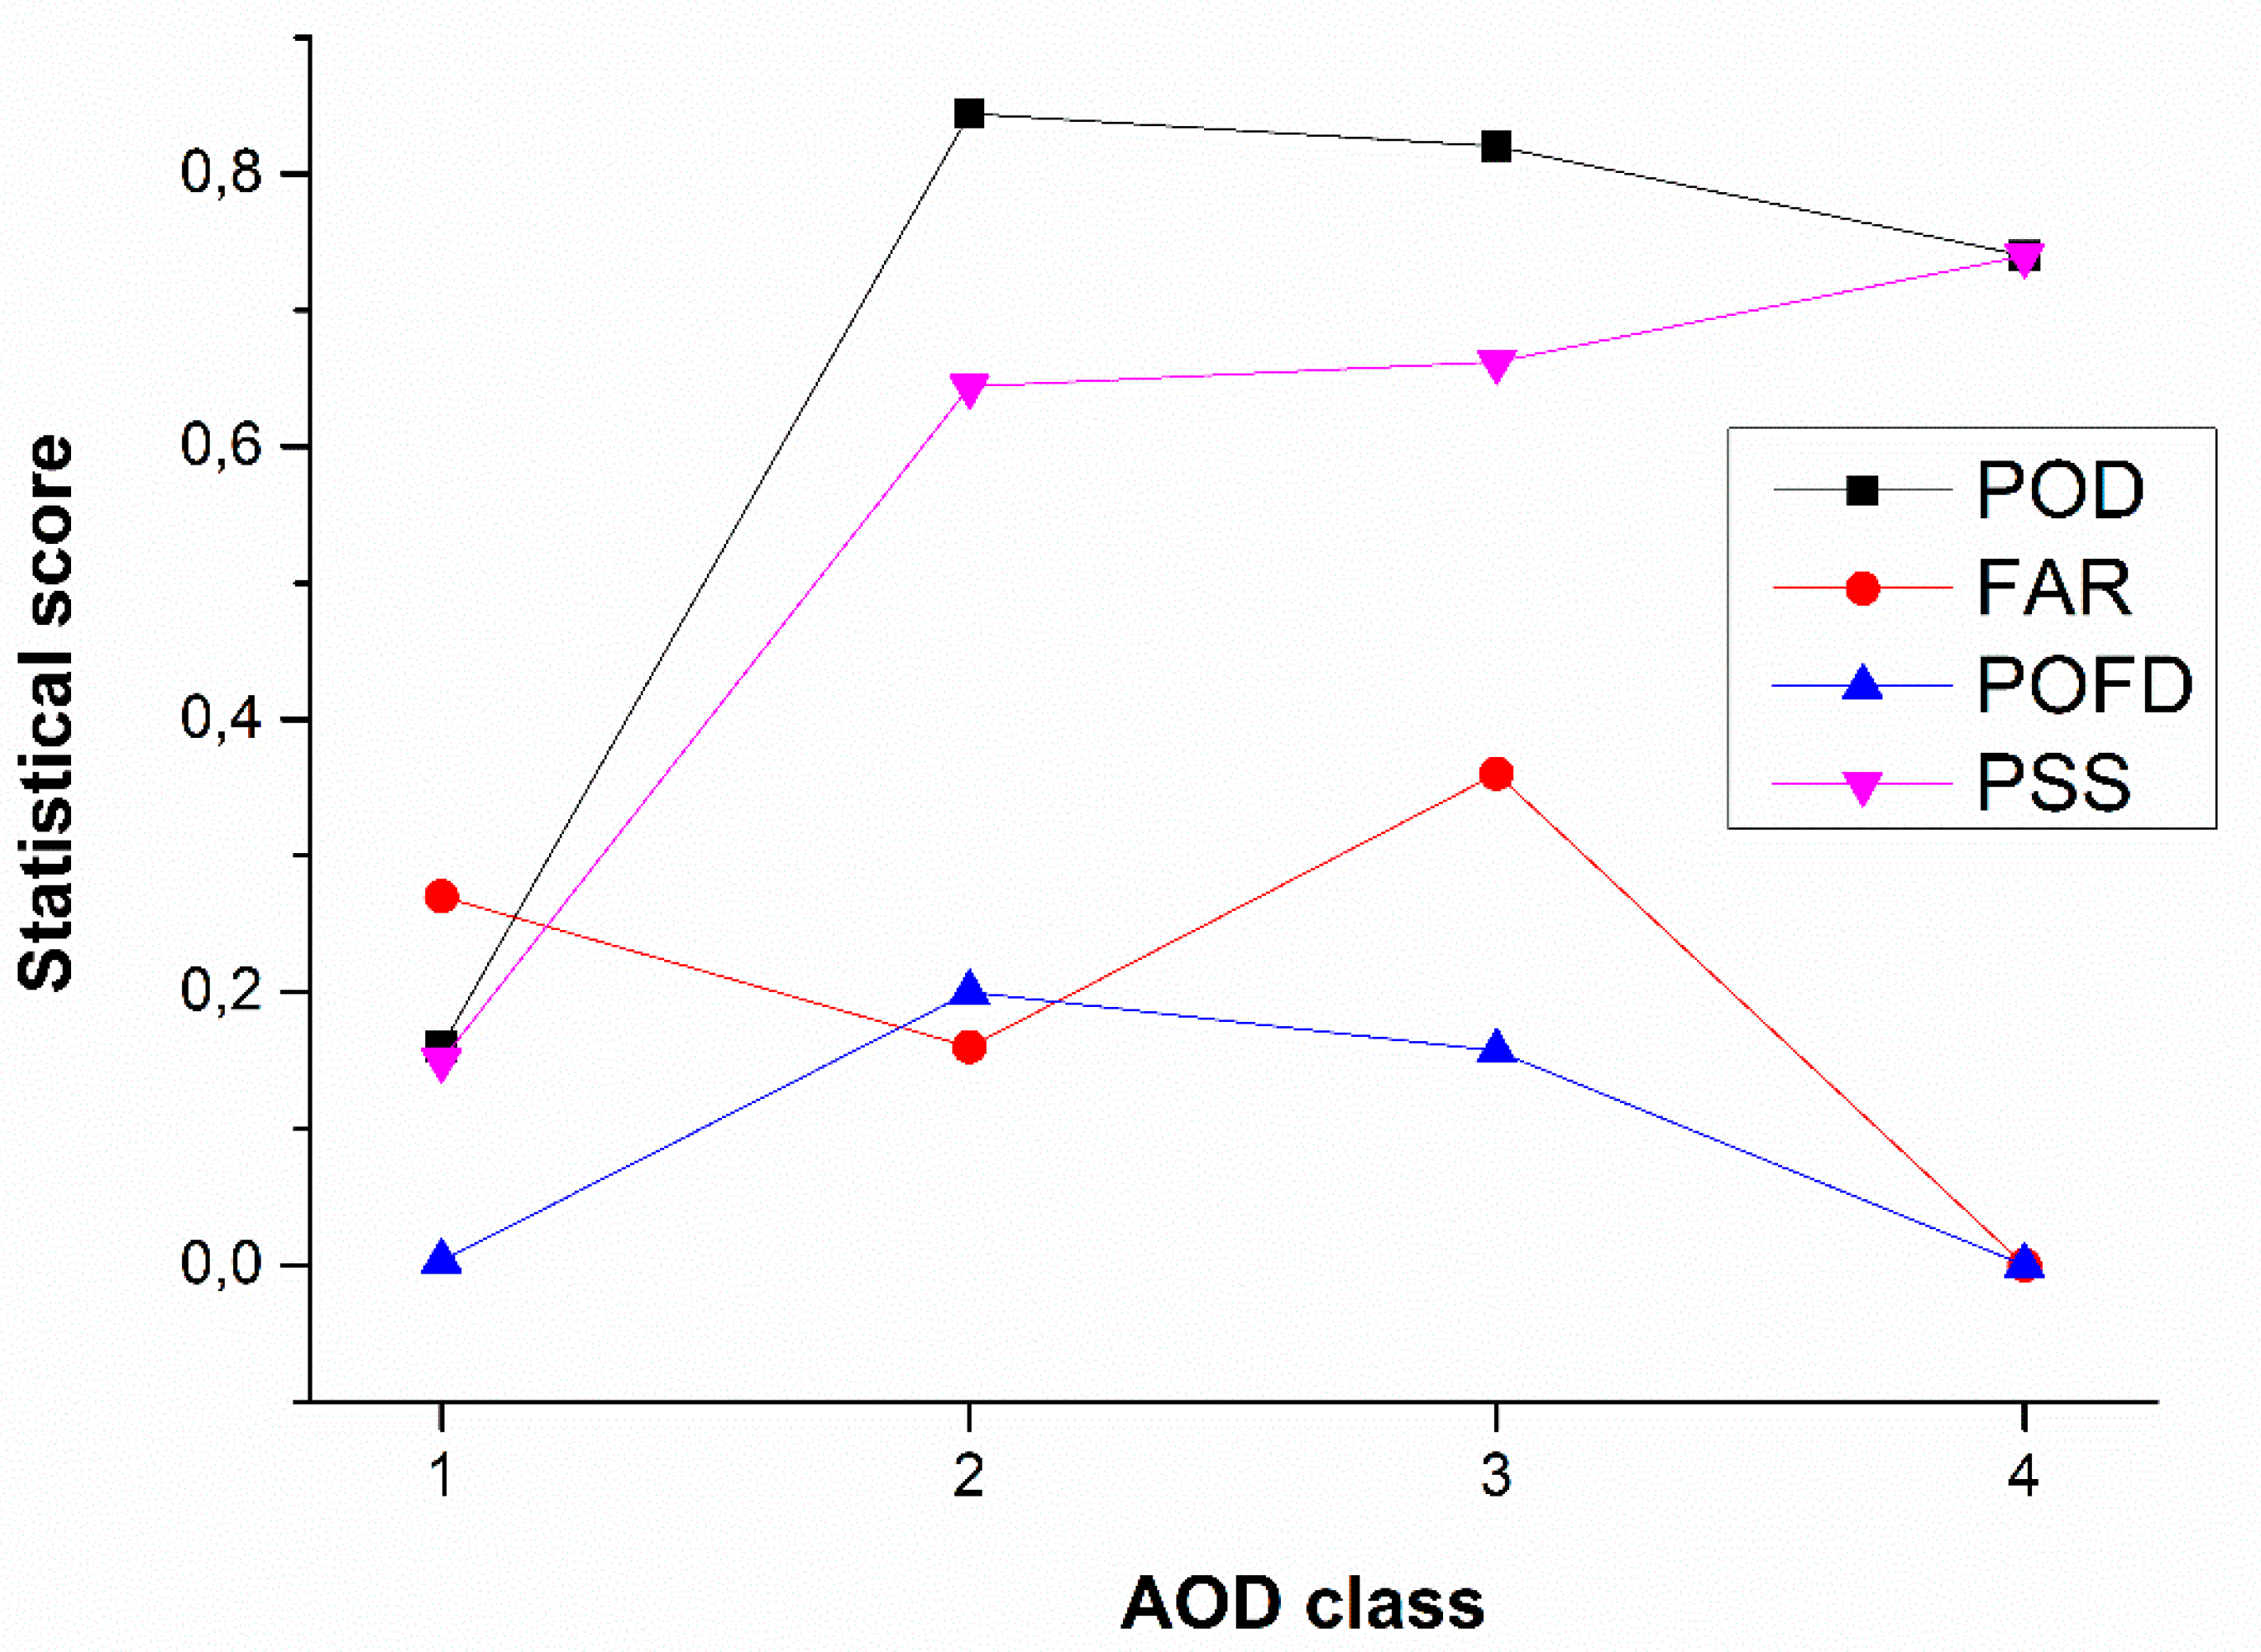
4.1. Overall Evaluation
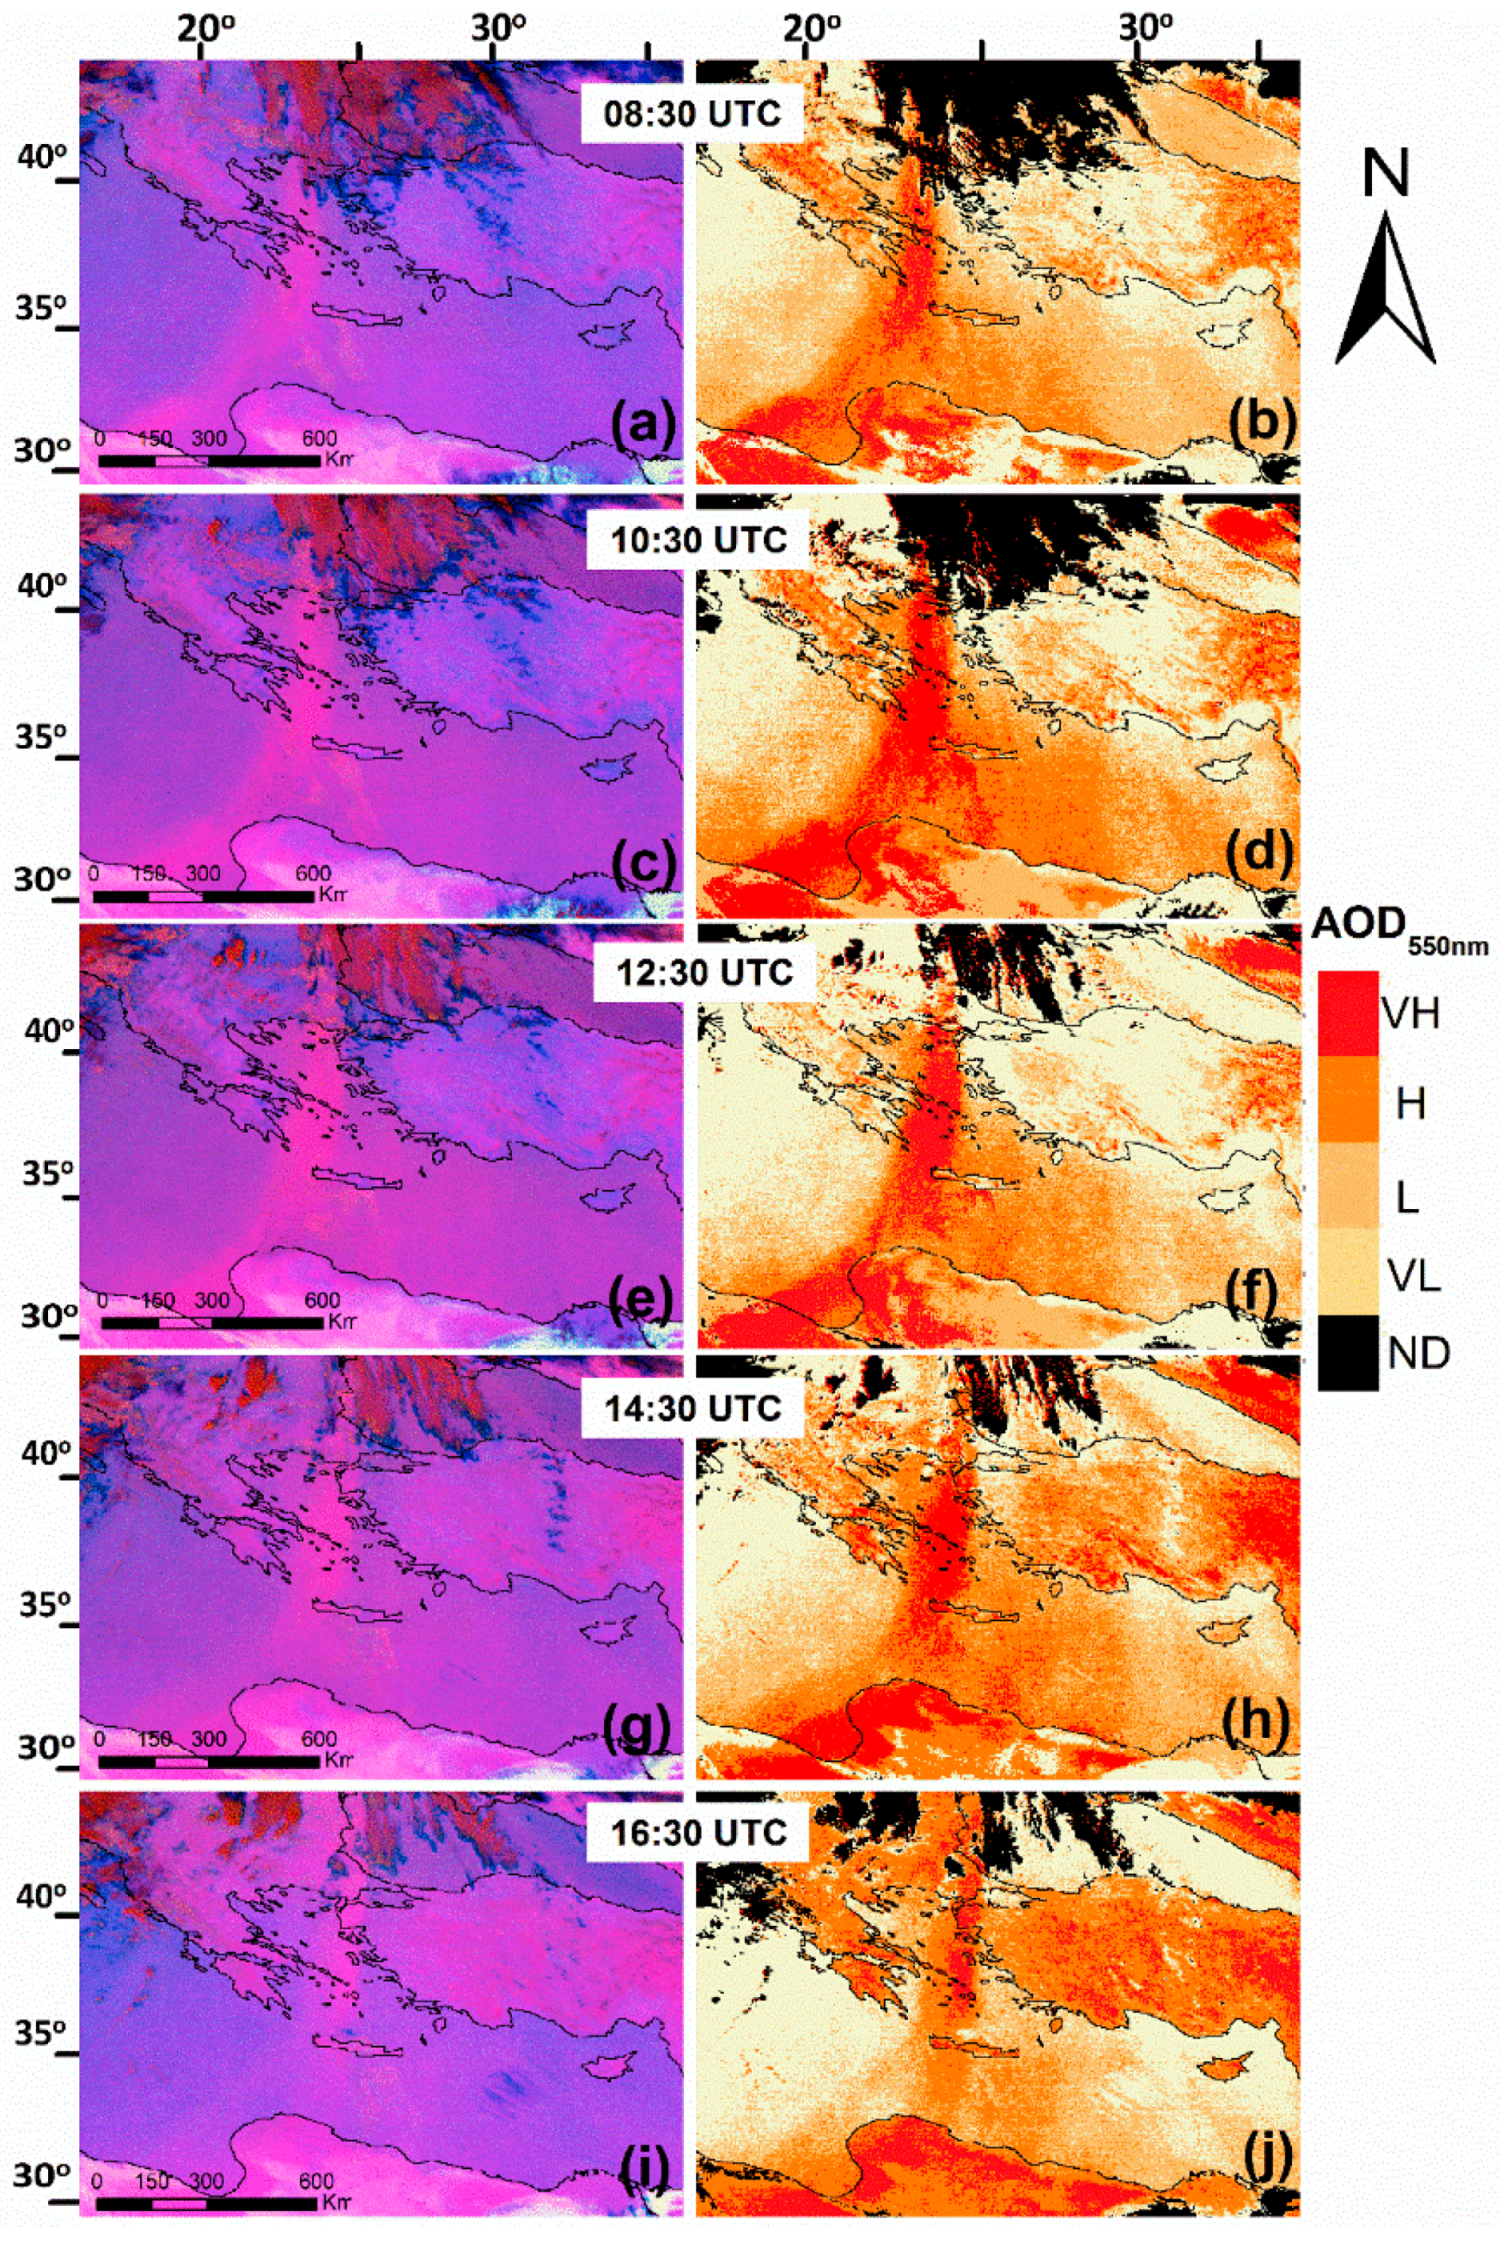
Evaluation of the ANN model was performed by calculating four basic statistical parameters that were widely used for assessing the accuracy of model estimations. These parameters were the mean error (ME), the mean absolute error (MAE), the root mean squared error (RMSE), and the Pearson correlation coefficient (rP). The equations and computed values of all statistical parameters in the ANN model, resulting from comparisons between estimated and measured AOD550 nm values for the validation sample, are provided in Table 1.
Statistical values in Table 1 confirmed satisfactory accuracy of the ANN model. Indeed, the AOD values of MAE, ME, and RMSE were one to two orders of magnitude lower than the values associated with significant dust episodes (AOD550 nm > 0.4). More specifically, compared to the overall mean AOD550 nm value of the validation sample (0.2 for the ground-based measurements, against 0.21 for ANN), MAE, ME, and RMSE were equal to 0.031, −0.0025, and 0.051%, respectively. Also, good correlation (0.91) between the ANN model estimations and the real AOD550 nm values underlined very good agreement in the whole range of values of the validation dataset.
A second statistical procedure was undertaken in order to evaluate the accuracy of the ANN model. A set of statistical scores were calculated that quantified the model’s efficiency in producing adequate estimates in different (manually set) classes of AOD550 nm values representing four different levels of dust load in the atmosphere. The four different ranges of AOD550 nm values (i.e., classes of dust loads) were “very low dust”, “low dust”, “high dust”, and “very high dust” conditions in the Mediterranean. These classes of AOD550 nm were defined so that they comprised the measured values from the validation sample of data that fell within the following ranges: [AOD550 nm(min), AOD550 nm(mean) – AOD550 nm(stddev)) for class-1, [AOD550 nm(mean) – AOD550 nm(stddev), AOD550 nm(mean)) for class-2, [AOD550 nm(mean), AOD550 nm(mean) + AOD550 nm(stddev)) for class-3, and [AOD550 nm(mean) + AOD550 nm(stddev), AOD550 nm(max)] for class-4. AOD550 nm(min) was the minimum value of the validation sample (equal to 0.01), AOD550 nm(mean) was the average value of the validation sample (equal to 0.2), AOD550 nm(stddev) was the standard deviation of the validation sample (equal to 0.16), and AOD550 nm(max) was the maximum value of the validation sample (equal to 1.39). It was noted that the number of values of each AOD class with respect to the total number of sample values were equal to 3.15% for class-1, 57.87% for class-2, 25.58% for class-3, and 13.4% for class-4. More specifically, a contingency table was used (Table 2), and four statistical scores were calculated (Equations (1)–(4)).
P O D = H ( H + M ) ;
F A R = F A ( H + F A ) ;
P O F D = F A ( F A + C N ) ;
P S S = P O D P O F D ;
where POD stands for the probability of detection, FAR stands for the false alarm ratio, POFD stands for probability of false detection, and PSS stands for the Peirce skill score. The symbols “H” (hit), “M” (miss), “CN” (correct negative), and “FA” (false alarm) are parameters that are presented and explained in Table 2. From a practical standpoint, “H” referred to the number of correct AOD estimates, “FA” referred to the total number of estimated values that belonged to a wrong class of values, “M” referred to the observed values that were wrongly estimated, and finally, “CN” referred to the total number of paired values that did not belong to the examined class of values.
The probability of detection (POD) score was the fraction of the number of observed values that were estimated correctly by the ANN model (within the range of values of each AOD class). It ranged from zero (low estimation ability) to one (high estimation ability). The false alarm ratio (FAR) was the fraction of wrong estimations with respect to the total number of estimations. It ranged from zero to on. An accurate model provided a low FAR score, while a bad model provided a high FAR score [58,59]. The probability of false detection (POFD) was the fraction of observed values that were estimated wrongly, and it ranged from zero to one. An accurate model provided a low POFD score, while a bad model provided high POFD values [59,60]. The Peirce skill score PSS accounted for all the elements of the contingency table, and it was calculated as the difference between the probability of detection (POD) and the probability of false detection (POFD). PSS values ranged from −1 to 1. A PSS value greater than zero meant that the number of hits (correct AOD550 nm estimates) was higher than the number of false alerts and indicated the model’s ability to estimate AOD550 nm values. An estimate had no predictive ability when PSS ≤ 0 [59,60].
The values of POD, FAR, POFD, and PSS statistical scores for each one of the four AOD550 nm classes are presented in Figure 5. It was found that POD scores were satisfactory (˃0.7) except for class-1 (“very low dust”), for which the POD was 0.16. For this class, FAR was 0.27, the POFD was 0.157, and the PSS was 0.15, with these score values indicating a relatively weak efficiency of ANN in estimating very weak dust loads in the Mediterranean, although PSS was still positive. Nevertheless, it should be noted that since this class included a small percentage of total sample AOD550 nm values (equal to 3.15%), this hardly affected ANN model performance overall. Under “low dust” and “high dust” conditions (class-2 and class-3 in Figure 5), the model performed very satisfactorily. Indeed, POD was equal to 0.84 for class-2 and 0.82 for class-3, while the corresponding FAR values were 0.16 and 0.36 (Figure 5). The PSS was above 0.6 for both classes, while the POFD was below 0.2. Since the number of AOD550 nm values of these two classes represented 83.45% of the total number of sample values, the computed values of all the four scores confirmed the ability of the developed ANN model to accurately estimate AOD550 nm values using initial information from SEVIRI multispectral imagery. Finally, regarding the 4th AOD class (i.e., under “very high dust” load conditions), the values of computed statistical scores indicated, again, overall good accuracy. The POD and PSS scores were both above 0.75, while FAR and POFD were close to zero for the examined validation sample. Consequently, it was shown that the ANN model performed very well, generally, in 96.6% of cases, producing accurate estimations of AOD550 nm over the Mediterranean basin.
Apart from the POD, FAR, POFD, and PSS scores, other statistical metrics, namely MAE, ME, RMSE, and rp, were also computed for each class and are presented in Table 3. The relevant conclusions on the performance of the ANN model were comparable to those drawn from Figure 5. More specifically, class-2 of AOD had the best results, but satisfactory results were also calculated for AOD class-3 and class-4. This was very important since these classes included large AOD550 nm values that corresponded to dust loads in the atmosphere.

4.2. Case Study

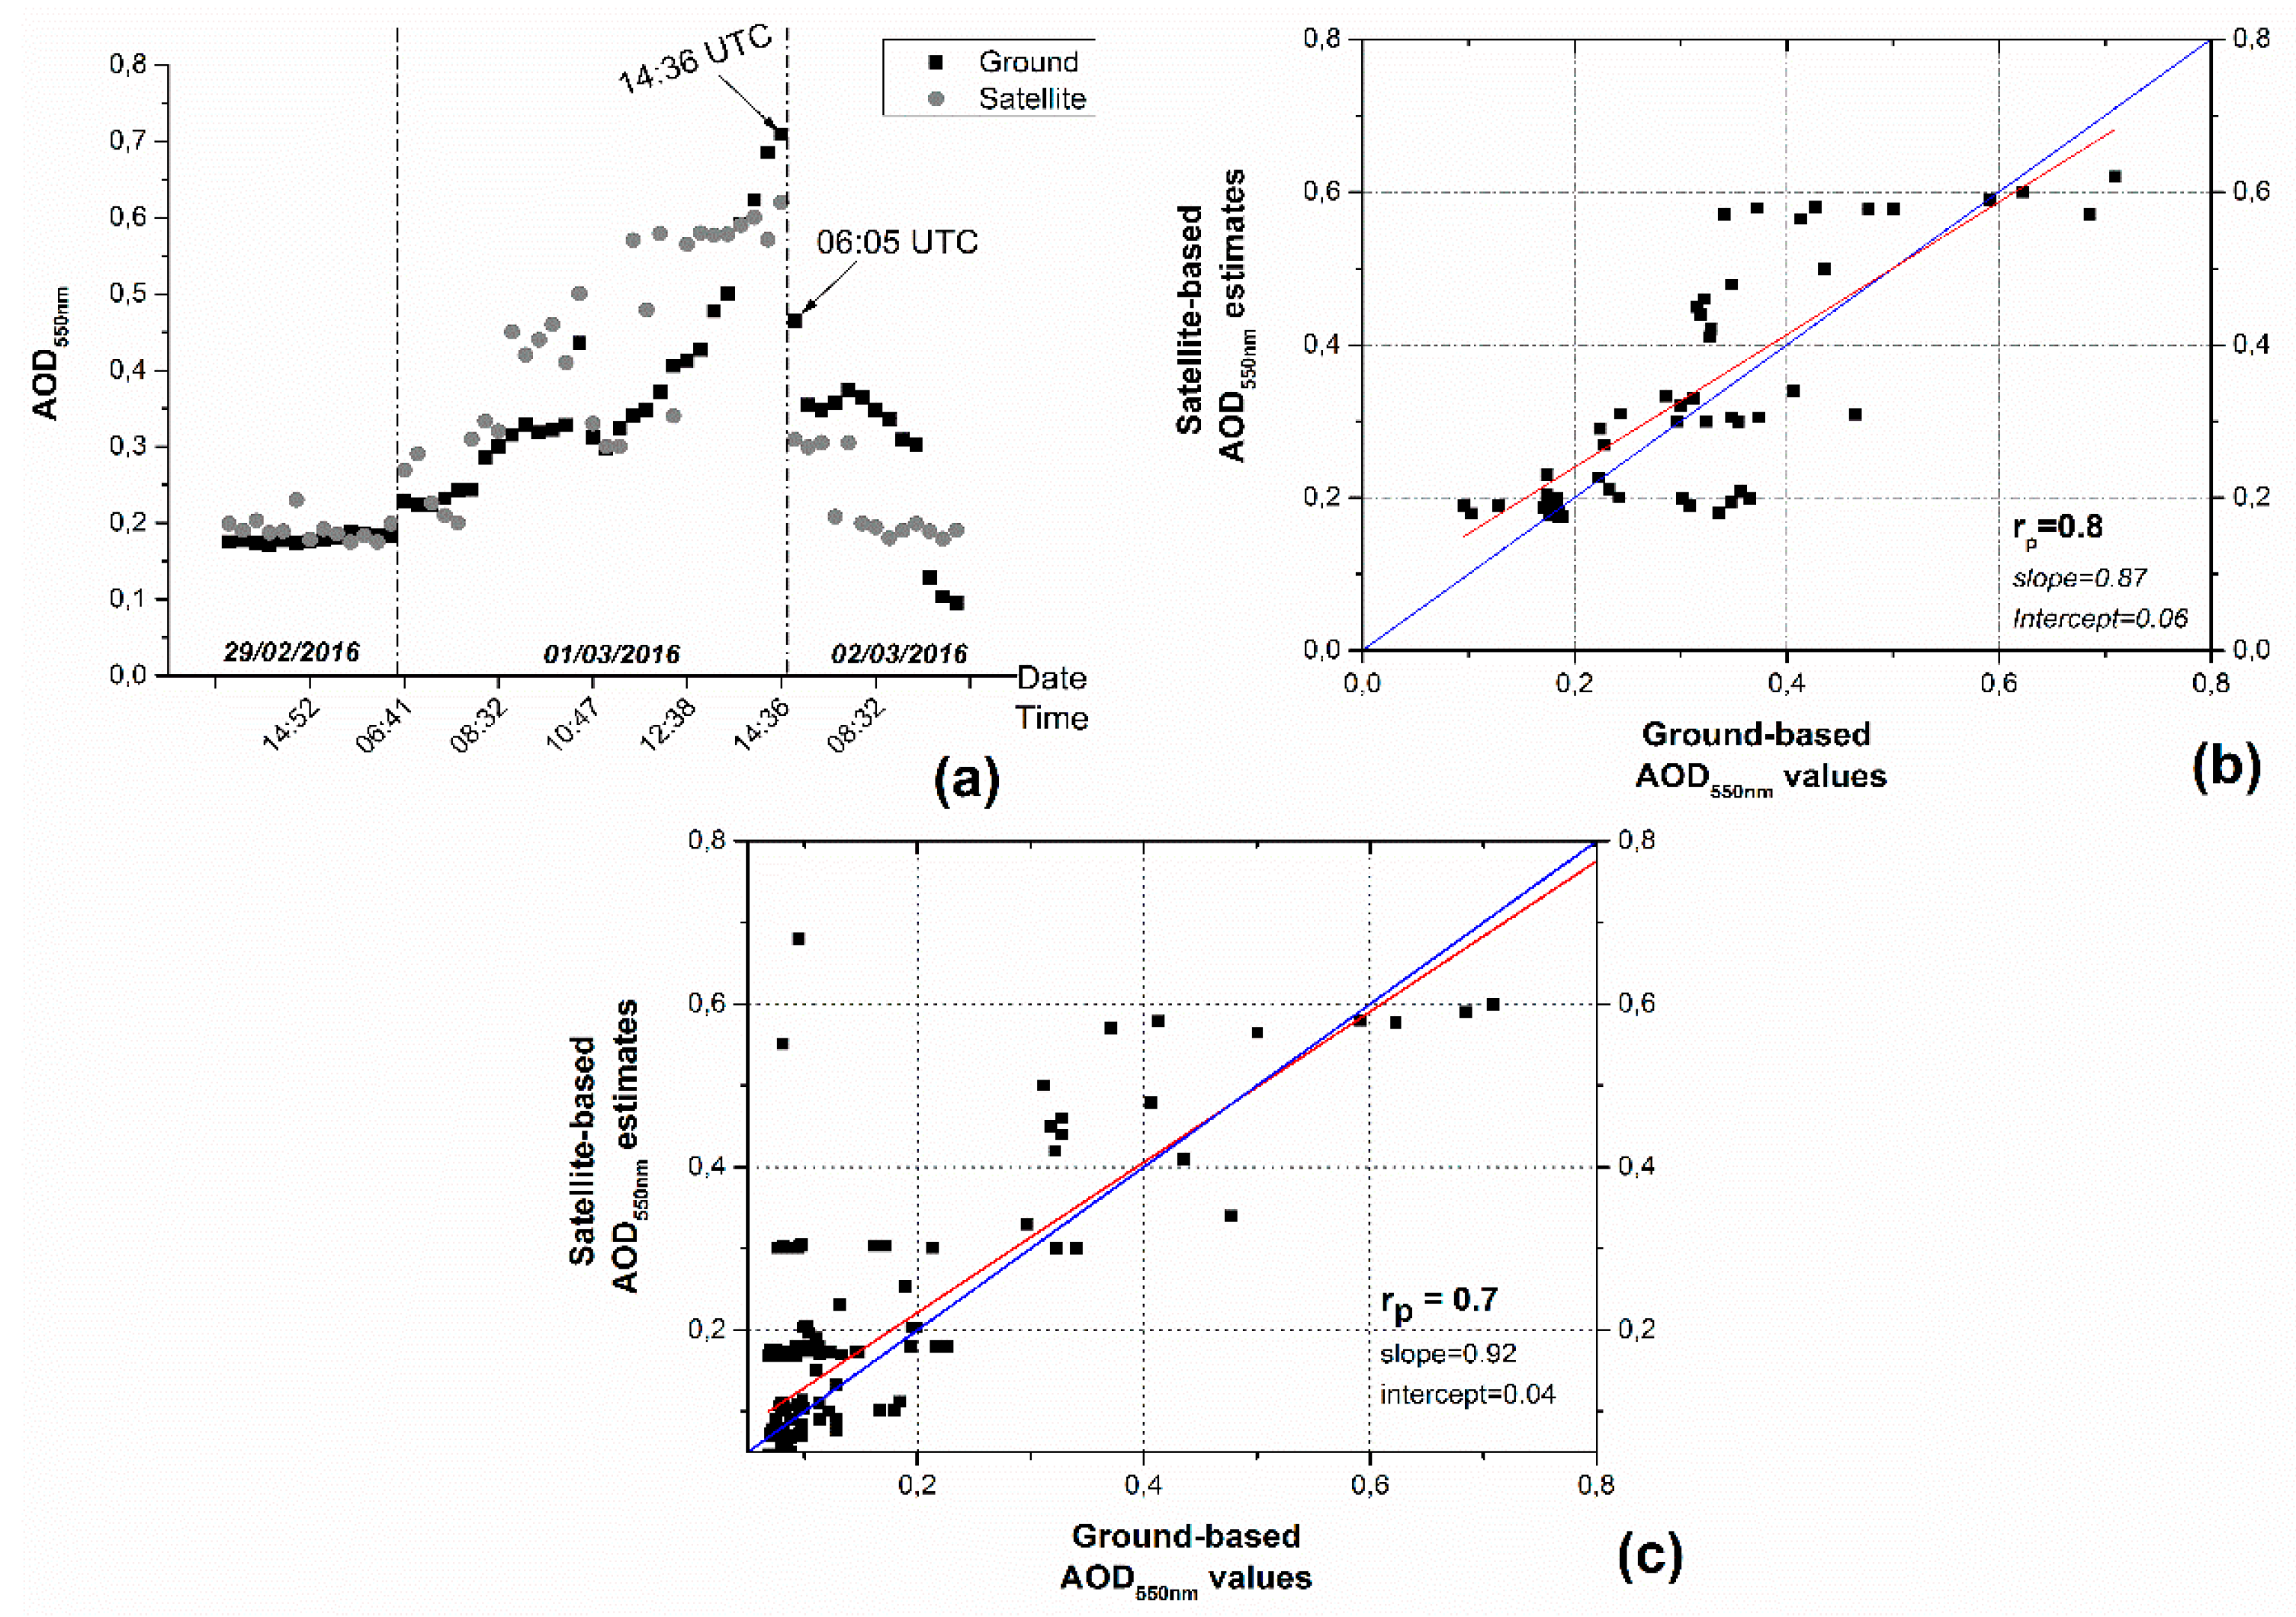
4.2.1. Evaluation of ANN Model Outputs against the Aerosol Robotic NETwork (AERONET)

Apart from the overall evaluation, a case study analysis was conducted in order to evaluate the ability of the ANN model to reproduce geographical patterns of dust load (i.e., AOD550 nm values) using BTs from thermal infrared imagery of Meteosat Second Generation imagery as the initial information. More specifically, on 1 March 2016 a significant dust transport from northern Africa to southeastern Europe occurred. Under southwestern air flow, dust from the Sahara region moved northeast and gradually covered significant parts of the Ionian and the Aegean Seas (Figure 6). Figure 6 shows that the main dust load overlaid the Gulf of Sirte (Libya), the southern Ionian Sea, and the Aegean Sea (Greece). Also, there were notable dust loads over the central Mediterranean Sea as well as over large parts of the eastern Mediterranean. The images on the left side of the Figure 6 are RGB composites (Red: BTD(12.0μm-10.8μm), Green: BTD(10.8μm-8.7μm), Blue: BT(10.8μm) μm), which is the usual way that information on dust load is provided [61,62]. The magenta colored parts of Figure 6 depict geographical regions that were covered by the dust load. It was important to note that the date of this case study did not include the period covered by the data used to train or validate the model.
Apart from evaluating visually (in Figure 6) the performance of the ANN model towards reproducing geographical patterns of dust transport on 1 March 2016, further numerical evaluation was also performed against ground-based AOD550 nm data from the reference AERONET network. The results are given in Figure 7. More specifically, ANN model AOD550 nm outputs were compared to corresponding outlets of the “FORTH_Crete” AERONET station in Crete (latitude: 35.333°N, longitude: 25.282°E). This specific station was selected because it was located on the pathway of dust transport in the studied case, and also because it had the largest availability of AOD550 nm data. In Figure 7a the day-to-day evolution of AERONET AOD550 nm retrievals and the corresponding estimations from the ANN model were given together. Both AERONET and ANN models indicated similar low AOD550 nm values on 29 February 2016 (i.e., one day before the dust event). On the morning of the next day (1 March 2016), the AOD550 nm values of both AERONET and ANN models started increasing until they reached high levels (up to about 0.7) as a result of the dust transport event that took place on this day (see Figure 6). Subsequently, AOD550 nm values decreased and became smaller than about 0.3 for both ANN and AERONET. The obtained results proved that the ANN model was able to reproduce the temporal evolution of AERONET AOD550 nm over Crete. This was also clearly shown in Figure 7b, where the relevant scatterplot comparison between the ANN model and AERONET AOD550 nm data for the studied dust transport event was given. The computed Pearson correlation coefficient (rp) was equal to 0.8, and the RMSE value was 0.09, thus highlighting satisfactory performance of the developed ANN model scheme. It was noted that the two statistical metrics (rp and RMSE) for the case study (0.8 and 0.09, respectively) were slightly inferior to the corresponding ones for the overall evaluation (0.91 and 0.051, Table 1). This was not strange since the statistical metrics of a specific case are expected (statistically) to be either slightly better or worse than the statistics of all the examined cases (Figure 2). Nevertheless, in both cases (i.e., the case study and the overall evaluation) the statistical metrics were very satisfactory.
In addition, apart from the evaluation of the model against the FORTH_Crete AERONET station for the studied case, a further evaluation was performed against all available AOD550 nm data from the total of AERONET stations of the study region for the day of the case study on which the dust event took place (1 March 2016). The results were summarized in the scatterplot comparison of Figure 7c, and they were quite satisfactory, yielding an overall correlation coefficient equal to 0.7, a slope value of 0.92, and a very small intercept (0.04). The large population of AOD550 nm data pairs with small values in the lower part of the scatterplot was explained by the fact that most of the AERONET stations were not found within the path of dust transport on 1 March 2016 (Figure 6 and Figure 8), thus having low AOD550 nm values. It should be reminded that the 14 AERONET stations (Figure 1) were located over both land and sea (coastal) areas, also including arid and non-arid regions. This differentiation in characteristics of the surface type of AERONET stations was important for the observed longwave radiation by the SEVIRI instrument through a semi-transparent atmosphere and different emitting surface types. Therefore, spatial distribution of the utilized AERONET stations covered different surface types and, thus, could be considered as sufficiently representative. The obtained satisfactory statistics of the overall comparison of the ANN model AOD550 nm products against those of 14 AERONET stations confirmed its ability to estimate AOD550 nm using Meteosat multispectral imagery.

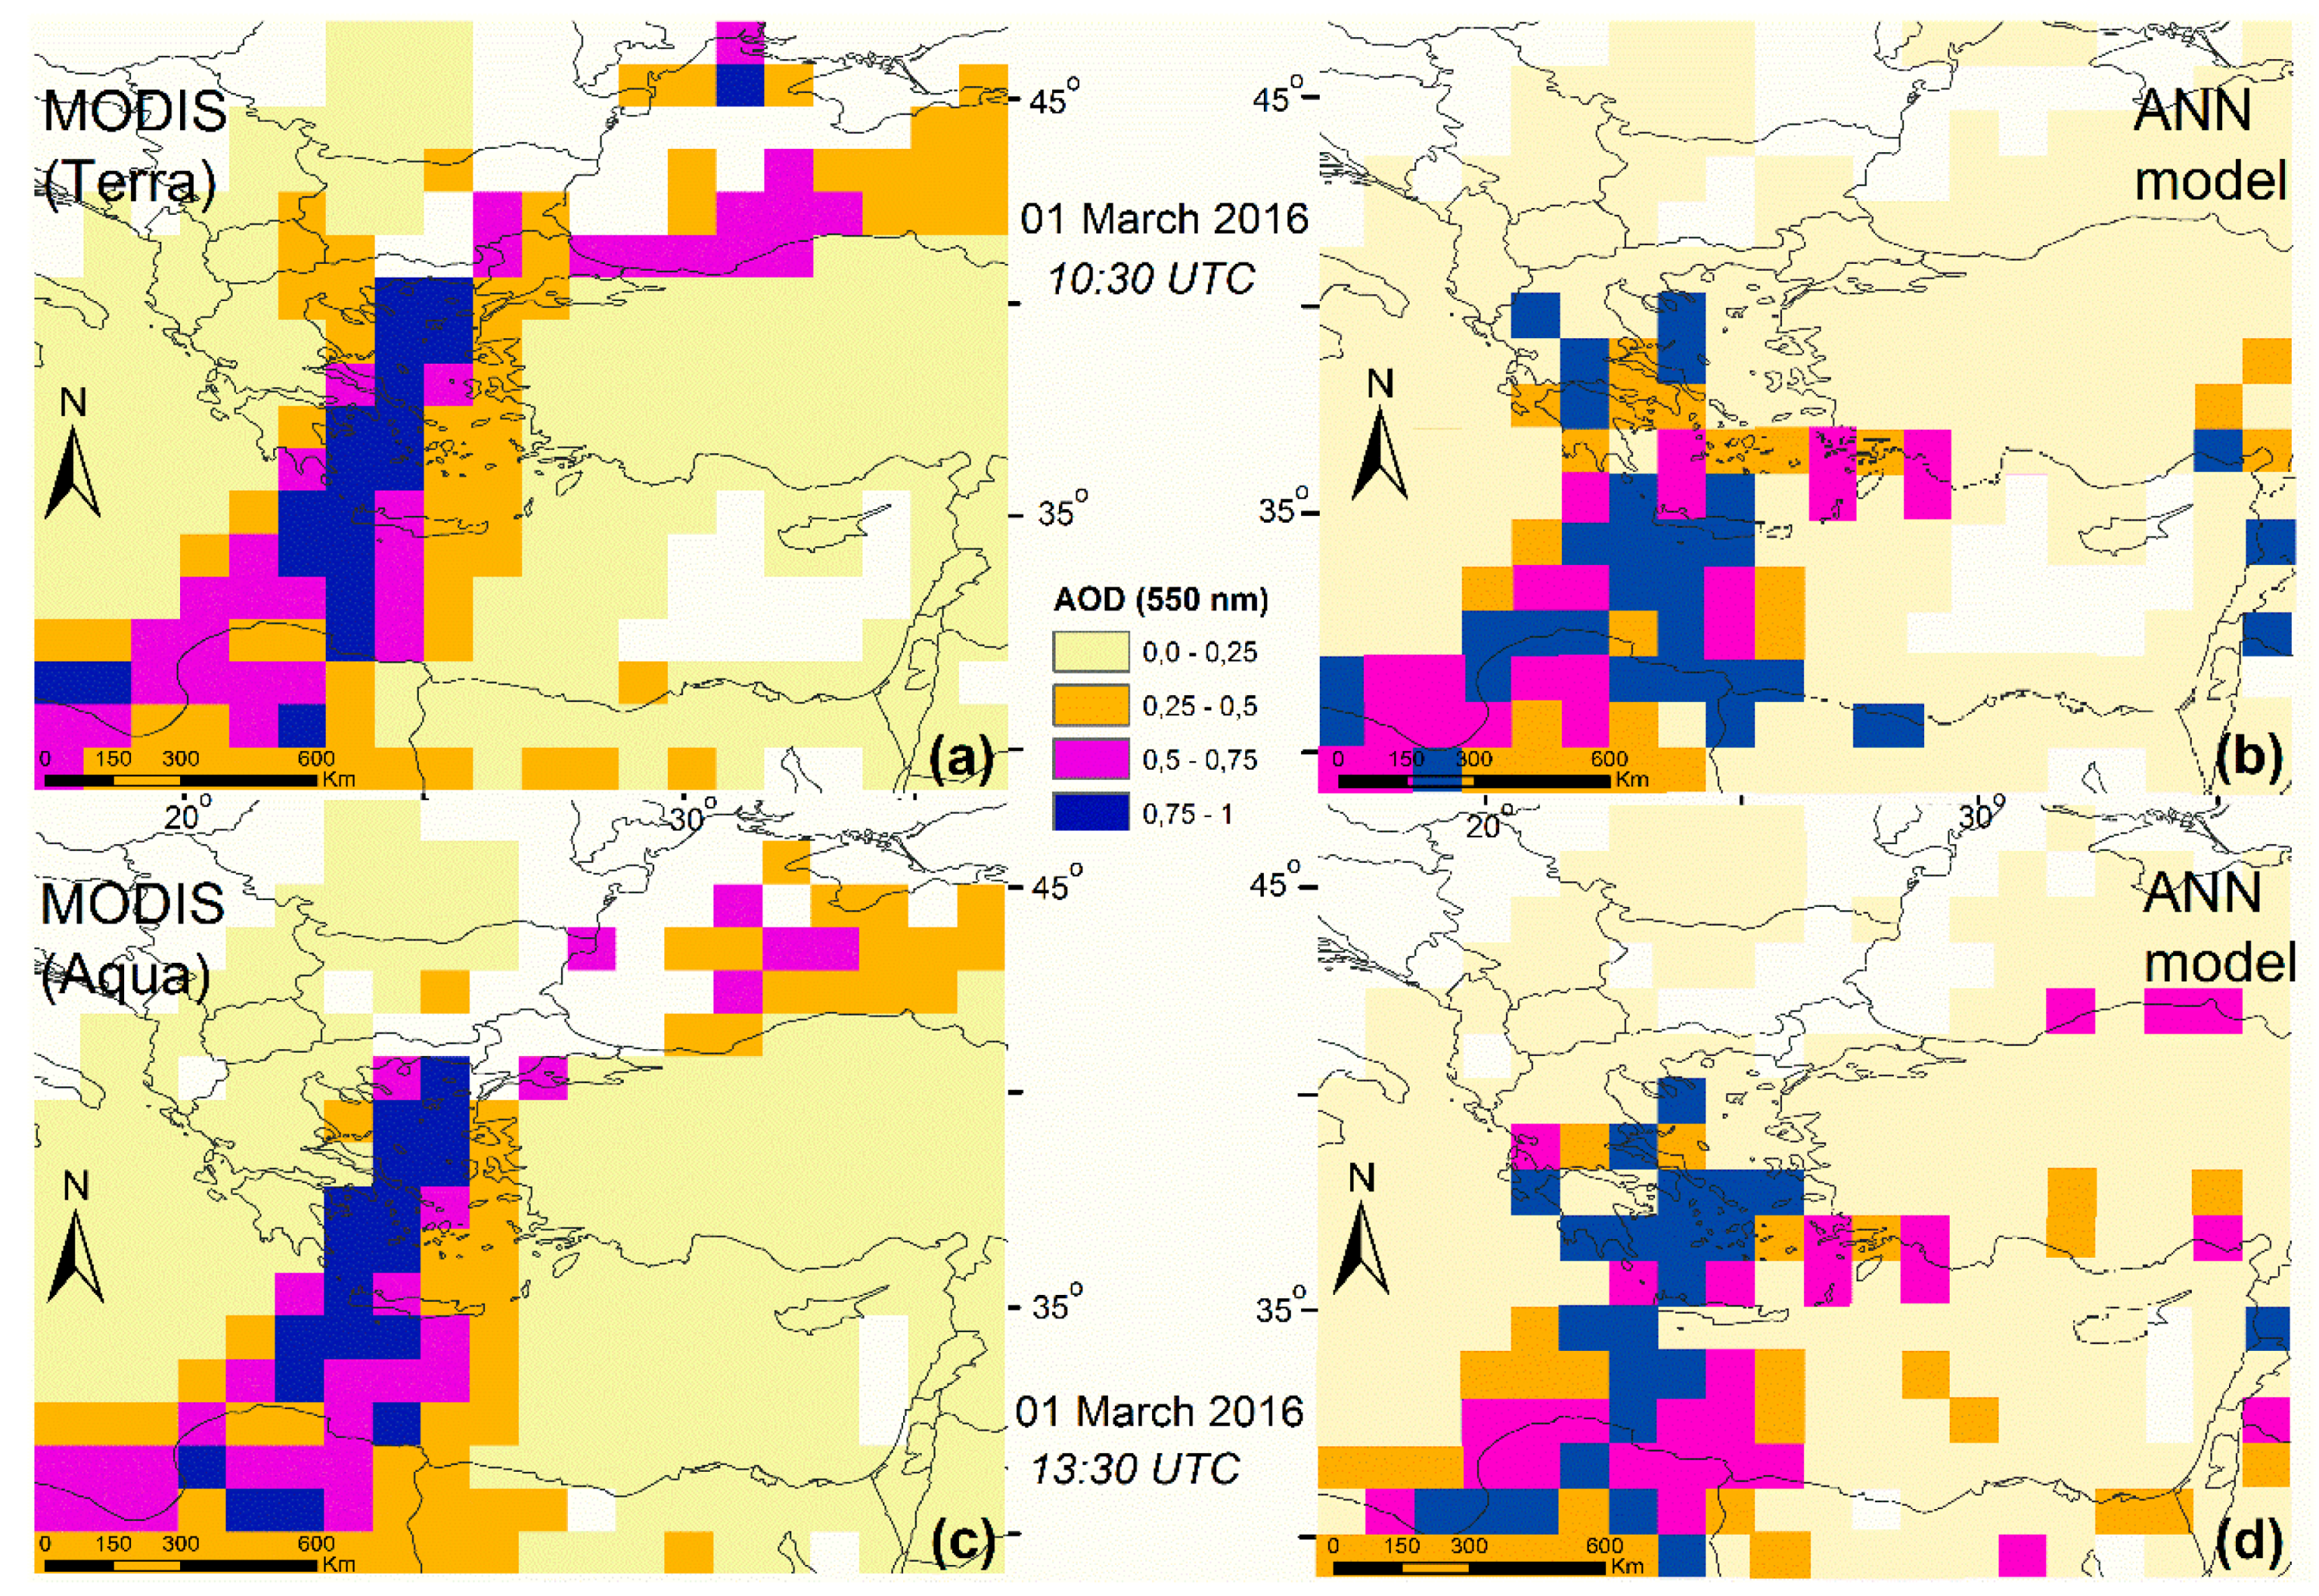
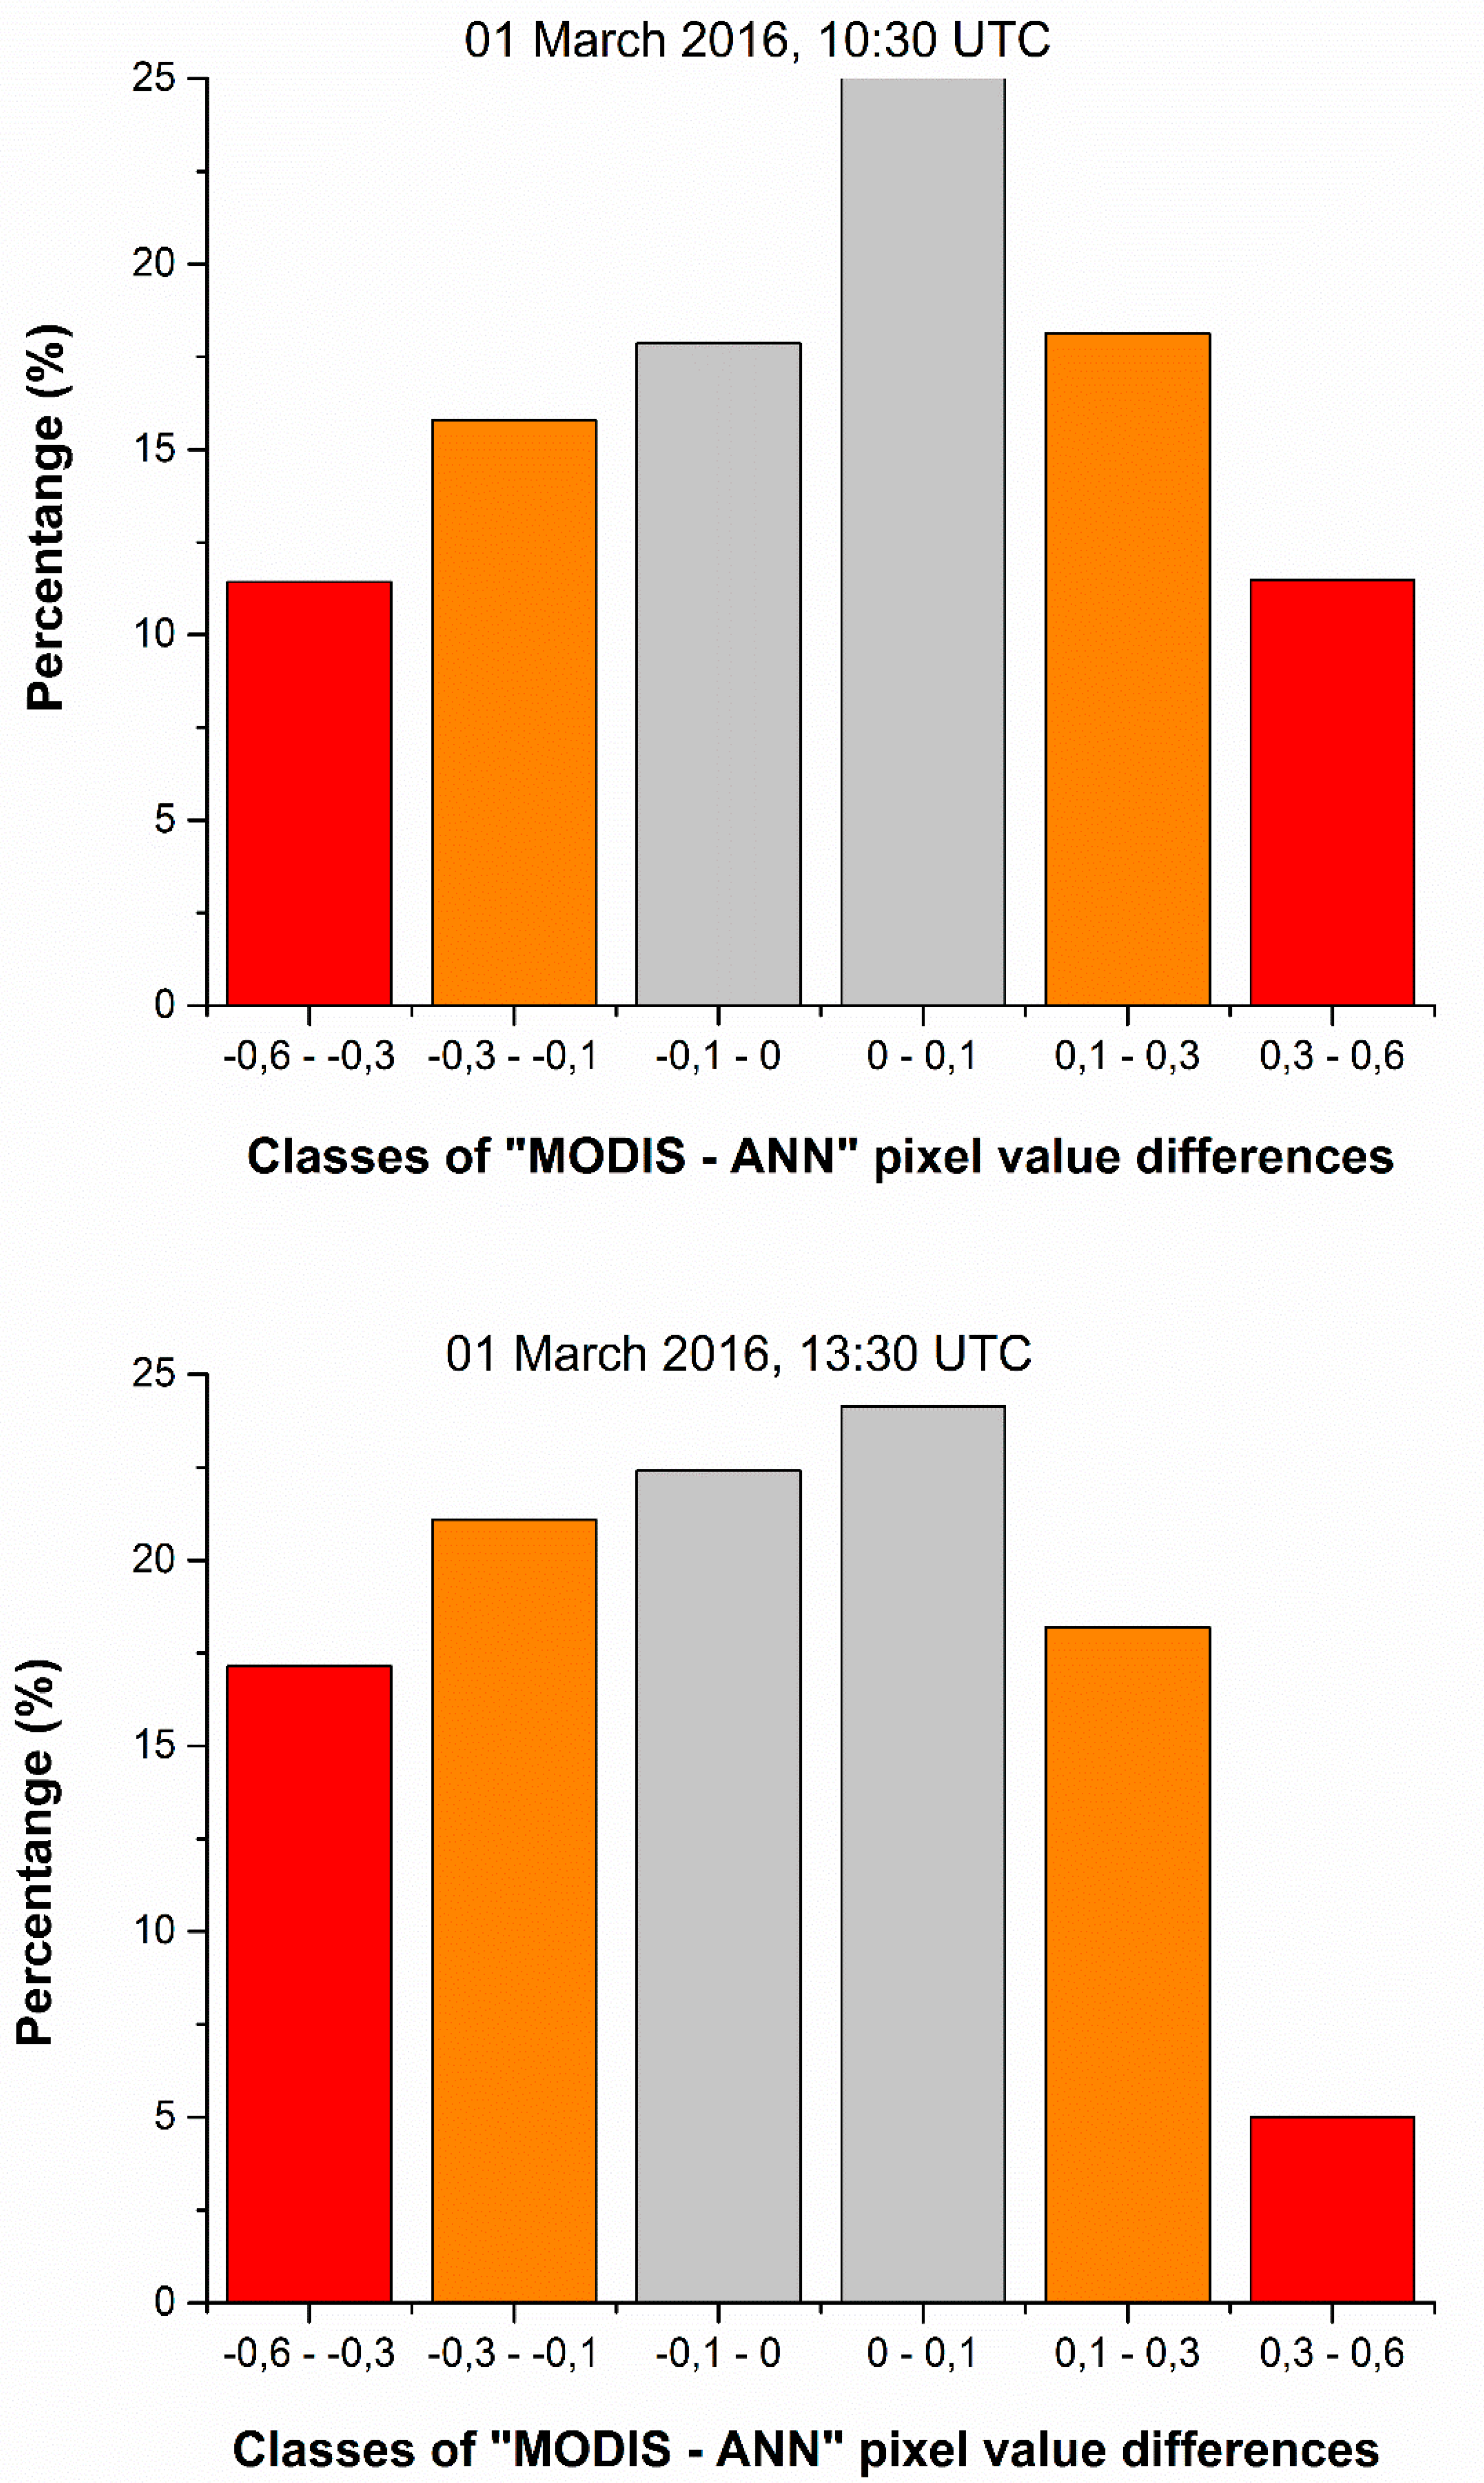
4.2.2. Evaluation of ANN Model Outputs against the Moderate Resolution Imaging Spectroradiometer (MODIS)

Apart from the comparison against the 14 AERONET stations, which ensured successful operation of the ANN model above different surface types, a further comparison was made against MODIS satellite data in order to inter-compare ANN model performance over the entire study region. MODIS-Terra and MODIS-Aqua AOD550 nm data have been extensively and successfully validated all over the globe (e.g., [63,64]) as well as over the Mediterranean basin (e.g., [65]) and, thus, are considered a high-quality dataset. More specifically, here the daily collection 6.1 Level-3 MODIS-Terra and MODIS-Aqua AOD550 nm data for the case study (1 March 2016) were utilized and compared to the corresponding ANN data. The AOD550 nm data of the ANN model that had a 4 km × 4 km spatial resolution were re-gridded to match the resolution of MODIS (100 km × 100 km). Re-gridding was done using the inverse distance weighting method. From the available upscaled ANN model AOD550 nm products (every 15 min during 1 March 2016), those corresponding to the time passages of the MODIS instrument were selected and compared (namely at 10:30 UTC for Terra satellite descending orbit and 13:30 UTC for Aqua satellite ascending orbit). Figure 8 shows the spatial distribution of the model estimated and MODIS-Terra and MODIS-Aqua AOD550 nm values over the study region on the day of the case study (i.e., on 1 March 2016).
There was an apparent similarity between the geographical distribution of modeled and MODIS AOD550 nm data, especially with regard to the main dust transport pathway extending from northern Africa up to Greece and the Aegean Sea. Of course, there were also some differences, as for example the absence of many high AOD550 nm values in the northern part of the study region (northern Greece and Black Sea) and the existence of high Meteosat-based values in the eastern part of the study region (Middle East). Nevertheless, the ANN model AOD550 nm product was consistent with Meteosat composite images (Figure 6a,c,e,g,i), which did not indicate the presence of dust over the Black Sea where significant cloud coverage occurred.
Comparisons of the ANN model against MODIS were also illustrated by the histogram distribution of their AOD550 nm pixel-level differences (Figure 9). For the comparison against MODIS-Terra (10:30 UTC), small AOD550 nm differences (from −0.1 to 0.1) were found in 43.2% of the total number of data pairs, while moderate differences (from −0.3 to 0.3) were found in 77.1% of the total population of data pairs. For the comparison against MODIS-Aqua (13:30 UTC) the corresponding percentages were equal to 46.6% and 85.9%, respectively, indicating satisfactory similarity between modeled and MODIS pixel-level AOD550 nm data.

5. Conclusions

In this study, a back-propagation ANN model was developed for quantitatively estimating different aerosol loads during dust outbreaks over the Mediterranean, in terms of AOD550 nm values at 550 nm, using combinations of brightness temperatures from different channels of the SEVIRI instrument onboard the MSG satellites as initial information. A thorough evaluation of the developed ANN model using a tested sample of data (validation sample) proved its accuracy since ANN AOD550 nm estimations yielded satisfactory statistical scores, namely a MAE of 0.031, RMSE of 0.052, and a Pearson correlation coefficient rP of 0.91. Moreover, further assessment of ANN accuracy for four different levels of dust loads (very low, low, high, and very high) also yielded good statistical scores, namely a probability of detection (POD) larger than 0.7 and a false alarm ratio (FAR) lower than 0.3, in almost all the examined classes of AOD550 nm values. The very satisfactory efficiency of the ANN model was especially confirmed for high AOD550 nm values, which corresponded to significant dust load transportation in the Mediterranean atmosphere. Finally, a case study of a specific dust transport event above the central-eastern Mediterranean on 1 March 2016 was presented, This showed ability of the ANN model to reproduce detailed patterns of either the geographical distribution or the temporal (hourly to daily) evolution of dust AOD550 nm as well as dust transport, as proven through comparisons against corresponding surface-based AERONET and MODIS (Terra and Aqua satellites) AOD550 nm data.
It is important to note that the present ANN model can be used for AOD retrievals on a real-time basis and also for providing AOD products at the same high spatial and temporal resolutions of Meteosat satellite imagery. On the other hand, it also can be used for deriving AOD products on a climatological basis using long-term spectral observations of Meteosat. In both cases, either real-time or long-term, the present model AOD products have the great advantage of high spatial (4 km) and temporal (15 min) resolutions, which combined with their extended spatial coverage (both land and ocean), make significant improvements to other existing similar data products (e.g., MODIS, MISR, AVHRR, OMI, etc.). Automated operation of the ANN model, as part of a system solely based on multispectral MSG imagery that aims to monitor and nowcast different features of storms (e.g., hail and heavy rainfall) as well as dust transport episodes, is also an important addition to the present tool.
In future steps, different ANN parametrizations (e.g., additional channels of image data from the SEVIRI instrument; additional dependent variables, namely latitude, longitude, and topography; and larger training/validation datasets) are intended to be studied for further improving ANN accuracy in estimating dust using Meteosat imagery.

Author Contributions

Conceptualization, S.K.; Methodology, S.K.; Software, S.K.; Validation, S.K. and N.H.; Formal Analysis, S.K.; Investigation, S.K.; Resources, S.K.; Data Curation, S.K.; Writing-Original Draft Preparation, S.K.; Writing-Review & Editing, S.K. and N.H.; Visualization, S.K.; Supervision, N.H.; Project Administration, S.K.; Funding Acquisition, S.K.

Funding

This research is implemented through IKY (State scholarships Foundation) programme, co-financed by the European Union (European Social Fund - ESF), and Greek national funds through the action entitled “Reinforcement of Postdoctoral Researchers”, in the framework of the Operational Programme “Human Resources Development Program, Education and Lifelong Learning” of the National Strategic Reference Framework (NSRF) 2014–2020.

Acknowledgments

The authors acknowledge the providers of all the different datasets used in this study: EUMETSAT (European Organization for the Exploitation of Meteorological Satellites) for the free provision of the Meteosat multispectral satellite images (raw datasets); NASAs Goddard Earth Science (GES) Data and Information Service Center (DISC) for the provision of the MODIS data product used in this study; NASA for the free provision of ground-based aerosol measurements in the framework of the AERONET (AErosol RObotic NETwork) Project; Greek State scholarships Foundation (“IKY”) and the European Union (European Social Fund—ESF) for financial support of this study through the action entitled “Reinforcement of Postdoctoral Researchers”, in the framework of the Operational Programme “Human Resources Development Program, Education and Lifelong Learning” of the National Strategic Reference Framework (NSRF) 2014–2020.

Conflicts of Interest

The authors declare no conflict of interest. The funders had no role in the design of the study; in the collection, analyses, or interpretation of data; in the writing of the manuscript, or in the decision to publish the results.

References

  1. Karanasiou, A.; Moreno, N.; Moreno, T.; Viana, M.; de Leeuw, F.; Querol, X. Health effects from Sahara dust episodes in Europe: literature review and research gaps. Environ. Int. 2012, 5, 107–114. [Google Scholar] [CrossRef]
  2. Lee, H.; Honda, Y.; Lim, Y.-H.; Guo, Y.L.; Hashizume, M.; Kim, H. Effect of Asian dust storms on mortality in three Asian cities. Atmos. Environ. 2014, 89, 309–317. [Google Scholar] [CrossRef]
  3. Zhang, X.; Zhao, L.; Tong, D.Q.; Wu, G.; Dan, M.; Teng, B. A Systematic Review of Global Desert Dust and Associated Human Health Effects. Atmosphere 2016, 7, 158. [Google Scholar] [CrossRef]
  4. Lambert, F.; Delmonte, B.; Petit, J.R.; Bigler, M.; Kaufmann, P.R.; Hutterli, M.A.; Stocker, T.F.; Rüth, U.; Steffensen, J.P.; Maggi, V. Dust-climate couplings over the past 800,000 years from the EPICA Dome C ice core. Nat. Cell Boil. 2008, 452, 616–619. [Google Scholar] [CrossRef] [Green Version]
  5. Martínez-Garcia, A.; Rosell-Mele, A.; Jaccard, S.L.; Geibert, W.; Sigman, D.M.; Haug, G.H.; Jaccard, S. Southern Ocean dust–climate coupling over the past four million years. Nat. Cell Boil. 2011, 476, 312–315. [Google Scholar] [CrossRef]
  6. IPCC. Climate Change 2013: The Physical Science Basis. Twelfth Session of Working Group contribution to the IPCC Fifth Assessment Report (WGI AR5). Available online: http://www.climatechange2013.org/images/report/WG1AR5_Frontmatter_FINAL.pdf (accessed on 17 June 2018).
  7. Yu, F.; Luo, G.; Wang, Z. Impact of aerosol on sea surface temperature over the subtropical Atlantic Ocean: A potential trigger factor of the NAO phase conversion? Geophys. Lett. 2009, 36. [Google Scholar] [Green Version]
  8. Zhao, T.L.; Gong, S.L.; Zhang, X.Y.; Jaffe, D.A. Asian dust storm influence on North American ambient PM levels: observational evidence and controlling factors. Atmos. Chem. Phys. Discuss. 2008, 8, 2717–2728. [Google Scholar] [CrossRef] [Green Version]
  9. Gkikas, A.; Obiso, V.; Pérez García-Pando, C.; Jorba, O.; Hatzianastasiou, N.; Vendrell, L.; Basart, S.; Casso, S.; Baldasano, J.-M. Direct radiative effects of intense Mediterranean desert dust outbreaks. Atmos. Chem. Phys. 2018, 18, 8757–8787. [Google Scholar] [CrossRef]
  10. Satheesh, S.K.; Deepshikha, S.; Srinivasan, J. Impact of dust aerosols on Earth–atmosphere clear-sky albedo and its shortwave radiative forcing over African and Arabian regions. Int. J. Remote Sens. 2006, 27, 1691–1706. [Google Scholar] [CrossRef]
  11. Creamean, J.M.; Suski, K.J.; Rosenfeld, D.; Cazorla, A.; DeMott, P.J.; Sullivan, R.C.; White, A.B.; Ralph, F.M.; Minnis, P.; Comstock, J.M.; et al. Dust and biological aerosols from the Sahara and Asia influence precipitation in the western US. Science 2013, 339, 1572–1578. [Google Scholar] [CrossRef] [PubMed]
  12. Ridgwell, A.J.; Watson, A.J. Feedback between aeolian dust, climate, and atmospheric CO2 in glacial time. Paleoceanography 2002, 17, 1059. [Google Scholar] [CrossRef]
  13. Maher, B.; Prospero, J.; Mackie, D.; Gaiero, D.M.; Hesse, P.; Balkanski, Y.; Maher, B.; Prospero, J. Global connections between aeolian dust, climate and ocean biogeochemistry at the present day and at the last glacial maximum. Earth-Sci. Rev. 2010, 99, 61–97. [Google Scholar] [CrossRef]
  14. Goudie, A.; Middleton, N.J. Desert Dust in the Global System; Springer: Berlin/Heidelberg, Germany, 2006. [Google Scholar] [CrossRef]
  15. Barnum, B.; Winstead, N.; Wesely, J.; Hakola, A.; Colarco, P.; Toon, O.; Ginoux, P.; Brooks, G.; Hasselbarth, L.; Toth, B. Forecasting dust storms using the CARMA-dust model and MM5 weather data. Environ. Model. Softw. 2004, 19, 129–140. [Google Scholar] [CrossRef]
  16. Kallos, G.; Papadopoulos, A.; Katsafados, P.; Nickovic, S. Transatlantic Saharan dust transport: Model simulation and results. J. Geophys. Res. Biogeosci. 2006, 111, 09204. [Google Scholar] [CrossRef]
  17. Nickovic, S.; Kallos, G.; Papadopoulos, A.; Kakaliagou, O. A model for prediction of desert dust cycle in the atmosphere. J. Geophys. Res. Biogeosci. 2001, 106, 18113–18129. [Google Scholar] [CrossRef] [Green Version]
  18. Pérez, C.; Haustein, K.; Janjic, Z.; Jorba, O.; Huneeus, N.; Baldasano, J.M.; Black, T.; Basart, S.; Nickovic, S.; Miller, R.L.; et al. An online mineral dust aerosol model for meso to global scales: Model description, annual simulations and evaluation. Atmos. Chem. Phys. 2011, 11, 13001–13027. [Google Scholar]
  19. Haustein, K.; Pérez, C.; Baldasano, J.M.; Jorba, O.; Basart, S.; Miller, R.L.; Janjić, Z.; Black, T.; Nickovic, S.; Todd, M.C.; et al. Atmospheric dust modeling from meso to global scales with the online NMMB/BSC-Dust model—Part 2: Experimental campaigns in Northern Africa. Atmos. Chem. Phys. Discuss. 2012, 12, 2933–2958. [Google Scholar] [CrossRef]
  20. Grell, G.A.; Peckham, S.E.; Schmitz, R.; McKeen, S.A.; Frost, G.; Skamarock, W.C.; Eder, B. Fully coupled ‘online’ chemistry in the WRF model. Atmos. Environ. 2005, 39, 6957–6976. [Google Scholar] [CrossRef]
  21. Bian, H. Analysis of a Severe Dust Storm Event over China: Application of the WRF-Dust Model. Aerosol Air Qual. 2011, 11, 419–428. [Google Scholar] [CrossRef]
  22. Pope, R.J.; Marsham, J.H.; Knippertz, P.; Brooks, M.E.; Roberts, A.J. Identifying errors in dust models from data assimilation. Geophys. Lett. 2016, 43, 9270–9279. [Google Scholar] [CrossRef] [PubMed] [Green Version]
  23. Huneeus, N.; Schulz, M.; Balkanski, Y.; Griesfeller, J.; Prospero, J.; Kinne, S.; Bauer, S.; Boucher, O.; Chin, M.; Dentener, F.; et al. Global dust model intercomparison in AeroCom phase I. Atmos. Chem. Phys. Discuss. 2011, 11, 7781–7816. [Google Scholar] [CrossRef] [Green Version]
  24. Romano, F.; Ricciardelli, E.; Cimini, D.; Di Paola, F.; Viggiano, M. Dust Detection and Optical Depth Retrieval Using MSG-SEVIRI Data. Atmosphere 2013, 4, 35–47. [Google Scholar] [CrossRef]
  25. Perea, P.R.; Rosiles, J.G.; Cota-Ruiz, J. Statistical and neural pattern recognition methods for dust aerosol detection. Int. J. Sens. 2013, 34, 7648–7670. [Google Scholar] [CrossRef]
  26. Zhou, T.; Xie, H.; Bi, J.; Huang, Z.; Huang, J.; Shi, J.; Zhang, B.; Zhang, W. Lidar Measurements of Dust Aerosols during Three Field Campaigns in 2010, 2011 and 2012 over Northwestern China. Atmosphere 2018, 9, 173. [Google Scholar] [CrossRef]
  27. Hu, X.Q.; Lu, N.M.; Niu, T.; Zhang, P. Operational retrieval of Asian sand and dust storm from FY-2C geostationary meteorological satellite and its application to real time forecast in Asia. Atmos. Chem. Phys. Discuss. 2008, 8, 1649–1659. [Google Scholar] [CrossRef] [Green Version]
  28. Wong, M.S.; Xiao, F.; Nichol, J.; Fung, J.; Kim, J.; Campbell, J.; Chan, P. A multi-scale hybrid neural network retrieval model for dust storm detection, a study in Asia. Atmos. Res. 2015, 158, 89–106. [Google Scholar] [CrossRef]
  29. She, L.; Xue, Y.; Yang, X.; Guang, J.; Li, Y.; Che, Y.; Fan, C.; Xie, Y. Dust Detection and Intensity Estimation Using Himawari-8/AHI Observation. Remote. Sens. 2018, 10, 490. [Google Scholar] [CrossRef]
  30. Klüser, L.; Schepanski, K. Remote sensing of mineral dust over land with MSG infrared channels: A new Bitemporal Mineral Dust Index. Remote Sens. Environ. 2009, 113, 1853–1867. [Google Scholar] [CrossRef] [Green Version]
  31. Ashpole, I.; Washington, R. An automated dust detection using SEVIRI: A multiyear climatology of summertime dustiness in the central and western Sahara. J. Geophys. Res. Biogeosci. 2012, 117, D08202. [Google Scholar] [CrossRef]
  32. Xie, Y.; Zhang, W.; Qu, J.J. Detection of Asian Dust Storm Using MODIS Measurements. Remote. Sens. 2017, 9, 869. [Google Scholar] [CrossRef]
  33. Prata, A.J. Observations of volcanic ash clouds in the 10–12 μm window using AVHRR/2 data. Int. J. Sens. 1989, 10, 751–761. [Google Scholar] [CrossRef]
  34. Ellrod, G.P.; Connell, B.H.; Hillger, D.W. Improved detection of airborne volcanic ash using multispectral infrared satellite data. J. Geophys. Res. Biogeosci. 2003, 108, 4356. [Google Scholar] [CrossRef]
  35. Dunion, J.P.; Velden, C.S. The Impact of the Saharan Air Layer on Atlantic Tropical Cyclone Activity. Am. Meteorol. Soc. 2004, 85, 353–366. [Google Scholar] [CrossRef] [Green Version]
  36. Pavolonis, M.J.; Feltz, W.F.; Heidinger, A.K.; Gallina, G.M. A Daytime Complement to the Reverse Absorption Technique for Improved Automated Detection of Volcanic Ash. J. Atmos. Ocean. Technol. 2006, 23, 1422–1444. [Google Scholar] [CrossRef]
  37. Ackerman, S.A. Remote sensing aerosols using satellite infrared observations. J. Geophys. Res. Biogeosci. 1997, 102, 17069–17079. [Google Scholar] [CrossRef] [Green Version]
  38. Zhao, T.X.-P.; Ackerman, S.; Guo, W.; Ackerman, S. Dust and Smoke Detection for Multi-Channel Imagers. Remote. Sens. 2010, 2, 2347–2368. [Google Scholar] [CrossRef] [Green Version]
  39. Prata, A.J.; Grant, I.F. Retrieval of microphysical and morphological properties of volcanic ash plumes from satellite data: Application to Mt Ruapehu, New Zealand. Q. J. Meteorol. Soc. 2001, 127, 2153–2179. [Google Scholar] [CrossRef]
  40. Legrand, M.; Plana-Fattori, A.; N’Doumé, C.; Plana-Fattori, A. Satellite detection of dust using the IR imagery of Meteosat: 1. Infrared difference dust index. J. Geophys. Res. Atmos. 2001, 106, 18251–18274. [Google Scholar] [CrossRef]
  41. Ciren, P.; Kondragunta, S. Dust aerosol index (DAI) algorithm for MODIS. J. Geophys. Res. Atmos. 2014, 119, 4770–4792. [Google Scholar] [CrossRef]
  42. Chacon-Murguía, M.I.; Quezada-Holguín, Y.; Perea, P.R.; Cabrera, S. Dust Storm Detection Using a Neural Network with Uncertainty and Ambiguity Output Analysis. In Lecture Notes in Computer Science; Springer: Berlin, Germany, 2011; Volume 6718, pp. 305–313. [Google Scholar]
  43. Shahrisvand, M.; Akhoondzadeh, M. A comparison of empirical and inteligent methods for dust detection using modis satellite data. ISPRS - Int. Arch. Photogramm. Sens. Spat. Inf. Sci. 2013, 1, 371–375. [Google Scholar] [CrossRef]
  44. Souri, A.H.; Vajedian, S. Dust storm detection using random forests and physical-based approaches over the Middle East. J. Earth Sci. 2015, 124, 1127–1141. [Google Scholar] [CrossRef]
  45. Lazri, M.; Ameur, S.; Brucker, J.M.; Ouallouche, F. Convective rainfall estimation from MSG/SEVIRI data based on different development phase duration of convective systems (growth phase and decay phase). Atmos. Res. 2014, 147, 38–50. [Google Scholar] [CrossRef]
  46. Lazri, M.; Ameur, S. Combination of support vector machine, artificial neural network and random forest for improving the classification of convective and stratiform rain using spectral features of SEVIRI data. Atmos. Res. 2018, 203, 118–129. [Google Scholar] [CrossRef]
  47. Marchese, F.; Sannazzaro, F.; Falconieri, A.; Filizzola, C.; Pergola, N.; Tramutoli, V. An Enhanced Satellite-Based Algorithm for Detecting and Tracking Dust Outbreaks by Means of SEVIRI Data. Remote. Sens. 2017, 9, 537. [Google Scholar] [CrossRef]
  48. Lensky, I.M.; Rosenfeld, D. Clouds-Aerosols-Precipitation Satellite Analysis Tool (CAPSAT). Atmos. Chem. Phys. Discuss. 2008, 8, 6739–6753. [Google Scholar] [CrossRef] [Green Version]
  49. Banks, J.R.; Brindley, H.E. Evaluation of MSG-SEVIRI mineral dust retrieval products over North Africa and the Middle East. Remote Sens. Environ. 2012, 128, 58–73. [Google Scholar] [CrossRef]
  50. Hubanks, P.; Platnick, S.; King, M.; Ridgway, B. MODIS Atmosphere L3 Gridded Product Algorithm Theoretical Basis Document (ATBD) and Users Guide, Collection 006, Version 4.2. 27 July 2016. Available online: https://modis-images.gsfc.nasa.gov/_docs/L3_ATBD_C6.pdf (accessed on 10 August 2018).
  51. Brindley, H.; Knippertz, P.; Ryder, C.; Ashpole, I. A critical evaluation of the ability of the Spinning Enhanced Visible and Infrared Imager (SEVIRI) thermal infrared red-green-blue rendering to identify dust events: Theoretical analysis. J. Geophys. Res. Biogeosci. 2012, 117, D07201. [Google Scholar] [CrossRef]
  52. Liu, R.; Cheng, X.; Liu, Y. Dust detection over desert surfaces with thermal infrared bands using dynamic reference brightness temperature differences. J. Geophys. Res. Atmos. 2013, 118, 8566–8584. [Google Scholar] [CrossRef] [Green Version]
  53. Georgiev, C.G.; Santurette, P. Mid-level jet in intense convective environment as seen in the 7.3 µm satellite imagery. Atmos. Res. 2009, 93, 277–285. [Google Scholar] [CrossRef]
  54. Kolios, S.; Stylios, C. Combined use of an instability index and SEVIRI water vapor imagery to detect unstable air masses. In Proceedings of the EUMETSAT Conference of Satellite Meteorology, Geneva, Switzerland, 22–26 September 2014. [Google Scholar]
  55. Kolios, S. Study of Mesoscale Cloud System Oscillations Capable of Producing Convective Gravity Waves. Climate 2018, 6, 25. [Google Scholar] [CrossRef]
  56. Mann, H.B.; Whitney, D.R. On a Test of Whether one of Two Random Variables is Stochastically Larger than the Other. Ann. Math. Stat. 1947, 18, 50–60. [Google Scholar] [CrossRef]
  57. Fay, M.P.; Proschan, M.A. Wilcoxon-Mann-Whitney or t-test? On assumptions for hypothesis tests and multiple interpretations of decision rules*. Stat. Surv. 2010, 4, 1–39. [Google Scholar] [CrossRef]
  58. Glorot, X.; Bordes, A.; Bengio, Y. Deep Sparse Rectifier Neural Networks. In Proceedings of the 14th International Conference on Artificial Intelligence and Statistics Conference, Lauderdale, FL, USA, 11–13 April 2011. [Google Scholar]
  59. Wilks, D.S. Statistical Methods in the Atmospheric Sciences, 3rd ed.; Academic Press: Oxford, UK, 2011; ISBN 9780123850232. [Google Scholar]
  60. Jolliffe, I.T.; Stephenson, D.B. Forecast Verification: A Practitioner’s Guide in Atmospheric Science; Wiley: West Sussex, UK, 2011; ISBN 978-0-470-66071-3. [Google Scholar]
  61. Kerkman, J.; Roesli, H.P.; Bridge, G.; König, M. Applications of Meteosat Second Generation (MSG), RGB Composites with Channels 01–11 and Their Interpretation. Available online: http://oiswww.eumetsat.org/IPPS/html/bin/guides/msg_rgb_dust.ppt (accessed on 5 June 2018).
  62. Remer, L.A.; Kleidman, R.G.; Levy, R.C.; Kaufman, Y.J.; Tanré, D.; Mattoo, S.; Martins, J.V.; Ichoku, C.; Koren, I.; Yu, H.; et al. Global aerosol climatology from the MODIS satellite sensors. J. Geophys. Res. Biogeosci. 2008, 113, D14. [Google Scholar] [CrossRef]
  63. Levy, R.; Remer, L.A.; Kleidman, R.G.; Mattoo, S.; Ichoku, C.; Kahn, R.; Eck, T.F. Global evaluation of the Collection 5 MODIS dark-target aerosol products over land. Atmos. Chem. Phys. Discuss. 2010, 10, 10399–10420. [Google Scholar] [CrossRef] [Green Version]
  64. Papadimas, C.D.; Hatzianastassiou, N.; Mihalopoulos, N.; Querol, X.; Vardavas, I. Spatial and temporal variability in aerosol properties over the Mediterranean basin based on 6-year (2000–2006) MODIS data. J. Geophys. Res. Biogeosci. 2008, 113, D11205. [Google Scholar] [CrossRef]
  65. Floutsi, A.; Korras-Carraca, M.-B.; Matsoukas, C.; Hatzianastassiou, N.; Biskos, G. Climatology and trends of aerosol optical depth over the Mediterranean basin during the last 12 years (2002–2014) based on Collection 006 MODIS-Aqua data. Sci. Total Environ. 2016, 551, 292–303. [Google Scholar] [CrossRef]
Figure 1. The domain of the study. The 14 Aerosol Robotic NETwork (AERONET) stations (white circles) used in the study are indicated. The brownish colored areas highlight mountainous areas with an altitude greater than 800 m.
Remotesensing 11 01022 g001
Figure 2. The frequency distributions of AOD550 nm values for the 14 used AERONET stations during the five examined periods with dust outbreaks in the greater area of the central and eastern Mediterranean.
Remotesensing 11 01022 g002
Figure 3. Box plots for the distributions of training and validation samples of aerosol optical depth at 550 nm (AOD550 nm) values.
Remotesensing 11 01022 g003
Figure 4. A simplified scheme of the architecture of the ANN model with its input nodes, brightness temperature (BT) and BT difference (BTD), and output (AOD550 nm) nodes.
Remotesensing 11 01022 g004
Figure 5. Statistical scores (probability of detection—POD, false alarm ratio—FAR, probability of false detection—POFD, and Peirce skill score—PSS) depicting ANN model accuracy in adequately estimating four different classes of AOD550 nm values over the Mediterranean basin. Class-1 corresponds to “very low dust”, class-2 to “low dust”, class-3 to “high dust”, and class-4 to “very high dust” conditions.
Remotesensing 11 01022 g005
Figure 6. An African dust transport event that occurred over the Mediterranean basin on 1 March 2016. The images in magenta (RGB composites) on the left side depict dust load transportation from northern Africa up to the Aegean Sea. RGB refers to red (BTD(12.0 μm-10.8 μm)), green (BTD(10.8μm-8.7μm)), and blue (BT(10.8 μm) μm) channels. The right-side plots display the corresponding image products (AOD550 nm values) of the ANN model scheme, referring to the same date/time with the RGB composites. The different colors in the right-hand plots represent four different levels of AOD550 nm (very low—VL, low—L, high—H and very high—VH, see Section 4.1). Black colored areas correspond to optically thick cloud patterns for which aerosol loads (AOD550 nm) were not detected (ND) by the ANN model.
Remotesensing 11 01022 g006
Figure 7. (a) Temporal evolution of the AOD550 nm values (black dots) over the “FORTH_CRETE” AERONET station as retrieved by AERONET (black colored dots) and as derived by the ANN model (gray colored dots) during the period 29 February–2 March 2016. (b) Scatterplot comparison of the pairs of AERONET and ANN model AOD550 nm values over the Crete-AERONET station during the period 29 February–1 March 2016. The red line corresponds to linear fit (slope = 0.87 and intercept = 0.06), while the blue line is the ideal (1:1) line. (c) Scatterplot comparison of the pairs of AERONET and ANN model AOD550 nm data for the 14 AERONET stations for 1 March 2016. The red line corresponds to linear fit (slope = 0.92 and intercept = 0.04), while the blue line is the ideal (1:1) line.
Remotesensing 11 01022 g007
Figure 8. Comparison between MODIS-Terra and MODIS-Aqua daily AOD550 nm data (a,c) and the corresponding AOD products of the ANN model (b,d) for the date on 1 March 2016.
Remotesensing 11 01022 g008
Figure 9. Histogram distributions of differences between the matched 1° × 1° pixel-level AOD550 nm data of MODIS-Terra (10:30 UTC) and MODIS-Aqua (13:30 UTC) and the ANN model for 1 March 2016.
Remotesensing 11 01022 g009
Table 1. The equations and computed values of four basic statistical parameters calculated from the comparison between the ANN (algorithm theoretical estimations) and measured daily AOD550 nm values (in the equations e refers to the theoretical estimates, r to the real values, and n is the total number of the values of the validation sample). MAE: mean absolute error; ME: mean error; RMSE: root mean squared error; and rp: Pearson correlation.
Statistical ParameterEquationValue
MAE M A E = i = 1 n ( | e i r i | ) / n 0.031
ME M E = ( i = 1 n ( e i r i ) ) / n −0.0025
RMSE R M S E = ( i = 1 n ( e i r i ) 2 ) / n 0.051
rp r P = i = 1 n ( e i e )   ( r i r ¯ ) ( i = 1 n ( e i e ¯ ) 2 ) ( i = 1 n ( r i r ¯ ) 2 ) 0.91
Table 2. Contingency table with calculated statistical scores used to evaluate the ability of the ANN model to reproduce AERONET AOD550 nm values over the Mediterranean.
Threshold ValueGround-Based Measurements
YesNo
ANN model estimationsYesHit (H) False Alarm (FA)
NoMiss (M) Correct Negative (CN)
Table 3. Statistical results for the different AOD550 nm classes that are defined for the evaluation sample.
Statistical ParametersClass-1Class-2Class-3Class-4
MAE0.030.0180.0260.092
ME−0.028−0.0080.0120.014
RMSE0.0310.00350.020.12
rp0.190.920.840.87

