Evaluation of the Performance of SM2RAIN-Derived Rainfall Products over Brazil


1
Department of Civil Engineering, University of the Western Plains Ezequiel Zamora, San Carlos Campus 2201 CO, Venezuela
2
Unidade Acadêmica de Ciências Atmosféricas, Universidade Federal de Campina Grande, Av. Aprígio Veloso, 58109-970 PB Campina Grande, Brazil
3
Laboratório de Análise e processamento de Imagens de Satélites (LAPIS), Instituto de Ciências Atmosféricas, Universidade Federal de Alagoas, A. C. Simões Campus, 57072-900 MA Alagoas, Brazil
4
Daugherty Water for Food Global Institute, University of Nebraska-Lincoln, Lincoln, NE 68501, USA
*
Author to whom correspondence should be addressed.
Remote Sens. 2019, 11(9), 1113; https://0-doi-org.brum.beds.ac.uk/10.3390/rs11091113
Submission received: 30 March 2019
/
Revised: 27 April 2019
/
Accepted: 7 May 2019
/
Published: 9 May 2019
(This article belongs to the Special Issue Precipitation and Water Cycle Measurements Using Remote Sensing)
Abstract
:Microwave-based satellite soil moisture products enable an innovative way of estimating rainfall using soil moisture observations with a bottom-up approach based on the inversion of the soil water balance Equation (SM2RAIN). In this work, the SM2RAIN-CCI (SM2RAIN-ASCAT) rainfall data obtained from the inversion of the microwave-based satellite soil moisture (SM) observations derived from the European Space Agency (ESA) Climate Change Initiative (CCI) (from the Advanced SCATterometer (ASCAT) soil moisture data) were evaluated against in situ rainfall observations under different bioclimatic conditions in Brazil. The research V7 version of the Tropical Rainfall Measurement Mission Multi-satellite Precipitation Analysis (TRMM TMPA) was also used as a state-of-the-art rainfall product with an up-bottom approach. Comparisons were made at daily and 0.25° scales, during the time-span of 2007–2015. The SM2RAIN-CCI, SM2RAIN-ASCAT, and TRMM TMPA products showed relatively good Pearson correlation values (R) with the gauge-based observations, mainly in the Caatinga (CAAT) and Cerrado (CER) biomes (R median > 0.55). SM2RAIN-ASCAT largely underestimated rainfall across the country, particularly over the CAAT and CER biomes (bias median < −16.05%), while SM2RAIN-CCI is characterized by providing rainfall estimates with only a slight bias (bias median: −0.20%), and TRMM TMPA tended to overestimate the amount of rainfall (bias median: 7.82%). All products exhibited the highest values of unbiased root mean square error (ubRMSE) in winter (DJF) when heavy rainfall events tend to occur more frequently, whereas the lowest values are observed in summer (JJA) with light rainfall events. The SM2RAIN-based products showed larger contribution of systematic error components than random error components, while the opposite was observed for TRMM TMPA. In general, both SM2RAIN-based rainfall products can be effectively used for some operational purposes on a daily scale, such as water resources management and agriculture, whether the bias is previously adjusted.
1. Introduction
Rainfall is a critical component of the global water cycle [1,2] and is crucial for a wide range of applications such as crop modeling, hydrometeorology, water resources management, flood and drought monitoring, and climatological applications [3,4,5,6]. Rainfall data from ground stations have been conventionally used to provide local estimates of rainfall amounts [7,8], but their limited spatial representativeness, inhomogeneous distribution and high maintenance costs constrain their applicability at the global scale [3,9,10,11]. Nevertheless, in the last three decades, the development of remote sensing technology is opening new perspectives for estimating rainfall data from space [12,13,14], especially over areas where measurements are scarce, such as deserts [15], forests [16], oceans [17], and high-altitude regions [18].
The satellite rainfall estimates are mainly derived from thermal infrared (IR) sensors onboard geosynchronous earth orbit (GEO) satellites, and passive and active microwave (MW) sensors onboard low-earth orbit (LEO) satellites [19,20]. Some rainfall products combine IR- and MW-based estimates, thus taking advantage of the high temporal resolution of IR platforms and the better accuracy in rainfall estimation of MW sensors [21]. Examples include the near-real-time Tropical Rainfall Measurement Mission Multi-satellite Precipitation Analysis (TRMM TMPA 3B42RT, [22]), the Precipitation Estimation from Remotely Sensed Information using Artificial Neural Networks (PERSIANN, [23]), the Climate Prediction Center MORPHing technique (CMORPH, [24]), the Climate Hazards Group InfraRed Precipitation with Station (CHIRPS, [25]), among others. More recently, the Multi-Source Weighted-Ensemble Precipitation (MSWEP) product exploits a range of data sources, including gauge, satellite, and reanalysis data to provide more reliable rainfall estimates at the global scale [26]. These state-of-the-art rainfall products adopt different methods to retrieve rainfall through a top-down approach, which is based on the inversion of the atmospheric signals scattered or emitted by atmospheric hydrometers [27].
A novel approach for rainfall estimation using in situ soil moisture (SM) measurements and satellite-based SM estimates was proposed by Brocca et al. [28], who used SM data to obtain a direct estimate of rainfall by inverting the soil-water balance Equation (i.e., bottom-up approach). For this purpose, rainfall is computed from knowledge of the SM state and its variation in time utilizing an algorithm called SM2RAIN. The SM2RAIN algorithm has been applied on a local scale with in situ observations [28,29] and on a regional/global scale with satellite data [3,27,30,31,32,33] showing promising results. SM2RAIN has also been blended with state-of-the-art rainfall products (i.e., top-down approach) for obtaining more accurate and reliable rainfall products in Australia [33] and Italy [14]. Currently, the SM2RAIN-based products are receiving more and more attention, as confirmed by several projects funded by the European Space Agency (ESA), European Organization for the Exploitation of Meteorological Satellites (EUMETSAT), and National Aeronautics and Space Administration (NASA) on this topic [34,35].
In early 2017, the ESA CCI SM v03.2 dataset was released by the European Space Agency Climate Change Initiative (ESA-CCI) project. This dataset was obtained by merging SM retrievals from both active and passive MW instruments carried by various satellite platforms and provided daily SM estimates on a global scale [36,37]. This then allowed Ciabatta et al. [32] to develop a global-scale rainfall dataset by applying the SM2RAIN algorithm to the ESA-CCI SM products to obtain the rainfall estimate at 0.25° and daily spatial-temporal resolution (hereinafter referred to as SM2RAIN-CCI). SM2RAIN-CCI showed reasonable performance when the five-day accumulated rainfall data and the Global Precipitation Climatology Centre Full Data Daily (GPCC-FDD) product were compared [32]. Similarly, other datasets were obtained by the application of the SM2RAIN algorithm to three surface soil moisture (SSM) products derived from the Advanced SCATterometer (ASCAT), Soil Moisture and Ocean Salinity (SMOS), and Advanced Microwave Scanning Radiometer for Earth Observing System (AMSR-E) [27]. ASCAT is a scatterometer operating at 5.255 GHz (C-band, VV polarization) onboard MetOp A, B, and C satellites, which constitute the space segment of the EUMETSAT Polar System (EPS) [38]. The ASCAT-derived rainfall product (hereinafter referred to as SM2RAIN-ASCAT) was found to be more accurate in terms of Pearson correlation (R), root mean square error (RMSE), and detection of rainfall events, with performance similar to the TRMM TMPA 3B42RT rainfall product [27].
The studies mentioned above highlighted that the SM2RAIN-based rainfall products can provide relatively reliable rainfall estimates. Nevertheless, they have received little attention in Brazil [30], whereas several studies assessed rainfall products based on a top-down approach for operational hydrologic, climatic, and meteorological applications. For example, Melo et al. [39] evaluated the quality of the TRMM TMPA 3B42V6 and 3B42V7 products on a daily and monthly basis by comparing them with gridded ground-based rainfall data distributed in Brazil. TRMM TMPA combines rainfall estimates retrieved from passive MW and thermal IR observations from multiple satellite sensors with radar data from TRMM [12,22]. They found that TRMM TMPA performed poorly in coastal areas of Northeast Brazil (NEB), but exhibited good performance in its semiarid zone. In this same region, the monthly rainfall estimates from the CHIRPS product were compared with ones from the rain gauges’ data [15]. CHIRPS blends satellite and gauge rainfall estimates using inverse-error weighted averaging to produce an unbiased estimate [25,40]. According to these authors, CHIRPS data correlate well with observations, but tend to overestimate low and underestimate high rainfall values. On the other hand, CHIRPS achieves better results during the wet season, but its ability for rain detection is reduced. Similar results are reported by Nogueira et al. [41], who applied a comparison and validation among rainfall estimates derived from the Eta/CPTEC (Centro de Previsão de Tempo e Estudos Climáticos) model, the 3B42V7-TRMM and CHIRPS products, and the rainfall data from the INMET (National Institute of Meteorology) meteorological stations located in the south-southeast sub-region of the NEB. The authors pointed out that CHIRPS, 3B42V7-TRMM, and the Eta model show relatively good results in terms of correlation coefficient (0.88 ≤ R ≤ 0.98 for CHIRPS, R ≥ 0.90 for 3B42V7-TRMM, and 0.69 ≤ R ≤ 0.94 for Eta). Concerning the RMSE, 3B42V7-TRMM presented values between 9.51 mm and 17.33 mm (the best performance). For CHIRPS, this metric varied from 10.25 mm and 21.85 mm, while the Eta model showed values between 37.45 mm and 93.47 mm (the worst performance). Unlike rainfall products based on a top-down approach, only two studies analyzed the SM2RAIN-CCI v1.0 product. Paredes-Trejo et al. [30] showed that for the NEB, this product provides the best performance in terms of Pearson correlations over the Cerrado biome, but fails in the estimation of the amount of rainfall under extreme moisture conditions. Souto et al. [42] presented similar results for the São Francisco River basin in Brazil.
The different references described above indicate that a study investigating the performance of the SM2RAIN-based rainfall products, including their range of applicability and their limitations across all of Brazil, is still needed. Thus, the objective of this study is to evaluate the capabilities of the SM2RAIN-CCI and SM2RAIN-ASCAT rainfall products in entire Brazil, using high-quality ground-based observations as a benchmark. The rationale behind the choice of these two products is related to their novel approach (bottom-up), good spatial-temporal coverage (global and daily), and that they were both very recently updated [43,44]. Another innovation of this research is that the analysis was performed under different bioclimatic conditions determined by the main biomes in Brazil (i.e., Amazon Forest, Cerrado, Atlantic Forest, Caatinga, Pantanal, and Pampa).
2. Materials and Methods
2.1. Study Area
The study was carried out over the continental region of Brazil, which is located between 5.2°N–33.7°S and 34.7–74°W, occupying an area of about 8,515,759 km2. It has more than 207 million inhabitants and a human population density of about 22 inhabitants per square kilometer [45]. It is characterized by a vast range of biodiversity, landscapes, topography, climates, and rainfall regimes, with the mean annual rainfall ranging from ~400 to >2000 mm/year (Figure 1). The main biomes of Brazil are Amazônia (Amazon Forest), Cerrado, Mata Atlântica (Atlantic Forest), Caatinga, Pantanal, and Pampa; hereinafter AMZ, CER, MAT, CAAT, PTN, and PMP, respectively.
The AMZ biome is a moist broadleaf forest, which comprises the largest and most biodiverse tract of tropical rainforest in Brazil and is characterized by the highest rainfall regime [46]. The CER biome is a vast tropical savanna. Its main habitats are forest savanna, wooded savanna, park savanna, gramineous-woody savanna, savanna wetlands, and gallery forests [47]. The MAT biome extends along the eastern coastal strip, and groups the seasonal moist and dry broad-leaf tropical and subtropical grasslands, savannas, shrublands, and mangrove forests [48]. The CAAT biome is characterized by a mosaic of seasonally dry tropical forests and thorn scrubs [49,50], with the lowest rainfall regime [51]. The PTN biome is a sedimentary basin dominated by a combination of mesic and xeric vegetation growing side by side due to seasonal flooding [52]. The PMP biome consists of large areas of natural grasslands with a floristic matrix composed of forest formations interspersed along the watercourses [53]. Table 1 summarizes other characteristics of the Brazilian biomes, whereas the rainfall regime for each is shown in Figure 2. The spatial distribution of such biomes is strongly linked to the spatiotemporal variability of rainfall [54,55,56] (see Figure 1a,d). Consequently, in this study, they are selected as benchmark areas to investigate the performances of the SM2RAIN-CCI and SM2RAIN-ASCAT rainfall products under different bioclimatic conditions.
The AMZ biome is characterized by prevailing convective rainfall, which is related to the position of the Intertropical Convergence Zone (ITCZ) in the year [60,61]. The position of the ITCZ also plays an important role in most of the CER, CAAT, and MAT biomes, defining the rainy season in those biomes (see Figure 2). In this region, higher rainfall rates occur along the eastern coastal strip, due to the contrast in air temperature over the ocean and continent. However, the rainfall regime is mainly controlled by the orographic effect, resulting in orographic rainfall on the east side and limiting rain from reaching the semiarid region [39,62] (see Figure 1d). Over the PTN and PMP biomes in Southern NEB, and most of the Southern MAT and CER biomes, the Front Systems and the South Atlantic Convergence Zone (SACZ) is active [63,64]. Moreover, the El Niño–Southern Oscillation (ENSO) phenomenon and mesoscale convective systems and frontal systems over the Southern Atlantic Ocean are primarily responsible for interannual variations of the rainfall in Brazil [65,66]. All factors mentioned above contribute to the fact that the AMZ biome receives the highest annual rainfall amount (>2000 mm/year), while the CAAT biome receives on average <700 mm/year (see Table 1).
2.2. Rainfall Datasets
2.2.1. Ground Observation Dataset
A grid with a spatial resolution of 0.25° × 0.25° of daily rainfall developed by Xavier et al. [59] using in situ rainfall observations (>9200 rain gauges; time coverage: 1980–2015) provided by the Brazilian Water Agency (ANA), the National Institute of Meteorology (INMET) and the Water and Electric Energy Department of São Paulo state (DAEE), was used (version 2.2 released on February 2018 and available at [67]); hereinafter GBGR (see Figure 1d). The procedure to generate the GBGR dataset involved a quality control check, in which rainfall data exceeding 450 mm/day and less than 0 mm/day were eliminated, and as well as rain gauge data that was duplicated. To create this dataset, Xavier et al. [59] tested six different methods to interpolate rainfall throughout the period 1980–2015: angular distance weighting (ADW), inverse-distance weighted (IDW), average inside the area of each grid of 0.25° × 0.25°, thin plate spline, natural neighbor, and ordinary point kriging. Among them, they verified using cross-validation analysis that the ADW interpolation scheme was superior to the others. The ADW method used two weights: one based on the correlation decay distance (CDD) and the other based in the position of the rain gauges concerning the query point where the estimate is desired [59,68]. The choice to use this dataset was driven by its full availability during the period of analysis (i.e., 2007–2015) and the high quality of rainfall data [69]. However, it is not a completely independent dataset [70]; this is because the rainfall observations from the GBGR dataset could have been partially used in the calibration step of SM2RAIN-CCI [32] and TRMM TMPA [41], but not for SM2RAIN-ASCAT [44]. For more details about the GBGR product, the reader is referred to [69].
2.2.2. SM2RAIN-CCI Rainfall Product
The SM2RAIN algorithm proposed by Brocca et al. [28] is based on the inversion of the soil-water balance equation for retrieving rainfall from soil moisture data. It assumes that during rainfall, the evapotranspiration rate and the surface runoff are negligible [27,29]. In this context, a simplified version of the soil-water balance equation is formulated as follows:
where p(t) is the estimated rainfall between two successive SM retrievals for the time step dt (L/T), Z* represents the water capacity of the soil layer (L), s(t) denotes the relative soil saturation (dimensionless), t is the time (t), and a and b are two parameters describing the nonlinearity between soil saturation and drainage. The parameters a, b, and Z* are estimated through calibration [32]. More information about the SM2RAIN algorithm can be found in Brocca et al. [29].
The SM2RAIN-CCI product was obtained by applying the SM2RAIN algorithm separately to the ESA CCI soil moisture active and passive products. Then, an integration procedure based on a weighted average is applied to obtain the accumulated rainfall between 00:00 and 23:59 UTC of the indicated day. The quality flag provided within the raw soil moisture observations (i.e., ESA CCI SM v3.2) is used to mask out low-quality data and those observations characterized by issues in retrieval (e.g., frozen soil, snow-dominated regions, dense vegetation, and high topographic complexity). For this product, the SM2RAIN algorithm was calibrated during the 1998–2001, 2002–2006, and 2007–2013 periods against the GPCC-FDD gauge-based product by minimizing the RMSE between the five-day estimated rainfall and the GPCC-FDD data on a pixel-by-pixel basis [32]. The use of different calibration periods relies on the various data and sensors that have been used for building the active and passive SM datasets. In this study, the SM2RAIN-CCI product (version 2.0 released in July 2018; source: [43]), available from 1 January 1998 to 31 December 2015 at a daily timescale and spatial resolution of 0.25°, was used (Ciabatta et al. [32], for more details).
2.2.3. SM2RAIN-ASCAT Rainfall Product
The SMRAIN-ASCAT rainfall product was obtained through the inversion of ASCAT soil moisture observations via SM2RAIN, but unlike to SM2RAIN-CCI, the Medium-Range Weather Forecasts (ERA5) reanalysis data has been used for its calibration and bias correction [44,71]. The surface soil moisture data were derived by backscattering retrievals from the ASCAT sensor onboard the MetOp-A and MetOp-B satellites using the TU Wien soil moisture retrieval algorithm [38]. This surface soil moisture data is distributed within the EUMETSAT Satellite Application Facility on Support to Operational Hydrology and Water Management project (H-SAF, http://hsaf.meteoam.it/), which are denoted as H113 (temporal coverage: 2007–2017) plus H114 (only 2018) products [35,72]. In this study, the SM2RAIN-ASCAT product (version 1.0 released in March 2019), disseminated over an irregular grid at 12.5 km on a global scale with a temporal coverage from January 2007 to December 2018 (source: [43]), was used. Further details of SM2RAIN-ASCAT can be found in Brocca et al. [44].
2.2.4. TRMM TMPA Rainfall Product
In this study, the TRMM Multi-satellite Precipitation Analysis rainfall product (TRMM 3B42 v7, hereinafter referred to as TRMM TMPA) provided by National Aeronautics and Space Administration (NASA) Goddard Space Flight Center (GSFC) and available at [73] was used. It has a spatial resolution of 0.25° (~25 km at the equator) for the ±50 latitude bands every 3 h with a temporal coverage from January 1998 to present (released in July 2011). The TRMM TMPA product was derived from the combination of rainfall estimates based on observations in the microwave and infrared channels obtained by satellites. These multi-satellite estimates were computed using re-analyzed rainfall data from the GPCC-FDD dataset [39,41] (Huffman et al. [22] for more details). The selection of this product was motivated by the fact that some studies in Brazil have recognized to TRMM TMPA as a state-of-the-art rainfall product [39,41,74].
2.3. Dataset Pre-Processing
The SM2RAIN-CCI, SM2RAIN-ASCAT, and TRMM TMPA rainfall products were clipped using a shapefile of Brazil as a mask. To harmonize the datasets, the SMRAIN-ASCAT rainfall product has been resampled via the nearest neighbor algorithm over the 0.25° GBGR grid by considering at least five pixels from the 12.5 km SMRAIN-ASCAT grid around each GBGR pixel [35].
2.4. Performance Evaluation Methods
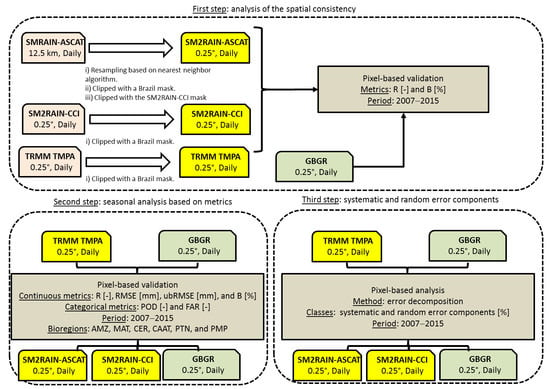
Figure 3 summarizes the methods of analysis applied in this study. Because of the different time durations of the considered satellite products and the GBGR dataset, the performance of each satellite rainfall product is only assessed during 2007–2015 (i.e., common period). To perform a fair intercomparison, the SM2RAIN-ASCAT and TRMM TMPA rainfall products were previously masked with the same mask of SM2RAIN-CCI, resulting 6293 common pixels over which the scores were computed (12.11%, 17.02%, 40.71%, 23.33%, 3.67%, and 3.16% are located in AMZ, CAAT, CER, MAT, PMP, and PTN, respectively). As can be seen in Figure 3, to examine the spatial consistency of the three satellite rainfall products over Brazil, an intercomparison of daily rainfall estimates derived from SM2RAIN-CCI, SMRAIN-ASCAT, and TRMM TMPA with estimates from the GBGR dataset has been carried out (first step in Figure 3). Secondly, a comparative analysis on the seasonally and monthly time scales using continuous and categorical metrics with the GBGR dataset as a benchmark was made over different bioclimatic conditions to determine whether the effects of bioclimatic conditions on performance varied regionally (second step in Figure 3). Finally, we assessed systematic and random error components of the SM2RAIN-CCI, SMRAIN-ASCAT, and TRMM TMPA rainfall products through a decomposition technique (third step in Figure 3).
In this study, the meteorological seasons were defined for the northern hemisphere. However, the meteorological seasons for Brazil are winter instead of summer, spring instead of autumn, summer instead of winter and autumn instead of spring due to its location in the southern hemisphere.
Four continuous metrics were used to measure how the value of estimates from the SM2RAIN-CCI, SMRAIN-ASCAT, and TRMM TMPA products differed with the value of the GBGR dataset. These metrics were based on a pair-wise comparison to evaluate the performance of each product in estimating rainfall amounts derived from the GBGR dataset on a pixel-to-pixel basis. The Pearson correlation coefficient (R), root mean square error (RMSE), unbiased root mean square error (ubRMSE), and bias (B) were considered in this study, whose equations are outlined in Table 2. R measures the linear relationship strength between estimations and observations, varying from −1 to 1, with the best score equal to 1. The RMSE, ubRMSE, and B metrics measure how the value of estimates differs from the observed value. RMSE and ubRMSE acquire only positive values, with lower values corresponding to better performance. B can take any negative or positive value, with a perfect score equal to 0. Positive B values indicate an overestimation, while negative ones indicate an underestimation [21,70].
In this study, the total mean square error (MSE) in the satellite rainfall estimates is separated into systematic (MSEs) and random error (MSEr) components based on the method proposed by AghaKouchak et al. [75], whose equations are:
where for N discrete points in time, Ci is the satellite estimate (mm/day) and Gi represents gauge-based rainfall (mm/day). The daily time series of Ci* (mm/day) in Equations (3)–(5) is derived from the satellite estimates least squares linearly regressed against the ground-based observation at each grid. Therefore, in Equation (5), a is the offset and b is a scale parameter [76]. The contribution of MSEs or MSEr to MSE is given by MSEs/MSE × 100% (MSEr/MSE × 100%) [3,75].
To examine the rain-detection capability of the SM2RAIN-CCI, SMRAIN-ASCAT, and TRMM TMPA products, four categorical metrics were used with six rainfall thresholds (i.e., 1, 2, 5, 10, 15, and 20 mm/day) to classify the intensity of rainfall events (i.e., rain/non-rain, light, light-moderate, moderate, heavy-moderate, and heavy, respectively) on a pixel-to-pixel basis. The categorical metrics used were: Probability of detection (POD), false alarm ratio (FAR), critical success index (CSI), and bias score (BS). These terms represent the ability of a rainfall product to detect observed rainfall events, taking into account a threshold to differentiate the rainfall events from non-rainfall events at any time scale [15]. These metrics were derived from a contingency table in which the letters A–D represent, respectively, hits (satellite estimates to occur, and did occur), false alarms (satellite estimates to occur, but did not occur), missing (satellite estimates not to occur, but did occur), and correct negatives (satellite estimates not to occur, and did not occur), with a rainfall threshold (see Table 3). The equations for these metrics are listed in Table 4. POD and FAR indicate the fraction of the observed events that were correctly forecasted and the fraction of the predicted events did not occur, respectively [76]. POD and FAR vary from 0–1, with a perfect score equal to 1 and 0, respectively. CSI (also known as the threat score) is the fraction between hits to all product-based events. The value varies from 0 ≤ CSI ≤ 1, with the best score equal to 1 [75,77]. BS is the fraction of all product-based events that were correct. The BS value ranges from 0 ≤ BS ≤ 1, and the best score is 1. For the sake of simplicity, these metrics are often depicted through a Roebber’s diagram, which exploits the geometric relationship among POD, BS, CSI, and FAR to represent them in a single diagram [78]. For good forecasts, POD, 1–FAR, BS, and CSI approach unity, such that a perfect performance lies in the upper right of the diagram [74].
3. Results
3.1. Annual and Seasonal Mean Precipitation
Figure 4 shows the spatial distribution of the seasonal and annual climatic mean rainfall over Brazil during 2007–2015. The ground-based rainfall shows distinctive seasonal variations. The rainfall decreases from winter (mean areal rainfall, MAP: 7.12 mm/day) to summer (MAP: 2.15 mm/day) and then increases in autumn (MAP: 3.68 mm/day). Some heavy rainfall spots with intensities over 11 mm/day in winter and spring are observed at the Amazon basin. High rainfall rates with intensities above 8 mm/day in summer are located near the Venezuelan and Colombian borders at the upper Negro and Branco rivers basin. Large rainfall spots with more than 6 mm/day in autumn can be seen near the Peruvian and Colombian borders and over Southern Brazil at the Paraná River basin.
Visual inspection of Figure 4 reveals that the SM2RAIN-based and TRMM TMPA products are relatively similar in reproducing the seasonal and annual rainfall patterns, particularly in summer. Note that the blank area in most of the Amazon River basin in Figure 4 for the SM2RAIN-CCI rainfall product is due to the use of a static mask to filter rainforest areas before applying the SM2RAIN algorithm to the ESA CCI SM dataset [32,79].
The gauge-based data show that the annual daily mean rainfall over Brazil gradually decreases from northwestern Brazil to northeastern Brazil (Figure 4a1). The annual daily mean rainfall over 8 mm/day (below 3 mm/day) is located in north and northwestern (northeastern) Brazil. As can be seen in Figure 4, the three satellite precipitation products (SPPs) can capture the overall spatial distribution of the gauge-based annual daily mean rainfall over Brazil, except over the AMZ biome where, as mentioned above, SM2RAIN-CCI only provides rainfall estimates in the lowest part of the Negro, Tapajó, Xingu, Tocantins, Mapuera, and Madeira rivers. The semiarid regions within the CAAT, CER, and MAT biomes are accurately delimited by the SM2RAIN-CCI and TRMM TMPA rainfall products (Figure 4b1,d1), whereas the SMRAIN-ASCAT rainfall product and the GBGR dataset are relatively comparable in the AMZ biome (Figure 4c1).
Figure 5 and Figure 6 display the spatial distributions of the correlation coefficient (R) and bias (B) obtained after the pixel-to-pixel comparison of SPPs against the gauge-based dataset for the 2007–2015 period, but only considering those common pixels (n = 6293). The R and B median values listed in each subpanel were obtained by averaging R and B values from all-pixels over each biome via median. The median values of R for the SM2RAIN-CCI (SM2RAIN-ASCAT; TRMM TMPA) product are equal to 0.47, 0.51, 0.57, 0.43, 0.40, and 0.41 (0.55, 0.55, 0.60, 0.53, 0.43, and 0.49; 0.52, 0.59, 0.53, 0.50, 0.53, and 0.51) in the AMZ, CAAT, CER, MAT, PMP, and PTN biomes, respectively, on an annual timescale. For the same timescale, the median values of B for the SM2RAIN-CCI (SM2RAIN-ASCAT; TRMM TMPA) product are equal to −5.50%, 1.10%, −0.90%, 0.40%, −3.50%, and 1.80% (−5.60%, −27.80%, −14.90%, −14.00%, −13.10%, and 5.90%; 3.90%, 11.30%, 6.00%, 5.80%, 9.70%, and 10.20%) in the AMZ, CAAT, CER, MAT, PMP, and PTN biomes, respectively. As expected, both SM2RAIN-based rainfall products provide the lowest performance in terms of R and B in the PTN biome, likely due to the high saturation of their soil throughout the year, which affects the estimation of rainfall via SM2RAIN [32]. The TRMM TMPA data correlate well with observations (median R over 0.50), but it tends to overestimate the amount of rainfall, particularly over the CAAT and PTN biomes (median R: 11.30% and 10.20%, respectively).
From Figure 5, the R mean values for SM2RAIN-CCI (SM2RAIN-ASCAT; TRMM TMPA) in winter, spring, summer, and autumn are 0.40, 0.39, 0.34, and 0.43 (0.46, 0.46, 0.39, and 0.51; 0.47, 0.506, 0.47, and 0.52), respectively. The B percentage mean values in Figure 6 for SM2RAIN-CCI (SM2RAIN-ASCAT; TRMM TMPA) in winter, spring, summer, and autumn are 0.75%, 0.30%, −10.15%, and 0.30% (−12.30%, −14.50%, −22.15%, and −11.50%; 8.65%, 9.06%, 5.14%, and 8.30%), respectively. These first quantitative results indicate that the SM2RAIN-ASCAT and TRMM TMPA rainfall products exhibit slightly closer agreement with the gauge-based rainfall in terms of linear correlation compared to the SM2RAIN-CCI product, mainly in the CAAT biome and autumn (R mean over 0.50 for SM2RAIN-ASCAT and TRMM TMPA). From Figure 6, one can see that SM2RAIN-ASCAT tends to underestimate the seasonal daily mean rainfall at all biomes, with the greatest magnitude of B over the CAAT biome in summer (B mean: −34.70%). Unlike SM2RAIN-ASCAT, SM2RAIN-CCI shows values of B moderately near zero across the country (i.e., perfect score), except in summer where the B median values for all points is equal to −10.15%. TRMM TMPA tends to overestimate the seasonal daily mean rainfall at all biomes, excepting the CAAT biome in summer, where the values of B reflect a moderate underestimation of the rainfall amount (B mean: −7.40%).
A more detailed comparison, considering the land use/cover and elevation simultaneously for an annual time scale, shows that the lowest R values for the SM2RAIN-CCI product are observed at the non-vegetated regions with ≤141 m a.s.l. (e.g., Chapada das Mangabeiras in the CAAT biome) and the wetland areas located between 142 and 438 m a.s.l. (e.g., Serra da Mantiqueira in the MAT biome). SM2RAIN-ASCAT shows its lowest R values in the densely forested regions with elevation between 741 and 994 m a.s.l. and those mosaic tree cover and shrub regions located above 995 m a.s.l., while for the TRMM TMPA product those values were observed in mosaic cropland regions located over 1277 m a.s.l. (Table 5). The highest R values for SM2RAIN-CCI and TRMM TMPA are prevalent in the wetland regions above 740 m a.s.l., whereas SM2RAIN-ASCAT exhibits its highest R values in the vegetation natural mosaics and rainfed-cropland regions above 994 m a.s.l. It is interesting to remark that the lowest and negative B values for SM2RAIN-CCI (i.e., the largest underestimation) are persistent in those landscapes dominated by the tree cover regions regularly flooded located below 141 m a.s.l, while for SM2RAIN-ASCAT and TRMM TMPA are observed in the sparse vegetation regions situated in lowland areas (below 438 m a.s.l). The highest and positive B values (i.e., the largest overestimation) for SM2RAIN-CCI and TRMM TMPA are frequent in areas characterized by the presence of non-vegetated areas and the tree cover regions regularly flooded with an elevation below 141m a.s.l. In contrast, SM2RAIN-ASCAT shows a low frequency of positive B values (mainly in the tree cover regions regularly flooded).
To investigate the impact of elevation on R and B, the linear correlation between the R and B scores against elevation for each product at annual time scale were calculated. For SM2RAIN-CCI, R and B were found to be moderately sensitive to elevation (correlations equal to 0.27 and 0.17 for R and B, respectively). Similar results were found for SM2RAIN-ASCAT (TRMM TMPA) with correlations equal to 0.38 and −0.12 (0.17 and 0.10) for R and B, respectively. A comparison more exhaustive of results from Table 5 reveals that the highest difference between both SM2RAIN-based products in terms of R occurs on those landscapes located between 741 and 994 m a.s.l. and characterized by the presence of the rainfed croplands or water bodies (about 0.05). By contrast, when B is considered, the difference is very significant in all elevation ranges; particularly in the lowlands dominated by non-vegetated soils and areas of sparse vegetation (values of B over 23%). These findings suggest that the performance of three rainfall products in terms of R and B is affected by the type of vegetation and the terrain complexity. In general, the values of R tend to increase in those regions with higher elevation (in particular, SM2RAIN-ASCAT and TRMM TMPA), but this is not the case for B, because the B-elevation relationship is not linear.
To evaluate the performance of the SPPs at a local scale, the daily rainfall estimates were compared to in situ rainfall measurements at six pixels randomly selected from the GBGR dataset (i.e., one per biome, see its location in Figure 1a). This comparison can be seen in Figure 7. As expected, these products slightly overestimate light rainfall (i.e., the red line over the orange line in Figure 7), but significantly underestimate heavy rainfall (i.e., the orange line over the red line in Figure 7). Moreover, when the R and B scores for each site are calculated (results not shown), one can note that the SM2RAIN-CCI rainfall estimates show reasonably good agreement with GBGR, especially over the CER and CAAT biomes in terms of R (R median: 0.62 and 0.41, respectively). It also shows slight biases, except in the CAAT biome where the B median is equal to −11.20%. Regarding the SM2RAIN-ASCAT product, results are in accordance with those inferences obtained from Figure 5 and Figure 6. Over the CAAT, MAT, and PMP biomes, the SM2RAIN-ASCAT product provided the highest underestimation (B median: −67.50%, −14.90%, and −18.4%, respectively), while a significant overestimation was observed in the AMZ biome (B median: 48.5%). The TRMM TMPA product is comparable with the SM2RAIN-based products in terms of R and B. They provided the highest values of R in the CAAT biome, but the low values in the AMZ biome. In terms of B, these products tend to overestimate (underestimate) the amount of rainfall in the (CAAT) AMZ biome. An inspection of Figure 7a reveals that the SM2RAIN-based products tend to overestimate the light rainfall in the AMZ biome. However, this behavior is attributed to the nearness of this pixel to the Amazon River, which is a permanent source of superficial moisture that the SM2RAIN algorithm has confused with rainfall during the dry season.
3.2. Monthly Mean Precipitation
We further evaluated the performance of SPPs on a monthly scale to investigate the seasonal variation in Brazil. For quantitative comparison purposes, the R, RMSE, ubRMSE, and B metrics were computed from 2007–2015, as shown in Figure 8. Several validation studies pointed out that the biases and errors could be amplified over those regions with no gauge stations [4,80,81]. Therefore, for this analysis, only those grid points with more than one gauge station per pixel and with 50% or more of rain gauge data frequency at the GBGR dataset were considered. Thus, the values of R, RMSE, ubRMSE, and B for each pixel (i.e., 4144 pixels met the defined criterion, equivalent to about 66% of common pixels for both rainfall products), month (i.e., 12 months per year), and year (i.e., nine years from 2007–2015) were calculated. Then, each point in Figure 8 was obtained by averaging those values from all-pixels over all-Brazil via median (n = 108 points).
The R, RMSE, and ubRMSE of the three SPPs exhibit a similar temporal variability during the period 2007–2015 (Figure 8). Note that results for R and B are quite consistent to those obtained from Figure 5 and Figure 6. The higher R values occur in winter (DJF), while the lower R values are observed in summer (JJA). The SM2RAIN-ASCAT rainfall product exhibits higher R values than the SM2RAIN-CCI and TRMM TMPA rainfall products for all months, except in summer where the correlation is slightly higher for TRMM TMPA. Additionally, the temporal distribution of RMSE and ubRMSE is similar for the three SPPs, showing a w-style pattern. That is, the higher RMSE and ubRMSE values are observed from January to March (a wet trimester in almost whole Brazil; see Figure 2), whereas lower RMSE and ubRMSE values occur in summer (JJA). TRMM TMPA exhibits higher RMSE and ubRMSE values than the SM2RAIN-based rainfall products for all months. Concerning the bias percentage, the SPPs show an irregular pattern in time, characterized by a high monthly variability (see Figure 8d). However, SM2RAIN-ASCAT (SM2RAIN-CCI) tends to underestimate (overestimate) rainfall in all months (almost all months, except in January, March, and April). When compared to the GBGR dataset, TRMM TMPA shows relatively good performance in terms of B and R, but it tends to underestimate the amount of rainfall in summer. Interestingly, the two SM2RAIN-based rainfall products exhibit a slight increase (decrease) of performance for the ground measurements in term of R (RMSE and ubRMSE) since 2009 onward. These results are consistent with ones from the previous section (e.g., Figure 7) and once again confirm that SM2RAIN-ASCAT provides rainfall estimates with a higher bias (median B: −13.10%) than that obtained with the SM2RAIN-CCI (median B: 6.10%) and TRMM TMPA (median B: 3.80%) rainfall products.
3.3. Error Characteristics of Daily Precipitation
In this section, the systematic and random errors for the SM2RAIN-based rainfall products and TRMM TMPA are further analyzed to reveal the detailed features of the errors in the rainfall estimates. Figure 9 shows the spatial distributions of error components (i.e., the systematic and random errors) for the three SPPs during 2007–2015. More significant contributions of systematic error components as compared to random error components over the country are evident for the SM2RAIN-based rainfall products. By contrast, TRMM TMPA shows larger contribution of random error components than systematic error components (MSEr explains more than 92% of MSE in each biome). SM2RAIN-ASCAT exhibits larger systematic error (relative to the total error) within the MAT and CAAT biomes and near the Venezuelan, Peruvian, and Colombian borders, particularly in those grasslands and sparse-vegetation regions located at the lowest part of the São Francisco River basin (MSEs median > 86%). The values of systematic error at the highest part of the Paraguay River basin (the PTN biome) are less than 65%. On the other hand, from Figure 9a,d, the systematic errors for SM2RAIN-CCI is lower than the random errors over most the Amazon basin where rainfall estimates are available. It is interesting to mention that SM2RAIN-CCI shows the most significant contribution of systematic error components than random error components over the agricultural regions at the PMP biome (MSEs median > 64%).
3.4. Performance of Precipitation Product in Detecting the Rainy Events
Figure 10 displays the spatial distribution of POD and FAR with the threshold of 1 mm/day (see Table 3 and Table 4). The three SPPs tend to show higher POD (lower FAR) values over the Amazon basin and most parts of the CER biome than over Northeastern Brazil and other Brazilian regions. Compared to the SM2RAIN-CCI product, SM2RAIN-ASCAT shows higher POD values in all biomes, excepting the CAAT biome where SM2RAIN-CCI is slightly better. About the skill of detection of rainfall events in terms of FAR, the best performance for SM2RAIN-ASCAT was achieved in the AMZ, MAT, and CAAT biomes, while SM2RAIN-CCI exhibited slightly lower FAR values in the CER, PMP, and PTN biomes. Figure 10 also reveal the good performance of the SM2RAIN-based rainfall products to detect rainfall in terms of POD. Conversely, the TRMM TMPA rainfall product tends to outperform the other two products in terms of FAR, in particular over the AMZ and CER biomes.
To evaluate the performance of the satellite estimates for light to heavy rainfall events over each biome, Figure 11 presents the Roebber’s performance diagram [78] of SM2RAIN-ASCAT (red circles), SM2RAIN-CCI (blue circles), and TRMM TMPA (orange circles) products for the different daily rainfall thresholds (i.e., 1, 2, 5, 10, 15, and 20 mm/day) over the six biomes of Brazil during 2007–2015. Since the dashed lines represent the BS and solid lines the CSI, the best scores are located in the upper right area of the diagram. The three SPPs tend to show decreased POD (increased FAR) with the rainfall threshold increased in all biomes of Brazil, revealing that the performance of each SPP in detecting the rain occurrence deteriorates with increasing rainfall thresholds. Overall, if the threshold value is greater than 10 mm/day, TRMM TMPA tends to show higher CSI values than SM2RAIN-ASCAT and SM2RAIN-CCI. In terms of FAR, the results were relatively similar between both SM2RAIN-based products, excepting the CAAT biome; where FAR values for SM2RAIN-ASCAT are significantly lower (Figure 11b). Regarding the B metric, results disclose that the three SPPs tend to underestimate the area for moderate and heavy rain events (i.e., threshold ≥ 10 mm/day and B < 1) in all biomes.
4. Discussion
Several statistical metrics were used to evaluate the SM2RAIN-CCI, SM2RAIN-ASCAT, and TRMM TMPA rainfall products against gridded rainfall observations in six Brazilian biomes with different rainfall regimes, and the whole Brazilian territory, during the period from January 2007 to December 2015. As already mentioned, SM2RAIN-CCI does not provide rainfall estimates over frozen soil, snow-cover, rainforest, and high topographical regions, because its processing chain uses a mask for removing these areas characterized by issues in the soil moisture retrieval [3] (see Figure 4). Inputs are based on the integration of the active and passive ESA CCI SM datasets with a calibration and bias correction based on the GPCC-FDD data [32]. In contrast, the SM2RAIN-ASCAT dataset is derived from the application of the SM2RAIN algorithm [29] to ASCAT soil moisture data without a previous filter and with a calibration and bias correction based on the ERA5 reanalysis data [71]. The GPCC-FDD dataset is a gauge-based product [32,82] while the ERA5 data is the fifth generation European Centre for Medium-Range Weather Forecasts (ECMWF) reanalysis based on a global atmospheric model in which different types of observations are routinely assimilated [83]. The TRMM TMPA rainfall product combines the estimates of rainfall from several satellite sensors and incorporates rainfall data from the GPCC-FDD data to scale the final product [84].
From a broad perspective, the three SPPs captured the temporal dynamics of the in situ daily and seasonal rainfall relatively well (see Figure 5), but tended to fail to estimate the amount of rainfall (see Figure 6), mainly in those regions dominated by a semiarid climate at the CAAT and CER biomes (in particular, SM2RAIN-CCI and SM2RAIN-ASCAT) and in coastal areas of the NEB (in particular, TRMM TMPA). These results are in good agreement with those shown by Paredes-Trejo et al. [30], who found that SM2RAIN-CCI (version 1.0) exhibits this same feature over most of Northeastern Brazil (particularly, in the Sertão region). In general, SM2RAIN-CCI and TRMM TMPA tended to show slightly better agreement with the gauge-based data in different seasons relative to the SM2RAIN-ASCAT rainfall product (Figure 4 and Figure 6). This can be partially explained by the fact that very likely, some of the rain gauges from the GPCC-FDD data used during the stage of calibration and bias correction of both SM2RAIN-CCI and TRMM TMPA have also been used for developing the GBGR dataset, resulting lower bias magnitudes than that obtained with SM2RAIN-ASCAT.
Although SM2RAIN-ASCAT significantly underestimated the seasonal mean rainfall over most of the Brazilian biomes (Figure 6), the locations of most of the heavy rainfall spots over the inland regions of Southern Brazil and the upper Amazon region were relatively well detected (Figure 4). Larger biases in these SPPs were evident over inland northeast Brazil and on the eastern part of the Chapada Diamantina and Serra do Espinhaço cordilleras, in particular for SM2RAIN-ASCAT in summer and autumn (Figure 6j–l). In these regions, the impact of topographic complexity (see Figure 1c) and volume scattering in dry soils [71] on soil moisture retrieval accuracy has been well documented and extensively analyzed in the literature [42,85,86,87]. A factor less evident that influenced the numerical performance of both SM2RAIN-based products in term of bias is linked to the fact that the rainfall in summer is characterized by intense and short rainfall events (excepting the PMP biome) [88]. Therefore, it is possible that sensors (in particular, ASCAT) missed rainfall during the period.
As shown in Figure 2, there has been more rainfall in autumn and winter than in summer and spring (excepting the PMP biome where rainfall are uniformly distributed [52]). As can be seen in Figure 8, the three SPPs showed the highest (lowest) values of error in terms of RMSE and ubRMSE in winter and autumn (summer and spring), as expected because RMSE and ubRMSE are strongly dependent on the rainfall magnitude [27].
The TRMM TMPA rainfall product performed relatively similar to SM2RAIN-CCI and SM2RAIN-ASCAT in terms of R (Figure 8a), implying that they reproduced the dynamic of the rainfall reasonably well, except in summer. Nevertheless, this does not appear to have a regular pattern in relation to the seasonal bias (B) (Figure 8d). Overall, SM2RAIN-CCI tended to show higher overestimation during the transition from summer to autumn, whereas a general underestimation characterized SM2RAIN-ASCAT throughout the year, but was significantly noticeable in spring. Interestingly, the SM2RAIN-based products performed better than TRMM TMPA against the GBGR dataset in terms of R, RMSE, and ubRMSE (in particular, SM2RAIN-ASCAT). The three SPPs slightly overestimated light rainfall, but they significantly underestimated heavy rainfall (Figure 7), thus confirming the tendency of the SM2RAIN algorithm to underestimate the higher rainfall rates [27] and the difficulty of estimating the amount of rainfall for light and heavy rainfall events from TRMM TMPA [84]. For the SM2RAIN-based rainfall products, this can be put down to soil moisture retrieval errors, which significantly affected the quality of the rainfall estimates derived from the SM2RAIN algorithm (i.e., via error propagation) [71]. In terms of B, SM2RAIN-CCI showed better performance than SM2RAIN-ASCAT across Brazil (i.e., B values closer to 0 mm/day). This could be partially explained by the fact that the SM2RAIN parameters for SM2RAIN-CCI were obtained by minimizing the RMSE between the five-day estimated rainfall and the GPCC-FDD data during three calibration periods 1998–2001, 2002–2006, and 2007–2013 on a pixel-by-pixel basis [32], whereas SM2RAIN-ASCAT implemented a static correction procedure for climatological correction based on a cumulative density function (CDF) and the ERA5 reanalysis data [44]. A different reason for the best performance of SM2RAIN-CCI in terms of B can be because this product combines multiple soil moisture data sources [43], while SM2RAIN-ASCAT uses only ASCAT soil moisture data disseminated by H-SAF in its processing chain (i.e., H113 and H114) [35]. In this context, it is interesting to mention that also the type of land cover/use and the terrain complexity influenced the overall performance for the three SPPs in terms of R and B (see Table 5). For the SM2RAIN-based products, the higher positive or negative B values should be expected over forested regions where the signal of satellite sensors does not penetrate the dense vegetation cover [87] or over flooded regions where the soil remains saturated through the year [27], respectively.
Regarding the error components, results revealed that the two SM2RAIN-based SPPs were quite similar in terms of error characteristics (Figure 9). They showed more significant contribution of systematic error components than random error components across Brazil, coinciding with findings from a previous study carried out by Prakash [3] in India. Therefore, such products may require refinement and correction before being used for operational application (e.g., drought monitoring) [89], particularly in the CAAT (PMP) biome for SM2RAIN-ASCAT (SM2RAIN-CCI). By contrast, TRMM TMPA showed a more significant contribution of random error components than systematic error components; thus, TRMM TMPA performed better than the SM2RAIN-ASCAT and SM2RAIN-CCI products (see Figure 9).
In terms of the detection of rainfall events, results showed that the two SM2RAIN-based SPPs have a relatively similar ability (median POD > 0.70), with a rainfall threshold of 1 mm/day and performed better than TRMM TMPA (see Figure 10). Nevertheless, for the SM2RAIN-based SPPs, this feature tended to decrease in those semiarid regions with complex topography, such as in the CAAT biome. SM2RAIN-ASCAT showed better performance than SM2RAIN-CCI over almost all Brazil in terms of POD (excepting the CAAT biome), which was somewhat unexpected given the sophisticated calibration scheme and multiple soil moisture datasets employed in generating the SM2RAIN-CCI dataset [32]. Additionally, the three SPPs tended to show decreased POD with an increase in rainfall threshold (i.e., from 1–20 mm/day) in all Brazilian biomes (Figure 11), indicating that the performance of each SPP for rain event detection decreased with an increased rainfall threshold. This result is consistent with the findings of similar studies [74,76]. Overall, SM2RAIN-CCI and SM2RAIN-ASCAT are still facing a significant challenge to estimate the amount of rainfall accurately and to detect rainfall over Northeastern Brazil, especially over the Sertão region where the rainfall is largely underestimated. Nevertheless, it should be highlighted that SM2RAIN-ASCAT performed better than TRMM TMPA and SM2RAIN-CCI in terms of R, RMSE, and ubRMSE (see Figure 8), and in terms of POD and FAR with a rainfall threshold equal to 1 mm/day (see Figure 11). Thus, their rainfall estimates can offer a valuable alternative to ground-based observations whether the bias is adjusted before its use in operational applications such as water resources management and agriculture.
5. Conclusions
Microwave-based satellite soil moisture products allow an innovative way to directly estimate rainfall using soil moisture observations with a bottom-up approach based on the inversion of the soil water balance Equation (SM2RAIN). The SM2RAIN–CCI (SM2RAIN-ASCAT) product provides rainfall estimates obtained from the inversion of the microwave-based satellite soil moisture observations derived from the ESA–CCI project (from the ASCAT soil moisture data). This study set out with the aim of evaluating the performance of SM2RAIN-CCI, SM2RAIN-ASCAT, and TRMM TMPA satellite rainfall estimates against gridded rain gauge observations (GBGR) in six Brazilian bioregions with different rainfall regimes, and the whole Brazilian territory. The analysis was performed on a sub-regional scale at 0.25° spatial sampling with daily rainfall during the period 2007-2015. Concerning the obtained results, the following conclusions could be drawn:
- (1).
- (2).
- The reliability of rainfall products was partially dependent on the topography and types of land use/land cover (biomes); for instance, they tended to fail to estimate the amount of rainfall in those regions dominated by a semiarid climate at the CAAT and CER biomes (see Figure 1c and Figure 6, and Table 5).
- (3).
- These products showed the highest (lowest) values of error in terms of RMSE and ubRMSE in winter and autumn (summer and spring), as expected because these scores are strongly dependent on the rainfall magnitude (see Figure 8).
- (4).
- SM2RAIN-CCI tended to show higher overestimation during the transition from summer to autumn, while a general underestimation characterized SM2RAIN-ASCAT throughout the year, and was significantly noticeable in spring (see Figure 8). TRMM TMPA tended to overestimate the seasonal daily mean rainfall in all biomes, excepting the CAAT biome in summer, where a moderate underestimation of the rainfall amount was observed (see Figure 5 and Figure 6).
- (5).
- The systematic error component in SM2RAIN-CCI and SM2RAIN-ASCAT was dominant to the random error component in all-Brazil (see Figure 9), suggesting the need for bias correction to these rainfall products before integrating them in any operational application. By contrast, TRMM TMPA showed a larger contribution of random error components than systematic error components.
- (6).
- In terms of POD, the results of the two SM2RAIN-based rainfall products were quite similar (excepting the CAAT biome) when a rainfall threshold of 1 mm/day was used (see Figure 10). Interestingly, the SM2RAIN-based and TRMM TMPA products tended to show decreased POD with the rainfall threshold increased (i.e., from 1–20 mm/day) over all biomes of Brazil. Thus, indicating that the performance of each product in detecting the rain occurrence declined with the rainfall threshold increased (see Figure 11). In terms of the detection of rainfall events, the two SM2RAIN-based SPPs performed better than TRMM TMPA (see Figure 10).
The overall results indicated slightly better performance of SM2RAIN-CCI rainfall product than SM2RAIN-ASCAT across Brazil for rainfall estimation. Nevertheless, further improvements for the SM2RAIN-ASCAT rainfall product could be obtained by using the GPCC-FDD data for its calibration and bias correction rather than the ERA5 reanalysis data. Results also demonstrated that both SM2RAIN-based rainfall products can be effectively used for some operational purposes on a daily scale, such as water irrigation planning, where the best accuracy of rainfall estimates was observed (Figure 5 and Figure 6). Future work should involve validation of these rainfall products considering others satellite-based rainfall products, and also against fully independent observed data (e.g., radar estimates), to come to more conclusive results about the performance of SM2RAIN-ASCAT and SM2RAIN-CCI in Brazil.
Author Contributions
F.P.-T. conceived and designed the experiments; H.B. performed the experiments; C.A.C.d.S. analyzed the data and contributed analysis tools. F.P.-T. wrote the paper, but all authors discussed the results and enhanced the final draft of the manuscript.
Funding
This work was funded by the Coordenação de Aperfeiçoamento de Pessoal de Nível Superior (CAPES) (grant no. 88887.091737/2014-01: Edital Pró-Alertas no 24/2014 under project Análise e Previsão dos Fenômenos Hidrometeorológicos Intensos do Leste do Nordeste Brasileiro) and PNPD—UFCG/Meteorology (grant no. 24009016001P5). The third author also thanks CAPES—Finance Code 001 (Visiting Professor Fellowship, grant no. 88881.172029/2018-01).
Acknowledgments
Hydrology Group of the Research Institute for Geo-Hydrological Protection (Perugia, Italy) is thanked for providing the data for this study: SM2RAIN-CCI (from https://zenodo.org/record/1305021) and SM2RAIN-ASCAT (from https://zenodo.org/record/2591215). The authors are very thankful to anonymous reviewers for their insightful comments and valuable suggestions. We thank Lacey Bodnar from the Daugherty Water for Food Global Institute at the University of Nebraska-Lincoln for her invaluable assistance.
Conflicts of Interest
The authors declare that they have no conflict of interest.
References
- Skofronick-Jackson, G.; Petersen, W.A.; Berg, W.; Kidd, C.; Stocker, E.F.; Kirschbaum, D.B.; Kakar, R.; Braun, S.A.; Huffman, G.J.; Iguchi, T.; et al. The global precipitation measurement (GPM) mission for science and society. Bull. Am. Meteorol. Soc. 2017, 98, 1679–1695. [Google Scholar] [CrossRef]
- Zhao, X.; Jing, W.; Zhang, P. Mapping Fine Spatial Resolution Precipitation from TRMM Precipitation Datasets Using an Ensemble Learning Method and MODIS Optical Products in China. Sustainability 2017, 9, 1912. [Google Scholar] [CrossRef]
- Prakash, S. Performance assessment of CHIRPS, MSWEP, SM2RAIN-CCI, and TMPA precipitation products across India. J. Hydrol. 2019, 571, 50–59. [Google Scholar] [CrossRef]
- Beck, H.E.; Vergopolan, N.; Pan, M.; Levizzani, V.; Van Dijk, A.I.J.M.; Weedon, G.P.; Brocca, L.; Pappenberger, F.; Huffman, G.J.; Wood, E.F. Global-scale evaluation of 22 precipitation datasets using gauge observations and hydrological modeling. Hydrol. Earth Syst. Sci. 2017, 21, 6201–6217. [Google Scholar] [CrossRef] [Green Version]
- Zambrano, F.; Wardlow, B.; Tadesse, T.; Lillo-Saavedra, M.; Lagos, O. Evaluating satellite-derived long-term historical precipitation datasets for drought monitoring in Chile. Atmos. Res. 2017, 186, 26–42. [Google Scholar] [CrossRef]
- Funk, C.; Verdin, A.; Michaelsen, J.; Peterson, P.; Pedreros, D.; Husak, G. A global satellite assisted precipitation climatology. Earth Syst. Sci. Data Discuss. 2015, 8, 401–425. [Google Scholar] [CrossRef]
- Villarini, G.; Mandapaka, P.V.; Krajewski, W.F.; Moore, R.J. Rainfall and sampling uncertainties: A rain gauge perspective. J. Geophys. Res. Atmos. 2008, 113. [Google Scholar] [CrossRef] [Green Version]
- Maggioni, V.; Sapiano, M.R.P.; Adler, R.F.; Tian, Y.; Huffman, G.J. An Error Model for Uncertainty Quantification in High-Time-Resolution Precipitation Products. J. Hydrometeorol. 2014, 15, 1274–1292. [Google Scholar] [CrossRef]
- Ciabatta, L.; Brocca, L.; Massari, C.; Moramarco, T.; Gabellani, S.; Puca, S.; Wagner, W. Rainfall-runoff modelling by using SM2RAIN-derived and state-of-the-art satellite rainfall products over Italy. Int. J. Appl. Earth Obs. Geoinf. 2016, 48, 163–173. [Google Scholar] [CrossRef]
- Munzimi, Y.A.; Hansen, M.C.; Adusei, B.; Senay, G.B. Characterizing Congo basin rainfall and climate using Tropical Rainfall Measuring Mission (TRMM) satellite data and limited rain gauge ground observations. J. Appl. Meteorol. Climatol. 2015, 54, 541–555. [Google Scholar] [CrossRef]
- Kidd, C.; Becker, A.; Huffman, G.J.; Muller, C.L.; Joe, P.; Skofronick-Jackson, G.; Kirschbaum, D.B. So, how much of the Earth’s surface is covered by rain gauges? Bull. Am. Meteorol. Soc. 2017, 98, 69–78. [Google Scholar] [CrossRef] [PubMed]
- Maggioni, V.; Meyers, P.C.; Robinson, M.D. A Review of Merged High-Resolution Satellite Precipitation Product Accuracy during the Tropical Rainfall Measuring Mission (TRMM) Era. J. Hydrometeorol. 2016, 17, 1101–1117. [Google Scholar] [CrossRef]
- Ciabatta, L.; Marra, A.C.; Panegrossi, G.; Casella, D.; Sanò, P.; Dietrich, S.; Massari, C.; Brocca, L. Daily precipitation estimation through different microwave sensors: Verification study over Italy. J. Hydrol. 2017, 545, 436–450. [Google Scholar] [CrossRef]
- Ciabatta, L.; Brocca, L.; Massari, C.; Moramarco, T.; Puca, S.; Rinollo, A.; Gabellani, S.; Wagner, W. Integration of Satellite Soil Moisture and Rainfall Observations over the Italian Territory. J. Hydrometeorol. 2015, 16, 1341–1355. [Google Scholar] [CrossRef]
- Paredes, F.; Barbosa, H.A.; Lakshmi-Kumar, T. Validating CHIRPS-based satellite precipitation estimates in Northeast Brazil. J. Arid Environ. 2016, 139, 26–40. [Google Scholar] [CrossRef]
- Sahoo, A.K.; Sheffield, J.; Pan, M.; Wood, E.F. Evaluation of the Tropical Rainfall Measuring Mission Multi-Satellite Precipitation Analysis (TMPA) for assessment of large-scale meteorological drought. Remote Sens. Environ. 2015, 159, 181–193. [Google Scholar] [CrossRef]
- Liu, X.; Chang, P.; Kurian, J.; Saravanan, R.; Lin, X. Satellite-observed precipitation response to ocean mesoscale eddies. J. Clim. 2018, 31, 6879–6895. [Google Scholar] [CrossRef]
- Zambrano-Bigiarini, M.; Nauditt, A.; Birkel, C.; Verbist, K.; Ribbe, L. Temporal and spatial evaluation of satellite-based rainfall estimates across the complex topographical and climatic gradients of Chile. Hydrol. Earth Syst. Sci. 2017, 21, 1295–1320. [Google Scholar] [CrossRef] [Green Version]
- Maggioni, V.; Sapiano, M.R.P.; Adler, R.F. Estimating Uncertainties in High-Resolution Satellite Precipitation Products: Systematic or Random Error? J. Hydrometeorol. 2016, 17, 1119–1129. [Google Scholar] [CrossRef]
- Abera, W.; Brocca, L.; Rigon, R. Comparative evaluation of different satellite rainfall estimation products and bias correction in the Upper Blue Nile (UBN) basin. Atmos. Res. 2016, 178–179, 471–483. [Google Scholar] [CrossRef]
- Kimani, M.W.; Hoedjes, J.C.B.; Su, Z. An assessment of satellite-derived rainfall products relative to ground observations over East Africa. Remote Sens. 2017, 9, 430. [Google Scholar] [CrossRef]
- Huffman, G.J.; Bolvin, D.T.; Nelkin, E.J.; Wolff, D.B.; Adler, R.F.; Gu, G.; Hong, Y.; Bowman, K.P.; Stocker, E.F. The TRMM Multisatellite Precipitation Analysis (TMPA): Quasi-Global, Multiyear, Combined-Sensor Precipitation Estimates at Fine Scales. J. Hydrometeorol. 2007, 8, 38–55. [Google Scholar] [CrossRef]
- Hsu, K.; Gao, X.; Sorooshian, S.; Gupta, H.V. Precipitation estimation from remotely sensed information using artificial neural networks. J. Appl. Meteorol. 1997, 36, 1176–1190. [Google Scholar] [CrossRef]
- Joyce, R.J.; Janowiak, J.E.; Arkin, P.A.; Xie, P. CMORPH: A Method that Produces Global Precipitation Estimates from Passive Microwave and Infrared Data at High Spatial and Temporal Resolution. J. Hydrometeorol. 2004, 5, 487–503. [Google Scholar] [CrossRef]
- Funk, C.; Peterson, P.; Landsfeld, M.; Pedreros, D.; Verdin, J.; Shukla, S.; Husak, G.; Rowland, J.; Harrison, L.; Hoell, A.; et al. The climate hazards infrared precipitation with stations—A new environmental record for monitoring extremes. Sci. Data 2015, 2, 150066. [Google Scholar] [CrossRef] [PubMed]
- Beck, H.E.; Van Dijk, A.I.J.M.; Levizzani, V.; Schellekens, J.; Miralles, D.G.; Martens, B.; De Roo, A. MSWEP: 3-hourly 0.25° global gridded precipitation (1979–2015) by merging gauge, satellite, and reanalysis data. Hydrol. Earth Syst. Sci. 2017, 21, 589–615. [Google Scholar] [CrossRef] [Green Version]
- Brocca, L.; Ciabatta, L.; Massari, C.; Dorigo, W.; Hahn, S. Soil as a natural raingauge: Estimating rainfall from global satellite soil moisture data. J. Geophys. Res. Atmos. 2014, 119, 5128–5141. [Google Scholar] [CrossRef]
- Brocca, L.; Moramarco, T.; Melone, F.; Wagner, W. A new method for rainfall estimation through soil moisture observations. Geophys. Res. Lett. 2013, 40, 853–858. [Google Scholar] [CrossRef] [Green Version]
- Brocca, L.; Massari, C.; Ciabatta, L.; Moramarco, T.; Penna, D.; Zuecco, G.; Pianezzola, L.; Borga, M.; Matgen, P.; Martínez-Fernández, J. Rainfall estimation from in situ soil moisture observations at several sites in Europe: An evaluation of the SM2RAIN algorithm. J. Hydrol. Hydromech. 2015, 63, 201–209. [Google Scholar] [CrossRef]
- Paredes-Trejo, F.; Barbosa, H.; Rossato, L. Assessment of SM2RAIN-Derived and State-of-the-Art Satellite Rainfall Products over Northeastern Brazil. Remote Sens. 2018, 10, 1093. [Google Scholar] [CrossRef]
- Koster, R.D.; Brocca, L.; Crow, W.T.; Burgin, M.S.; De Lannoy, G.J.M. Precipitation estimation using L-band and C-band soil moisture retrievals. Water Resour. Res. 2016, 52, 7213–7225. [Google Scholar] [CrossRef] [PubMed]
- Ciabatta, L.; Massari, C.; Brocca, L.; Gruber, A.; Reimer, C.; Hahn, S.; Paulik, C.; Dorigo, W.; Kidd, R.; Wagner, W. SM2RAIN-CCI: A new global long-term rainfall dataset derived from ESA CCI soil moisture. Earth Syst. Sci. Data 2018, 10, 267–280. [Google Scholar] [CrossRef]
- Brocca, L.; Pellarin, T.; Crow, W.T.; Ciabatta, L.; Massari, C.; Ryu, D.; Su, C.-H.; Rüdiger, C.; Kerr, Y. Rainfall estimation by inverting SMOS soil moisture estimates: A comparison of different methods over Australia. J. Geophys. Res. Atmos. 2016, 121, 12–62. [Google Scholar] [CrossRef]
- Brocca, L.; Ciabatta, L.; Massari, C.; Camici, S.; Tarpanelli, A. Soil moisture for hydrological applications: Open questions and new opportunities. Water 2017, 9, 140. [Google Scholar] [CrossRef]
- Brocca, L.; National, I.; Ciabatta, L.; National, I.; Massari, C.; National, I.; Italian, M.; View, D.W.; Brocca, L. Integration of H05 and H16 Products through SM2RAIN Algorithm for Improving Rainfall Estimate; European Organisation for the Exploitation of Meteorological Satellites: Darmstadt, Germany, 2016. [Google Scholar]
- Liu, Y.Y.; Parinussa, R.M.; Dorigo, W.A.; De Jeu, R.A.M.; Wagner, W.; Van Dijk, A.I.J.M.; McCabe, M.F.; Evans, J.P. Developing an improved soil moisture dataset by blending passive and active microwave satellite-based retrievals. Hydrol. Earth Syst. Sci. 2011, 15, 425–436. [Google Scholar] [CrossRef] [Green Version]
- Dorigo, W.A.; Gruber, A.; De Jeu, R.A.M.; Wagner, W.; Stacke, T.; Loew, A.; Albergel, C.; Brocca, L.; Chung, D.; Parinussa, R.M.; et al. Evaluation of the ESA CCI soil moisture product using ground-based observations. Remote Sens. Environ. 2015, 162, 380–395. [Google Scholar] [CrossRef]
- Wagner, W.; Hahn, S.; Kidd, R.; Melzer, T.; Bartalis, Z.; Hasenauer, S.; Figa-Saldaña, J.; de Rosnay, P.; Jann, A.; Schneider, S.; et al. The ASCAT soil moisture product: A review of its specifications, validation results, and emerging applications. Meteorol. Z. 2013, 22, 5–33. [Google Scholar] [CrossRef]
- Melo, D.d.C.D.; Xavier, A.C.; Bianchi, T.; Oliveira, P.T.S.; Scanlon, B.R.; Lucas, M.C.; Wendland, E. Performance evaluation of rainfall estimates by TRMM multi-satellite precipitation analysis 3B42V6 and V7 over Brazil. J. Geophys. Res. 2015, 120, 9426–9436. [Google Scholar] [CrossRef]
- Ayehu, G.T.; Tadesse, T.; Gessesse, B.; Dinku, T. Validation of new satellite rainfall products over the Upper Blue Nile Basin, Ethiopia. Atmos. Meas. Tech. Discuss. 2017, 11, 1–24. [Google Scholar] [CrossRef]
- Nogueira, S.M.C.; Moreira, M.A.; Volpato, M.M.L. Evaluating precipitation estimates from Eta, TRMM and CHRIPS data in the south-southeast region of Minas Gerais state-Brazil. Remote Sens. 2018, 10, 313. [Google Scholar] [CrossRef]
- Souto, J.; Beltrão, N.; Teodoro, A.; Souto, J.; Beltrão, N.; Teodoro, A. Performance of Remotely Sensed Soil Moisture for Temporal and Spatial Analysis of Rainfall over São Francisco River Basin, Brazil. Geosciences 2019, 9, 144. [Google Scholar] [CrossRef]
- Ciabatta, L.; Massari, C.; Brocca, L.; Gruber, A.; Reimer, C.; Hahn, S.; Paulik, C.; Dorigo, W.; Kidd, R.; Wagner, W. SM2RAIN-CCI (1 Jan 1998–31 December 2015) global daily rainfall dataset 2018. Available online: https://zenodo.org/record/846260#.XNOpPZoRWUk (accessed on 8 May 2019).
- Brocca, L.; Filippucci, P.; Hahn, S.; Ciabatta, L.; Massari, C.; Camici, S.; Schüller, L.; Bojkov, B.; Wagner, W. Wolfgang SM2RAIN-ASCAT (2007–2018): Global daily satellite rainfall from ASCAT soil moisture. Earth Syst. Sci. Data 2019. in review. [Google Scholar] [CrossRef]
- Instituto Brasileiro de Geografia e Estatística 2010 Census (Censo 2010). Available online: https://ww2.ibge.gov.br/home/estatistica/populacao/censo2010/default.shtm (accessed on 7 March 2019).
- Salazar, L.; Nobre, C.; Oyama, M. Climate change consequences on the biome distribution in tropical South America. Geophys. Res. Lett. 2007, 34, 1–6. [Google Scholar] [CrossRef]
- Oliveira-Filho, A.T.; Ratter, J.A. Vegetation Physiognomies and Woody Flora of the Cerrado Biome. Cerrados Brazil Ecol. Nat. Hist. a Neotrop. Savanna 2002, 42, 91–120. [Google Scholar]
- Scarano, F.R.; Ceotto, P. Brazilian Atlantic forest: Impact, vulnerability, and adaptation to climate change. Biodivers. Conserv. 2015, 24, 2319–2331. [Google Scholar] [CrossRef]
- Barbosa, H.A.; Huete, A.R.; Baethgen, W.E. A 20-year study of NDVI variability over the Northeast Region of Brazil. J. Arid Environ. 2006, 67, 288–307. [Google Scholar] [CrossRef]
- Mariano, D.A.; dos Santos, C.A.C.; Wardlow, B.D.; Anderson, M.C.; Schiltmeyer, A.V.; Tadesse, T.; Svoboda, M.D. Use of remote sensing indicators to assess effects of drought and human-induced land degradation on ecosystem health in Northeastern Brazil. Remote Sens. Environ. 2018, 213, 129–143. [Google Scholar] [CrossRef]
- Souza, R.; Feng, X.; Antonino, A.; Montenegro, S.; Souza, E.; Porporato, A. Vegetation response to rainfall seasonality and interannual variability in tropical dry forests. Hydrol. Process. 2016, 30, 3583–3595. [Google Scholar] [CrossRef]
- Alho, C.J.R. Biodiversity of the Pantanal: Response to seasonal flooding regime and to environmental degradation. Braz. J. Biol. 2008, 68, 957–966. [Google Scholar] [CrossRef]
- Cruz, J.C.; Valente, M.L.; Baggiotto, C.; Baumhardt, E. Qualitative characteristics of water resulting from the introduction of Eucalyptus silviculture in Pampa biome, RS. RBRH 2016, 21, 636–645. [Google Scholar] [CrossRef] [Green Version]
- Barbosa, H.A.; Lakshmi Kumar, T.V.; Silva, L.R.M. Recent trends in vegetation dynamics in the South America and their relationship to rainfall. Nat. Hazards 2015, 77, 883–899. [Google Scholar] [CrossRef]
- Barbosa, H.A.; Lakshmi Kumar, T.V. Influence of rainfall variability on the vegetation dynamics over Northeastern Brazil. J. Arid Environ. 2016, 124, 377–387. [Google Scholar] [CrossRef]
- Barbosa, H.A.; Lakshmi Kumar, T.; Paredes, F.; Elliott, S.; Ayuga, J.G. Assessment of Caatinga response to drought using Meteosat-SEVIRI Normalized Difference Vegetation Index (2008–2016). ISPRS J. Photogramm. Remote Sens. 2019, 148, 235–252. [Google Scholar] [CrossRef]
- Houghton, R.A.; Bontemps, S.; Peng, S.; Lamarche, C.; Li, W.; MacBean, N.; Defourny, P.; Ciais, P. Gross and net land cover changes based on plant functional types derived from the annual ESA CCI land cover maps. Earth Syst. Sci. Data Discuss. 2017, 10, 1–23. [Google Scholar]
- Berry, P.A.M.; Garlick, J.D.; Smith, R.G. Near-global validation of the SRTM DEM using satellite radar altimetry. Remote Sens. Environ. 2007, 106, 17–27. [Google Scholar] [CrossRef]
- Xavier, A.C.; King, C.W.; Scanlon, B.R. Daily gridded meteorological variables in Brazil (1980–2013). Int. J. Climatol. 2016, 36, 2644–2659. [Google Scholar] [CrossRef]
- Marengo, J.A. Interannual variability of surface climate in the Amazon basin. Int. J. Climatol. 1992, 12, 853–863. [Google Scholar] [CrossRef]
- Tomaziello, A.C.N.; Carvalho, L.M.V.; Gandu, A.W. Intraseasonal variability of the Atlantic Intertropical Convergence Zone during austral summer and winter. Clim. Dyn. 2016, 47, 1717–1733. [Google Scholar] [CrossRef]
- Ledru, M.-P.; Montade, V.; Blanchard, G.; Hély, C. Long-term spatial changes in the distribution of the Brazilian Atlantic Forest. Biotropica 2016, 48, 159–169. [Google Scholar] [CrossRef]
- Kousky, V.E. Frontal Influences on Northeast Brazil. Mon. Weather Rev. 1979, 107, 1140–1153. [Google Scholar] [CrossRef] [Green Version]
- Carvalho, L.M.V.; Jones, C.; Liebmann, B. The South Atlantic convergence zone: Intensity, form, persistence, and relationships with intraseasonal to interannual activity and extreme rainfall. J. Clim. 2004, 17, 88–108. [Google Scholar] [CrossRef]
- Rao, V.B.; Franchito, S.H.; Santo, C.M.E.; Gan, M.A. An update on the rainfall characteristics of Brazil: Seasonal variations and trends in 1979–2011. Int. J. Climatol. 2016, 36, 291–302. [Google Scholar] [CrossRef]
- Uvo, C.B.; Repelli, C.A.; Zebiak, S.E.; Kushnir, Y. The relationships between tropical Pacific and Atlantic SST and northeast Brazil monthly precipitation. J. Clim. 1998, 11, 551–562. [Google Scholar] [CrossRef]
- Xavier, A.C.; King, C.W.; Scanlon, B.R. Brazil Gridded Meteorological Data from 1980–2013, 2016. Available online: https://pdfs.semanticscholar.org/9e4c/b88ee4d2c6d574c9eb1ccd7d4f81d1aa1029.pdf (accessed on 8 May 2019).
- Hofstra, N.; New, M. Spatial variability in correlation decay distance and influence on angular-distance weighting interpolation of daily precipitation over Europe. Int. J. Climatol. 2009, 29, 1872–1880. [Google Scholar] [CrossRef] [Green Version]
- Xavier, A.C. An update of Xavier, King and Scanlon (2016) daily precipitation gridded dataset for the Brazil. In Proceedings of the 18th Brazilian Symposium on Remote Sensing, Santos, São Paulo, Brazil, 28–31 May 2017. [Google Scholar]
- Loew, A.; Bell, W.; Brocca, L.; Bulgin, C.E.; Burdanowitz, J.; Calbet, X.; Donner, R.V.; Ghent, D.; Gruber, A.; Kaminski, T.; et al. Validation practices for satellite-based Earth observation data across communities. Rev. Geophys. 2017, 55, 779–817. [Google Scholar] [CrossRef] [Green Version]
- Brocca, L.; Crow, W.T.; Ciabatta, L.; Massari, C.; De Rosnay, P.; Enenkel, M.; Hahn, S.; Amarnath, G.; Camici, S.; Tarpanelli, A.; et al. A review of the applications of ASCAT soil moisture products. IEEE J. Sel. Top. Appl. Earth Obs. Remote Sens. 2017, 10, 2285–2306. [Google Scholar] [CrossRef]
- Massari, C.; Camici, S.; Ciabatta, L.; Brocca, L. Exploiting satellite-based surface soil moisture for flood forecasting in the Mediterranean area: State update versus rainfall correction. Remote Sens. 2018, 10, 292. [Google Scholar] [CrossRef]
- GES DISC. Mirador—Goddard Earth Sciences (GES) Data and Information Center (DISC). Available online: https://mirador.gsfc.nasa.gov/ (accessed on 8 May 2019).
- Rozante, J.; Vila, D.; Barboza Chiquetto, J.; Fernandes, A.; Souza Alvim, D. Evaluation of TRMM/GPM blended daily products over Brazil. Remote Sens. 2018, 10, 882. [Google Scholar] [CrossRef]
- AghaKouchak, A.; Mehran, A.; Norouzi, H.; Behrangi, A. Systematic and random error components in satellite precipitation datasets. Geophys. Res. Lett. 2012, 39. [Google Scholar] [CrossRef]
- Huang, A.; Zhao, Y.; Zhou, Y.; Yang, B.; Zhang, L.; Dong, X.; Fang, D.; Wu, Y. Evaluation of multisatellite precipitation products by use of ground-based data over China. J. Geophys. Res. Atmos. 2016, 121, 10–654. [Google Scholar] [CrossRef]
- Toté, C.; Patricio, D.; Boogaard, H.; van der Wijngaart, R.; Tarnavsky, E.; Funk, C. Evaluation of satellite rainfall estimates for drought and flood monitoring in Mozambique. Remote Sens. 2015, 7, 1758–1776. [Google Scholar] [CrossRef]
- Roebber, P.J. Visualizing multiple measures of forecast quality. Weather Forecast. 2009, 24, 601–608. [Google Scholar] [CrossRef]
- Rodriguez-Fernández, N.J.; Kerr, Y.H.; van der Schalie, R.; Al-Yaari, A.; Wigneron, J.-P.; de Jeu, R.; Richaume, P.; Dutra, E.; Mialon, A.; Drusch, M.; et al. Long Term Global Surface Soil Moisture Fields Using an SMOS-Trained Neural Network Applied to AMSR-E Data. Remote Sens. 2016, 8, 959. [Google Scholar] [CrossRef]
- Chen, M.; Shi, W.; Xie, P.; Silva, V.B.S.; Kousky, V.E.; Wayne Higgins, R.; Janowiak, J.E. Assessing objective techniques for gauge-based analyses of global daily precipitation. J. Geophys. Res. Atmos. 2008, 113. [Google Scholar] [CrossRef] [Green Version]
- Zeng, Q.; Wang, Y.; Chen, L.; Wang, Z.; Zhu, H.; Li, B. Inter-comparison and evaluation of remote sensing precipitation products over China from 2005 to 2013. Remote Sens. 2018, 10, 168. [Google Scholar] [CrossRef]
- Schneider, U.; Becker, A.; Finger, P.; Meyer-Christoffer, A.; Ziese, M.; Rudolf, B. GPCC’s new land surface precipitation climatology based on quality controlled in situ data and its role in quantifying the global water cycle. Theor. Appl. Climatol. 2014, 115, 15–40. [Google Scholar] [CrossRef]
- Dee, D.P.; Uppala, S.M.; Simmons, A.J.; Berrisford, P.; Poli, P.; Kobayashi, S.; Andrae, U.; Balmaseda, M.A.; Balsamo, G.; Bauer, P.; et al. The ERA-Interim reanalysis: Configuration and performance of the data assimilation system. Q. J. R. Meteorol. Soc. 2011, 137, 553–597. [Google Scholar] [CrossRef]
- Huffman, G.J.; Adler, R.F.; Bolvin, D.T.; Nelkin, E.J. The TRMM multi-satellite precipitation analysis (TMPA). In Satellite Rainfall Applications for Surface Hydrology; Springer: Dordrecht, The Netherlands, 2010; pp. 3–22. [Google Scholar]
- Vittucci, C.; Ferrazzoli, P.; Kerr, Y.; Richaume, P.; Guerriero, L.; Rahmoune, R.; Laurin, G.V. SMOS retrieval over forests: Exploitation of optical depth and tests of soil moisture estimates. Remote Sens. Environ. 2016, 180, 115–127. [Google Scholar] [CrossRef]
- Kerr, Y.H.; Waldteufel, P.; Wigneron, J.-P.; Martinuzzi, J.; Font, J.; Berger, M. Soil moisture retrieval from space: The Soil Moisture and Ocean Salinity (SMOS) mission. IEEE Trans. Geosci. Remote Sens. 2001, 39, 1729–1735. [Google Scholar] [CrossRef]
- Rodríguez-Fernández, N.; Muñoz Sabater, J.; Richaume, P.; de Rosnay, P.; Kerr, Y.; Albergel, C.; Drusch, M.; Mecklenburg, S. SMOS near real time soil moisture product: Processor overview and first validation results. Hydrol. Earth Syst. Sci. Discuss. 2017, 21, 1–23. [Google Scholar] [CrossRef]
- Obregon, G.O.; Nobre, C.A. Rainfall trends in Brazil. Bull. Am. Meteorol. Soc. 2003, 84, 1008. [Google Scholar]
- Bhatti, H.; Rientjes, T.; Haile, A.; Habib, E.; Verhoef, W. Evaluation of bias correction method for satellite-based rainfall data. Sensors 2016, 16, 884. [Google Scholar] [CrossRef] [PubMed]
Figure 1.
Geographical location of the study area: (a) Brazil’s main biomes: AMZ, Amazônia; CER, Cerrado; MAT, Mata Atlântica; CAAT, Caatinga; PTN, Pantanal; and Pampa, PMP. (b) Land cover for 2015 derived from the Land Cover-Climate Change Initiative (LC-CCI) product (source: http://maps.elie.ucl.ac.be/CCI) [57]. (c) Brazil’s terrain elevation. Elevation based on 250-m Digital Elevation Model—Shuttle Radar Topographic Mission (DEM-SRTM) images (source: https://earthexplorer.usgs.gov) [58]. (d) Mean annual rainfall derived from ground-based gridded rainfall dataset developed by Xavier et al. [59] (period: 1980–2015).

Figure 2.
Boxplots for the mean monthly rainfall estimated from ground-based gridded rainfall dataset developed by Xavier et al. [59] over the biomes: (a) AMZ; (b) MAT; (c) CER; (d) CAAT; (e) PTN; and (f) PMP during the period 1980–2015. The center line of each boxplot depicts the median value (50th percentile), and the box encompasses the 25th and 75th percentiles of the sample data. The whiskers extend from q1 − 1.5 × (q3 − q1) to q3 + 1.5 × (q3 − q1), where q1 and q3 are the 25th and 75th percentiles of the sample data, respectively.

Figure 3.
Flowchart of the summarized research design and method.

Figure 4.
Spatial distribution of the seasonal and annual climatic mean rainfall in mm/day from: (a1–a5) the GBGR dataset; (b1–b5) the SM2RAIN-CCI rainfall product; (c1–c5) the SM2RAIN-ASCAT rainfall product; (d1–d5) the TRMM TMPA rainfall product during 2007–2015. The Brazilian biomes are shown in Figure 1a. Whited cells in the panels from b1–b5 depict gaps due to the application of a static mask used by the SM2RAIN-CCI product [32].

Figure 5.
Pearson linear correlation derived from the SM2RAIN-CCI rainfall product against the GBGR dataset, the SM2RAIN-ASCAT rainfall product against the GBGR dataset, and the TRMM TMPA rainfall product against the GBGR dataset for: (a,b,c) annual; (d,e,f) winter; (g,h,i) spring; (j,k,l) summer; and (m,n,o) autumn during 2007–2015. Whited cells in the panels are as per Figure 4. For each product and season, the median value per biome is reported.

Figure 6.
The percent bias derived from the SM2RAIN-CCI rainfall product against the GBGR dataset, the SM2RAIN-ASCAT rainfall product against the GBGR dataset, and the TRMM TMPA rainfall product against the GBGR dataset for: (a,b,c) annual; (d,e,f) winter; (g,h,i) spring; (j,k,l) summer; and (m,n,o) autumn during 2007–2015. Whited cells in the panels are as per Figure 4. For each product and season, the median value per biome is reported.

Figure 7.
Daily rainfall estimates from TRMM TMPA, SM2RAIN-CCI, and SM2RAIN-ASCAT products against in situ daily rainfall from the GBGR dataset located in the biomes: (a) AMZ; (b) MAT; (c) CER; (d) CAAT; (e) PTN; and (f) PMP during the period during 2007–2015. The orange line indicates 1:1 correspondence and red line gives the linear regression best fit. The BS1, BS4, BS3, BS2, BS6, and BS5 benchmark sites shown in Figure 1a provided the in situ rainfall data for AMZ, CAAT, CER, MAT, PMP, and PTN, respectively.

Figure 8.
Monthly time series for: (a) R (dimensionless); (b) RMSE (mm/day); (c) ubRMSE (mm/day); and (d) B (%) derived from the SM2RAIN-ASCAT rainfall product against the GBGR dataset (red line), the SM2RAIN-CCI rainfall product against the GBGR dataset (blue line), and the TRMM TMPA rainfall product against the GBGR dataset (orange line) for all-Brazil during the period 2007–2015.

Figure 9.
Spatial distributions of systematic [%] and random [%] error components across Brazil from: (a,d) the SM2RAIN-CCI product; (b,e) the SM2RAIN-ASCAT product; and (c,f) the TRMM TMPA product against the GBGR dataset for 2007–2015. Whited cells for all products are as per Figure 4.
Figure 9.
Spatial distributions of systematic [%] and random [%] error components across Brazil from: (a,d) the SM2RAIN-CCI product; (b,e) the SM2RAIN-ASCAT product; and (c,f) the TRMM TMPA product against the GBGR dataset for 2007–2015. Whited cells for all products are as per Figure 4.

Figure 10.
Spatial distributions of the POD [fraction] and FAR [fraction] across Brazil from: (a,d) the SM2RAIN-CCI product; (b,e) the SM2RAIN-ASCAT product; and (c,f) the TRMM TMPA product against the GBGR dataset for 2007-2015. Whited cells for all products are as per Figure 4. POD and FAR are calculated with a threshold of 1 mm/day.

Figure 11.
Roebber’s performance diagram [78] for the SM2RAIN-ASCAT rainfall product (red circles), the SM2RAIN-CCI rainfall product (blue circles), and the TRMM TMPA rainfall product (orange circles) in the biomes: (a) AMZ; (b) CAAT; (c) CER; (d) MAT; (e) PMP; and (f) PTN during 2007–2015. Dashed lines depict BS metric (see Table 4) with labels the upper axis, whereas labeled solid contours show values of CSI (see Table 4). Circles portray the six rainfall thresholds. The smallest circle indicates the rain/no rain threshold (≤1 mm), and the largest circle indicates the threshold ≥ 20 mm.


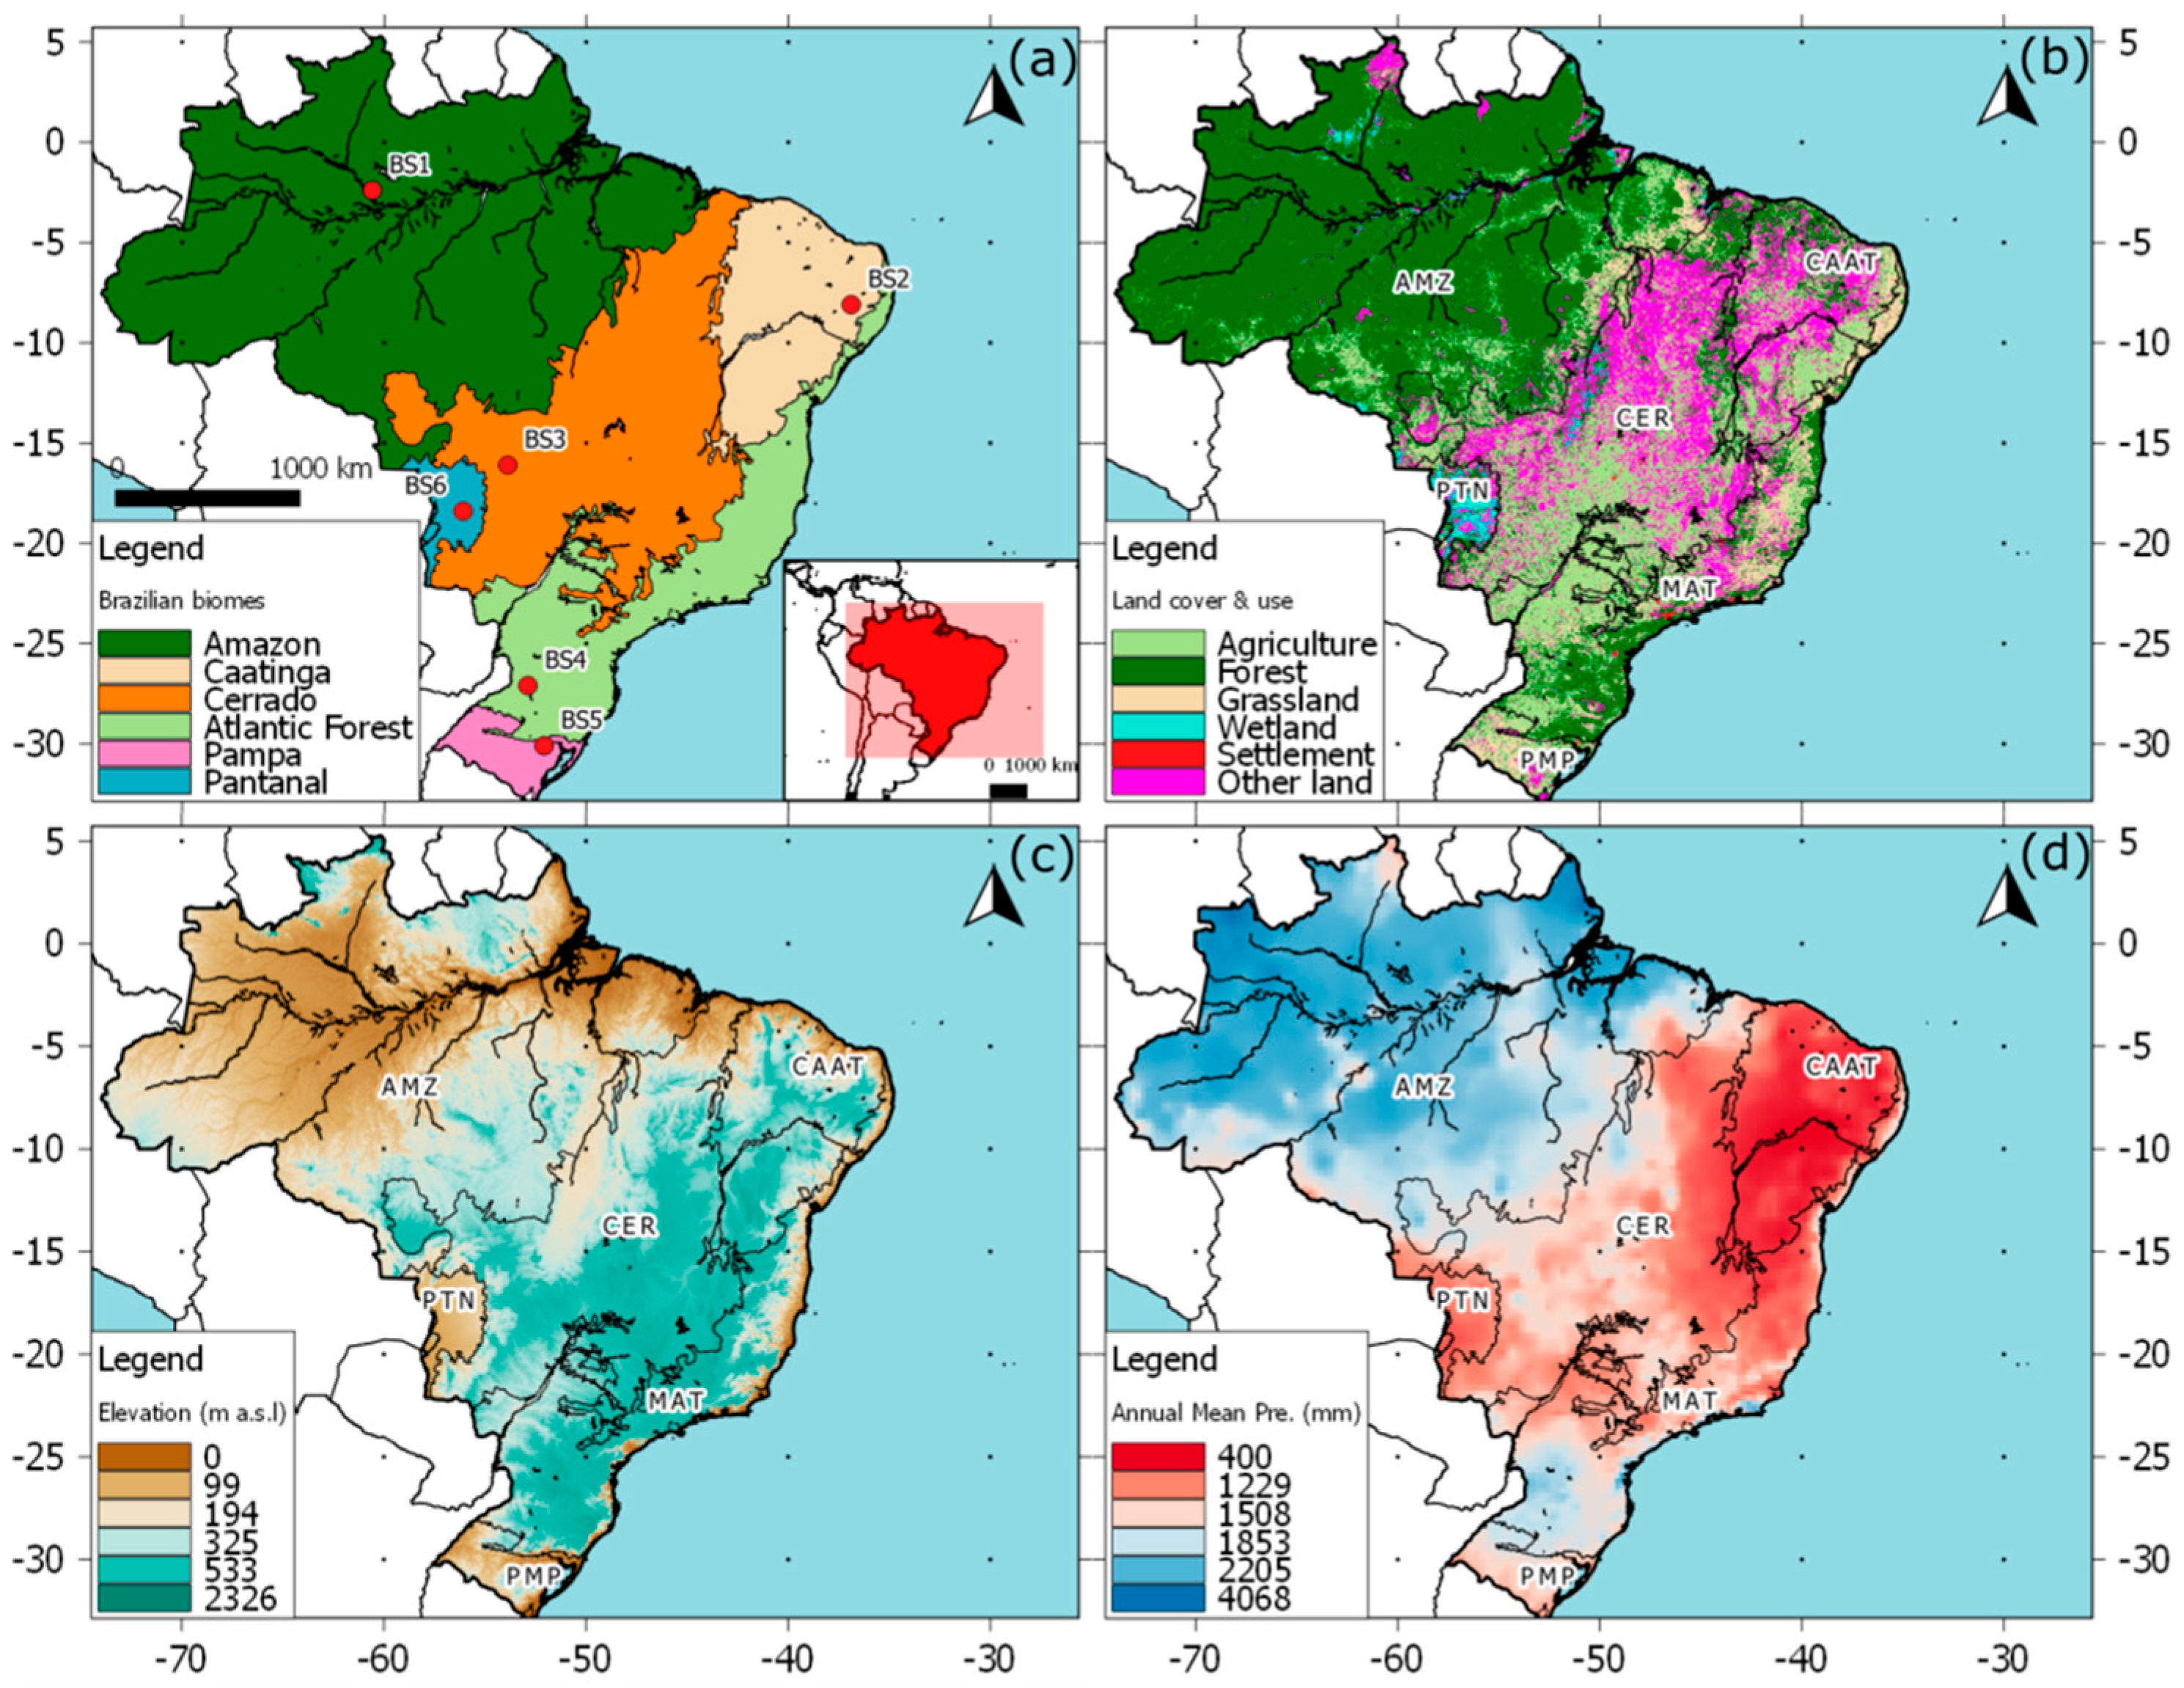
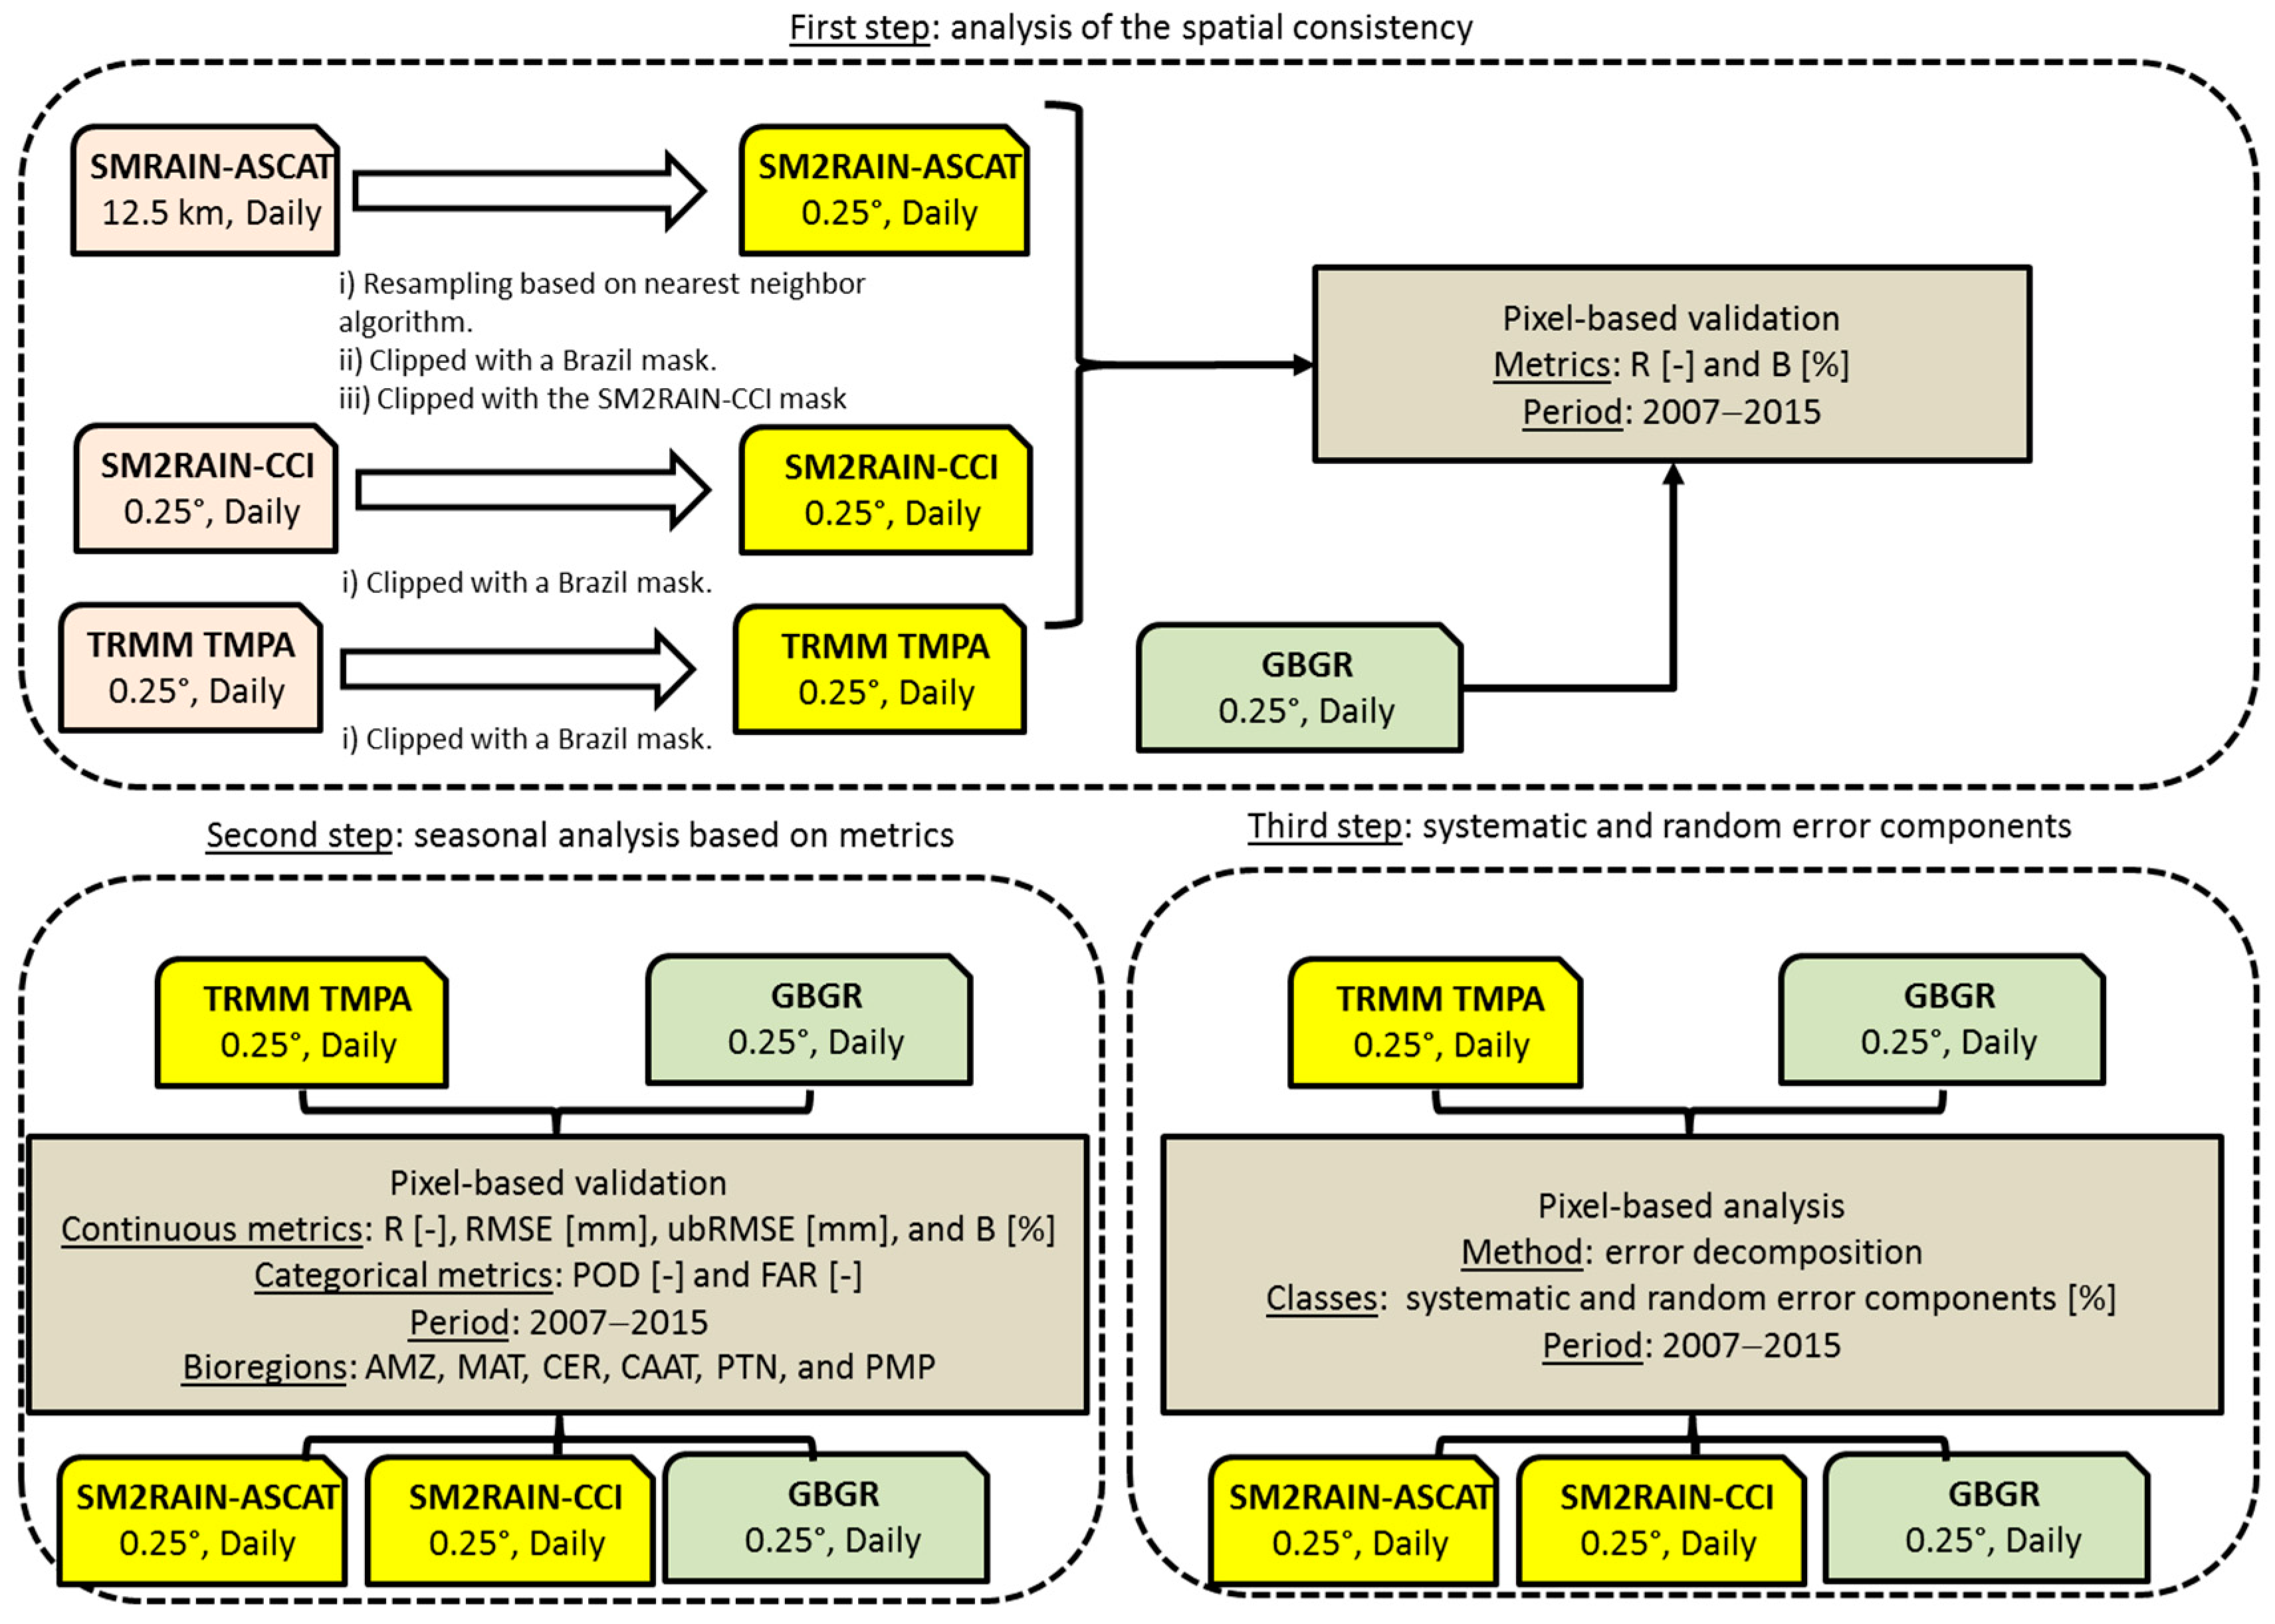
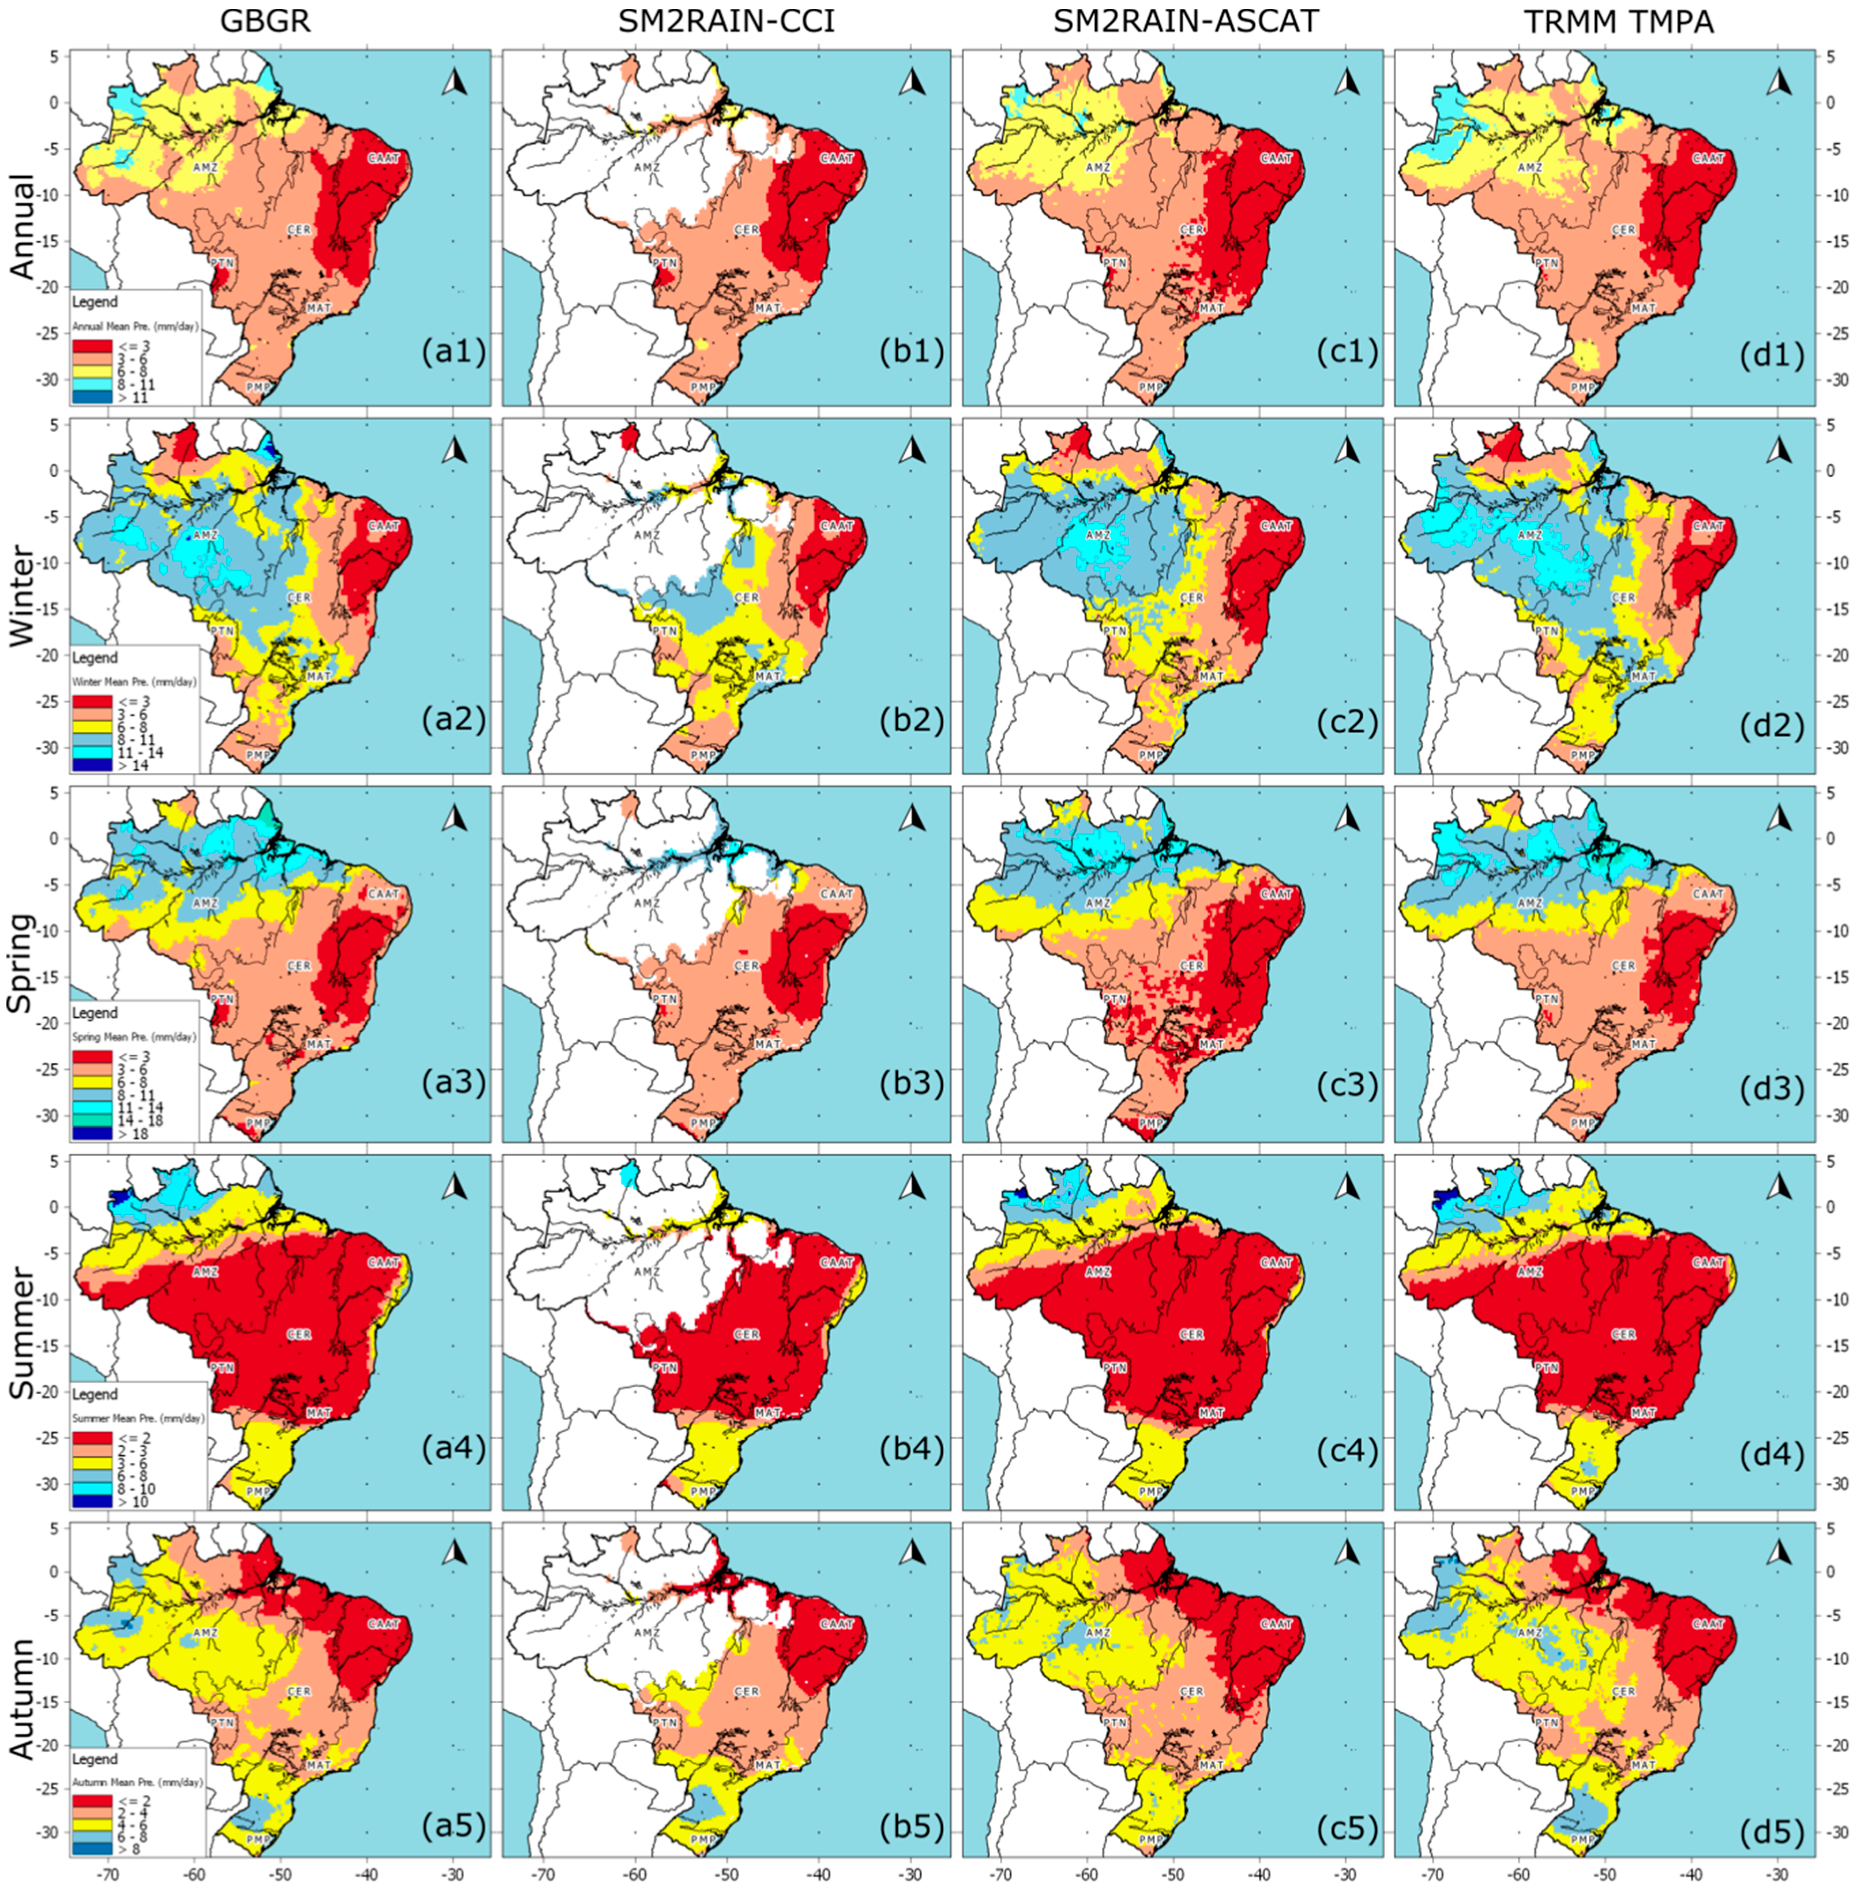
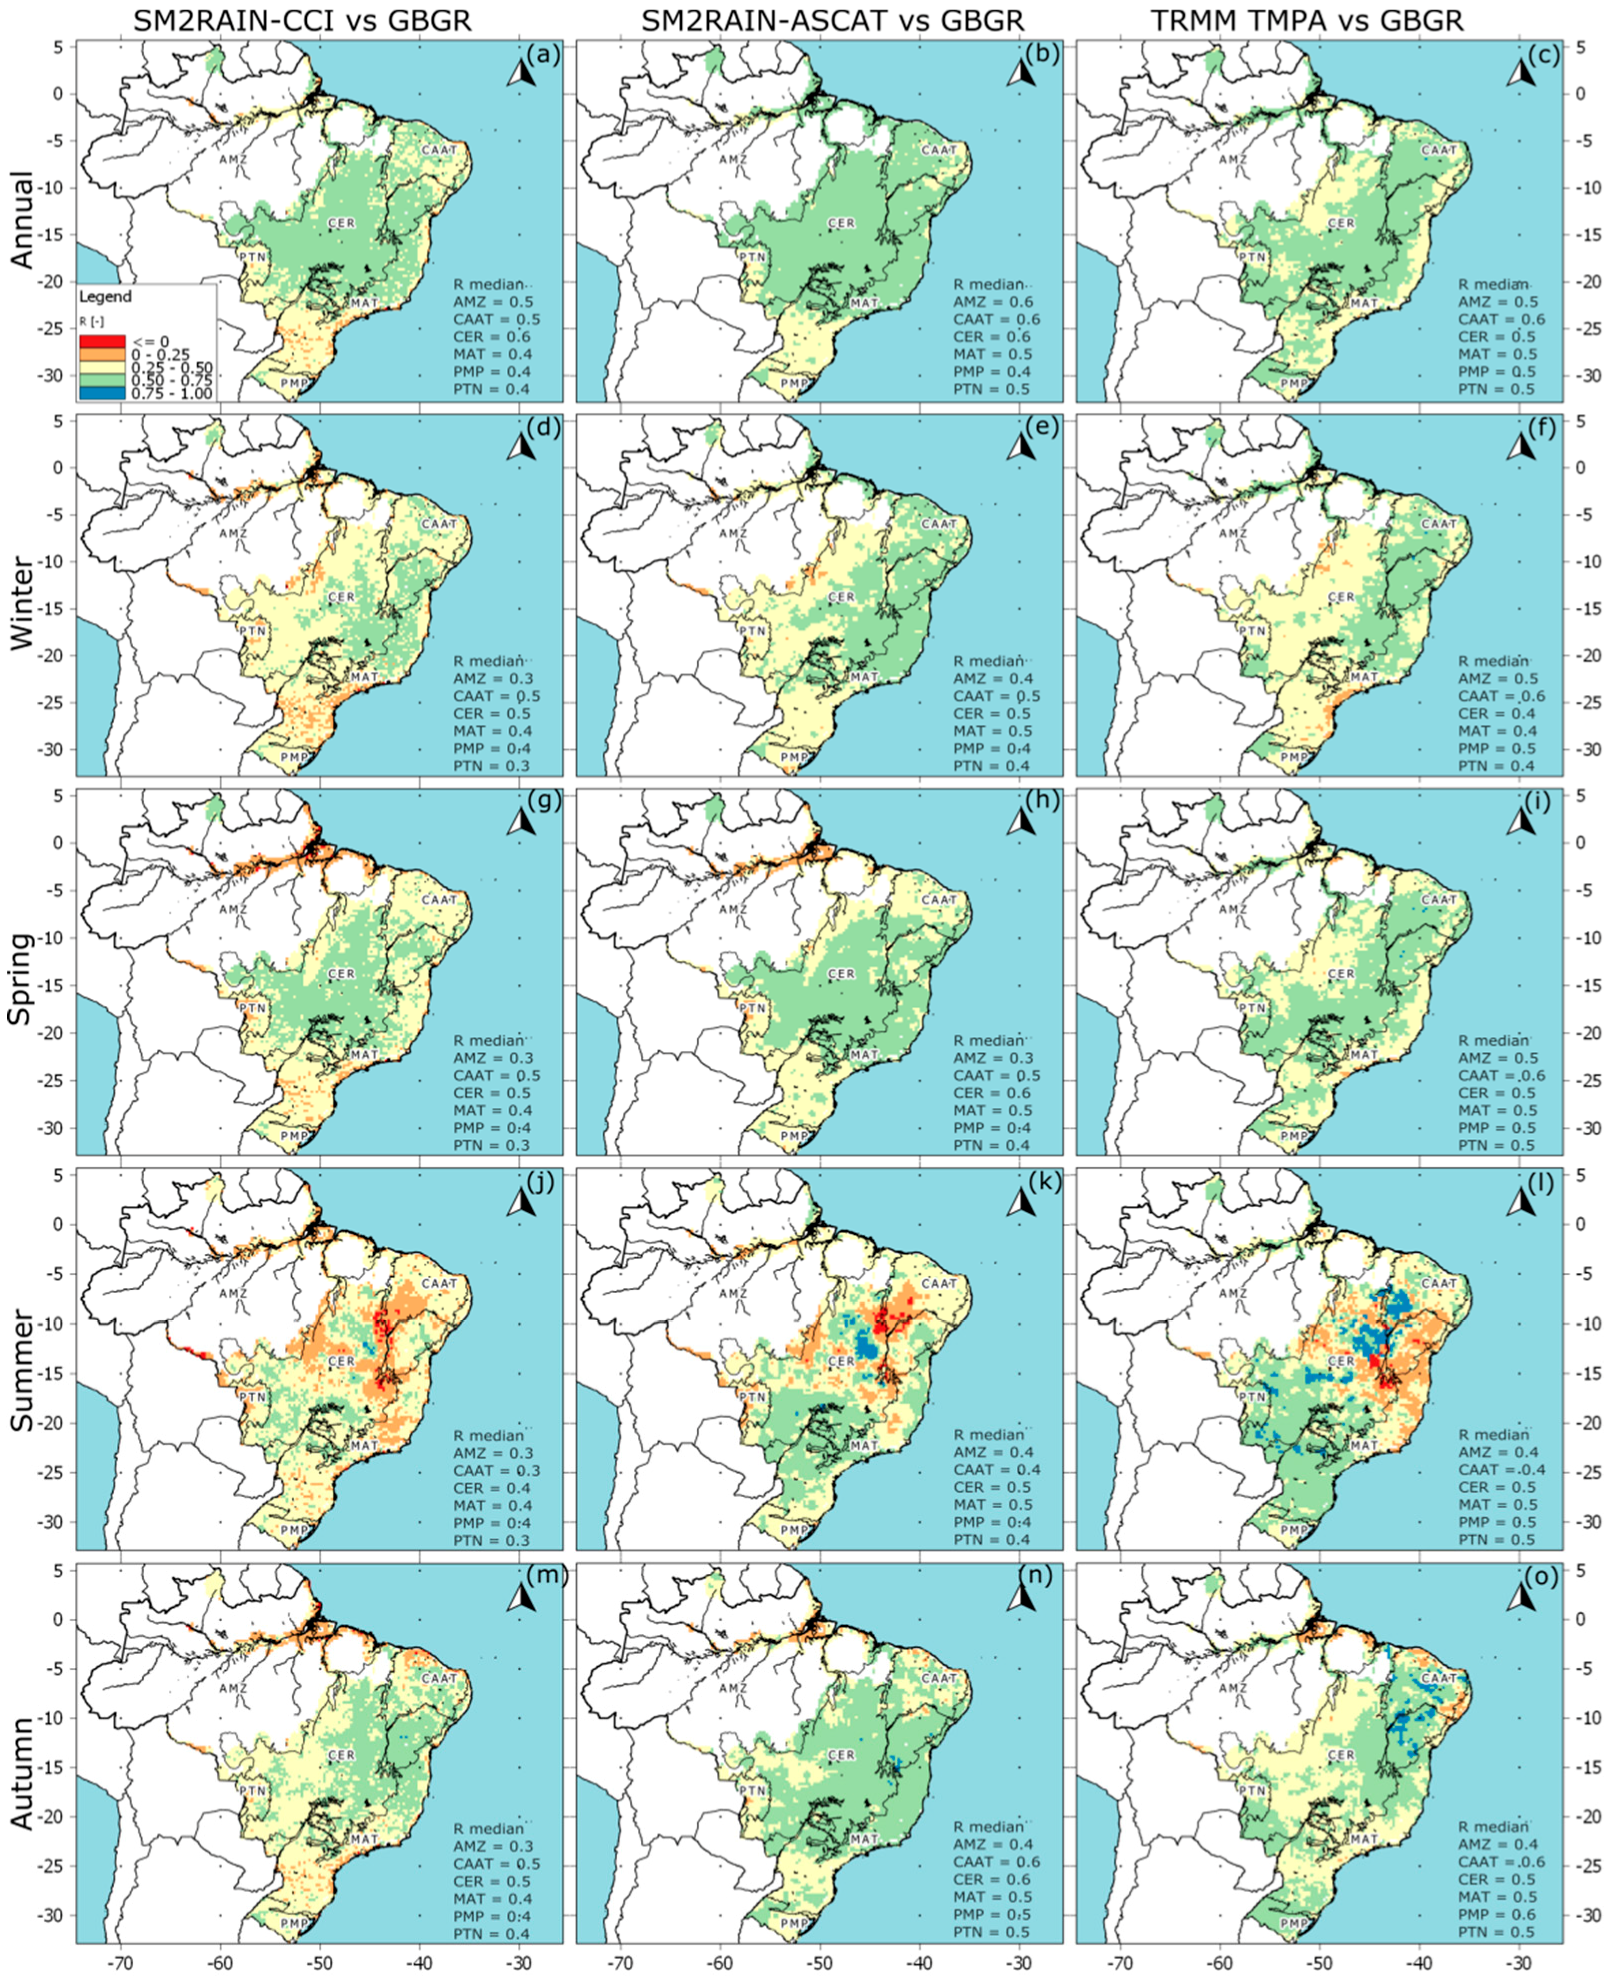
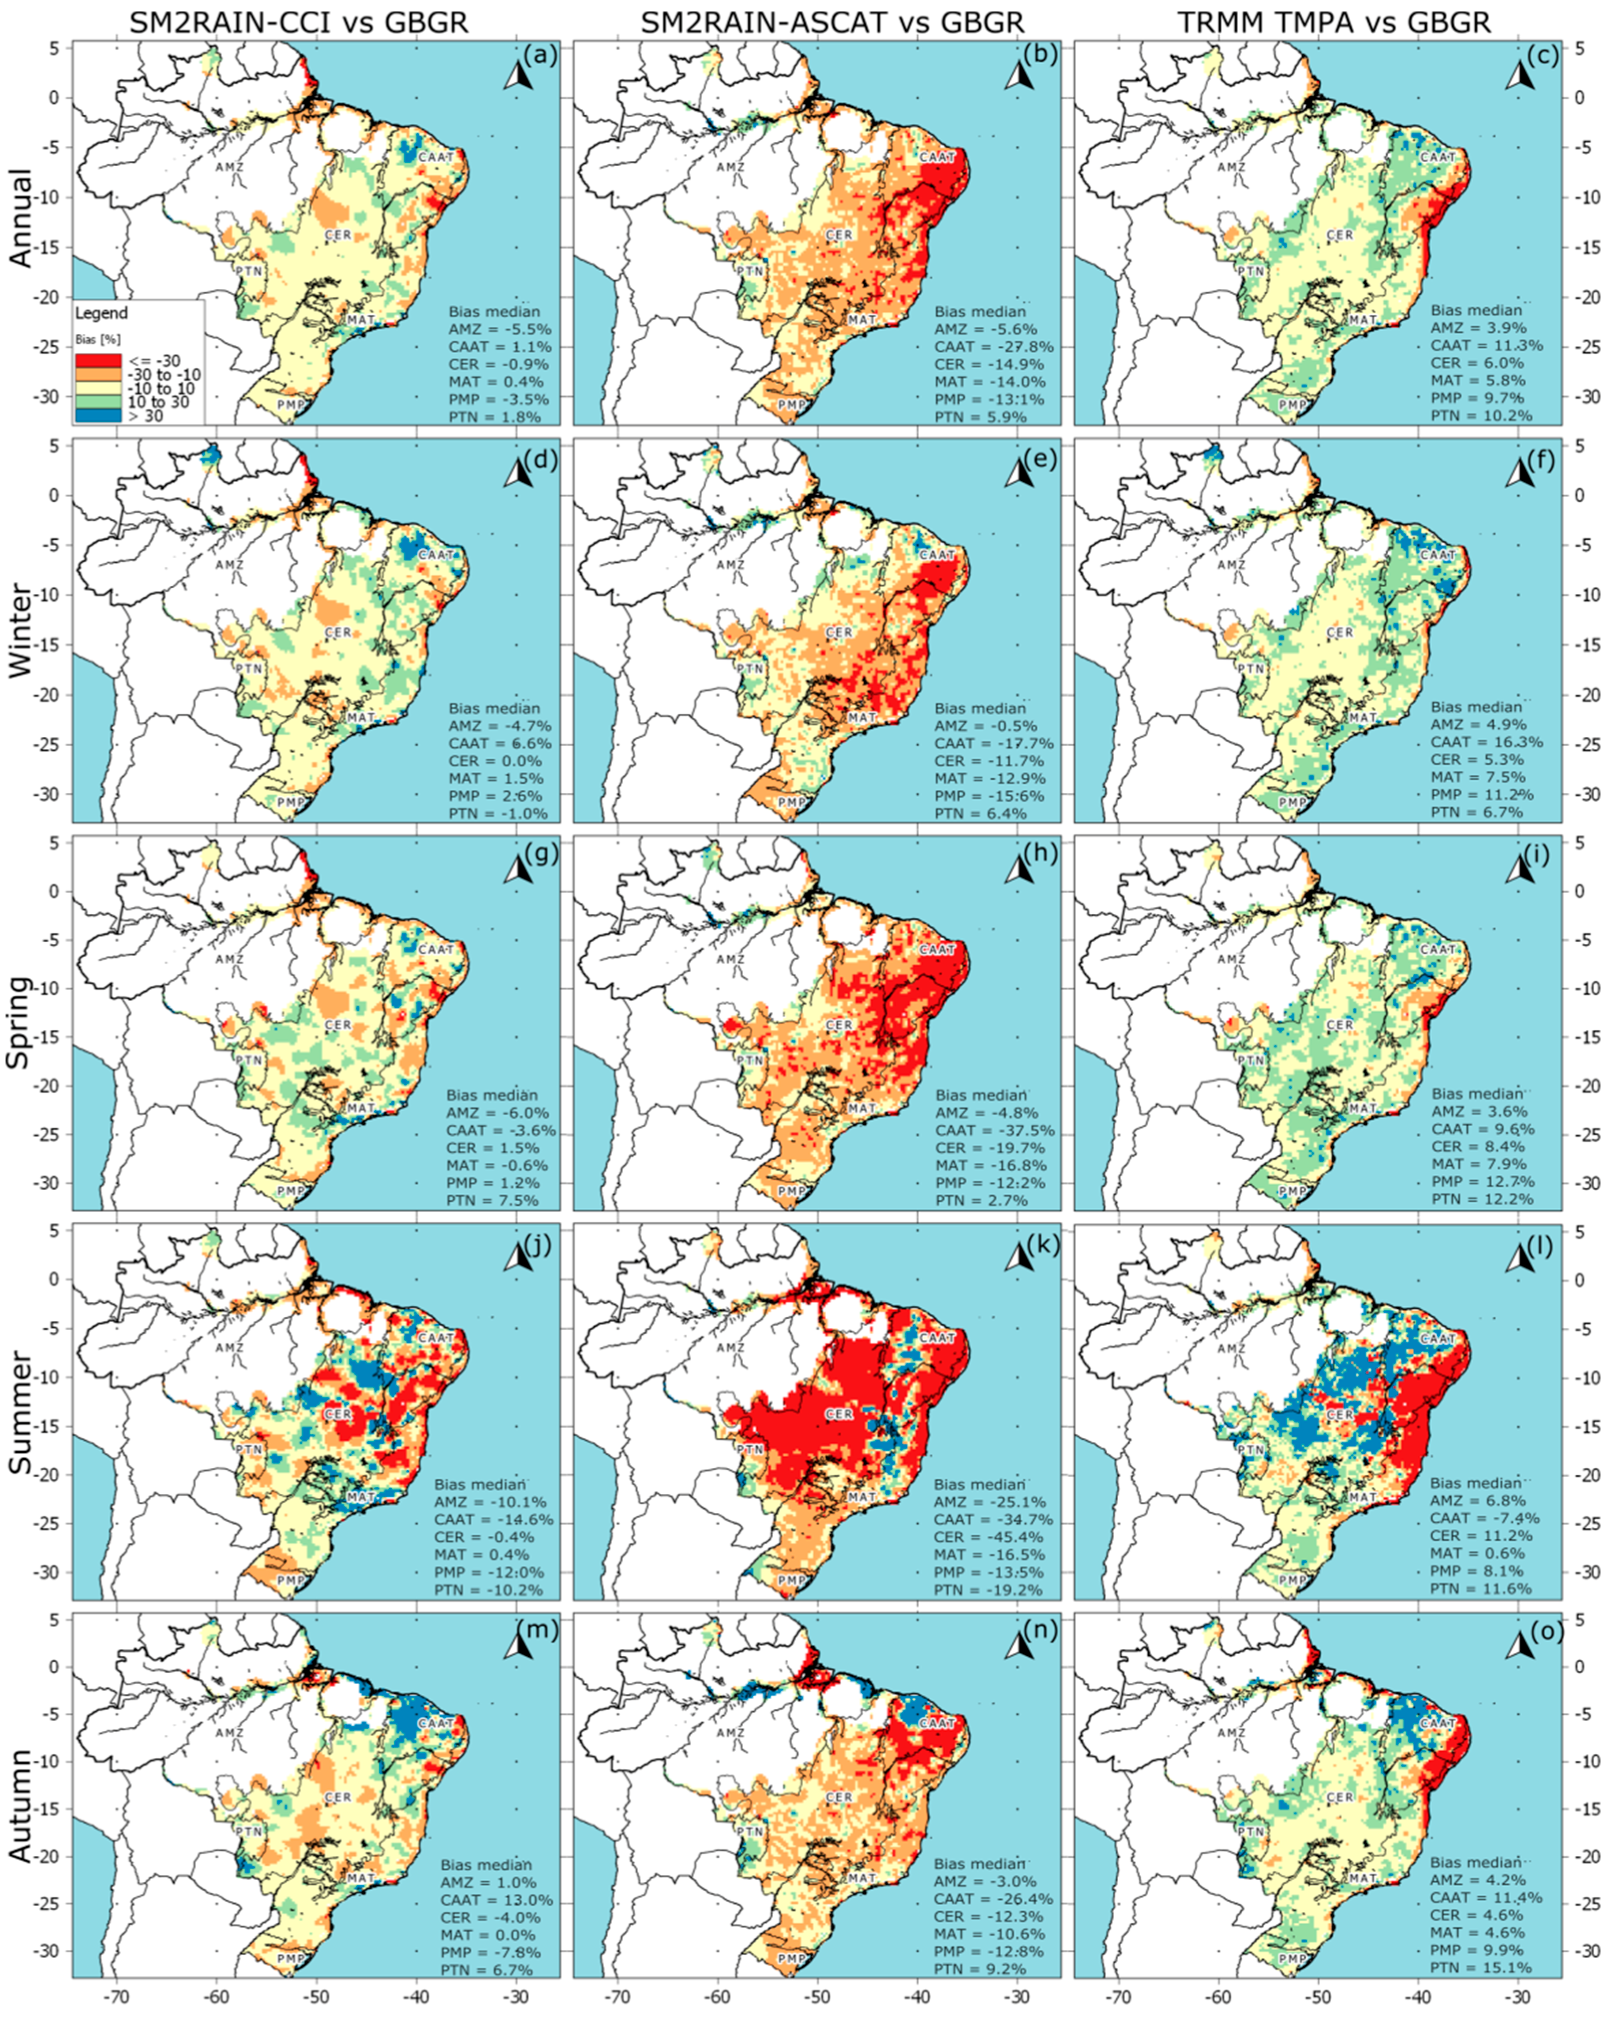
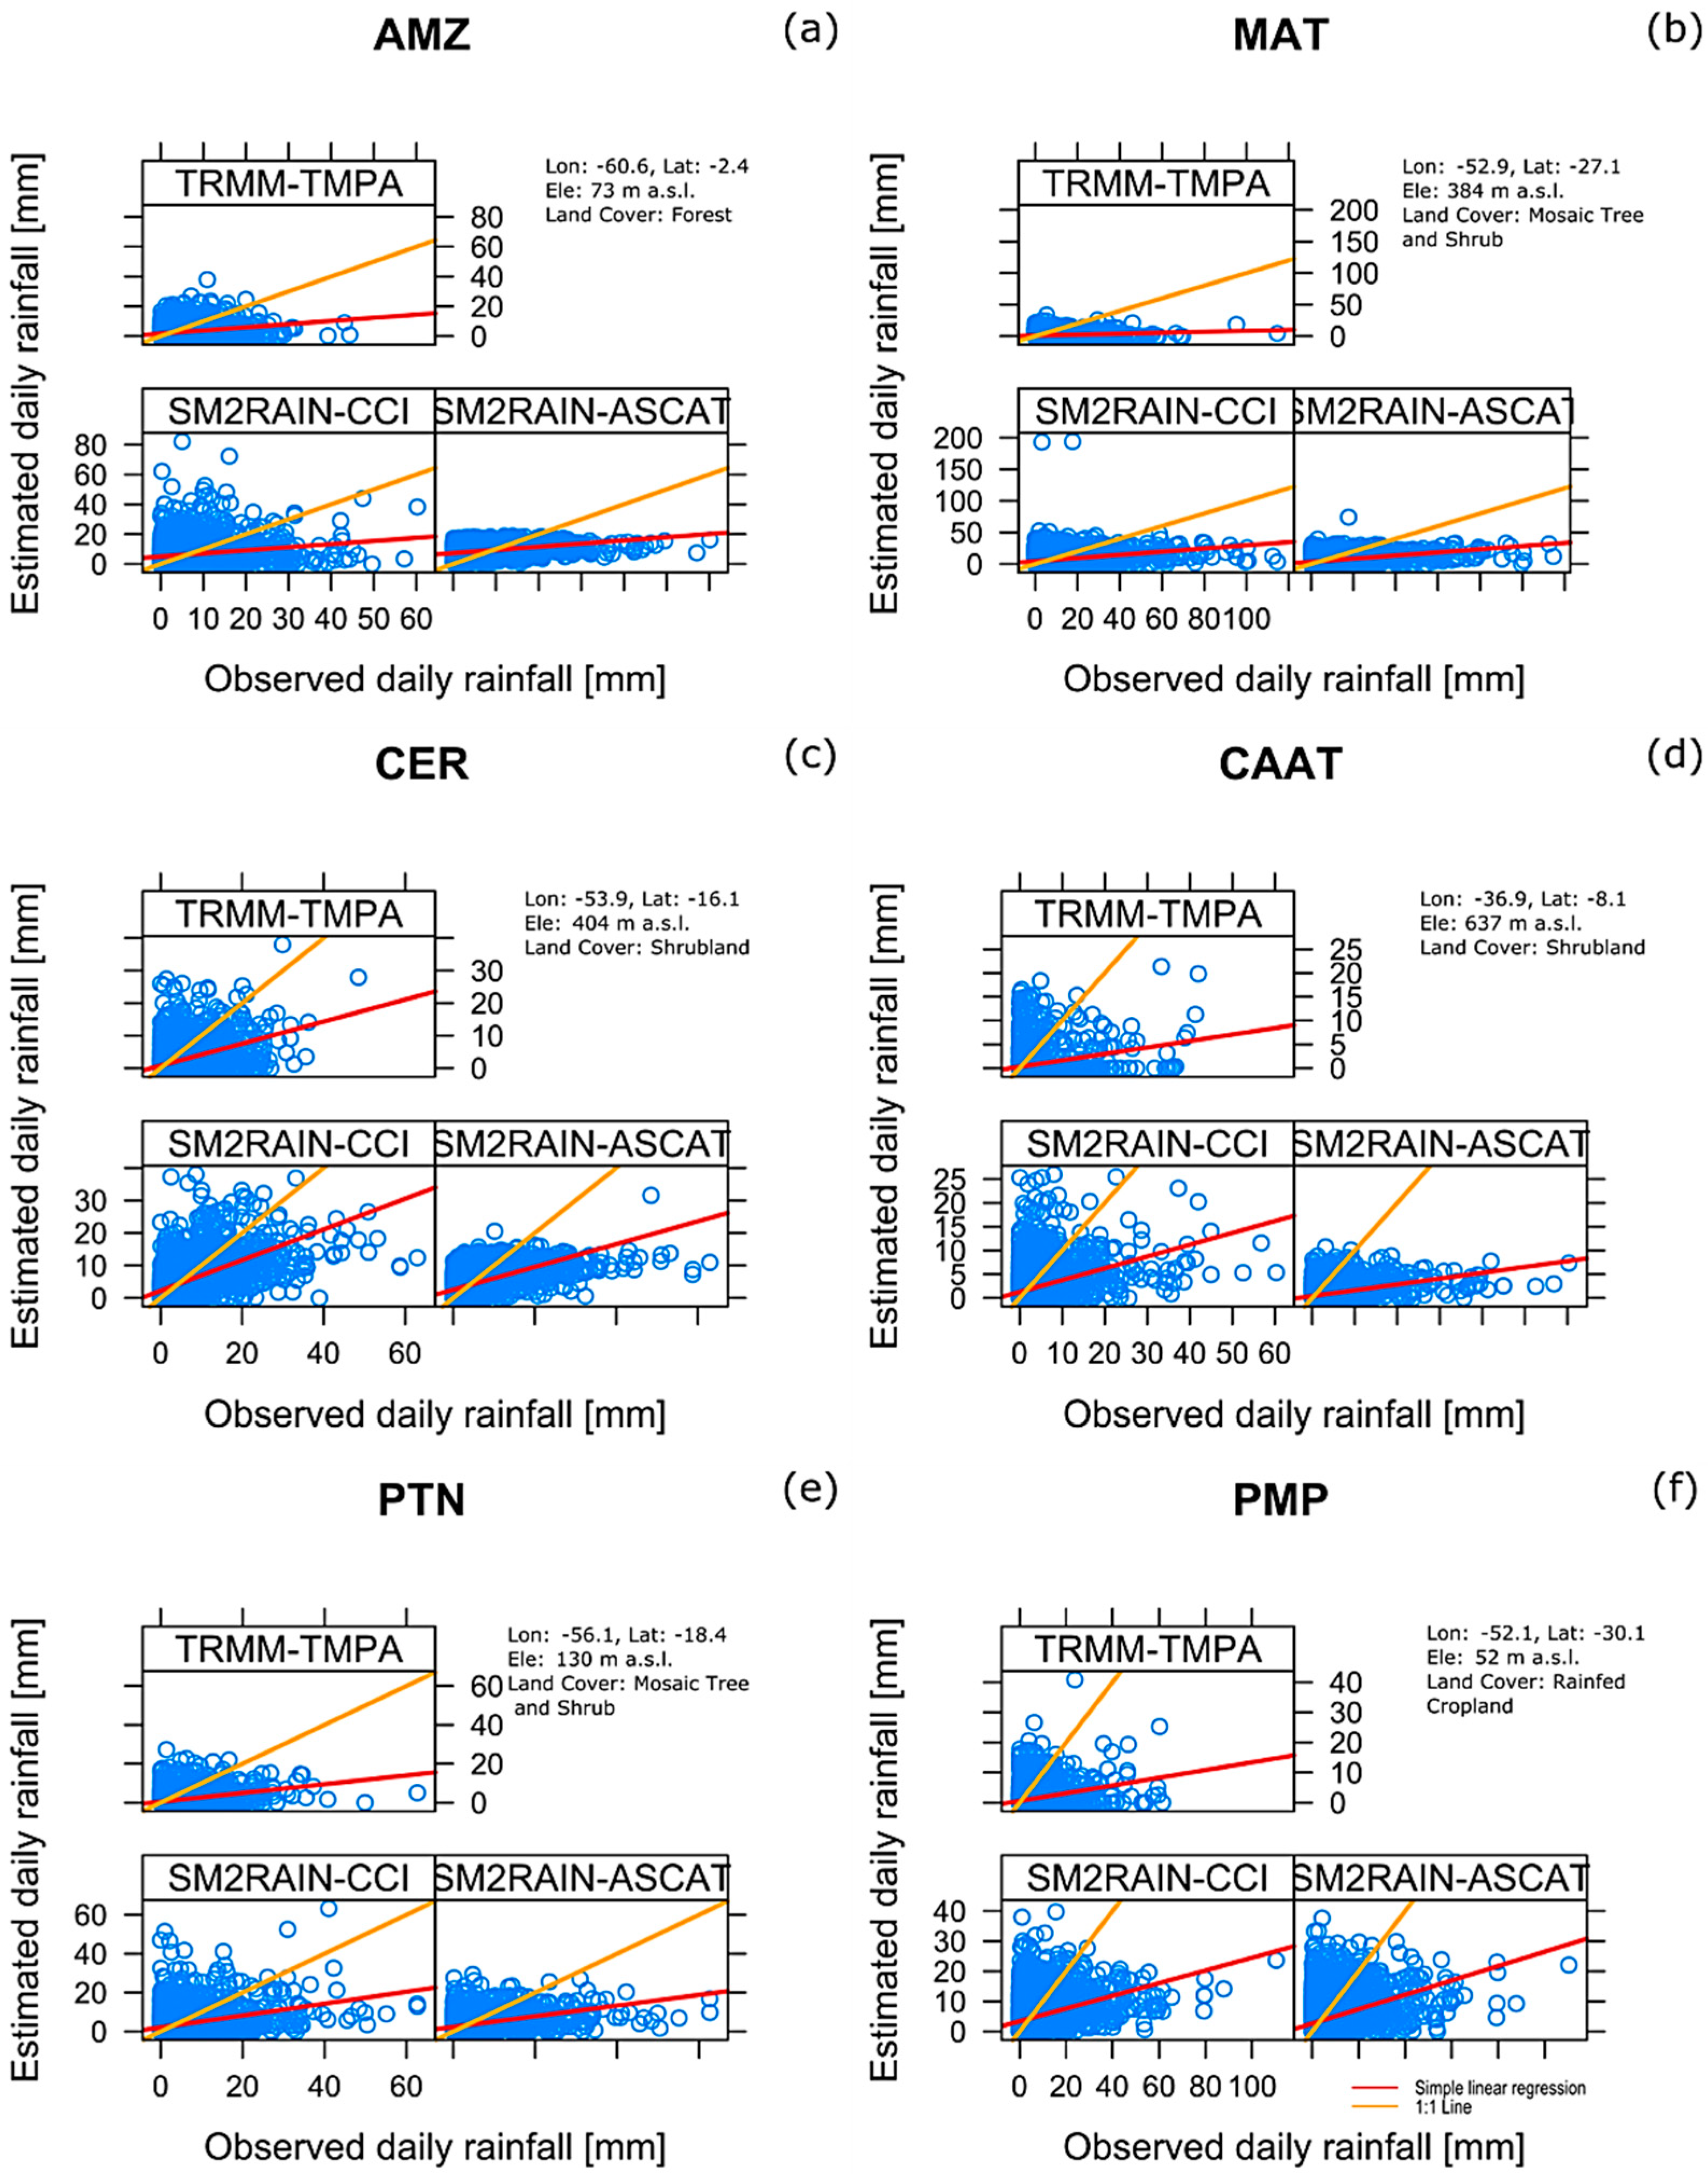
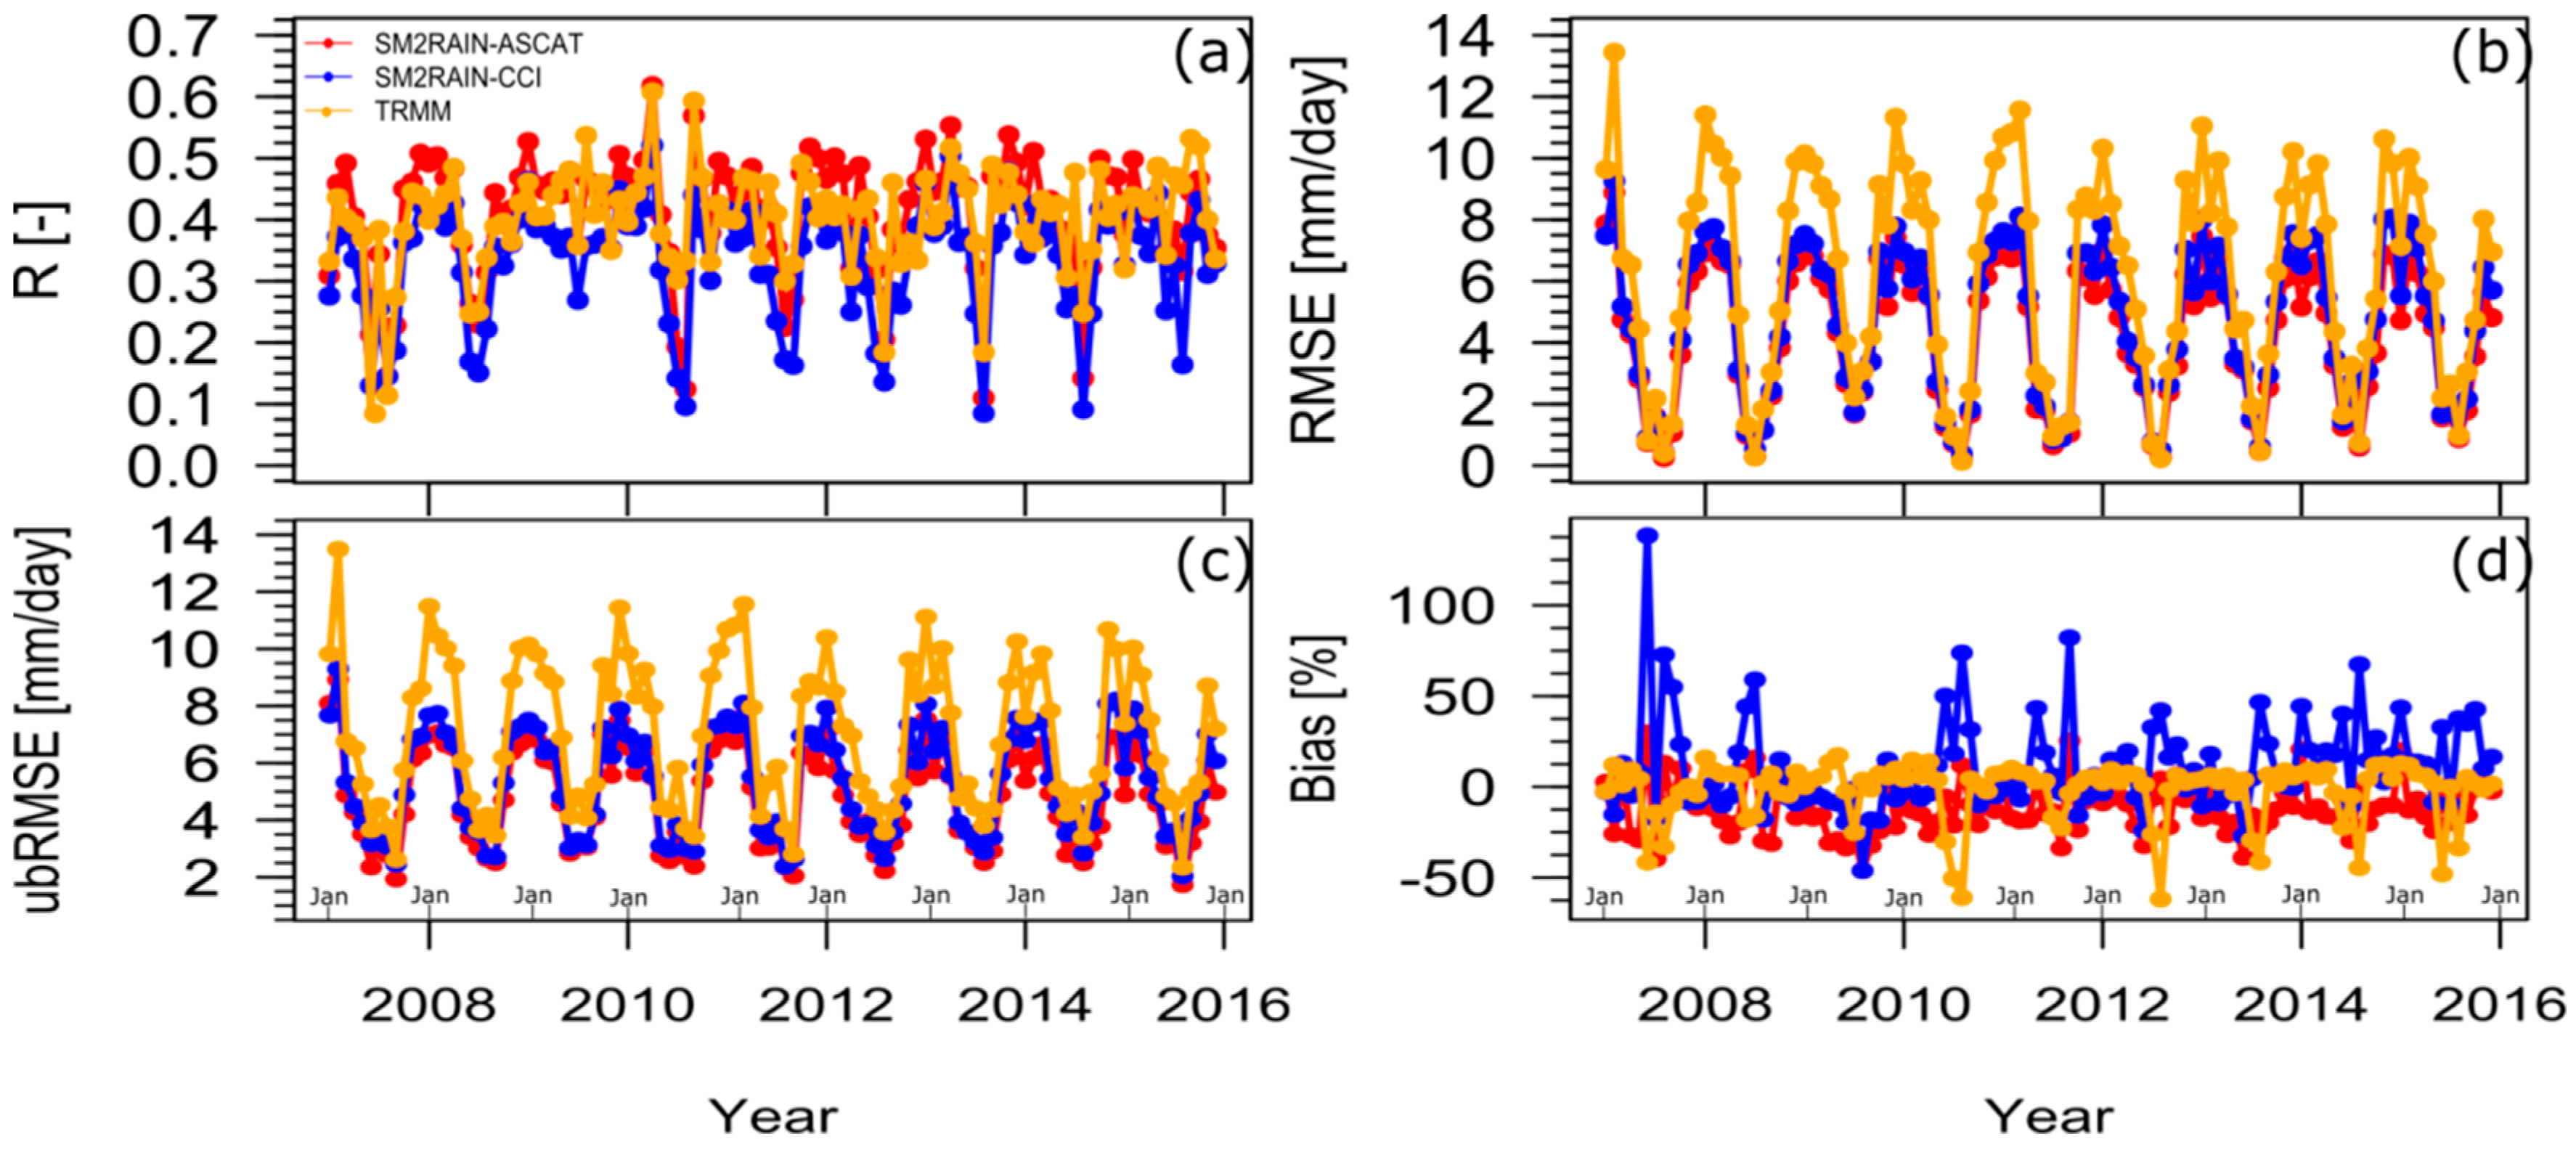
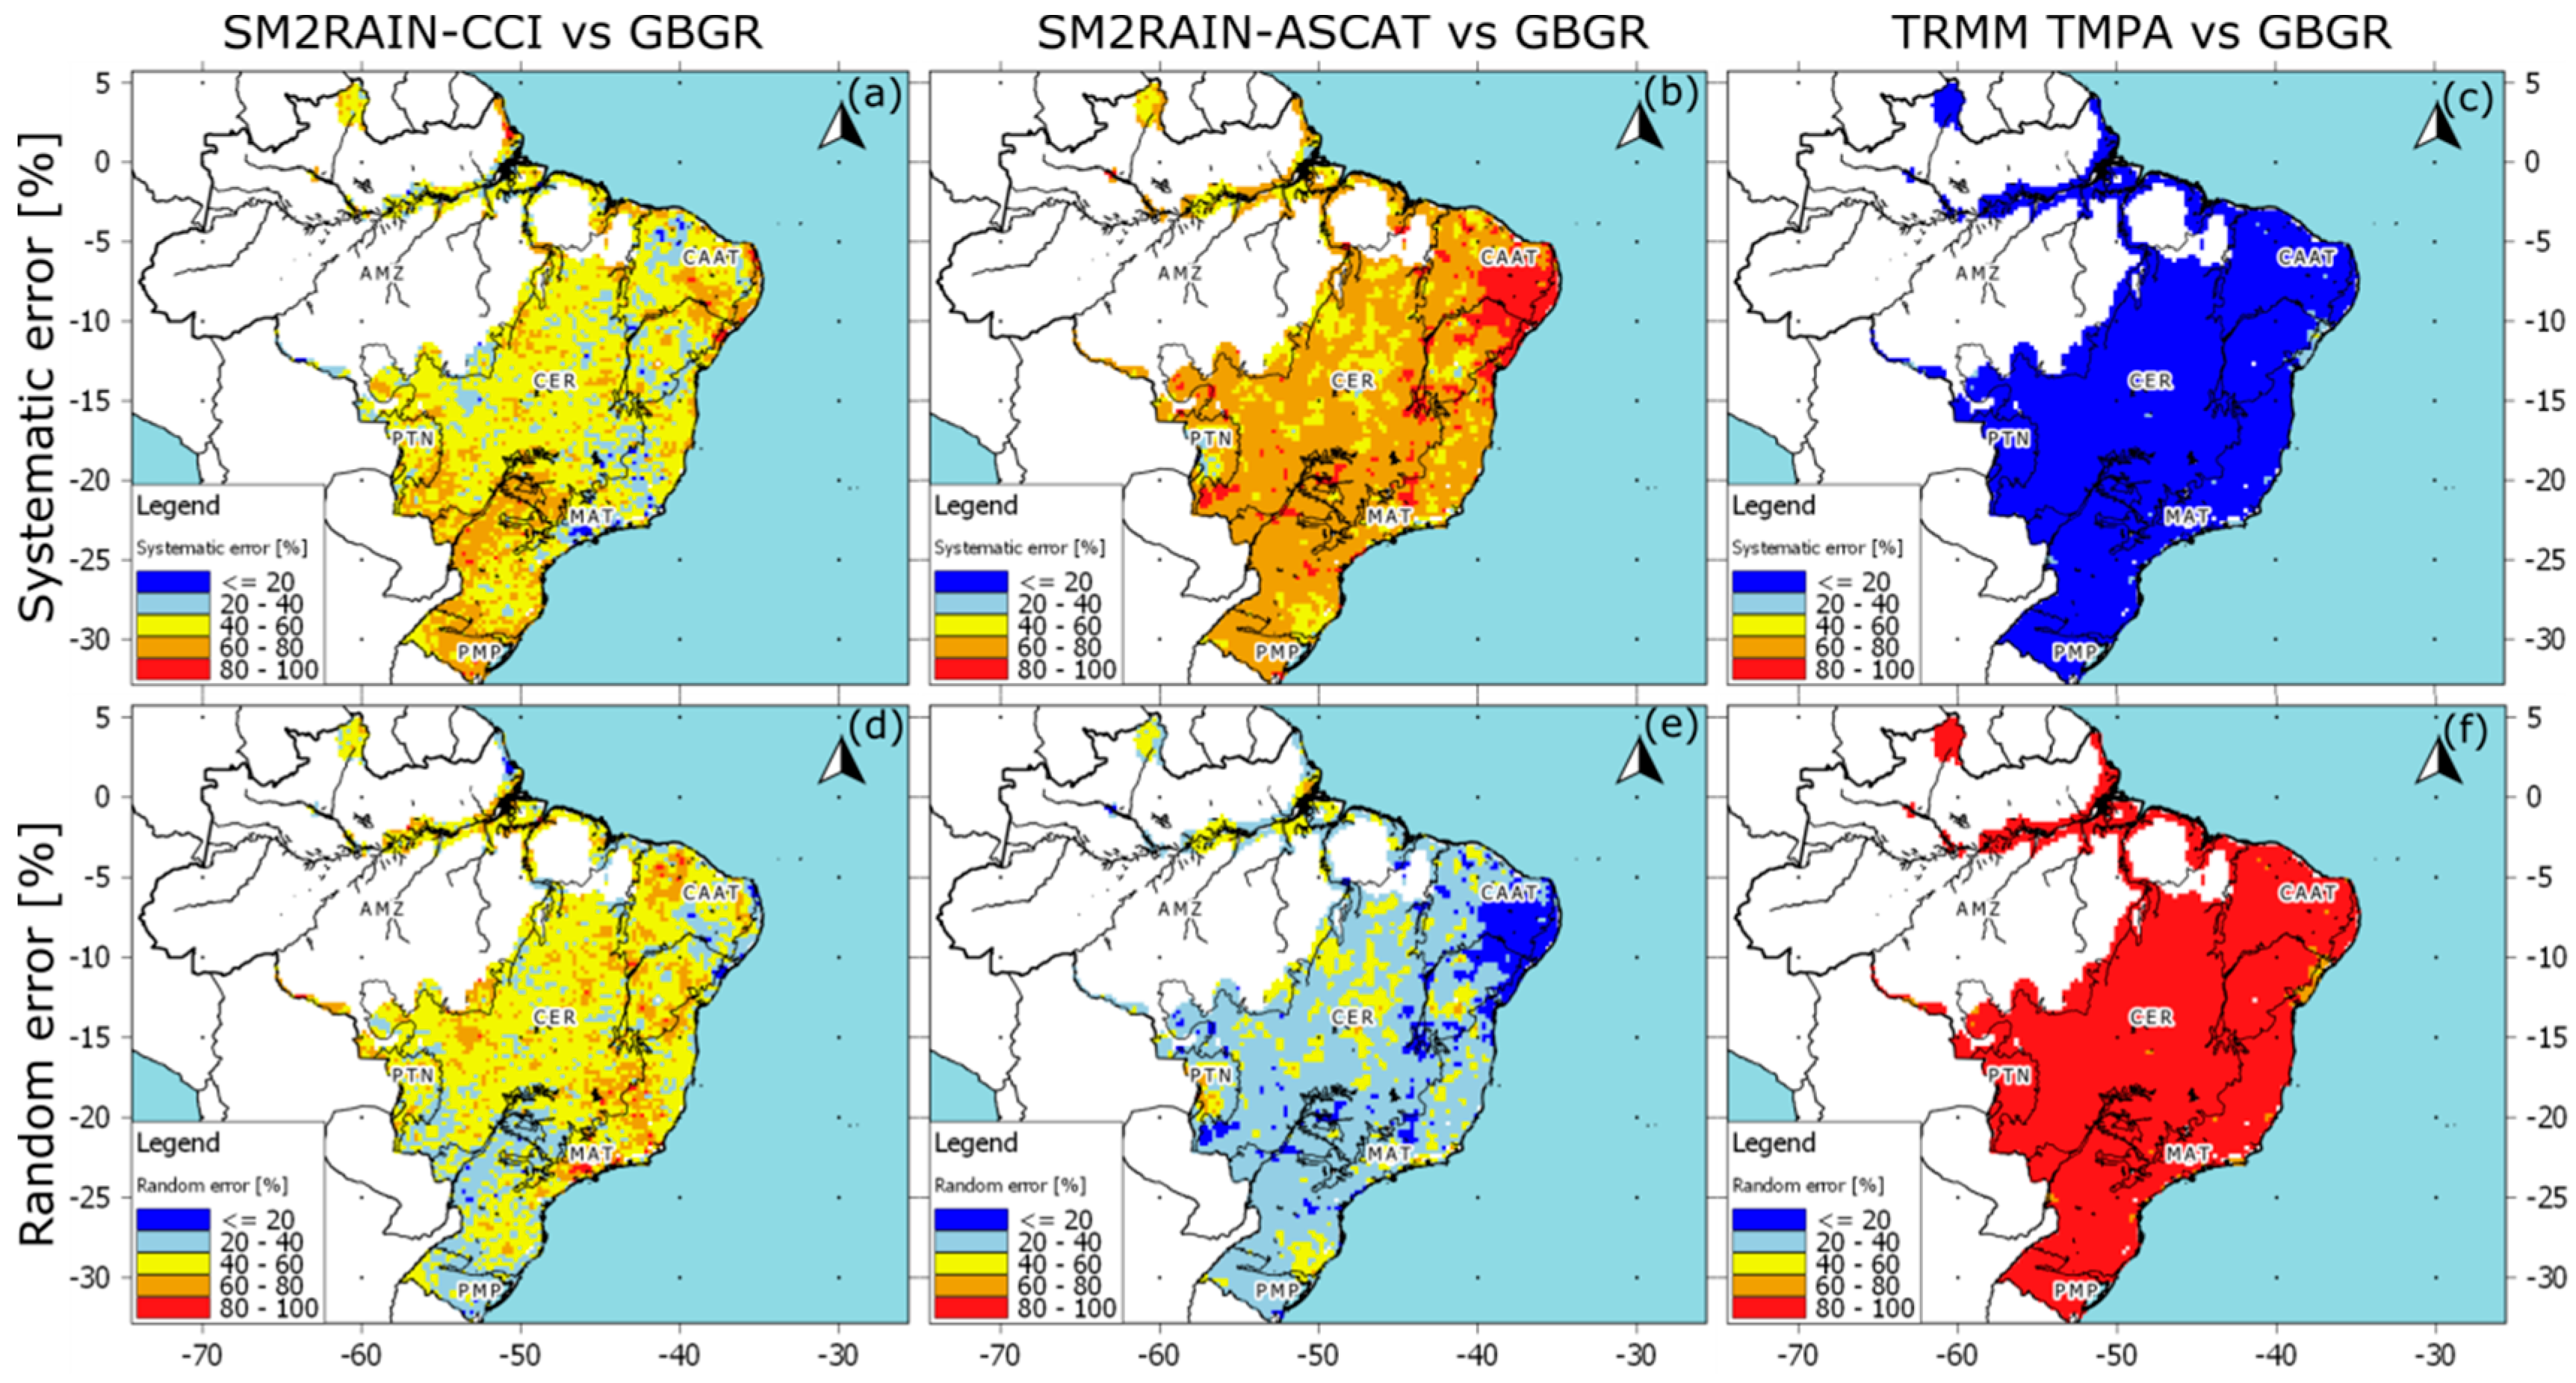
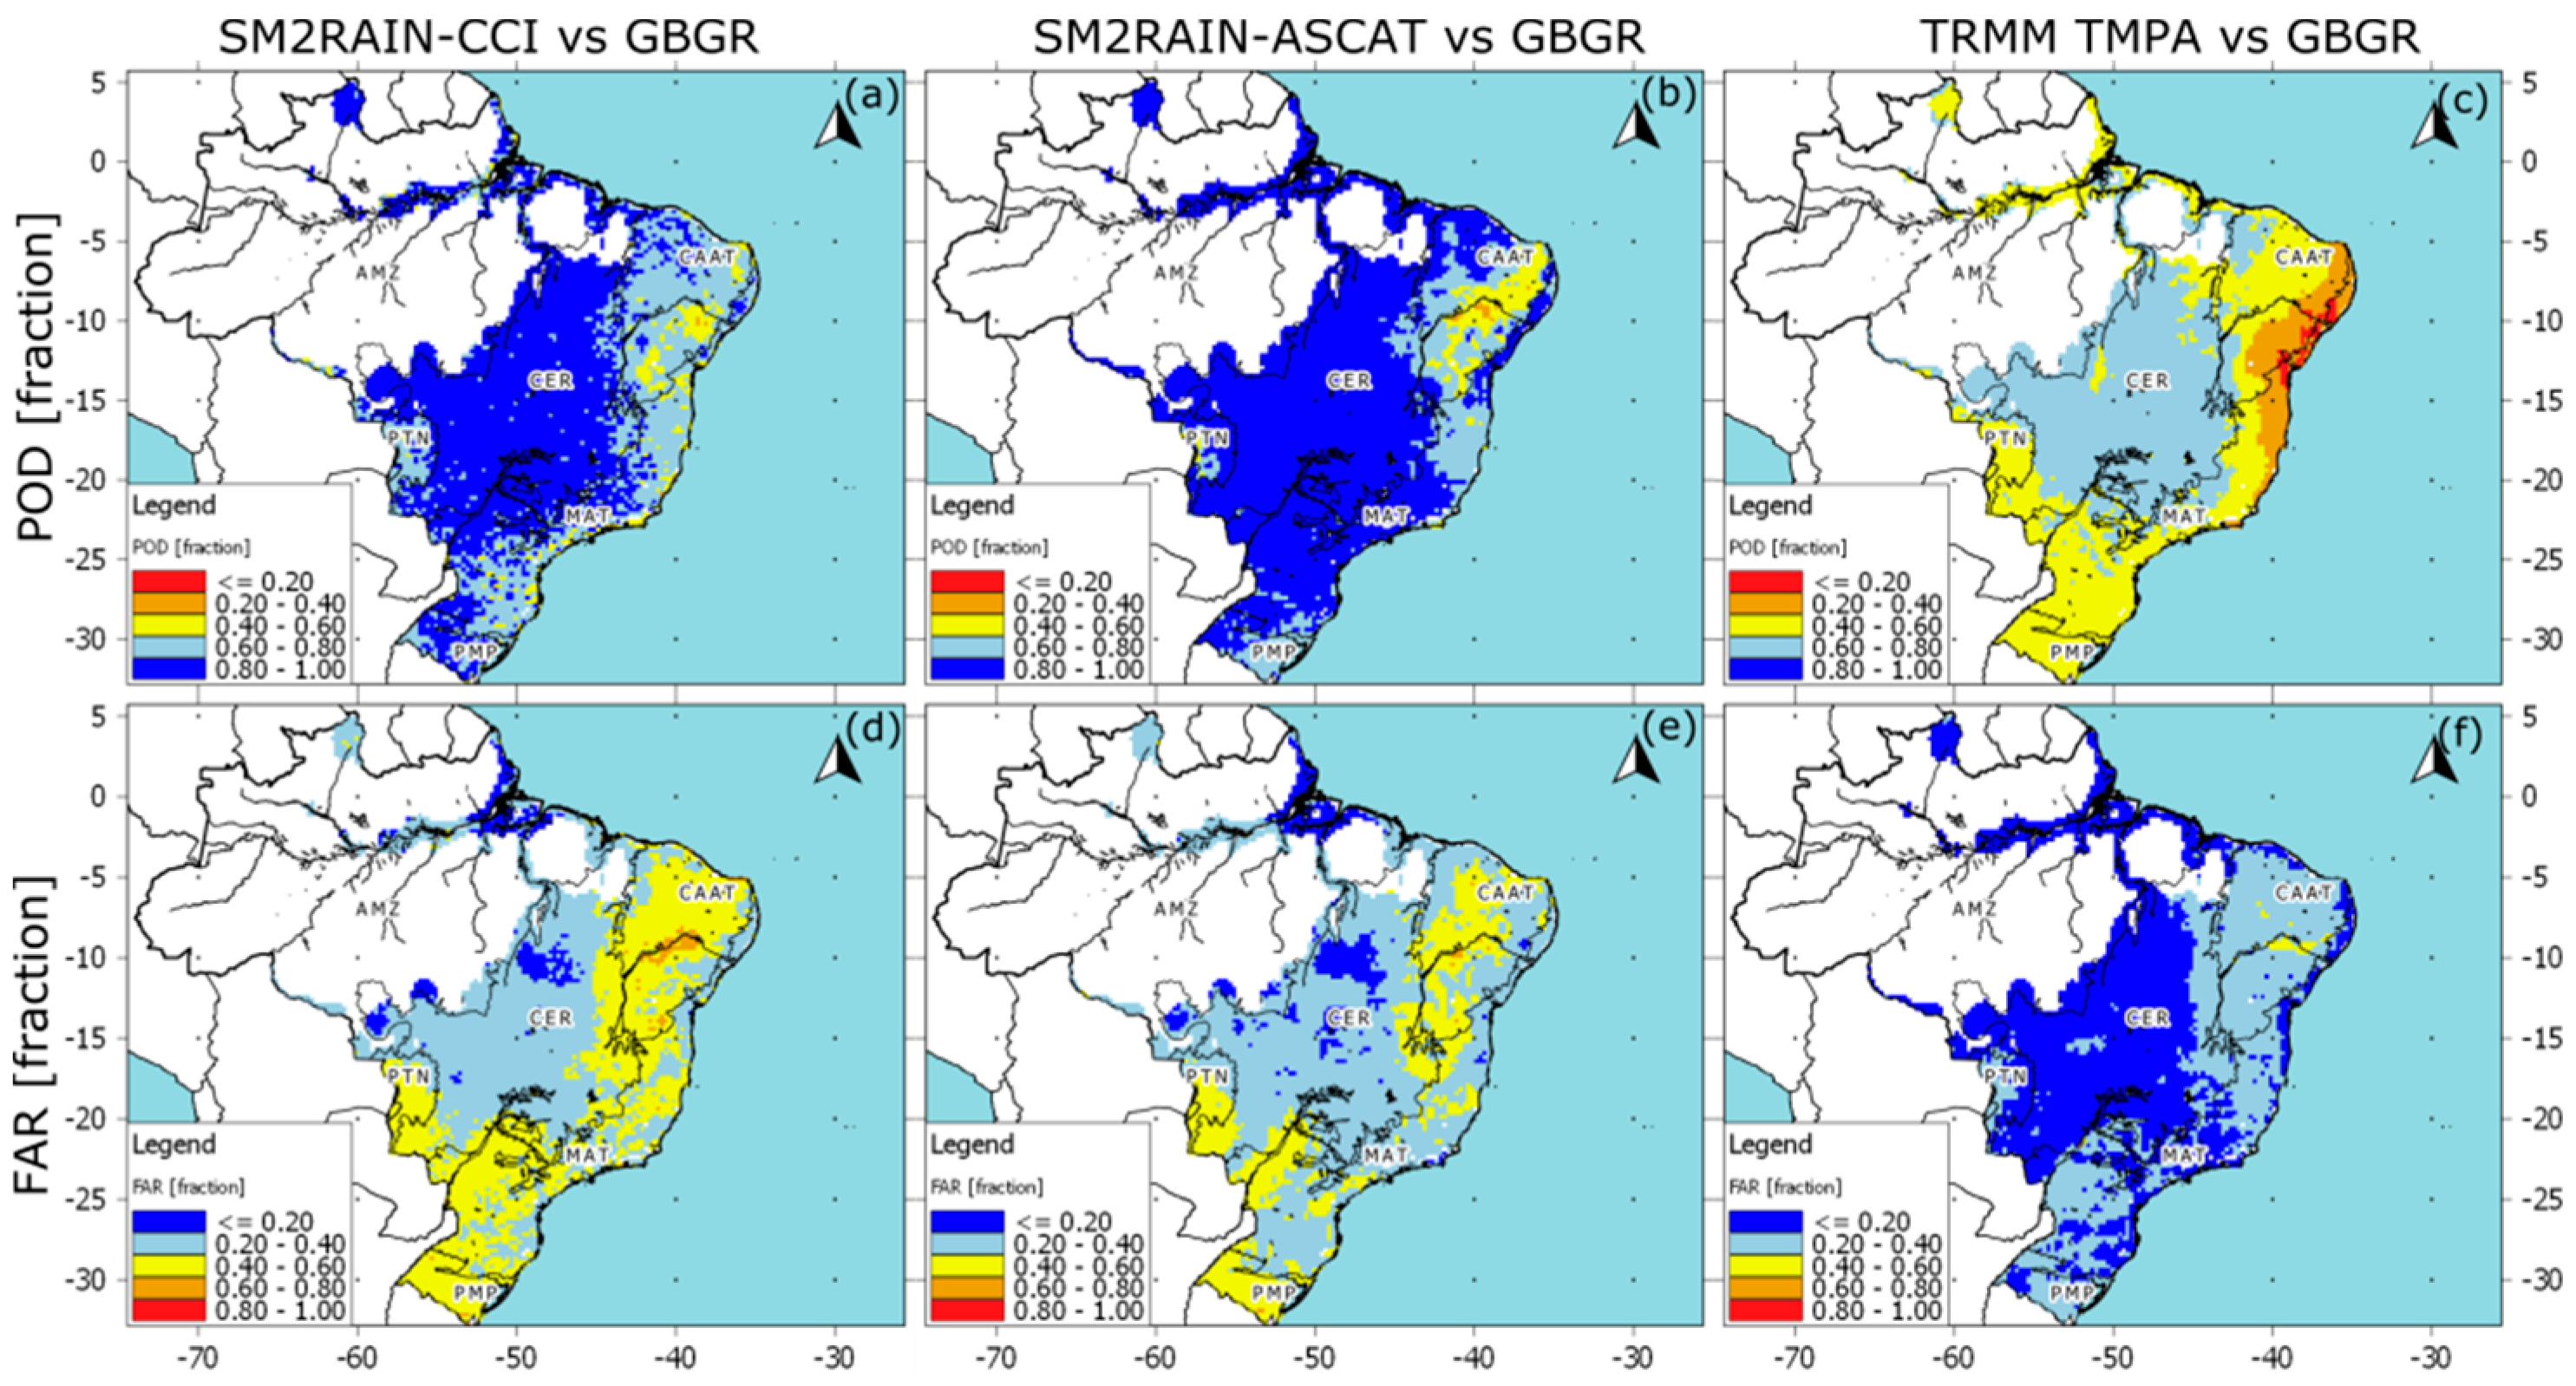
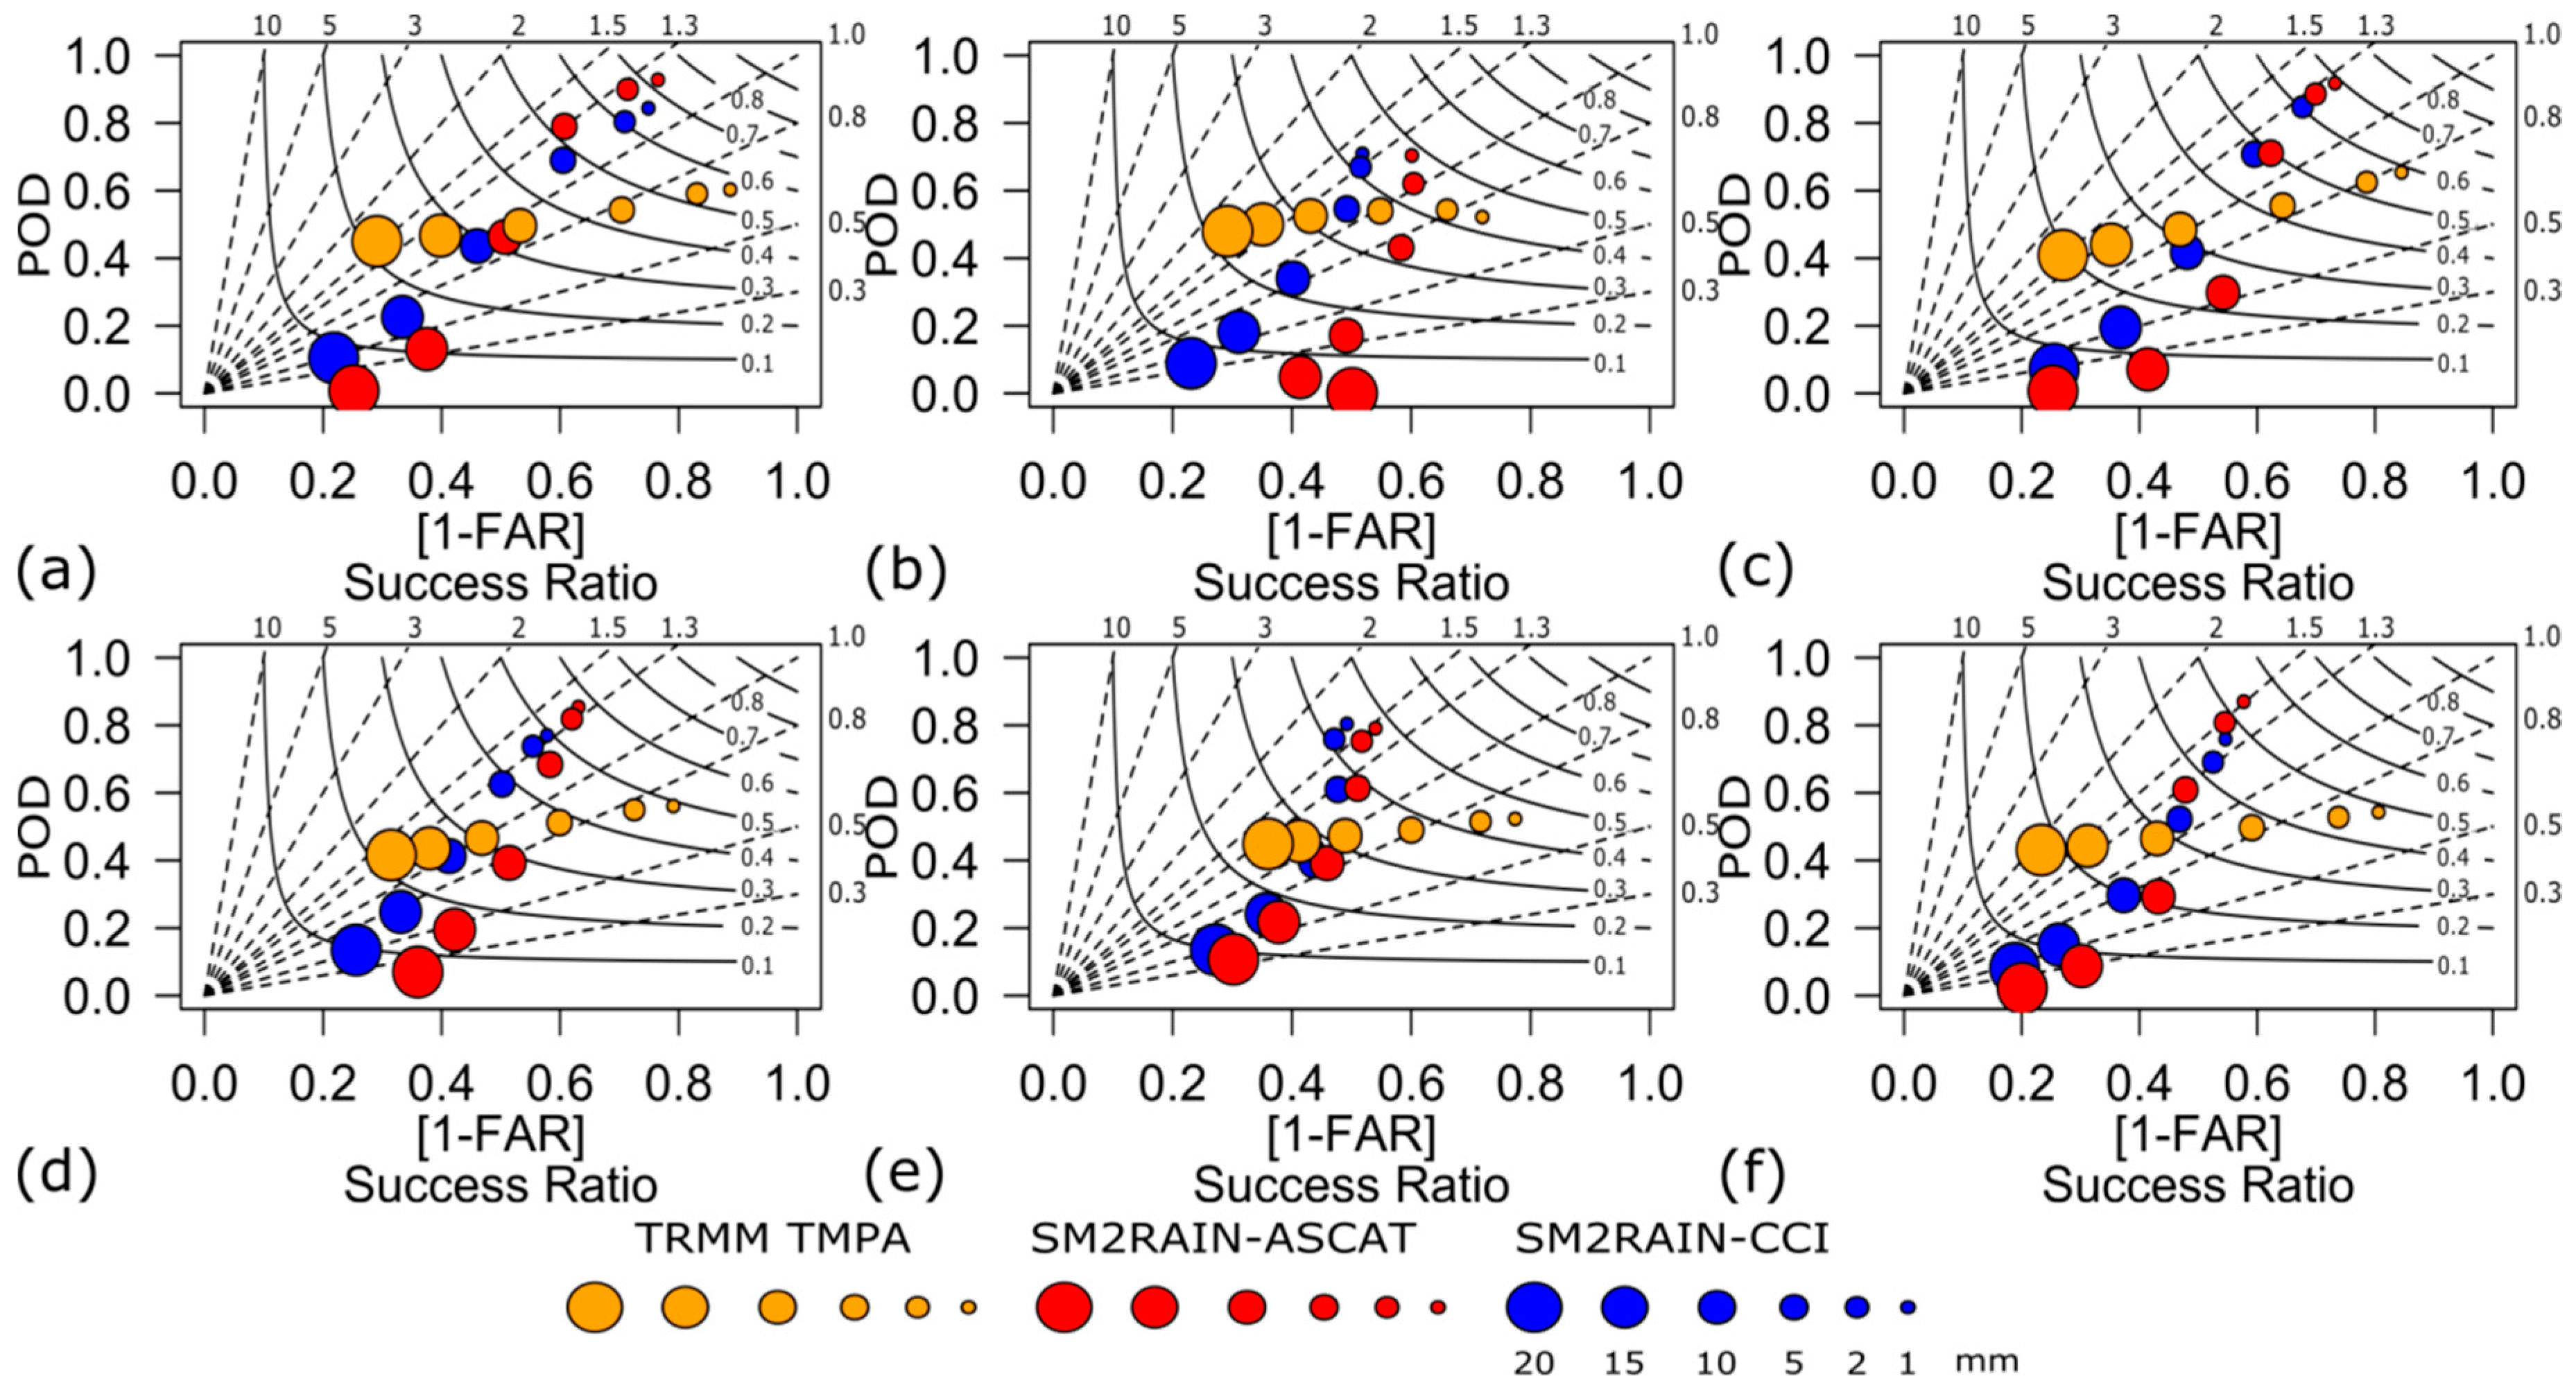
Table 1.
Main characteristics of the biomes in Brazil: Area (km2), median elevation (meters above sea level, m a.s.l.), dominant land cover/use (name and %), mean annual rainfall (MAR), and wettest trimester.
Table 1.
Main characteristics of the biomes in Brazil: Area (km2), median elevation (meters above sea level, m a.s.l.), dominant land cover/use (name and %), mean annual rainfall (MAR), and wettest trimester.
| Biome | Area (km2/1000) * | Median Elevation (m a.s.l.) ** | Dominant Land Cover/Use 1 (Name/%) | MAR 2 (mm) | Wettest Trimester 3 |
|---|---|---|---|---|---|
| AMZ | 4094 | 176 | Forest/82% | 2215 | JFM |
| CER | 2089 | 504 | Agriculture/43% | 1400 | DJF |
| MAT | 1166 | 550 | Agriculture/40% | 1457 | DJF |
| CAAT | 825 | 418 | Agriculture/36% | 639 | FMA |
| PTN | 156 | 127 | Forest/25% | 1145 | DJF |
| PMP | 186 | 152 | Agriculture/41% | 1433 | SON |
Table 2.
Formulas of continuous metrics, where G: GBGR-based rainfall measurement (mm/day), : average GBGR-based rainfall measurement (mm/day), C: product-based rainfall estimate (mm/day), : average product-based rainfall estimate (mm/day), and N: number of data pairs (dimensionless). The rainfall products are SM2RAIN-CCI and SMRAIN-ASCAT.
| Name | Formula | Perfect Score |
|---|---|---|
| Pearson correlation coefficient | 1 | |
| Root mean square error | 0 | |
| Unbiased root mean square error | 0 | |
| Bias | 0 |
Table 3.
Contingency table for comparing gauge-based rainfall (GBGR) and satellite rainfall (SM2RAIN-CCI, SMRAIN-ASCAT, and TRMM TMPA). Threshold: 1, 2, 5, 10, 15, and 20 mm/day.
Table 3.
Contingency table for comparing gauge-based rainfall (GBGR) and satellite rainfall (SM2RAIN-CCI, SMRAIN-ASCAT, and TRMM TMPA). Threshold: 1, 2, 5, 10, 15, and 20 mm/day.
| Gauge ≥ Threshold | Gauge < Threshold | |
|---|---|---|
| Satellite ≥ Threshold | A | B |
| Satellite < Threshold | C | D |
Table 4.
Formulas of categorical metrics, where A: number of hits, B: number of false alarms, C: number of misses, and D: number of correct negatives. N: number of events.
Table 4.
Formulas of categorical metrics, where A: number of hits, B: number of false alarms, C: number of misses, and D: number of correct negatives. N: number of events.
| Name | Formula | Perfect Score |
|---|---|---|
| Probability of Detection | 1 | |
| False Alarm Ratio | 0 | |
| Critical Success Index | 1 | |
| Bias Score | 1 |
Table 5.
Median values of R and Bias against elevation and land use/cover for each rainfall product at annual time scale.
Table 5.
Median values of R and Bias against elevation and land use/cover for each rainfall product at annual time scale.
| R | BIAS | ||||||
|---|---|---|---|---|---|---|---|
| Elevation Range 1 | Land Cover/Use 2 | CCI | ASCAT | TMRR | CCI | ASCAT | TMRR |
| Very Low (≤141 m a.s.l.)* | Bare Area | 0.33 | 0.50 | 0.52 | 24.60 | −19.05 | −5.80 |
| Forest | 0.44 | 0.54 | 0.50 | −5.60 | −8.00 | 5.90 | |
| Grassland | 0.46 | 0.54 | 0.50 | −5.85 | −18.50 | 2.70 | |
| Mosaic Cropland | 0.47 | 0.54 | 0.52 | −3.70 | −14.40 | 5.30 | |
| Mosaic Natural Vegetation | 0.46 | 0.52 | 0.52 | −4.20 | −14.30 | 5.30 | |
| Mosaic Tree and Shrub | 0.46 | 0.54 | 0.53 | −4.50 | −10.70 | 3.80 | |
| Rainfed Cropland | 0.50 | 0.55 | 0.51 | −1.20 | −11.80 | 6.60 | |
| Settlement | 0.47 | 0.58 | 0.48 | −6.15 | −21.50 | 1.85 | |
| Shrubland | 0.52 | 0.55 | 0.50 | 0.40 | −11.20 | 8.10 | |
| Sparse Vegetation | 0.38 | 0.51 | 0.55 | 7.30 | −18.60 | −0.50 | |
| Tree Cover Flooded | 0.34 | 0.54 | 0.43 | −11.70 | −17.30 | 6.00 | |
| Tree Cover Flooded Saline | 0.34 | 0.60 | 0.60 | −16.80 | −9.80 | 3.35 | |
| Water | 0.40 | 0.49 | 0.53 | −1.05 | −5.55 | 3.75 | |
| Wetland | 0.42 | 0.49 | 0.50 | 0.20 | 0.65 | 6.45 | |
| Low (142–438 m a.s.l.) | Bare Area | 0.49 | 0.55 | 0.61 | 18.60 | −25.50 | 16.60 |
| Forest | 0.52 | 0.57 | 0.54 | 2.55 | −14.00 | 10.55 | |
| Grassland | 0.51 | 0.57 | 0.52 | 1.80 | −19.05 | 5.05 | |
| Mosaic Cropland | 0.53 | 0.57 | 0.54 | −0.30 | −18.90 | 5.30 | |
| Mosaic Natural Vegetation | 0.50 | 0.55 | 0.56 | −0.15 | −20.95 | 7.10 | |
| Mosaic Tree and Shrub | 0.52 | 0.58 | 0.52 | 1.50 | −14.90 | 7.70 | |
| Rainfed Cropland | 0.53 | 0.58 | 0.53 | −0.80 | −13.75 | 6.60 | |
| Settlement | 0.51 | 0.58 | 0.51 | −5.80 | −8.50 | 3.60 | |
| Shrubland | 0.55 | 0.59 | 0.53 | 1.50 | −17.30 | 9.10 | |
| Sparse Vegetation | 0.54 | 0.56 | 0.60 | 1.40 | −48.60 | −4.00 | |
| Tree Cover Flooded | 0.49 | 0.53 | 0.55 | 41.30 | 7.60 | 22.90 | |
| Water | 0.52 | 0.56 | 0.54 | −1.95 | −20.25 | 0.50 | |
| Wetland | 0.33 | 0.50 | 0.50 | 1.70 | −12.50 | 5.40 | |
| Medium (439–740 m a.s.l.) | Forest | 0.49 | 0.57 | 0.52 | 1.60 | −14.60 | 8.15 |
| Grassland | 0.48 | 0.61 | 0.52 | 1.70 | −16.80 | 6.00 | |
| Mosaic Cropland | 0.55 | 0.62 | 0.54 | −2.00 | −16.90 | 7.40 | |
| Mosaic Natural Vegetation | 0.57 | 0.62 | 0.56 | 0.25 | −19.00 | 6.05 | |
| Mosaic Tree and Shrub | 0.50 | 0.58 | 0.52 | 3.40 | −14.50 | 9.10 | |
| Rainfed Cropland | 0.57 | 0.62 | 0.55 | −0.10 | −16.65 | 6.60 | |
| Settlement | 0.38 | 0.53 | 0.49 | 2.40 | −18.10 | 5.00 | |
| Shrubland | 0.60 | 0.64 | 0.57 | 0.00 | −18.40 | 5.50 | |
| Water | 0.60 | 0.63 | 0.56 | −0.30 | −28.35 | 1.90 | |
| Wetland | 0.63 | 0.63 | 0.61 | −1.10 | −9.30 | 2.80 | |
| High (741–994 m a.s.l.) | Forest | 0.36 | 0.48 | 0.51 | 2.05 | −10.30 | 9.65 |
| Grassland | 0.51 | 0.58 | 0.54 | −0.30 | −17.70 | 6.30 | |
| Mosaic Cropland | 0.56 | 0.61 | 0.54 | −0.85 | −14.40 | 4.65 | |
| Mosaic Natural Vegetation | 0.54 | 0.66 | 0.55 | 2.35 | −15.85 | 4.25 | |
| Mosaic Tree and Shrub | 0.53 | 0.63 | 0.52 | 0.05 | −13.05 | 5.25 | |
| Rainfed Cropland | 0.58 | 0.64 | 0.55 | −0.30 | −13.20 | 4.25 | |
| Settlement | 0.53 | 0.65 | 0.58 | 8.80 | −18.50 | 10.90 | |
| Shrubland | 0.58 | 0.65 | 0.56 | −1.40 | −20.35 | 4.40 | |
| Very High (≥995 m a.s.l.) | Forest | 0.41 | 0.59 | 0.48 | -0.70 | −5.45 | 6.85 |
| Grassland | 0.46 | 0.56 | 0.53 | -3.65 | −0.15 | 6.15 | |
| Mosaic Cropland | 0.39 | 0.57 | 0.40 | 2.55 | 2.70 | 9.70 | |
| Mosaic Natural Vegetation | 0.48 | 0.62 | 0.45 | 3.40 | −15.50 | 4.20 | |
| Mosaic Tree and Shrub | 0.35 | 0.48 | 0.53 | 1.60 | −5.70 | 13.20 | |
| Rainfed Cropland | 0.62 | 0.65 | 0.55 | -0.50 | −10.40 | −0.50 | |
| Shrubland | 0.56 | 0.65 | 0.55 | 1.05 | −17.35 | 0.60 | |
© 2019 by the authors. Licensee MDPI, Basel, Switzerland. This article is an open access article distributed under the terms and conditions of the Creative Commons Attribution (CC BY) license (http://creativecommons.org/licenses/by/4.0/).
Share and Cite
MDPI and ACS Style
Paredes-Trejo, F.; Barbosa, H.; dos Santos, C.A.C. Evaluation of the Performance of SM2RAIN-Derived Rainfall Products over Brazil. Remote Sens. 2019, 11, 1113. https://0-doi-org.brum.beds.ac.uk/10.3390/rs11091113
AMA Style
Paredes-Trejo F, Barbosa H, dos Santos CAC. Evaluation of the Performance of SM2RAIN-Derived Rainfall Products over Brazil. Remote Sensing. 2019; 11(9):1113. https://0-doi-org.brum.beds.ac.uk/10.3390/rs11091113
Chicago/Turabian StyleParedes-Trejo, Franklin, Humberto Barbosa, and Carlos A. C. dos Santos. 2019. "Evaluation of the Performance of SM2RAIN-Derived Rainfall Products over Brazil" Remote Sensing 11, no. 9: 1113. https://0-doi-org.brum.beds.ac.uk/10.3390/rs11091113
Note that from the first issue of 2016, this journal uses article numbers instead of page numbers. See further details here.