A Novel Effectively Optimized One-Stage Network for Object Detection in Remote Sensing Imagery


State Key Laboratory of Integrated Service Networks, School of Telecommunications Engineering, Xidian University, Xi’an 710071, China
*
Author to whom correspondence should be addressed.
Remote Sens. 2019, 11(11), 1376; https://0-doi-org.brum.beds.ac.uk/10.3390/rs11111376
Submission received: 13 May 2019
/
Revised: 5 June 2019
/
Accepted: 6 June 2019
/
Published: 9 June 2019
(This article belongs to the Special Issue Image Processing and Spatial Neighbourhoods for Remote Sensing Data Analysis)
Abstract
:With great significance in military and civilian applications, the topic of detecting small and densely arranged objects in wide-scale remote sensing imagery is still challenging nowadays. To solve this problem, we propose a novel effectively optimized one-stage network (NEOON). As a fully convolutional network, NEOON consists of four parts: Feature extraction, feature fusion, feature enhancement, and multi-scale detection. To extract effective features, the first part has implemented bottom-up and top-down coherent processing by taking successive down-sampling and up-sampling operations in conjunction with residual modules. The second part consolidates high-level and low-level features by adopting concatenation operations with subsequent convolutional operations to explicitly yield strong feature representation and semantic information. The third part is implemented by constructing a receptive field enhancement (RFE) module and incorporating it into the fore part of the network where the information of small objects exists. The final part is achieved by four detectors with different sensitivities accessing the fused features, all four parallel, to enable the network to make full use of information of objects in different scales. Besides, the Focal Loss is set to enable the cross entropy for classification to solve the tough problem of class imbalance in one-stage methods. In addition, we introduce the Soft-NMS to preserve accurate bounding boxes in the post-processing stage especially for densely arranged objects. Note that the split and merge strategy and multi-scale training strategy are employed in training. Thorough experiments are performed on ACS datasets constructed by us and NWPU VHR-10 datasets to evaluate the performance of NEOON. Specifically, 4.77% and 5.50% improvements in mAP and recall, respectively, on the ACS dataset as compared to YOLOv3 powerfully prove that NEOON can effectually improve the detection accuracy of small objects in remote sensing imagery. In addition, extensive experiments and comprehensive evaluations on the NWPU VHR-10 dataset with 10 classes have illustrated the superiority of NEOON in the extraction of spatial information of high-resolution remote sensing images.
1. Introduction
Remote sensing imaging technology, such as optical or hyperspectral aerial image processing [1,2,3], has rapidly become one of the most significant technologies in image processing, especially in object detection [4]. It is a challenge to detect densely arranged small objects with arbitrary orientations in wide-scale monitoring [5]. While the traditional methods [6,7,8,9,10] and techniques such as fractal-wavelet modeling [11,12,13,14,15] have made great efforts, they are still far from being automatic and practical currently.
With the recent advent of large ground-based datasets and advanced computational techniques, methods [16,17] based on deep neural network, especially convolutional neural network, (CNN) have achieved great success in general object detection. There are two main streams of CNN-based object detection methods: The two-stage frameworks and the one-stage frameworks. The Region-based CNN (R-CNN) [18], Fast R-CNN [19], Faster R-CNN [20], and R-FCN [21] are the representatives of the two-stage frameworks, where the first stage extracts region proposals within the given image and predicts results according to proposals in the second stage. To accelerate the detection process, the one-stage frameworks, including You Only Look Once (YOLO) [22,23,24] and Single Shot Multi-Box Detector (SSD) [25], directly predict bounding boxes and produce detection results simultaneously. Compared to the two-stage frameworks, YOLO and SSD run faster but tend to sacrifice detection accuracy to a certain extent.
Among these general object detection algorithms, YOLOv3 [24] has shown the greatest inference speed and the highest score on the PASCAL VOC dataset and the Microsoft COCO dataset [26]. As a method specially optimized for detecting small objects in ground-based imagery, it achieves a favourable tradeoff between accuracy and efficiency.
On this basis, object detection in remote sensing imagery has been widely studied in recent years [27,28,29,30,31,32]. In the field of remote sensing, many researchers have made great efforts to object detection methods based on CNN [33,34,35,36,37,38,39].
A position-sensitive balancing (PSB) framework based on the ResNet [40] was proposed in [41]. Meanwhile, the online hard example mining (OHEM) [42] was added into the Faster R-CNN in [43] to further improve the accuracy of detecting small objects. In addition, Long, et al. [44] proposed an unsupervised score-based bounding box regression for accurate positioning of objects in the aerial images. To address the problem of rotation variations and appearance ambiguity in remote sensing imagery, Ref. [45] combined the region proposal network (RPN) and the local contextual feature fusion. Despite that great efforts have been made, these methods based on the two-stage frameworks are still far from running in real time currently.
To address the abovementioned problems, a series of the one-stage detection models have been proposed. At present, the detection frameworks usually adopt the feature pyramid structure such as the FPN [46] which was proposed for independent detection in different convolutional layers. In addition, Chen et al. [37] improved the SSD via augmented semantic information in remote sensing images. While this method can improve speed, it still has poor performance for small objects. Besides, the You Only Look Twice (YOLT) [5] which is optimized for small and densely arranged objects in remote sensing images, adopted the YOLOv2 [23] with a down-sampling multiple as 16. Object detection method [36], which is also improved on the YOLOv2, proposed a visual detail enhancement mapping method to detect small aerial objects. However, the performance of [36] is worse than YOLOv3 on squint angle. Besides, the CornerNet [47], detecting an object bounding box as a pair of key points, introduced the hourglass network [48] as its backbone for better detection performance of corners. However, this approach is relatively unsatisfactory in terms of detection speed.
Based on the Faster R-CNN [20], a multi-model decision fusion network developed in [34] combines a contextual information fusion sub-network, a part-based multi-region fusion sub-network, and a baseline sub-network to recognize and locate geospatial objects. In addition, the final detection results are obtained by the way of making a decision fusion on the results of the three sub-networks. Based on the YOLOv2 [23], a single-shot geospatial object detection framework based on multi-scale feature fusion modules has been proposed in [33]. Note that detectors in this model are used in conjunction with multi-scale feature fusion modules. Based on the SSD [25], a novel single-shot detector named the Recurrent Detection with Activated Semantics (RDAS) structure is presented for addressing the small-scaled object fast detection problem in VHR remote sensing in [35]. Besides, the shared multi-scale base network and the multi-scale object proposal network were employed in [38], which enables the production of feature maps with high semantic information at different layers and generation of anchor boxes that cover most of the objects with a small number of negative samples.
However, there are still some challenges [5,33] to be solved in geospatial object detection even though abovementioned excellent methods have been put forward because of the characteristic of remote sensing image as follows.
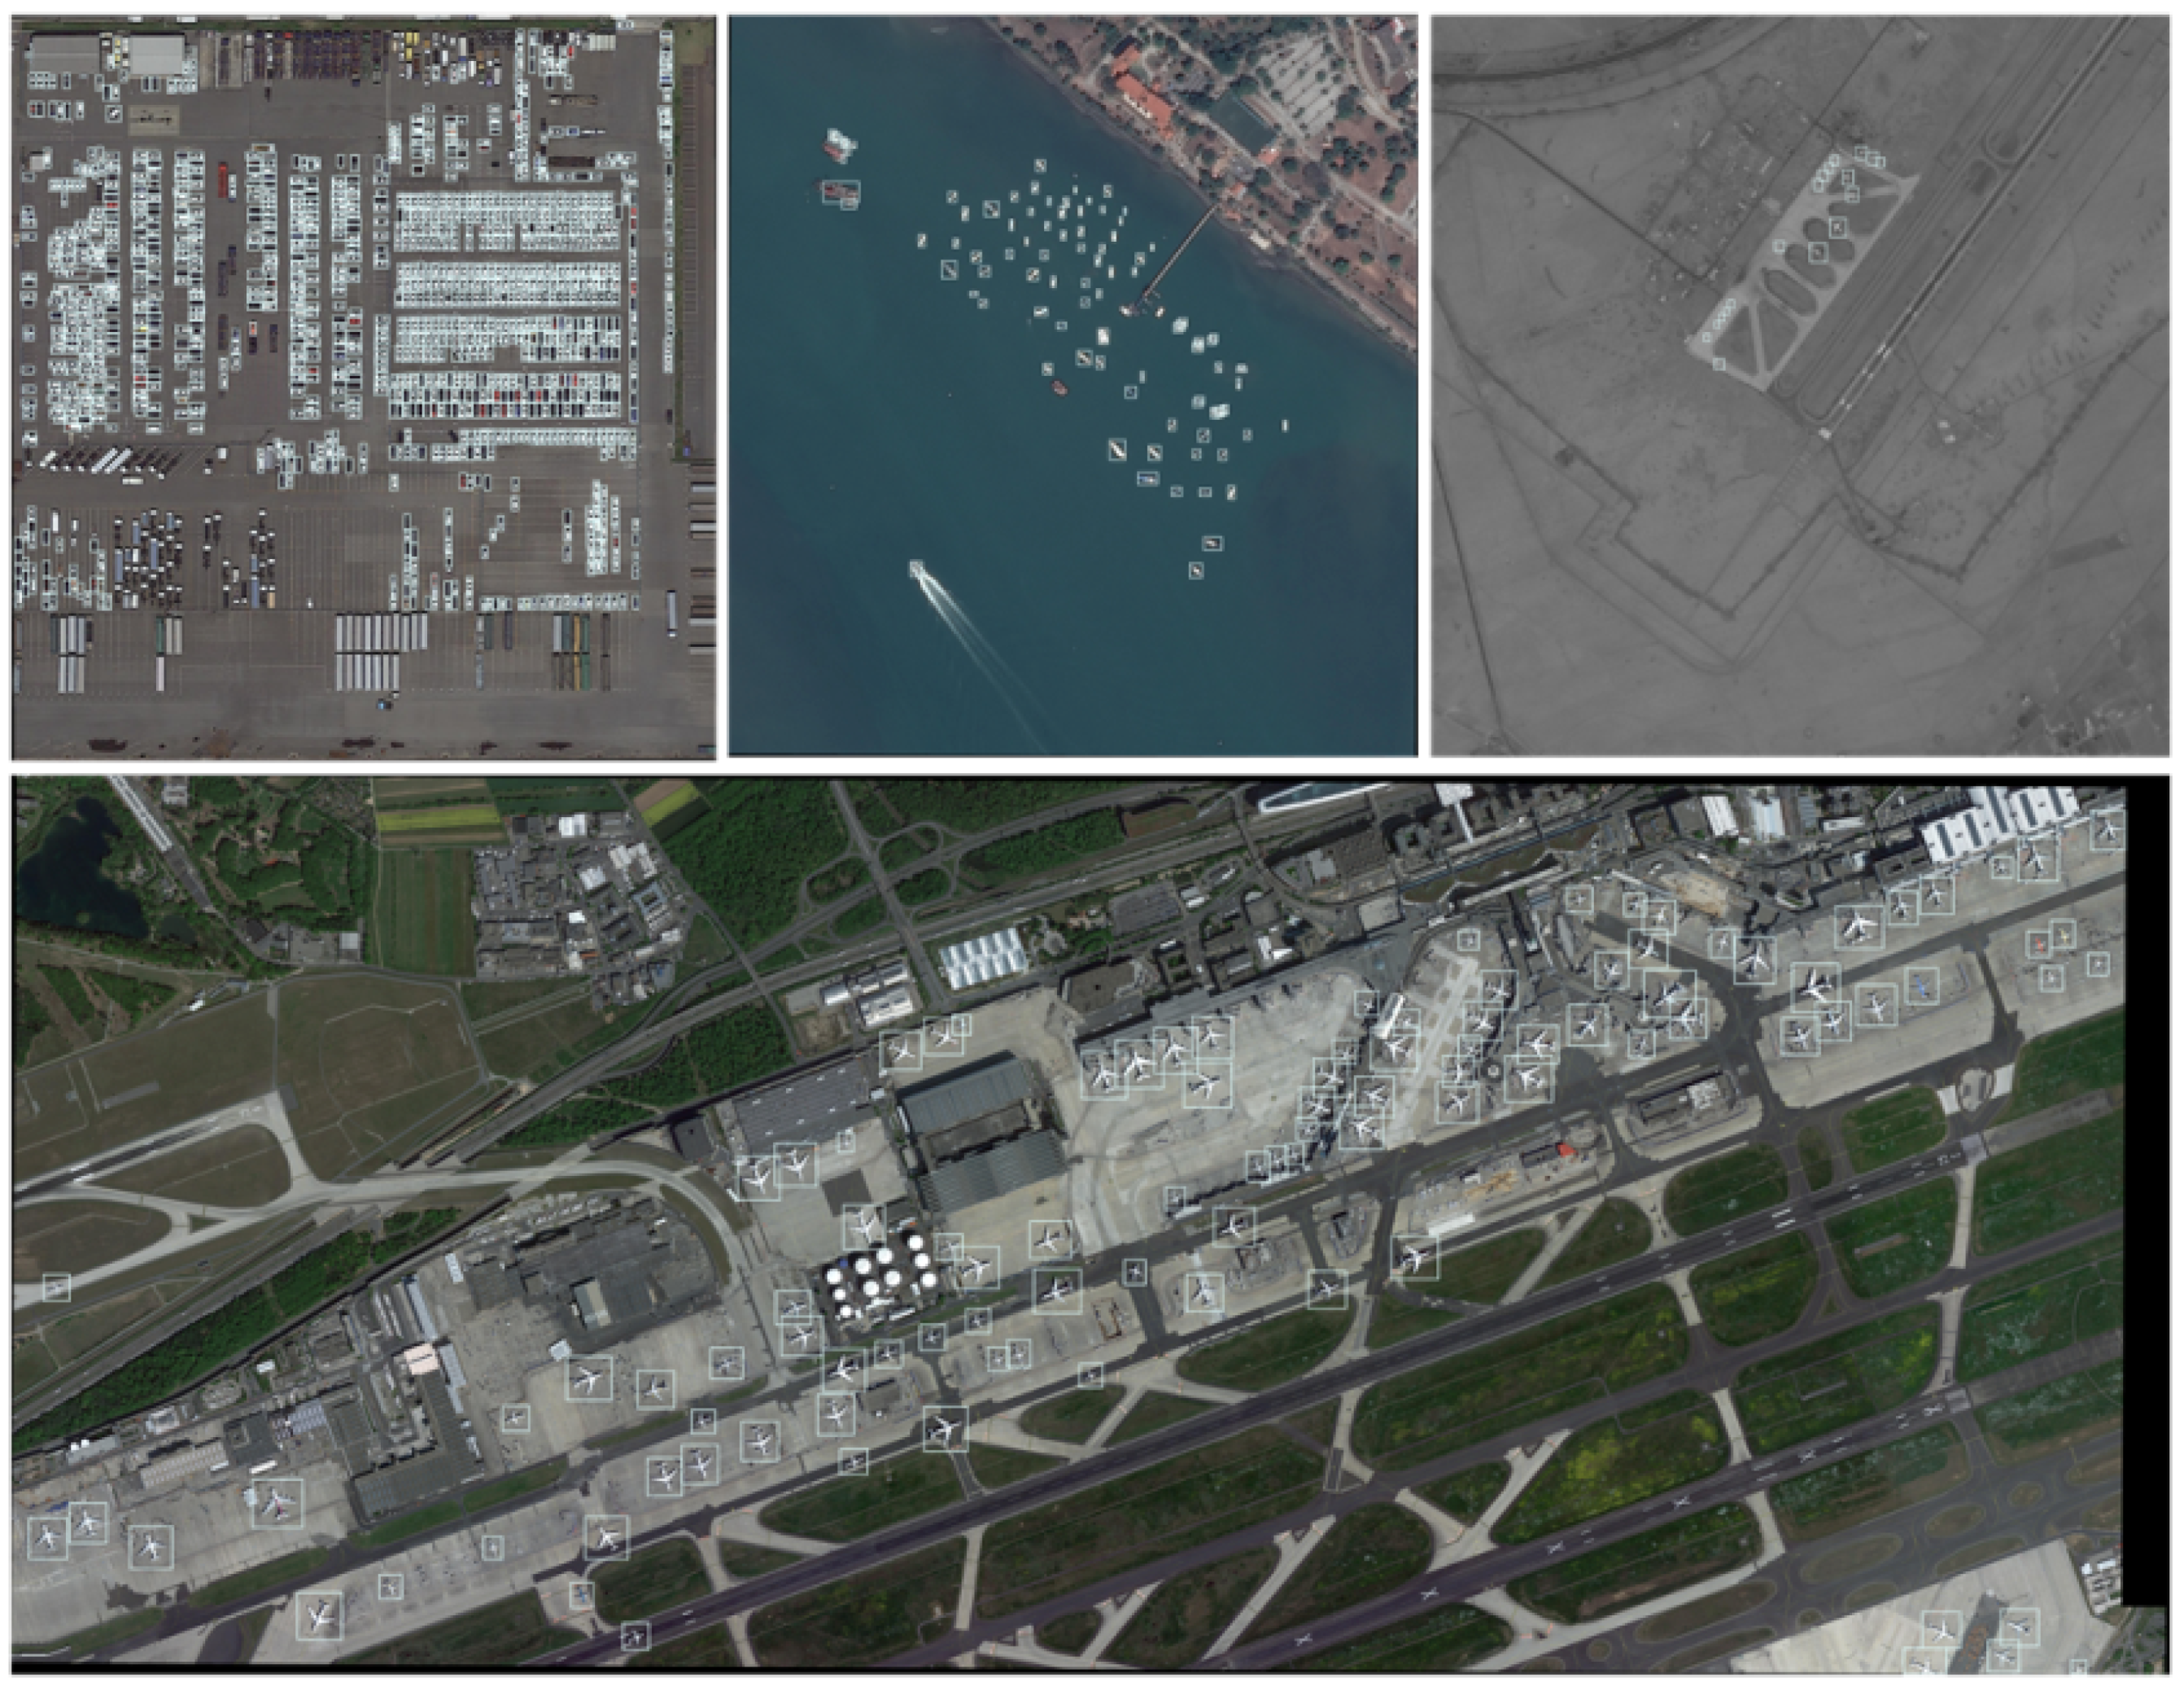
- In satellite imagery objects we are interested in, such as ships [49,50], are often densely arranged [51] and may appear as merely several pixels [52,53,54] (see Figure 1), rather than the large and prominent subjects in general object data such as Microsoft COCO [26]. For some objects such as cars, each object can be only 15 pixels at the highest resolution.
- Training data of high quality is insufficient. Only a small number of well-labelled geospatial images are publicly available. In addition, the quantity and quality of remote-sensing images have undergone rapid development and made great progress, which demands fast and effective approaches to real-time object localization [33].
- The geospatial images are different from general object images captured in ordinary life. Objects viewed from overhead can appear as multi-scale with any orientation such as airplanes [55,56,57] in an airport. Besides, the changing illumination, unusual aspect ratios and complex backgrounds make the detection difficult.
In this work, we tackle the previous problems and propose a specific neural network named NEOON which mainly focuses on capturing the features and semantic information of small objects. Due to the speed, accuracy, and flexibility of YOLOv3 [24], we implement our method in the Darknet framework in which YOLOv3 was developed, and maintain some effective mechanisms of YOLOv3.
At first, we try to find out the characteristic of object features in remote sensing images firstly and then figure out how to design or optimize the algorithm. In our experiments, a key observation is that the first few layers of the whole network tend to contain more discriminative information of small objects such airplanes, while the deep layers of CNN contain strong semantics with unobvious even disappeared feature information of small objects. Based on this observation, our motivation becomes clear, that is, to make the best use of small object information in the forepart of the network. So we design NEOON based on the purpose of capturing and fusing features across different resolutions in order to transmit the feature information from the forepart of the network to the final detectors as much as possible.
For the experiments, we adopted the ACS dataset consisting of 3 categorieswhich is a collection of five public datasetsand the NWPU VHR-10 dataset [41,45,58,59] which is a 10-class HSR remote sensing imagery geospatial object detection dataset. Note that the methods proposed in [33,35,41,58,59] are all evaluated in the NWPU VHR-10 dataset. The experimental results confirmed that the proposed method can achieve a satisfactory detection performance in remote sensing object detection.
In summary, we make the following contributions in this work:
- We validate the characteristic of small objects feature in geospatial images when the deep CNN working, and then propose the main idea, making the best use of small object information in the forepart of the network, to copy with remote sensing detection tasks.
- We propose a novel one-stage detection framework named NEOON with a satisfactory performance for detecting densely arranged small objects in remote sensing imagery. NEOON focuses on extracting spatial information of high-resolution remote sensing images by understanding and analyzing the combination of feature and semantic information of small objects.
- The Focal Loss [60] is introduced in darknet as the loss function for classification to address the problem of class imbalance which is the main reason leading to the phenomenon that two-stage methods always outperform one-stage methods in detection accuracy.
- For densely arranged objects, we make use of the Soft-NMS [61] in post-processing and modify the code to make it suitable for the Darknet framework to preserve accurate bounding boxes in the post-processing stage.
- Abundant datasets and sufficient experiments are adopted and executed, respectively. On the one hand, experiments are conducted on both the ACS dataset and the NWPU VHR-10 dataset. On the other hand, the design of experiments and analysis of results are so thorough that the effectiveness of NEOON has been provenly validated. Specifically, we obtained the Precision as well as the Recall, and discuss the influence of image resolution on detection performance.
- The split and merge strategy, as well as the multi-scale training, are employed and do make sense in this work. To ensure that NEOON works smoothly and efficaciously, we have updated the C library of Darknet [62] by modifying a considerable part of C code as well as used quite a lot of script codes written in Python.
In a word, validated ideas and solutions were provided to remote sensing detection task in this work, and the proposed NEOON model has been proved effective and significant through experiments.
The rest of this paper is organized as follows. The proposed novel effectively optimized one-stage network (NEOON) is described in detail in Section 2. Section 3 presents a description of the dataset and the experimental settings. Section 4 presents the analysis of the experimental results and a discussion of our work. Finally, the conclusions are stated in Section 5.
2. Proposed Method
In this section, we present a geospatial object detection approach named NEOON especially optimized for densely arranged small objects and discuss its main features.
NEOON is implemented in the Darknet neural network framework and maintains many settings (such as anchor boxes and bounding box prediction) of YOLOv3 [24] which is an excellent detection method developed in the Darknet. Meanwhile, in order to ensure that NEOON works smoothly and efficaciously, we updated specific parts of the Darknet in C, such as the implementation of convolutional layer (for atrous convolution), the way of backpropagation (for variety of loss function such as SE, CE and the Focal Loss) and the configuration of multithread of GPU (for more efficient calculation), etc. Besides, we use quite a lot of script codes written in Python in this work.
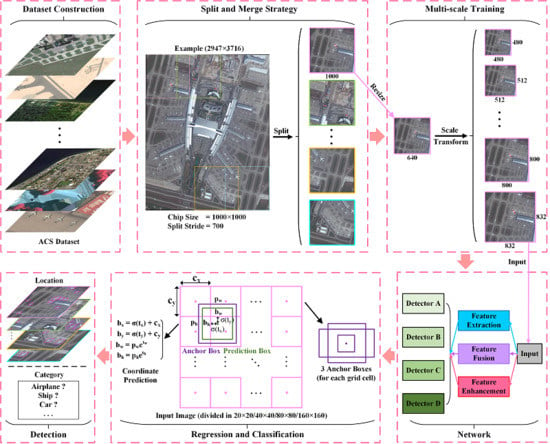
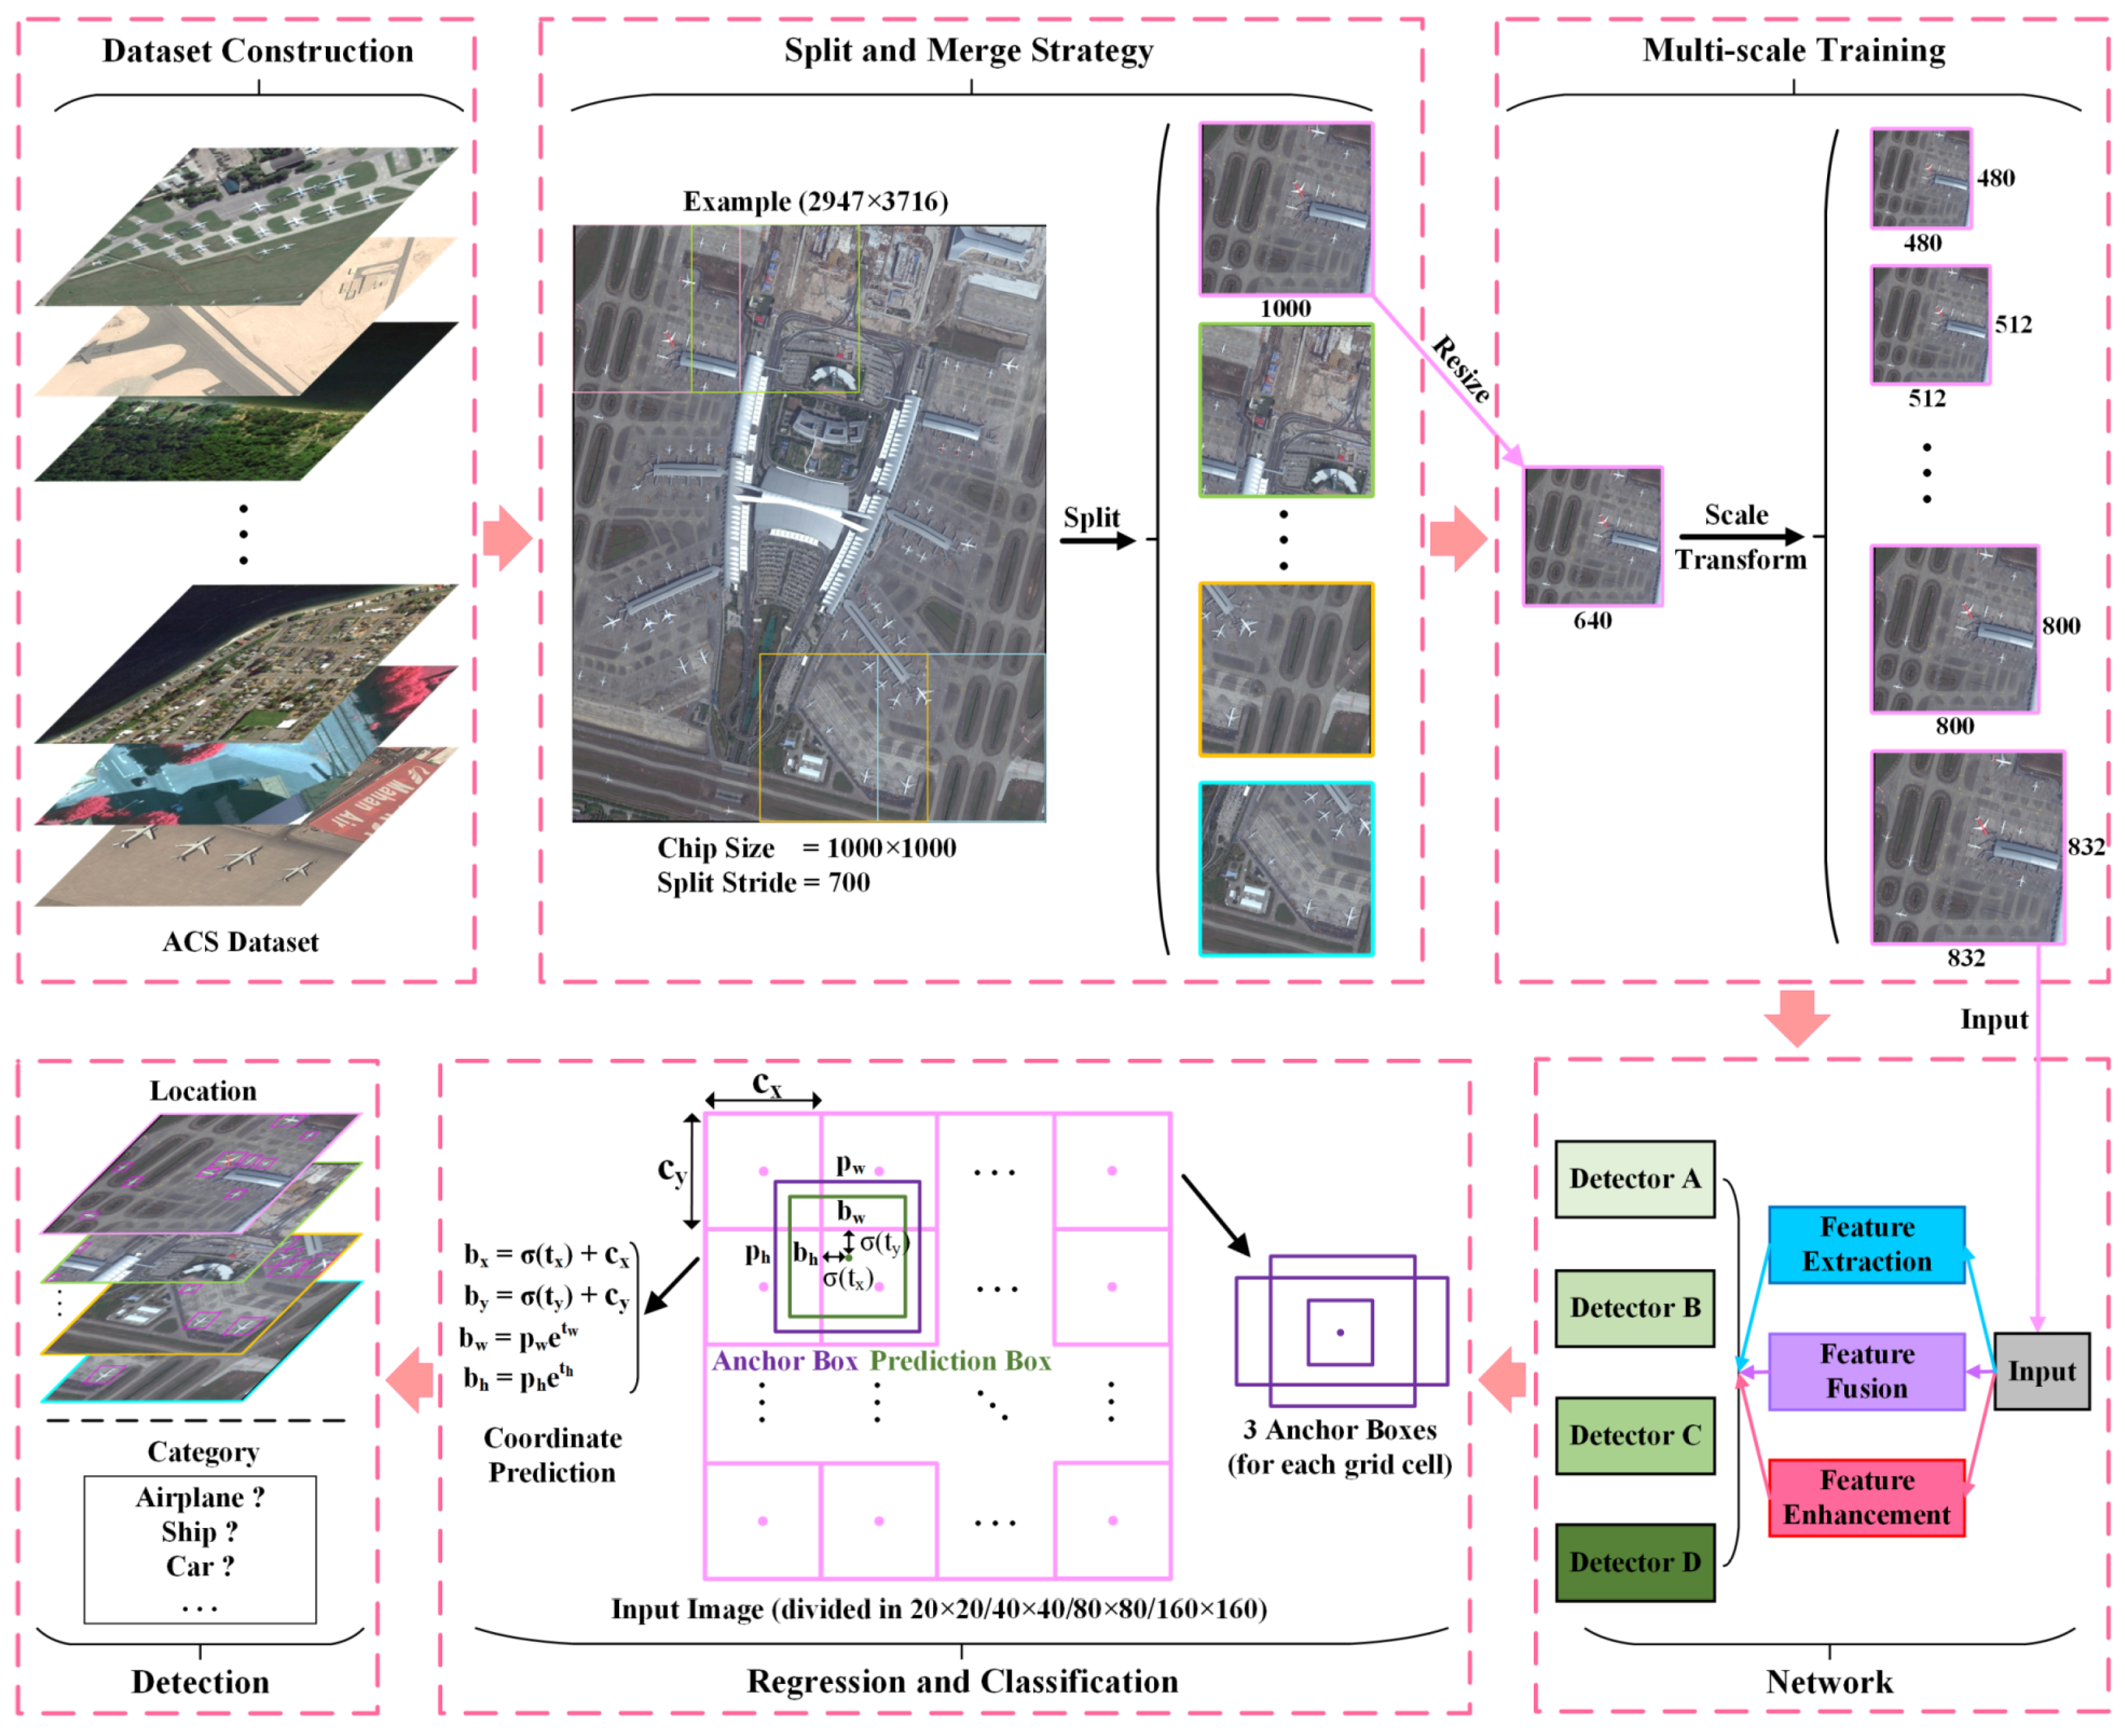
An overview of the overall detection process in this work is given in Figure 2. Focusing on extracting spatial information of high-resolution remote sensing images, the proposed method is aimed at understanding and analyzing the combination of feature and semantic information of small objects, which can be demonstrated in detail as following components.
- Feature extraction. The backbone of NEOON undertakes the task of feature extraction which will directly affect the final performance. As a special partly symmetrical architecture, it achieves bottom-up and corresponding top-down processing with several residual modules [40] adopted to accelerate and optimize the fitting process of NEOON model.
- Feature fusion. Concatenation operations and subsequent convolutional operations are carried out for feature maps, all four parallel, to implement feature fusion across the backbone to effectively combine the low-level and high-level features.
- Feature enhancement. We construct an RFE module in according to RFBNet [63] and incorporate it into NEOON. It is located at the forepart of backbone to especially enhance feature information of small objects of interested.
- Multi-scale detectors. Four detectors with different sensitivities, set all four parallel, play a vital role in capturing and utilizing features of objects in different scales.
- Focal loss. We introduce the Focal Loss [60] as the loss function of classification because it has been proved helpful to improve the performance of the one-stage methods by settling the class imbalance problem.
- Post-processing. The soft non-maximum suppression (Soft-NMS) [61] has been utilized in the post-processing procedure to filtrate bounding boxes more reasonably to improve the detection accuracy, especially for densely arranged objects.
- Implementation strategy. The split and merge strategy, as well as multi-scale training, are employed because the sizes of images and objects are too enormous and varying, respectively.
Then we first verify the influence of different feature maps output from different layers of a network on extracting features and detecting small objects in Section 2.1 and then present NEOON in three aspects illustrated separately in Section 2.2, Section 2.3 and Section 2.4.
2.1. Feature Analysis
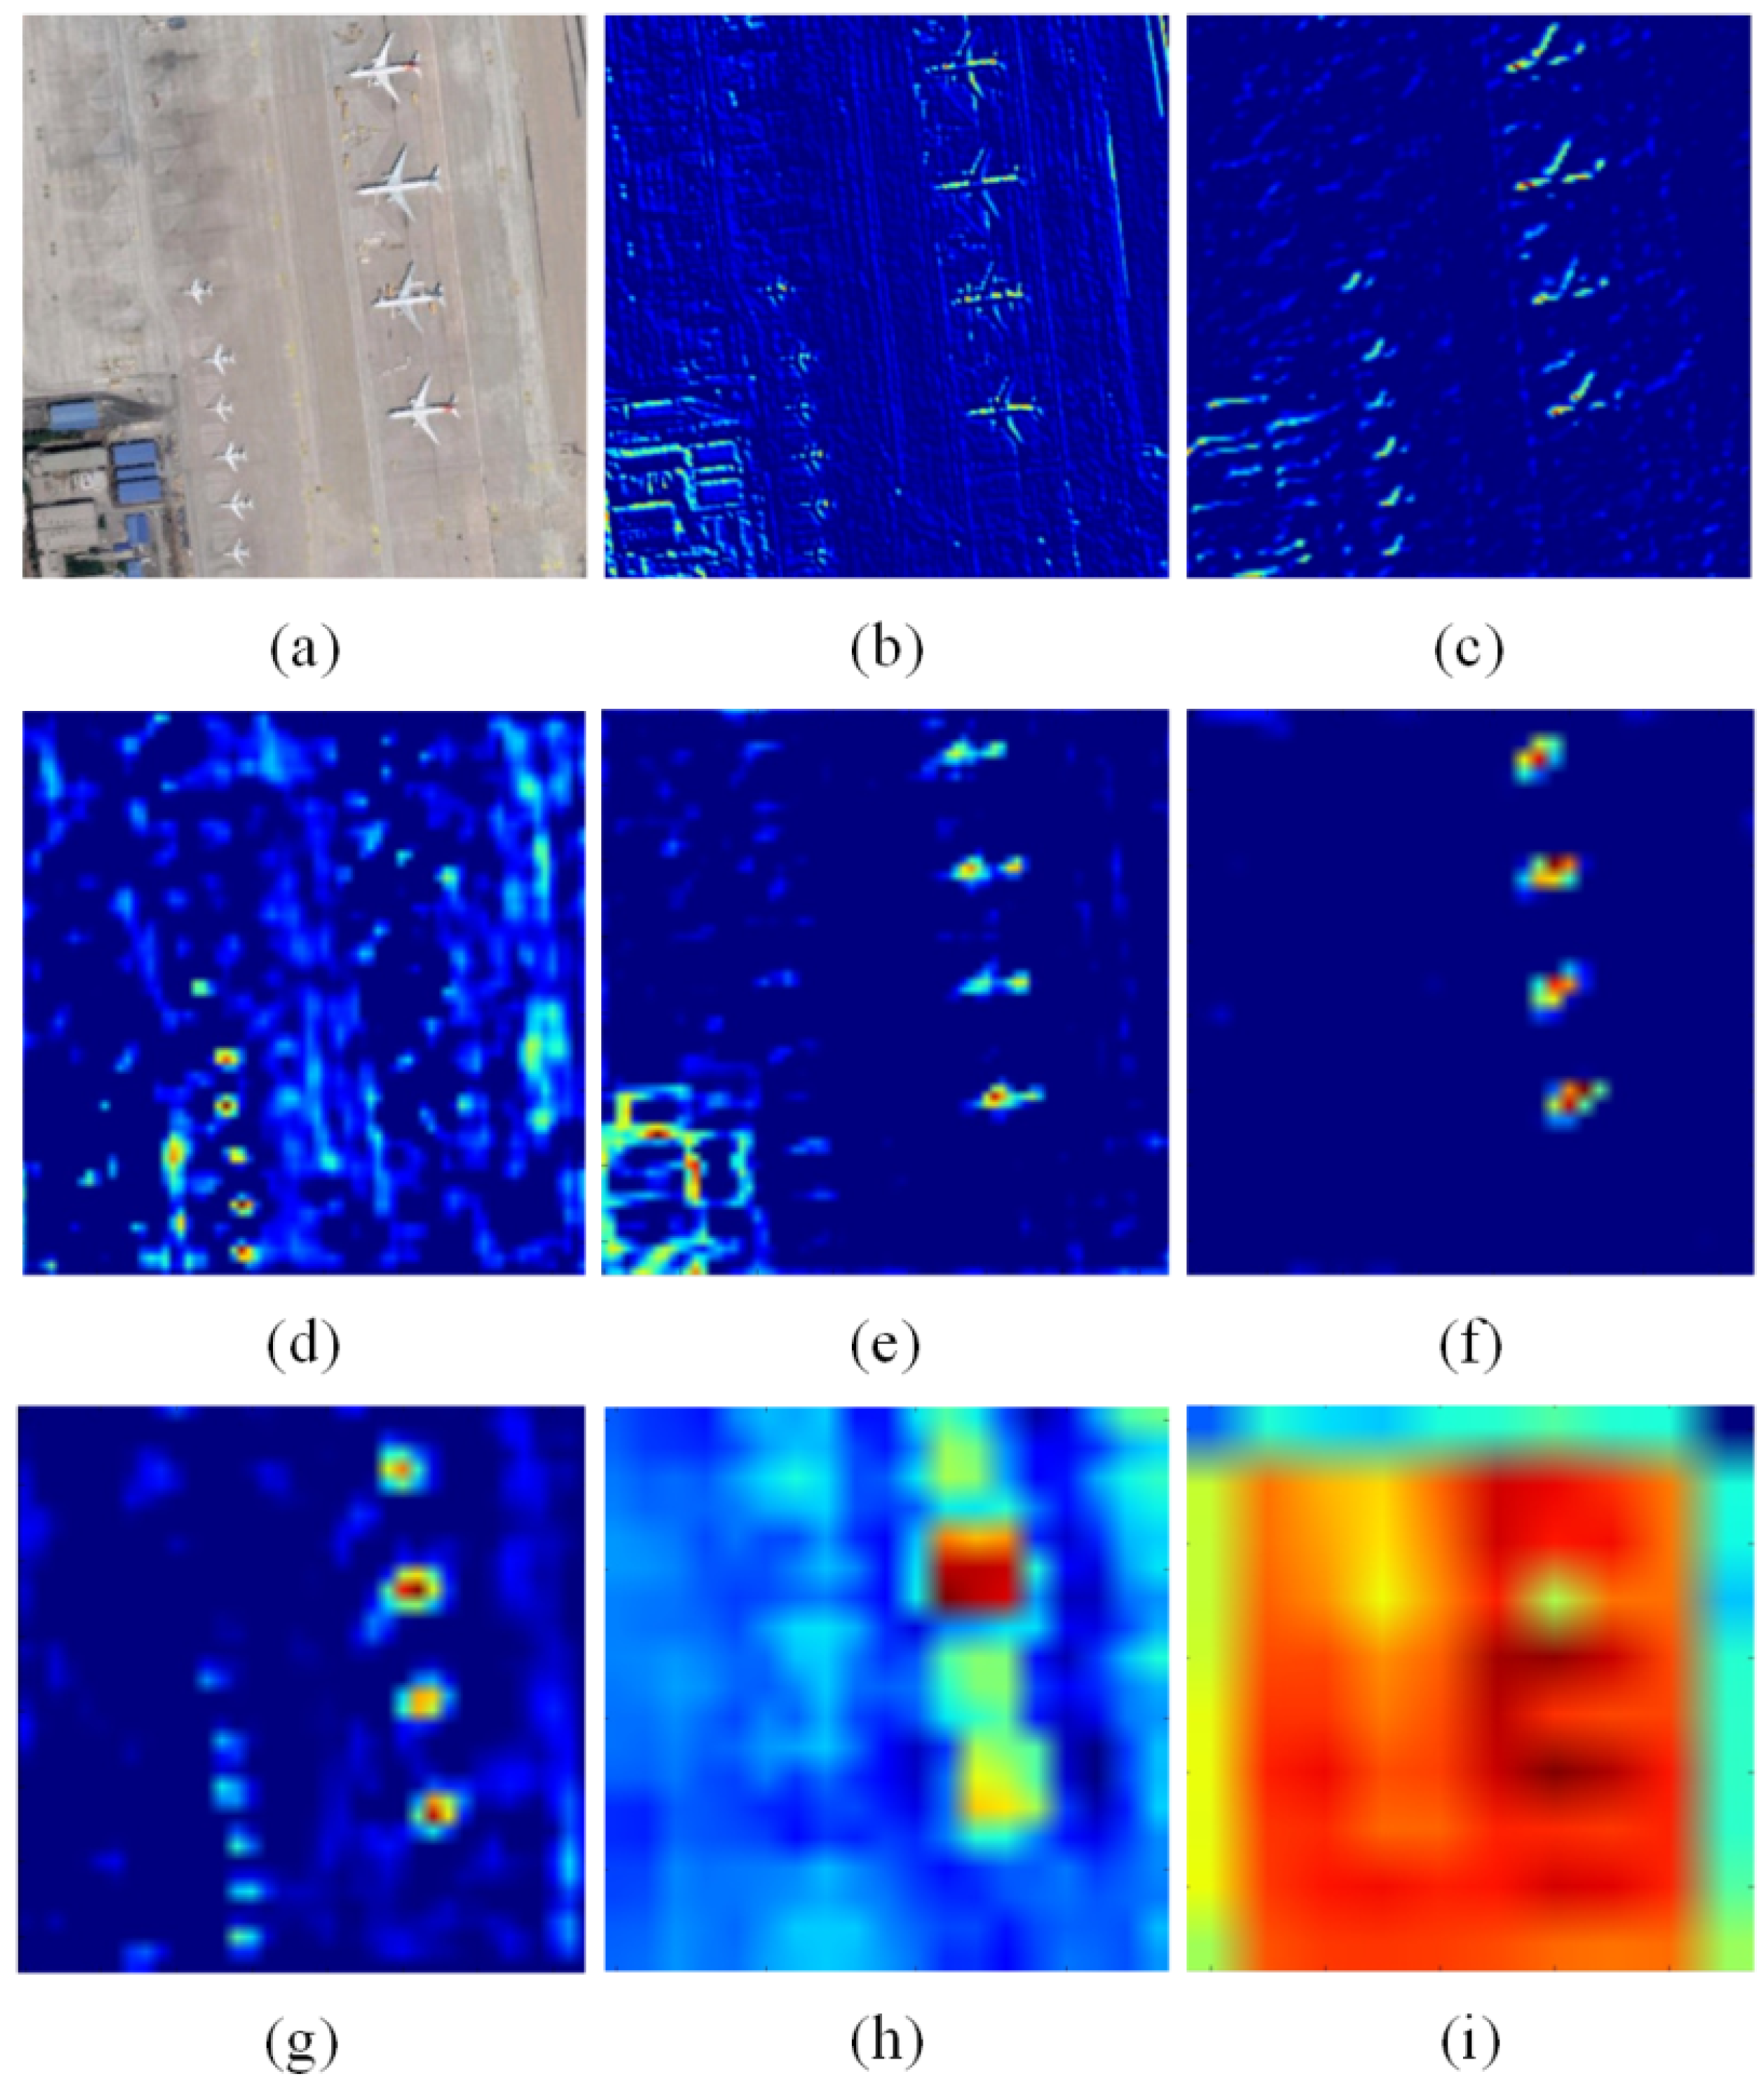
In order to evaluate the influences of different layers in the network on feature extraction of small objects, we collect and compare the heatmaps output from different layers of the YOLOv3 framework.
As shown in Figure 3, the heatmaps collected from the first few layers contain more information of small objects, on the contrary, the heatmaps collected from latter layers contain strong semantic information but less information of small objects. That is to say, the distinctive features of small objects in remote sensing imagery are mainly preserved in the forepart of the whole network based on CNN.
2.2. Neoon Network
In general, NEOON, as a novel fully convolutional network optimized efficaciously in many ways, focuses on making full use of features across several scales contained in diverse layers to extract, fuse and enhance features of indistinguishable small and densely arranged objects in geospatial images. Specifically, the structure of NEOON will be illustrated in Section 2.2.1, Section 2.2.2, Section 2.2.3 and Section 2.2.4.
2.2.1. Feature Extraction
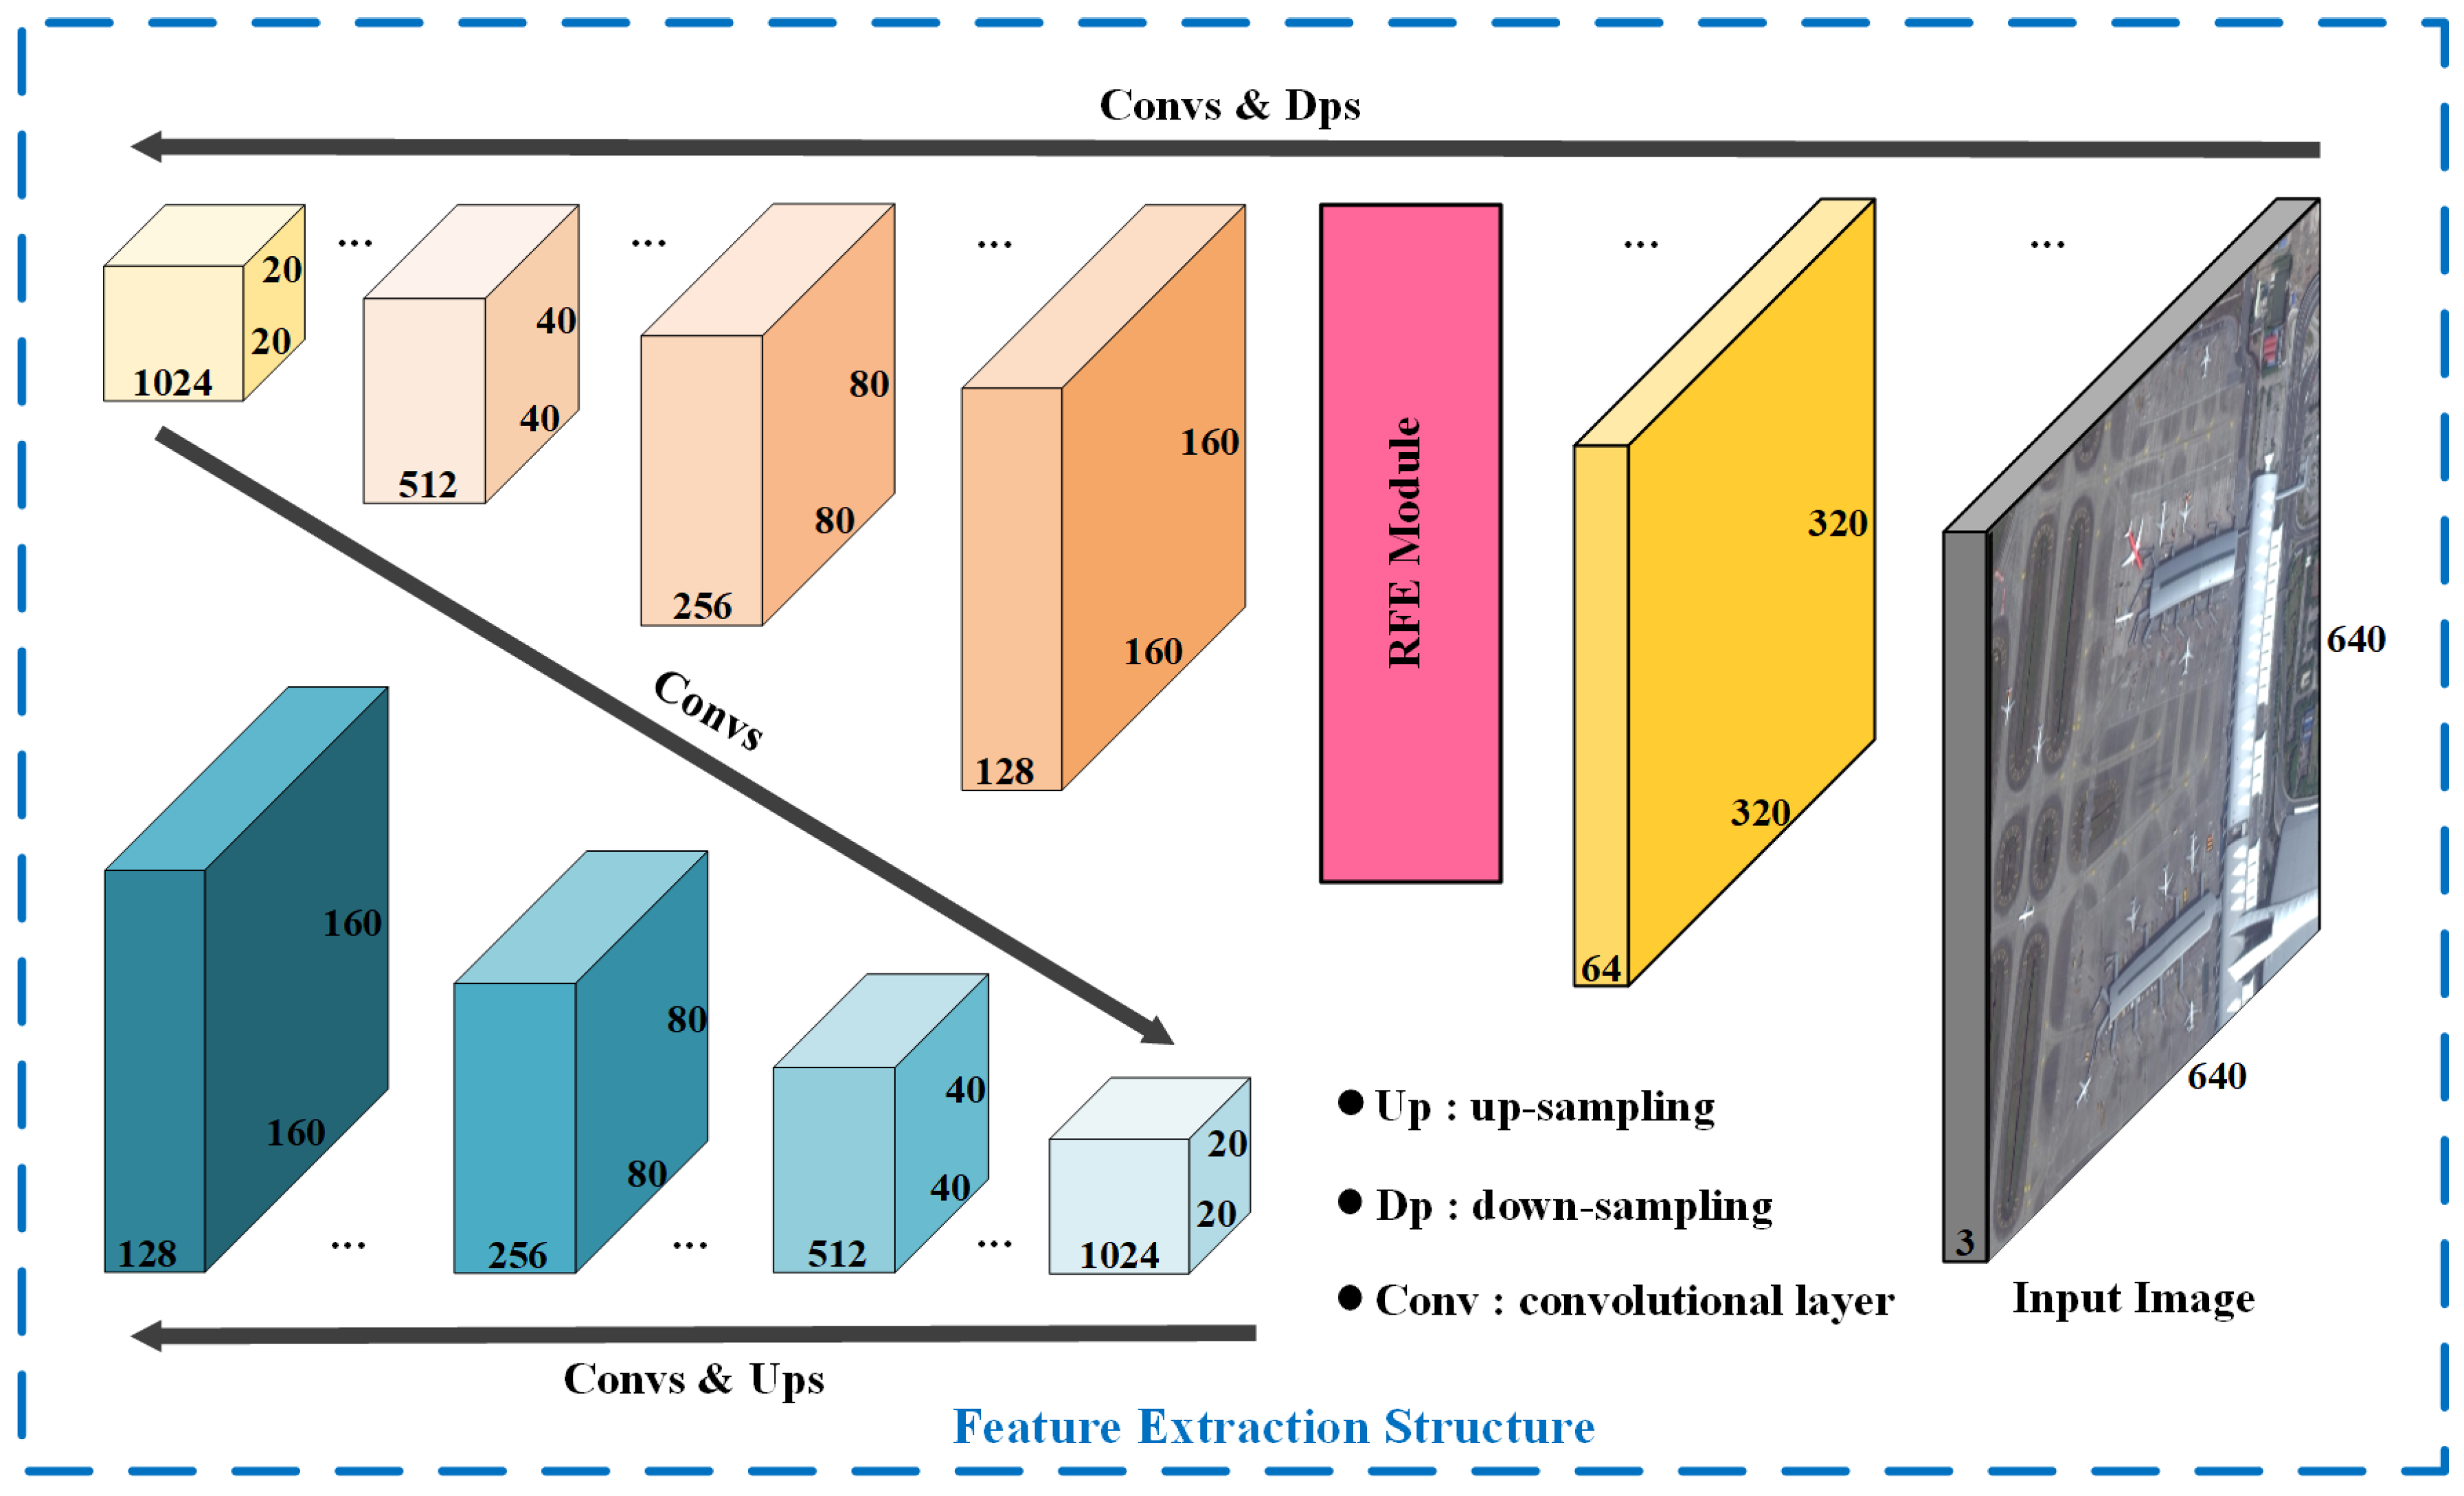
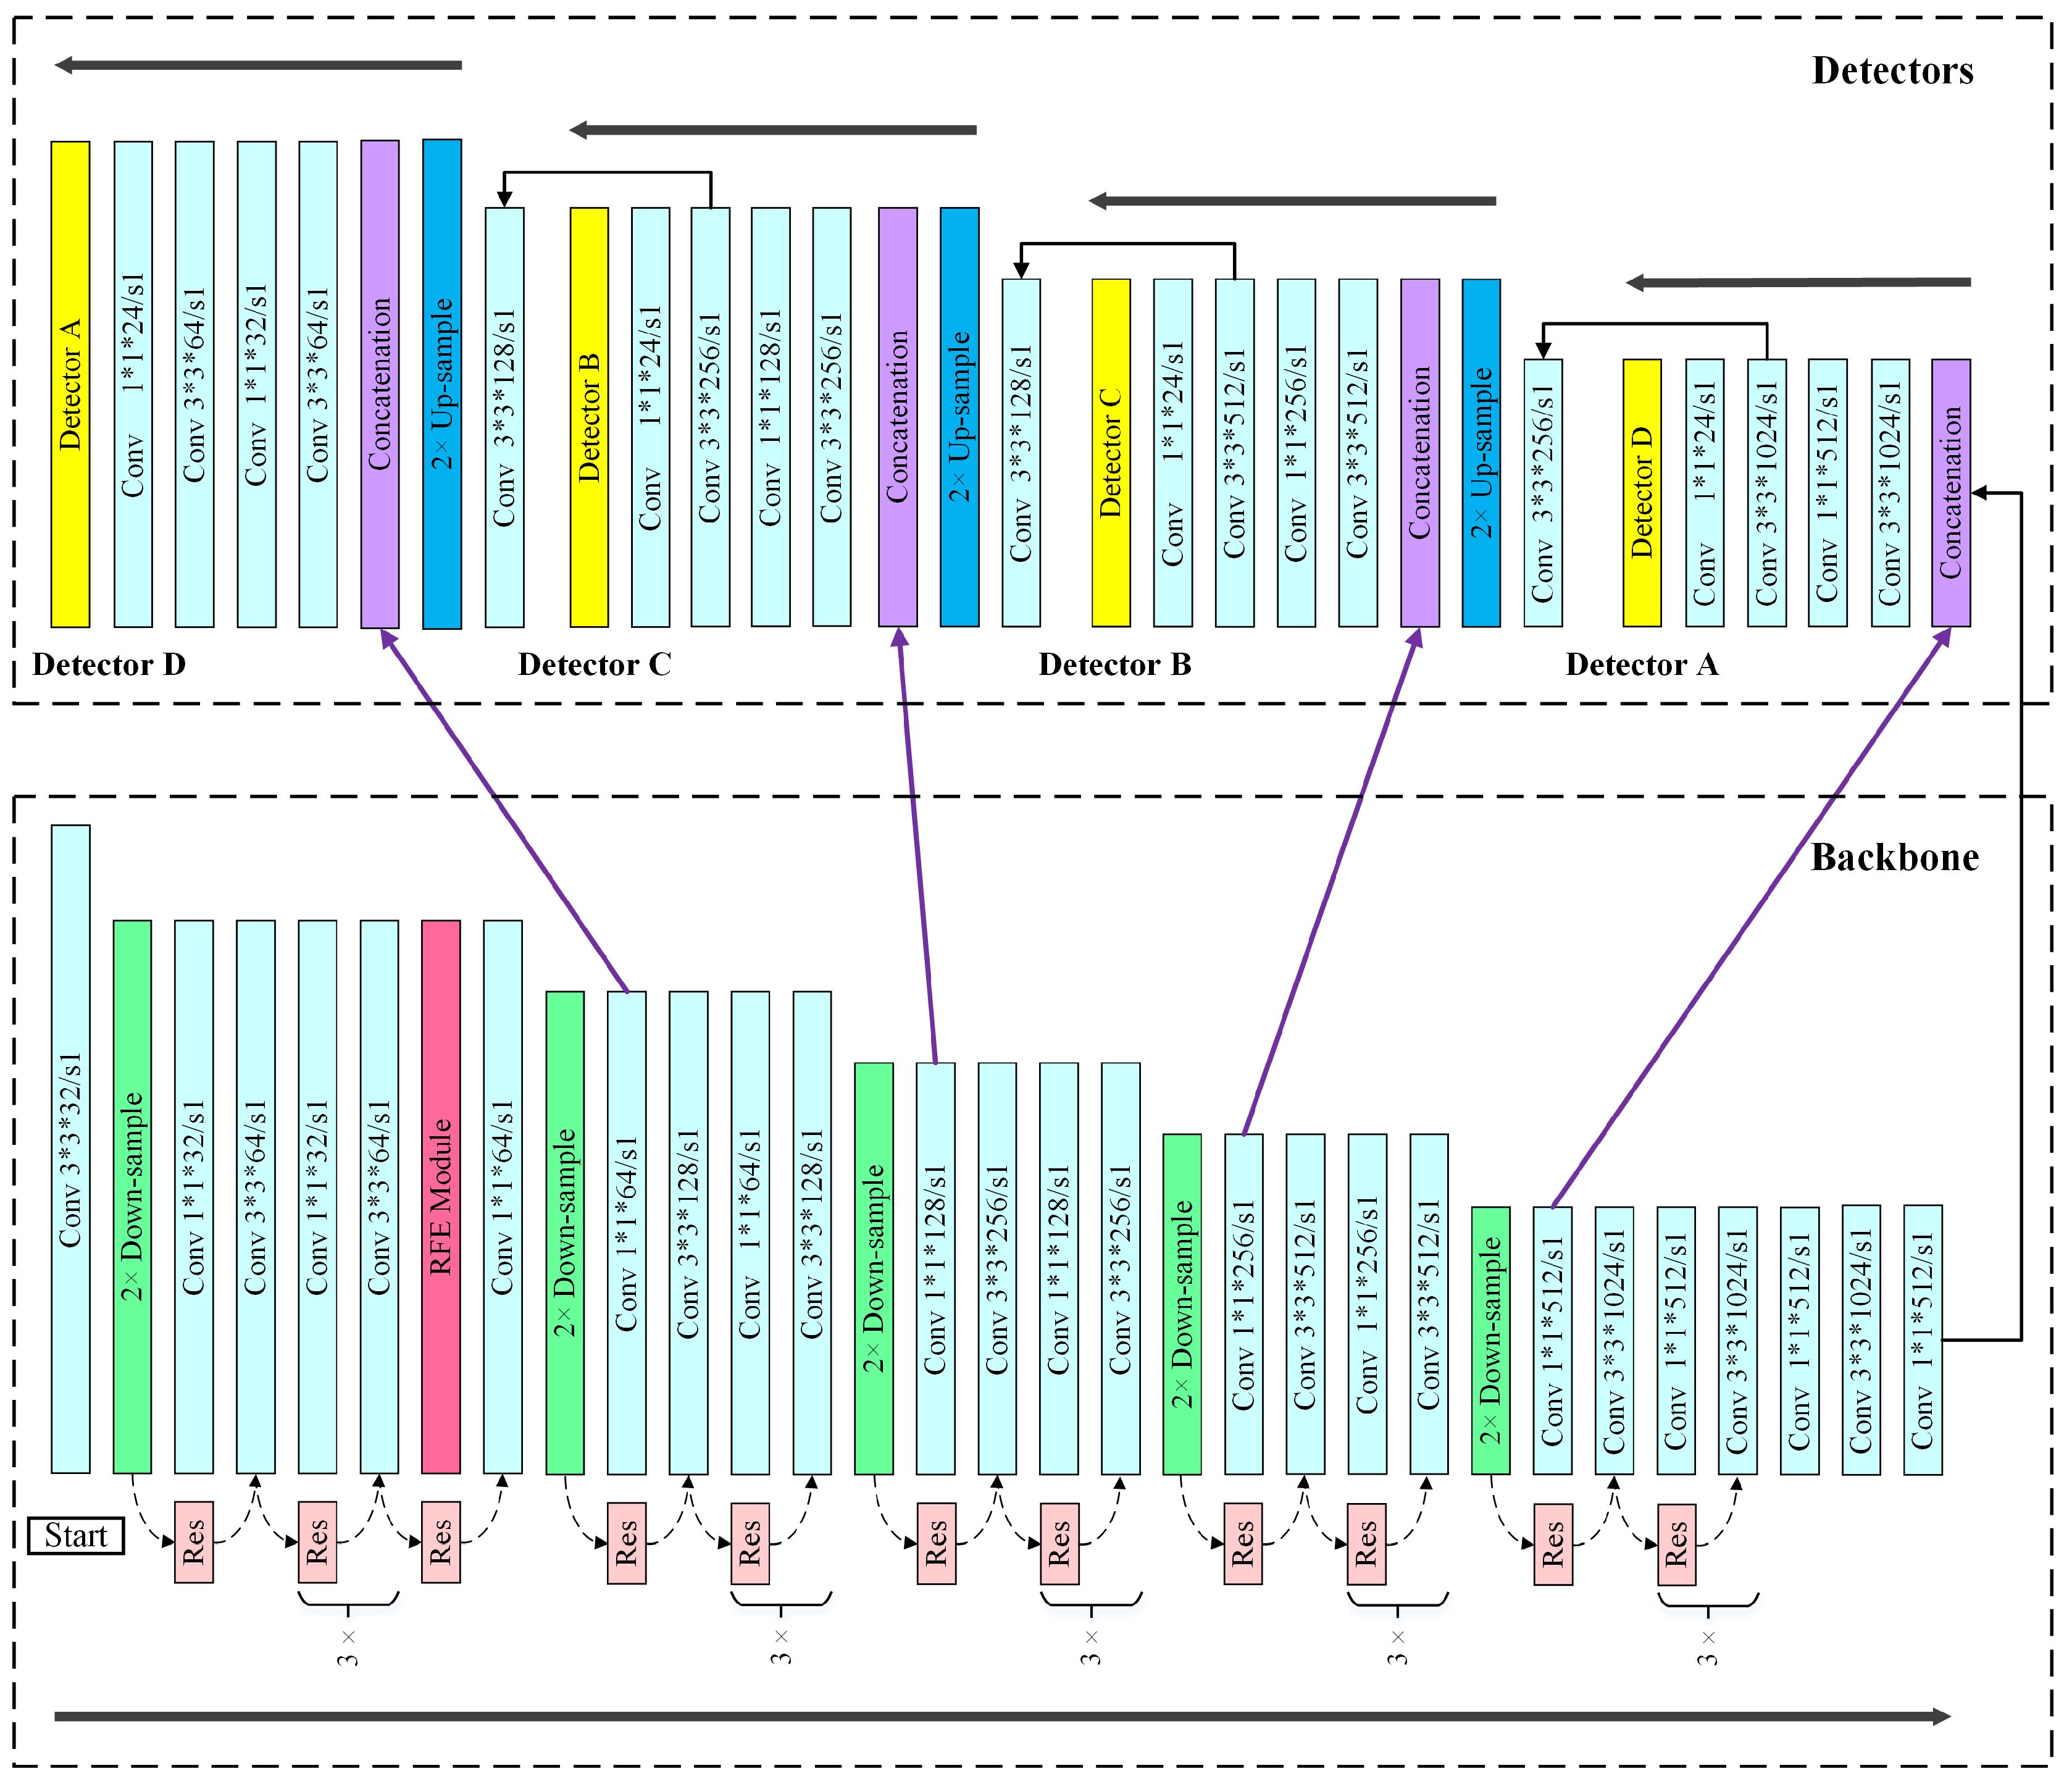
Considering the characteristics of small objects, we put the focus of NEOON on constructing a backbone that could capture feature information of small objects as much as possible. As a fully convolutional network, the backbone of NEOON is designed as shown in Figure 4, which has used more than 50 convolutional layers through continuously repeating convolutional layer with 3 × 3 size kernel and subsequent convolutional layer with 1 × 1 size kernel.
Specifically, the backbone, as a partly symmetrical structure, is implemented by a series of down-sampling operations and corresponding up-sampling operations to achieve bottom-up processing and top-down processing. In detail, both down-sampling operations achieved by the convolutional operation and up-sampling operation achieved by the bilinear interpolation is repeated five times respectively in total. Meanwhile, successive residual modules are interspersed into the backbone for every two or three convolutional layers to accelerate and optimize the fitting process of the model, which also helps NEOON extract features better progressively and effectively.
2.2.2. Feature Fusion
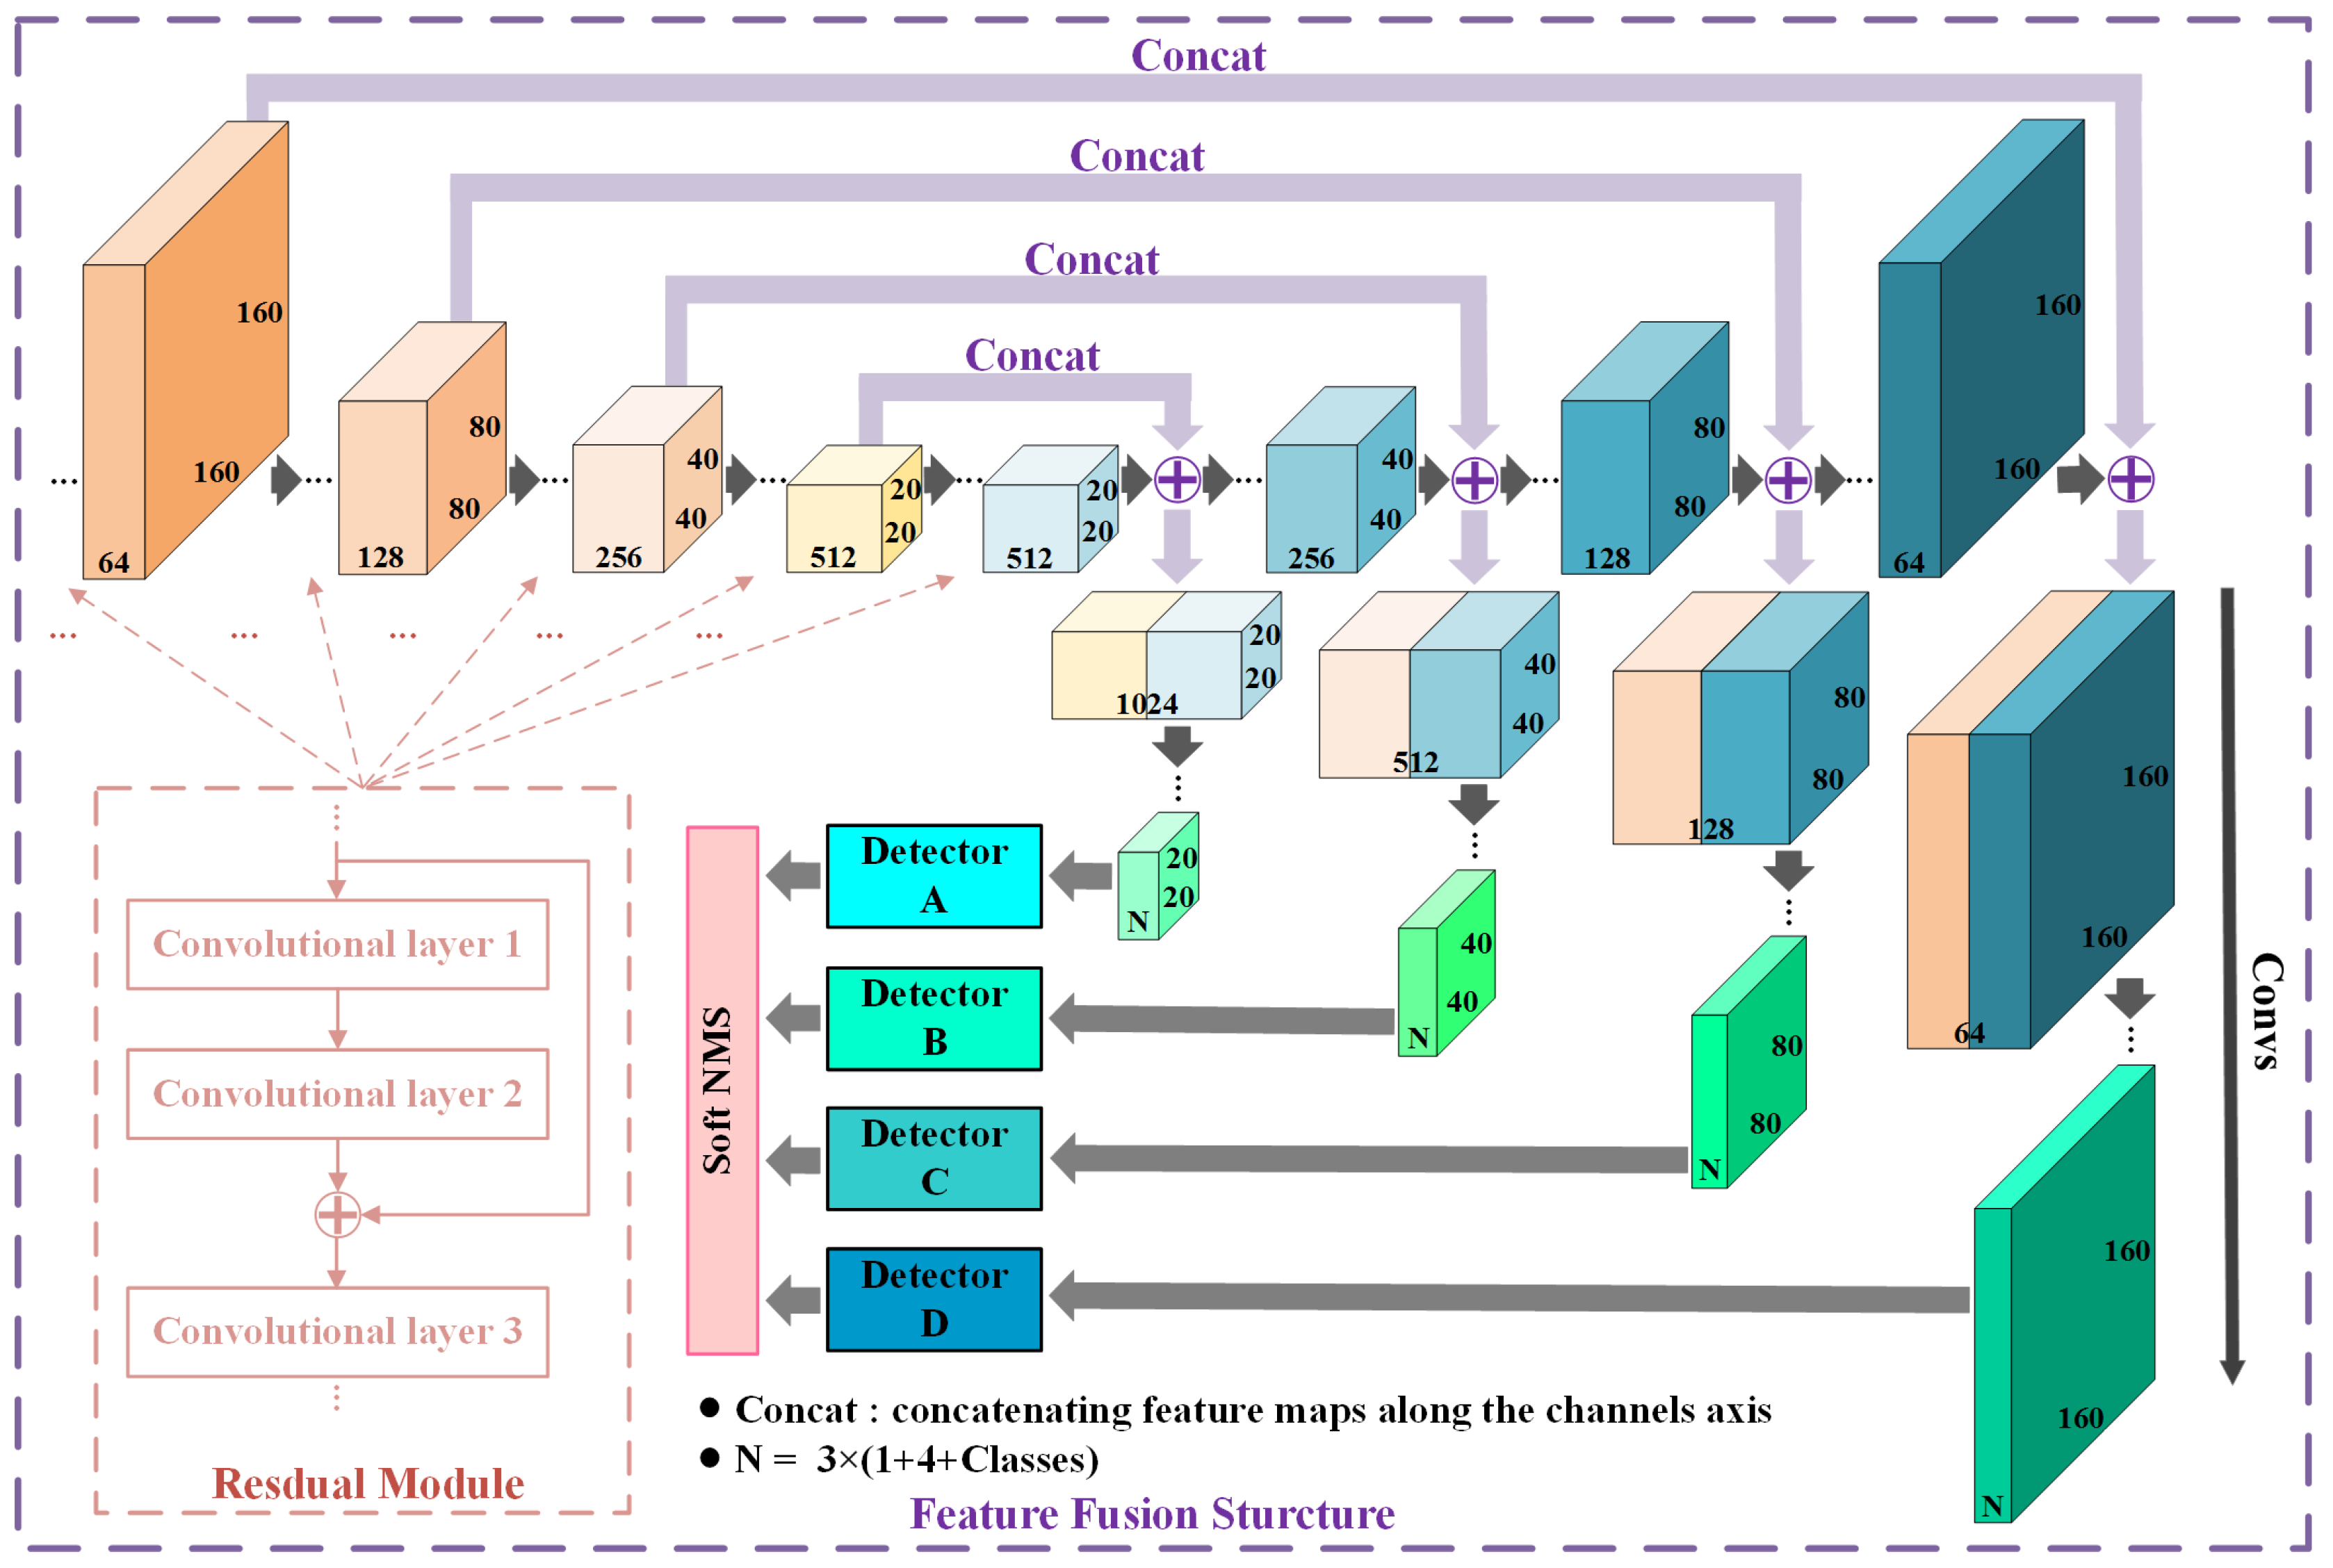
According to Section 2.1, it is a significant but tough problem to make the feature information of small object free from loss or even disappearance in a deep convolutional network. While the top-down and bottom-up processing could help model capture features across several scales to some degree, it is still not enough to deal with this problem. So it is necessary to build off connections more directly between the front and the posterior sections of the whole network.
Therefore, we divide the convolutional layers of backbone into two equal sections in order and pair the two corresponding convolutional layers located at the former section and the latter section respectively. Specifically, the two layers of a pair output feature maps of the same size as 160 × 160, 80 × 80, 40 × 40 and 20 × 20 severally when the size of the input image is 640 × 640.
Obviously, there are four pairs of convolutional layers built off in NEOON (see Figure 5). We establish a connection between the two layers of a pair through concatenating their outputs firstly and then fuse these feature maps by convolutional operations, all four parallel. In this case, the feature maps before being transmitted into detectors will contain both more detailed information and sufficient semantics of small objects.
Therefore, this kind of fusion method allows NEOON to get more meaningful semantic information from the upsampled features and finer-grained information from the earlier feature map at the same time.
Note that the multi-scale structure of NEOON is different from FPN [46] and PSPNet [64] in details. Specifically, the feature fusion is achieved by concatenation in NEOON instead of element-wise addition in FPN [46]. In addition, the down-sampling is achieved by convolution in NEOON rather than pooling in PSPNet [64].
2.2.3. Feature Enhancement
According to the analysis in Section 3.1, the distinctive information of small objects is gradually lost through layer-by-layer convolutional operations, especially for NEOON with a backbone consisting of more than 50 convolutional layers. While feature fusion structure is constructed in NEOON to preserve features information of the first few layers, the features of small objects will still fade in the deep layers.
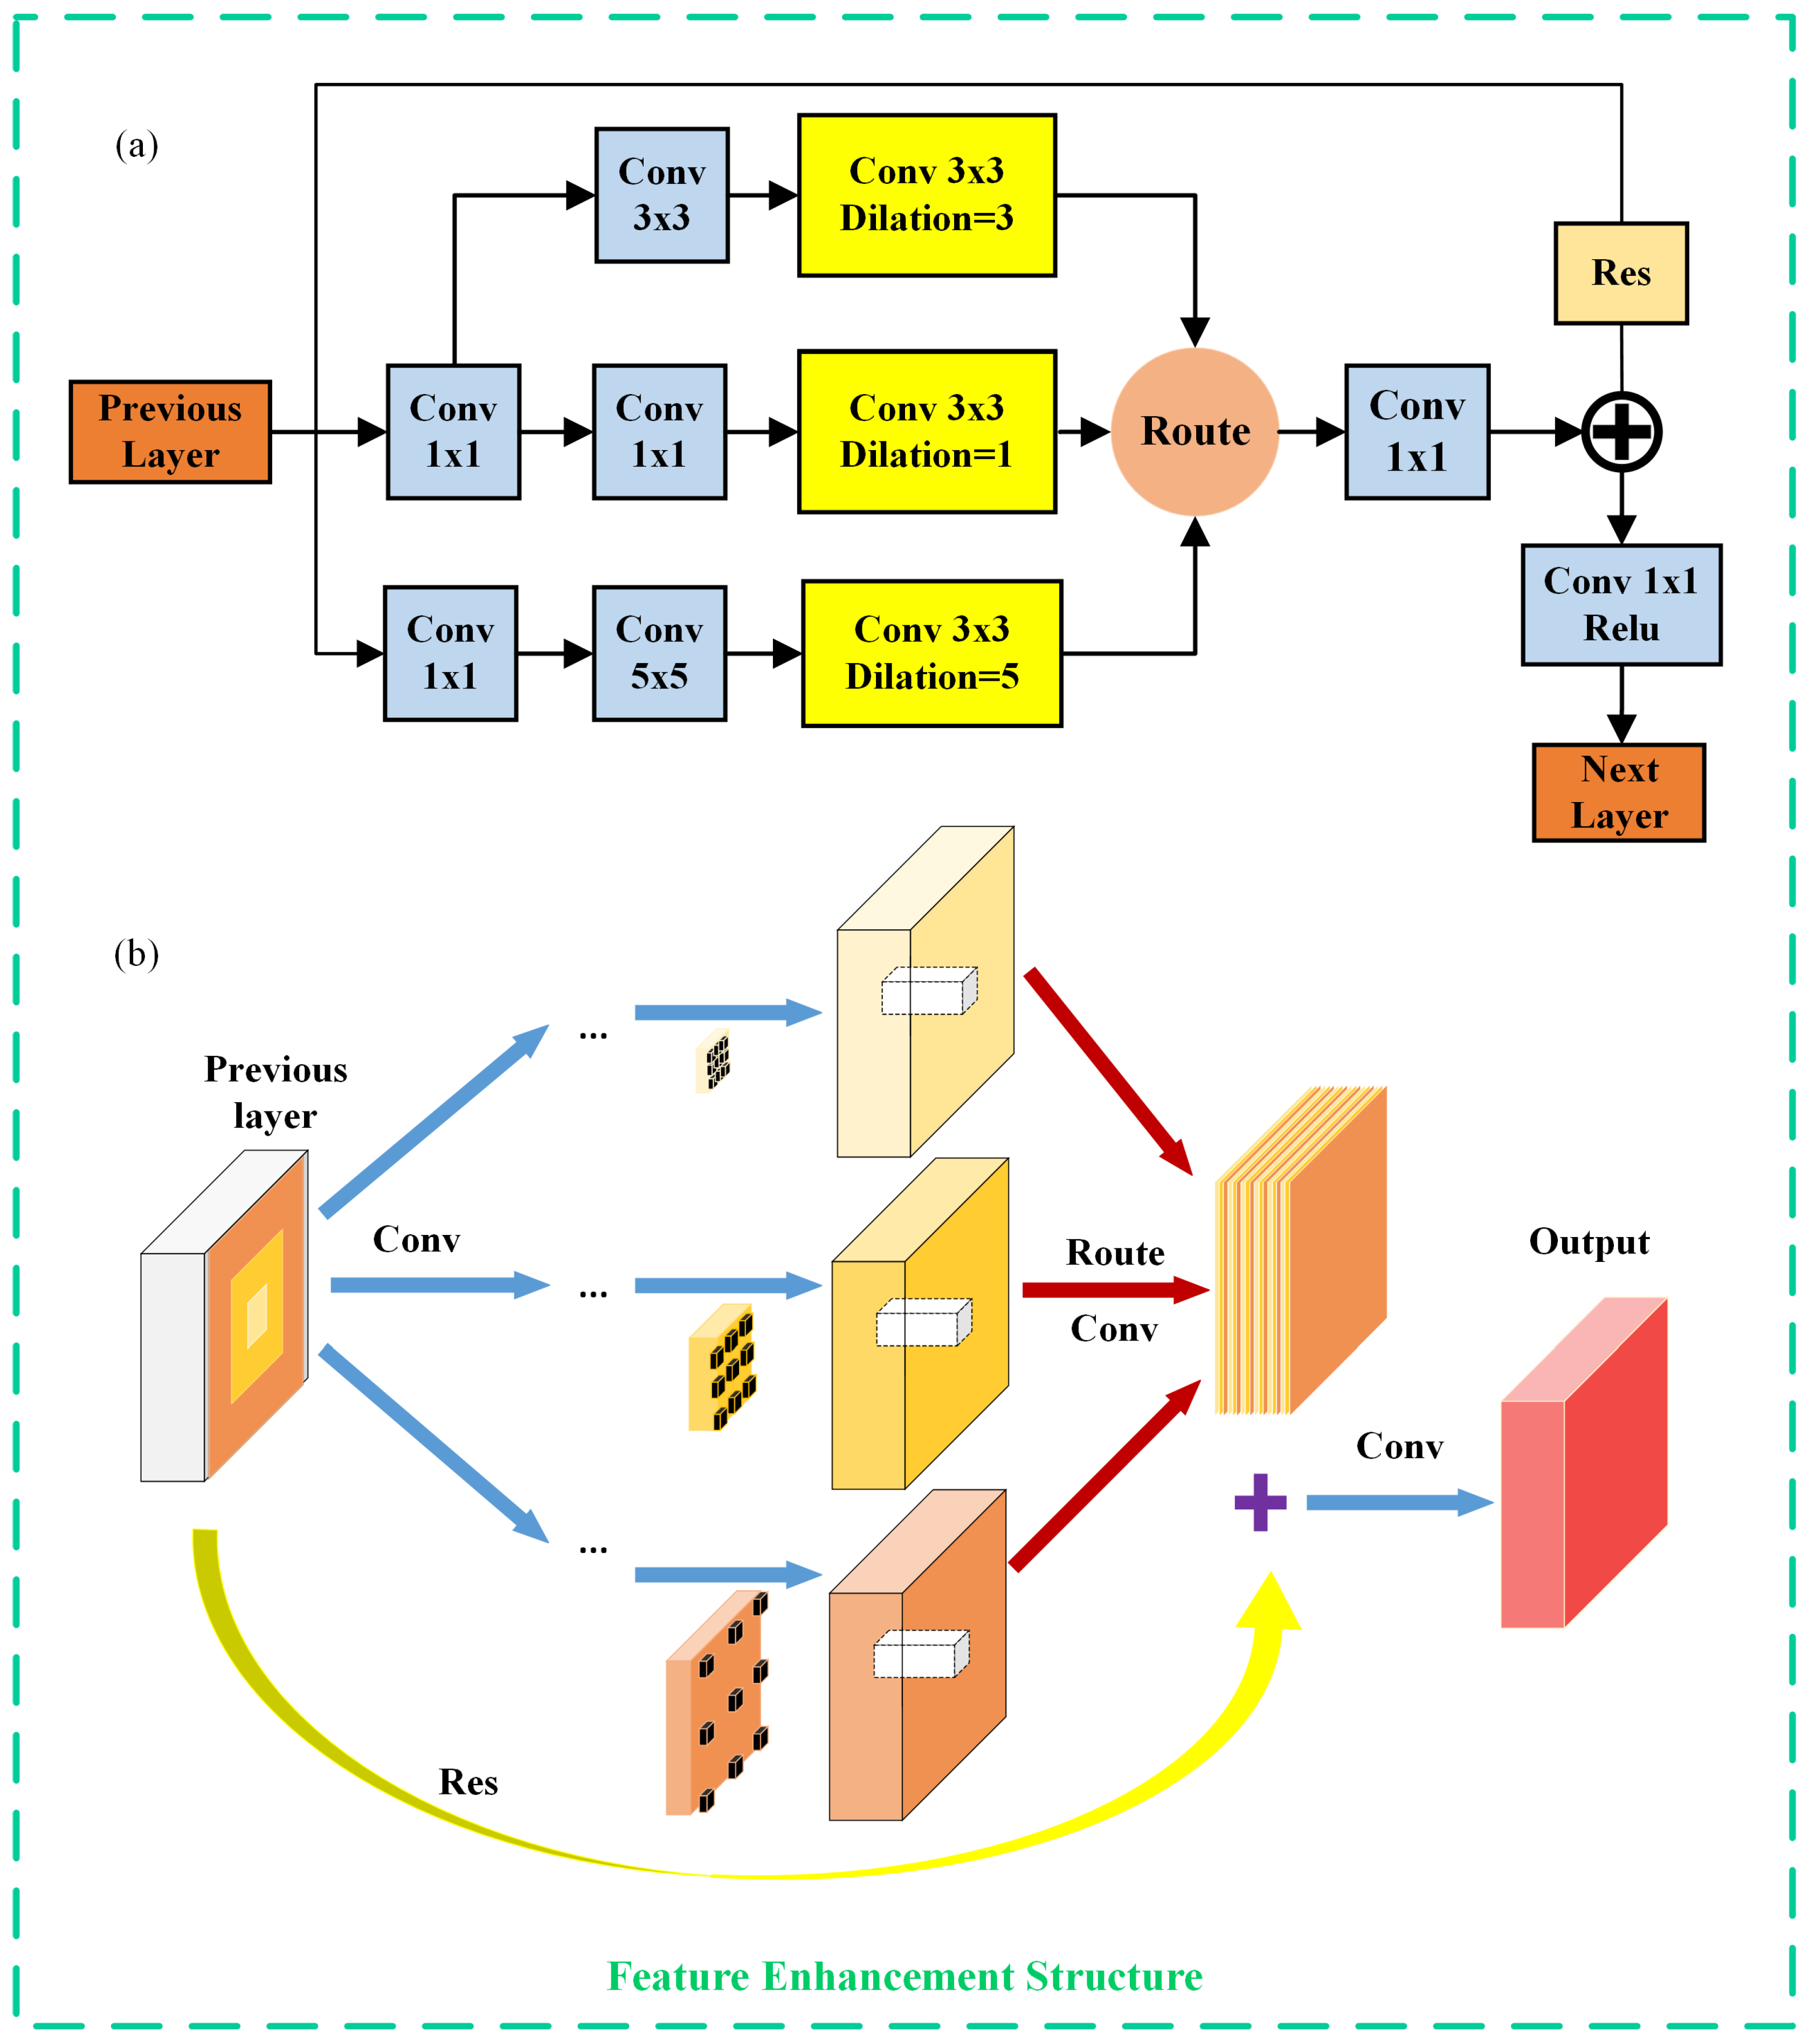
Therefore, we construct a Receptive-Filed Enhancement (RFE) module (see Figure 6) to maximize the low-level features of small objects by combining convolutional operations with different scales.
In detail, RFE module (see Figure 6), modeling the structure of receptive-fields(RFs) in human visual systems [61] to generate more discriminative and robust features, consists of a multi-branch convolutional layer with kernels of different sizes and the trailing dilated convolutional layers (also named astrous convolutional layers). In the above settings, the former is to apply different convolutional kernels to build multi-size RFs and the latter is to generate feature maps of a higher resolution, which helps capture features at a larger area with more context information.
Specifically, we add an RFE module in behind of the convolutional layer (see Figure 4 and Figure 7) outputting feature maps of 160 × 160 × 128 size (when input image size is 640 × 640), which is the one layer of the first layer pair (demonstrated in Section 2.2.2) consisting of two convolutional layers of same size distributed in the former section and the latter section respectively, to enhance feature information of small object as much as possible. Therefore, we suppose that detection accuracy for densely arranged small objects in remote sensing images tends to be improved with a decrease of missed or mistakenly detected cases in detection.
2.2.4. Multi-Scale Detection
In order to simultaneously obtain discriminative features and strong semantics of objects of various sizes, we set up four detectors of diverse sizes and sensitivities at the end of the aforementioned four parallel convolutional routes to adapt NEOON to different object sizes. In this way, detectors could take full advantages of both low-level and high-level features of small objects.
In the Darknet, each grid cell of the image divided by the detector is responsible for detecting objects that are falling into it. This mechanism was emphasized and executed in YOLO methods [22,23,24] and the dense grid is crucial for detecting densely arranged objects such as cars in parking lots.
Several densely arranged small objects may fall into the same grid when the input image is not divided densely enough, thus causing missed detection. To further avoid the occurrence of missing objects (falling into in the grid cell), we consider employing four detectors (instead of three in YOLOv3) with the increasingly larger size, which divides the image into the denser grid than YOLOv3 so that each grid cell is responsible for fewer than three objects.
Objectively, larger size (denser grid) of a detector is unnecessary for sparsely arranged objects such as airports but crucial for high-density scenes such as parking lots where the occurrence of missing objects may exist.
Therefore, the sensitivity of each detector is different. From the detector A to the detector D in Figure 7, the denser the grid the input image is divided into, the smaller the anchor boxes are predicted by each cell, which leads to the higher accuracy for densely arranged small objects. So, each of them plays a complementary role with each other in NEOON.
Note that each detector predicts a 3-dimension tensor encoding bounding box, confidence and class predictions, similarly to YOLOv3. Specifically, NEOON predicts 3 anchor boxes for each grid cell at each scale. In addition, the tensor finally predicted is N × N × [3 × (4 + 1 + C)] for the 4 box offsets, 1 confidence, and C class predictions. So, C should be set to 3 for ACS dataset and 10 for NWPU VHR-10 dataset.
2.3. Model Training
In practice, NEOON has followed several settings of YOLOv3 in detection mechanisms such as anchor boxes [24] and predicts both location and category information for bounding boxes simultaneously.
In general, NEOON predicts bounding boxes at 4 different scales corresponding to 4 detectors which are achieved by the last convolutional layers in four parallel branches described in Figure 5. Specifically, when the input image size is 640 × 640, it will be divided into a 20 × 20, 40 × 40, 80 × 80 and 160 × 160 grid by detector A, detector B, detector C, and detector D, respectively. For each grid cell, NEOON predicts 3 bounding boxes corresponding to 3 anchor boxes per grid cell. For each bounding box, the network predicts 4 coordinates, a confidence and C conditional class probabilities reflecting the possibility that the bounding box belongs to every category in C classes.
2.3.1. Overview
The final loss function adopted as Equation (1) in NEOON can be divided into 3 parts contributing to confidence, location, and classification respectively as follows.
Similar to YOLOv3 [24], NEOON only assigns one anchor box responsible for each ground truth object. If an anchor box is not responsible for a ground truth object it makes no loss for regression and classification (only confidence).
As for the confidence, NEOON predicts a confidence value for each bounding box using logistic regression and employ binary cross-entropy (BCE) to calculate the loss according to Equation (2). The confidence predicted should be 1, if the anchor box overlaps a ground truth object by more than any other anchor boxes. Meanwhile, that anchor box is assigned to predict a bounding box for the specific ground truth object, and the value of corresponding to the anchor box will be set to 1 (or 0 in other cases). If the anchor box is not the best but does overlap a ground truth by more than a threshold we ignore the prediction [24].
where as well as denotes if the anchor box j of grid cell i overlaps a ground truth object by more than any other anchor boxes or not but does overlap one object by more than a threshold of . The threshold is set to 0.5 which is the same as YOLOv3.
2.3.2. Regression
Similarly to YOLOv3 [24], NEOON predicts 4 coordinates for each bounding box, , , , and employ the sum of squared error (SE) to calculate the loss.
We suppose the grid cell is offset from the top left corner of the image by (, ) and the anchor box has normalized width and height , . In this case, the normalized coordinates representing the center of the box relative to the bounds of the grid cell can be calculated according to Equation (3). In a similar way, the representing the normalized width and height of the box are predicted relative to the whole image can be calculated, which has been illustrated in Figure 2.
During training, we use the sum of squared error loss for regression as follows.
where is adopted to improve the punishment for small objects which are more sensitive to location information than large objects.
2.3.3. Classification
As we know, one-stage methods usually have an advantage over two-stage methods in terms of running speed, but on the contrary, they are slightly inferior in detection accuracy. The proposed NEOON is no exception.
According to the research of [60], the extreme imbalance between foreground and background classes during training is the main reason for the accuracy decline of one-stage methods. That is to say, the vast number of easy negatives have overwhelmed the optimization direction of one-stage models during the training process.
On this basis, the Focal Loss [60] is introduced as the loss function for classification to address the class imbalance problem of one-stage detection algorithm including NEOON. Specifically, as described in [60], we reshape the standard cross entropy loss to eliminate the loss contribution from easy examples (i.e., objects could be well-classified).
As for classification, NEOON uses independent logistic classifiers as the same as YOLOv3 [24]. During training, NEOON employs the Focal Loss (see Equation (6)) rather than binary cross-entropy (see Equation (7)) in YOLOv3 for the class predictions.
where, parameter y represents the label class k and parameter predicts the probability of the bounding box with label class k.
Next, we will demonstrate how the Focal Loss is introduced and works in NEOON.
The binary cross entropy (BCE) loss function for binary classification as follows.
To simplify the above function, parameter is defined as follows.
Substituting into Equation (7), CE loss function can be rewritten as follows.
Then, we introduce the factor for class k as well as for other classes and define as follows.
Meanwhile, a factor with adjustable parameter is introduced to the loss function.
Specifically, the Focal Loss [60] is defined as follows.
Therefore, the final form of can be determined as follows.
In Equation (10), the parameter balances the influences from positive and negative examples on model optimization during the training process. Furthermore, factor down-weights easy examples in loss function so thatthe model could focus on training on hard negatives, which helps NEOON differentiate easy and hard examples more accurately. Note that we set and in NEOON for optimal performance, which makes a positive influence on the improvement of detection accuracy.
2.4. Post-Processing
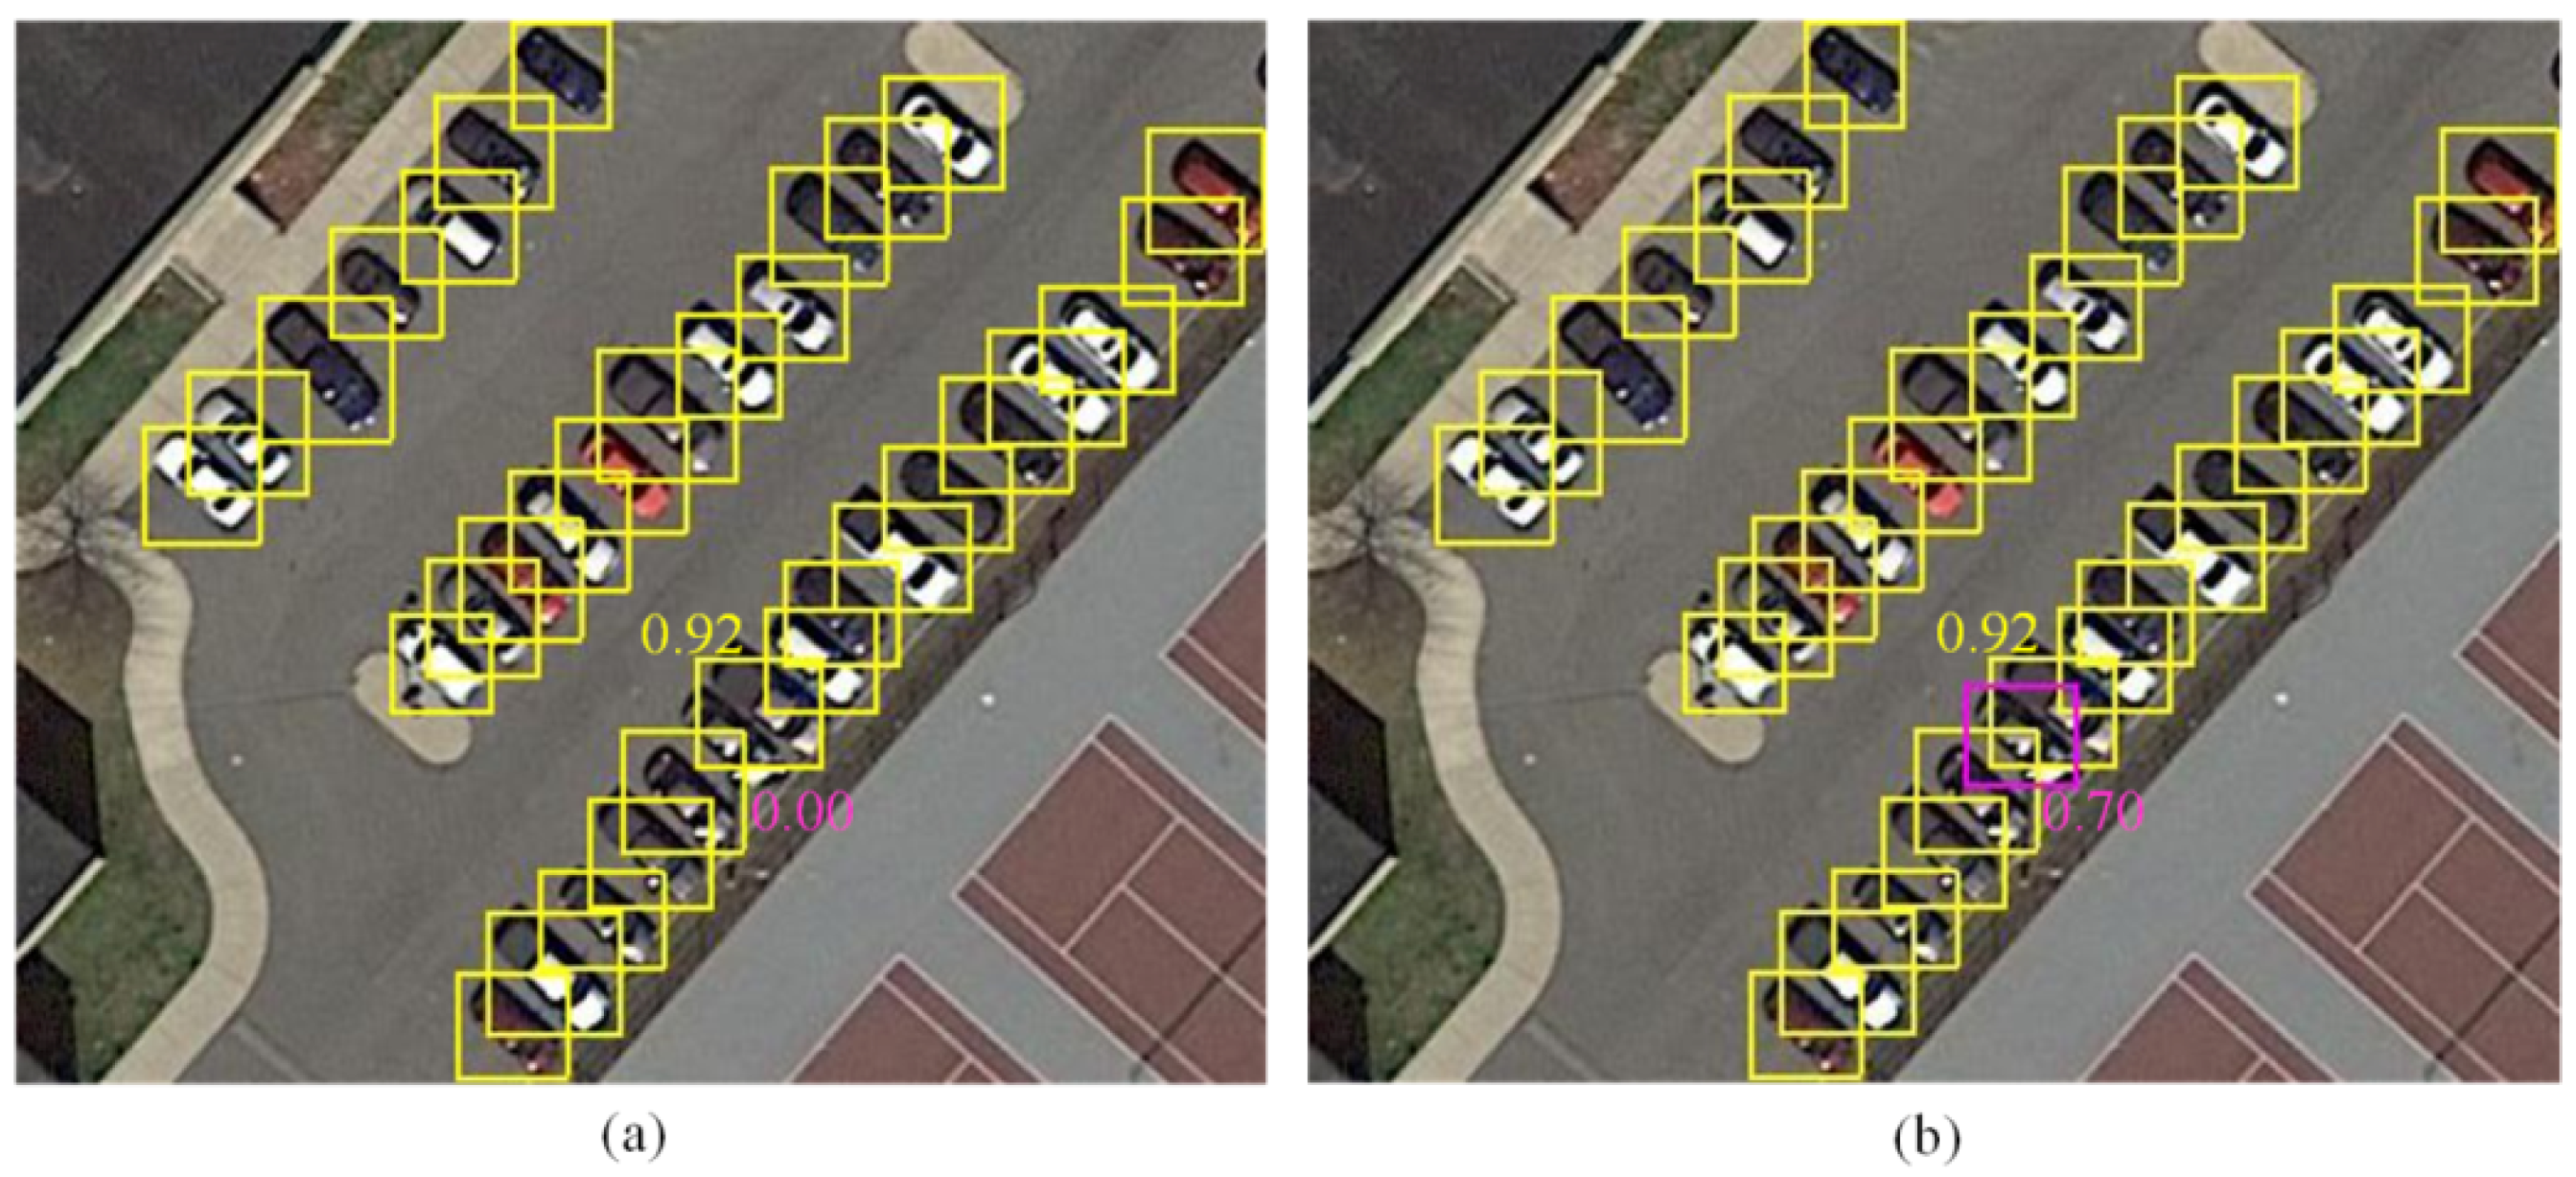
In remote sensing imagery, detecting densely arranged objects of different sizes confronts a challenge: one of the two different bounding boxes of the two objects, which are very close together, is likely to be mistakenly filtered out by the non-maximum suppression (NMS) operation because of their high intersection-over-union (IOU) value. Specifically, one of the two boxes which have a lower confidence score will be regarded as a false detection result by the NMS in this case (see Figure 8a).
Different from traditional NMS, the Soft-NMS chooses to replace the original score with a slightly lower score instead of directly zeroing the confidence score of the bounding box. In detail, we modify the code of the Soft-NMS to make it suitable for the Darknet framework. For the bounding box , if the IOU between and , which has higher confidence score than , is greater than a fixed threshold , the IOU value will be calculated according to the following equation to compute and set the final confidence score of .
where the parameter is set to 0.5 instead of 0.3 in [61] in order to make the performance in mAP more relatively stable.
3. Experimental Settings and Implementation Details
To verify the performance of the proposed NEOON, we conduct a series of confirmatory experiments in this work.
In order to further evaluate the proposed method, we have applied some prevalent and widely utilized evaluation indicators including the Average Precision (AP), the Recall and the mean Average Precision (mAP), which are extensively adopted for the object detection frameworks. Besides, the Intersection-over-Union (IOU) is also calculated as a metric to measure location accuracy. Note that the mAP computes the average value of all the AP values, which reflects the performance of a detector for all the classes.
Then we will demonstrate the dataset adopted in this work, the compared methods and some implementation details including the split and merge strategy and the multi-scale training strategy in this section.
3.1. Dataset
For reliable evaluation and verification of the proposed method, two datasets are used in our experiments. The first one is ACS dataset built in this work, which is introduced in Section 3.1.1 in detail. The second one is the NWPU VHR-10 dataset [45,58,59] which contains 10 geospatial object classes. There are two image subsets in NWPU VHR-10 dataset: a positive set including 650 annotated images and a negative set including 150 images without any objects of interested [33].
3.1.1. Acs Dataset
We construct ACS dataset as a collection of five public datasets including DOTA (http://captain.whu.edu.cn/DOTAweb/) [65], UCAS-AOD (http://www.ucassdl.cn/resource.asp), NWPU VHR-10 (http://jiong.tea.ac.cn/people/JunweiHan/NWPUVHR10dataset.html) [45,58,59], RSOD (https://github.com/RSIA-LIESMARS-WHU/RSOD-Dataset-) and LEVIR (http://levir.buaa.edu.cn/Publication.htm), which consists of three representative categories, i.e., airplane, car and ship. It is worth noting that we have specially eliminated the images containing incomplete objects and their labels. For convenience, the constructed dataset is named as ACS dataset which is an abundant and effective large-scale dataset for remote sensing object detection.
Specifically, there are 4159 remote sensing images in the ACS dataset with a total of 27,438 independently labelled objects, consisting of 13,082 airplanes, 4843 cars and 9513 ships as listed in Table 1. It is not necessary for data augmentation before starting the training process because the ACS dataset is large and abundant enough. We randomly divide the dataset into a training set as well as a validation set by 3:1 to ensure that the objects of each category are averagely distributed in the training set and the validation set with this proportion.
Note that the airplane, car, and ship are the most meaningful three categories for remote sensing. In addition, challenges still exist for ACS dataset even though there are only three classes because of the following two main reasons:
- Images in ACS dataset are collected with multiple resolutions and viewpoints leading to multiple scales and angles respectively of similar objects.
- Objects of these three classes occupying fewer pixels than other classes such as bridges or basketball courts and so on.
It is worth mentioning that several existing geospatial datasets mostly focus on one object category, such as the Aircraft dataset, the Aerial-Vehicle dataset, and the High Resolution Ship Collections 2016 (HRSC2016) for ship detection [33].
3.1.2. Nwpu Vhr-10 Dataset
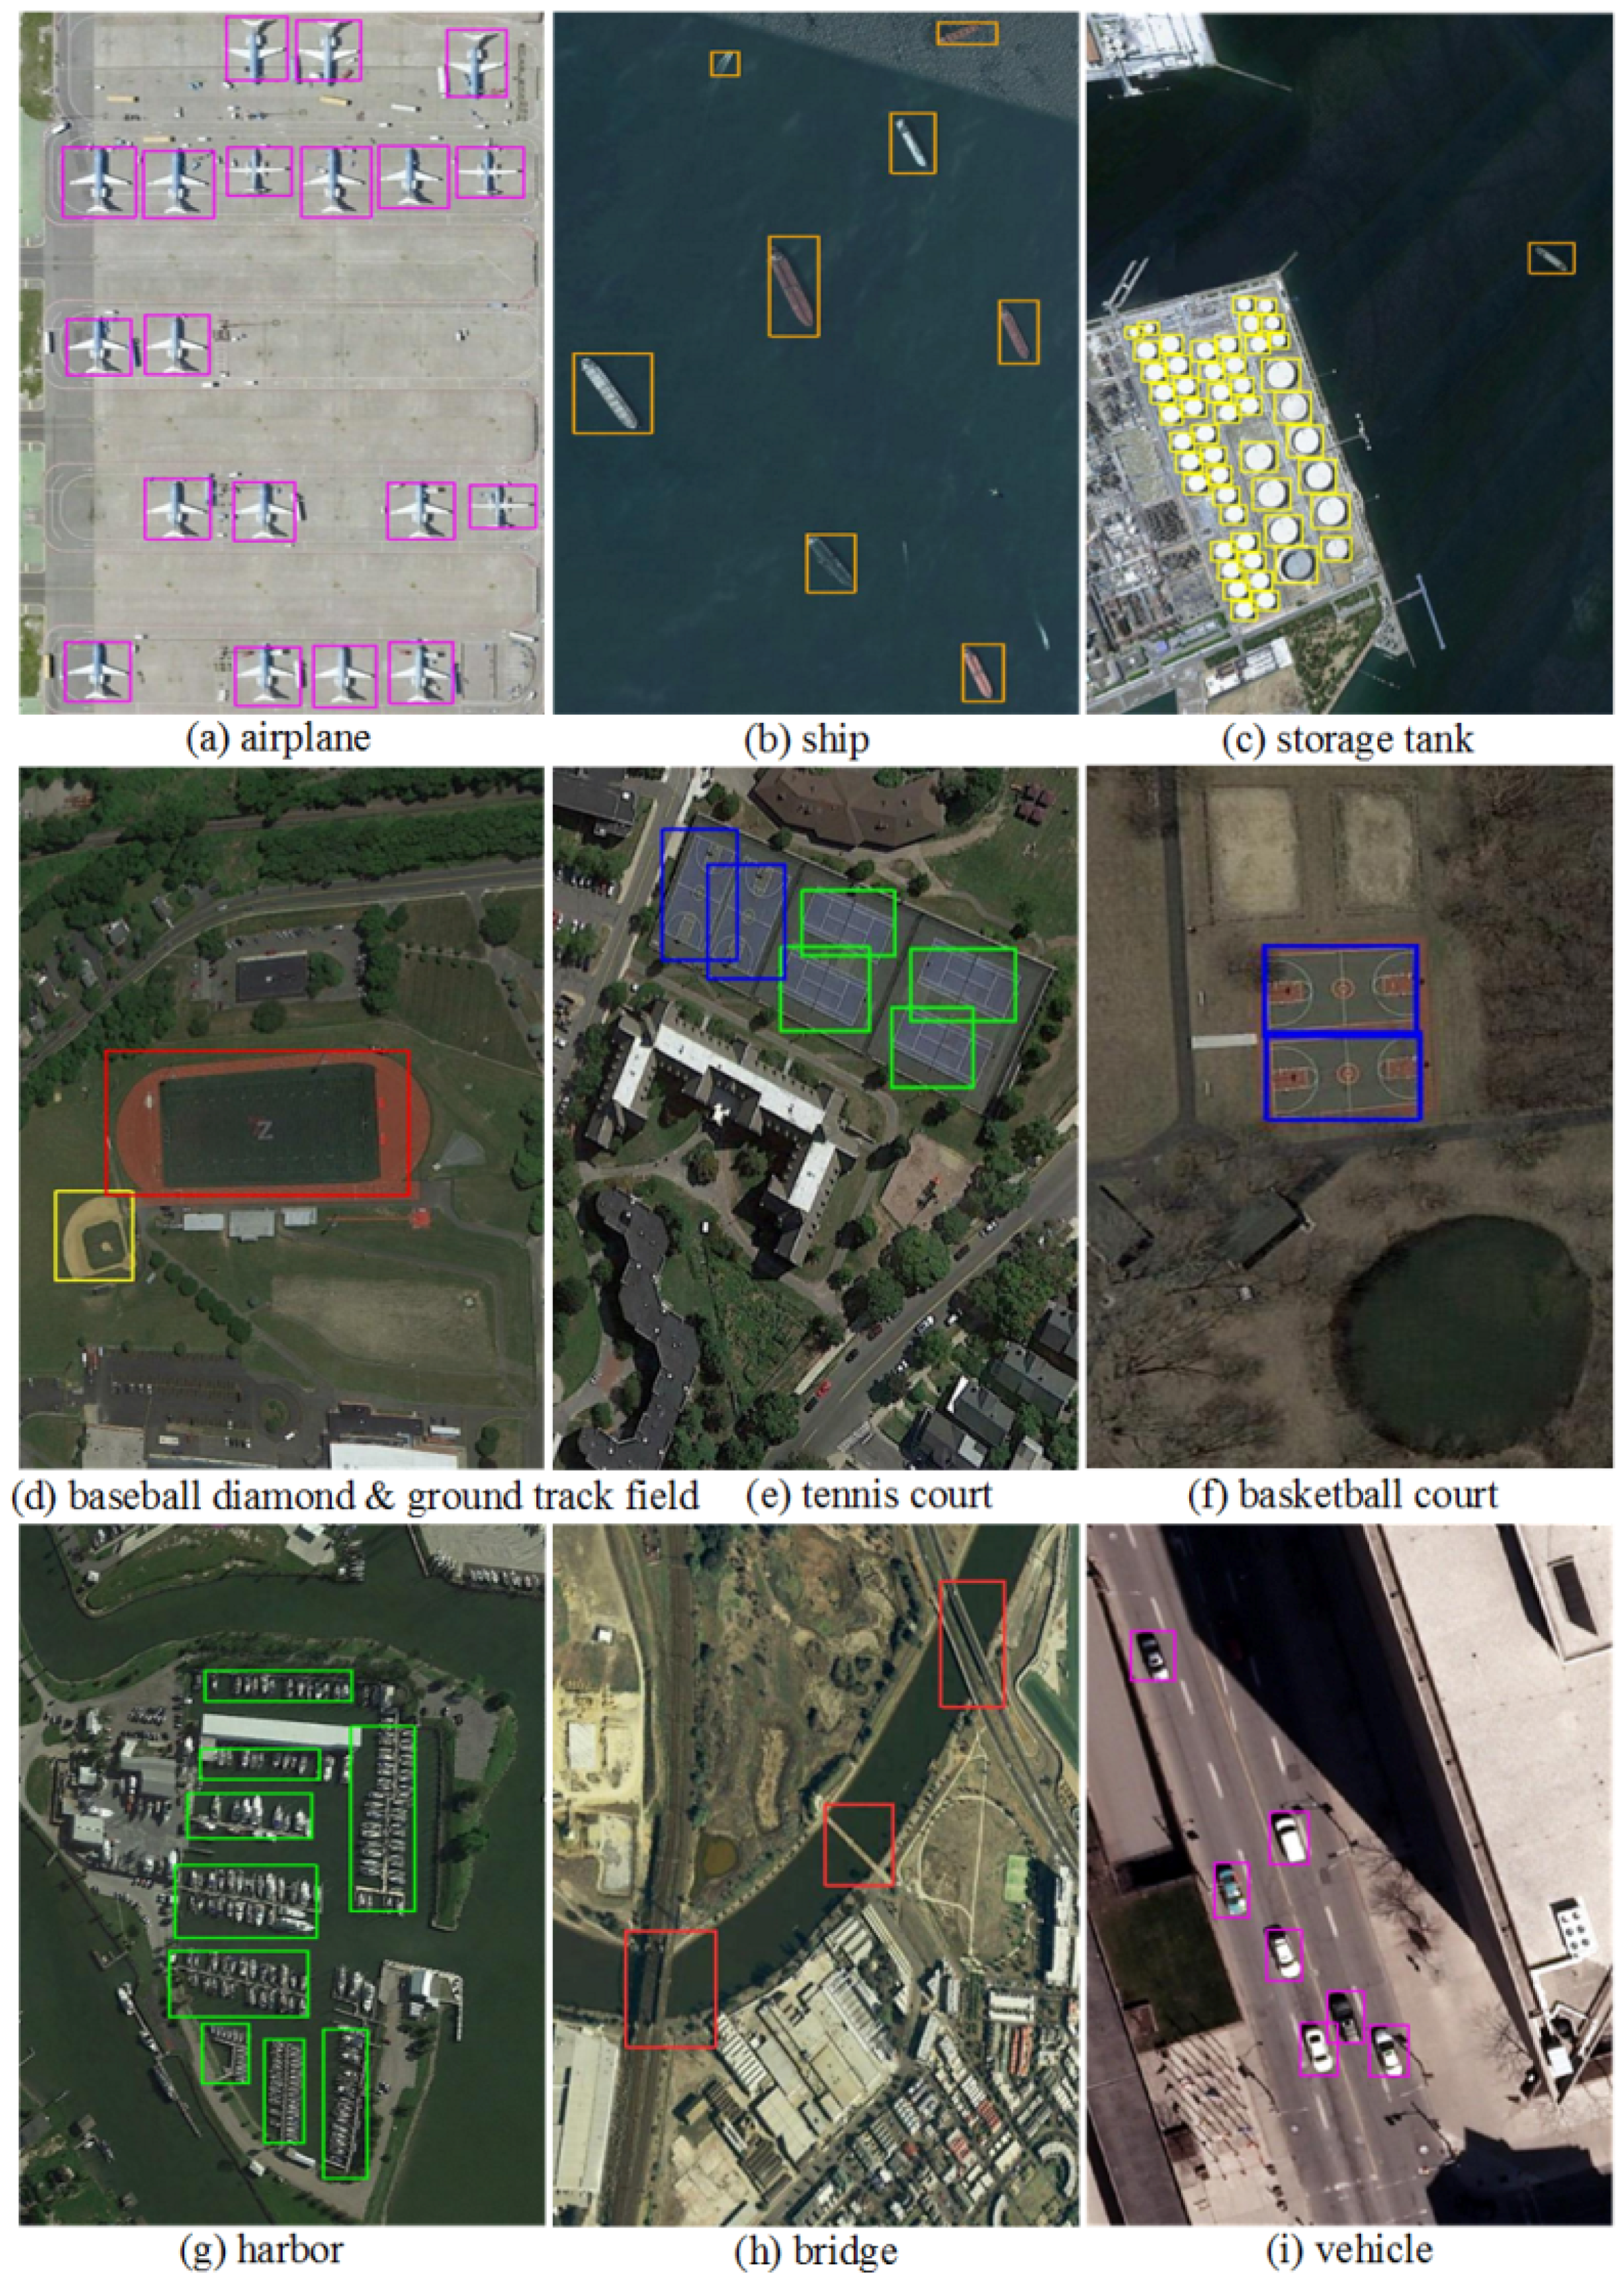
The other dataset adopted in this work to evaluate the performance of NEOON is the NWPU VHR-10 dataset [45,58,59] consisting of a positive image set including 650 images and a negative image set including 150 images. NWPU VHR-10 dataset contains 10 classes of geospatial objects, including airplane, ship, storage tank, baseball diamond, tennis court, basketball court, ground track field, harbor, bridge, and vehicle.
3.2. Baseline Method and Compared Methods
To quantitatively evaluate NEOON, we compared it with five methods including the collection of part detector (COPD) [59], the YOLOv2 [23], the rotation-invariant convolutional neural network (RICNN) [58], the SSD [25], and the R-P-Faster R-CNN [39] as follows.
- CPOD, which is made up of 45 seed-based part detectors. Each part detector is a linear support vector machine (SVM) classifier and corresponds to a particular viewpoint of an object class, therefore the collection of them providing a solution for rotation-invariant object detection.
- YOLOv2, in which anchor priors and multi-scale training techniques are applied to predict location candidates. The Darknet-19 is used to extract object features, which has 19 convolutional layers, 5 max-pooling layers, and no fully connected layers.
- RICNN, which is achieved by learning a new rotation-invariant layer on the basis of the Alexnet to deal with the problem of object rotation variations.
- SSD, in which small convolutional filters are applied to each feature map to predict box offsets and category scores rather than fully connected layers in region-based methods. Additionally, SSD uses multi-representation that detect objects with different scales and aspect ratios.
- R-P-Faster R-CNN, which integrates the region proposal network and classification procedure through sharing the convolutional weights.
3.3. Implementation Details
In the training process, we use the batch size of 64 and train NEOON for 20k iterations for both the ACS dataset and the NWPU VHR-10 dataset. Meanwhile, the step-by-step strategy to decrease the learning rate is employed in the training procedure. Specifically, we set the initial learning rate to during the first 16k iterations, and then reduce it ten times per 2k iterations. In addition, all the experiments use the same set of IOU thresh, i.e., 0.5. Note that models were trained on a 64-bit Ubuntu 16.04 computer in which experimental environment contains an Intel Xeon E5-2650 v4 CPU with a NVIDIA Tesla K80 GPU with 11GB memory.
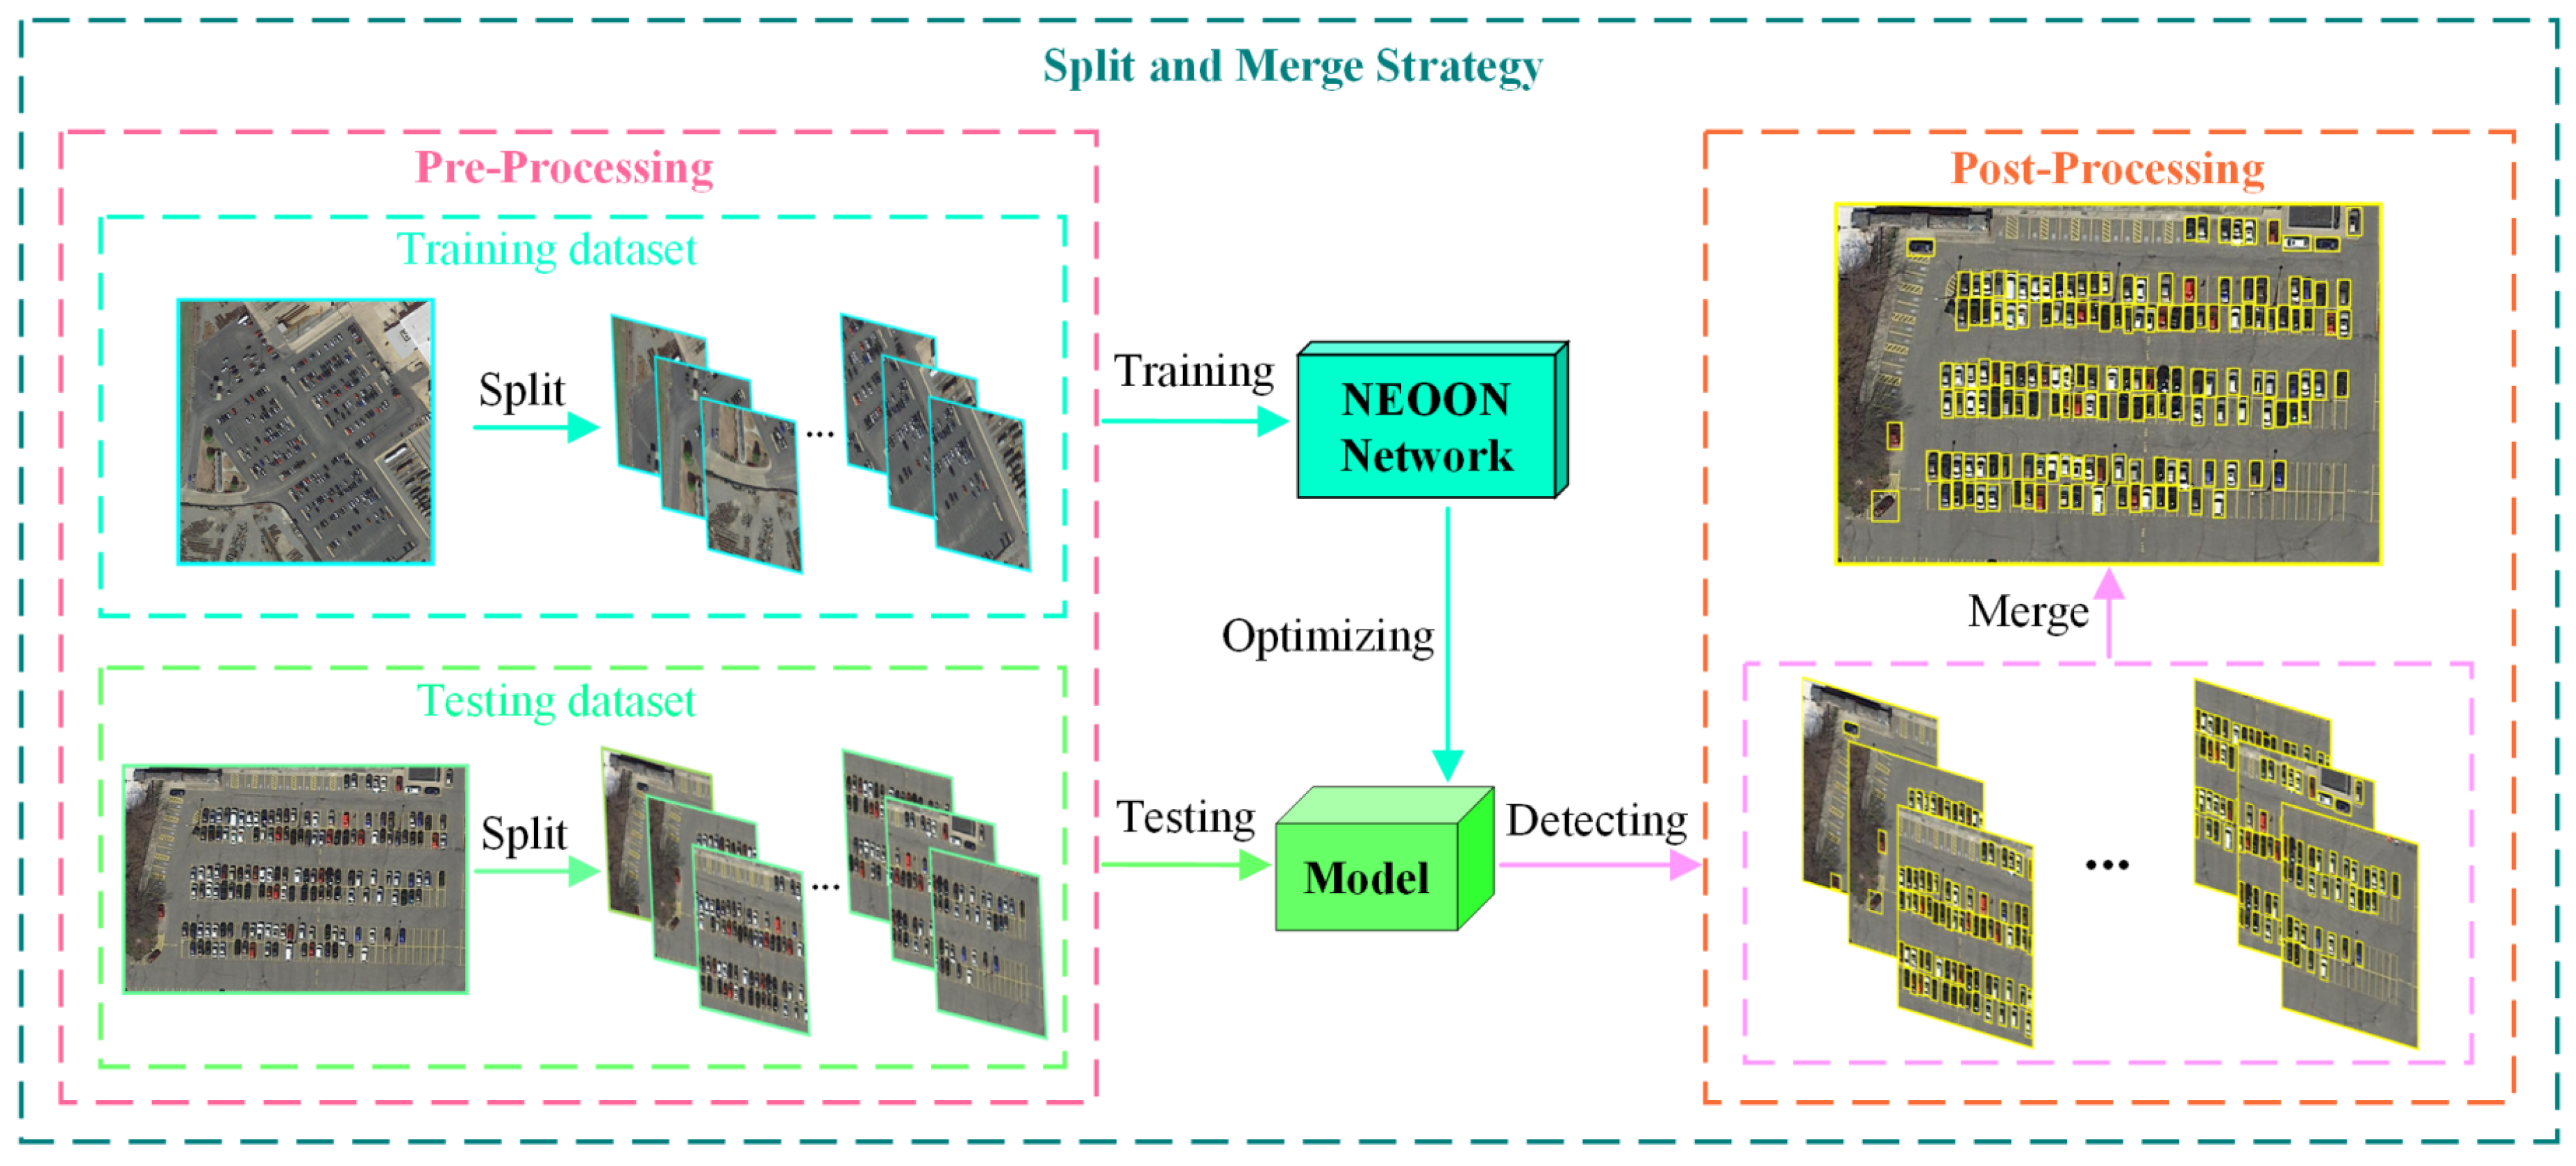
3.3.1. Split and Merge Strategy
As we mentioned earlier, small objects occupy very few pixels in remote sensing imagery with wide monitoring. Directly resizing and inputting the original image into the network may lead to the loss of features of small objects and make detecting difficult. Therefore, we employ multi-scale training strategies (see Figure 9) when utilizing the ACS dataset in order to increase the scale of the area occupied by small objects relative to the whole image.
Specifically, we split all the images of the ACS dataset into square chips with a size of 400 × 400 to 1000 × 1000 pixels, with a stride of 700 approximately. During the splitting process, some objects located at the edge of the image may be split into two incomplete parts. To overcome this problem, we eliminate the incomplete objects of which IOU (to the ground truth of their corresponding original objects) is less than 0.7.
Finally, the detection results consisting of each chip are merged to obtain the final result with the same size of the whole image. In this way, we can improve the detection accuracy of small objects, especially in regions where objects are quite small.
3.3.2. Multi-Scale Training Strategy
Remote sensing images are shot range from a few hundred meters to nearly 10,000 m and the ground objects are of varying sizes even for similar objects. In order to flexibly capture the multi-scale features of objects in remote sensing imagery, we introduce multi-scale training strategies, which makes the same network can predict detections at different resolutions.
In order to adapt the network to the average size of the images in the both ACS dataset and NWPU VHR-10 dataset, we set the standard input size of the NEOON with 640 × 640 pixels and then change the network every few iterations. Specifically, during the training procedure, we randomly resize the training images to 10 different scales between 480 and 832 per 10 iterations and then continue training, which forces the network to learn to predict well across a variety of input dimensions in remote sensing imagery.
4. Experimental Results and Analysis
The experimental results will be illustrated and analyzed in this section and the detection performance is measured by the mean Average Precision (mAP) and Recall in this work. Note that we consider a detection to be correct if its bounding box overlaps more than 50% with the bounding box of the corresponding ground truth. In addition, the Soft-NMS is applied to all the compared methods for fairness.
Obviously, all the proposed components of the optimization in NEOON have a positive improvement in the ACS dataset. Meanwhile, NEOON has shown better performance in NWPU VHR-10 dataset when compared what other advanced methods.
4.1. Results and Analysis on ACS
The quantitative comparison results are shown in Table 2, including the AP and Recall values of three categories, as well as the mAP of a comprehensive assessment.
As shown in Table 2 and Figure 10, NEOON achieves the best mAP value of 86.65%. Compared with the YOLOv3, NEOON achieves an average 8.51% improvement in of airplanes in validation dataset and the corresponding improvements of the cars and ships are 2.64%, 3.15%, respectively. Besides, NEOON obtains 4.77% performance gains in term of mAP, which demonstrates the effectiveness of our multi-scale feature fusion detector. As we can see, all the components play an positive role in improving performance in mAP, which especially improves detection results for small objects in remote sensing images. Note that the split and merge strategy improves the mAP by 23.67% in comparison with YOLOv3.
4.2. Results and Analysis on Nwpu Vhr-10
In order to further evaluate the effectiveness and generalization ability of NEOON, we also train it on NWPU VHR-10 dataset. The quantitative results of different methods are shown in Table 3, including the AP values of 10 categories and a an mAP measurement.
As can be observed in Table 3, in terms of mAP over all ten object categories, NEOON outperforms the COPD, the YOLOv2, the RICNN, the SSD, and the R-P-Faster R-CNN by 22.9%, 17%, 4.9%, 1.6%, and 1.0%, respectively. Especially, for airplane, ship, basketball court, bridge, vehicle, and so on, we obtain significant performance improvement, as shown in Table 3. These results demonstrate the high superiority of NEOON achieving better performance compared to the existing widely used methods in remote sensing object detection.
For the results, it can be illustrated: owe to the fully using of the low-level features of small objects and high-level semantic information, NEOON obtains a discriminative feature representation ability to effectively recognize objects in spite of the diversity and complexity of background information.
In addition, the Average Running Time compares the average running time of different methods when one image is tested. The results demonstrate that NEOON has a slight speed disadvantage compared to yolov2 and SSD, but it is still worthwhile if the advantages of NEOON in detection accuracy are taken into account.
Besides, the feature fusion structure provides more spatial structural information about objects so that more semantic information can be obtained to enhance the feature representation. In addition, the multi-scale training strategy makes the model more robust and provides better detection performance.
Based on the experiment results, it can be drawn that NEOON displays a superior detection performance especially for small scaled objects in remote sensing images. We also confirmed our intuition that the performance can be further boosted by the fully utilizing of the combination of the low-level and high-level information, which can contribute to a stronger object detector. In addition, some examples of detection results obtained by NEOON in NWPU VHR-10 are shown in Figure 12.
4.3. Fine-Grained Feature Impact Analysis
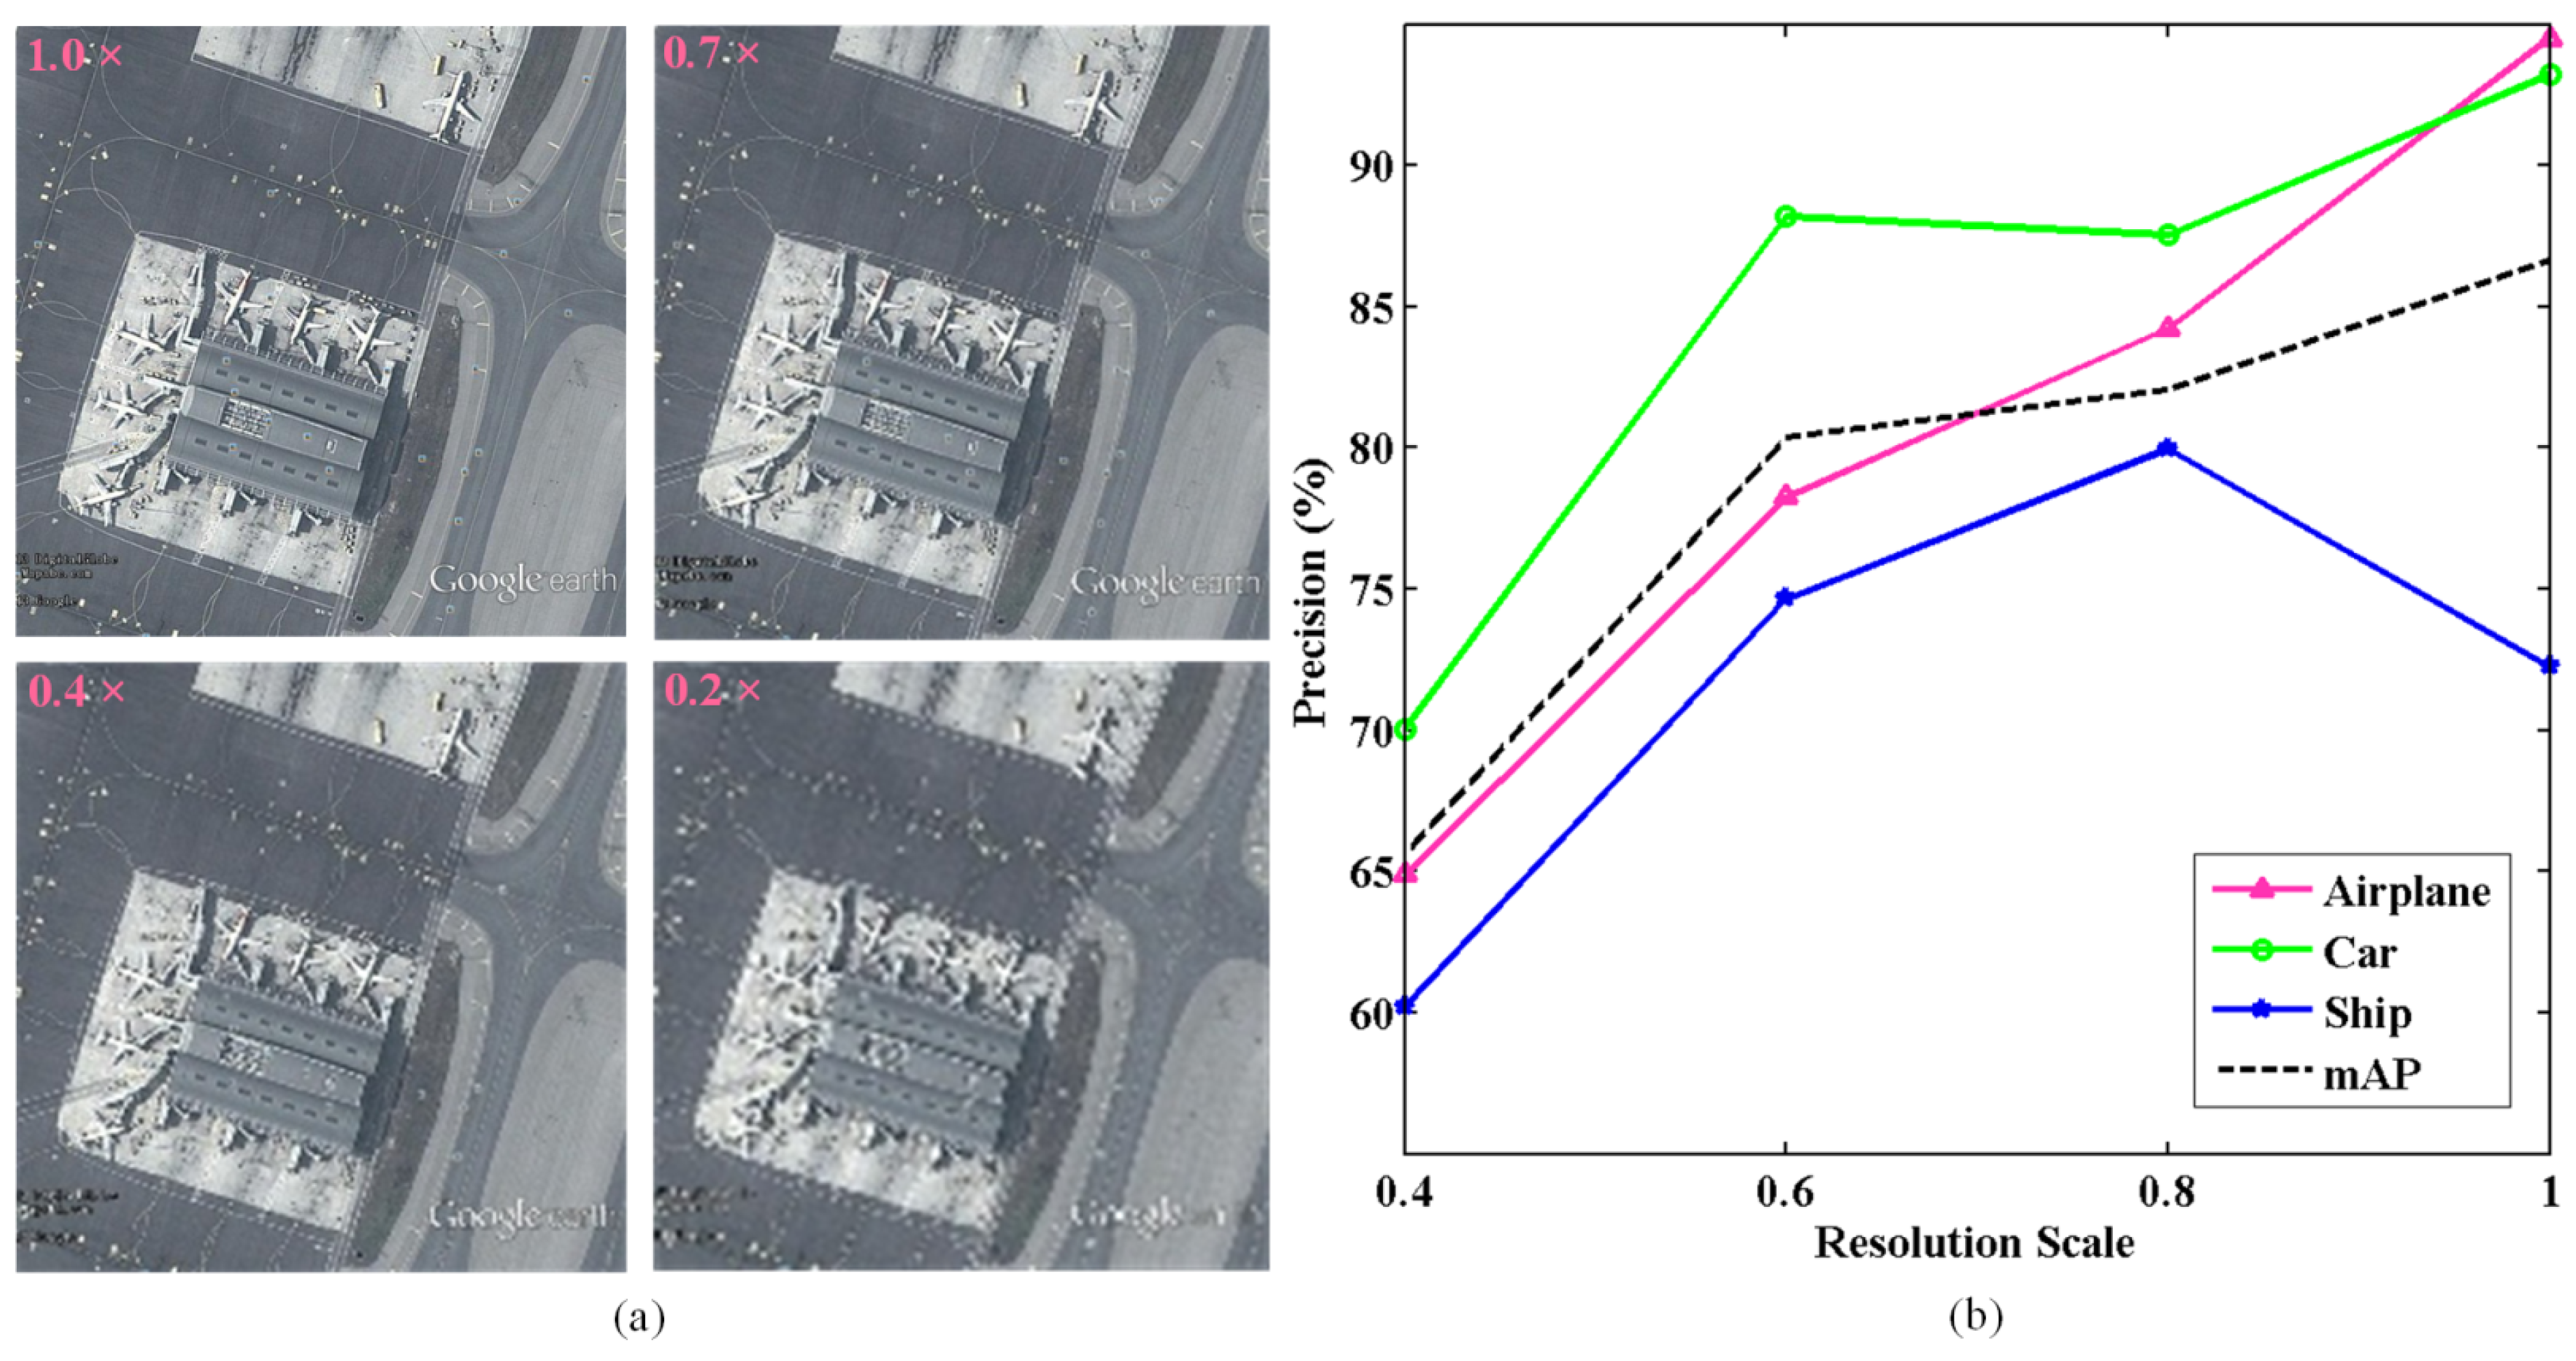
In the experiment, we find it will be easier to detect objects if the images contain more detailed features and objects to be detected occupy more pixels. So we have implemented experiments to find out the impact of detailed features on detection results.
Firstly, we down-sample the original remote sensing images to lower resolutions to evaluate the influences on the subjective effect of detection results. Then we train NEOON on ACS dataset with each resolution and compare the corresponding detection results, which is illustrated in Figure 13 and Table 4.
Objectively, higher-resolution images contain more detailed features; as Table 4 shows, the mAP decreased by 2.75%, 6.29% and 21.61% with the decreasing of imagery resolution. Meanwhile, Figure 13 shows the best mAP is the result of the original high-resolution imagery, and the worst result is from the lowest-resolution images which were down-sampled 0.4 times.
Therefore, it can be concluded that the more detailed features exist in the image, the better detection accuracy will be achieved. Therefore, enhancing the detailed features of small objects is quite crucial for object detection in remote sensing imagery.
4.4. Discussion
While thorough and convincing experiments and analysis have verified the effectiveness of the proposed NEOON, there are still some interesting details found during experiments which are valuable to be discussed as follows.
- About the Soft-NMS. As demonstrated in Section 2.4, the Soft-NMS does works in specific situations where objects are arranged densely, such as when square boxes are predicted to detect obliquely and tightly aligned cars in Figure 8. However, it just plays a limited role in improvement on performance if the objects of interested are not densely arranged, which is the more general case. So we can consider utilizing the Soft-NMS in post-processing under the specific rather than all the circumstances.
- About the RFE module. In experiments, the RFE module does work and improves both the subjective and objective effect. However, we have found that in some test images of small and large objects coexisting, the RFE module raised the recall value of small object while making some large objects undetected, which needs further investigation to be found out.
- About the Darknet framework. As we can see in the Table 3, it can be found that the AP value of two class, the tennis court and basketball court, is much lower than SSD and R-P-Faster R-CNN, which is Similarly to YOLOv2 adopting the Darknet as its basic framework just like NEOON. Therefore, we suppose that this issue is related to the algorithm mechanism of the Darknet framework to some extent.
At present, we cannot give satisfactory explanations and analyses for these problems abovementioned, and we will further explore them in future work.
5. Conclusions
In this work, we proposed the NEOON, which is a novel one-stage model designed and optimized for extracting spatial information of high-resolution remote sensing images by understanding and analyzing the combination of feature and semantic information of small objects. In NEOON, the feature extraction part implements bottom-up and top-down processings by successive down-sampling and up-sampling operations in conjunction with residual modules. In addition, the feature fusion part is achieved by concatenation operations with corresponding convolutional operations. Moreover, the feature enhancement part and the multi-scale detection part are implemented by an RFE module and four different detectors with different sensitivities, respectively. Furthermore, the Focal Loss is set as the loss function to settle the class imbalance problem. In addition, the Soft-NMS plays a vital role in detecting densely arranged objects. Note that adequate experiments are executed in the ACS dataset constructed by ourselves and the NWPU VHR-10 dataset. Additionally, the analysis of experimental results is thorough enough to not only provenly demonstrate the effectiveness of the proposed NEOON but also provide new insights for other scholars to cope with object detection tasks in remote sensing imagery.
Author Contributions
W.X. and H.Q. provided conceptualization; H.Q. performed the experiments and analyzed the result data; W.X. and H.Q. designed the methodology; W.X. and Z.W. investigated related work; Y.L. and J.L. provided suggestions on algorithm optimization and paper revision; H.Q. wrote the paper.
Funding
This work was supported in part by the National Natural Science Foundation of China (Nos. 61801359, 61571345, 91538101, 61501346, 61502367 and 61701360) and the 111 project (B08038). It was also partially supported by the Fundamental Research Funds for the Central Universities JB180104, the Natural Science Basic Research Plan in Shaanxi Province of China (Nos. 2016JQ6023, 2016JQ6018, 2019JQ153), General Financial Grant from the China Postdoctoral Science Foundation (No. 2017M620440), Yangtse Rive Scholar Bonus Schemes (No. CJT160102).
Acknowledgments
The authors would like to thank Gong Cheng from Northwestern Polytechnical University for providing the awesome remote sensing objection dataset NWPU VHR-10. The authors would also like to thank the anonymous reviewers for their very competent comments and helpful suggestions.
Conflicts of Interest
The authors declare no conflict of interest.
References
- Xie, W.; Shi, Y.; Li, Y.; Jia, X.; Lei, J. High-Quality Spectral-Spatial Reconstruction Using Saliency Detection and Deep Feature Enhancement. Pattern Recognit. 2019, 88, 139–152. [Google Scholar] [CrossRef]
- Xie, W.; Jiang, T.; Li, Y.; Jia, X.; Lei, J. Structure Tensor and Guided Filtering-Based Algorithm for Hyperspectral Anomaly Detection. IEEE Trans. Geosci. Remote Sens. 2019, 1–13. [Google Scholar] [CrossRef]
- Wang, Q.; Meng, Z.; Li, X. Locality Adaptive Discriminant Analysis for Spectral-Spatial Classification of Hyperspectral Images. IEEE Geosci. Remote Sens. Lett. 2017, 14, 2077–2081. [Google Scholar] [CrossRef]
- Cheng, G.; Han, J. A Survey on Object Detection in Optical Remote Sensing Images. ISPRS J. Photogramm. Remote Sens. 2016, 117, 11–28. [Google Scholar] [CrossRef]
- Etten, A.V. You Only Look Twice: Rapid Multi-Scale Object Detection In Satellite Imagery. arXiv 2018, arXiv:1805.09512. [Google Scholar]
- Hu, Y.; Chen, J.; Pan, D.; Hao, Z. Edge-Guided Image Object Detection in Multiscale Segmentation for High-Resolution Remotely Sensed Imagery. IEEE Trans. Geosci. Remote Sens. 2016, 54, 4702–4711. [Google Scholar] [CrossRef]
- Qiu, S.; Wen, G.; Fan, Y. Occluded Object Detection in High-Resolution Remote Sensing Images Using Partial Configuration Object Model. IEEE J. Sel. Top. Appl. Earth Obs. Remote Sens. 2017, 10, 1909–1925. [Google Scholar] [CrossRef]
- Wang, Q.; Gao, J.; Yuan, Y. Embedding Structured Contour and Location Prior in Siamesed Fully Convolutional Networks for Road Detection. IEEE Trans. Intell. Transp. Syst. 2018, 19, 230–241. [Google Scholar] [CrossRef]
- Peng, X.; Feng, J.; Xiao, S.; Yau, W.; Zhou, J.T.; Yang, S. Structured AutoEncoders for Subspace Clustering. IEEE Trans. Image Process 2018, 27, 5076–5086. [Google Scholar] [CrossRef]
- Debnath, S.; Chinthavali, M. Multiple Marginal Fisher Analysis. IEEE Trans. Ind. Electron. 2018, 65, 9215–9224. [Google Scholar] [CrossRef]
- Hwang, K.C. A Modified Sierpinski Fractal Antenna for Multiband Application. IEEE Antennas Wirel. Propag. Lett. 2007, 6, 357–360. [Google Scholar] [CrossRef]
- Guido, R.C. Practical and Useful Tips on Discrete Wavelet Transforms. IEEE Signal Process. Mag. 2015, 32, 162–166. [Google Scholar] [CrossRef]
- Guariglia, E. Entropy and Fractal Antennas. Entropy 2016, 18, 84. [Google Scholar] [CrossRef]
- Guariglia, E. Harmonic Sierpinski Gasket and Applications. Entropy 2018, 20, 714. [Google Scholar] [CrossRef]
- Hutchinson, J.E. Fractals and Self Similarity. Indiana Univ. Math. J. 1981, 30, 713–747. [Google Scholar] [CrossRef]
- Liu, L.; Ouyang, W.; Wang, X.; Fieguth, P.W.; Chen, J.; Liu, X.; Pietikainen, M. Deep Learning for Generic Object Detection: A Survey. arXiv 2019, arXiv:1809.02165. [Google Scholar]
- Chahal, S.K.; Dey, K. A Survey of Modern Object Detection Literature Using Deep Learning. arXiv 2018, arXiv:1808.07256. [Google Scholar]
- Girshick, R.; Donahuea, J.; Darrell, T.; Malik, J. Rich Feature Hierarchies for Accurate Object Detection and Semantic Segmentation. In Proceedings of the IEEE Conference on Computer Vision and Pattern Recognition (CVPR), Columbus, OH, USA, 24–27 June 2014; pp. 580–587. [Google Scholar]
- Girshick, R. Fast R-CNN. In Proceedings of the IEEE International Conference on Computer Vision (ICCV), Santiago, Chile, 13–16 December 2015; pp. 1440–1448. [Google Scholar]
- Ren, S.; He, K.; Girshick, R.; Sun, J. Faster R-CNN: Towards Real-time Object Detection with Region Proposal Networks. IEEE Trans. Pattern Anal. Mach. Intell. 2015, 39, 1137–1149. [Google Scholar] [CrossRef]
- Dai, J.; Li, Y.; He, K.; Sun, J. R-FCN: Object Detection via Region-Based Fully Convolutional Networks. In Proceedings of the Advances in Neural Information Processing Systems (NIPS), Barcelona, Spain, 5–10 December 2016; pp. 2294–2298. [Google Scholar]
- Redmon, J.; Divvala, S.; Girshick, R.; Farhadi, A. You Only Look Once: Unified, Real-Time Object Detection. In Proceedings of the IEEE Conference on Computer Vision and Pattern Recognition (CVPR), Las Vegas, NV, USA, 26 June–1 July 2016; pp. 779–788. [Google Scholar]
- Redmon, J.; Farhadi, A. YOLO9000: Better, Faster, Stronger. In Proceedings of the IEEE Conference on Computer Vision and Pattern Recognition (CVPR), Honolulu, HI, USA, 21–26 July 2017; pp. 7263–7271. [Google Scholar]
- Redmon, J.; Farhadi, A. YOLOv3: An Incremental Improvement. arXiv 2018, arXiv:1804.02767. [Google Scholar]
- Liu, W.; Anguelov, D.; Erhan, D.; Szegedy, C.; Reed, S.; Fu, C.; Berg, A.C. SSD: Single Shot Multibox Detector. In Proceedings of the European Conference on Computer Vision (ECCV), Amsterdam, The Netherlands, 8–16 October 2016; pp. 21–37. [Google Scholar]
- Lin, T.; Maire, M.; Belongie, S.; Hays, J.; Perona, P.; Ramanan, D.; Dollar, P.; Zitnick, C.L. Microsoft COCO: Common Objects in Context. In Proceedings of the European Conference on Computer Vision (ECCV), Zurich, Switzerland, 6–12 September 2014; pp. 740–755. [Google Scholar]
- Yang, X.; Fu, K.; Sun, H.; Sun, X.; Yan, M.; Diao, W.; Guo, Z. Object Detection with Head Direction in Remote Sensing Images Based on Rotational Region CNN. In Proceedings of the IEEE International Geoscience and Remote Sensing Symposium (IGARSS), Valencia, Spain, 22–27 July 2018; pp. 2507–2510. [Google Scholar]
- Wu, Z.; Gao, Y.; Li, L.; Fan, J. Research on Object Detection Technique in High Resolution Remote Sensing Images Based on U-Net. In Proceedings of the Chinese Control And Decision Conference (CCDC), Shenyang, China, 9–11 June 2018; pp. 2849–2853. [Google Scholar]
- Chan-Hon-Tong, A.; Audebert, N. Object Detection in Remote Sensing Images with Center Only. In Proceedings of the IEEE International Geoscience and Remote Sensing Symposium (IGARSS), Valencia, Spain, 22–27 July 2018; pp. 7054–7057. [Google Scholar]
- Li, Q.; Mou, L.; Jiang, K.; Liu, Q.; Wang, Y.; Zhu, X. Hierarchical Region Based Convolution Neural Network for Multiscale Object Detection in Remote Sensing Images. In Proceedings of the IEEE International Geoscience and Remote Sensing Symposium (IGARSS), Valencia, Spain, 22–27 July 2018; pp. 4355–4358. [Google Scholar]
- Tayara, H.; Chong, K.T. Object Detection in Very High-Resolution Aerial Images Using One-Stage Densely Connected Feature Pyramid Network. Sensors 2018, 18, 3341. [Google Scholar] [CrossRef]
- Zou, Z.; Shi, Z. Random Access Memories: A New Paradigm for Target Detection in High Resolution Aerial Remote Sensing Images. IEEE Trans. Image Process. 2018, 27, 1100–1111. [Google Scholar] [CrossRef] [PubMed]
- Zhuang, S.; Wang, P.; Jiang, B.; Wang, G.; Wang, C. A Single Shot Framework with Multi-Scale Feature Fusion for Geospatial Object Detection. Remote Sens. 2019, 11, 594. [Google Scholar] [CrossRef]
- Ma, W.; Guo, Q.; Wu, Y.; Zhao, W.; Zhang, X.; Jiao, L. A Novel Multi-Model Decision Fusion Network for Object Detection in Remote Sensing Images. Remote Sens. 2019, 11, 737. [Google Scholar] [CrossRef]
- Zhang, X.; Zhu, K.; Chen, G.; Tan, X.; Zhang, L.; Dai, F.; Liao, P.J.; Gong, Y. Geospatial Object Detection on High Resolution Remote Sensing Imagery Based on Double Multi-Scale Feature Pyramid Network. Remote Sens. 2019, 11, 755. [Google Scholar] [CrossRef]
- Li, J.; Dai, Y.; Li, C.; Shu, J.; Li, D.; Yang, T.; Lu, Z. Visual Detail Augmented Mapping for Small Aerial Target Detection. Remote Sens. 2019, 11, 14. [Google Scholar] [CrossRef]
- Chen, S.; Zhan, R.; Zhang, J. Geospatial Object Detection in Remote Sensing Imagery Based on Multiscale Single-Shot Detector with Activated Semantics. Remote Sens. 2018, 10, 820. [Google Scholar] [CrossRef]
- Guo, W.; Yang, W.; Zhang, H.; Hua, G. Geospatial Object Detection in High Resolution Satellite Images Based on Multi-Scale Convolutional Neural Network. Remote Sens. 2018, 10, 131. [Google Scholar] [CrossRef]
- Han, X.; Zhong, Y.; Zhang, L. An Efficient and Robust Integrated Geospatial Object Detection Framework for High Spatial Resolution Remote Sensing Imagery. Remote Sens. 2017, 9, 666. [Google Scholar] [CrossRef]
- He, K.; Zhang, X.; Ren, S.; Sun, J. Deep Residual Learning for Image Recognition. In Proceedings of the IEEE Conference on Computer Vision and Pattern Recognition (CVPR), Las Vegas, NV, USA, 26 June–1 July 2016; pp. 770–778. [Google Scholar]
- Zhong, Y.; Han, X.; Zhang, L. Multi-Class Geospatial Object Detection Based on A Position-Sensitive Balancing Framework for High Spatial Resolution Remote Sensing Imagery. ISPRS J. Photogramm. Remote Sens. 2018, 138, 281–294. [Google Scholar] [CrossRef]
- Shrivastava, A.; Gupta, A.; Girshick, R. Training Region-Based Object Detectors with Online Hard Example Mining. In Proceedings of the IEEE Conference on Computer Vision and Pattern Recognition (CVPR), Las Vegas, NV, USA, 26 June–1 July 2016; pp. 761–769. [Google Scholar]
- Ding, P.; Zhang, Y.; Deng, W.; Jia, P.; Kuijper, A. A Light and Faster Regional Convolutional Neural Network for Object Detection in Optical Remote Sensing Images. ISPRS J. Photogramm. Remote Sens. 2018, 141, 208–218. [Google Scholar] [CrossRef]
- Long, Y.; Gong, Y.; Xiao, Z.; Liu, Q. Accurate Object Localization in Remote Sensing Images Based on Convolutional Neural Networks. IEEE Trans. Geosci. Remote Sens. 2017, 55, 2486–2498. [Google Scholar] [CrossRef]
- Li, K.; Cheng, G.; Bu, S.; You, X. Rotation-Insensitive and Context-Augmented Object Detection in Remote Sensing Images. IEEE Trans. Geosci. Remote Sens. 2018, 56, 2337–2348. [Google Scholar] [CrossRef]
- Lin, T.; Dollar, P.; Girshick, R.; He, K.; Hariharan, B.; Belongie, S. Feature Pyramid Networks for Object Detection. In Proceedings of the IEEE Conference on Computer Vision and Pattern Recognition (CVPR), Honolulu, HI, USA, 21–26 July 2017; pp. 2117–2125. [Google Scholar]
- Law, H.; Deng, J. CornerNet: Detecting Objects as Paired Keypoints. In Proceedings of the European Conference on Computer Vision (ECCV), Munich, Germany, 8–14 September 2018; pp. 734–750. [Google Scholar]
- Newell, A.; Yang, K.; Deng, J. Stacked Hourglass Networks for Human Pose Estimation. In Proceedings of the European Conference on Computer Vision (ECCV), Amsterdam, The Netherlands, 8–16 October 2016; pp. 483–499. [Google Scholar]
- Liu, W.; Ma, L.; Chen, H. Arbitrary-Oriented Ship Detection Framework in Optical Remote-Sensing Images. IEEE Geosci. Remote Sens. Lett. 2018, 15, 937–941. [Google Scholar] [CrossRef]
- Yang, F.; Xu, Q.; Li, B.; Ji, Y. Ship Detection From Thermal Remote Sensing Imagery Through Region-Based Deep Forest. IEEE Geosci. Remote Sens. Lett. 2017, 15, 449–453. [Google Scholar] [CrossRef]
- Deng, Z.; Lei, L.; Sun, H.; Zou, H.; Zhou, S.; Zhao, J. An Enhanced Deep Convolutional Neural Network for Densely Packed Objects Detection in Remote Sensing Images. In Proceedings of the International Workshop on Remote Sensing with Intelligent Processing (RSIP), Shanghai, China, 18–21 May 2017; pp. 1–4. [Google Scholar]
- Zhang, W.; Wang, S.; Thachan, S.; Chen, J.; Qian, Y. Deconv R-CNN for Small Object Detection on Remote Sensing Images. In Proceedings of the IEEE International Geoscience and Remote Sensing Symposium (IGARSS), Valencia, Spain, 22–27 July 2018; pp. 2483–2486. [Google Scholar]
- Li, J.; Liang, X.; Wei, Y.; Xu, T.; Feng, J.; Yan, S. Perceptual Generative Adversarial Networks for Small Object Detection. In Proceedings of the IEEE Conference on Computer Vision and Pattern Recognition (CVPR), Honolulu, HI, USA, 21–26 July 2017; pp. 1222–1230. [Google Scholar]
- Chen, C.; Liu, M.; Tuzel, O.; Xiao, J. R-CNN for Small Object Detection. In Proceedings of the 13th Asian Conference on Computer Vision (ACCV), Taipei, Taiwan, 20–24 November 2016. [Google Scholar]
- Cai, B.; Jiang, Z.; Zhang, H.; Yao, Y.; Nie, S. Online Exemplar-Based Fully Convolutional Network for Aircraft Detection in Remote Sensing Images. IEEE Geosci. Remote Sens. Lett. 2018, 15, 1095–1099. [Google Scholar] [CrossRef]
- Budak, U.; Sengur, A.; Halici, U. Deep Convolutional Neural Networks for Airport Detection in Remote Sensing Images. In Proceedings of the Signal Processing and Communications Applications Conference (SIU), Cesme-Izmir, Turkey, 2–5 May 2018; pp. 1–4. [Google Scholar]
- Han, Z.; Zhang, H.; Zhang, J.; Hu, X. Fast Aircraft Detection Based on Region Locating Network in Large-Scale Remote Sensing Images. In Proceedings of the IEEE International Conference on Image Processing (ICIP), Beijing, China, 17–20 September 2017; pp. 2294–2298. [Google Scholar]
- Cheng, G.; Zhou, P.; Han, J. Learning Rotation-Invariant Convolutional Neural Networks for Object Detection in VHR Optical Remote Sensing Images. IEEE Trans. Geosci. Remote Sens. 2016, 54, 7405–7415. [Google Scholar] [CrossRef]
- Cheng, G.; Han, J.; Zhou, P.; Guo, L. Multi-class Geospatial Object Detection and Geographic Image Classification Based on Collection of Part Detectors. ISPRS J. Photogramm. Remote Sens. 2014, 98, 119–132. [Google Scholar] [CrossRef]
- Lin, T.; Goyal, P.; Girshick, R.; He, K.; Dollar, P. Focal Loss for Dense Object Detection. In Proceedings of the IEEE International Conference on Computer Vision (ICCV), Venice, Italy, 22–29 October 2017; pp. 2999–3007. [Google Scholar]
- Bodla, N.; Singh, B.; Chellappa, R.; Davis, L.S. Improving Object Detection with One Line of Code. In Proceedings of the IEEE International Conference on Computer Vision (ICCV), Venice, Italy, 22–29 October 2017; pp. 5562–5570. [Google Scholar]
- Redmon, J. Darknet: Open Source Neural Networks in C. 2013–2016. Available online: http://pjreddie.com/darknet/ (accessed on 5 June 2019).
- Liu, S.; Huang, D.; Wang, Y. Receptive Field Block Net for Accurate and Fast Object Detection. In Proceedings of the European Conference on Computer Vision (ECCV), Munich, Germany, 8–14 September 2018; pp. 385–400. [Google Scholar]
- Zhao, H.; Shi, J.; Qi, X.; Wang, X.; Jia, J. Pyramid Scene Parsing Network. In Proceedings of the IEEE Conference on Computer Vision and Pattern Recognition (CVPR), Honolulu, HI, USA, 21–26 July 2017; pp. 6230–6239. [Google Scholar]
- Xia, G.; Bai, X.; Ding, J.; Zhu, Z.; Belongie, S.; Luo, J.; Datcu, M.; Pelillo, M.; Zhang, L. DOTA: A Large-Scale Dataset for Object Detection in Aerial Images. In Proceedings of the IEEE Conference on Computer Vision and Pattern Recognition (CVPR), Salt Lake City, UT, USA, 19–21 June 2018; pp. 3974–3983. [Google Scholar]
Figure 1.
Examples difficult to detect. Objects in remote sensing images are not only very small and densely clustered but also arranged with diverse orientations and extremely complex background.
Figure 1.
Examples difficult to detect. Objects in remote sensing images are not only very small and densely clustered but also arranged with diverse orientations and extremely complex background.

Figure 2.
Detection process. The detection process can be divided into six parts. Specifically, the dataset construction will be described in detail in Section 3.1.1, the split and merge strategy in Section 3.3.1, the multi-scale training in Section 3.3.2, the network architecture in Section 2.2, and the regression and classification in Section 2.3.

Figure 3.
Heatmaps. (a) is an input image; (b–d) demonstrate the heatmaps collected from the forepart of the network; (e–i) show the heatmaps collected from latter layers of the network.
Figure 3.
Heatmaps. (a) is an input image; (b–d) demonstrate the heatmaps collected from the forepart of the network; (e–i) show the heatmaps collected from latter layers of the network.

Figure 4.
Feature extraction structure. The feature extraction structure of novel effectively optimized one-stage network (NEOON) constructs top-down and bottom-up inference through a series of dwon-sampling operations and corresponding up-sampling operations.
Figure 4.
Feature extraction structure. The feature extraction structure of novel effectively optimized one-stage network (NEOON) constructs top-down and bottom-up inference through a series of dwon-sampling operations and corresponding up-sampling operations.

Figure 5.
Feature fusion structure. Concatenation operation and corresponding convolutional operations are employed four times in NEOON to achieve feature fusion. Note that residual modules are adopted to accelerate and optimize the fitting process of the model. Subsequently, four detectors in increasing layers access the progressively fused feature maps, all four parallel.

Figure 6.
Feature enhancement structure. (a) The mechanism of Receptive-Filed Enhancement (RFE) module from receptive field; (b) the detailed architecture of RFE module.
Figure 6.
Feature enhancement structure. (a) The mechanism of Receptive-Filed Enhancement (RFE) module from receptive field; (b) the detailed architecture of RFE module.

Figure 7.
Network structure detail. As a fully convolutional network, NEOON consists of more than fifty convolutions, 21 residual modules and an RFE module in practice.
Figure 7.
Network structure detail. As a fully convolutional network, NEOON consists of more than fifty convolutions, 21 residual modules and an RFE module in practice.

Figure 8.
Effect of the Soft-non-maximum suppression (NMS). In (a), a car cannot be detected because its confidence is set to 0 by NMS due to its Intersection-over-Union (IOU) with the nearest car, having a higher confidence 0.92, more than a thresh; however, in (b), the confidence of the car not detected in (a) is set to 0.70 instead of 0 according to Equation (13).

Figure 9.
Split and merge strategy. We tend to split the images into several square chips and each chip is detected by the network separately to produce a single result. Finally, all the results are merged into a large image with the same size as the original image.
Figure 9.
Split and merge strategy. We tend to split the images into several square chips and each chip is detected by the network separately to produce a single result. Finally, all the results are merged into a large image with the same size as the original image.

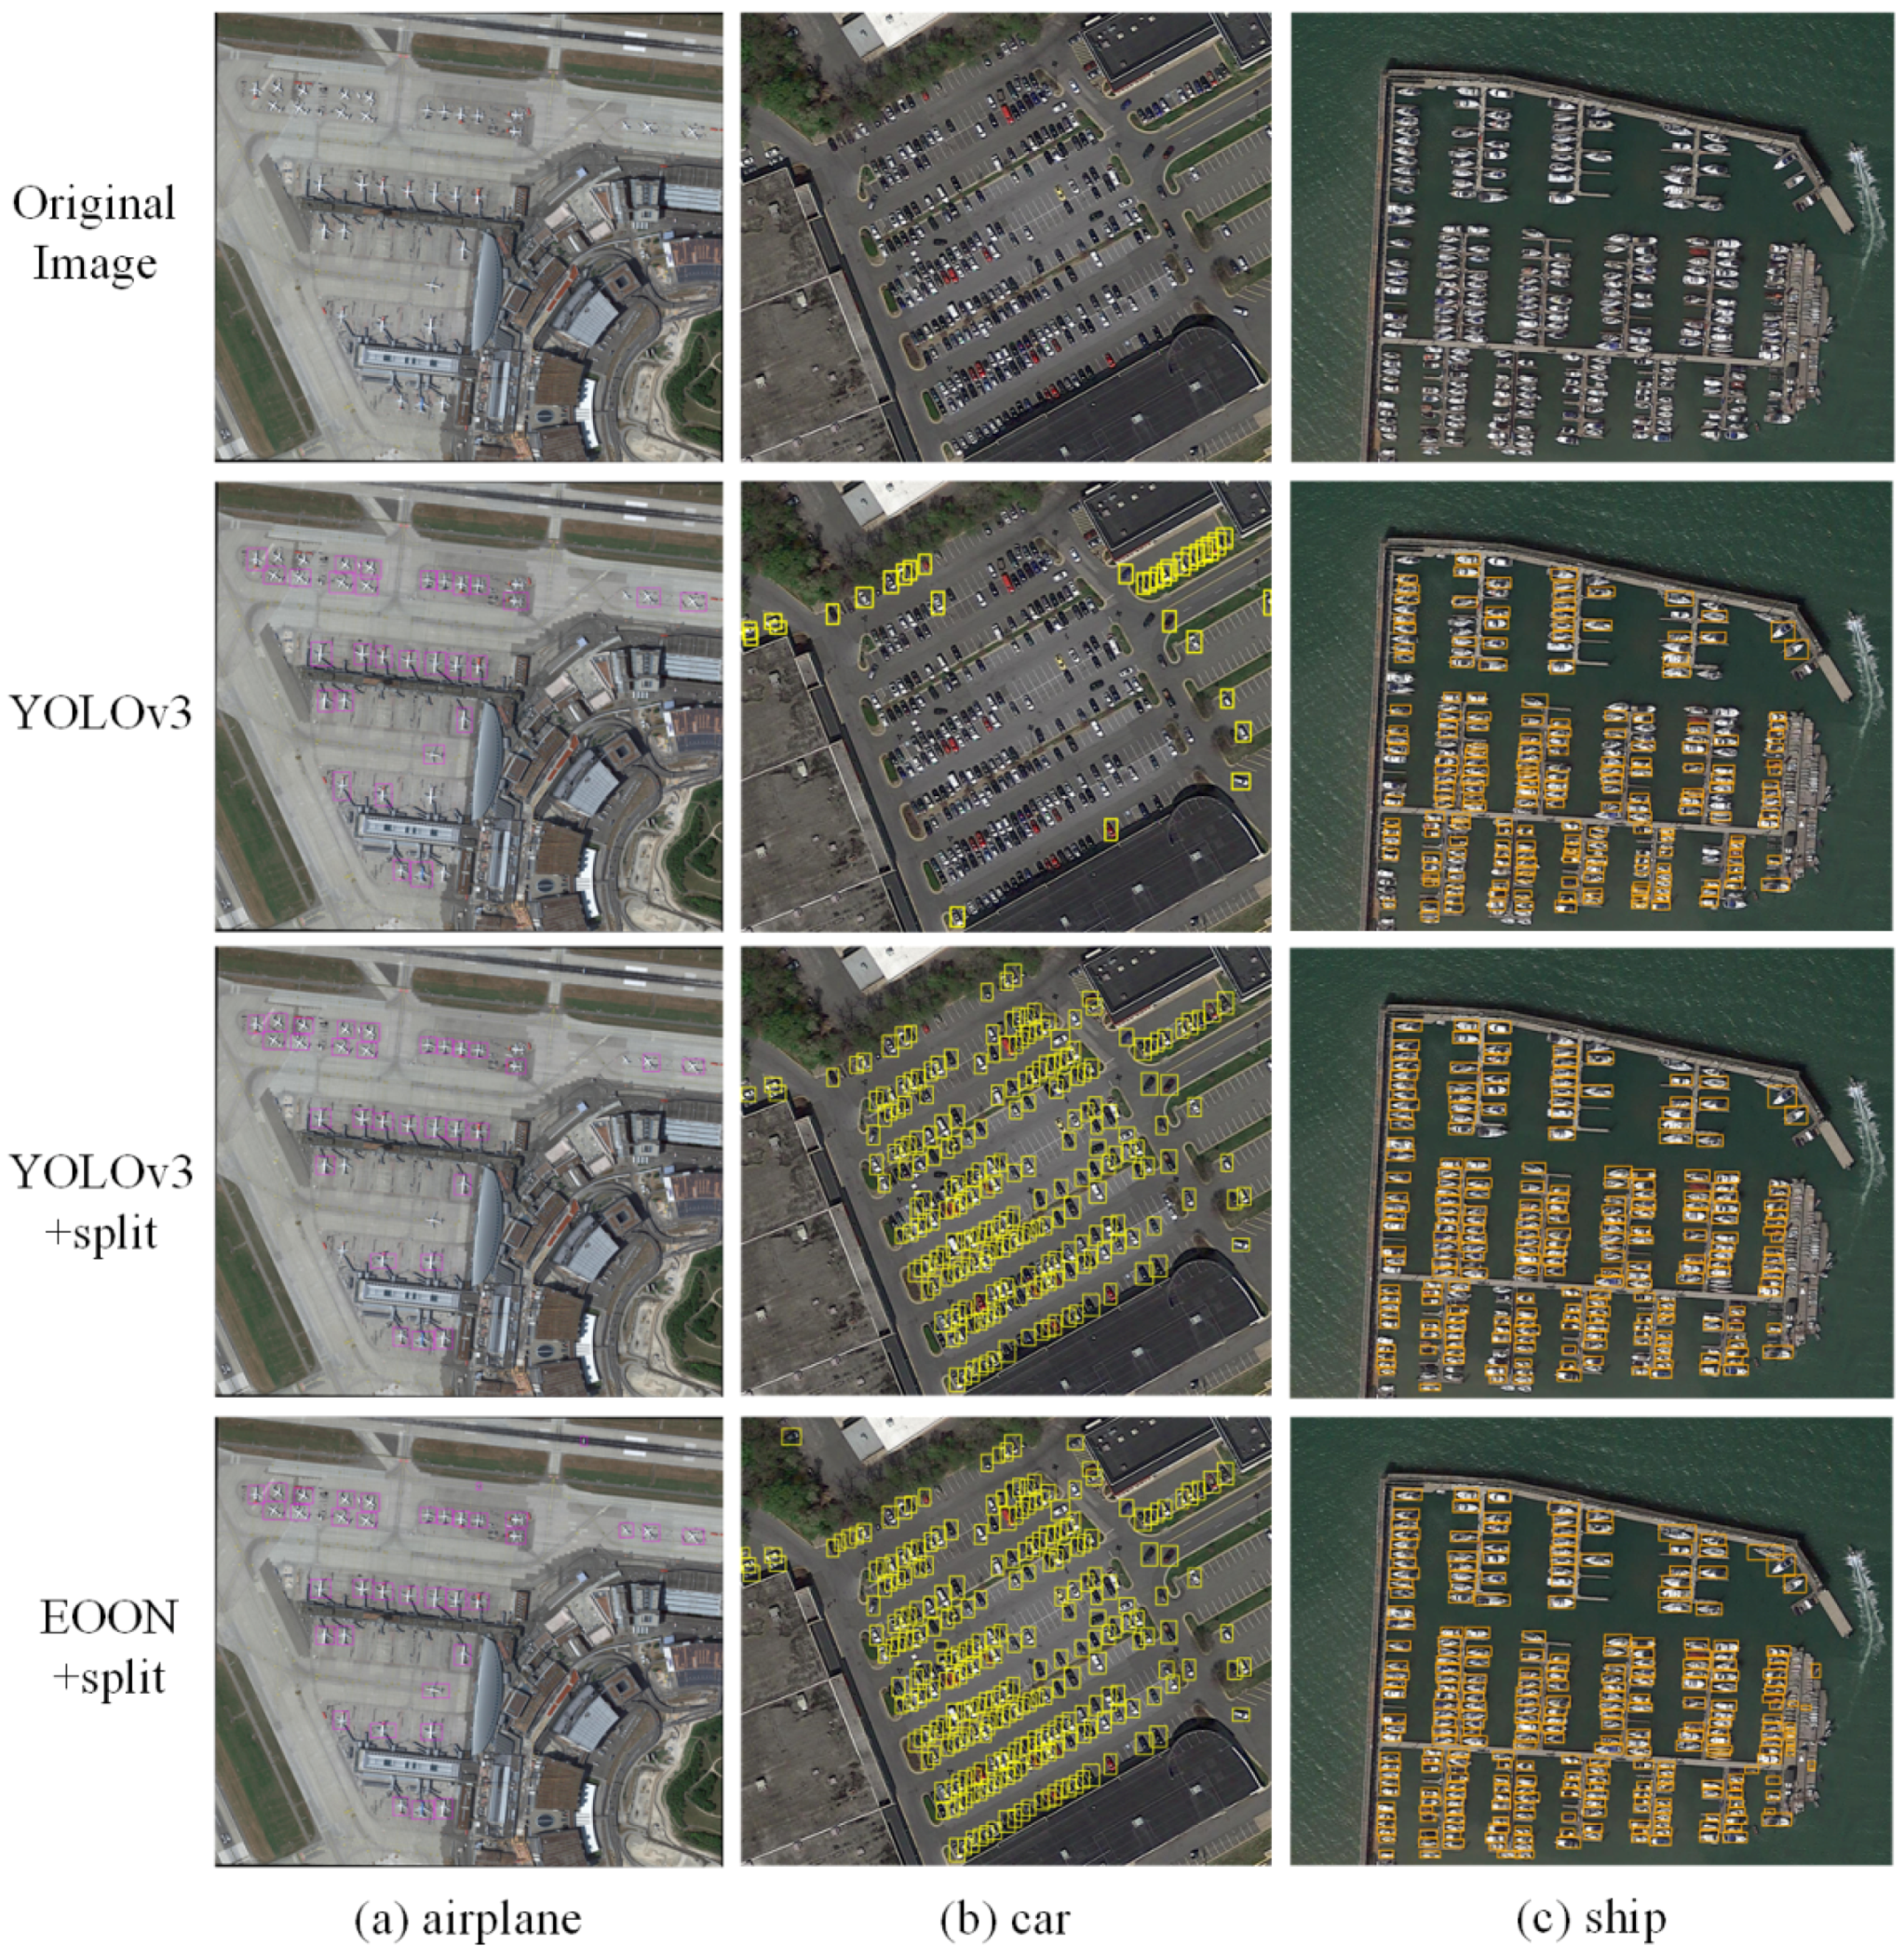
Figure 10.
Some detection results with three categories ((a) airplane; (b) car; (c) ship) to validate the performance of NEOON as well as the split and merge strategy. The first row shows the original images to be detected. The second row demonstrates the results obtained by YOLOv3. The third row shows the results obtained by YOLOv3 with the split and merge strategy. The last row is the detection results by NEOON with the split and merge strategy. In (a), YOLOv3 gets similar results as YOLOv3+split; however, YOLOv3+split achieves a higher classification confidence score than YOLOv3. Note that the first two methods cannot detect the tiny objects such as the two airplanes at the top of the testing image. However, the proposed NEOON can make it and detect more objects; in (b), cars are harder to detect than airplanes because they occupy fewer pixels and YOLOv3 can detect only a few cars. With split and merge strategy, both YOLOv3 and NEOON have shown a great detection performance especially for NEOON which is better at detecting indistinguishable small objects; in (c), the same as the cases in (a,b), the proposed NEOON has achieved the best results in ship detection.

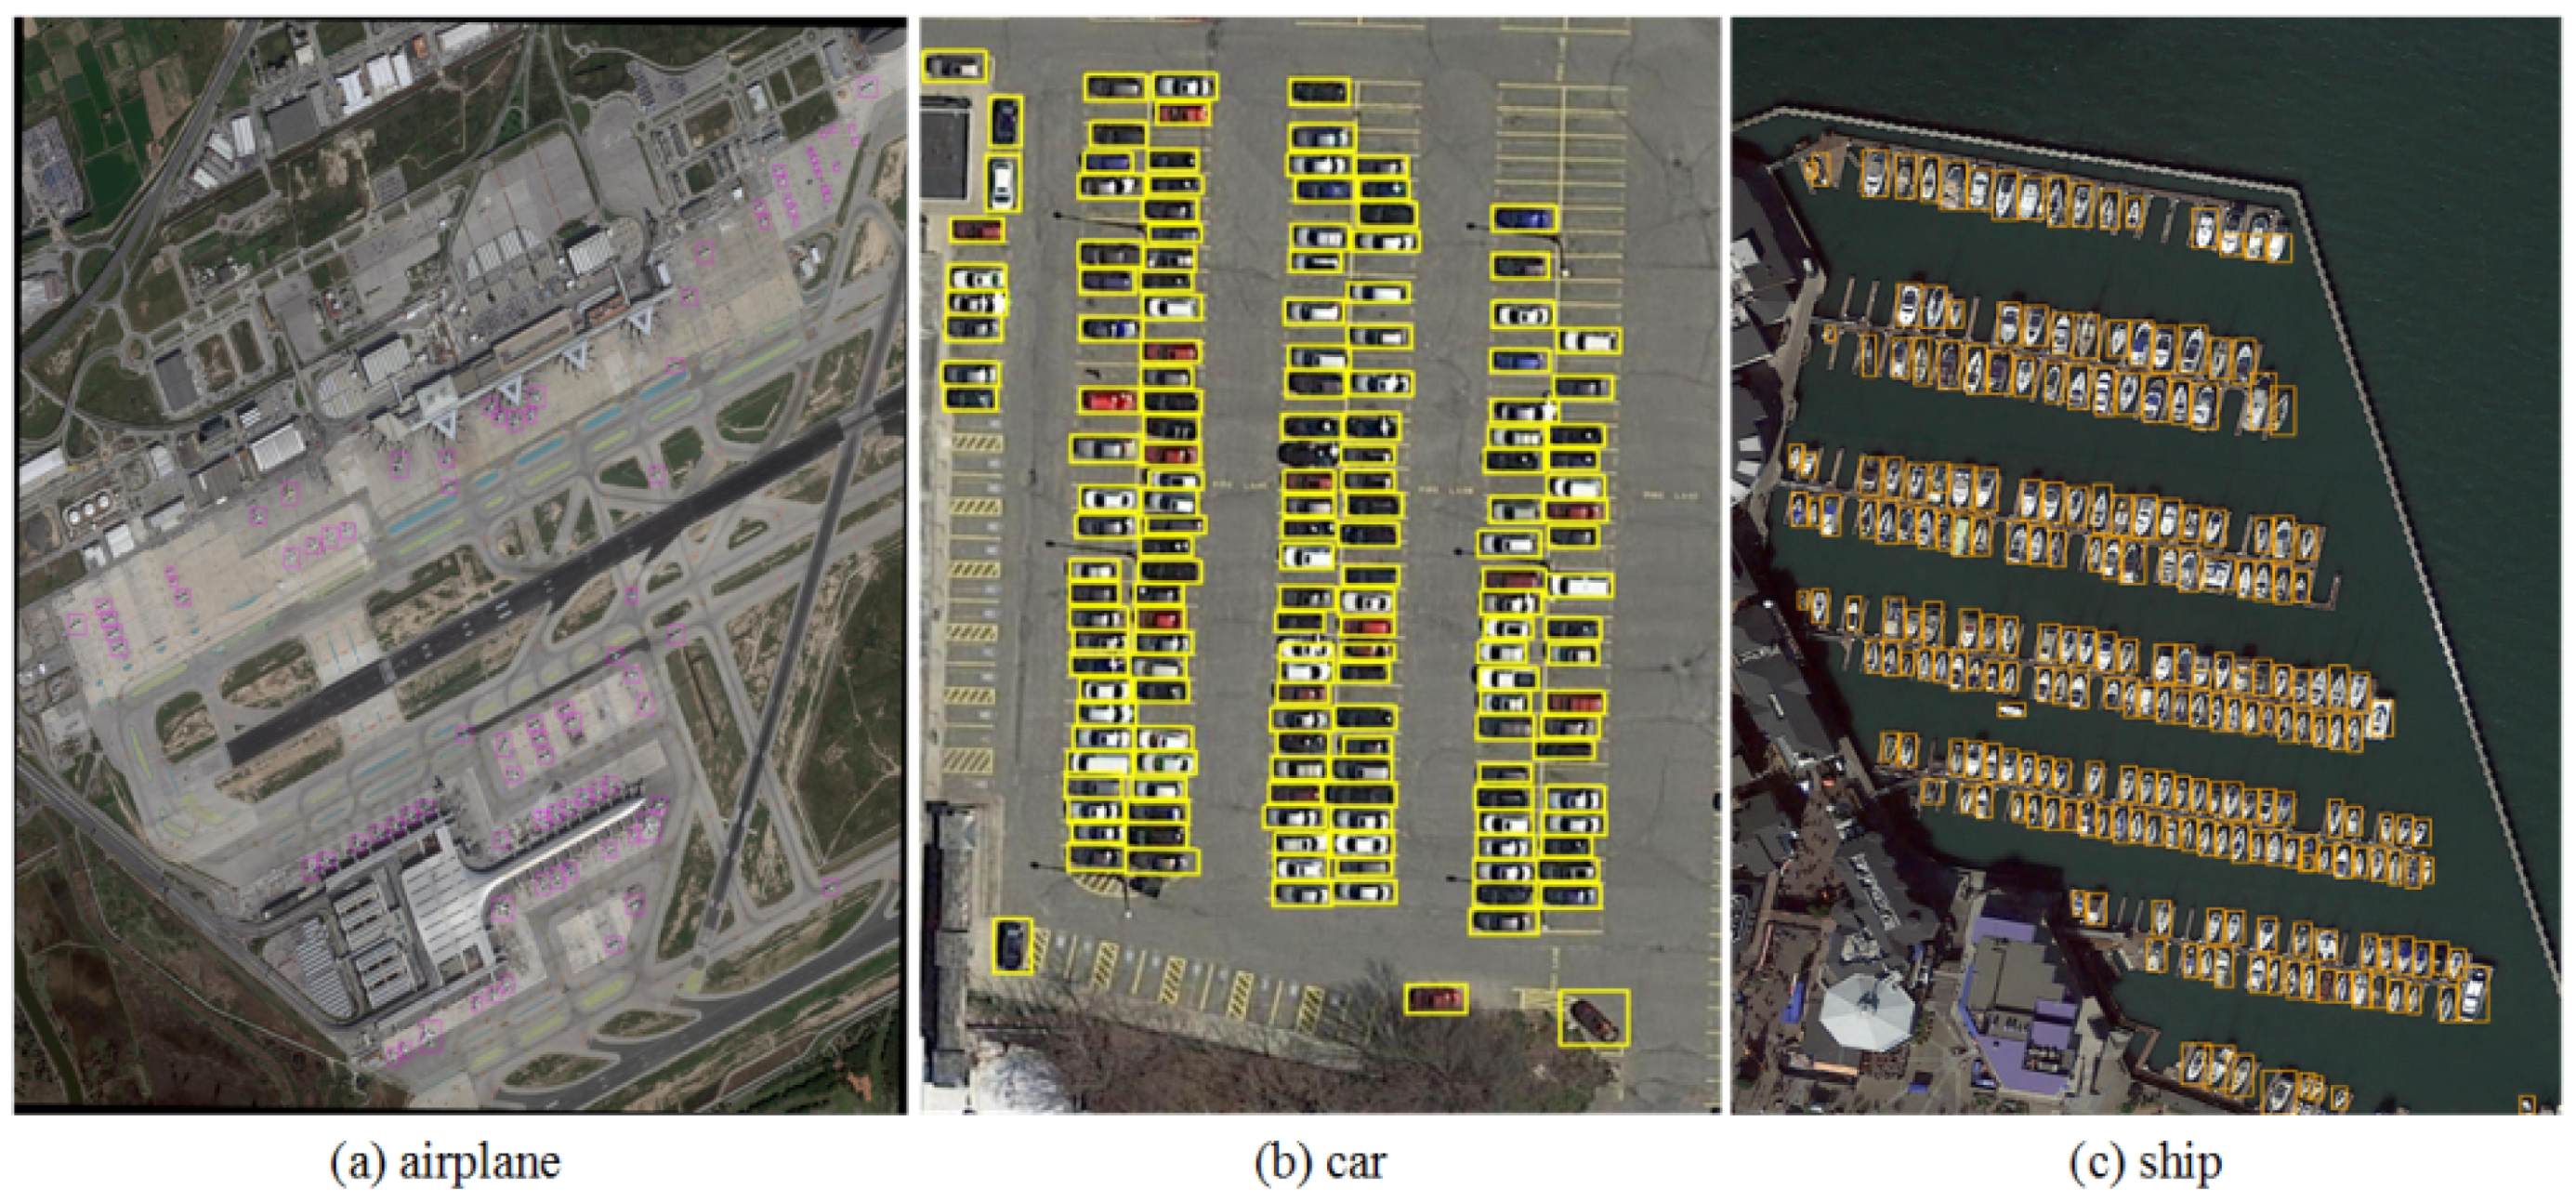
Figure 11.
Some instances of detection results obtained by NEOON with three categories ((a) airplane; (b) car; (c) ship).
Figure 11.
Some instances of detection results obtained by NEOON with three categories ((a) airplane; (b) car; (c) ship).

Figure 12.
Some instances of detection results obtained by NEOON in 10 categories.

Figure 13.
Subjective and objective effect. In (a), objects in a remote sensing image become more and more blurred as the resolution of the image decreases. In (b), AP and mAP curves (IoU = 0.5) of 3 categories as red, green and blue line for airplane, car and ship. As shown, AP and mAP rise with the increase in image resolution.


Table 1.
A Summary of Objects in ACS Dataset.
| Dataset | Airplane | Ship | Car |
|---|---|---|---|
| DOTA | 2933 | 6886 | 456 |
| UCAS-AOD | - | - | 3791 |
| NWPU VHR-10 | 754 | - | 596 |
| RSOD | 5374 | - | - |
| LEVIR | 3967 | 2627 | - |
| ASC | 13,082 | 9513 | 4843 |
Table 2.
Comparison of performance on ACS dataset.
| Method | Object Category | mAP | mRecall | |||||
|---|---|---|---|---|---|---|---|---|
| Airplane | Car | Ship | ||||||
| AP | Recall | AP | Recall | AP | Recall | |||
| YOLOv3 | 71.55% | 75.73% | 48.91% | 71.82% | 54.17% | 71.95% | 58.21% | 73.17% |
| YOLOv3+split | 85.98% | 86.77% | 90.58% | 93.60% | 69.10% | 81.19% | 81.88% | 87.19% |
| D: C–SoftNMS | 87.95% | 91.11% | 91.38% | 93.34% | 73.01% | 83.31% | 84.11% | 89.25% |
| C: B–FocalLoss | 88.65% | 92.24% | 91.54% | 94.23% | 72.88% | 84.35% | 84.36% | 90.27% |
| B: A–RFEmodule | 89.36% | 94.14% | 92.07% | 96.07% | 74.91% | 86.44% | 85.45% | 92.22% |
| A: NEOON+split | 94.49% | 95.37% | 93.22% | 96.87% | 72.25% | 85.83% | 86.65% | 92.69% |
Table 3.
Comparison of performance on NWPU VHR-10 dataset.
| Methods | COPD | YOLOv2 | RICNN | SSD | R-P-Faster R-CNN | NEOON |
|---|---|---|---|---|---|---|
| Airplane | 62.3% | 73.3% | 88.4% | 95.7% | 90.4% | 78.29% |
| Ship | 68.9% | 74.9% | 77.3% | 82.9% | 75.0% | 81.68% |
| Storage Tank | 63.7% | 34.4% | 85.3% | 85.6% | 44.4% | 94.62% |
| Baseball Diamond | 83.3% | 88.9% | 88.1% | 96.6% | 89.9% | 89.74% |
| Tennis Court | 32.1% | 29.1% | 40.8% | 82.1% | 79.7% | 61.25% |
| Basketball Court | 36.3% | 27.6% | 58.5% | 86.0% | 77.6% | 65.04% |
| Ground Track Field | 85.3% | 98.8% | 86.7% | 58.2% | 87.7% | 93.23% |
| Harbor | 55.3% | 75.4% | 68.6% | 54.8% | 79.1% | 73.15% |
| Bridge | 14.8% | 51.8% | 61.5% | 41.9% | 68.2% | 59.46% |
| Vehicle | 44.0% | 51.3% | 71.1% | 75.6% | 73.2% | 78.26% |
| mAP | 54.6% | 60.5% | 72.6% | 75.9% | 76.5% | 77.5% |
| Average Running Time (s) | 1.070 | 0.026 | 8.770 | 0.027 | 0.150 | 0.059 |
Table 4.
Impact of different resolutions on performance.
| Resolution | AP | mAP | ||
|---|---|---|---|---|
| Airplane | Car | Ship | ||
| Original | 94.49% | 93.22% | 72.25% | 86.65% |
| 0.8× | 84.22% | 87.53% | 79.96% | 83.90% |
| 0.6× | 78.25% | 88.18% | 74.65% | 80.36% |
| 0.4× | 64.88% | 70.02% | 60.21% | 65.04% |
© 2019 by the authors. Licensee MDPI, Basel, Switzerland. This article is an open access article distributed under the terms and conditions of the Creative Commons Attribution (CC BY) license (http://creativecommons.org/licenses/by/4.0/).
Share and Cite
MDPI and ACS Style
Xie, W.; Qin, H.; Li, Y.; Wang, Z.; Lei, J. A Novel Effectively Optimized One-Stage Network for Object Detection in Remote Sensing Imagery. Remote Sens. 2019, 11, 1376. https://0-doi-org.brum.beds.ac.uk/10.3390/rs11111376
AMA Style
Xie W, Qin H, Li Y, Wang Z, Lei J. A Novel Effectively Optimized One-Stage Network for Object Detection in Remote Sensing Imagery. Remote Sensing. 2019; 11(11):1376. https://0-doi-org.brum.beds.ac.uk/10.3390/rs11111376
Chicago/Turabian StyleXie, Weiying, Haonan Qin, Yunsong Li, Zhuo Wang, and Jie Lei. 2019. "A Novel Effectively Optimized One-Stage Network for Object Detection in Remote Sensing Imagery" Remote Sensing 11, no. 11: 1376. https://0-doi-org.brum.beds.ac.uk/10.3390/rs11111376
Note that from the first issue of 2016, this journal uses article numbers instead of page numbers. See further details here.