Uncertainty Analysis of Remotely-Acquired Thermal Infrared Data to Extract the Thermal Properties of Active Lava Surfaces


Department of Geology and Environmental Science, University of Pittsburgh, 4107 O’Hara Street, Pittsburgh, PA 15260, USA
*
Author to whom correspondence should be addressed.
Remote Sens. 2020, 12(1), 193; https://0-doi-org.brum.beds.ac.uk/10.3390/rs12010193
Submission received: 28 November 2019
/
Revised: 27 December 2019
/
Accepted: 3 January 2020
/
Published: 5 January 2020
(This article belongs to the Special Issue Quantitative Volcanic Hazard Assessment and Uncertainty Analysis in Satellite Remote Sensing and Modeling)
Abstract
:Using thermal infrared (TIR) data from multiple instruments and platforms for analysis of an entire active volcanic system is becoming more common with the increasing availability of new data. However, the accuracy and uncertainty associated with these combined datasets are poorly constrained over the full range of eruption temperatures and possible volcanic products. Here, four TIR datasets acquired over active lava surfaces are compared to quantify the uncertainty, accuracy, and variability in derived surface radiance, emissivity, and kinetic temperature. These data were acquired at Kīlauea volcano in Hawai’i, USA, in January/February 2017 and 2018. The analysis reveals that spatial resolution strongly limits the accuracy of the derived surface thermal properties, resulting in values that are significantly below the expected values for molten basaltic lava at its liquidus temperature. The surface radiance is ~2400% underestimated in the orbital data compared to only ~200% in ground-based data. As a result, the surface emissivity is overestimated and the kinetic temperature is underestimated by at least 30% and 200% in the airborne and orbital datasets, respectively. A thermal mixed pixel separation analysis is conducted to extract only the molten fraction within each pixel in an attempt to mitigate this complicating factor. This improved the orbital and airborne surface radiance values to within 15% of the expected values and the derived emissivity and kinetic temperature within 8% and 12%, respectively. It is, therefore, possible to use moderate spatial resolution TIR data to derive accurate and reliable emissivity and kinetic temperatures of a molten lava surface that are comparable to the higher resolution data from airborne and ground-based instruments. This approach, resulting in more accurate kinetic temperature and emissivity of the active surfaces, can improve estimates of flow hazards by greatly improving lava flow propagation models that rely on these data.
1. Introduction
Using remote sensing data to monitor volcanic eruptions has improved our understanding of the precursory activity, eruptions dynamics, and eruptive products [1,2]. Thermal infrared (TIR) data between a spectral range of 8 to 12 μm have been utilized since the early 1960s, with major developments in orbital, airborne, and ground-based TIR technologies. These systems provide new data that are important for modeling volcanic activity over a variety of spatial, spectral, and temporal scales (e.g., [3]). For example, the data have improved the accuracy, reliability, and duration of precursory evaluations, constrained eruption dynamics, and improved both magma rheological and thermal models of all volcanic products [1,4,5].
Multi-instrument, multi-platform TIR data of an entire volcanic system must be properly integrated and cross-calibrated to understand the thermal regime. An orbiting instrument such as the Advanced Spaceborne Thermal Emission and Reflection Radiometer (ASTER) acquiring moderate spatial (90 m) and spectral (5 TIR channels) resolution data will provide lower temporal frequency observations (~16 days) of the larger volcanic system and the ongoing eruption [6]. Typically, these systems miss the detailed spatial and spectral observations of low-level smaller-scale thermal anomalies and processes unless specific methods are adapted to directly detect and characterize these, and/or coincident mid-infrared data are exploited [5,7]. Airborne and ground-based instruments can observe smaller anomalies with the required spatial, spectral, and radiometric resolutions, but they are unable to provide data over extended time periods and may miss the synoptic coverage. Hence, there is a need for instrument and data synergy to improve observations from an individual source as well as the scientific interpretation of the volcanic system. This synergy requires accuracy and uncertainty quantification to improve analysis confidence. This issue has been investigated over many scenarios [8,9,10,11] but not for observations of active molten lava surfaces where rapid changes in thermal properties occur both spatially and temporally at very high surface temperatures (<1450 K), as seen in the recent basaltic eruptions in Hawaii.
Basaltic volcanism is the most common form of extrusive volcanism on Earth, occurring at every tectonic setting [12]. Recent significant basaltic eruptions have occurred at Piton de la Fournaise (Reunion Island); Yasur (Vanuatu); Tolbachik (Russia); and Kīlauea (Hawaii), emphasizing the hazards that these eruptions pose. For example, in 2018 the lava flows from the Lower East Rift Zone of Kīlauea Volcano threatened lives and property in the Puna District of the Island of Hawai’i [13]. During the 4-month long eruption, 23 fissures opened emplacing over 750 m3 of lava that covered the populated Leilani Estates and destroyed 716 dwellings [14]. Near-daily broadband helicopter-based TIR camera data were acquired to produce lava inundation maps, but no thermal lava flow propagation forecasts were calculated, mostly due to the lack of an available robust and reliable modeling approach.
With these recent large flow-producing eruptions, there is an increasing need to develop rapidly implementable lava flow propagation models to aid in volcanic hazard response. Developing these models requires improvements in the accuracy of estimating lava flow pathways and velocity to reduce the hazard risk to proximal communities. Volcanic eruption flow modeling relies on factors including but not limited to effusion rates, flow dynamics, viscosity, cooling rate, in addition to continuously-updated topography [15,16,17]. Typically, these models use data from TIR instruments to measure cooling and model viscosity. Therefore, improvements in the accuracy and constraint of uncertainty in the measured surface radiance, kinetic temperature, and emissivity from these instruments will improve our ability to model downslope lava surface dynamics, rheological changes, flow propagation, and hazard assessments (e.g., [3,18]).
TIR data for this study were acquired during the 2017 and 2018 NASA Hawaii airborne campaign and are utilized to determine the spatial and spectral resolution influence on the derived kinetic temperature and emissivity of the active lava surfaces as they cool. Simultaneous TIR data were acquired using the ground-based Miniature Multispectral Thermal Camera (MMT-Cam) system [19], the airborne Hyperspectral Thermal Emission Spectrometer (HyTES) [20], and the MODIS/ASTER (MASTER) airborne simulator [21], as well as the orbital ASTER instrument [6], with increasingly lower spatial resolutions, respectively. A primary goal was to constrain the relationship between the derived emissivity and acquired surface radiance to improve the accuracy of the surface temperatures derived from the TIR data [1,3].
2. Background
The TIR region is primarily used in volcanology to determine the eruption temperature, and with later multispectral systems being able to also derive surface emissivity [1]. Previous TIR spectroscopy studies investigated emissivity, cooling rates, surface textures, and compositions (e.g., [1,3,22]). However, the extreme thermal heterogeneity of active volcanic surfaces can easily lead to misclassification or over-simplification of the true thermal fractions [23]. This is made worse by the currently available low spatial resolution (>500 m) TIR datasets that are not able to accurately resolve the maximum temperature or representative emissivity spectrum. There are relatively few studies (i.e., [23]) that have investigated the influence of spatial and spectral resolution on these calculations over temperatures where a molten lava surface cools (<1450 K). Therefore, simply deconvolving the molten fraction that has the maximum temperature within each pixel will improve the accuracy and uncertainty of the emissivity, kinetic temperature, and radiant flux.
Measuring accurate thermal properties of a molten lava surface is also critical to lava flow propagation models [15,24]. With the increasing number of spectral bands in more recent TIR imagers (e.g., HyTES [20] and the Mineral and Gas Identifier (MAGI) [25]), the radiative temperature and emissivity of an object’s surface can be extracted with increasing accuracy [26,27,28]. A well-constrained emissivity can then be used with approaches such as linear spectral deconvolution modeling to quantitatively determine possible spectral end-member that defines the mineralogical, textural, and thermal fractions [29,30,31,32]. Additionally, kinetic temperature (and to a lesser degree, emissivity) is required to determine the runout distance and hazard potential using radiant heat flux in lava flow propagation models [15,24]. However, the accuracy of these derived parameters over the cooling temperature range of typical lavas is less well constrained at the various spatial resolutions of current TIR instruments. Therefore, improving the accuracy of the kinetic temperature and emissivity of the previously-determined molten fraction should then reduce the uncertainty in flow model analyses that directly rely on these thermal properties.
3. Data
3.1. Study Area
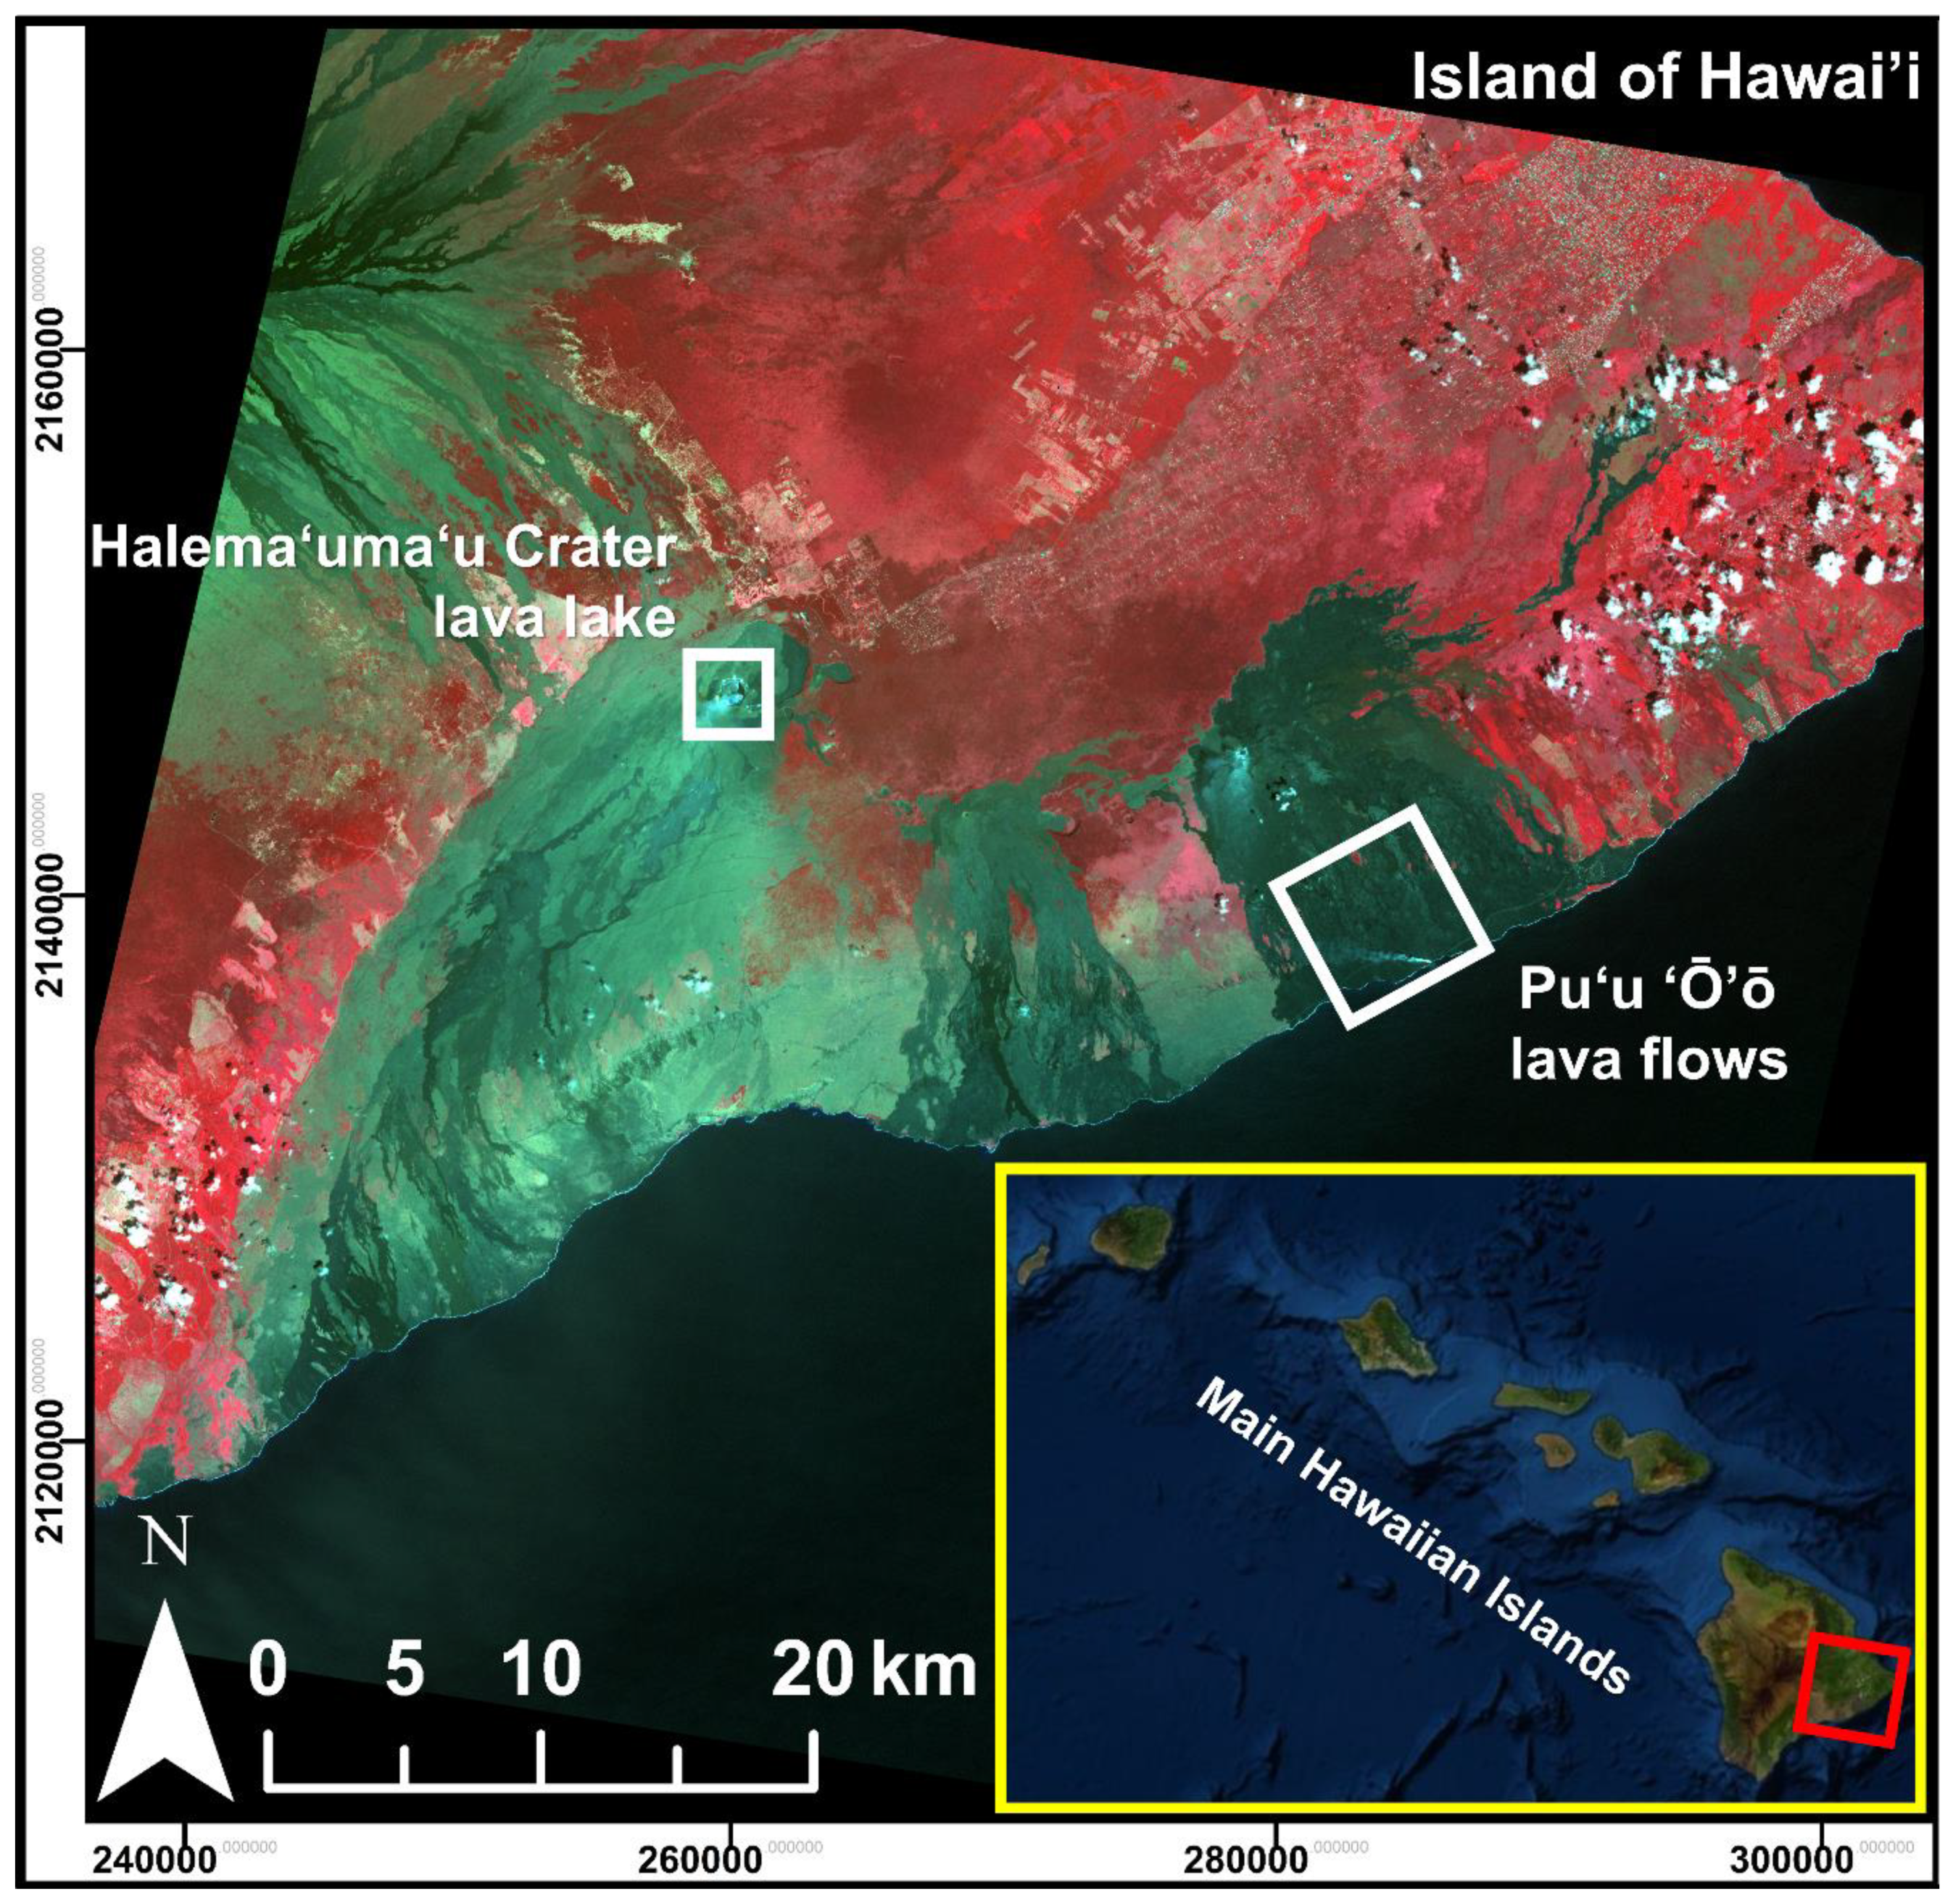
This study was conducted during two field campaigns at Kīlauea Volcano in Hawai’i, USA, in January/February 2017 and 2018, a period when both the summit lava lake and coastal plain surface lava flows were active. It focused primarily on the lava lake in the Halemaʻumaʻu Crater and propagating lava flows from the Puʻu ‘Ō’ō vent (Figure 1). Kīlauea is a basaltic shield volcano that has been erupting nearly continuously for the past 500 years [33]. The lava surfaces are produced during long sustained eruptions where pāhoehoe (tube- and surface-fed) and ‘a’ā flows are emplaced [33]. The lava lake in the Halemaʻumaʻu Crater observed during this study was active from 2008 until 2018 and varied in size with maximum dimensions of 160 m wide and 225 m long (Figure 1) [34]. During this period, there were fluctuations in lava lake activity with continuous gas plumes and irregular small explosions, finally ending with the summit collapse in May 2018 [13,34]. At the time of the field campaigns, the lava lake level was relatively high but not overflowing, approximately 100–130 m below the Halemaʻumaʻu Crater rim. It was continuously circulating with fresh lava upwelling in the north that migrated to the south, cooled and formed plates of cooler, solidified lava. The lava then sank in the south, distinguished by the occurrence of strong splattering and degassing [34]. The lava flows from the Puʻu ‘Ō’ō vent were active for ~30 years erupting in many locations over numerous eruptive episodes, producing mostly pāhoehoe lava flows with the occasional ‘a’ā lava flow [33,35]. This long eruption finally ended in 2018 with the cessation of the lower East Rift Zone (LERZ) eruption in the Leilani Estates [14]. The lava flows observed during our 2017–2018 study were part of the 61g episode that erupted from the east flank of Puʻu ‘Ō’ō. These flows propagated down the Pulama pali and entered the ocean at Kamokuna as a series of pāhoehoe surface lava flow and lava tubes (Figure 1) [35]. The majority of the flows observed were tube-fed pāhoehoe, both sheet-like and ropey in texture. Previous remote sensing studies of the pre-2018 Kīlauea eruption have investigated lava discharge rates [36], lava flow emplacement tracking [37], and lava pathway mechanisms [38]. The areas for this study were chosen for the high probability of observing molten lava surfaces combined with the availability of a variety of remote sensing TIR datasets.
3.2. Remote Sensing Data
3.2.1. Instruments
During the field campaigns, TIR data were acquired of the volcanic targets on 22 separate occasions. Of these, simultaneous data from all the sensors were acquired three times (Table 1). These included data from ground and airborne instruments made possible by two NASA-sponsored airborne campaigns to Hawaii in support of a proposed orbital mission data collection/analysis effort. The spaceborne data were acquired by the ASTER instrument, which has been in orbit aboard the Terra satellite since December 1999 [6]. Following the failure of the shortwave infrared (SWIR) system in 2008, ASTER is now a two-subsystem instrument with eight channels between 0.52 and 11.65 μm and a spatial resolution between 15 and 90 m [6]. For this study, only the five TIR channels between 8.125 and 11.65 μm with a spatial resolution of 90 m are used (Table 2). The airborne MASTER and HyTES instruments were mounted on a NASA ER-2 aircraft that flew at an altitude of ~20 km. MASTER is a 50-channel instrument that detects radiance between 0.4 and 13.0 μm, with a FOV of 85.92° resulting in a ground spatial resolution of ~50 m from the flight altitude [21]. In this study, the seven TIR channels are used between 8.0 and 13 μm (Table 2). HyTES is a hyperspectral TIR instrument with 256 channels that detects radiance between 7.5 and 12 μm, with a FOV of 50° resulting in a ground spatial resolution of ~35 m at an altitude of ~20 km [20]. In this study, 128 HyTES channels between 8.3 and 11.6 μm are used due to an instrument calibration resampling (Table 2). Finally, the MMT-Cam ground-based system acquired data in six spectral channels plus a broadband temperature channel between 8.0 and 11.5 μm, with a FOV of 45° × 37° (Table 2) [19].
3.2.2. Data Calibration
Before extracting the surface kinetic temperature and emissivity from the various datasets, the raw radiance data are calibrated and corrected for instrumentation and atmospheric effects (Figure 2). The ASTER instrument data are radiometrically calibrated by viewing an internal constant temperature blackbody and cold space. Occasionally, the internal blackbody is heated and cooled to provide a multi-temperature radiometric calibration [6]. The MASTER and HyTES data are corrected for aircraft motion and orthorectified using digital terrain models [20,21]. The MASTER instrument is spectrally and radiometrically calibrated in the laboratory using two blackbodies pre- and post-campaign, with a cold blackbody used during the data acquisition [21]. In the laboratory, the HyTES instrument is spectrally calibrated using narrowband interference filters and radiometrically calibrated using a blackbody between 4 and 40 °C [20]. Finally, the MMT-Cam instrument is spectrally and radiometrically calibrated in the laboratory using a blackbody between 20 and 800 °C [19].
The ASTER, MASTER, HyTES, and MMT-Cam radiometrically calibrated at-sensor TIR radiance data are all atmospherically corrected to derive the at-surface radiance (Figure 2). The MASTER and ASTER data are corrected using the MODTRAN radiative transfer model with the water vapor scaling method to optimize the atmospheric correction [39]. The HyTES data are corrected using the in-scene atmospheric correction method [40]. The MMT-Cam spectral channels are co-registered using a fast Fourier transform algorithm with centroid matching and then atmospherically corrected using the SpectralCalc simulator [19].
4. Methods
4.1. Kinetic Temperature and Emissivity
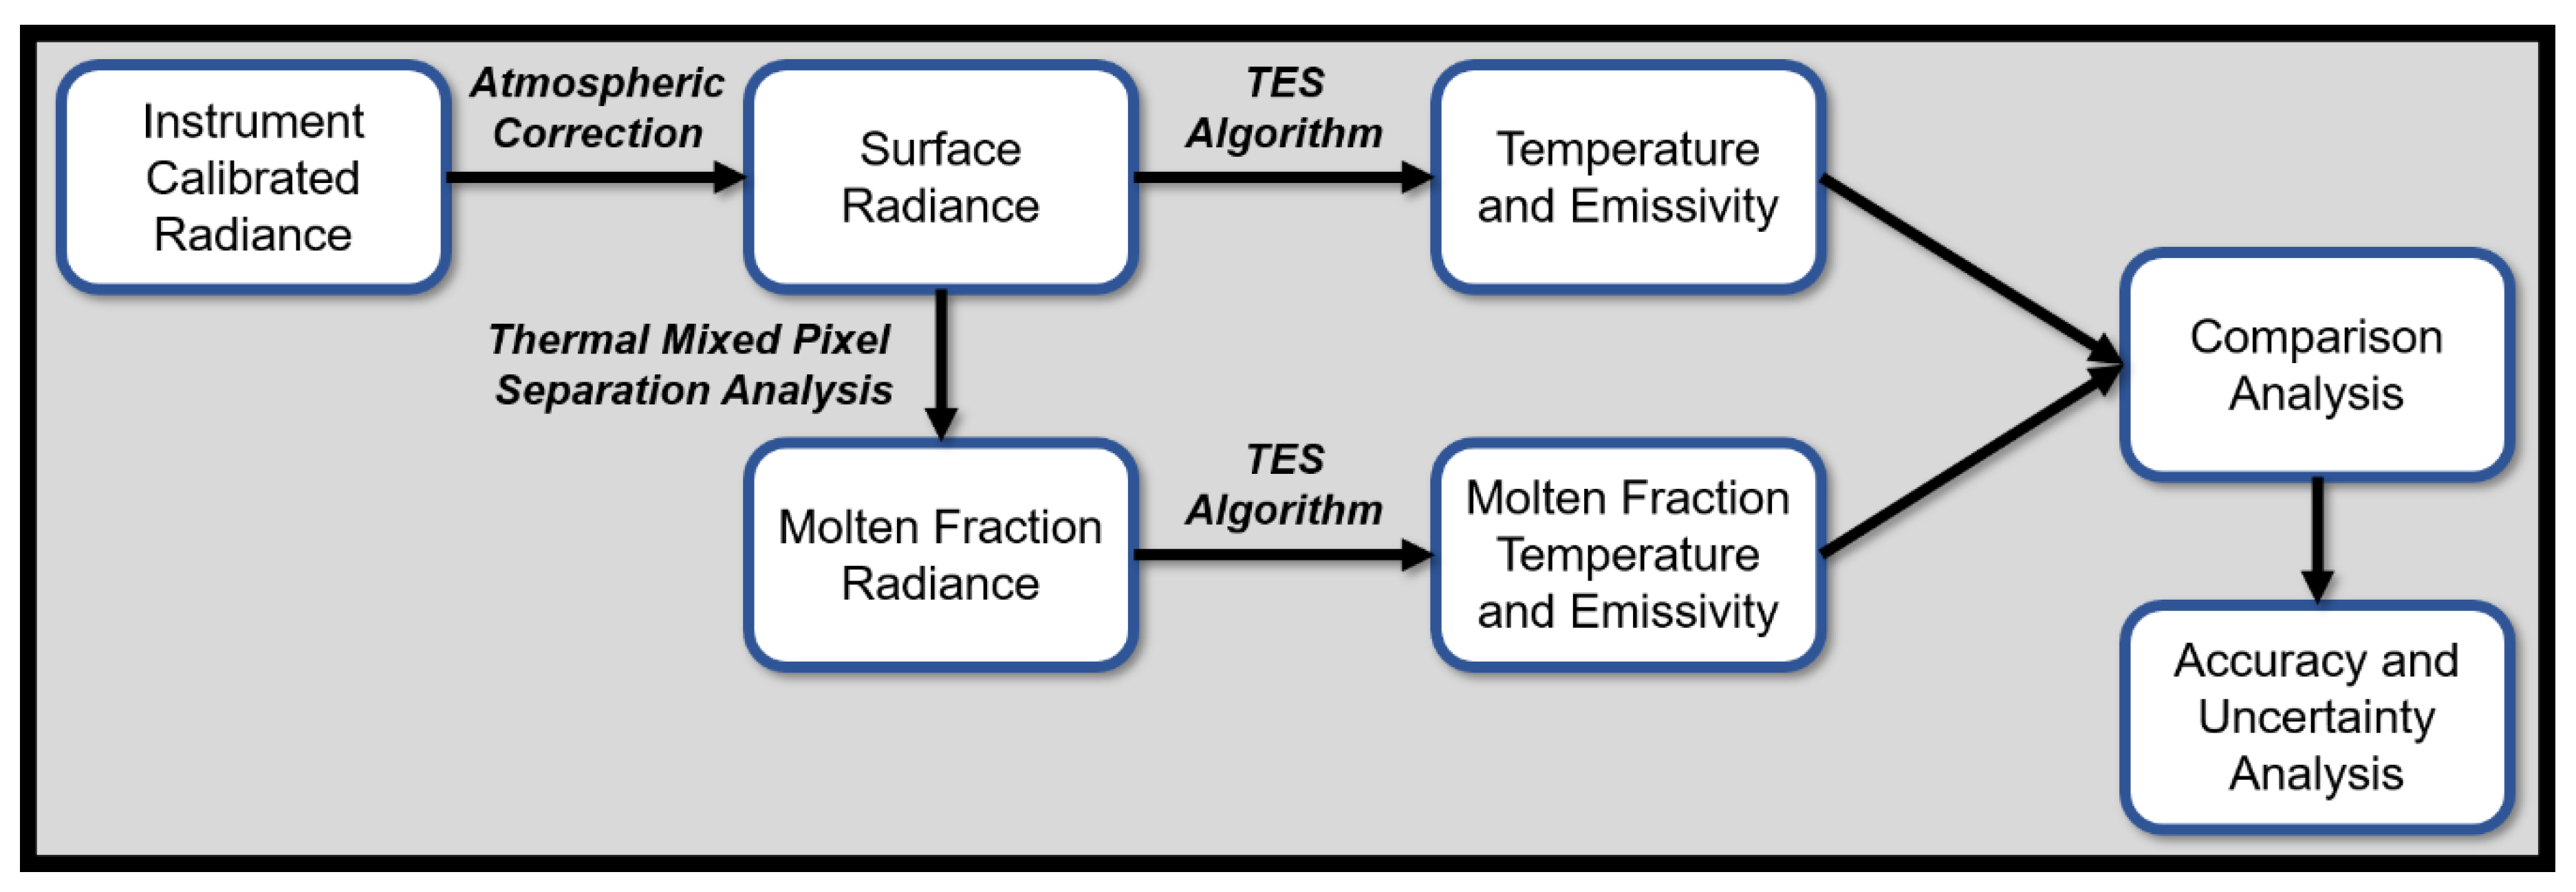
Kinetic temperature and emissivity are derived from the calibrated surface radiance data using the temperature emissivity separation (TES) algorithm (Figure 2), first developed for ASTER data [28]. The algorithm first assumes a brightness temperature using a maximum scene emissivity and the spectral morphology of each pixel is derived. An emissivity calibration curve relating spectral contrast to the minimum emissivity is then used to constrain the true emissivity values from band ratios. The calibration curve is empirically determined for each instrument separately using data from a laboratory spectral library. Finally, the kinetic temperature is then calculated from the maximum derived emissivity using the inverse Planck function [28].
4.2. Thermally-Mixed Pixel (TMP) Separation Analysis
In most TIR remote sensing data of active volcanic thermal anomalies, a pixel contains multiple surface fractions (or end-members) that can include temperature, composition, and texture. The spectrum of a mixed pixel composed of two or more fractions represents the areal-weighted averages of those end-members rather than being dominated by any one [29]. This problem increases in complexity with lower spatial resolution data and the increased mixing of potentially more surface fractions [41]. However, the end-members within any given pixel can be deciphered with knowledge of radiance theory, a well-developed spectral deconvolution model, and an understanding of the spectral signatures of the end-members (e.g., an end-member spectral library).
A straightforward solution to the thermally-mixed pixel problem was originally developed by Dozier [42] using a dual-band approach to define the two thermal fractions within a pixel (Figure 2). The method uses surface radiance values from two spectral channels to derive the unique combination of each fraction, both the value and proportion:
where, is the mixed surface radiance in channel for the mixed temperature (). and are the surface radiances contributed by the hot temperature fraction and background temperature fraction, respectively; and is the proportion of the hot fraction within the pixel area [42,43]. Equation (1) is solved with two simultaneous equations at two different wavelength channels, each containing two unknown variables. This approach provides a unique solution for the radiance of one fraction (either molten lava or the background) and its fractional proportion after assuming or knowing the value for the other radiance value.
In this study, the surface radiance values are unmixed within each pixel for each dataset using a channel at 8.5 μm and 11.0 μm. The background fraction applied to the analysis is the average value of the non-active regions for each scene and each channel in the dataset. After the thermal mixed pixel (TMP) separation analysis is applied, the molten fraction datasets are integrated into the TES algorithm in order to derive kinetic temperature and emissivity of the molten fractions only (Figure 2). These values for each pixel are then compared to the results from the same pixels prior to the unmixing analysis. Finally, the variability within each dataset is quantified to evaluate the effect of spatial and spectral resolution on the discrepancy and uniqueness.
4.3. Accuracy and Uncertainty Assessment
The accuracy and degree of variability of the measured surface radiance as well as the derived kinetic temperature and emissivity for each TIR dataset are quantified through comparative analysis (Figure 2). The TMP separation analysis approach is held as constant as possible to evaluate only the influence of spatial resolution. After spatial resolution, the largest variability between the datasets is the spectral resolution, which has less of an effect because the channel locations are commonly within 0.5 μm of each other. The hyperspectral resolution of the HyTES data increases the level of complexity for the comparative analysis to the multispectral resolution datasets. All analyses on the HyTES data are computed at full resolution, however, these results are then spectrally degraded to perform the later comparison. The HyTES data also provide a spectral resolution comparison with the MASTER data acquired at the same time and at a similar spatial resolution, which allows the influence of spectral resolution to be quantified. Finally, the sensitivity of spatial resolution on the derived kinetic temperature and emissivity is determined to quantify constraints on the degree of uncertainty with spatial resolution change.
5. Results
5.1. ASTER Data
Two regions of interest (ROI) of cooling lava surfaces (the lava lake at the Halemaʻumaʻu Crater and the lava flows from Puʻu ‘Ō’ō on the coastal plain) are chosen to evaluate the retrieval of surface radiance, kinetic temperature, and emissivity from the ASTER data. Within these ROIs, mixtures of both the cool crust and molten lava surfaces are represented in most pixels (Figure 3).
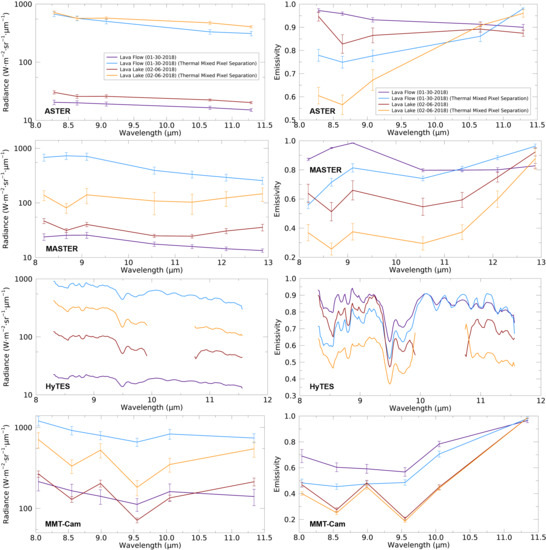
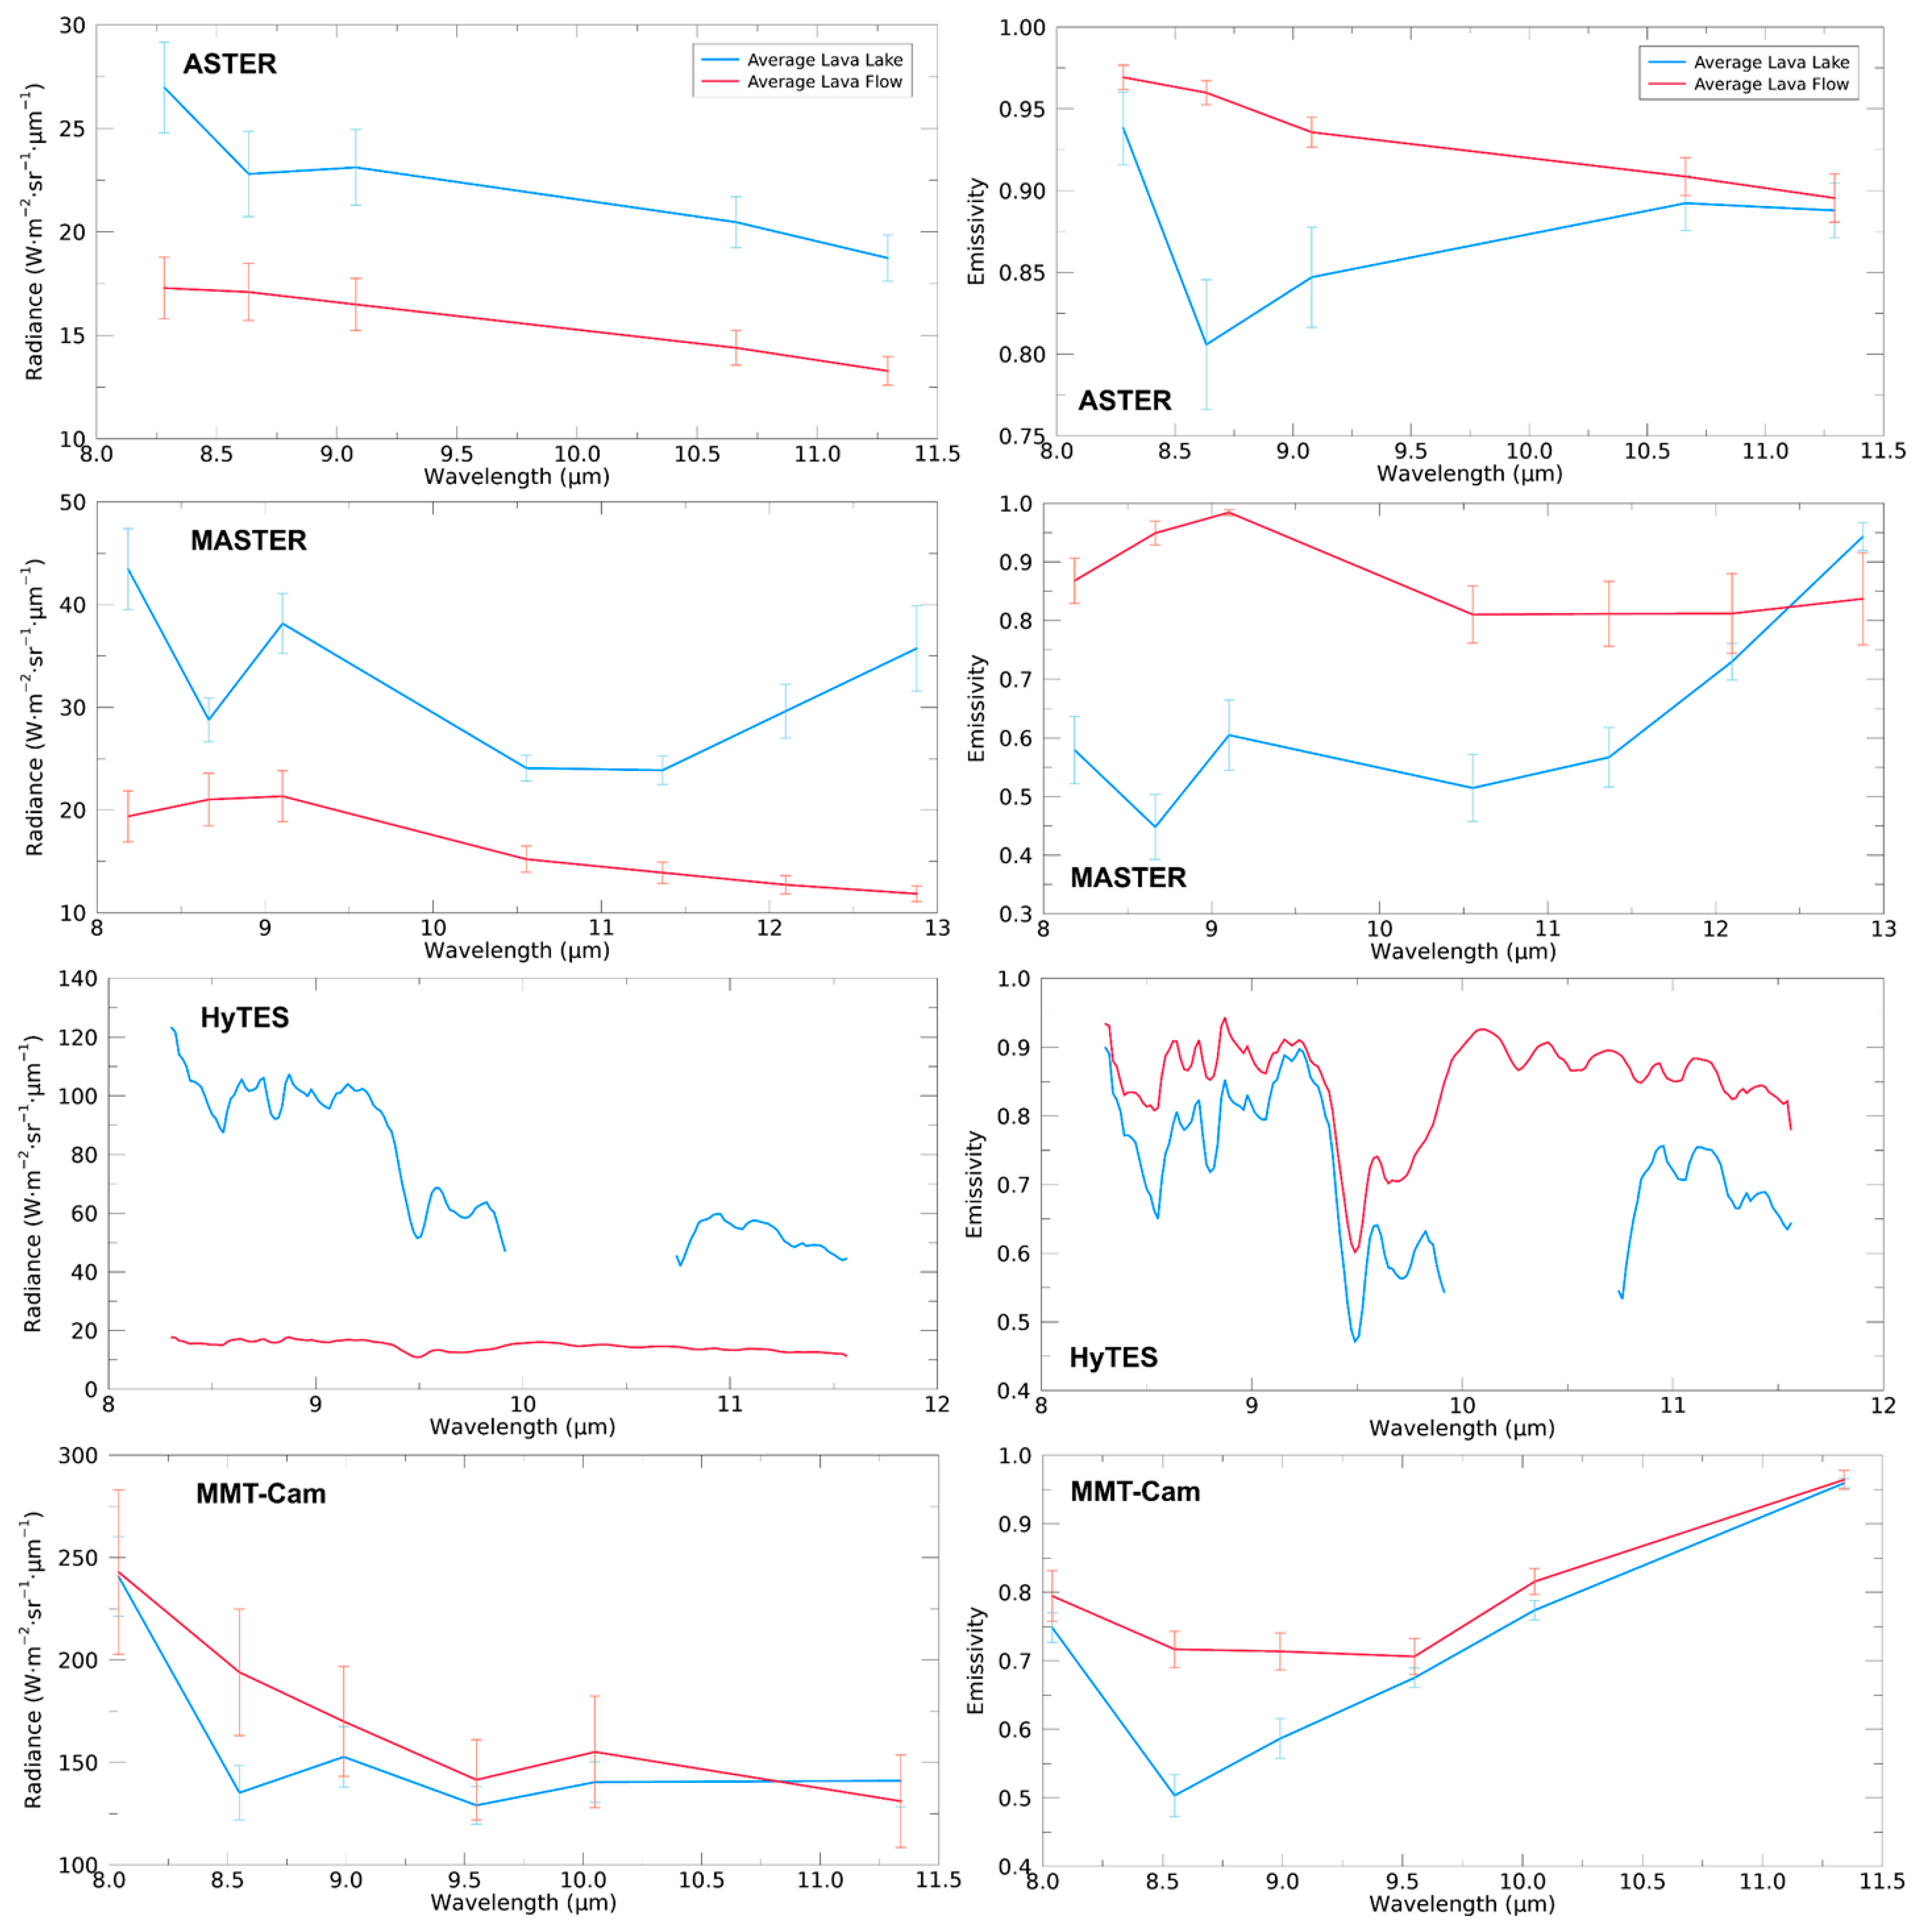
The ASTER surface radiance of the active lava is lower than expected for molten basalt (Figure 4) with an average of 19.74 W·m−2·sr−1·µm−1 and a variability of 5.85 W·m−2·sr−1·µm−1. The emissivity spectra have an absorption feature at 8.63 µm and higher spectral contrast in the lava lake data. The average pixel-integrated emissivity is 0.898 with a variability of 0.077 (Figure 4), whereas the average pixel-integrated kinetic temperature is 354.1 K with a variability of 23.8 K; both of which are significantly lower than expected for molten basaltic lavas [44,45].
5.2. MASTER and HyTES Data
The same two ROIs were selected in the MASTER and HyTES data; however, the number of pixels that constitute each of these are higher by a factor of approximately three compared to ASTER (Figure 3).
The MASTER surface radiance is also lower than expected for the temperatures of molten basalt (Figure 4) with an average of 25.77 W·m−2·sr−1·µm−1 and variability of 8.94 W·m−2·sr−1·µm−1. The pixel-integrated emissivity spectra have a narrow absorption feature at 8.63 µm and a broader absorption feature around 10.63 µm (Figure 4). The average emissivity is 0.723 with a variability of 0.130. The average pixel-integrated kinetic temperature is 425.2 K with a variability of 64.3 K.
The HyTES surface radiance data are lower than those extracted from MASTER over the lava flows but greater over the lava lake (Figure 4). The average surface radiance is 34.83 W·m−2·sr−1·µm−1 with a variability of 13.81 W·m−2·sr−1·µm−1. The emissivity spectra have an absorption feature at ~9.48 µm (Figure 4). The average pixel-integrated emissivity is 0.805 with a variability of 0.114, and lower values are derived from the lava lake; whereas the average pixel-integrated kinetic temperature is 407.8 K with a variability of 32.5 K. These values are also lower than the MASTER-derived temperatures, but at a lower variability.
5.3. MMT-Cam Data
The MMT-Cam data presented here are extracted from ROIs covering similar activity to the airborne and orbital data ROIs, especially at the lava lake (Figure 3). The lava flow ROIs, however, are significantly smaller but more spatial detail is observed in these data due to the high spatial resolution (<0.1 m). The radiance and kinetic temperatures derived from the MMT-Cam data are higher than the other datasets analyzed in the study, as expected.
The radiance derived from the MMT-Cam ROIs is closer to the values for molten basalt at the wavelengths and bandwidths of the MMT-Cam instrument (Figure 4). The average is 162.91 W·m−2·sr−1·µm−1 with a variability of 76.31 W·m−2·sr−1·µm−1. The emissivity spectra show a strong absorption between 8.55 and 9.55 µm, with both a single broad feature and two narrow features (Figure 4). The average pixel-integrated emissivity is 0.739 with a variability of 0.087, and the average pixel-integrated kinetic temperature is 736.2 K with a variability of 163.0 K.
5.4. Mixed Pixel Derivation
All the TIR datasets were next subjected to a thermally-mixed pixel separation analysis to extract the values associated with the maximum thermal fraction within each pixel (i.e., molten lava). This step evaluates the ability to measure an accurate molten fraction (if one is present) regardless of spatial scale within a given pixel and the radiance values associated with it. The background radiance values applied to this analysis are calculated from the average values of pixels at the background temperature for each channel of each dataset and observation. The largest difference between the original data and the unmixed counterparts was observed in the ASTER data and the smallest was seen in the MMT-Cam data, as might be expected based on their pixel sizes.
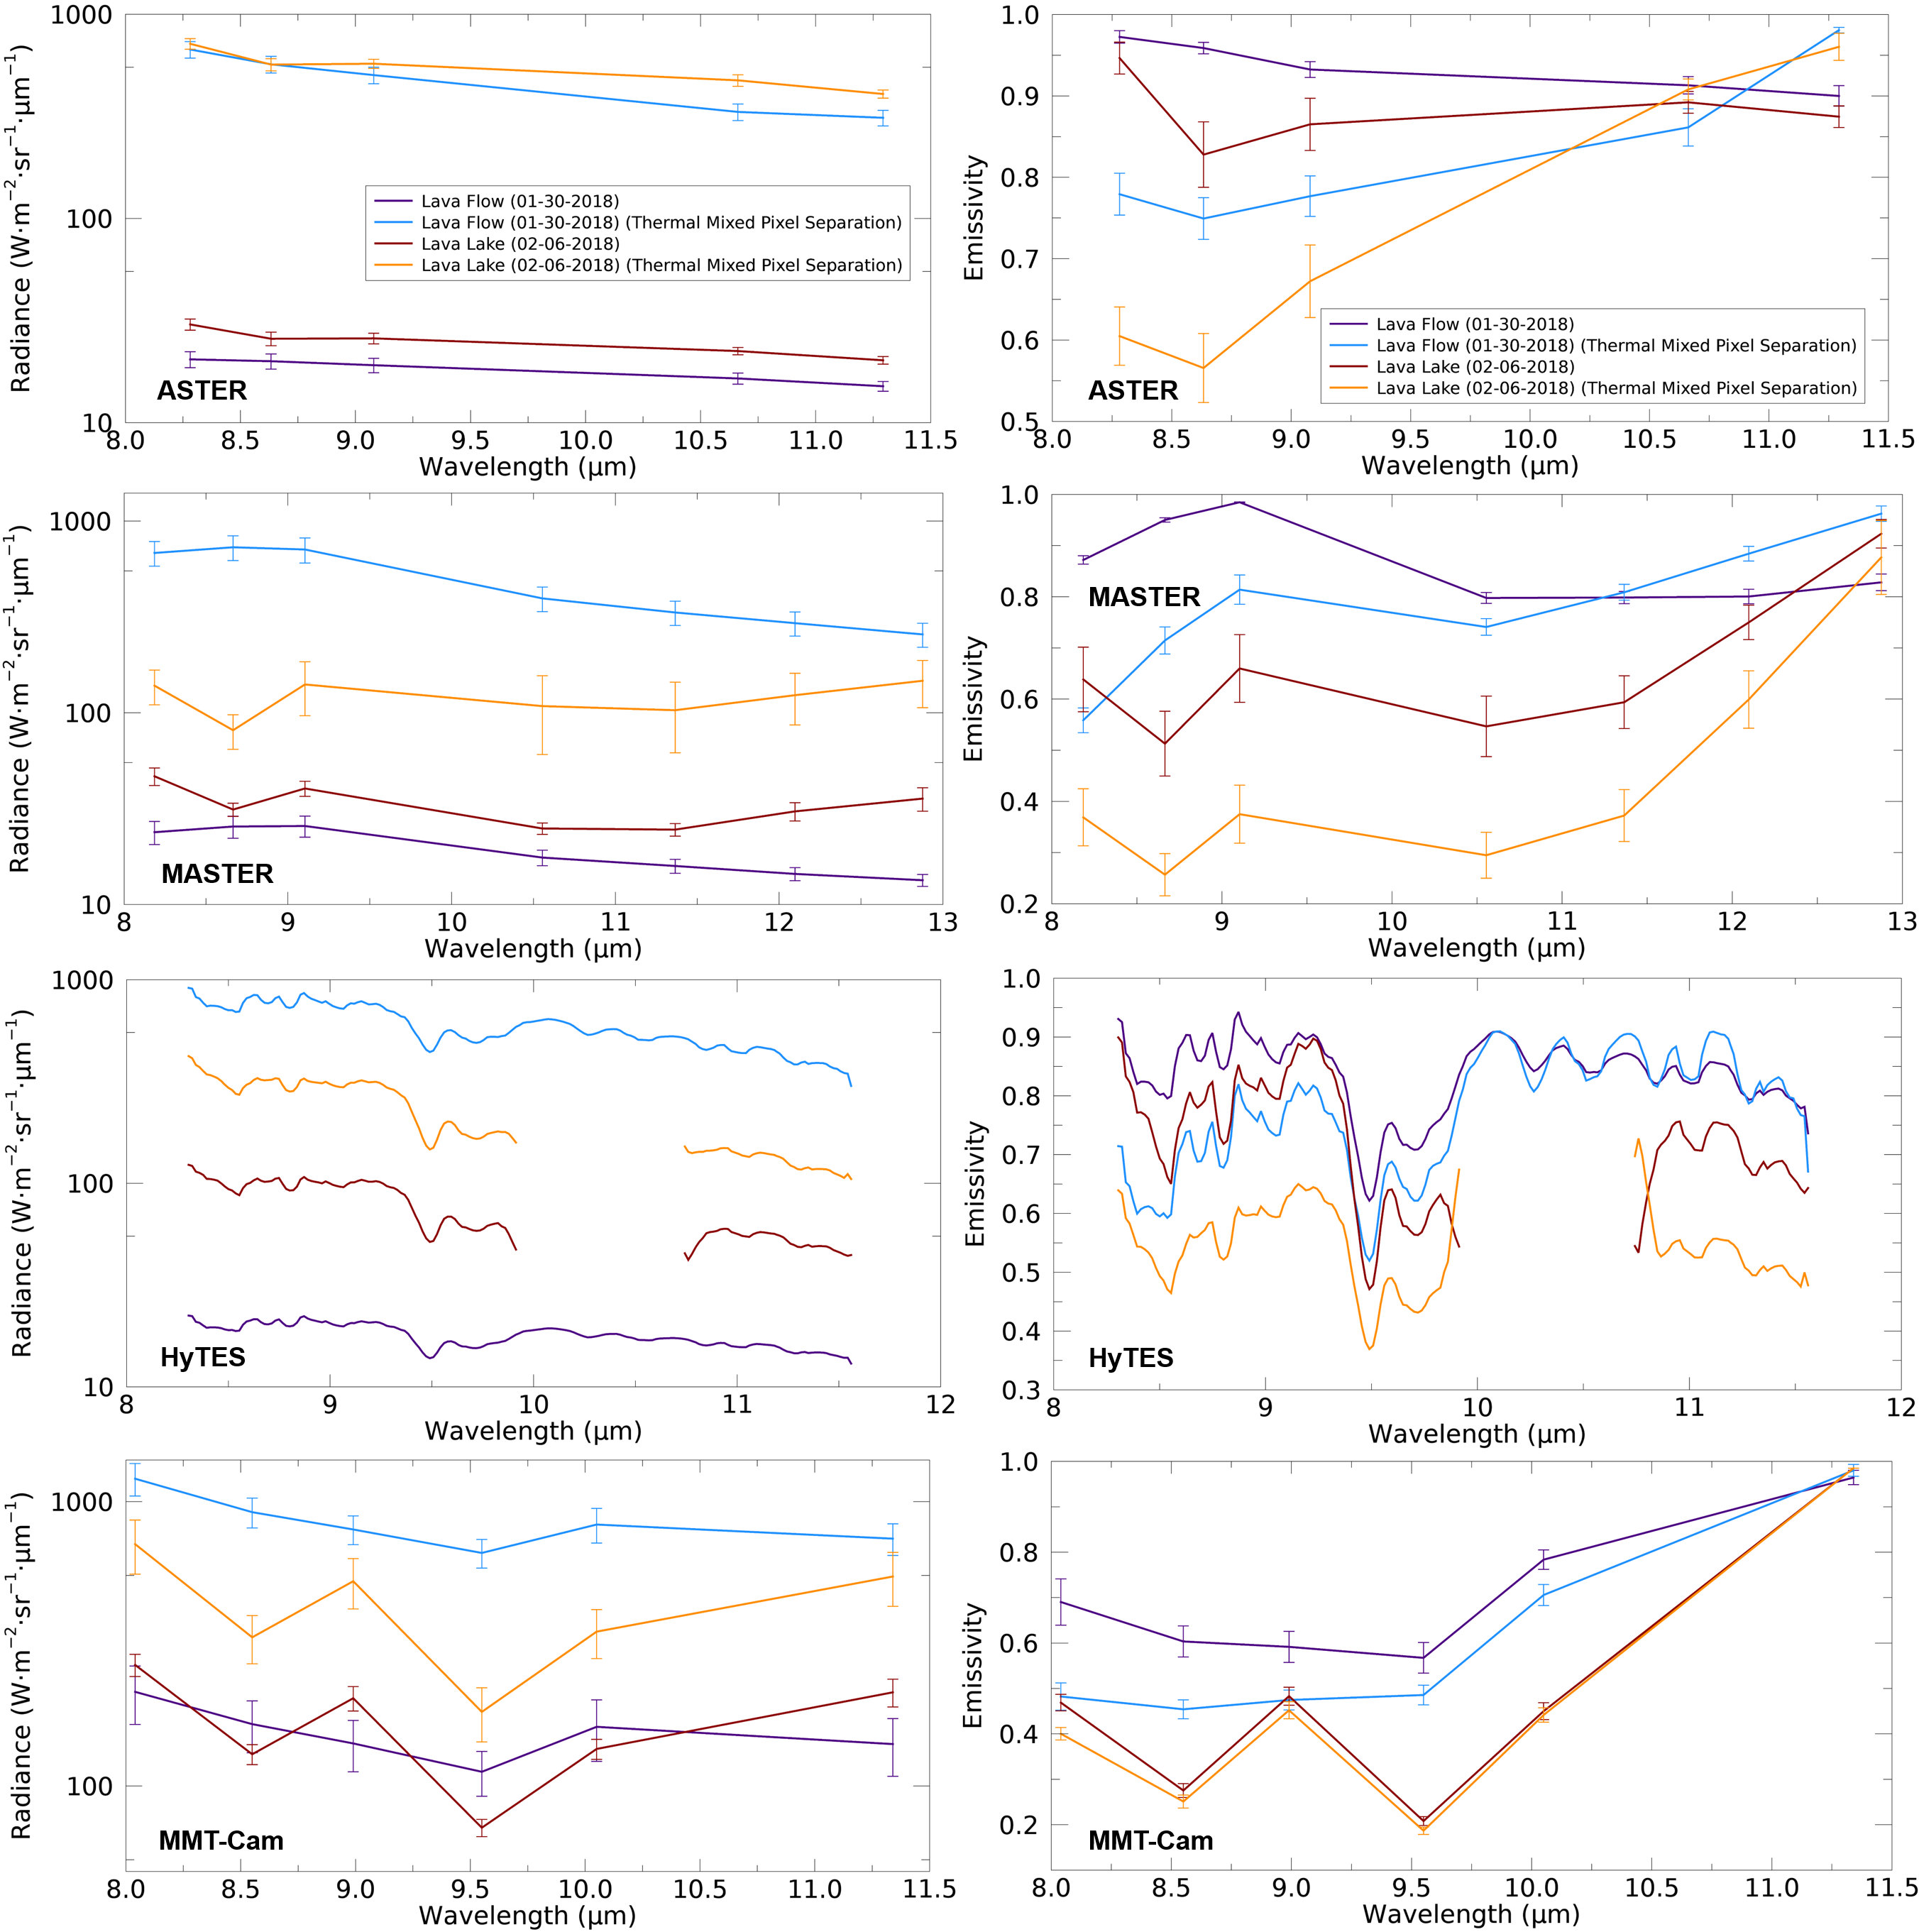
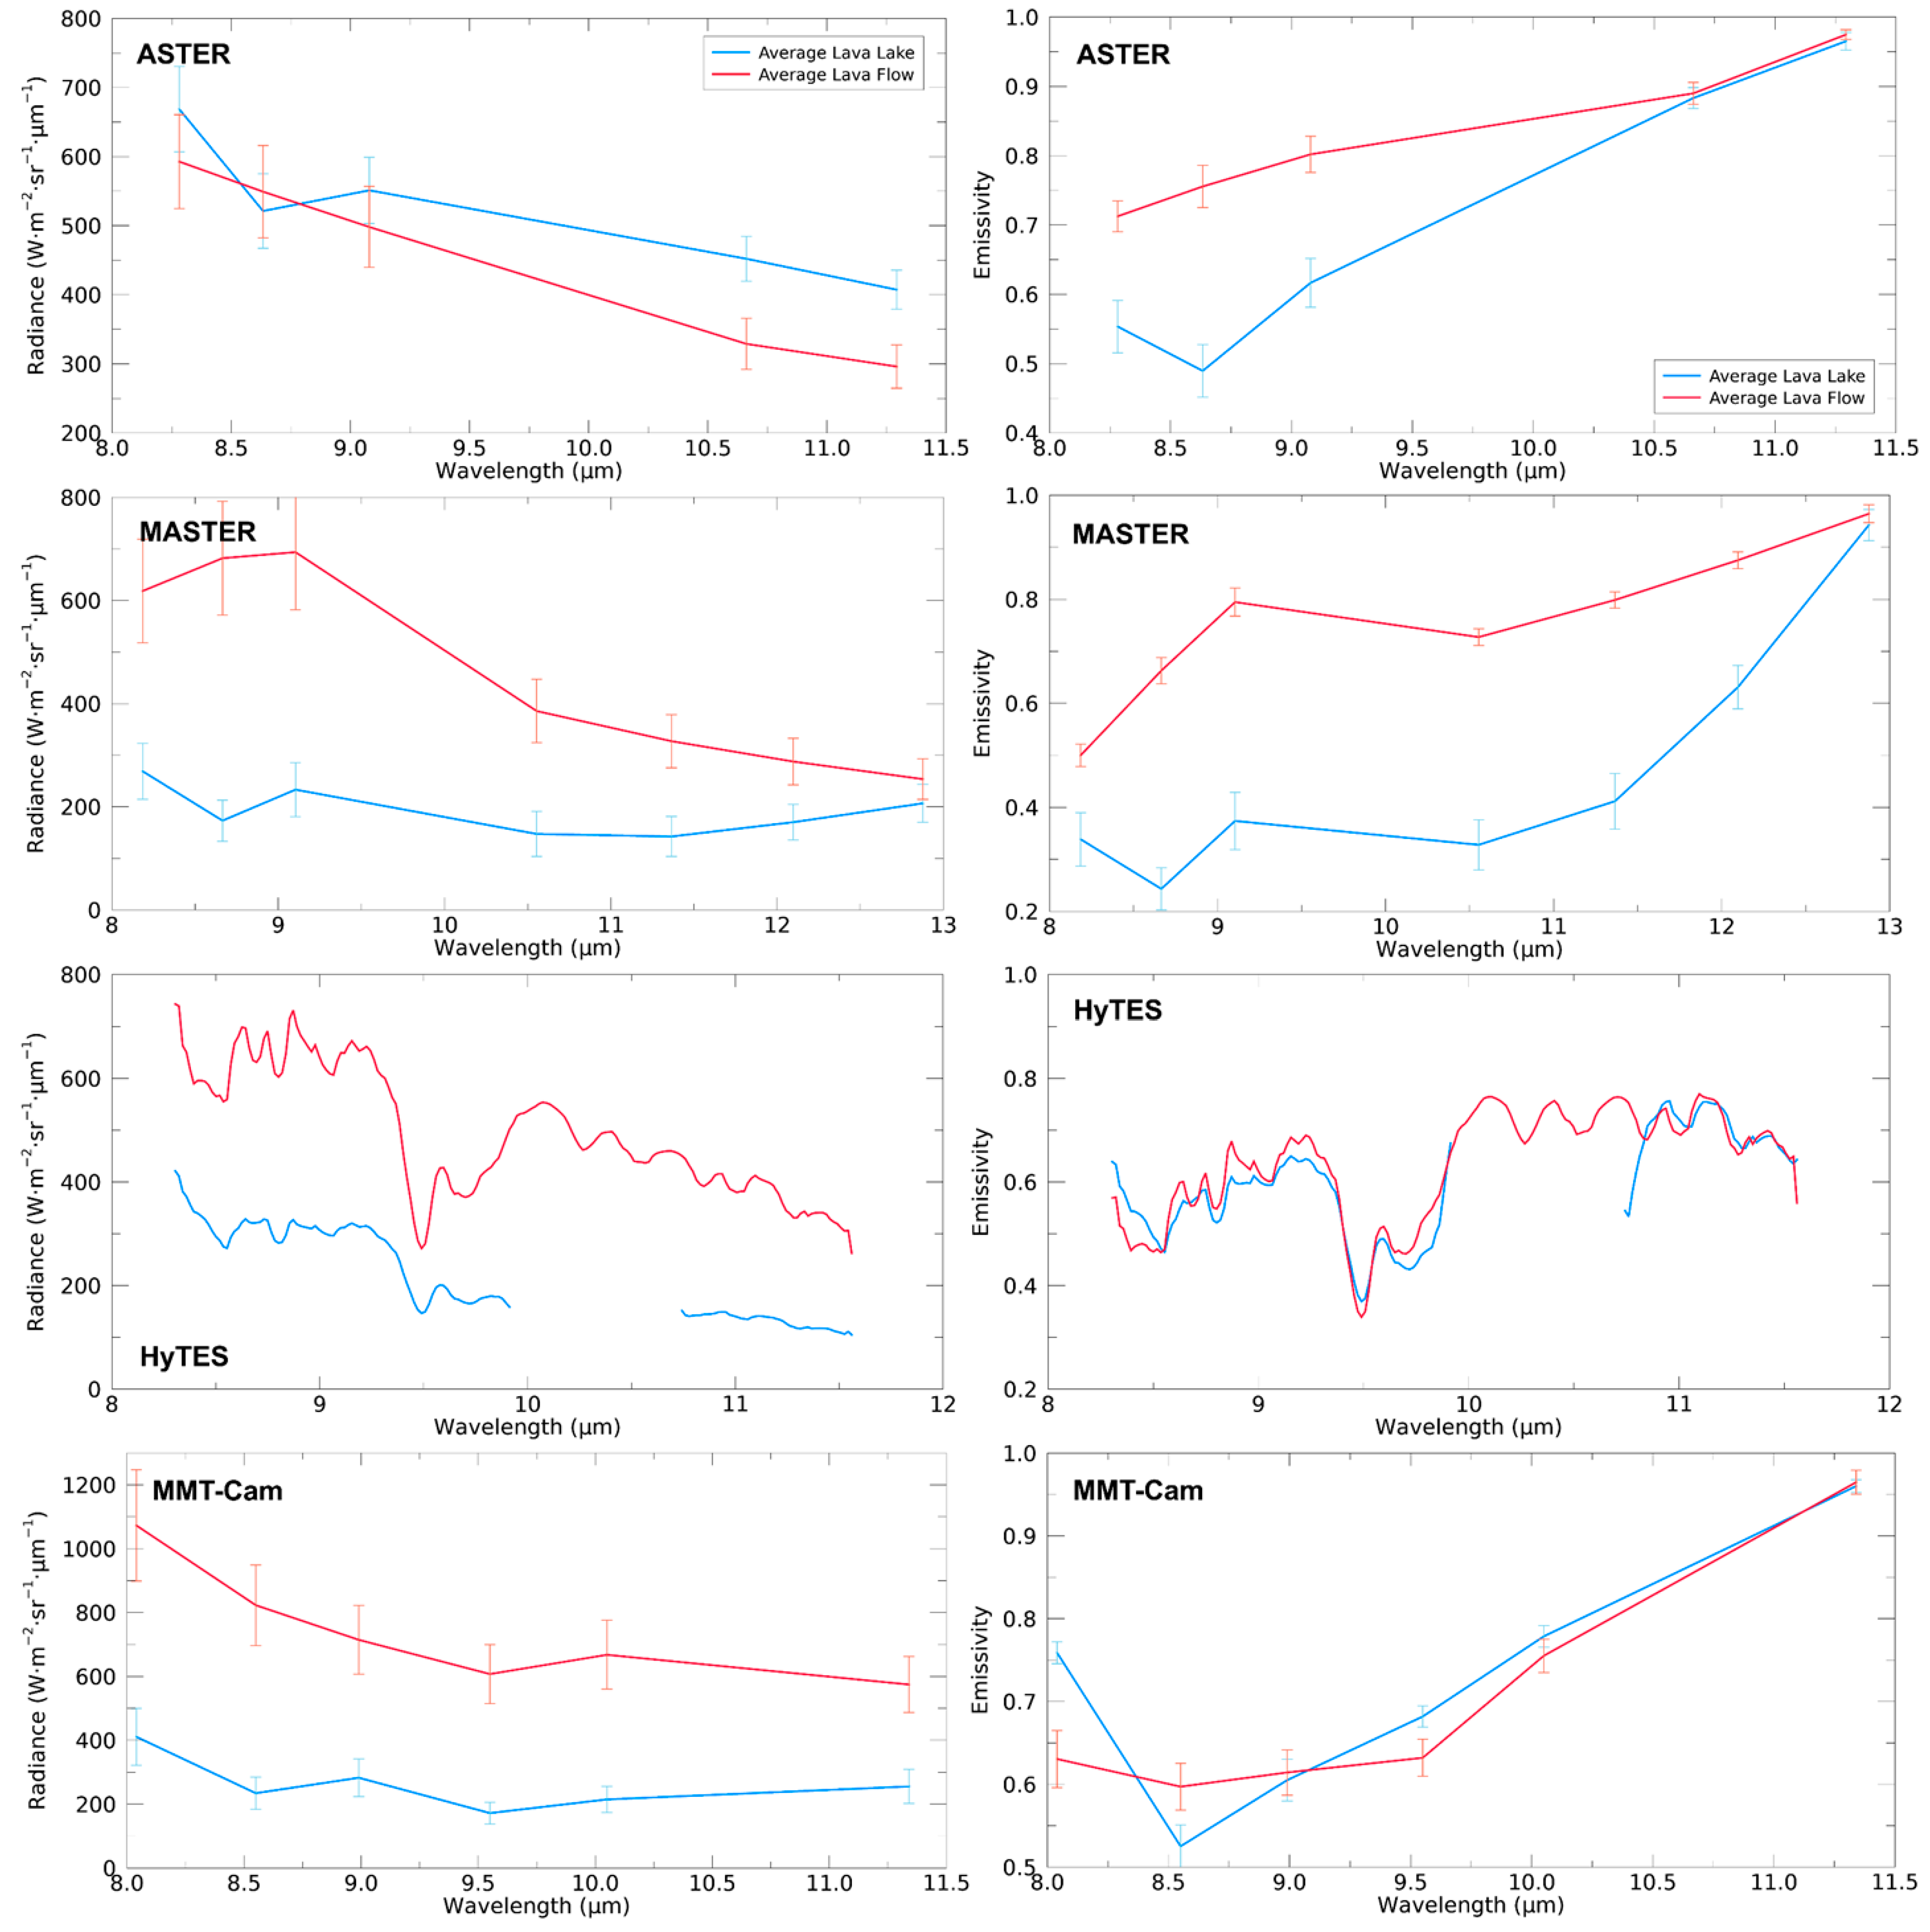
Following the mixed pixel derivations using an average background radiance of 8.18 W·m−2·sr−1·µm−1, the average ASTER surface radiance for the molten fraction increases to 493.22 W·m−2·sr−1·µm−1 as does the variability to 191.57 W·m−2·sr−1·µm−1 (Figure 5). The emissivity spectra have an absorption feature at 8.63 µm (except in one lava flow dataset) with a strong decrease in emissivity at shorter wavelengths (Figure 5). The absorption feature observed at 8.5–9.0 µm is associated with a molten Si-O absorption and is likely absent in the ASTER lava flow data due to the very low molten fractions (<0.05) observed with pixels at this target. The average molten fraction emissivity is 0.752 with a variability of 0.099; whereas the average molten fraction kinetic temperature is 1242.3 K with a variability of 337.0 K.
For the unmixed MASTER data using an average background radiance of 8.38 W·m−2·sr−1·µm−1, the average surface radiance derived for the maximum thermal fraction is 300.59 W·m−2·sr−1·µm−1 with a variability of 111.48 W·m−2·sr−1·µm−1 (Figure 5). The emissivity spectra from the lava lake show an absorption feature at 8.63 µm and the lava flow ROIs show a broad absorption feature at 10.63 µm with a decrease at wavelengths shorter than 9.09 µm (Figure 5). The average molten fraction emissivity is 0.584 with a variability of 0.141; whereas the average molten fraction kinetic temperature is 1128.2 K with a variability of 408.0 K.
Using an average calculated background radiance of 8.01 W·m−2·sr−1·µm−1, the average HyTES surface radiance derived for the molten fraction is 402.64 W·m−2·sr−1·µm−1 with a variability of 146.68 W·m−2·sr−1·µm−1. The emissivity spectra show an absorption feature at around 9.5 µm and a broader feature centered at 9.75 µm, with a decrease in overall emissivity at shorter wavelengths (Figure 5). The average molten fraction emissivity and kinetic temperature are 0.604 and 1266.1 K with variabilities of 0.260 and 404.0 K, respectively.
Lastly, using an average background radiance of 15.26 W·m−2·sr−1·µm−1, the average molten surface radiance derived from the MMT-Cam data is 454.27 W·m−2·sr−1·µm−1 with a variability of 158.12 W·m−2·sr−1·µm−1. The derived lava lake emissivity spectra show a single absorption feature between 8.55 and 8.99 µm or a double feature at 8.55 and 9.55 µm (Figure 5). The lava flow emissivity spectra decrease in emissivity below 10.05 µm and is centered at 8.55 µm (Figure 5). The average molten fraction emissivity and kinetic temperature values are 0.711 and 1225.9 K with variabilities of 0.078 and 329.6 K, respectively.
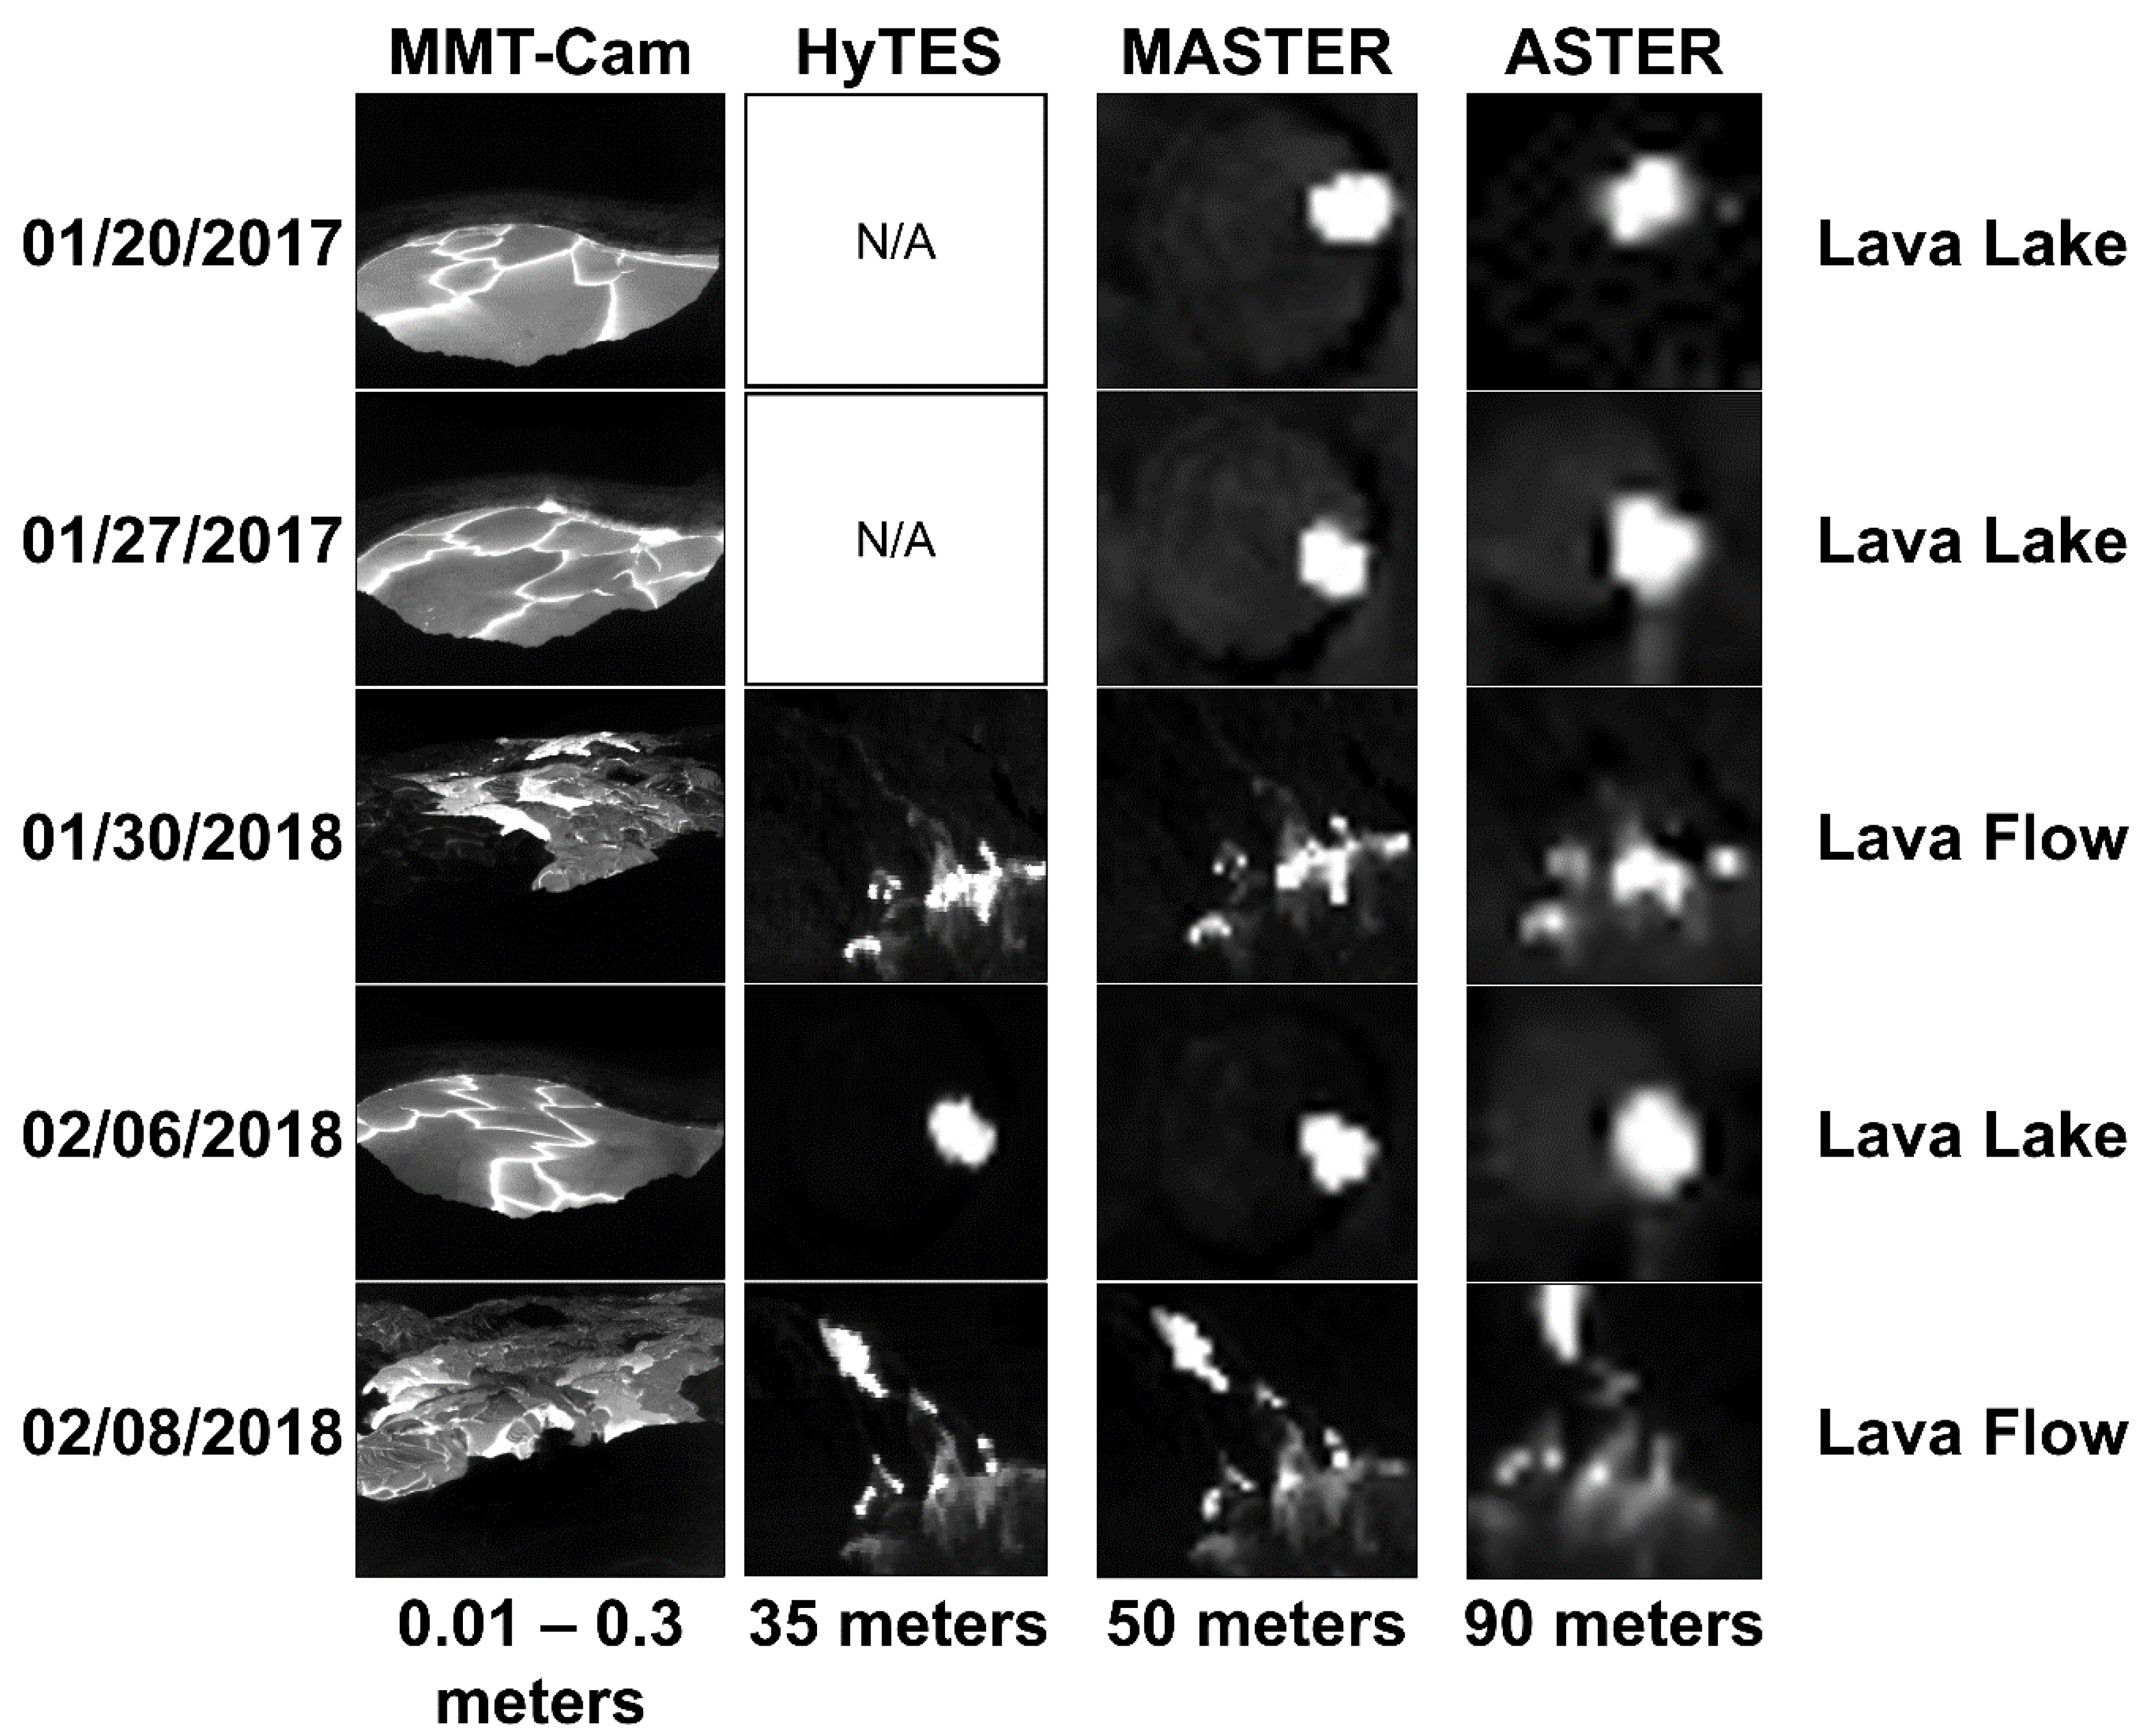
5.5. Comparisons and Trends
Qualitatively, significant variations are observed between the four datasets as a consequence of differences in spatial resolutions (Figure 3). The low spatial resolution ASTER data provide the least lava surface detail, whereas the high-resolution MMT-Cam data provide the greatest details. For example, crustal plates and molten spreading margins at the lava lake are observed in the MMT-Cam data but not in the ASTER data (Figure 3). However, the entire lava flow field is underrepresented in the MMT-Cam data due to the proximity of the instrument to the target. Additionally, greater spatial details of lava surface features are discerned in the HyTES data compared to the MASTER data, likely the result of a higher number of spectral channels (Figure 3). In general, the spatial resolution of the instrument strongly correlates to the scale of spatial detail qualitatively observed of the lava surfaces.
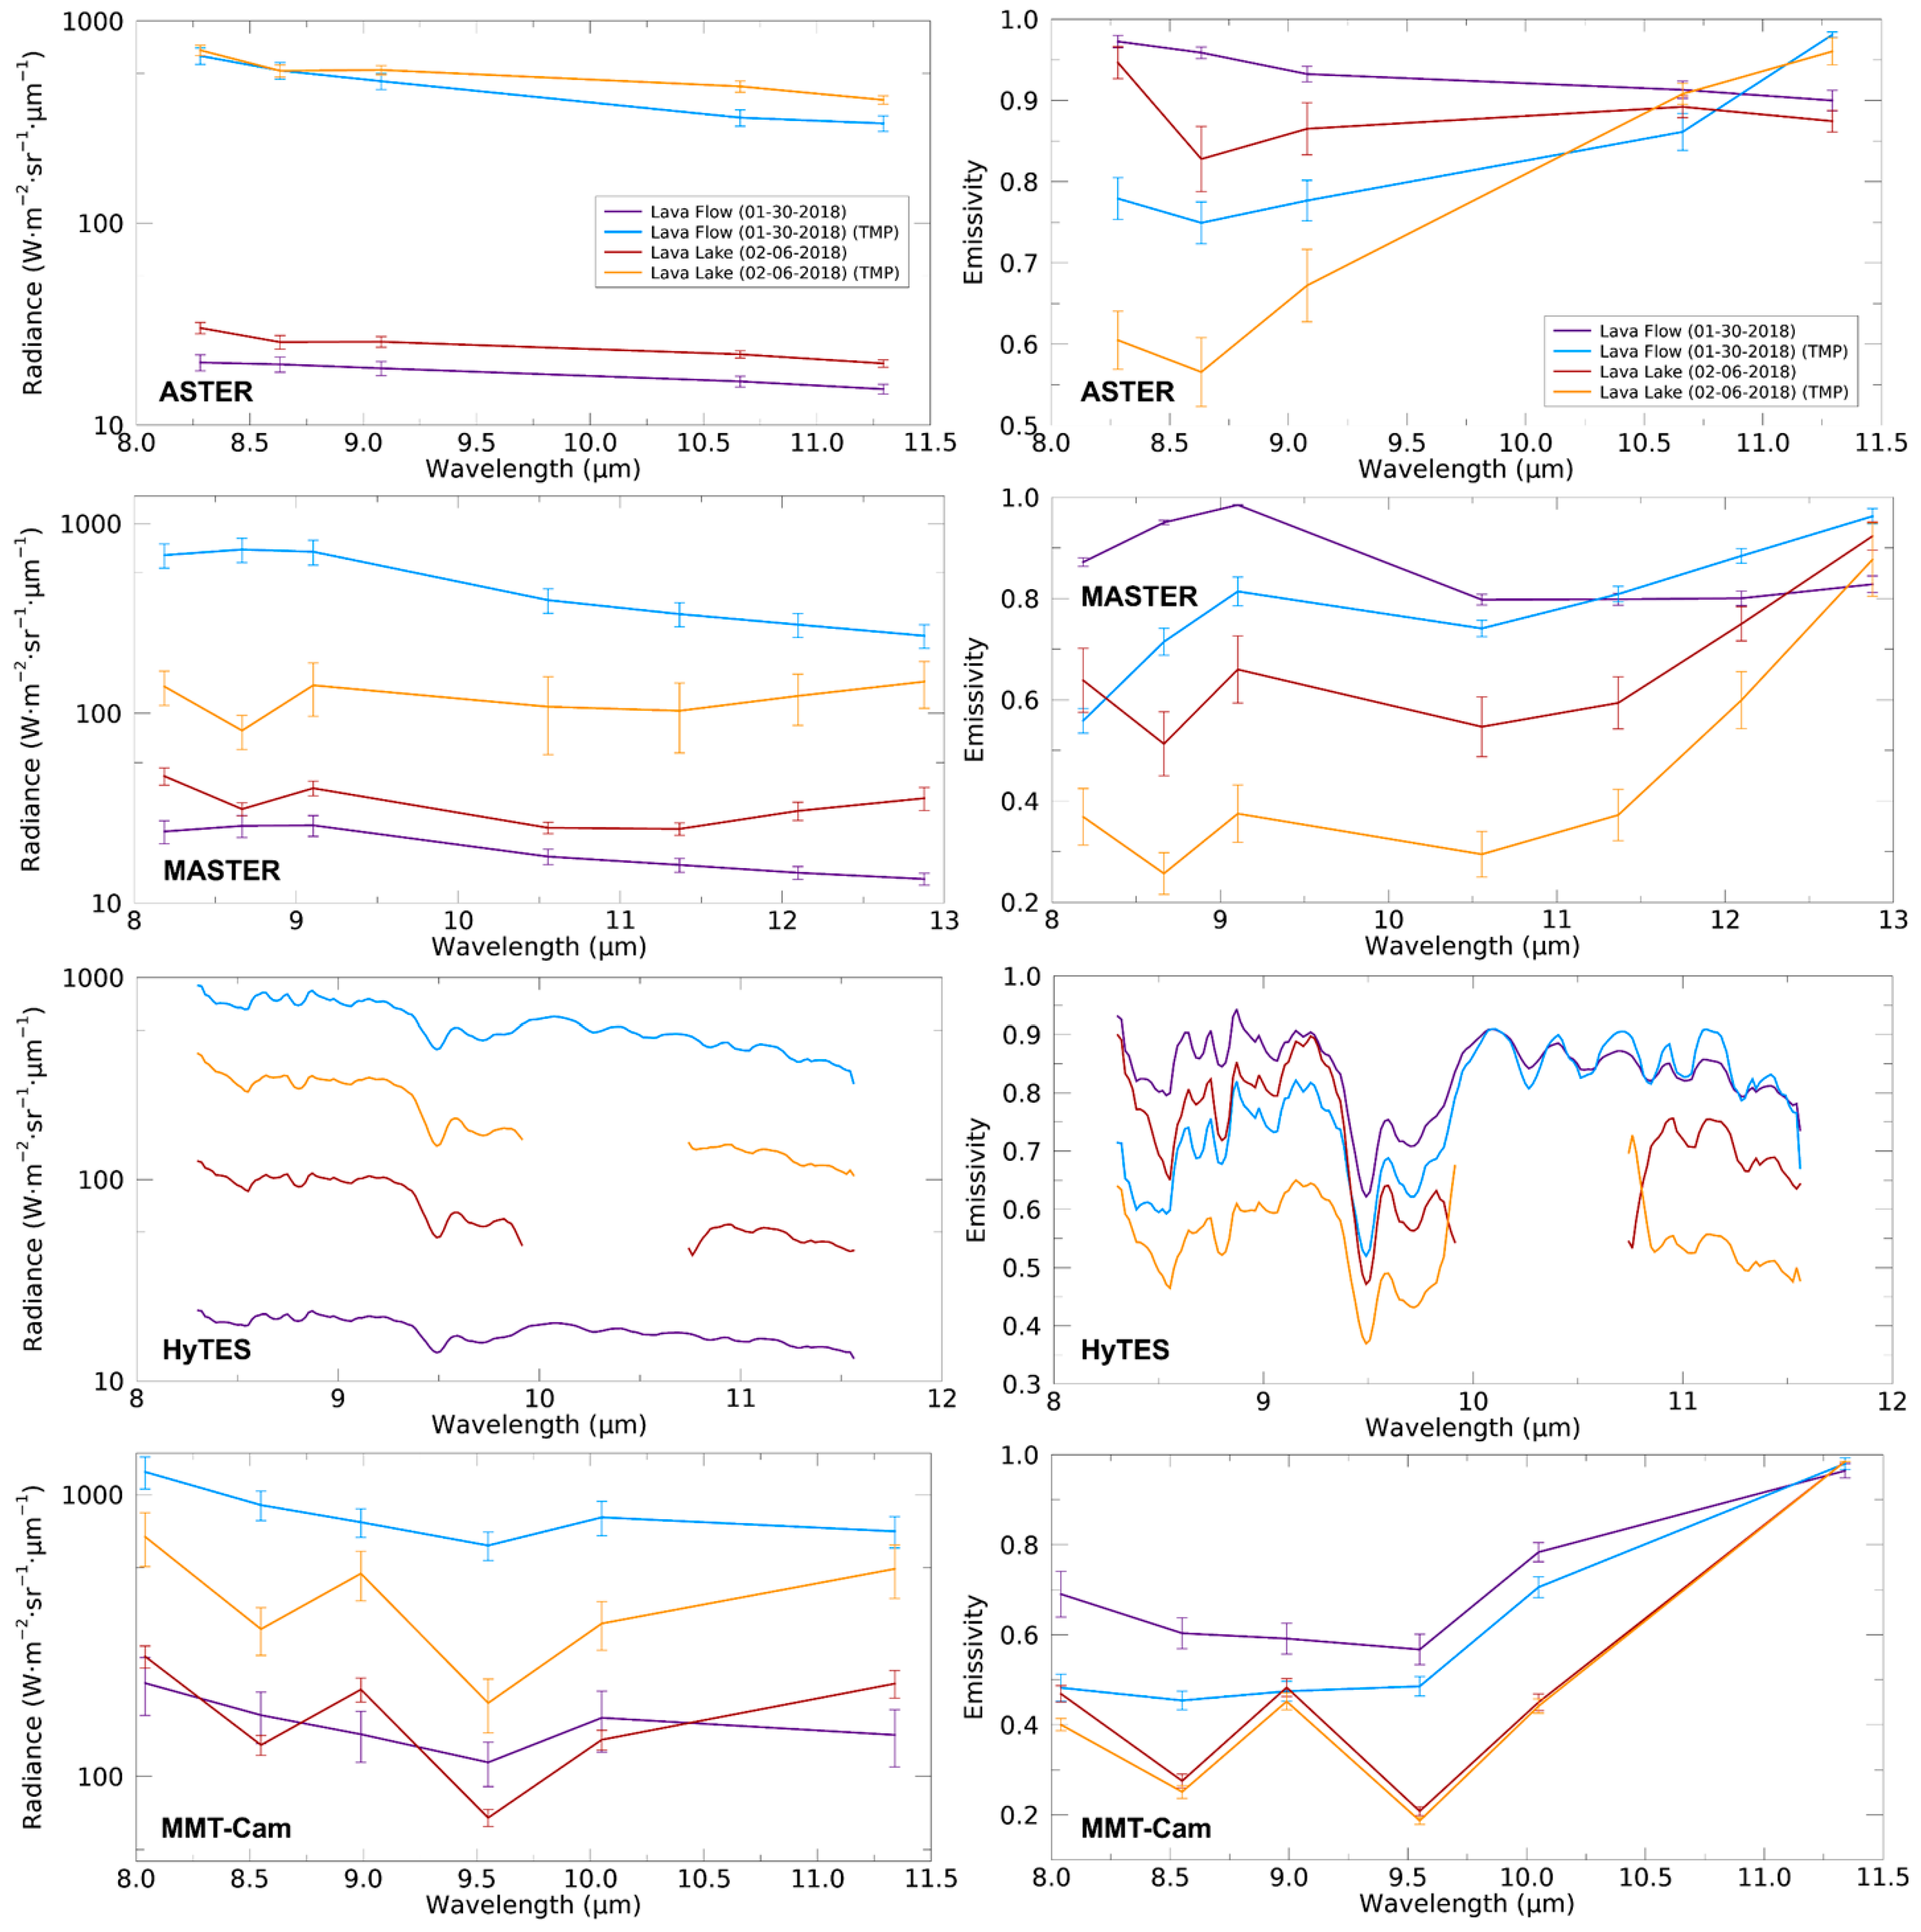
In all datasets, the surface radiance increases after the TMP separation analysis as would be expected. The ASTER surface radiance increases the most in the lava lake (2100%) and lava flow (2700%) data, compared to only a 70% and 330% increase in the MMT-Cam data, respectively (Figure 6 and Table 3). The MASTER and HyTES surface radiances increase by 500% and 200% in the lava lake data and 2800% and 3200% in the lava flow data, respectively. The highest increases are observed at shorter wavelengths (Figure 6), which is consistent with Wein’s Law where the peak radiance shifts to shorter wavelengths with increasing temperature [41]. The TMP separation analysis appears to provide a consistent and reasonable method for extracting the higher temperature fractions and allows more accurate values of surface radiance, kinetic temperature, and emissivity to be extracted from the lower spatial resolution datasets.
In general, the pixel-integrated temperatures derived from data prior to the TMP separation analysis show an inverse relationship with spatial resolution, with the larger pixels potentially containing the smallest fraction of molten lava. The ASTER data have the lowest kinetic temperatures and the MMT-Cam have the highest. Compared with the 35-m spatial resolution HyTES data, however, the 50-m spatial resolution MASTER data do have a higher derived pixel integrated temperature but at a higher variability. All the kinetic temperatures derived from the mixed-pixel data are significantly below that expected for a molten basaltic lava surface (~1450 K). In contrast, the average derived molten fraction temperature in every dataset is above 1100 K, significantly closer to what is expected for molten basaltic lava. Unmixing the HyTES data produced the highest average molten fraction temperature (1266.1 K) but with a high variability (404 K), implying there is still significant uncertainty at 35-m resolution. The MMT-Cam derived molten fraction temperatures span the liquidus temperatures of basaltic lava at the lowest variability, which provides the highest constraint on the derived data. The integration of the TMP calculation into the derivation of temperature improves the accuracy of the measured kinetic temperature associated with the molten lava fraction in all the datasets.
Emissivity spectra derived from these data before the TMP separation analysis have similar spectral morphologies to laboratory-derived results of molten basalts [44,45,46]. However, the spectral contrast is less than expected from laboratory results by up to 40% for ASTER (Figure 6). The MMT-Cam emissivity values are less than 15% shallower than laboratory data, with the MASTER and HyTES emissivity values being within 20%–30% (Figure 6). Following the TMP separation analysis, the spectral depths and contrasts increased to values consistent with those derived from laboratory experiments (Figure 6) [44,45,46]. The spectral morphology remained similar with a decrease in emissivity at shorter wavelengths and an increase at longer wavelengths. These results are also more exaggerated in the lava flow data (Figure 6), implying that there is high thermal mixing within a pixel representing the lava flow than the lava lake. For example, the improvement in the ASTER data highlights an absorption feature centered at ~8.5 μm with an increase in emissivity at longer wavelengths compared to absorption features centered at ~8.0 μm and ~10.5 μm in the improved MMT-Cam data. The improvements are attributed to variations in spatial and spectral resolution between the two instruments, as well as the difference in channel locations that resolve slightly different Si-O bonding. Similar trends are also detected in the HyTES and MMT-Cam data.
6. Discussion
The ability to remotely measure accurate surface radiance, kinetic temperature, and emissivity of a molten lava surface within a thermally-mixed pixel is important. Developing a methodology to extract only the molten fraction within every pixel of these datasets and constrain the uncertainty improves the subsequently-derived thermal data required for monitoring, scientific analysis, and later modeling studies. The results from the TMP separation analysis show that greatly improved radiance, kinetic temperature, and emissivity values can be extracted at different spatial and spectral scales. This methodology can be implemented with a variety of data quickly and uncertainties quantified. The TMP separation analysis is not new but has had limited application in volcanic hazard prediction models and assessments. Prior studies have shown that a typical lava surface has multiple thermal fractions (up to 8) at high spatial scales [7,23,47]. However, the processing required to analyze these fractions can be daunting at the scale of an entire flow field or slow in the case of an ongoing eruption. Furthermore, there is a somewhat limited applicability for this level of multiple fraction analysis in current lava flow propagation models where only the maximum molten fraction has the greatest influence on model results [15,24]. Therefore, improving the analysis of remote sensing data to provide rapid kinetic temperature and emissivity values of the highest temperature fractions within TIR image pixels will greatly improve and further constrain lava flow propagation models.
6.1. Emissivity
The spatial resolution of the TIR dataset has only a limited effect on the morphology of the emissivity spectra but does strongly influence the spectral depth. This result shows that the efficiency of radiative heat loss from a molten surface is overestimated more in TIR data with lower spatial resolutions. The emissivity spectra of the molten fraction show improved accuracy in the spectral contrast to those values expected for molten basaltic lava surfaces within the uncertainty calculated (Figure 6). The average minimum emissivity decreases by 20%, with the largest decrease observed in the HyTES data (33%) and the smallest decrease observed in the MMT-Cam data (4%). Additionally, larger decreases in emissivity are observed at the shorter wavelengths in all the datasets (Figure 6), which highlights the non-uniform influence of kinetic temperature on emissivity and the non-uniform mixing of thermal anomalies. Our results show that for future thermal studies of molten basaltic surface, a more appropriate value for the minimum emissivity would be 0.66 rather than the common values of 0.95 to 1.0 used in prior studies (i.e., [18,44,48,49,50]) and thermorheological models of lava flow propagation (i.e., [15,24]). This minimum emissivity value is consistent with a previous study of 0.55 for a cooling basaltic lava from Puʻu ‘Ō’ō at 1323 K [44] and a laboratory study of melts (albeit silicic ones) that measured emissivity of 0.68 at 1573 K [46]. However, the use of these higher maximum emissivity values used in these past studies of cooled basaltic lava surfaces is appropriate given the results calculated in this study. The TMP separation analysis identifying the molten fraction provides a useful approach for deriving and evaluating the actual emissivity of molten material seen in a variety of TIR instruments independent of spatial and spectral resolution.
6.2. Kinetic Temperature
The maximum temperatures derived from all the datasets following the TMP separation are closer to the liquidus temperatures of Hawaiian basalt [51], within the variability of the data (Table 3). The analysis improves the derived kinetic temperatures by up to 250% (ASTER TIR) and 70% in the MMT-Cam data. Although the eruption temperature of Hawaiian basalt is well-known from past direct measurements and petrologic analysis, the variability in the temperatures from this approach is critical for evaluating the uncertainty in subsequent studies that rely upon these measurements. The quantification of the temperature uncertainty improves the confidence and understanding of those model predictions, allowing more informed conclusions to be drawn from their forecasting estimates, for example.
6.3. Accuracy Assessment
The ability to measure accurate thermal properties of a surface from calibrated TIR data is influenced by numerous instrument factors including the spatial, spectral, and temporal resolution of those data as well as external factors such as the spatiotemporal variability of the surface itself. Molten lava surfaces vary, over seconds to minutes and centimeters to meters, either by lava flow propagation (breakouts) or lava lake overturning. To analyze the influence of the spatial and temporal scales, a variety of TIR datasets with different resolutions were needed. Most importantly, the new MMT-Cam data are used to validate the lower resolution datasets and determine whether both the anomalies and processes (e.g., lava lake overturning and flow crustal formation/morphology) are captured [12]. Typically, lower spatial resolution increases aggregation that leads to an increase in variability and a decrease in the ability to quantify the small-scale details.
Our analysis shows that the airborne and orbital data provide reliable and accurate results for the larger-scale anomalies and processes. Typically, anomalies 1.5 to 2 times the size of the spatial resolution of the dataset are required for more accurate estimates of kinetic temperature and emissivity, whereas even larger volcanic processes are required to be discerned individually. For example, the ~200 m diameter lava lake and >100 m long lava flows provide good targets for anomaly detection; however, the overturning and crustal formation observed within these anomalies are not identified in ASTER data and rarely in the airborne TIR data.
The temporal resolution also significantly influences the reliability of the TIR data, especially if the repeat time is greater than hours (which is the case for the ASTER and airborne instruments). As a result, these data underestimate the percentage of molten lava on the surface and its accurate radiance, kinetic temperature, and emissivity. Compared to the MMT-Cam TMP separation analysis, the same analysis of the airborne and orbital data underestimates the surface radiance by as much as 430% and 800%, respectively (Figure 4, Figure 7 and Figure 8). This translates to a lava emissivity error of 5% and 20% with a corresponding kinetic temperature error of 80% and 120%, respectively (Figure 4, Figure 7 and Figure 8). Separately evaluating the lava lake and lava flow data reveals the airborne and orbital data of the lava lake are 30% better compared to the lava flow data due mainly to the larger spatial scale and more uniform surface state of the lake (Figure 4, Figure 7 and Figure 8).
Larger pixel sizes also have a higher probability of integrating more than one surface thermal property, which leads to errors in the data analysis and ultimately subsequent results that are inaccurate. The dual-band mixed pixel approach is one possible solution and results show that it does improve the deviation of thermal properties of molten lava surfaces (Figure 7 and Figure 8). The molten surface radiance values are all within 25% of the MMT-Cam values, an improvement of up to 300% (Figure 7 and Figure 8). The molten emissivity and kinetic temperature values derived from the airborne and orbital data are all within 25% and 10% of the MMT-Cam values (Figure 7 and Figure 8), respectively, and more consistent with laboratory and field measurements [44,45,46,51].
6.4. Implications and Reasons for Uncertainty
The results extracted from the lava flow data before and after the TMP separation analysis are less uniform across all wavelengths where compared to the lava lake data (Figure 7 and Figure 8). The ratio of pre- versus post-TMP analysis is higher at shorter wavelengths in the surface radiance data and lower at shorter wavelengths in the emissivity data as expected from the relationship modeled in the Planck equation. This ratio is closer to one at longer wavelengths for all the thermal properties, implying the thermal mixing is less of a factor at these wavelengths, again, as one might predict based on the mixing of multi-temperature emissions. The non-uniform ratio in the lava flow data (most notable at larger pixel sizes) implies a more complex mixing and distribution of thermal fractions and a greater uncertainty in these properties at shorter wavelengths. Hence, the greatest errors are observed at shorter wavelengths in the mixed pixels and are more extreme in lower spatial resolution datasets (Figure 7 and Figure 8).
Although the greatest uncertainty and errors are observed in the mixed pixels acquired at lower spatial resolutions; these uncertainties fall within the expected values following the TMP separation for all the datasets. The variability within each dataset is used to quantify the uncertainty of the derived thermal properties of molten basaltic lava surfaces. Although the dual-band mixed pixel separation approach does provide data more similar to laboratory results, it ultimately increases the variability in the derived properties that results in a decrease in precision and therefore, an increase in uncertainty. This uncertainty is related to the spatial resolution of the dataset with lower resolution data having higher uncertainty. This is a function of smaller proportions of the molten lava fraction being present within a given larger pixel, which can be less than 5% in an ASTER pixel. Figure 7 and Figure 8 show the ratio in radiance and emissivity between pre- and post-TMP separation analysis, with values close to one requiring the least separation processing. In the majority of instances, the MMT-Cam data requires the least processing and the ASTER data requires the most. However, the HyTES lava lake surface radiance data requires the least separation processing, a function of the hyperspectral resolution, which offsets the lower spatial resolution (Figure 7a). The HyTES variability in the unmixed surface radiance data is significantly lower than that from MASTER at a very similar spatial resolution. Therefore, where spatial resolution is similar, data uncertainty drops by using higher spectral resolution data (decrease variability by ~40%), which is highly relevant for future orbital instrument design.
7. Conclusions
The accuracy and uncertainty in the thermal properties derived from remotely acquired TIR data of active lava surfaces were investigated using a variety of instruments acquiring data of two active basaltic lava surfaces (lava lake and lava flow). The effect of spatial and spectral resolution on the measured surface radiance and derived emissivity and kinetic temperature were quantified by comparing them to values expected for basaltic lava at liquidus temperatures based on prior laboratory and field results. Because a majority of currently available TIR instruments do not have the radiometric range or spatial resolution to derive the thermal properties of a molten lava surface accurately, the application of a dual-band mixed pixel separation analysis approach is one solution to improve results. This thermal unmixing can deconvolve the signature of the molten fraction within a pixel. By determining the accuracy and uncertainty in these thermal properties across four different TIR datasets acquired at the same time and with different spatial and spectral resolutions, the temperature, emissivity, and radiance results are compared and constrained. For example, prior to extracting the molten fraction within each pixel, it was impossible to compare thermal properties (Figure 4) as they are strongly dependent on the instrument position with respect to the surface and their individual specifications (Table 2). However, post-unmixing, the molten fraction (Figure 5) is more directly comparable between these datasets (Table 3).
Mixed pixel surface radiance values derived from the ASTER data are ~2400% underestimated, with the MASTER and HyTES data underestimated by ~1000%. Similar underestimates are seen in the extracted emissivity and kinetic temperature by approximately 20% and 250% in the ASTER data, and 25% and ~200% in the MASTER and HyTES data, respectively. However, this impact of spatial resolution is mitigated to a degree by improved spectral resolution. Following the TMP separation analysis, all surface radiance values are within 15% of the expected values, whereas the emissivity and kinetic temperature are within 8% and 12% of the expected values, respectively [44,45,46]. These results quantify the inherent TIR data uncertainty in the measured and derived thermal properties, demonstrate a significant improvement on previous estimates, and further constrains the errors associated with these values. The more accurate constraint of lava temperature, emissivity, and the emitted radiance from active surfaces derived from TIR measurements will ultimately improve the accuracy and reduce the unknown uncertainty in future flow models that rely upon these properties (e.g., [11]). Furthermore, these datasets can be directly compared with other measurements (i.e., terrain elevation, in situ thermocouple temperatures, and deformation change) to improve analysis of the synoptic eruption process and quantify the uncertainty in the results and conclusions.
Author Contributions
The following contributions were provided by each author: Conceptualization, J.O.T. and M.S.R.; data curation, J.O.T.; formal analysis, J.O.T.; funding acquisition, J.O.T. and M.S.R.; investigation, J.O.T.; methodology, J.O.T.; project administration, M.S.R.; resources, J.O.T. and M.S.R.; supervision, M.S.R.; validation, M.S.R.; Visualization, J.O.T.; writing—original draft, J.O.T.; writing—review and editing, J.O.T. and M.S.R. All authors have read and agreed to the published version of the manuscript.
Funding
This research is funded by NASA grants 80NSSC18K1001 (M.S.R.) and 80NSSC17K0445 P00001 (J.O.T.).
Acknowledgments
The authors would like to thank the USGS HVO for their assistance in conducting the field campaigns, especially Matthew Patrick, Greg Vaughan, and Tina Neal. Additional thanks to the NASA HyspIRI Preparatory Campaign Group, the NASA ground and flight teams, the ASTER science team, and Hawai’i Volcanoes National Park for facilitating the field campaigns in 2017 and 2018. We would also like to thank the Editors and anonymous reviewers for their comments and suggestions that greatly improved this manuscript.
Conflicts of Interest
The authors declare no conflict of interest. The funders had no role in the design of the study; in the collection, analyses, or interpretation of data; in the writing of the manuscript, or in the decision to publish the results.
References
- Spampinato, L.; Calvari, S.; Oppenheimer, C.; Boschi, E. Volcano Surveillance Using Infrared Cameras. Earth-Sci. Rev. 2011, 106, 63–91. [Google Scholar] [CrossRef]
- Cashman, K.V.; Stephen, R.; Sparks, R.S.J. How Volcanoes Work: A 25 Year Perspective. Bull. Geol. Soc. Am. 2013, 125, 664–690. [Google Scholar] [CrossRef]
- Ramsey, M.S.; Harris, A.J.L. Volcanology 2020: How Will Thermal Remote Sensing of Volcanic Surface Activity Evolve over the next Decade? J. Volcanol. Geotherm. Res. 2013, 249, 217–233. [Google Scholar] [CrossRef]
- Calvari, S.; Lodato, L.; Steffke, A.; Cristaldi, A.; Harris, A.J.L.; Spampinato, L.; Boschi, E. The 2007 Stromboli Eruption: Event Chronology and Effusion Rates Using Thermal Infrared Data. J. Geophys. Res. Solid Earth 2010, 115, 1–20. [Google Scholar] [CrossRef] [Green Version]
- Murphy, S.W.; Wright, R.; Oppenheimer, C.; Filho, C.R.S. MODIS and ASTER Synergy for Characterizing Thermal Volcanic Activity. Remote Sens. Environ. 2013, 131, 195–205. [Google Scholar] [CrossRef]
- Yamaguchi, Y.; Kahle, A.B.; Tsu, H.; Kawakami, T.; Pniel, M. Overview of Advanced Spaceborne Thermal Emission and Reflection Radiometer (ASTER). IEEE Trans. Geosci. Remote Sens. 1998. [Google Scholar] [CrossRef] [Green Version]
- Flynn, L.P.; Harris, A.J.L.; Wright, R. Improved Identification of Volcanic Features Using Landsat 7 ETM+. Remote Sens. Environ. 2001, 78, 180–193. [Google Scholar] [CrossRef]
- Handcock, R.N.; Gillespie, A.R.; Cherkauer, K.A.; Kay, J.E.; Burges, S.J.; Kampf, S.K. Accuracy and Uncertainty of Thermal-Infrared Remote Sensing of Stream Temperatures at Multiple Spatial Scales. Remote Sens. Environ. 2006, 100, 427–440. [Google Scholar] [CrossRef]
- Roberts, D.A.; Quattrochi, D.A.; Hulley, G.C.; Hook, S.J.; Green, R.O. Synergies between VSWIR and TIR Data for the Urban Environment: An Evaluation of the Potential for the Hyperspectral Infrared Imager (HyspIRI) Decadal Survey Mission. Remote Sens. Environ. 2012, 117, 83–101. [Google Scholar] [CrossRef]
- Western, L.M.; Watson, M.I.; Francis, P.N. Uncertainty in Two-Channel Infrared Remote Sensing Retrievals of a Well-Characterised Volcanic Ash Cloud. Bull. Volcanol. 2015, 77. [Google Scholar] [CrossRef] [Green Version]
- Guanter, L.; Brell, M.; Chan, J.C.W.; Giardino, C.; Gomez-Dans, J.; Mielke, C.; Morsdorf, F.; Segl, K.; Yokoya, N. Synergies of Spaceborne Imaging Spectroscopy with Other Remote Sensing Approaches. Surv Geophys 2019, 40, 657–687. [Google Scholar] [CrossRef]
- Walker, G.P.L. Basaltic-Volcano Systems. Geol. Soc. Lond. Spec. Publ. 1993, 76, 3–38. [Google Scholar] [CrossRef] [Green Version]
- Global Volcanism Program. Report on Kilauea. In Bulletin of the Global Volcanism Network; Crafford, A.E., Venzke, E., Eds.; Smithsonian Institution: Washington, DC, USA, 2018. [Google Scholar] [CrossRef]
- USGS Hawaiian Volcano Observatory. Overview of Kīlauea Volcano’s 2018 Lower East Rift Zone Eruption and Summit Collapse. U.S. Geol. Surv. Gen. Inf. Prod. 2019, 1, 1–2. [Google Scholar]
- Harris, A.J.L.; Rowland, S.K. FLOWGO: A Kinematic Thermo-Rheological Model for Lava Flowing in a Channel. Bull. Volcanol. 2001, 63, 20–44. [Google Scholar] [CrossRef]
- Crisci, G.M.; Rongo, R.; Di Gregorio, S.; Spataro, W. The Simulation Model SCIARA: The 1991 and 2001 Lava Flows at Mount Etna. J. Volcanol. Geotherm. Res. 2004, 132, 253–267. [Google Scholar] [CrossRef]
- Negro, C.; Fortuna, L.; Herault, A.; Vicari, A. Simulations of the 2004 Lava Flow at Etna Volcano Using the Magflow Cellular Automata Model. Bull. Volcanol. 2008, 70, 805–812. [Google Scholar] [CrossRef] [Green Version]
- Ramsey, M.S.; Chevrel, M.O.; Coppola, D.; Harris, A.J.L. The Influence of Emissivity on the Thermo-Rheological Modeling of the Channelized Lava Flows at Tolbachik Volcano. Ann. Geophys. 2019, 62. [Google Scholar] [CrossRef]
- Thompson, J.O.; Ramsey, M.S.; Hall, J.L. MMT-Cam: A New Miniature Multispectral Thermal Infrared Camera System for Capturing Dynamic Earth Processes. IEEE Trans. Geosci. Remote Sens. 2019, 57, 7438–7446. [Google Scholar] [CrossRef]
- Johnson, W.R.; Hook, S.J.; Mouroulis, P.; Wilson, D.W.; Gunapala, S.D.; Realmuto, V.; Lamborn, A.; Paine, C.; Mumolo, J.M.; Eng, B.T. HyTES: Thermal Imaging Spectrometer Development. In Proceedings of the IEEE Aerospace Conference, Big Sky, MT, USA, 5–12 March 2011. [Google Scholar] [CrossRef]
- Hook, S.J.; Myers, J.J.; Thome, K.J.; Fitzgerald, M.; Kahle, A.B. The MODIS/ASTER Airborne Simulator (MASTER)—A New Instrument for Earth Science Studies. Remote Sens. Environ. 2001, 76, 93–102. [Google Scholar] [CrossRef]
- Ramsey, M.S.; Harris, A.J.L.; Crown, D.A. What Can Thermal Infrared Remote Sensing of Terrestrial Volcanoes Tell Us about Processes Past and Present on Mars? J. Volcanol. Geotherm. Res. 2016, 311, 198–216. [Google Scholar] [CrossRef]
- Wright, R.; Flynn, L.P. On the Retrieval of Lava-Flow Surface Temperatures from Infrared Satellite Data. Geology 2003, 31, 893–896. [Google Scholar] [CrossRef]
- Favalli, M.; Pareschi, M.T.; Neri, A.; Isola, I. Forecasting Lava Flow Paths by a Stochastic Approach. Geophys. Res. Lett. 2005. [Google Scholar] [CrossRef]
- Hall, J.L.; Boucher, R.H.; Buckland, K.N.; Gutierrez, D.J.; Hackwell, J.A.; Johnson, B.R.; Keim, E.R.; Moreno, N.M.; Ramsey, M.S.; Sivjee, M.G.; et al. MAGI: A New High-Performance Airborne Thermal-Infrared Imaging Spectrometer for Earth Science Applications. IEEE Trans. Geosci. Remote Sens. 2015, 53, 5447–5457. [Google Scholar] [CrossRef]
- Planck, M. On the Law of Distribution of Energy in the Normal Spectrum On the Law of Distribution of Energy in the Normal Spectrum. Ann. Phys. 1901, 4, 553–563. [Google Scholar] [CrossRef]
- Realmuto, V.J. Separating the Effects of Temperature and Emissivity: Emissivity Spectrum Normalization. In Proceedings of the 2nd TIMS Workshop; Abbott, E.A., Ed.; Jet Propulsion Laboratory: Pasadena, CA, USA, 1990; pp. 31–37. [Google Scholar]
- Gillespie, A.; Rokugawa, S.; Matsunaga, T.; Steven Cothern, J.; Hook, S.J.; Kahle, A.B. A Temperature and Emissivity Separation Algorithm for Advanced Spaceborne Thermal Emission and Reflection Radiometer (ASTER) Images. IEEE Trans. Geosci. Remote Sens. 1998, 36, 1113–1126. [Google Scholar] [CrossRef]
- Ramsey, M.S.; Christensen, P.R. Mineral Abundance Determination Quantitative Deconvolution of Thermal Emission Spectra. J. Geophys. Res. 1998, 103, 577–596. [Google Scholar] [CrossRef]
- Ramsey, M.S.; Fink, J.H. Estimating Silicic Lava Vesicularity with Thermal Remote Sensing: A New Technique for Volcanic Mapping and Monitoring. Bull. Volcanol. 1999, 61, 32–39. [Google Scholar] [CrossRef]
- Carter, A.J.; Ramsey, M.S.; Durant, A.J.; Skilling, I.P.; Wolfe, A. Micron-Scale Roughness of Volcanic Surfaces from Thermal Infrared Spectroscopy and Scanning Electron Microscopy. J. Geophys. Res. Solid Earth 2009, 114, 1–13. [Google Scholar] [CrossRef] [Green Version]
- Rose, S.R.; Watson, I.M.; Ramsey, M.S.; Hughes, C.G. Thermal Deconvolution: Accurate Retrieval of Multispectral Infrared Emissivity from Thermally-Mixed Volcanic Surfaces. Remote Sens. Environ. 2014, 140, 690–703. [Google Scholar] [CrossRef]
- Holcomb, R.T. Eruptive History and Long-Term Behavior of Kilauea Volcano. US Geol. Surv. Prof. Pap. 1987, 1350, 261–350. [Google Scholar]
- Patrick, M.R.; Orr, T.R.; Sutton, A.J.; Elias, T.; Swanson, D.A. The First Five Years of Kīlauea’s Summit Eruption in Halema’uma’u Crater 2008–2013; Fact Sheet 2013–3116; US Geological Survey: Reston, VA, USA, 2013. [CrossRef]
- Orr, T.R.; Heliker, C.; Patrick, M.R. The Ongoing Pu̒u ̒Ō̒ō eruption of Kīlauea Volcano, Hawai̒i—30 Years of Eruptive Activity; Fact Sheet 2012–3127; US Geological Survey: Reston, VA, USA, 2013; p. 6.
- Poland, M.P. Time-Averaged Discharge Rate of Subaerial Lava at Kīlauea Volcano, Hawai’i, Measured from TanDEM-X Interferometry: Implications for Magma Supply and Storage during 2011-2013. J. Geophys. Res. Solid Earth 2014. [Google Scholar] [CrossRef]
- Dietterich, H.R.; Poland, M.P.; Schmidt, D.A.; Cashman, K.V.; Sherrod, D.R.; Espinosa, A.T. Tracking Lava Flow Emplacement on the East Rift Zone of Klauea, Hawaii, with Synthetic Aperture Radar Coherence. Geochem. Geophys. Geosyst. 2012. [Google Scholar] [CrossRef]
- Koeppen, W.C.; Patrick, M.; Orr, T.; Sutton, A.J.; Dow, D.; Wright, R. Constraints on the Partitioning of Kīlauea’s Lavas between Surface and Tube Flows, Estimated from Infrared Satellite Data, Sulfur Dioxide Emission Rates, and Field Observations. Bull. Volcanol. 2013. [Google Scholar] [CrossRef]
- Tonooka, H. An Atmospheric Correction Algorithm for Thermal Infrared Multispectral Data over Land-a Water-Vapor Scaling Method. IEEE Trans. Geosci. Remote Sens. 2001, 39, 682–692. [Google Scholar] [CrossRef]
- Young, S.J.; Johnson, B.R.; Hackwell, J.A. An In-Scene Method for Atmospheric Compensation of Thermal Hyperspectral Data. J. Geophys. Res. Atmos. 2002, 107, 1–20. [Google Scholar] [CrossRef]
- Harris, A.J.L. Thermal Remote Sensing of Active Volcanoes: A User’s Manual, 1st ed.; Cambridge University Press: New York, NY, USA, 2013. [Google Scholar]
- Dozier, J. A Method for Satellite Identification of Surface Temperature Fields of Subpixel Resolution. Remote Sens. Environ. 1981, 11, 221–229. [Google Scholar] [CrossRef]
- Matson, M.; Dozier, J. Identification of Subresolution High Temperature Sources Using a Thermal IR Sensor. Photogramm. Eng. Remote Sens. Eng. Remote Sens. 1981, 47, 1311–1318. [Google Scholar]
- Abtahi, A.A.; Kahle, A.B.; Abbott, E.A.; Gillespie, A.R.; Sabol, D.; Yamada, G.; Pieri, D.C. Emissivity Changes in Basalt Cooling after Eruption from Puu Oo, Kilauea, Hawaii. Trans. Am. Geophys. Union 2002, 83, F1442. [Google Scholar]
- Lee, C.T.A.; Luffi, P.; Plank, T.; Dalton, H.; Leeman, W.P. Constraints on the Depths and Temperatures of Basaltic Magma Generation on Earth and Other Terrestrial Planets Using New Thermobarometers for Mafic Magmas. Earth Planet. Sci. Lett. 2009, 279, 20–33. [Google Scholar] [CrossRef]
- Lee, R.J.; Ramsey, M.S.; King, P.L. Development of a New Laboratory Technique for High-Temperature Thermal Emission Spectroscopy of Silicate Melts. J. Geophys. Res. Solid Earth 2013, 118, 1968–1983. [Google Scholar] [CrossRef] [Green Version]
- Davies, A.G.; Calkins, J.; Scharenbroich, L.; Vaughan, R.G.; Wright, R.; Kyle, P.; Castańo, R.; Chien, S.; Tran, D. Multi-Instrument Remote and in Situ Observations of the Erebus Volcano (Antarctica) Lava Lake in 2005: A Comparison with the Pele Lava Lake on the Jovian Moon Io. J. Volcanol. Geotherm. Res. 2008, 177, 705–724. [Google Scholar] [CrossRef]
- Harris, A.J.L.; Dehn, J.; Patrick, M.; Calvari, S.; Ripepe, M.; Lodato, L. Lava Effusion Rates from Hand-Held Thermal Infrared Imagery: An Example from the June 2003 Effusive Activity at Stromboli. Bull. Volcanol. 2005, 68, 107–117. [Google Scholar] [CrossRef]
- Wright, R.; Garbeil, H.; Harris, A.J.L. Using Infrared Satellite Data to Drive a Thermo-Rheological/Stochastic Lava Flow Emplacement Model: A Method for near-Real-Time Volcanic Hazard Assessment. Geophys. Res. Lett. 2008, 35, 1–5. [Google Scholar] [CrossRef] [Green Version]
- Harris, A.J.L.; Favalli, M.; Steffke, A.; Fornaciai, A.; Boschi, E. A Relation between Lava Discharge Rate, Thermal Insulation, and Flow Area Set Using Lidar Data. Geophys. Res. Lett. 2010, 37, 1–6. [Google Scholar] [CrossRef]
- Putirka, K. Magma Transport at Hawaii: Inferences Based on Igneous Thermobarometry. Geology 1997, 25, 69–72. [Google Scholar] [CrossRef]
Figure 1.
Advanced Spaceborne Thermal Emission and Reflection Radiometer (ASTER) visible false-color image (RBG: 3,2,1) of the southeastern region of the Island of Hawai’i, showing the analysis locations of the Halemaʻumaʻu Crater lava lake and Puʻu ‘Ō’ō lava flows at Kīlauea Volcano (white boxes). The ASTER data were acquired on March 7, 2017, at 10:06:02 HST. Insert shows the entire state of the Hawaiian island chain in the central Pacific Ocean, the red box indicating the area of the ASTER image shown.

Figure 2.
A flowchart illustrating the methods used in this study.

Figure 3.
Examples of the thermal infrared (TIR) surface radiance data acquired of the Halemaʻumaʻu Crater lava lake and Puʻu ‘Ō’ō lava flows from the different datasets at ~11.3 µm. Data from 01/20/2017, 01/30/2018, and 02/06/2018 were acquired during the day (~10:00 HST) and data from 01/20/2017 and 02/08/2018 were acquired during the night (~21:45 HST). The Hyperspectral Thermal Emission Spectrometer (HyTES) instrument was not flown in 2017.

Figure 4.
Average mixed pixel surface (left column) radiance and (right column) emissivity spectra acquired of the (blue) Halemaʻumaʻu Crater lava lake and (red) Puʻu ‘Ō’ō lava flows derived from ASTER TIR, MODIS/ASTER (MASTER) TIR, HyTES, and Miniature Multispectral Thermal Camera (MMT-Cam) data. The error bars represent the standard deviation variation in the regions of interest (ROI). Note there are no HyTES data between 9.92 and 10.75 µm on 02/08/2018 so these data are not included in the lava lake plots.

Figure 5.
Average molten pixel fraction surface (left column) radiance and (right column) emissivity spectra acquired of the (blue) Halemaʻumaʻu Crater lava lake and (red) Puʻu ‘Ō’ō lava flows derived from the thermal mixed pixel molten fraction of the ASTER TIR, MASTER TIR, HyTES, and MMT-Cam data. The error bars represent the standard deviation variation in the ROI data. Note there are no HyTES data between 9.92 and 10.75 µm on 02/08/2018 so these data are not included in the lava lake plots.

Figure 6.
Comparison of surface (left column) radiance and (right column) emissivity pre- and post- TMP separation of the molten fraction derived from all the datasets acquired of the Halemaʻumaʻu Crater lava lake on February 6, 2018, and Puʻu ‘Ō’ō lava flows on January 30, 2019. The error bars represent the standard deviation variation in the ROI data. Note there are no HyTES data between 9.92 and 10.75 µm on 02/08/2018 so these data are not included in the lava lake plots.

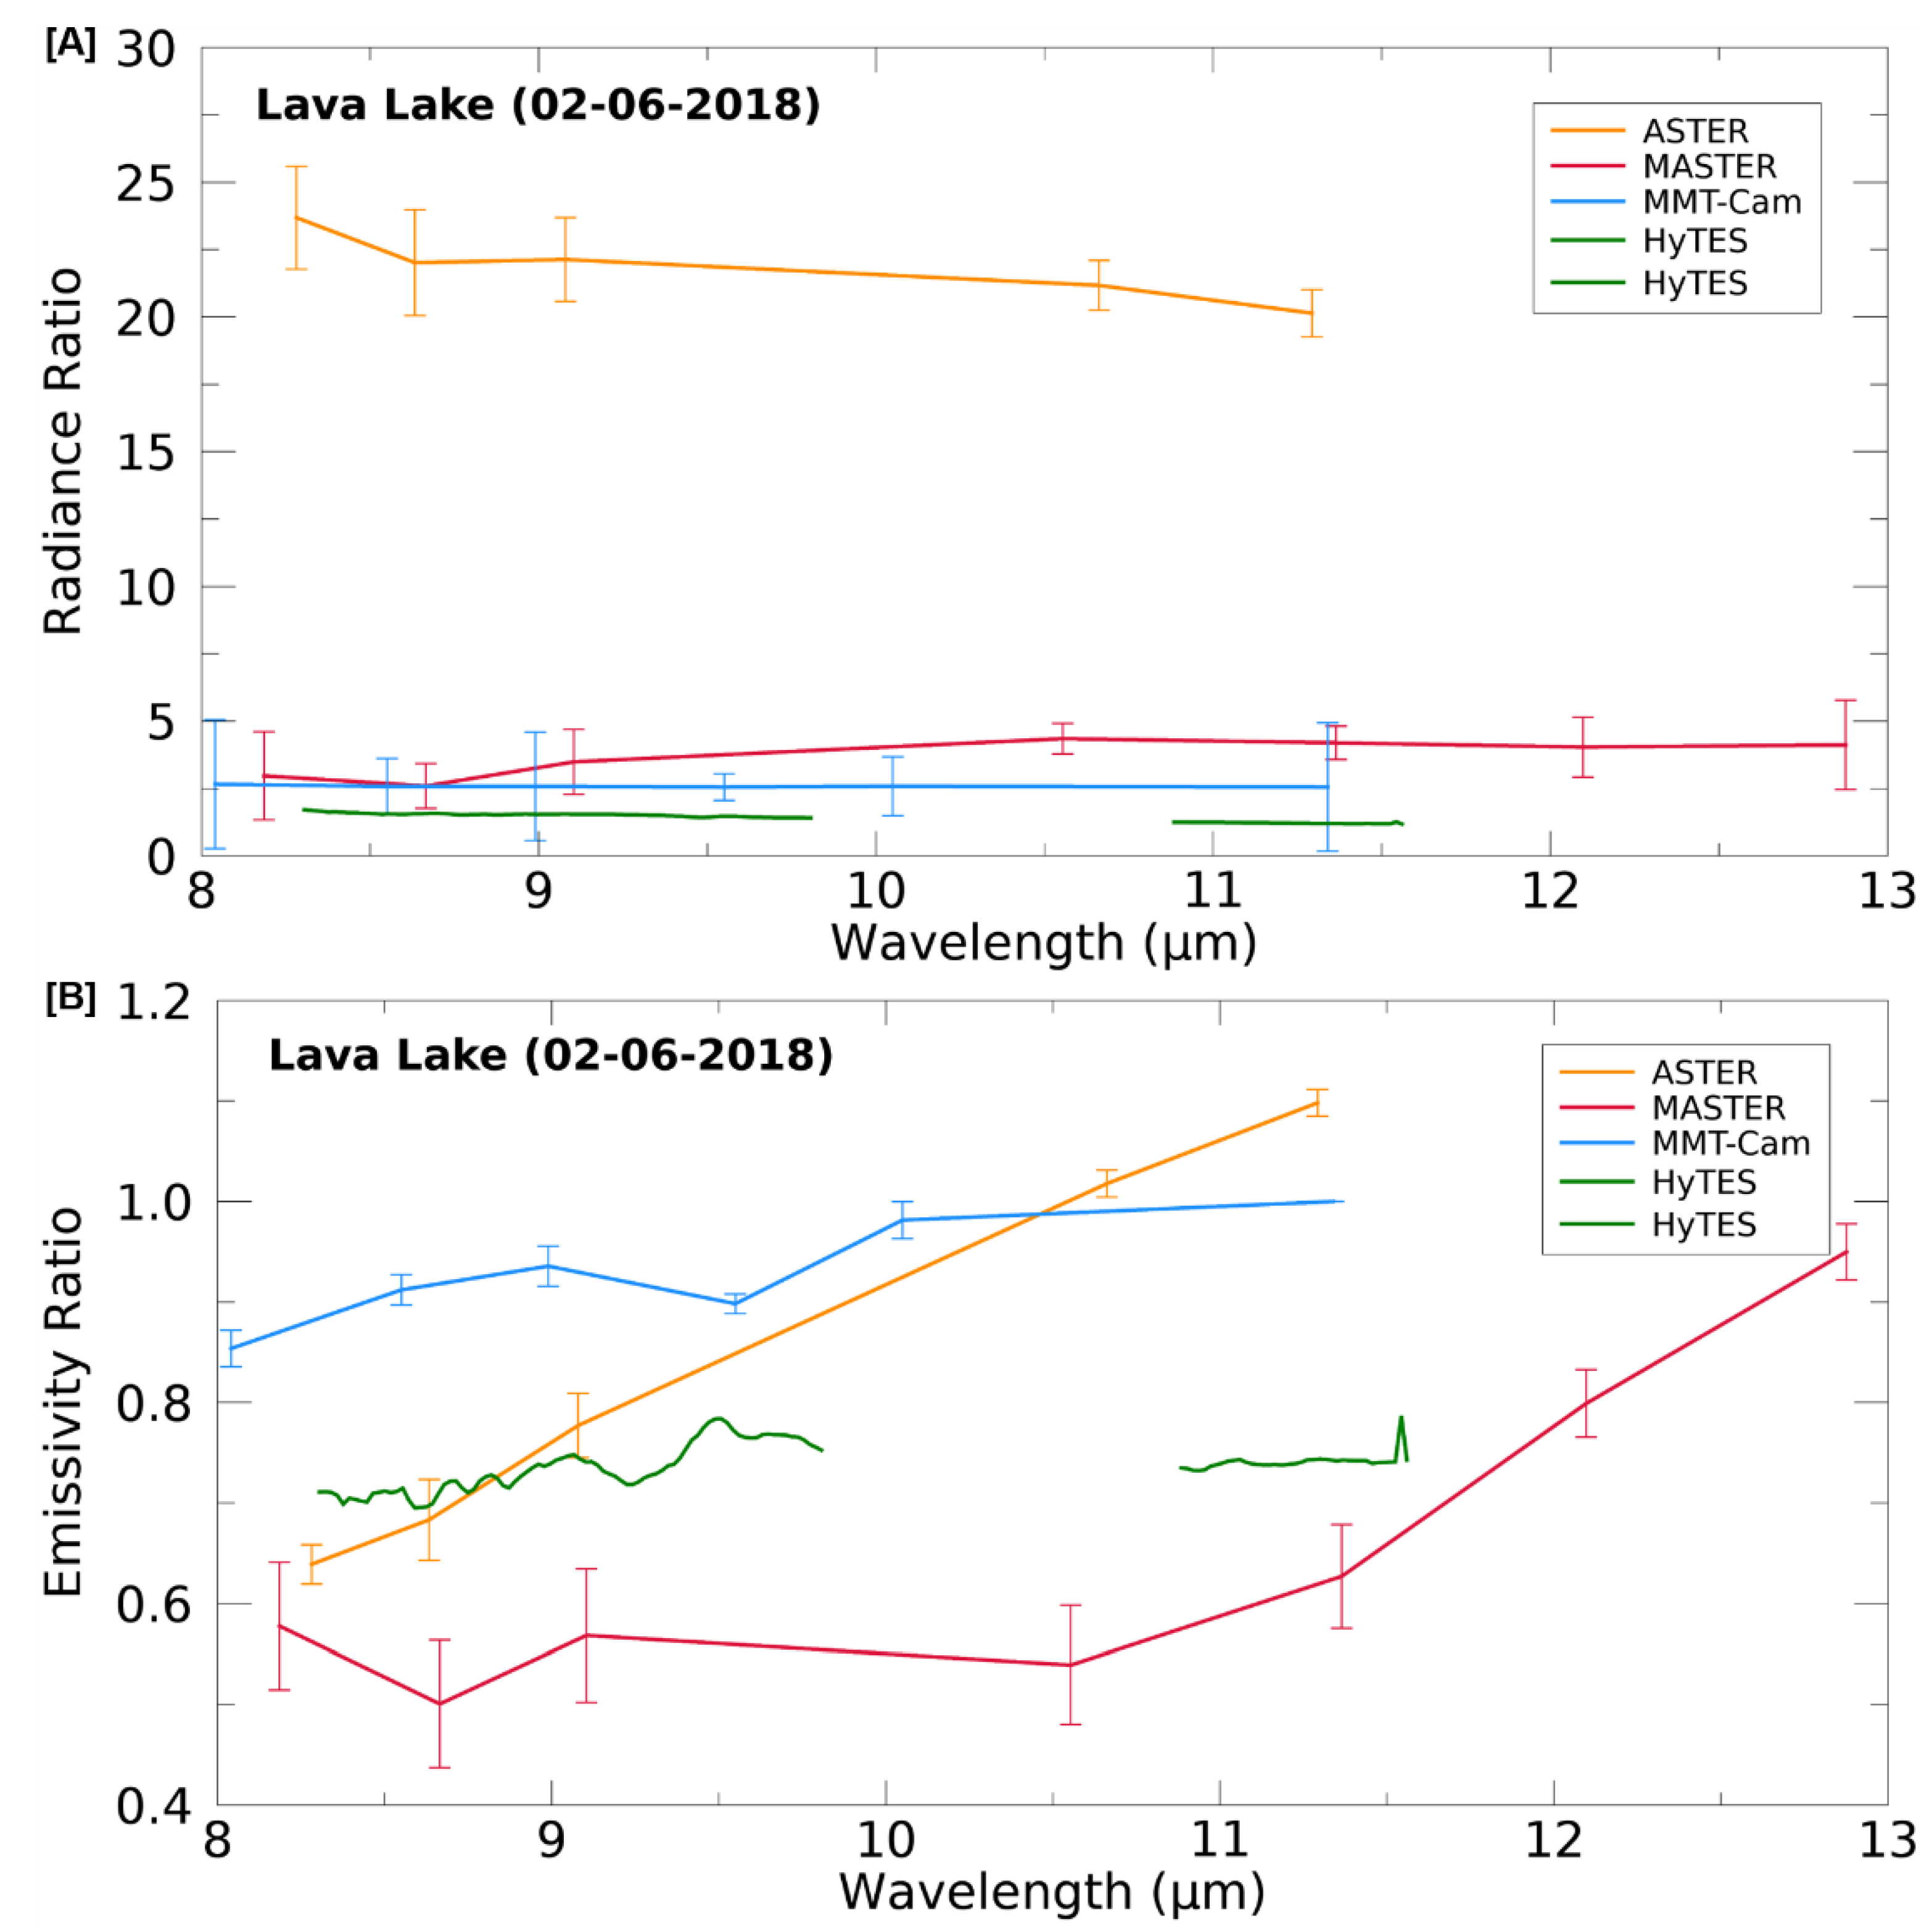
Figure 7.
The ratio between the pre- and post-TMP separation of the molten fraction for the (A) surface radiance and (B) emissivity for the Halemaʻumaʻu Crater lava lake acquired on February 6, 2018. Values closer to 1.0 require less TMP separation processing. The error bars represent the standard deviation variation in the ROI data. Note there are no HyTES data between 9.92 and 10.75 µm on 02/08/2018 so these data are not included in the lava lake plots.

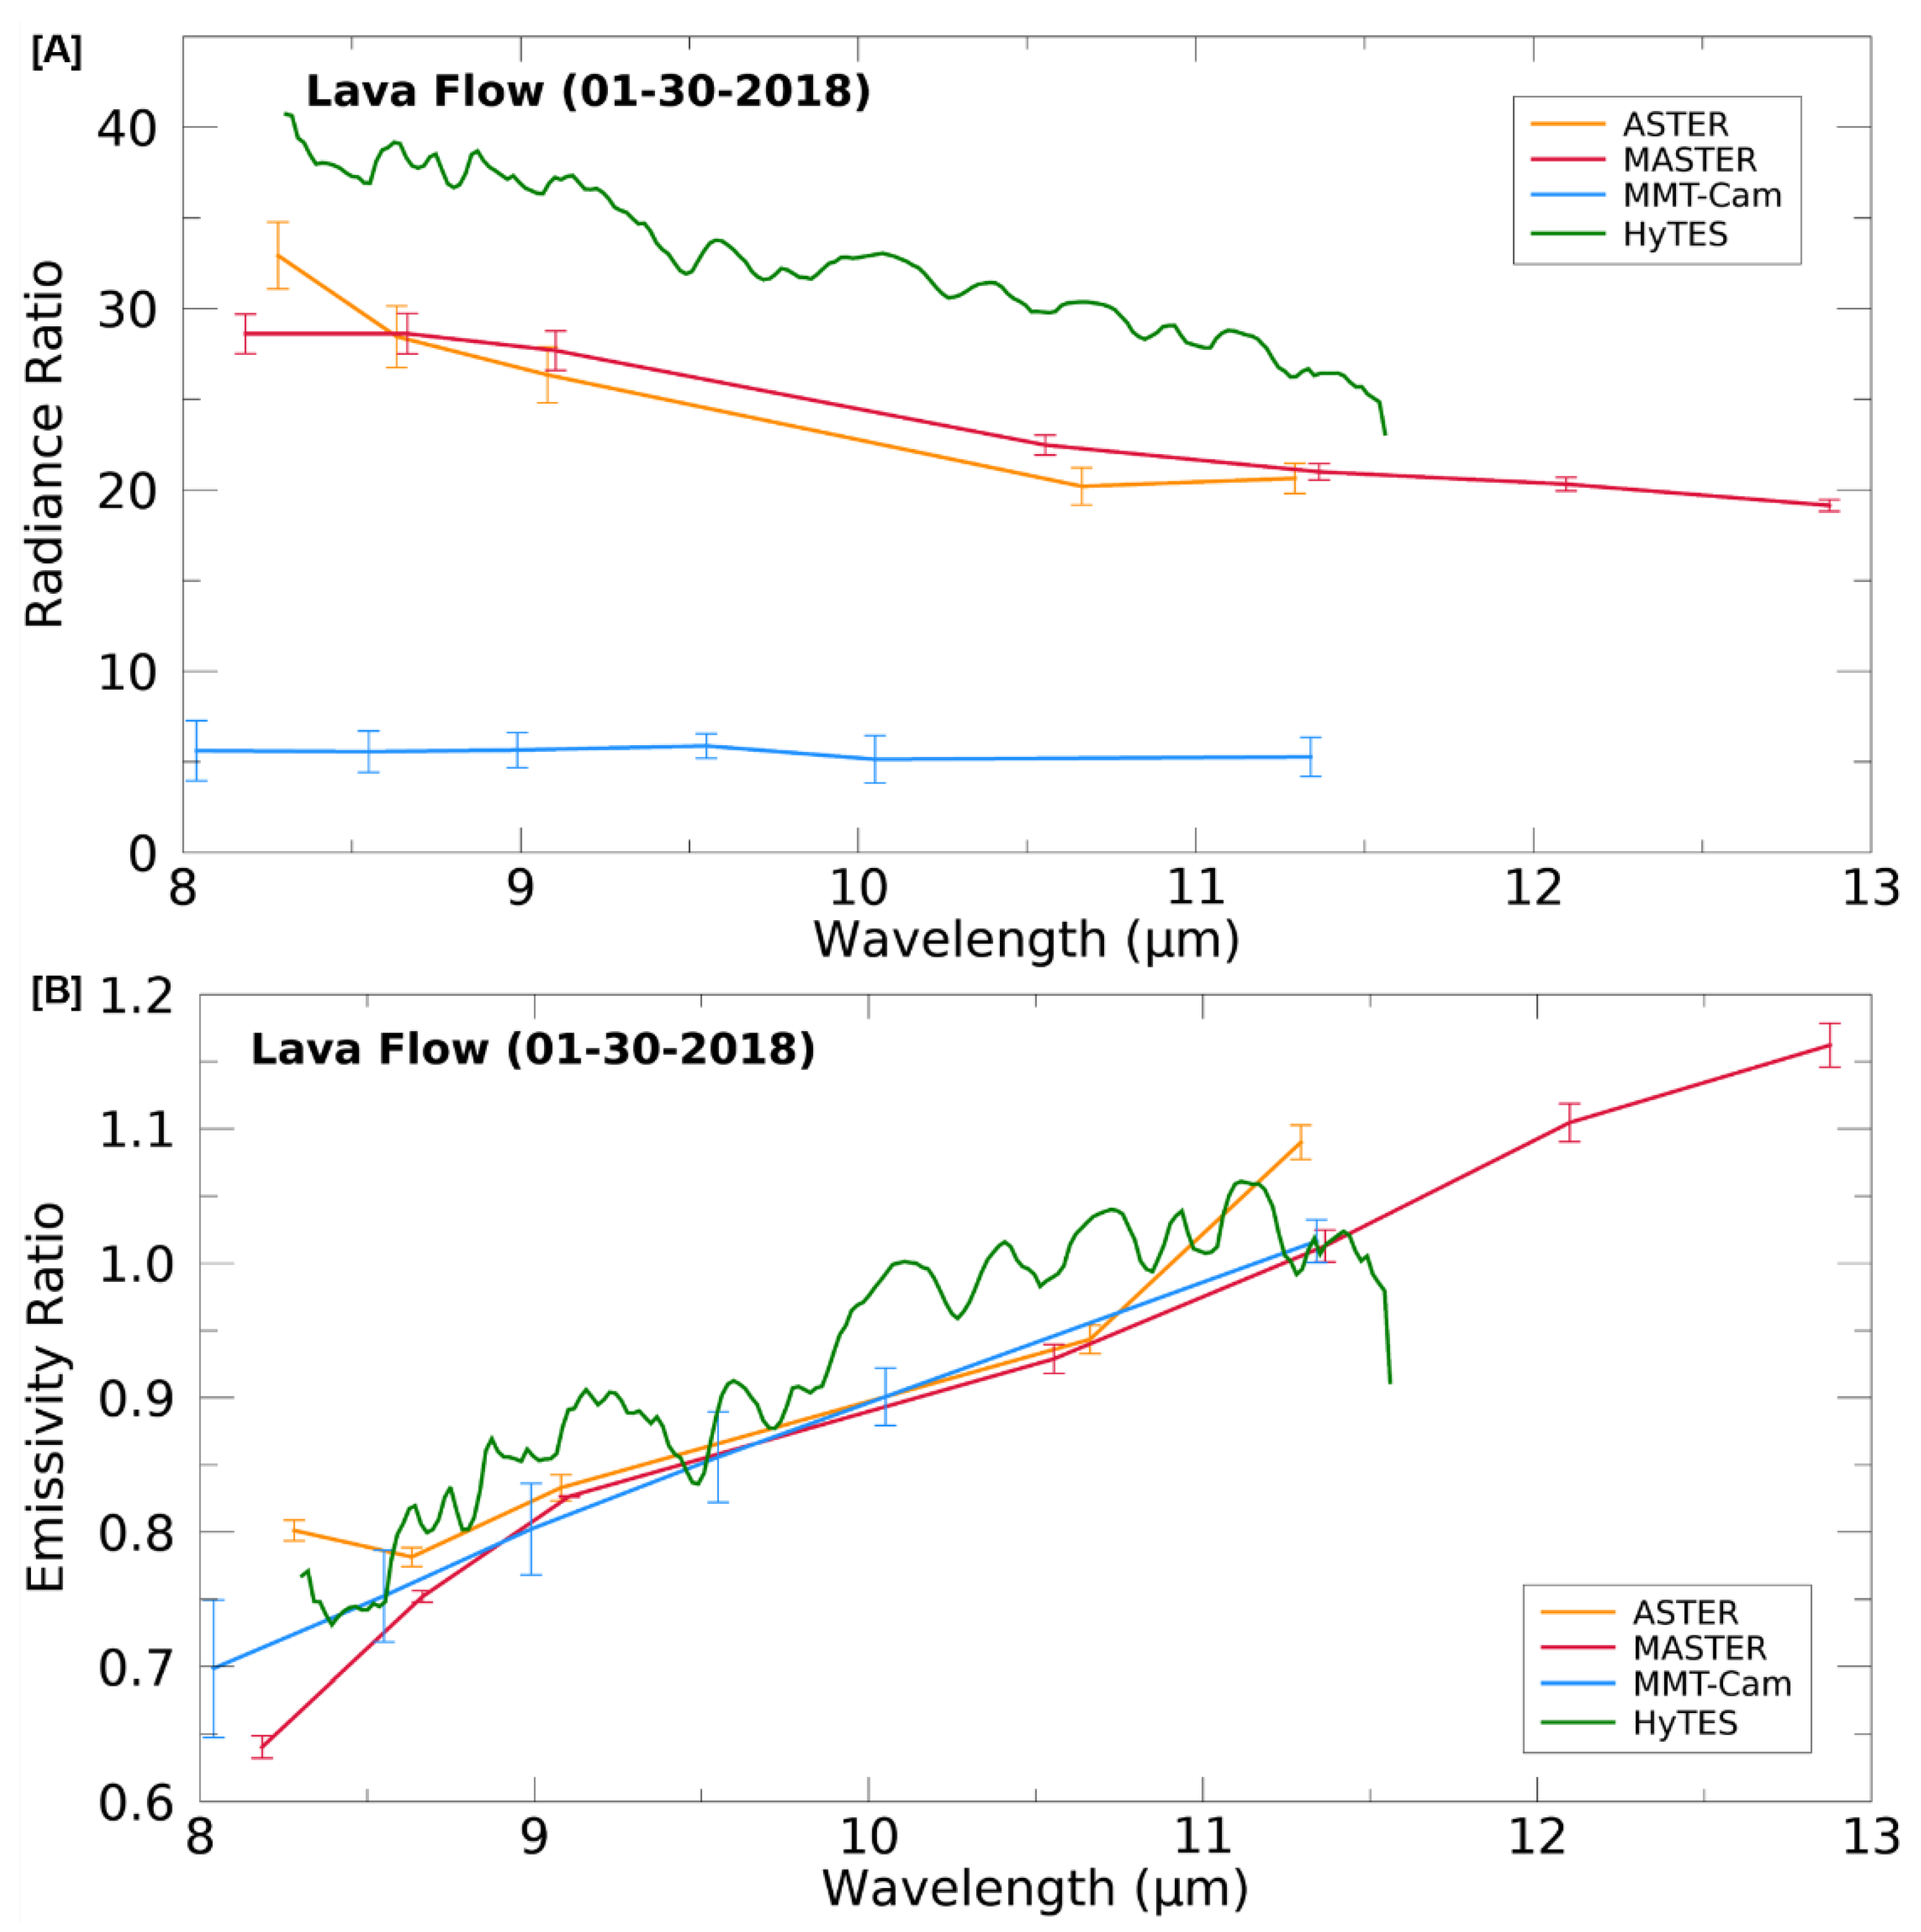
Figure 8.
The ratio between the pre- and post-TMP separation of the molten fraction for the (A) surface radiance and (B) emissivity for the Puʻu ‘Ō’ō lava flows acquired on January 30, 2018. Values closer to 1.0 require less TMP separation processing. The error bars represent the standard deviation variation in the ROI data.


Table 1.
Atmospheric conditions and target locations during each acquisition data.
| Acquisition Data | Time (HST) | No Data | Temperature (°C) | Humidity (%) | Target |
|---|---|---|---|---|---|
| 01/19/2017 | 20:32 | HyTES | 27.9 | 59.8 | Lava Lake |
| 01/26/2017 | 10:59 | HyTES | 17.3 | 82.4 | Lava Lake |
| 01/30/2018 | 10:59 | - | 40.0 | 25.3 | Lava Flows |
| 02/06/2018 | 11:06 | - | 28.5 | 47.9 | Lava Lake |
| 02/08/2018 | 22:42 | - | 26.4 | 49.8 | Lava Flows |
Table 2.
Instrument specifications.
| MMT-Cam (Ground) | MASTER TIR (Airborne) | HyTES (Airborne) | ASTER TIR (Orbital) | |
|---|---|---|---|---|
| Detector | VOX microbolometer | HgCdTe photoconductive | QWIP | HgCdTe photoconductive |
| Field of View | 45° × 37° | 85.92° | 50° | |
| Spatial Resolution (m) | 0.04/0.3 | 50 | 35 | 90 |
| Spectral Resolution | 6 | 9 (7) | 186 | 5 |
| Temporal Resolution | 1 second | Daily during campaign | Daily during campaign | 5–15 days |
| Radiometric Range (K) | 233 to 832 | 245 to 480 | 240 to 455 | 200 to 370 |
| Radiometric Accuracy | 5% | <5% | <1% | <3% |
Table 3.
The combined spatial and spectral average emissivity and kinetic temperature values pre- and post-thermal mixed pixel (TMP) separation analysis for each dataset, including the percentage improvement. The values in parenthesizes represent the standard deviation variation in the data.
Table 3.
The combined spatial and spectral average emissivity and kinetic temperature values pre- and post-thermal mixed pixel (TMP) separation analysis for each dataset, including the percentage improvement. The values in parenthesizes represent the standard deviation variation in the data.
| ASTER TIR | MASTER TIR | HyTES | MMT-Cam | ||
|---|---|---|---|---|---|
| Radiance (Wm−2sr−1µm−1) | Pre-TMP | 19.74 (5.85) | 25.77 (8.98) | 34.83 (13.81) | 162.91 (76.31) |
| Post-TMP | 493.22 (191.57) | 300.59 (111.48) | 402.64 (146.68) | 454.27 (158.12) | |
| Change | 2400% | 1070% | 1060% | 180% | |
| Emissivity | Pre-TMP | 0.898 (0.077) | 0.723 (0.130) | 0.805 (0.114) | 0.739 (0.087) |
| Post-TMP | 0.752 (0.099) | 0.584 (0.141) | 0.604 (0.260) | 0.711 (0.078) | |
| Change | 19% | 23% | 33% | 4% | |
| Temperature (K) | Pre-TMP | 354.1 (23.8) | 425.2 (64.3) | 407.8 (32.5) | 736.2 (163.0) |
| Post-TMP | 1242.3 (337.0) | 1128.2 (408.0) | 1266.1 (404.0) | 1225.9 (329.6) | |
| Change | 250% | 170% | 210% | 70% |
© 2020 by the authors. Licensee MDPI, Basel, Switzerland. This article is an open access article distributed under the terms and conditions of the Creative Commons Attribution (CC BY) license (http://creativecommons.org/licenses/by/4.0/).
Share and Cite
MDPI and ACS Style
Thompson, J.O.; Ramsey, M.S. Uncertainty Analysis of Remotely-Acquired Thermal Infrared Data to Extract the Thermal Properties of Active Lava Surfaces. Remote Sens. 2020, 12, 193. https://0-doi-org.brum.beds.ac.uk/10.3390/rs12010193
AMA Style
Thompson JO, Ramsey MS. Uncertainty Analysis of Remotely-Acquired Thermal Infrared Data to Extract the Thermal Properties of Active Lava Surfaces. Remote Sensing. 2020; 12(1):193. https://0-doi-org.brum.beds.ac.uk/10.3390/rs12010193
Chicago/Turabian StyleThompson, James O., and Michael S. Ramsey. 2020. "Uncertainty Analysis of Remotely-Acquired Thermal Infrared Data to Extract the Thermal Properties of Active Lava Surfaces" Remote Sensing 12, no. 1: 193. https://0-doi-org.brum.beds.ac.uk/10.3390/rs12010193
Note that from the first issue of 2016, this journal uses article numbers instead of page numbers. See further details here.