Article

Backward Adaptive Brightness Temperature Threshold Technique (BAB3T): A Methodology to Determine Extreme Convective Initiation Regions Using Satellite Infrared Imagery

1
Departamento de Ciencias de la Atmósfera y los Océanos, Facultad de Ciencias Exactas y Naturales, Universidad de Buenos Aires, Buenos Aires C1428EGA, Argentina
2
Centro de Investigaciones del Mar y la Atmósfera (CIMA), Instituto Franco Argentino sobre Estudios de Clima y sus Impactos (UMI IFAECI)/CNRS-CONICET, Universidad de Buenos Aires, Buenos Aires C1428EGA, Argentina
3
National Institute for Space Research, INPE/CPTEC, Cachoeira Paulista 12630-000, Brazil
4
Department of Atmospheric Sciences, University of Illinois at Urbana-Champaign, Urbana, IL 61801, USA
5
Servicio Meteorológico Nacional, Buenos Aires C1425GBE, Argentina
*
Author to whom correspondence should be addressed.
Submission received: 31 October 2019 / Revised: 15 January 2020 / Accepted: 16 January 2020 / Published: 20 January 2020

Abstract

:
Thunderstorms in southeastern South America (SESA) stand out in satellite observations as being among the strongest on Earth in terms of satellite-based convective proxies, such as lightning flash rate per storm, the prevalence for extremely tall, wide convective cores and broad stratiform regions. Accurately quantifying when and where strong convection is initiated presents great interest in operational forecasting and convective system process studies due to the relationship between convective storms and severe weather phenomena. This paper generates a novel methodology to determine convective initiation (CI) signatures associated with extreme convective systems, including extreme events. Based on the well-established area-overlapping technique, an adaptive brightness temperature threshold for identification and backward tracking with infrared data is introduced in order to better identify areas of deep convection associated with and embedded within larger cloud clusters. This is particularly important over SESA because ground-based weather radar observations are currently limited to particular areas. Extreme rain precipitation features (ERPFs) from Tropical Rainfall Measurement Mission are examined to quantify the full satellite-observed life cycle of extreme convective events, although this technique allows examination of other intense convection proxies such as the identification of overshooting tops. CI annual and diurnal cycles are analyzed and distinctive behaviors are observed for different regions over SESA. It is found that near principal mountain barriers, a bimodal diurnal CI distribution is observed denoting the existence of multiple CI triggers, while convective initiation over flat terrain has a maximum frequency in the afternoon.

Graphical Abstract

1. Introduction

The occurrence of severe deep moist convection over southeastern South America (SESA; area enclosed by solid black box in Figure 1) produces high impact weather events (e.g., hail, tornadoes, flooding, damaging winds) that directly impact the population, water resource management and agricultural production in the region [1,2,3,4,5,6].
Studies using data from multiple satellite platforms have shown that deep extreme and horizontal organized convection occurs in continental subtropical South America [7,8,9,10,11,12]. These studies show that deep moist convection, particularly mesoscale convective systems (MCSs), reach extreme characteristics of size and duration, and dominate rainfall production compared with other regions of the world [13,14]. In the absence of a monitoring ground-based weather radar network, earlier studies such as the pioneering work of Velasco and Fritsch [15] were mainly conducted using thermal infrared channels from geostationary satellite platforms. Other authors such as Machado et al. [16], Nieto Ferreira et al. [17], Siqueira et al. [18], Salio et al. [19], Anabor et al. [20], Vila et al. [21], Durkee and Mote [22], among others have explored more complete characterization of these MCSs lifecycles (i.e., spatial and temporal distribution, directions of travel, maximum sizes attained, among others). It was only with the advent of the Tropical Rainfall Measuring Mission (TRMM) satellite that the internal structure of these large convective systems was investigated in a more comprehensive manner over SESA. Many studies have shown that convection can occur with cloud tops defined by 20-dBZ contour as high as 18 km. Such conditions are at the same time associated with the presence of deep convective clouds, many with large ice and hail mass content, intense lightning activity, as well as wide convective regions [7,9,10,12,23]. TRMM’s non-sun-synchronous low-inclination orbit of 35 degrees poses limitations for the development of conceptual models to study deep moist convection initiation and further development due to a revisit frequency close to 46 days before returning at a specific local time. Nonetheless, several climatological studies of the diurnal cycle have been conducted with the long-term dataset available [24,25,26,27]. However, TRMM or the more recently launched global precipitation measurement (GPM) data are not able to provide information with the same temporal frequency as geostationary platforms. A combination of infrared sensors on geostationary platforms and TRMM-GPM radar information are ideal to understand the evolution of convective systems and determine initiation regions (e.g., [28]) over regions without the presence of long records of ground weather radar networks.
Focusing on central Argentina, Mulholland et al. [6] used observations from the first dual polarization weather radar at Córdoba (Figure 1) to examine convective initiation (CI) and life cycle of convective modes over the radar domain. While this work examined radar-determined CI locations over a two year period, further study is necessary to relate CI modes, storm environments, and associated storm impacts and hazards in SESA. Nonetheless, CI has been studied for many years primarily on ground-based weather radar observations of the clear-air boundary layer, storm reflectivity, storm Doppler velocity structure, and visual observations of clouds around the globe [29]. Backward tracking techniques using radar information are crucial to determine CI areas, but for the purposes of studying CI in SESA, ground-based weather radar coverage is limited in terms of the length of record (Mulholland et al. [6] used only two years of data), spatial coverage, and data availability. In spite of growing networks over Argentina and Brazil, radar coverage is primarily constrained to populated areas and records are short in comparison with satellite information. Moreover, since ground-based weather radar data over SESA is collected by multiple agencies, information availability to the scientific community is still a pending issue to be resolved in the near future.
With this motivation in mind, the purpose of this study is to extend current satellite tracking algorithms to better capture the initiation of convection, present the approach to this new technique, and validate the revised algorithm in order to identify convective initiation areas and track storms early in their life cycle using thermal infrared channel brightness temperatures from geostationary satellites. This tool is principally designed to be applied over large regions uncovered or without long term records provided by ground-based weather radars, but could also complement existing radar-based CI detection and nowcasting tools.
The structure of this paper is as follows. The data used and algorithm is described in Section 2, while Section 3 aims to validate the results of the methodology. The main findings of the study are summarized in Section 4.

2. Data and Methods

2.1. TRMM Extreme Rain Precipitation Features Selection

This study uses the University of Utah Rain Precipitation Feature (RPF) database [30]. RPFs are derived from TRMM satellite information to identify different types of extreme convective systems. Each RPF provides information on the precipitating system enclosed by 0.1 mm h - 1 as obtained from the 2A25 TRMM PR near-surface rainfall rate retrieval [31]. From this database, a variety of parameters are calculated from the multiple sensors onboard TRMM platform.
Following [7], RPFs, to be considered extreme, were required to exceed a threshold in at least one of the following intensity proxy variables: polarization corrected temperature (PCT) at 37 GHz and 85 GHz from TRMM Microwave Imager, lightning flash rate from Lightning Imaging Sensor, maximum height of the 40 dBZ echoes and volumetric rainfall from Precipitation Radar. Threshold values were defined as the 99th percentile of the probability distribution function for each variable shown in Table 1; we note these extreme RPFs as ERPFs herein. Probability density functions were calculated in the SESA region for the time period of 1 January 2000 to 31 December 2013 inclusive.

2.2. GOES-16 Extreme Convective Systems Selection

GOES-16 geostationary satellite was launched on November 2016 and reached its final position at 75W on December 2017. The Advanced Baseline Imager (ABI) sensor on board provides measurements on 16 channels distributed on the electromagnetic spectrum from visible to infrared with spatial resolution between 500 m and 2 km. Full disk observations covering North, Central and South America are available every 15 min until April 2019 and every 10 min since then. Unlike previous generation of GOES satellites which thermal infrared (TIR) channel with 4 km spatial resolution was located at 10.8 μ m, ABI sensor provides two TIR channels at 10.3 μ m and 11.2 μ m with 2 km spatial resolution, being the first, the one chosen for this study. Moreover, ABI produces Mesoscale Domain Sectors (MDS) measurements which consist on 1000 × 1000 km regions with varying central position and 1 min temporal resolution.
A useful proxy to identify the presence of deep convection development inside a large cloud shield is the presence of an overshooting cloud top (OT) that indicates an updraft strong enough to penetrate through the tropopause. A variety of studies conducted in different locations have shown that OTs are associated with severe weather such as strong winds, heavy rainfall, hail or tornadoes [32,33,34,35,36,37].
On 10 November 2018, during a RELAMPAGO (remote sensing of electrification, lightning, and meso-scale micro-scale processes with adaptive ground observations and CACTI: Cloud, aerosol, and complex terrain interactions) field campaign intensive operation period, a severe weather event took place in central Argentina with the development of two storms with marginal supercell characteristics and generated crowdsourced surface hail reports [38]. 10 November 2018 is an event outside TRMM era without an associated ERPF from GPM due to a mismatch in overpass time with the event, but OT patterns could be easily observed on the visible and infrared imagery assuring the presence of extreme convection associated with these cells. Therefore, following [33], OTs locations were estimated to define the position of the deep convective cells using GOES-16 15 min and full disk and MDS observations. The high temporal resolution information available for this event will provide for a sensitivity test of the technique proposed to time intervals between 1 and 30 min.

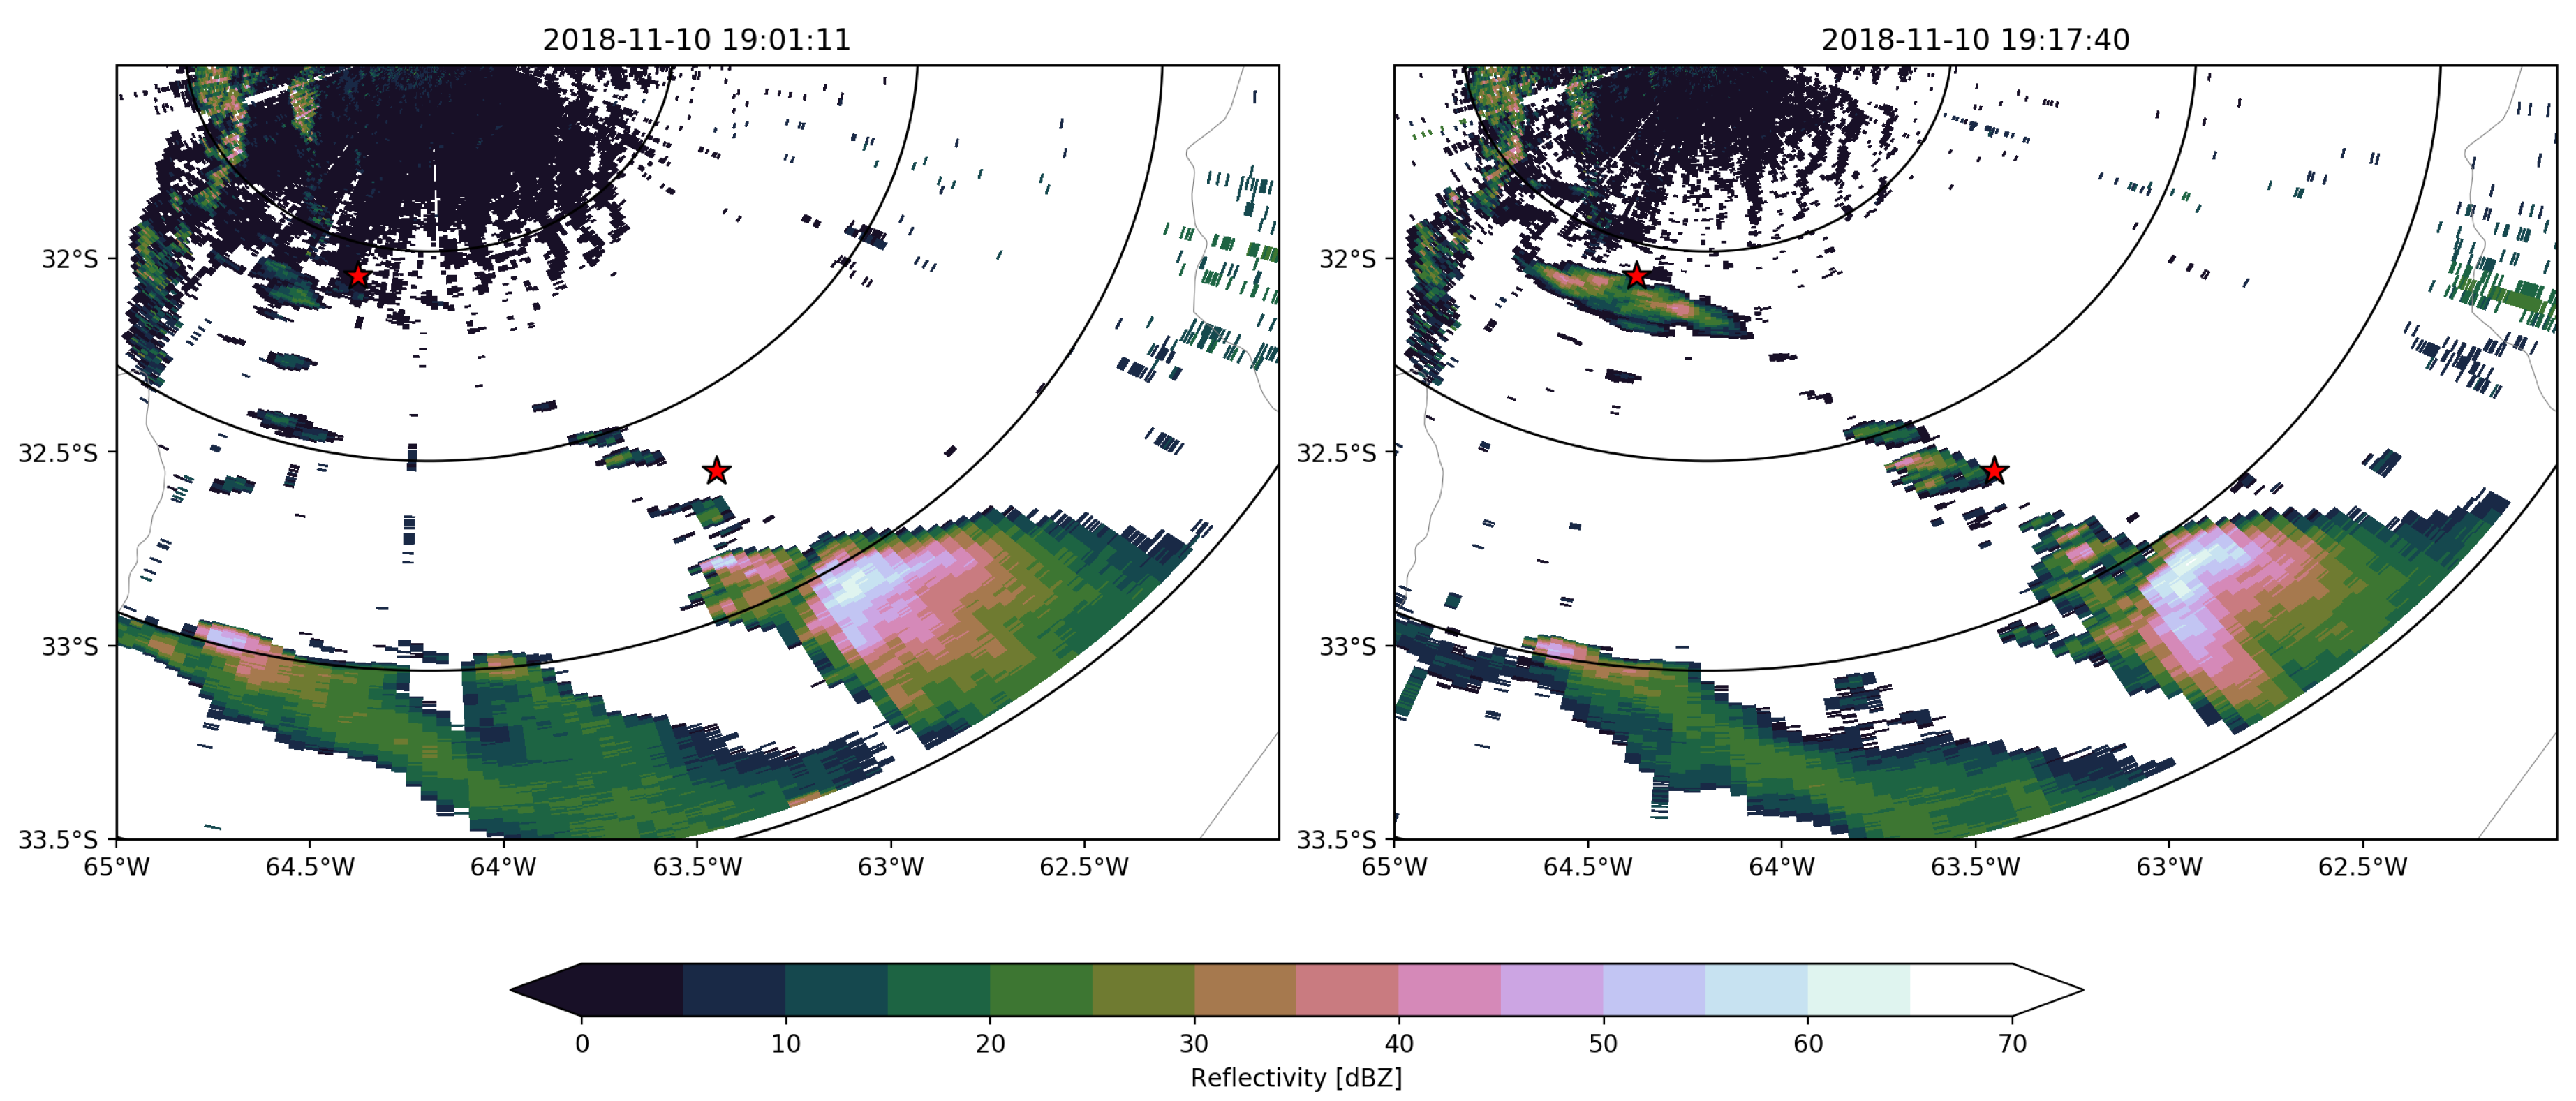
2.3. Ground Weather Radar Data

Argentinean Meteorological Radar 1 (RMA1—Radar Meteorológico Argentino 1, in Spanish) is located at the University of Córdoba, Córdoba (31.4 S–64.2 W). This is a C-band (5.4-cm wavelength) dual-polarization Doppler weather radar. This radar system was designed and manufactured by INVAP S.E. and is operated by the National System of Meteorological Radars (SINARAME, Sistema Nacional de Radares Meteorológicos, in Spanish) for the Servicio Meteorológico Nacional of Argentina. RMA1 records data at a range spacing of 480 m, with a maximum range of 480 km and a beam width of 0.988 . The system records radar reflectivity, radial velocity, spectral width, differential reflectivity, correlation coefficient, differential phase, among other moments. Information from the storms initiated on 10 November 2018 is considered in this work in order to evaluate the performance of the algorithm introduced in this study.

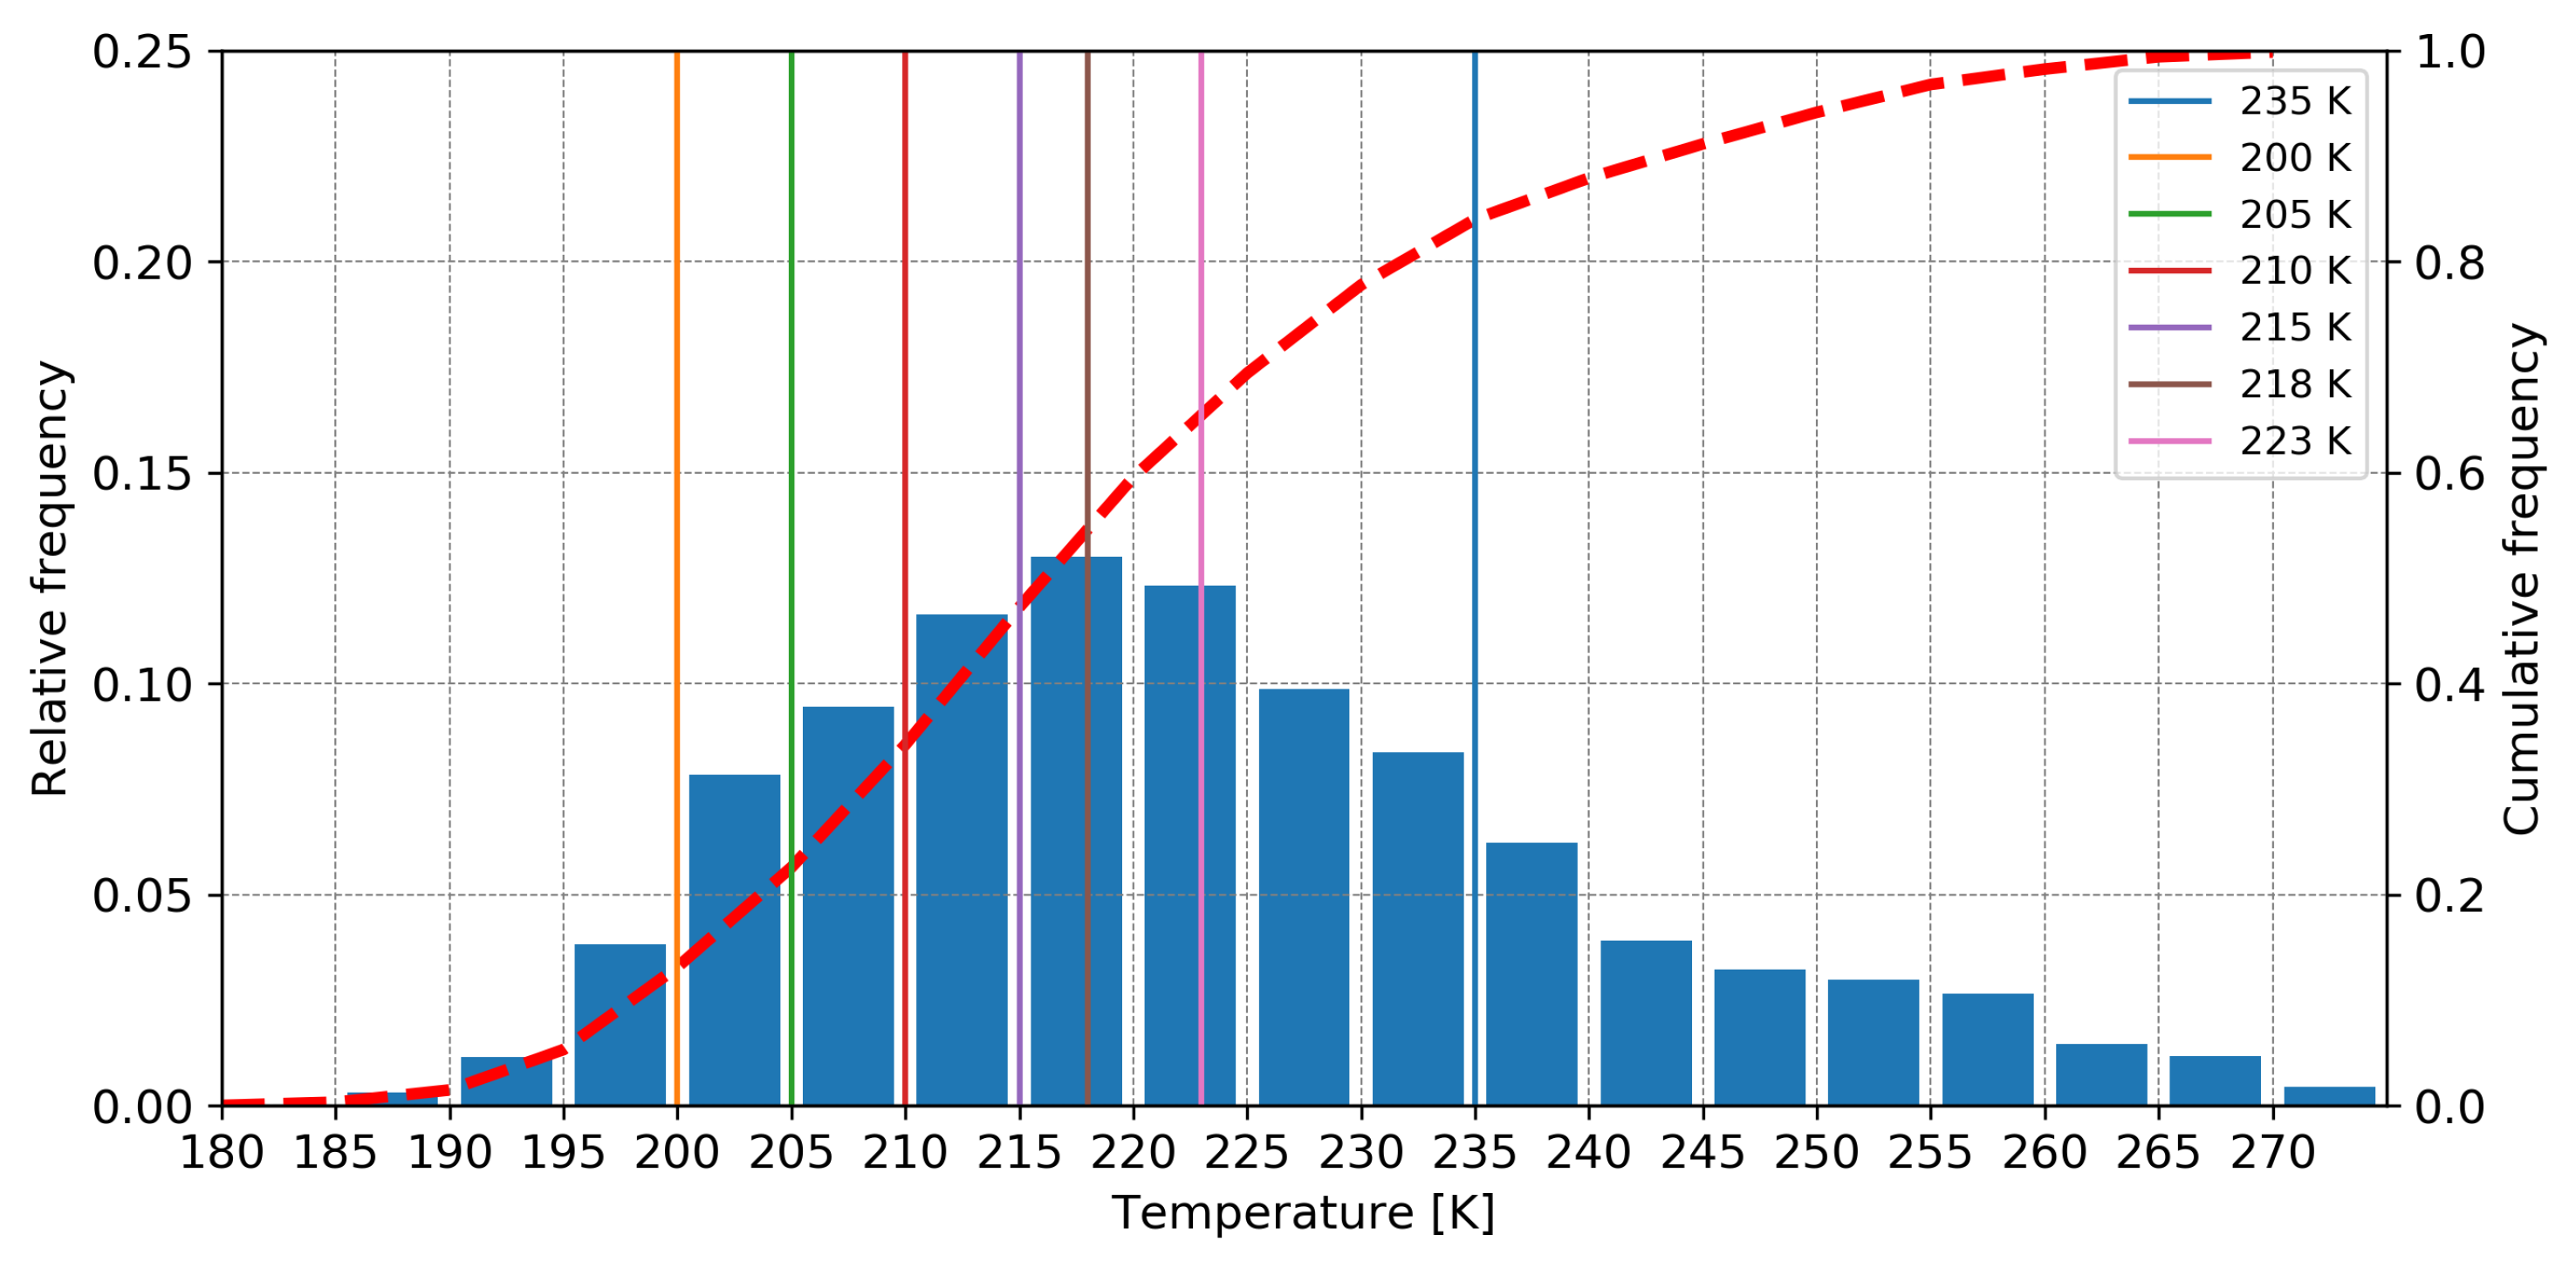
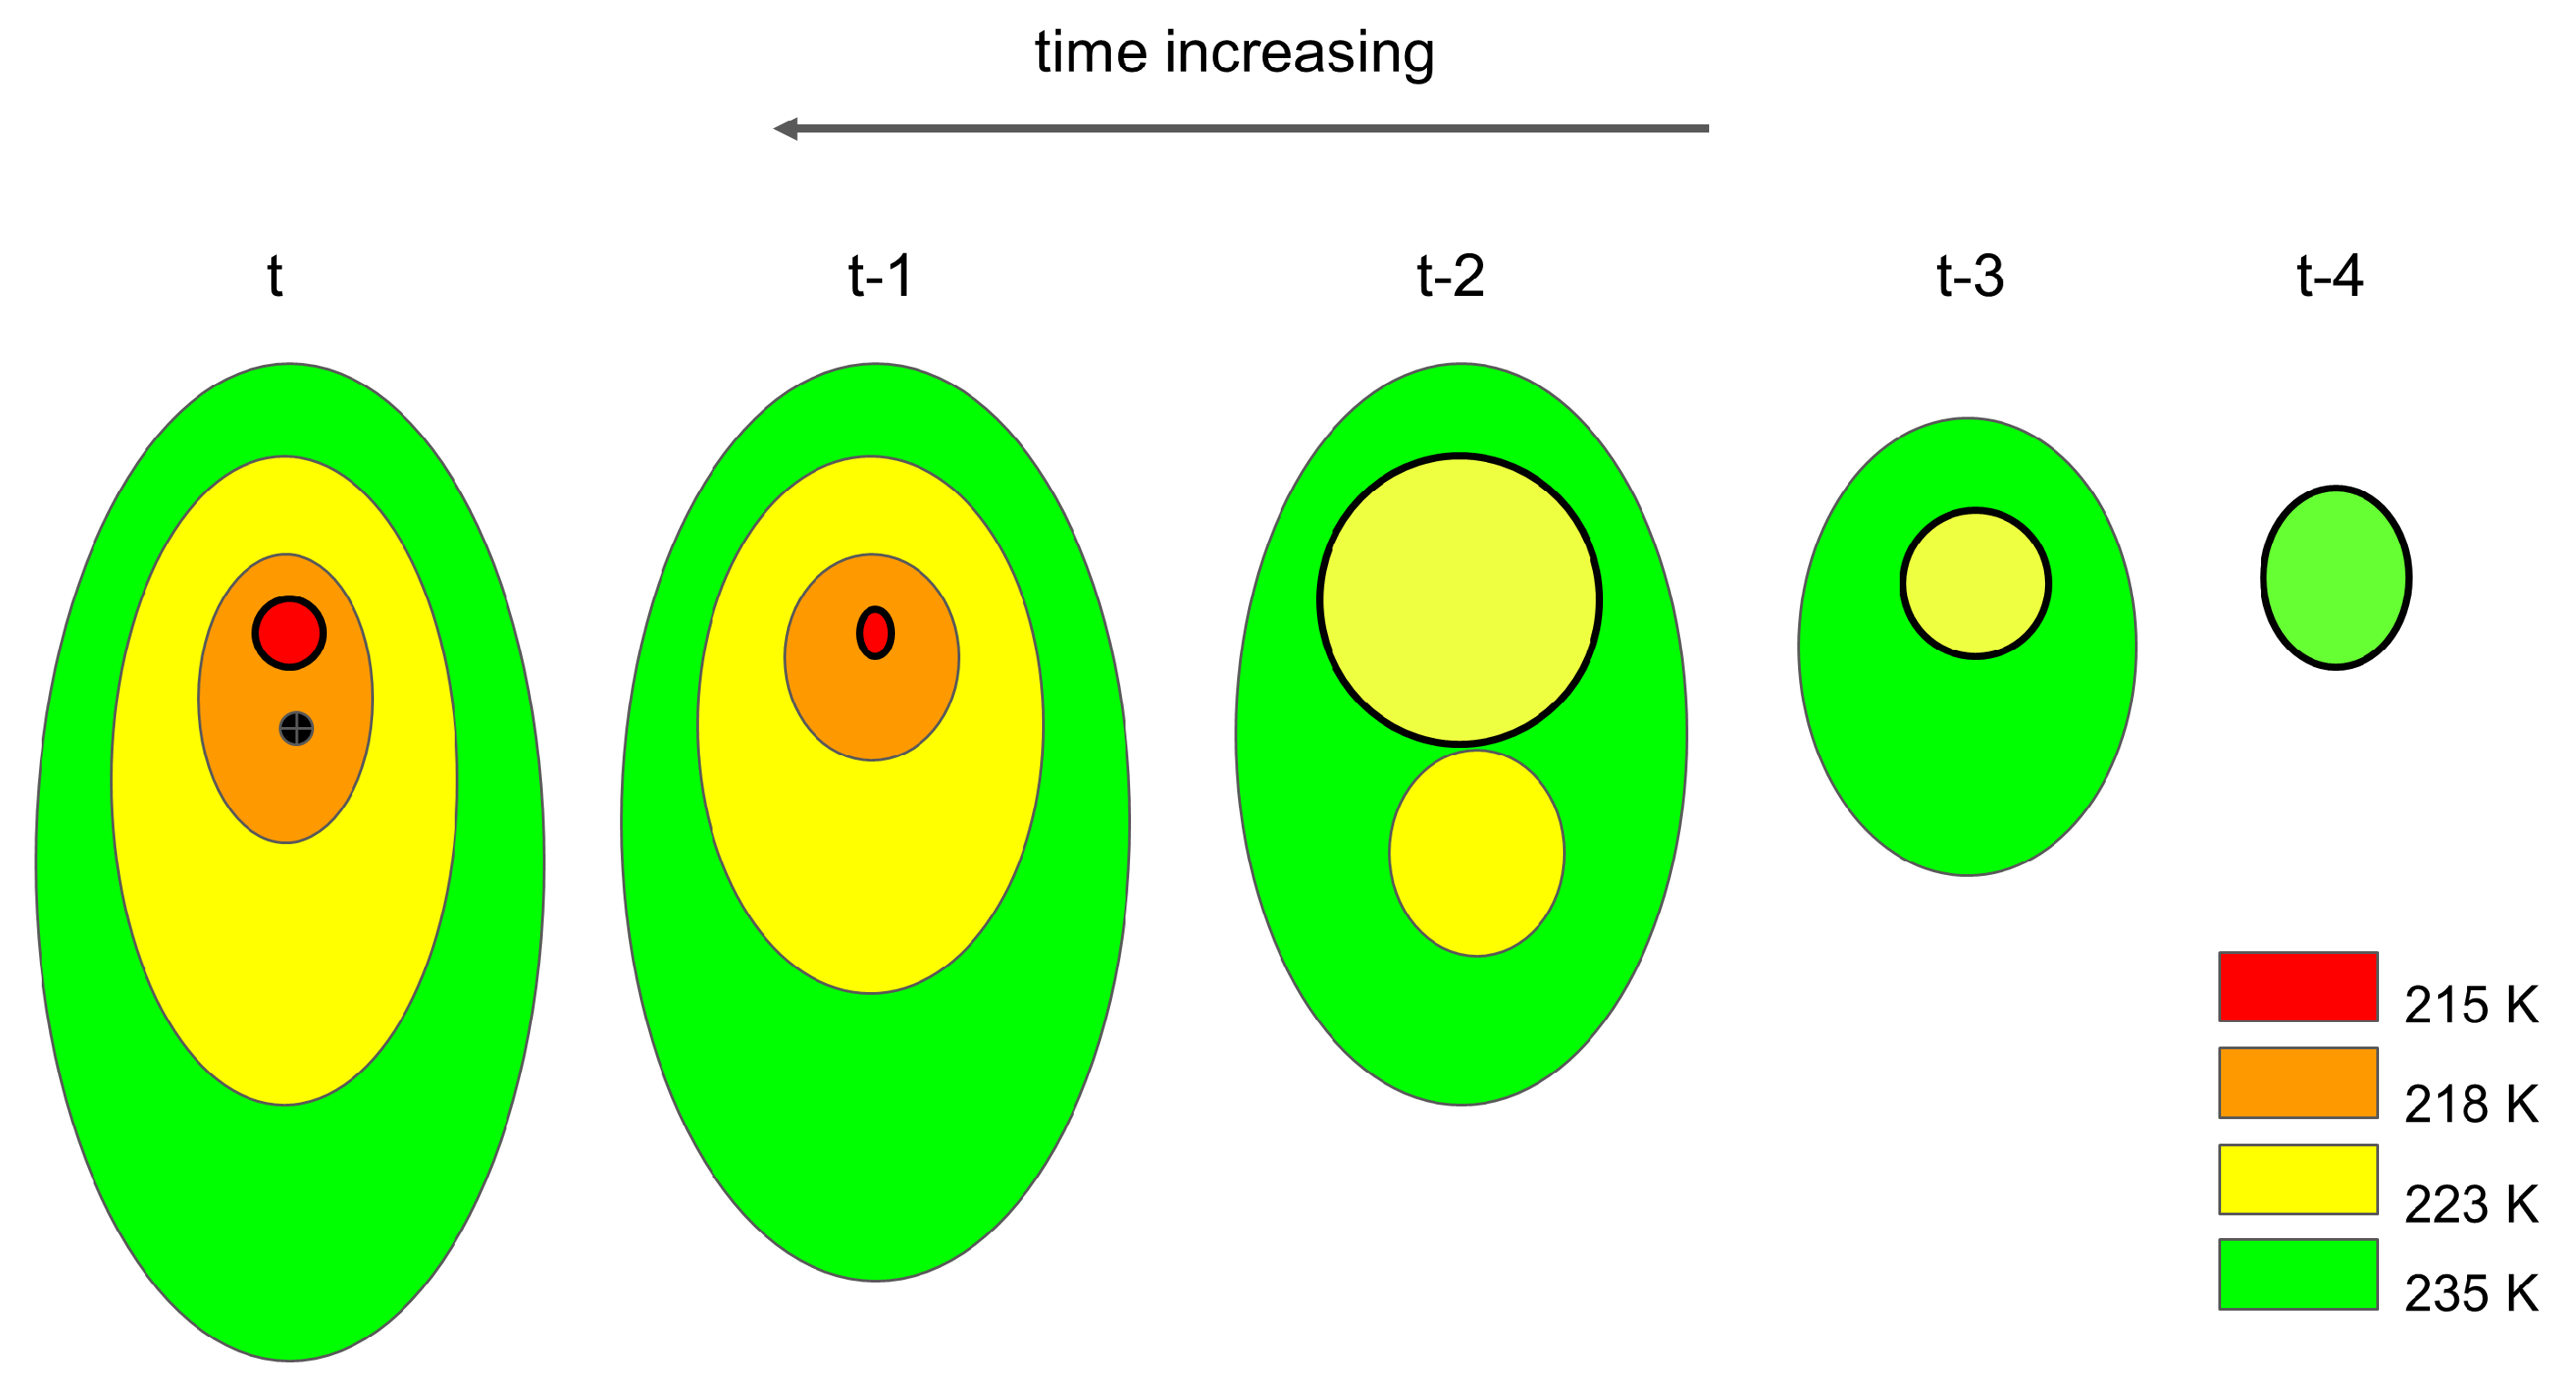
2.4. Backward Adaptive Brightness Temperature Threshold Technique to Determine Convective Initiation Area

The backward adaptive brightness temperature threshold technique (BAB3T) from TIR channel of geostationary satellites is developed, advancing the technique proposed by Vila et al. [21] to better capture CI. This methodology is based on the geographical overlapping between convective clouds in two consecutive images, where the cloud system is considered to initiate when no overlapping occurs in the previous image. On the other hand, a convective system dissipates when there is no longer an intersection with another cluster in the next image [39].
While the threshold choice to define a cloud system can vary depending on the study region or research focus, various studies have shown that brightness temperatures lower than 245 K are useful to identify and describe the lifecycle of MCSs [16]. Maddox [40] identified MCSs using a threshold of 241 K, while Velasco and Fritsch [15] used lower values over SESA region (231 K or 233 K) to detect the cloud shield but a lower threshold was required on both definitions to ensure convective activity inside the area. More recently, the 218 K threshold was used to study deep moist convective systems associated with South American Low Level Jet (SALLJ) events in the SESA region [19,22], 210 K [41] and 220 K [42] were found useful to detect deep convection with low earth orbital infrared sounders.
While the tracking of large cloud clusters can be informative, extreme convective systems such as individual ERPFs can be embedded within cloud clusters associated with several individual MCSs and/or anvil merging with other convective systems. One approach then to identify individual active convective regions is to consider colder temperature thresholds. In order to evaluate possible temperature values, TIR brightness temperature for the nearest pixel from the ERPF centroid location are examined. As shown in Figure 2, a wide distribution of temperatures is found for SESA convective systems, highlighting that a fixed threshold could not be suitable for cloud cluster tracking with a climatological perspective. For example, if a fixed 210 K threshold is picked, more than 60% of ERPFs would not be detected. On the other hand, 235 K could include more than 80% of ERPFs, however, as it will be shown later on this work, that would imply an erroneous determination of initiation area, due to the fact that the cloud cluster tracking is not necessarily following embedded deep convection which may be within a larger anvil region below a predefined TIR threshold.
First of all, BAB3T identifies the initial threshold to begin the backward tracking. For this purpose, cloud clusters were constructed considering consecutive pixels with TIR equal or less than 200 K, 205 K, 210 K, 215 K, 218 K, 223 K, and 235 K by pixel clustering using TIR at 10.8 μ m from the Ancillary TRMM database [43] with 30 min time resolution and 4 km spatial resolution. The cluster with the lower temperature overlapping at a maximum range of 16 km from the ERPF centroid location and at a +/−30 min window is initially chosen. As the timing of TRMM overpass rarely coincides exactly with TIR imagery on the half-hour and the ERPF centroid position can have a bias to the stratiform region of the storm, a colder cluster overlapping the previous one is searched in order to identify the most intense region of the storm. If more than one cluster with the minimum temperature is found a maximum overlapping area criterion is applied.
A schematic of the methodology is presented in Figure 3. In the first step, the ERPF (black dot) overlaps with the 218 K cluster, however, there is a 215 K cluster included in its area, hence, the later would be chosen as the initial threshold. Once the threshold is determined, an overlapping area of the same temperature is searched on the previous time. In case the system merged and, therefore, more than one system is found, again a maximum overlapping area criterion is used.
However, the definition of an adaptive initial threshold is not sufficient to estimate the convective initiation location. A low temperature threshold would lead to a short-lived system since the extreme values, as 200 K, could be reached several minutes after the storm initiation and would maintain only for a short period. In the simplified example, the 215 K cluster disappears on the third time step, but the convection starts developing at least two time steps before.
After no overlap for the initial threshold is found, an intersection with a higher temperature cluster is searched for and the tracking is continued until no overlap for the 235 K cluster area is founded on the previous image, defining the moment and center of convective cluster at initiation time.
Following the scheme, on the third time step, 215 K and 218 K clusters disappear and 223 K is now the tracking threshold. Since there are two systems, the one in the north is chosen because of the maximum area overlapping criteria. Initiation time and location are defined on the fifth step when the 235 K cluster found no overlapping on the next time step.
To avoid large jumps due to possible merging, a maximum distance between the clusters centroid locations on two consecutive images is imposed. Considering that it was observed that the centroid location of colder clusters that are usually associated with the convective region of the storm tends to change its position over time less than warmer ones associated with the stratiform region, it was necessary to define a unified distance value. Moreover, the technique should take into account that the centroid of different temperature clusters for the same cloud system can differ by several kilometers. Thus, if a very restrictive value is chosen, backward tracking would fail on the stage when temperature threshold is changed. On the other hand, if the distance allowed is too long or no limit is imposed, a cluster merging could lead to a erroneous convective initiation region. An evaluation with different distance values from 50 km to 500 km was performed for several cases, and 200 km was considered as the optimal value. If the distance exceeds the maximum, that time is skipped and the tracking continues by searching for an overlap on a previous time (i.e., 1 h before). If a large jump is also found at that time, the ERPF is dismissed as it cannot be isolated from a bigger MCS. Same methodology is followed in case of missing images. Prior to GOES-16, the GOES satellites had periods of intensive observation over North America, typically between 0:30 UTC to 04:00 UTC, and this produced a lack of TIR observations in southern South America. IR Ancillary TRMM database, however, consists of a globally-merged data from the European, Japanese, and U.S. geostationary satellites and missing hours could be partially covered by parallax-corrected Meteosat observations. Nevertheless, the high zenith angle of Meteosat observations caused a TIR temperature increase of cloud clusters. This effect is mitigated by continuing the tracking with the lowest possible threshold and restarting the tracking, searching for a colder temperature, once GOES missing hours were over.
Considering large jumps in centroid position and missing data limitations, from the total sample of the 1% extreme TRMM RPFs that contains 12,482 systems, 2889 were not possible to be tracked to their CI location. Thus, the database considered in this paper has a sample size of 9593 systems that were able to be tracked backward to determine convective initiation areas.
An advantage of BAB3T is that it can be implemented with several convective proxies since only TIR data is needed. CI time and location, for storms with later development of OTs, are easily tracked with BAB3T. The only difference with TRMM ERPFs methodology is that, since the convective proxy is derived from the same TIR dataset and there is no time gap, the coldest temperature cluster overlapping the OT position is chosen as the initial threshold.

3. Results

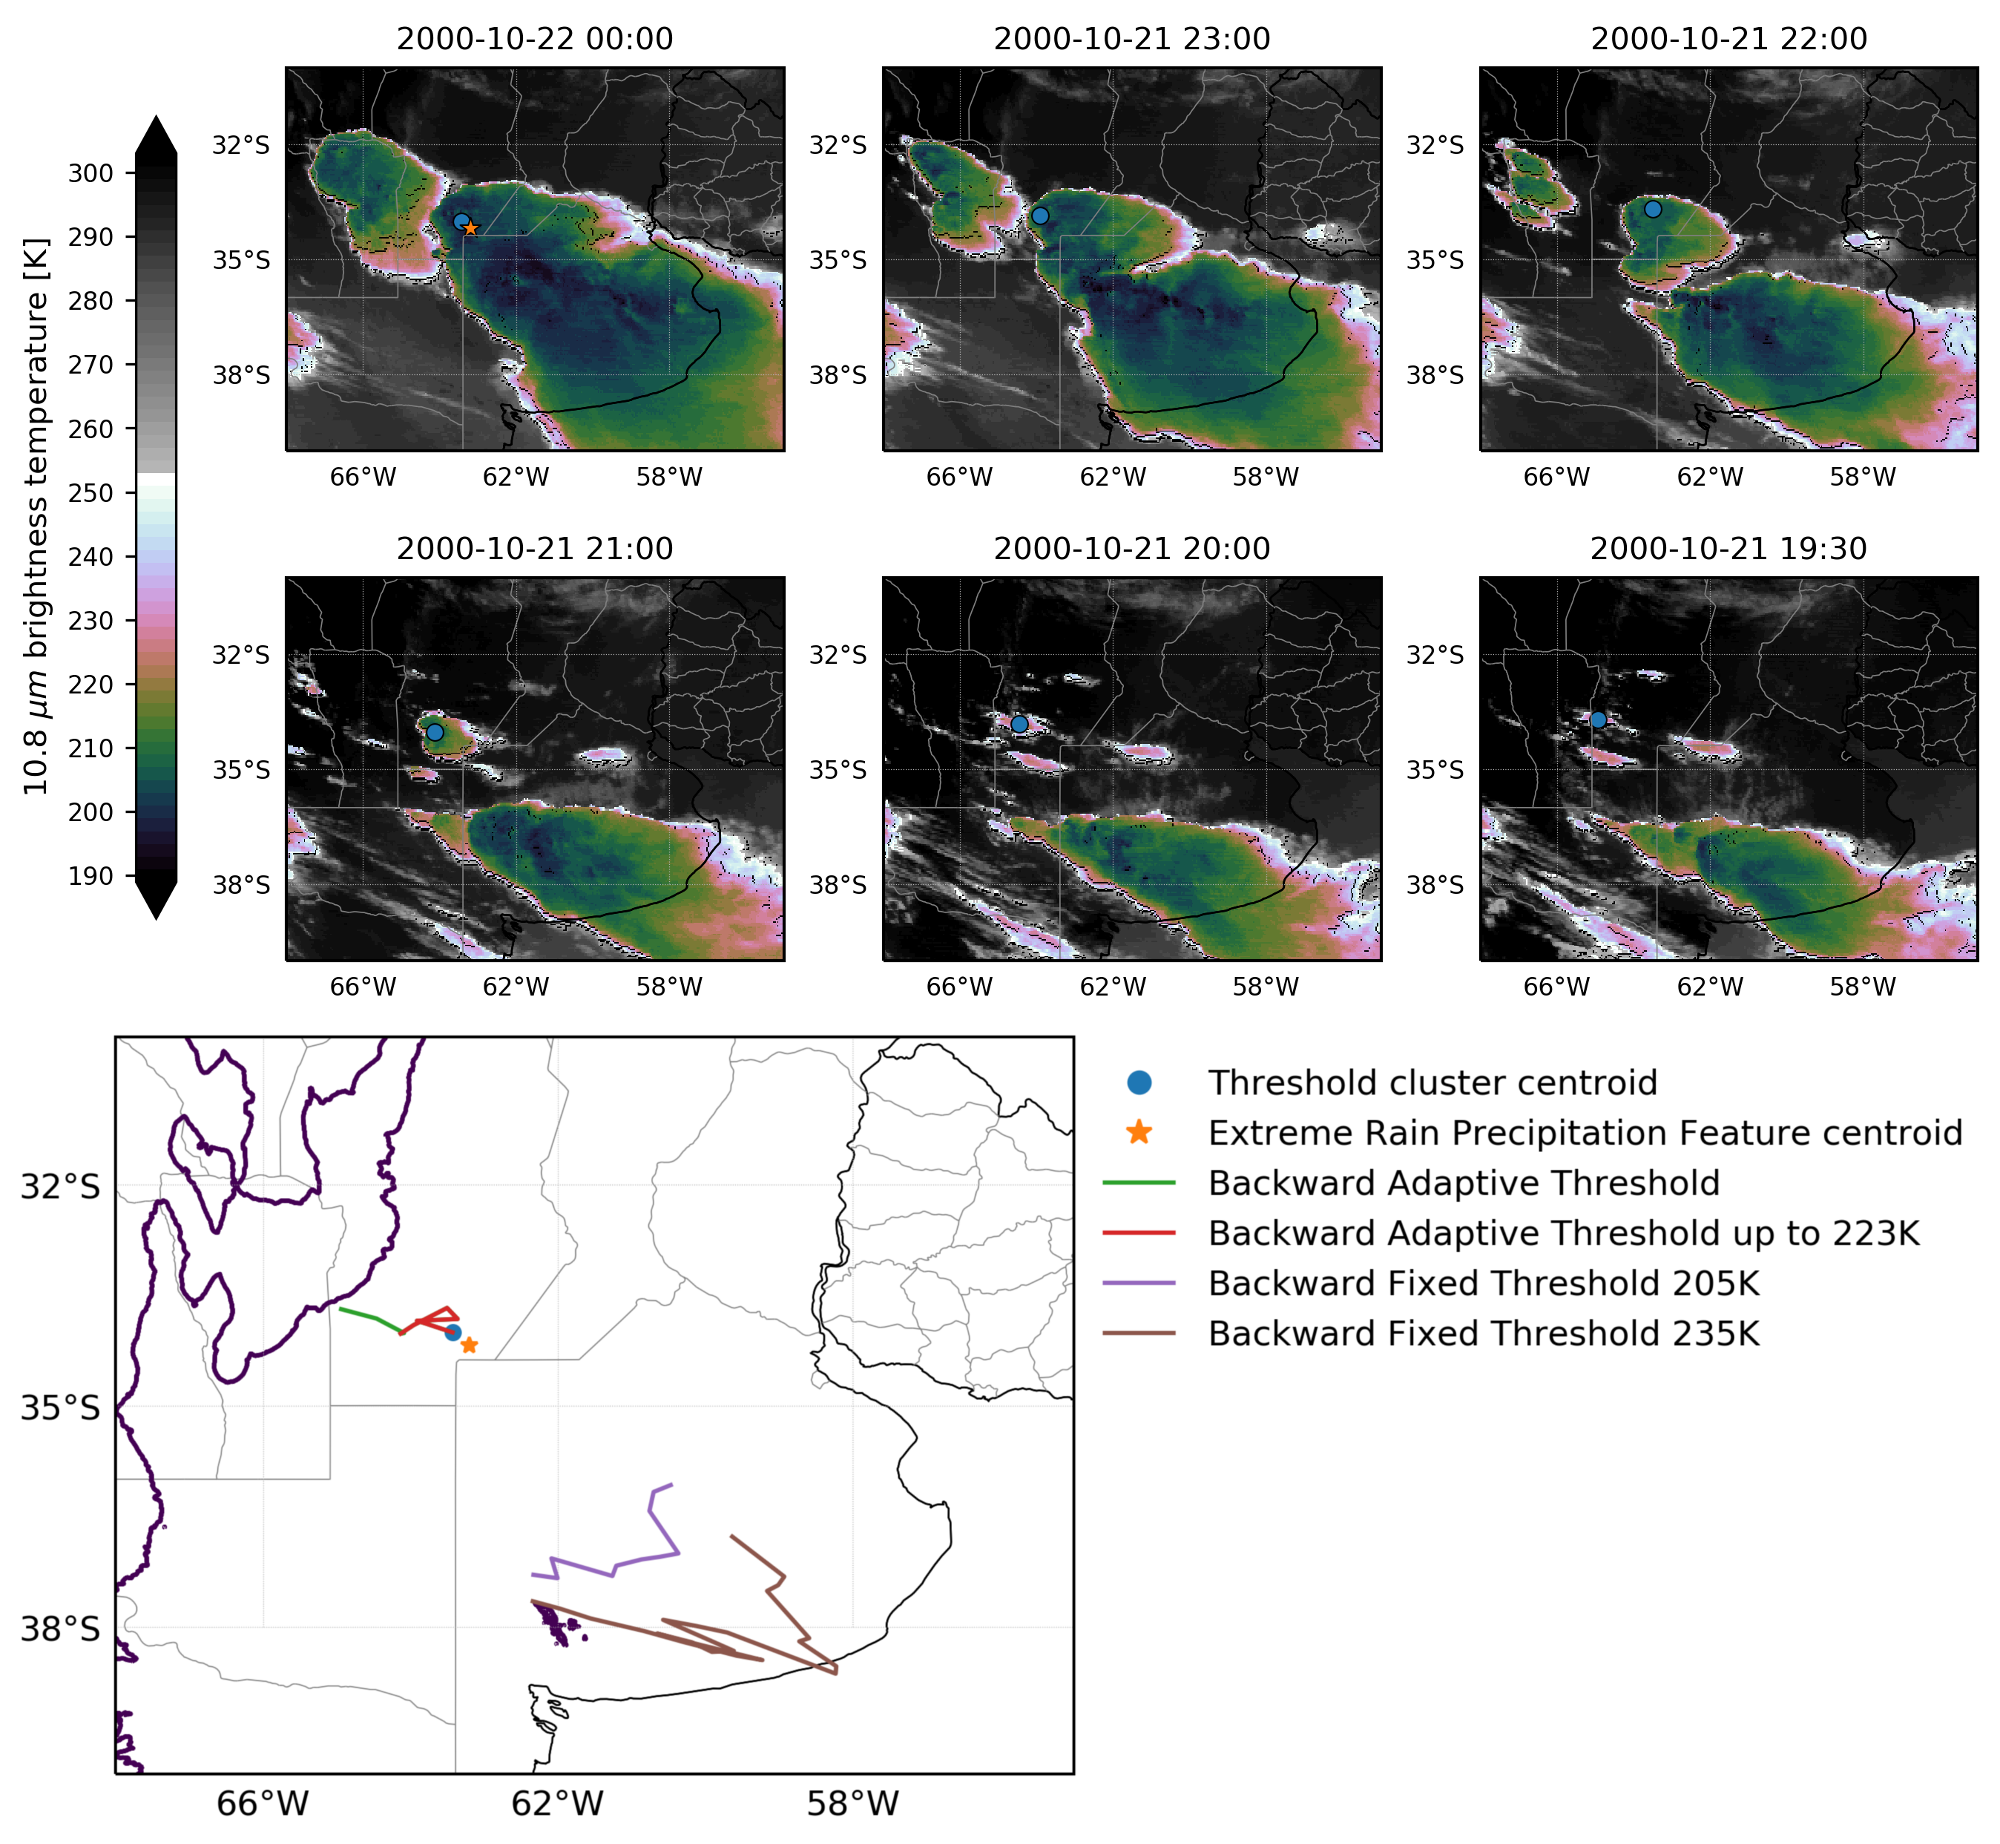
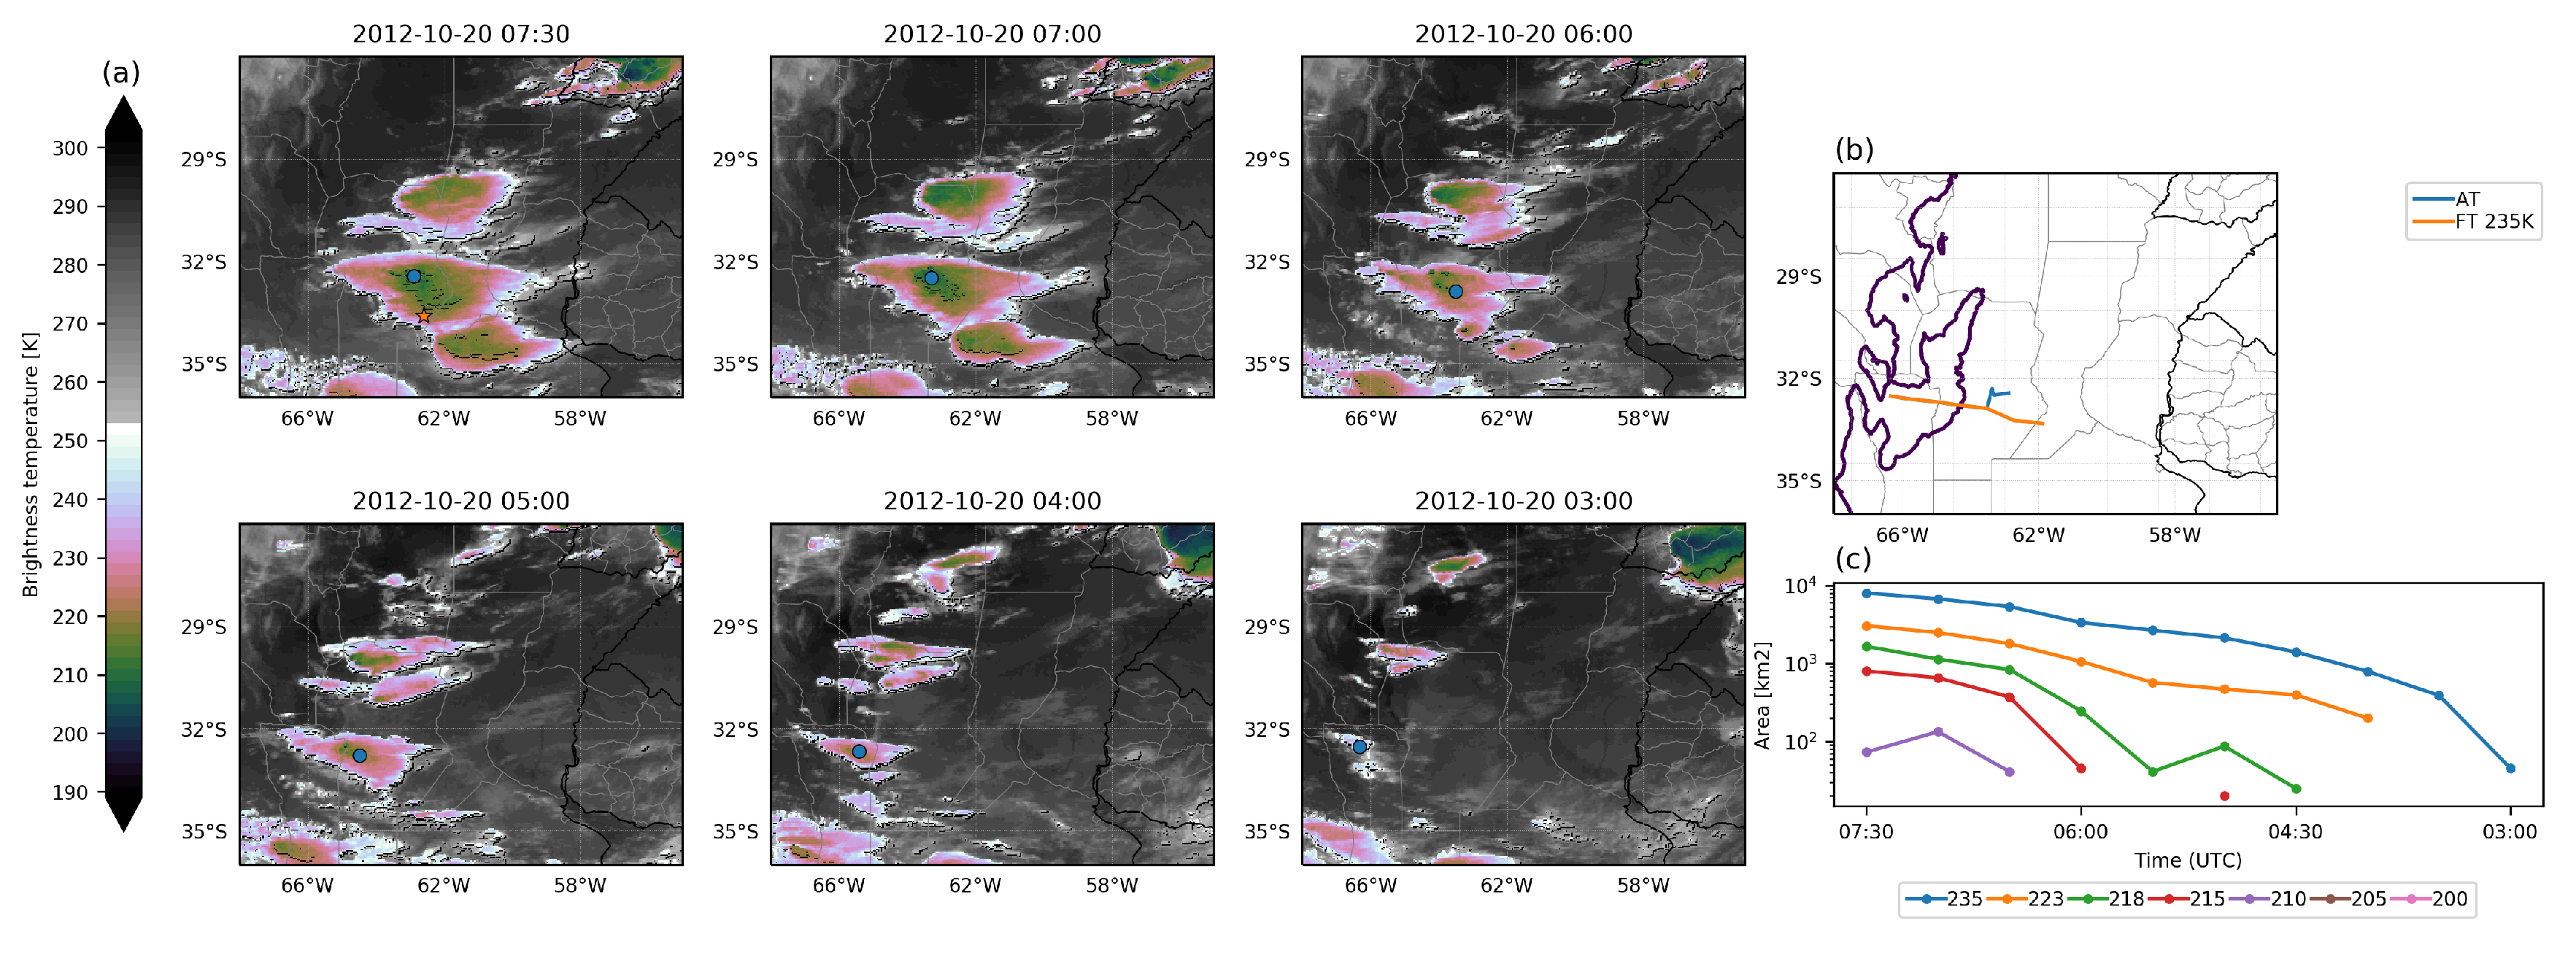
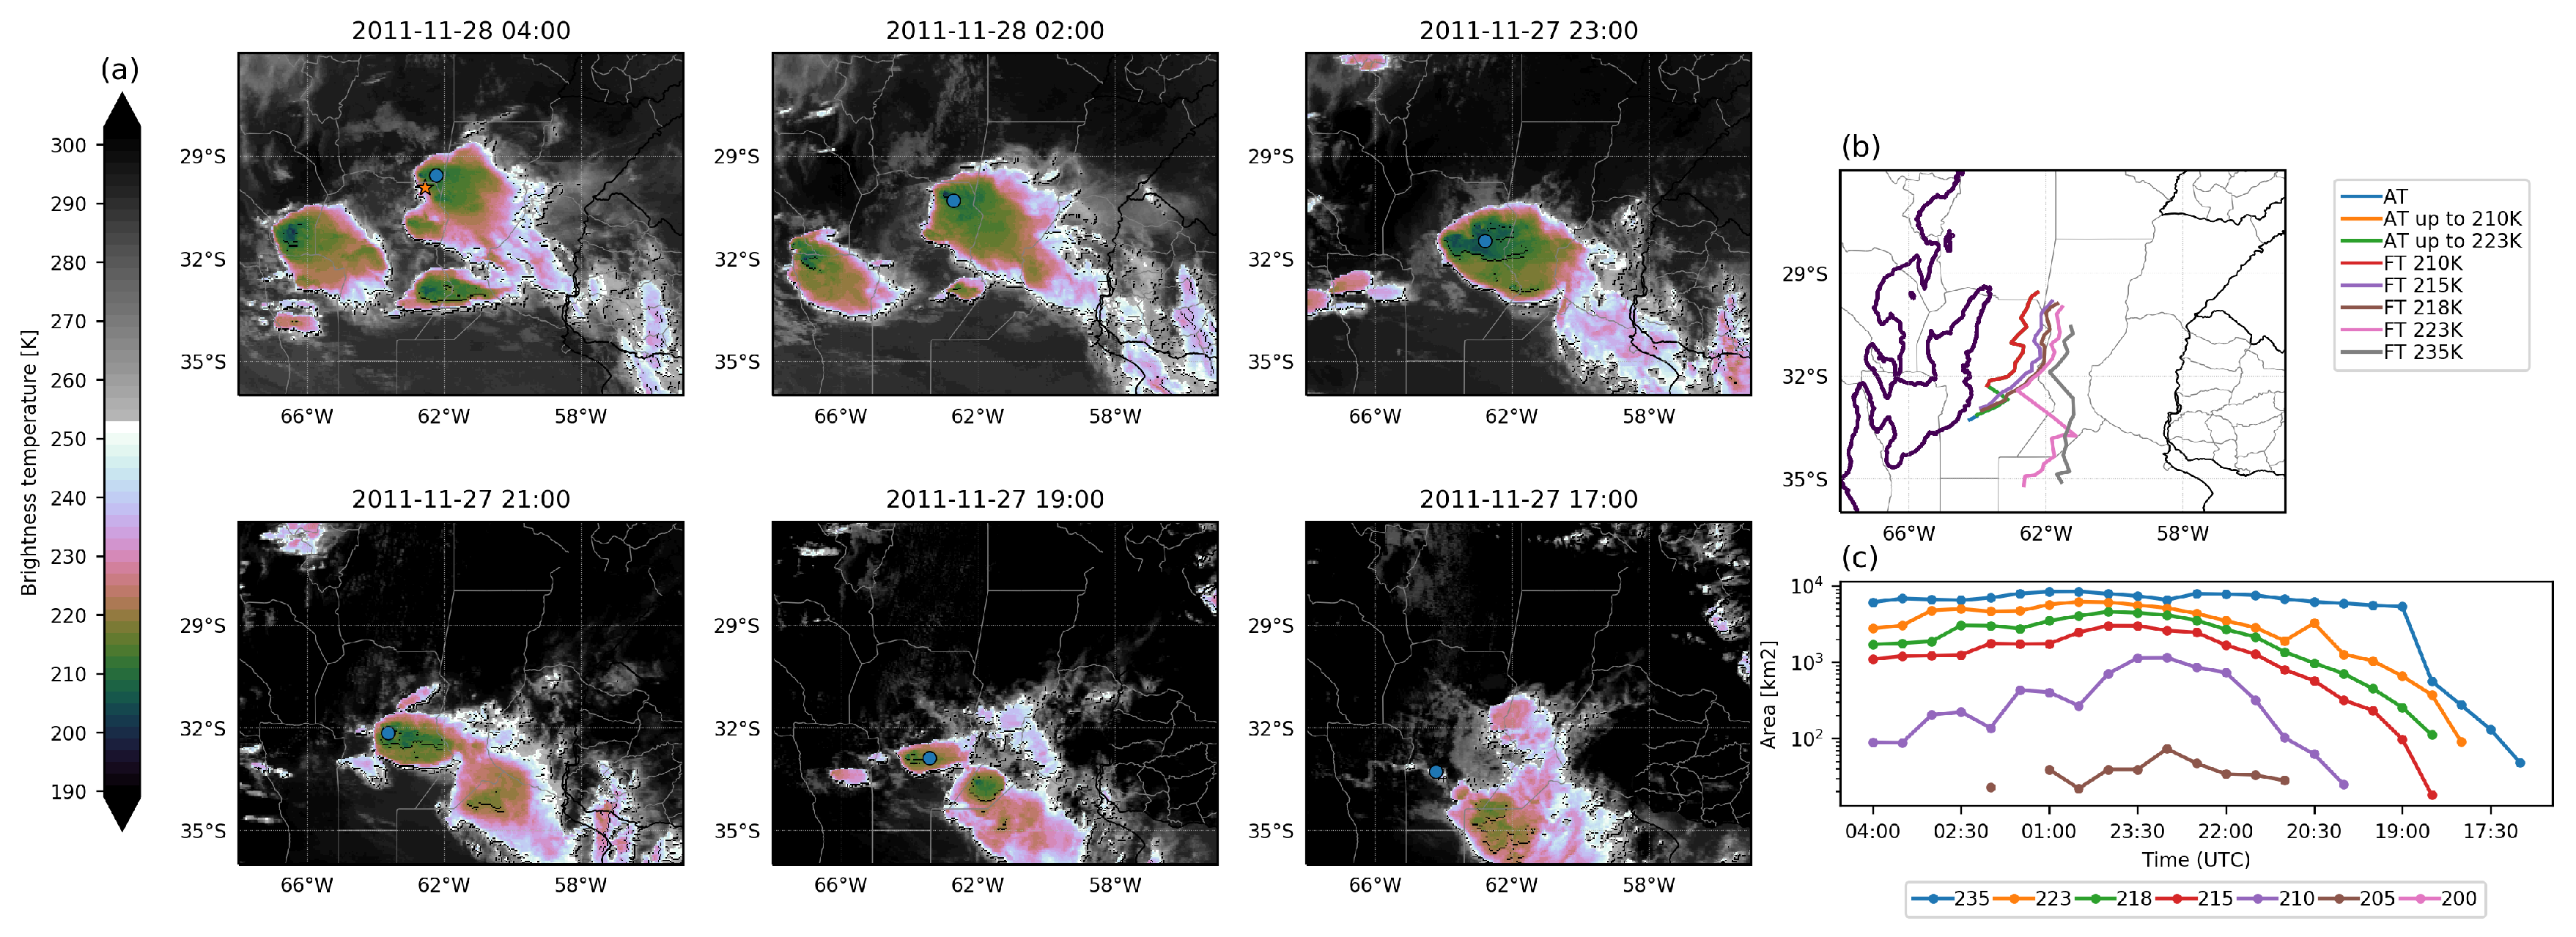
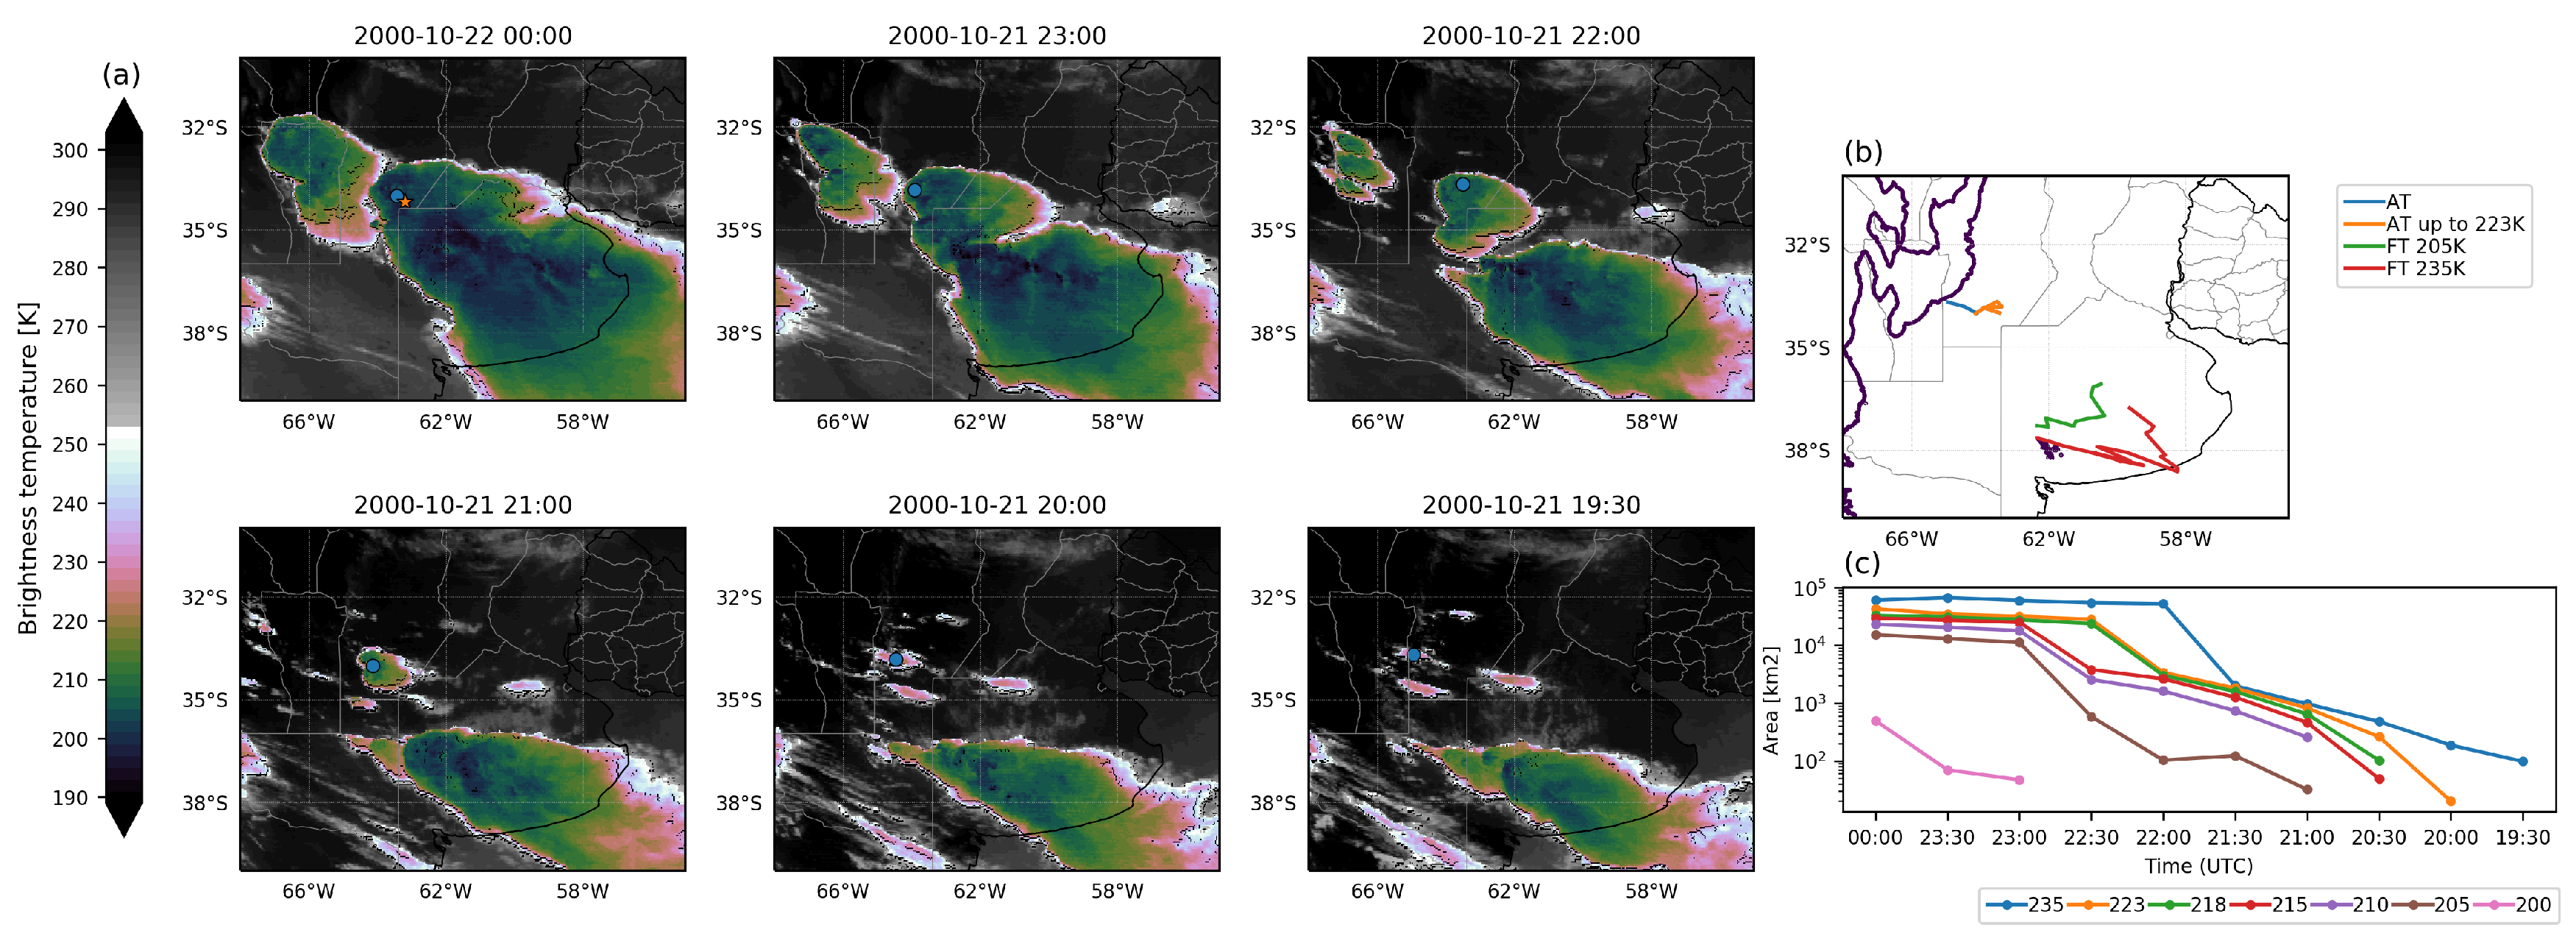
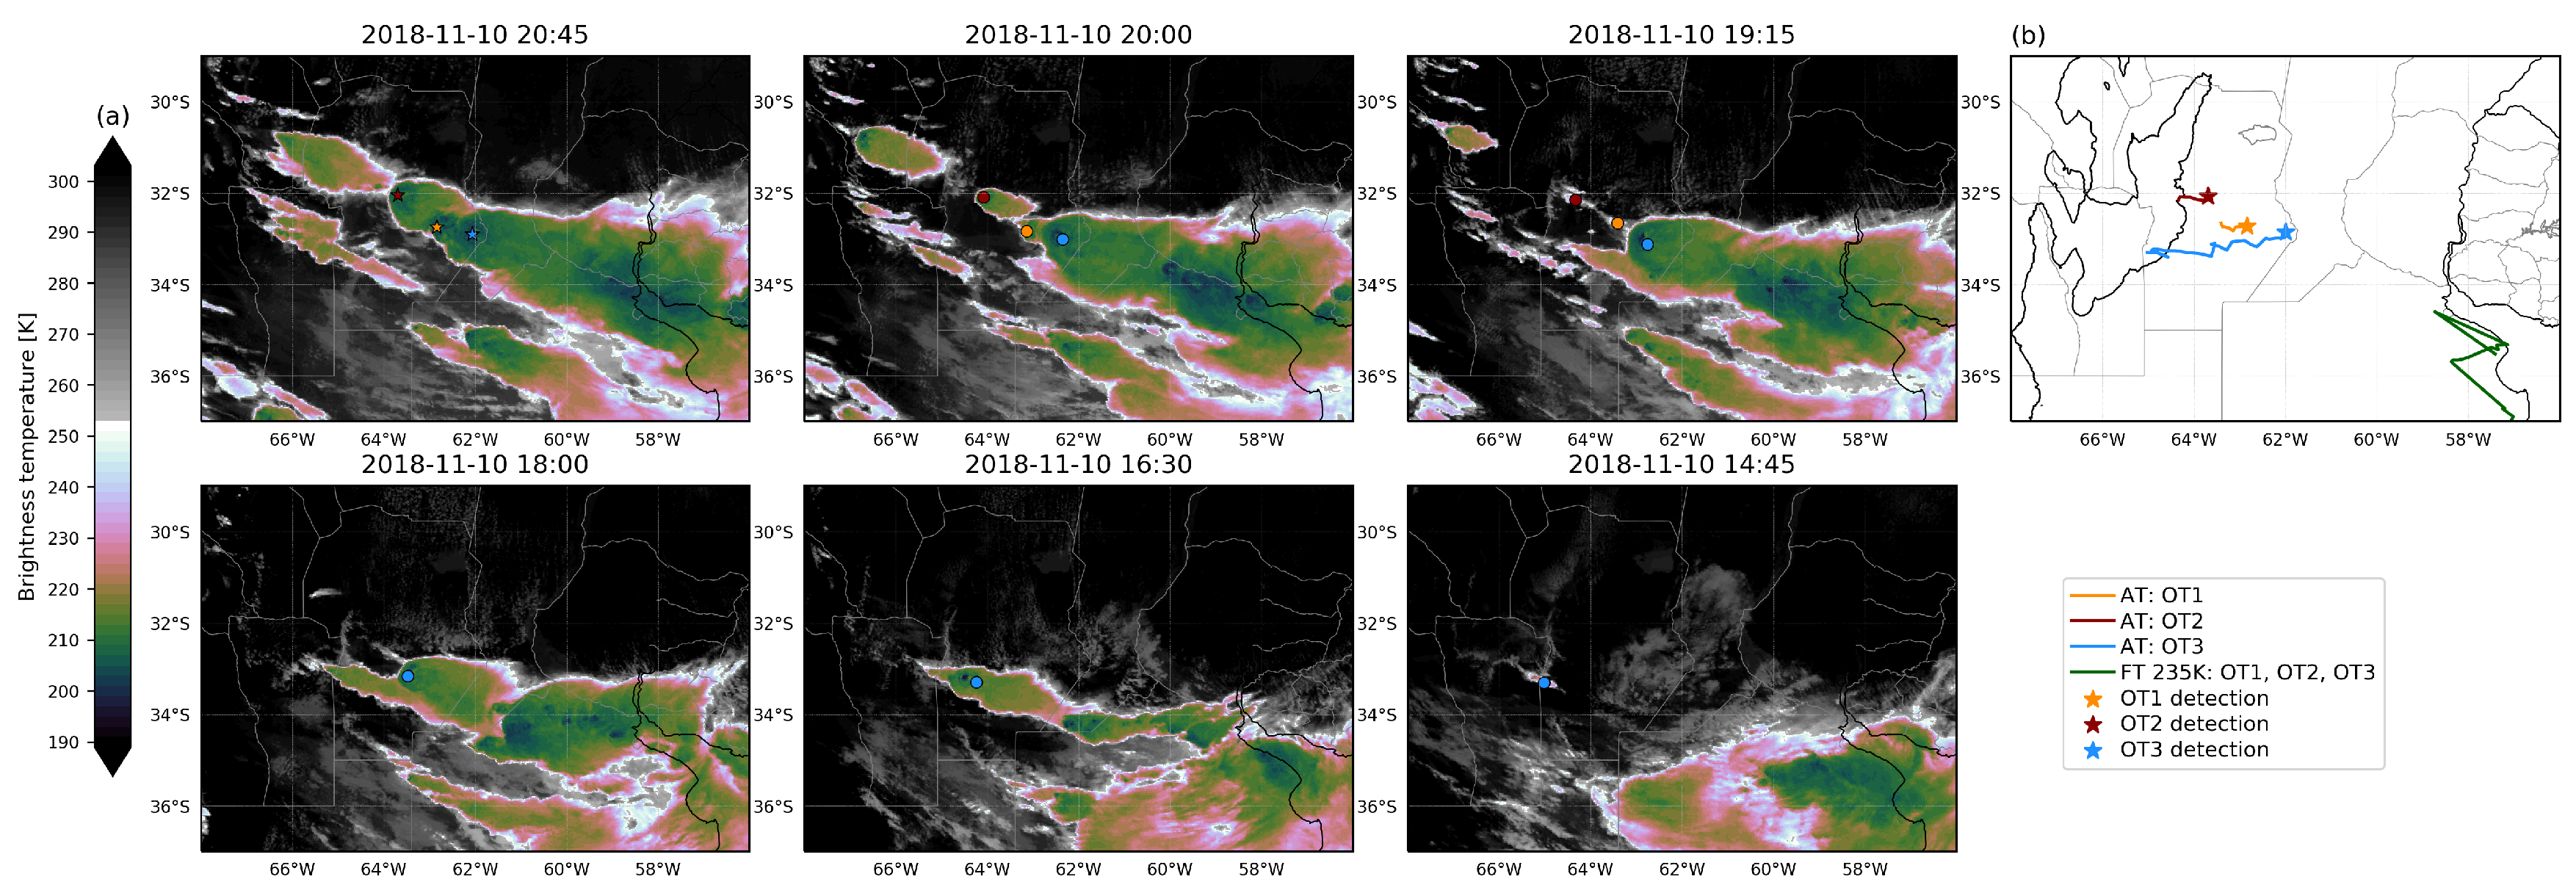
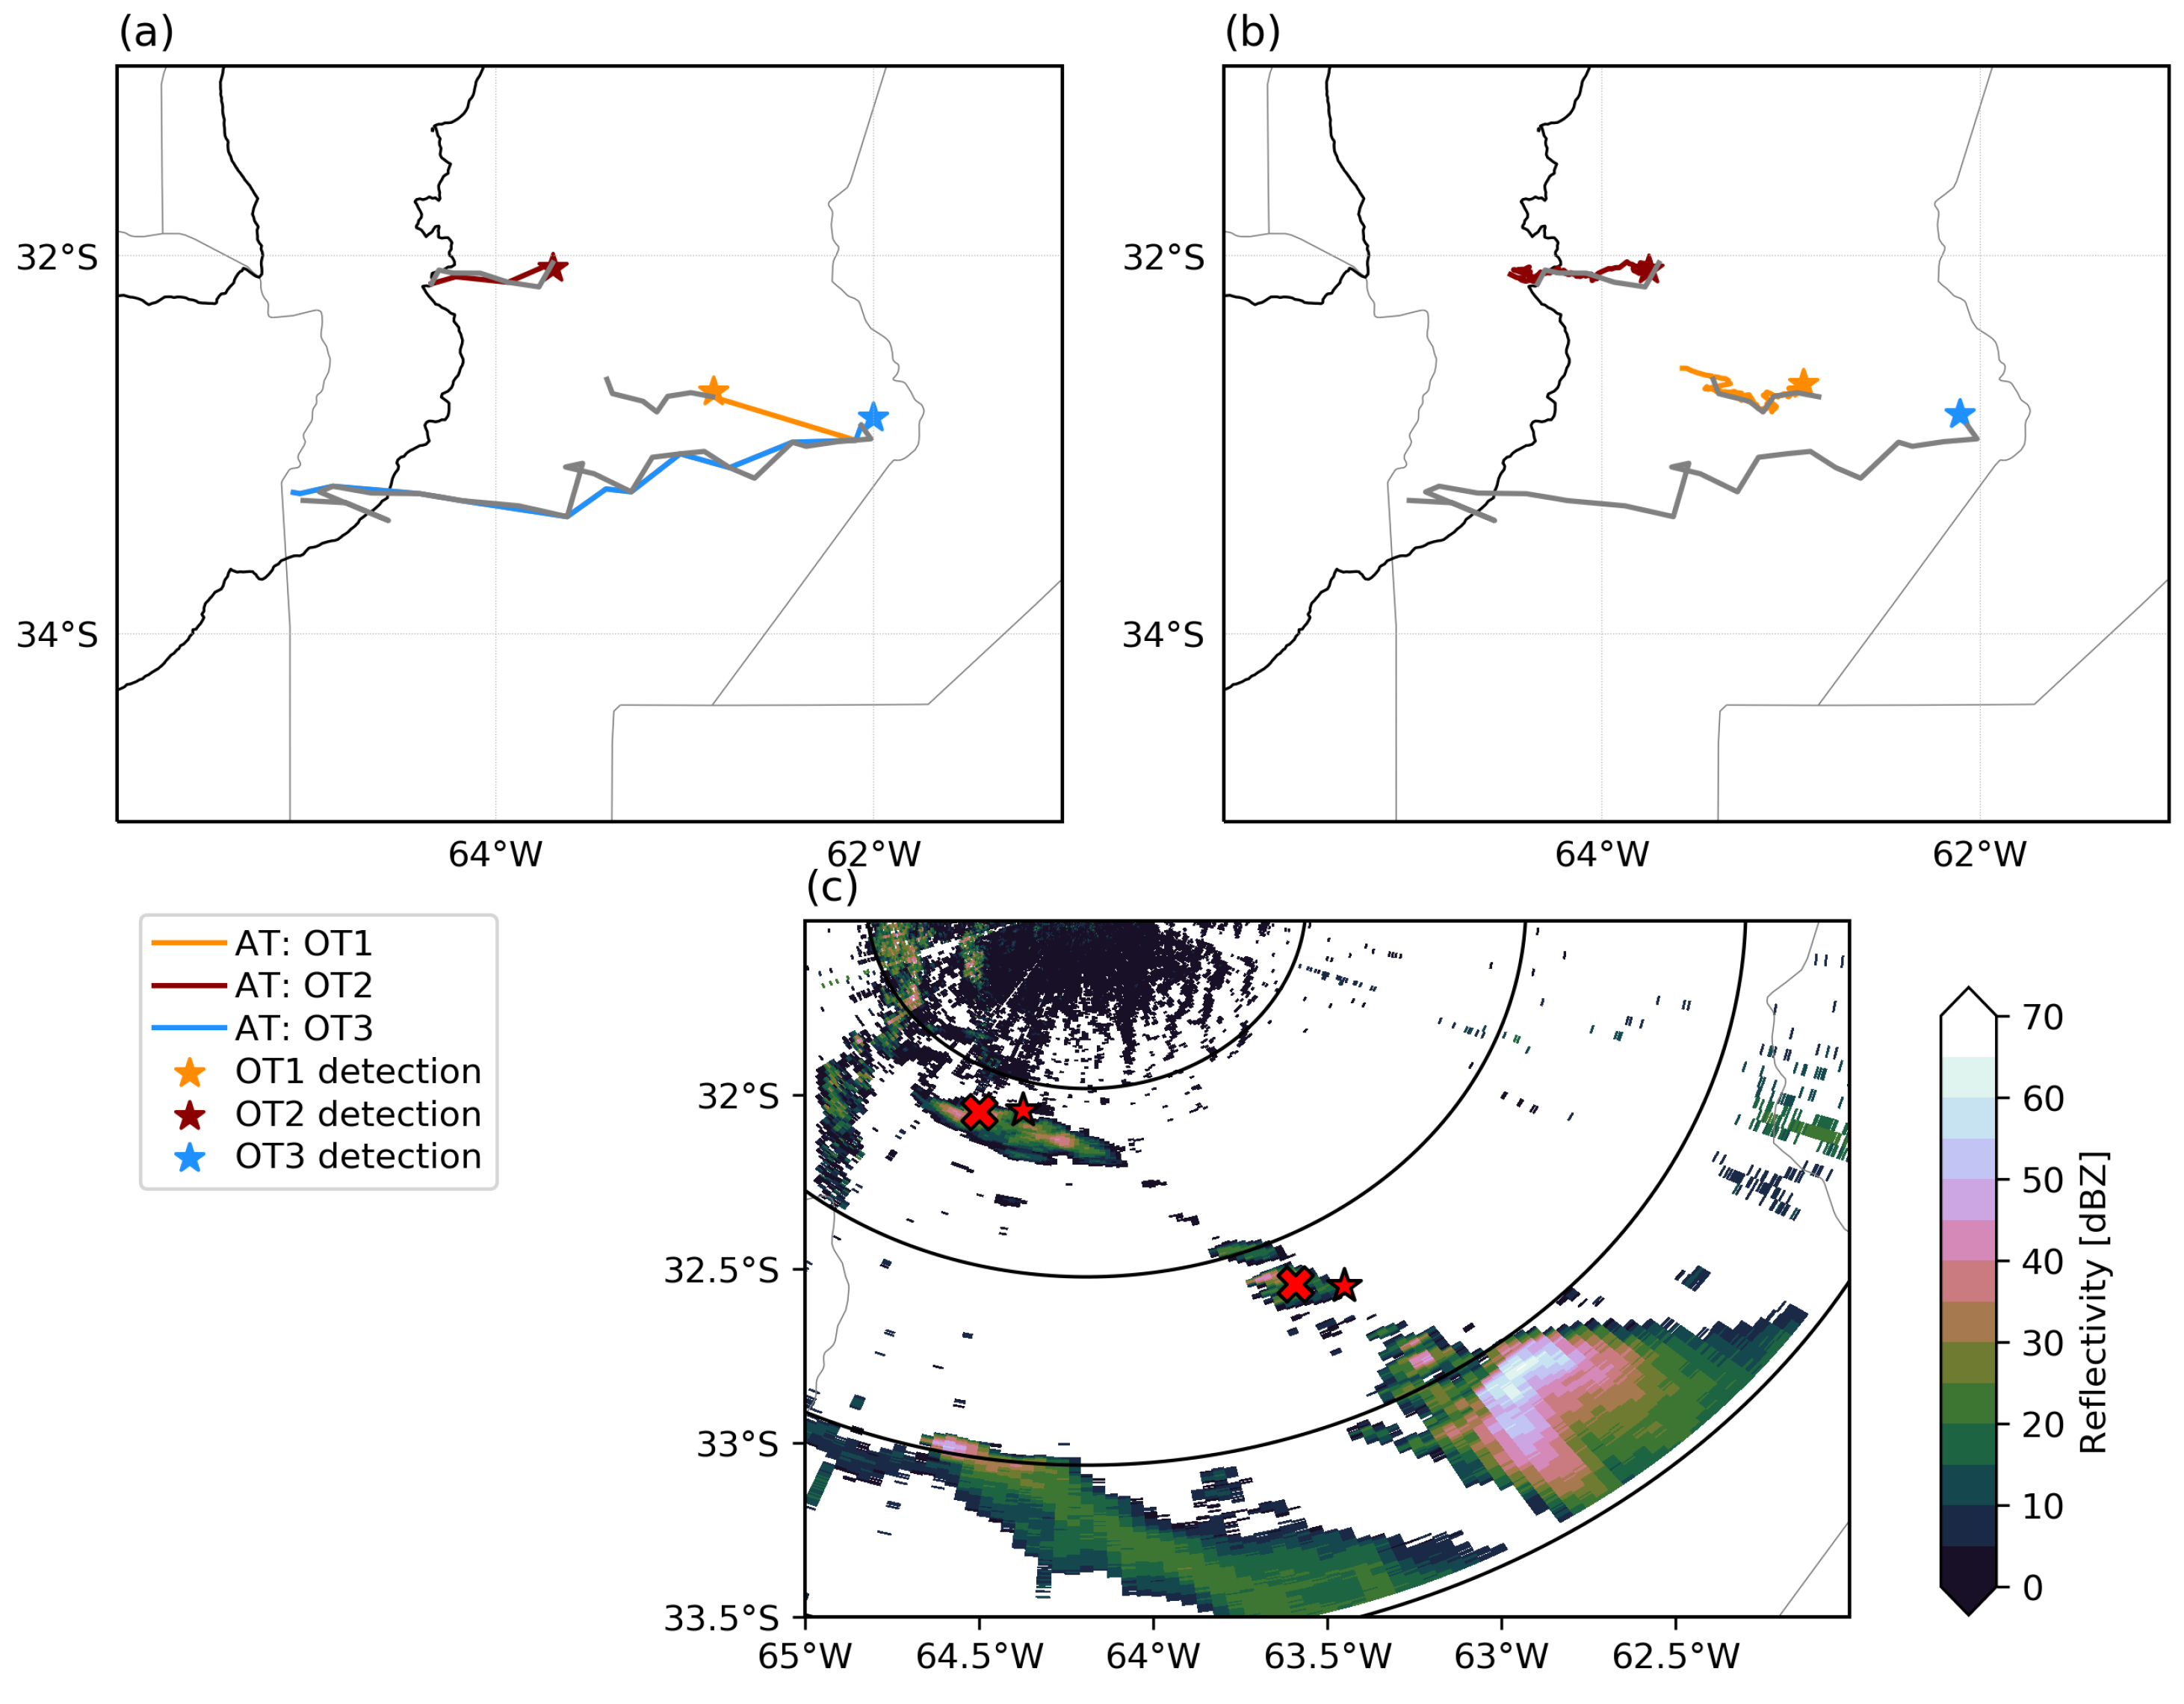
3.1. Implementation of BAB3T on ERPF Cases Studies over SESA

The determination of CI location using BAB3T is evaluated over three different ERPFs backward tracked cases over SESA: 20 October 2012, 28 November 2011 and 20 October 2000. These cases are selected illustrating different convective initiation determination problems in comparison with a fixed threshold tracking technique following 235 K TIR threshold.
The BAB3T technique applied to convective cells with OTs is also evaluated over a more recent case, 10 November 2018, in which available radar observations allow a comparison and validation of the BAB3T-determined storm initiation time and location.
20 October 2012 shows an intense storm detected by TRMM at 7:24 UTC over central Argentina, the cell can be observed from TIR in Figure 4a. Cloud tracking implementing BAB3T and a fixed threshold of 235 K were performed and are shown in Figure 4b. No difference in time or location of CI is found when comparing between the techniques. This is due to the isolated characteristics of this convective system. Since there are no other anvils merging in the area, the fixed threshold 235 K cluster adequately represents the position of the storm. It can be observed also in Figure 4c that any other fixed threshold colder than 235 K would fail to estimate the time of convective initiation.
In the next case, a deep convective system was detected in northeast Argentina at 3:50 UTC (Figure 5a) during 28 November 2011. Moving back in time, it can be observed that the cell remained isolated until 21:00 UTC and trajectories with fixed or BAB3T show no differences, beyond the ones due to the centroid location of the different temperature clusters. However, unlike the previous case, an anvil from a system that initiated on the southeast merged around 19:00 UTC generating a deviation of the tracking to that direction if a fixed 235 K threshold is chosen (Figure 5b). If BAB3T is implemented, the initial temperature is then 210 K as it can be observed in Figure 5c. At 20:00 UTC, the cluster finds no overlap on the previous time, so a 215 K threshold is chosen and the tracking continues until 18:30 UTC when again a higher temperature must be selected. Since the 215 K cluster does not merge with the system on the southeast, there is no deviation of the trajectory, allowing a correct tracking of the convective cluster. It is also evident in this case that although a colder threshold such as 210 K results in better tracking, the timing of the initiation would fail for 3 h and location for 121 km. Therefore, this case study shows that an extension of the tracking to warmer thresholds is needed.
ERPFs over SESA present a wide TIR distribution. In particular, for this dataset, more than 15% of the cases reach minimum TIR values below 200 K. Therefore, it was necessary to consider thresholds as cold as 200 K to appropriately estimate CI areas. In this case we provide an example to denote the importance of starting the tracking technique on a low threshold. On 22 October 2000, an intense MCS with TIR values below 200 K developed in east-central Argentina, while new convective cells initiated on the northern edge of the system (Figure 6). These systems merged as a cold front boundary moved to the northeast at 22:30 UTC. An ERPF is detected as deep convective system embedded in the north of the MCS at 00:11 UTC. As in the previous case, if a fixed threshold of 235 K is used, the tracking of the storm follows a trajectory to the southeast, denoting an initiation area south of 38 S, and the same behavior is observed even for thresholds up to 205 K. However, BAB3T starts the tracking with a 200 K temperature threshold and allows to successfully identify the embedded cell and estimate the correct convective initiation time and location which is 6:30 h before and 502 km to the northwest of the 235 K fixed threshold tracking estimation.
Figure 7a shows the TIR for 10 November 2018. On the first panel, corresponding to 20:45 UTC, an intense convective system is observed in central Argentina with cloud tops reaching temperatures below 200 K. The algorithm detected overshooting tops development and indicated the presence of at least three convective cores embedded within the anvil cloud (further referred as OT1, OT2 and OT3 and marked with orange, red and light blue stars respectively). While initially, the convective system shows up as one extended cloud cluster, moving back in time reveals that it is the result of cells merging that initiated at different times and locations. Furthermore, OT1 and OT3 belong to the severe storms detected with ground weather radar observations and hail size larger than 2.5 cm from photographic crowdsourced hail reports [44,45].
CI time and location, for the three storms with the later development of OTs, are estimated with BAB3T. Their trajectories are plotted in Figure 7b and it can be observed that the algorithm successfully identified the propagation of the different cells. Convective systems associated with OT1 and OT2, which became a marginal supercell, both initiated at 19:15 UTC, the first on the plains and the latter on the higher terrain. The storm that is detected as OT3 initiated at 14:45 UTC on the southern part of the high topography. As in the previously analyzed situations, a tracking using a fixed 235 K threshold is performed and this results in a unified trajectory for all three convective systems due to the anvils merging with an MCS on the southeast, not allowing for tracking of the individual cells, which were isolated supercells at early stages of their life cycle.
Ground weather radar observations are available for this period which allows a performance testing and validation of the proposed technique. Figure 8 shows a 1.5 radar reflectivity plan position indicator (PPI) from RMA1 14 min prior to the estimated time of convective initiation of the systems that produced OT1 and OT2 (left panel). No significant meteorological echo is observed near the parallax corrected locations obtained from the BAB3T. The supercell associated with OT3 can be seen on the southeast of the radar domain. However, at 19:17 UTC (right panel) the first 40 dBZ echoes are detected in this low elevation PPI scan close to both locations indicating the initiation of convective activity.

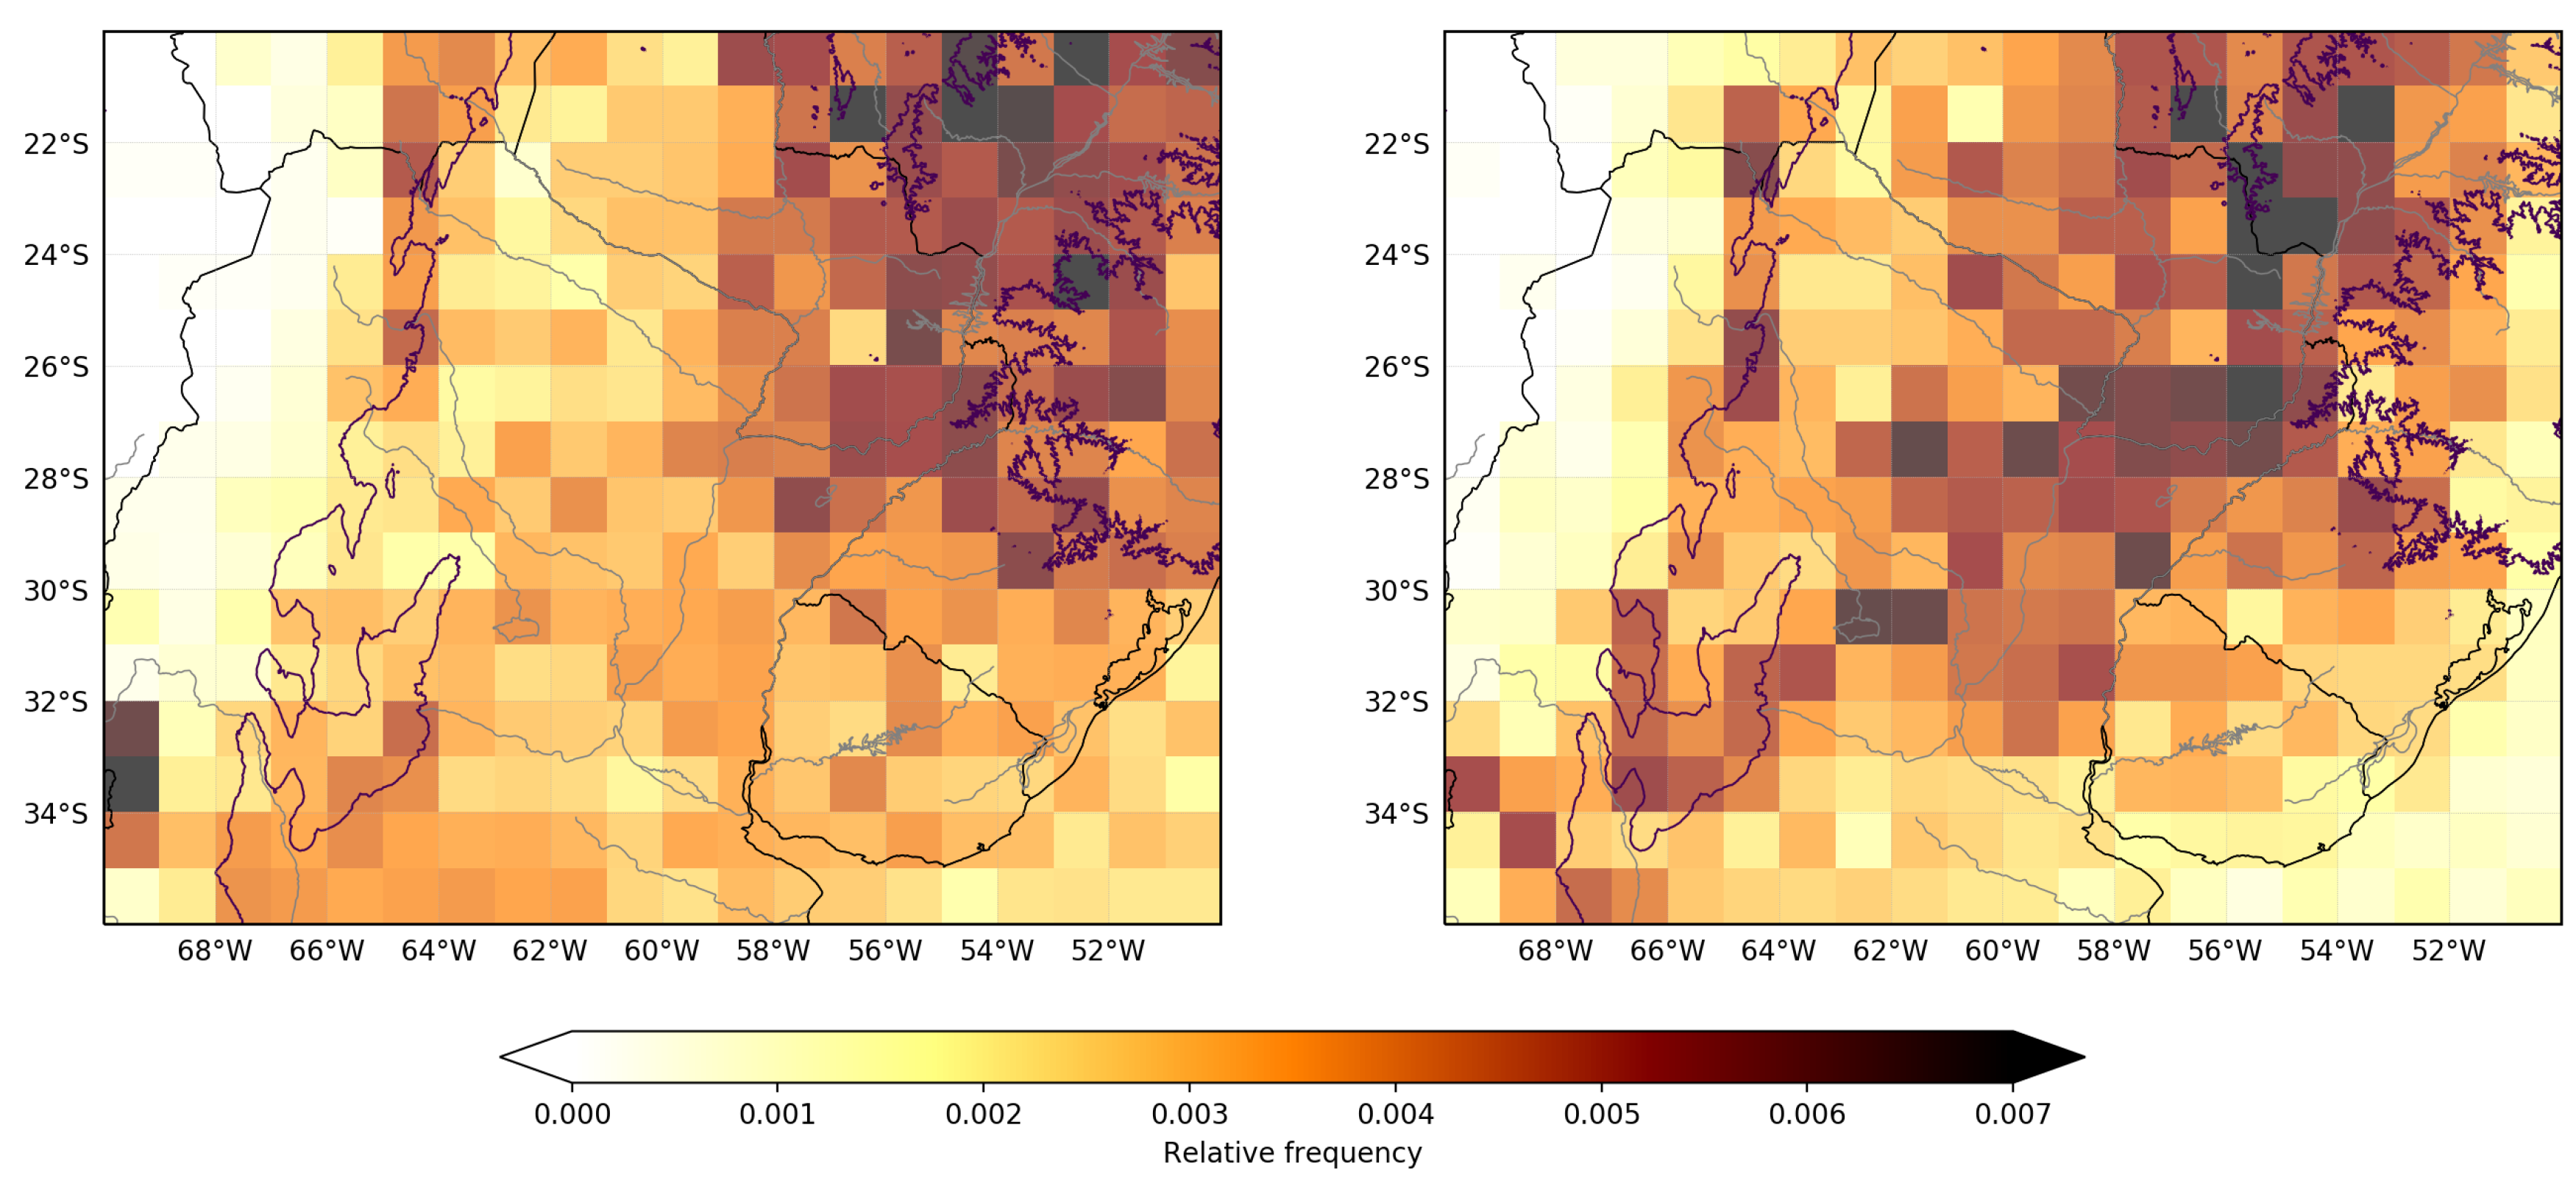
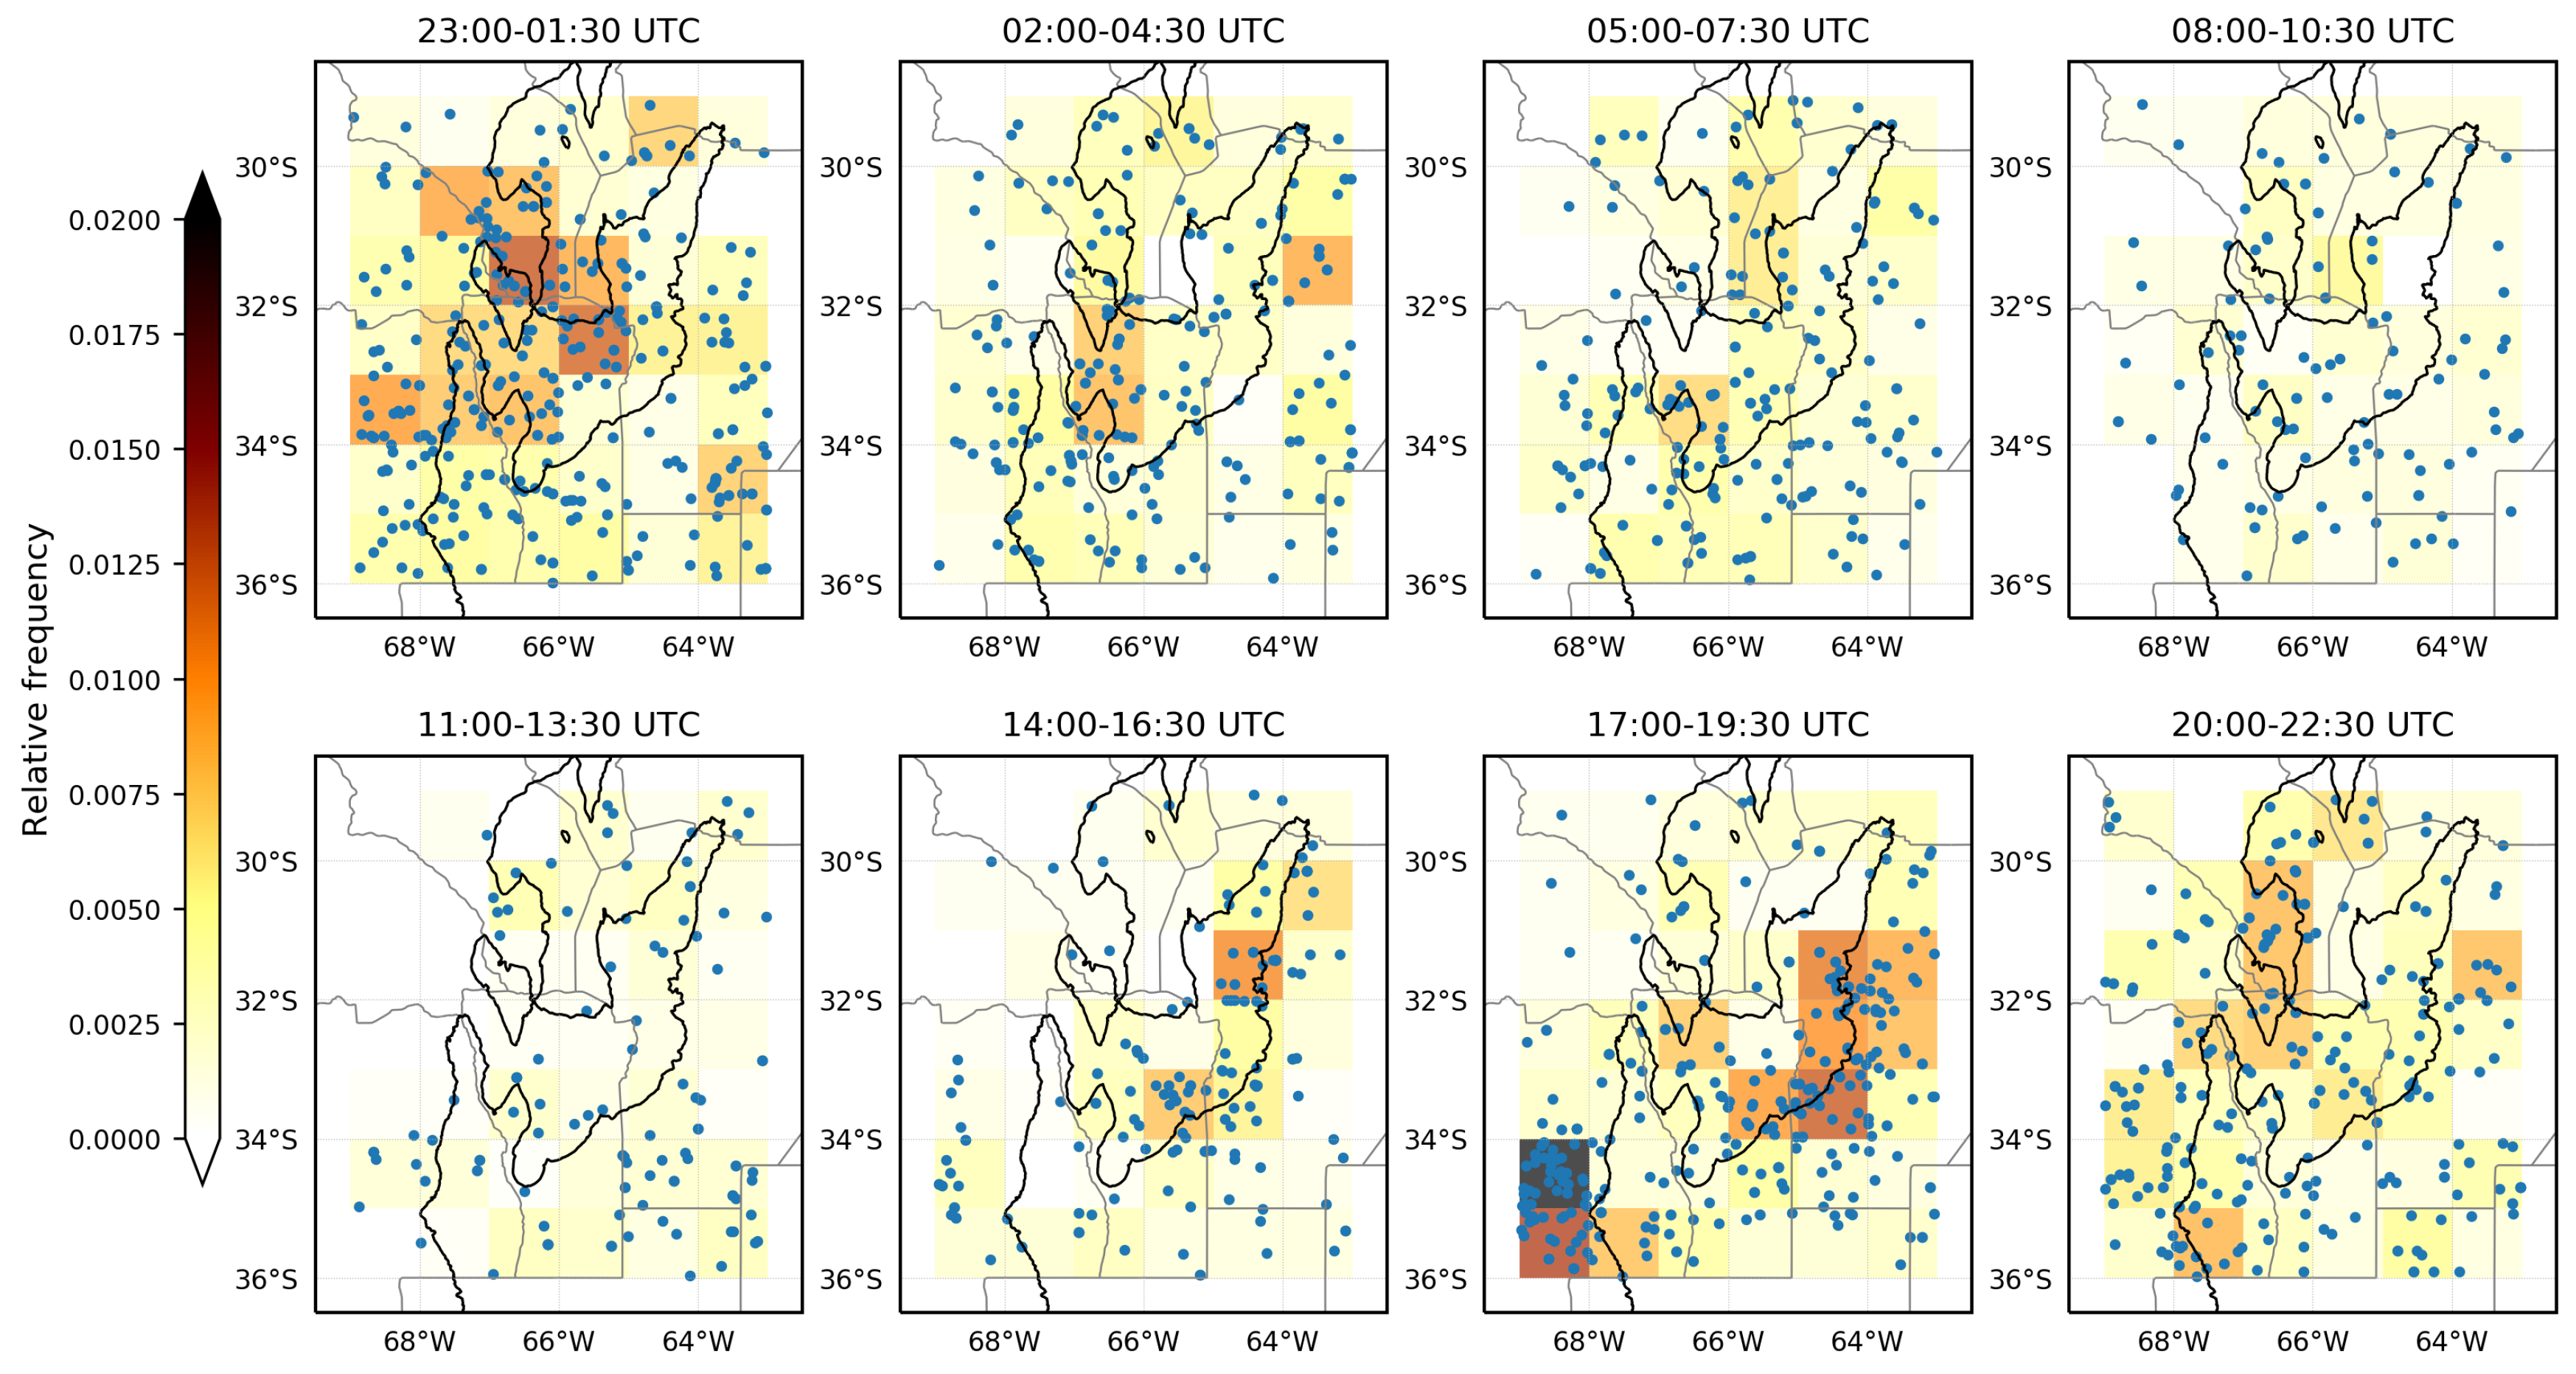
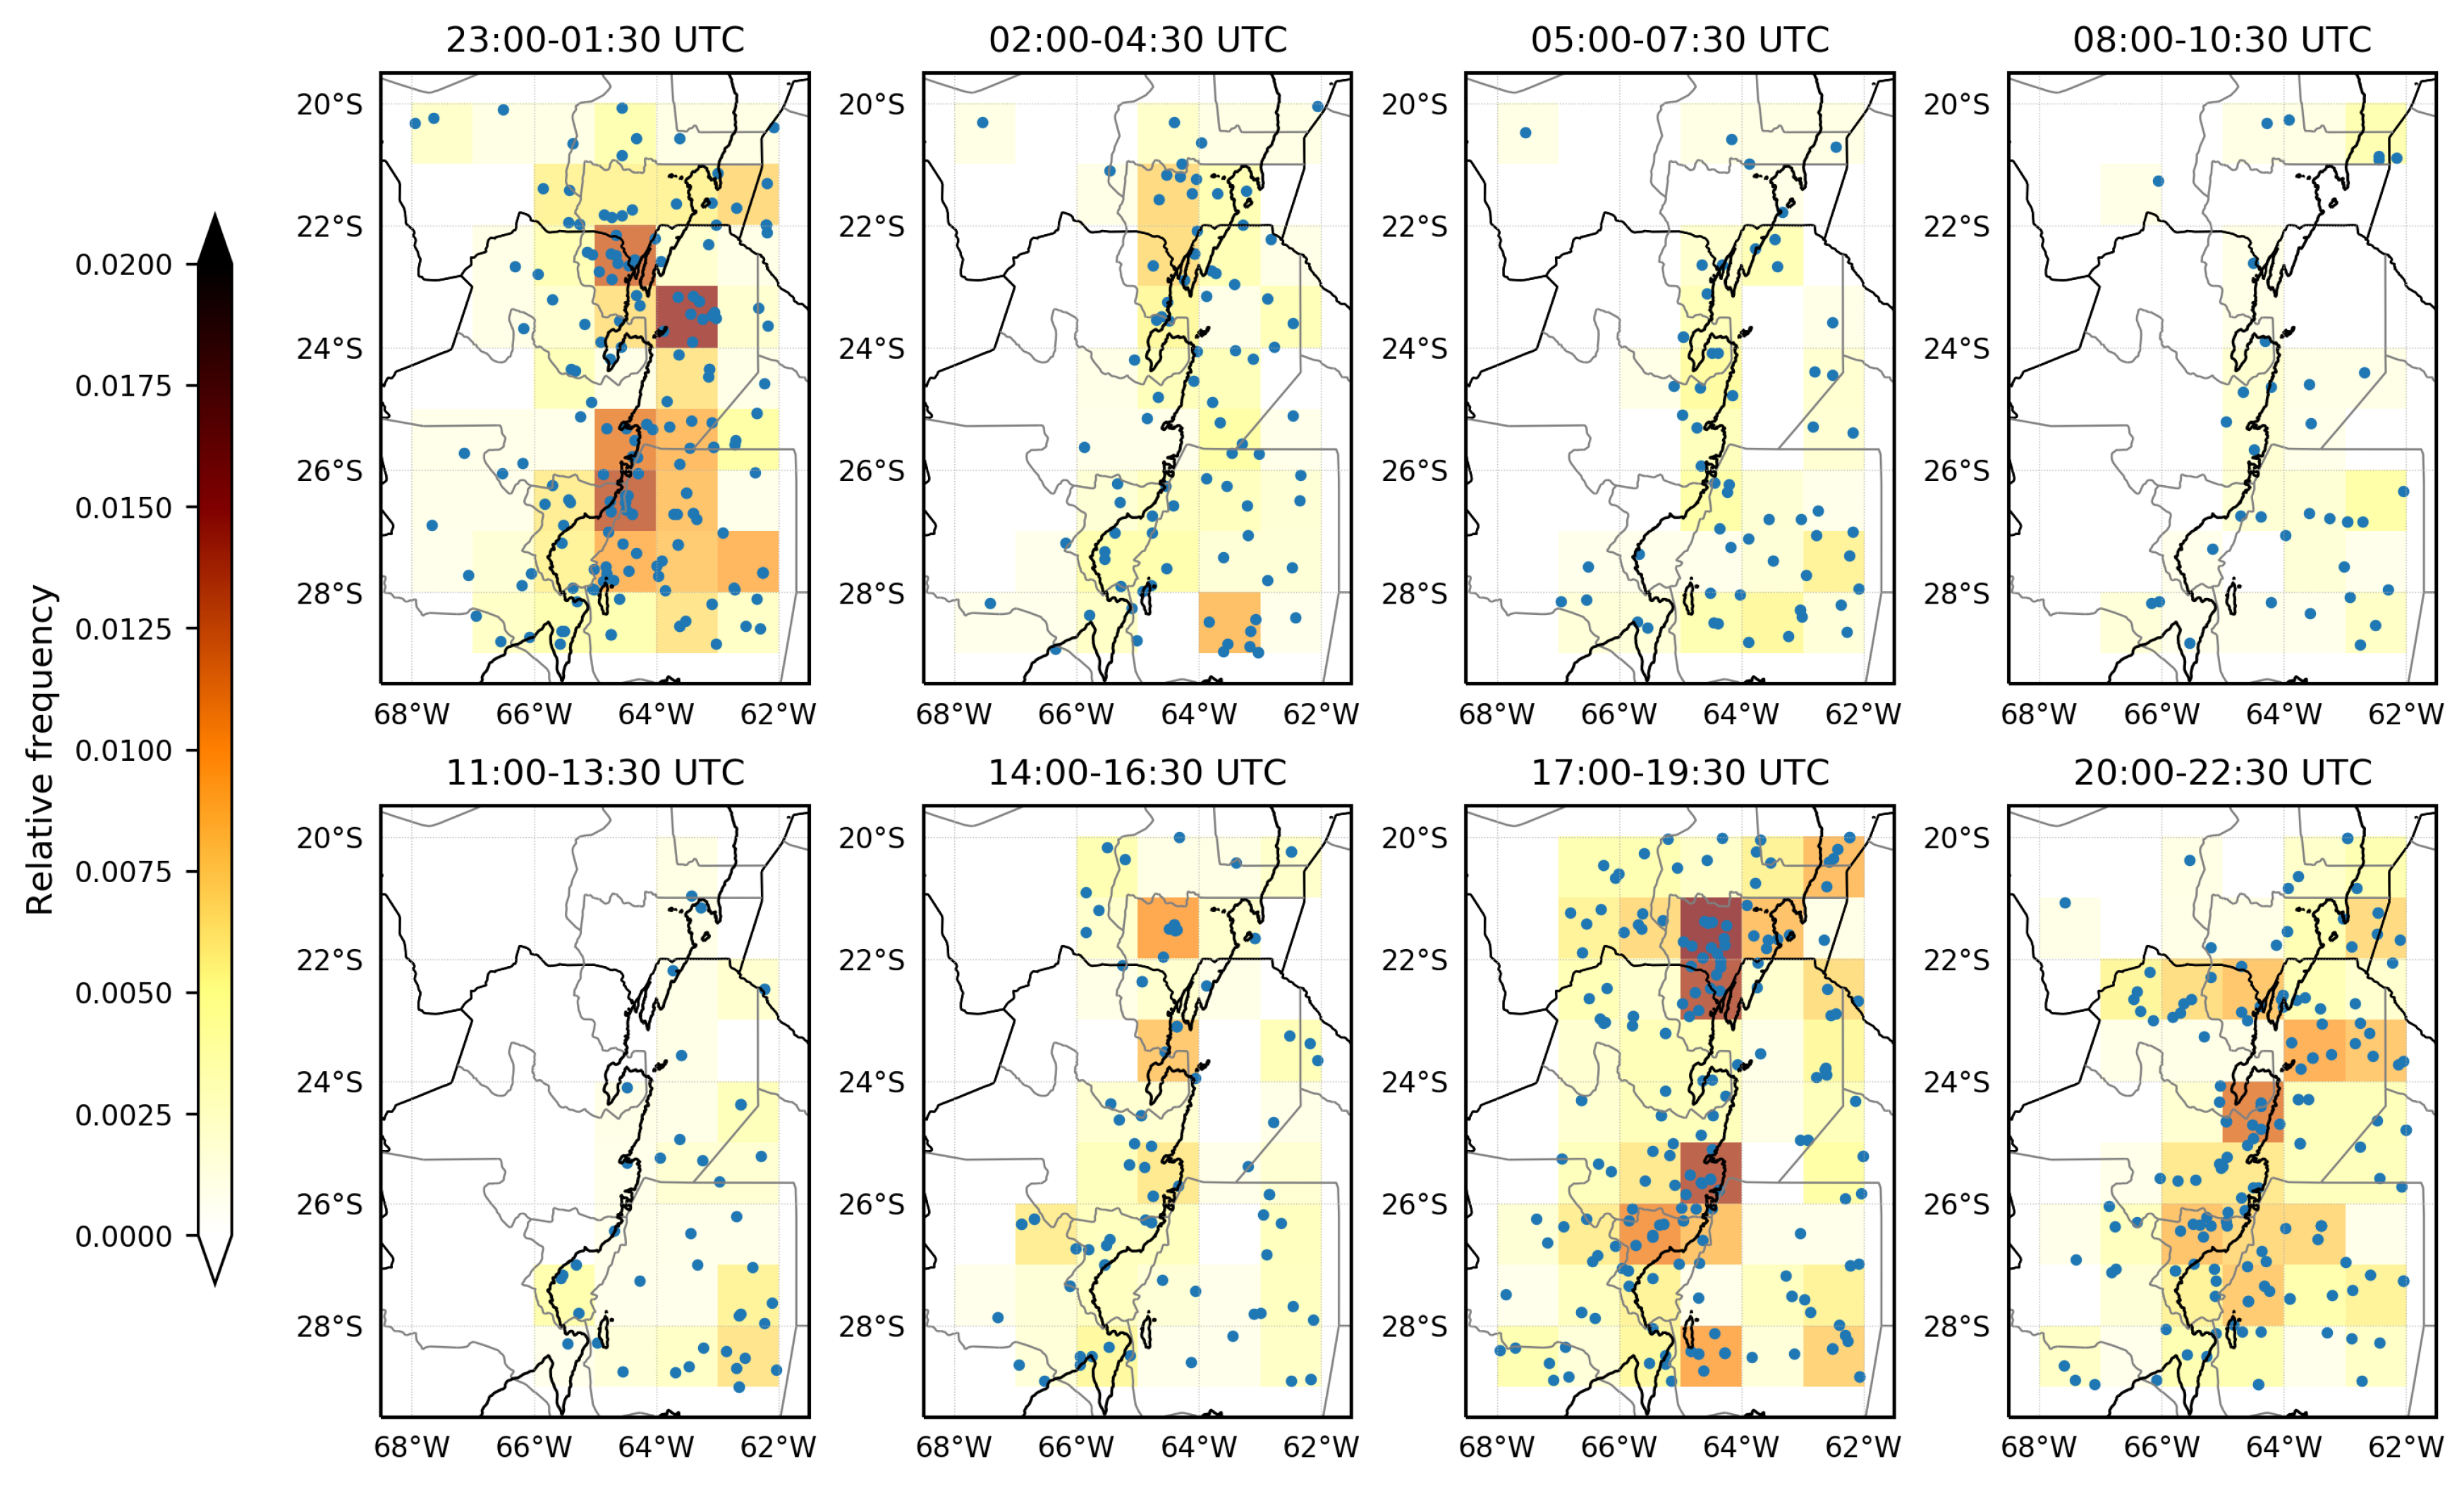
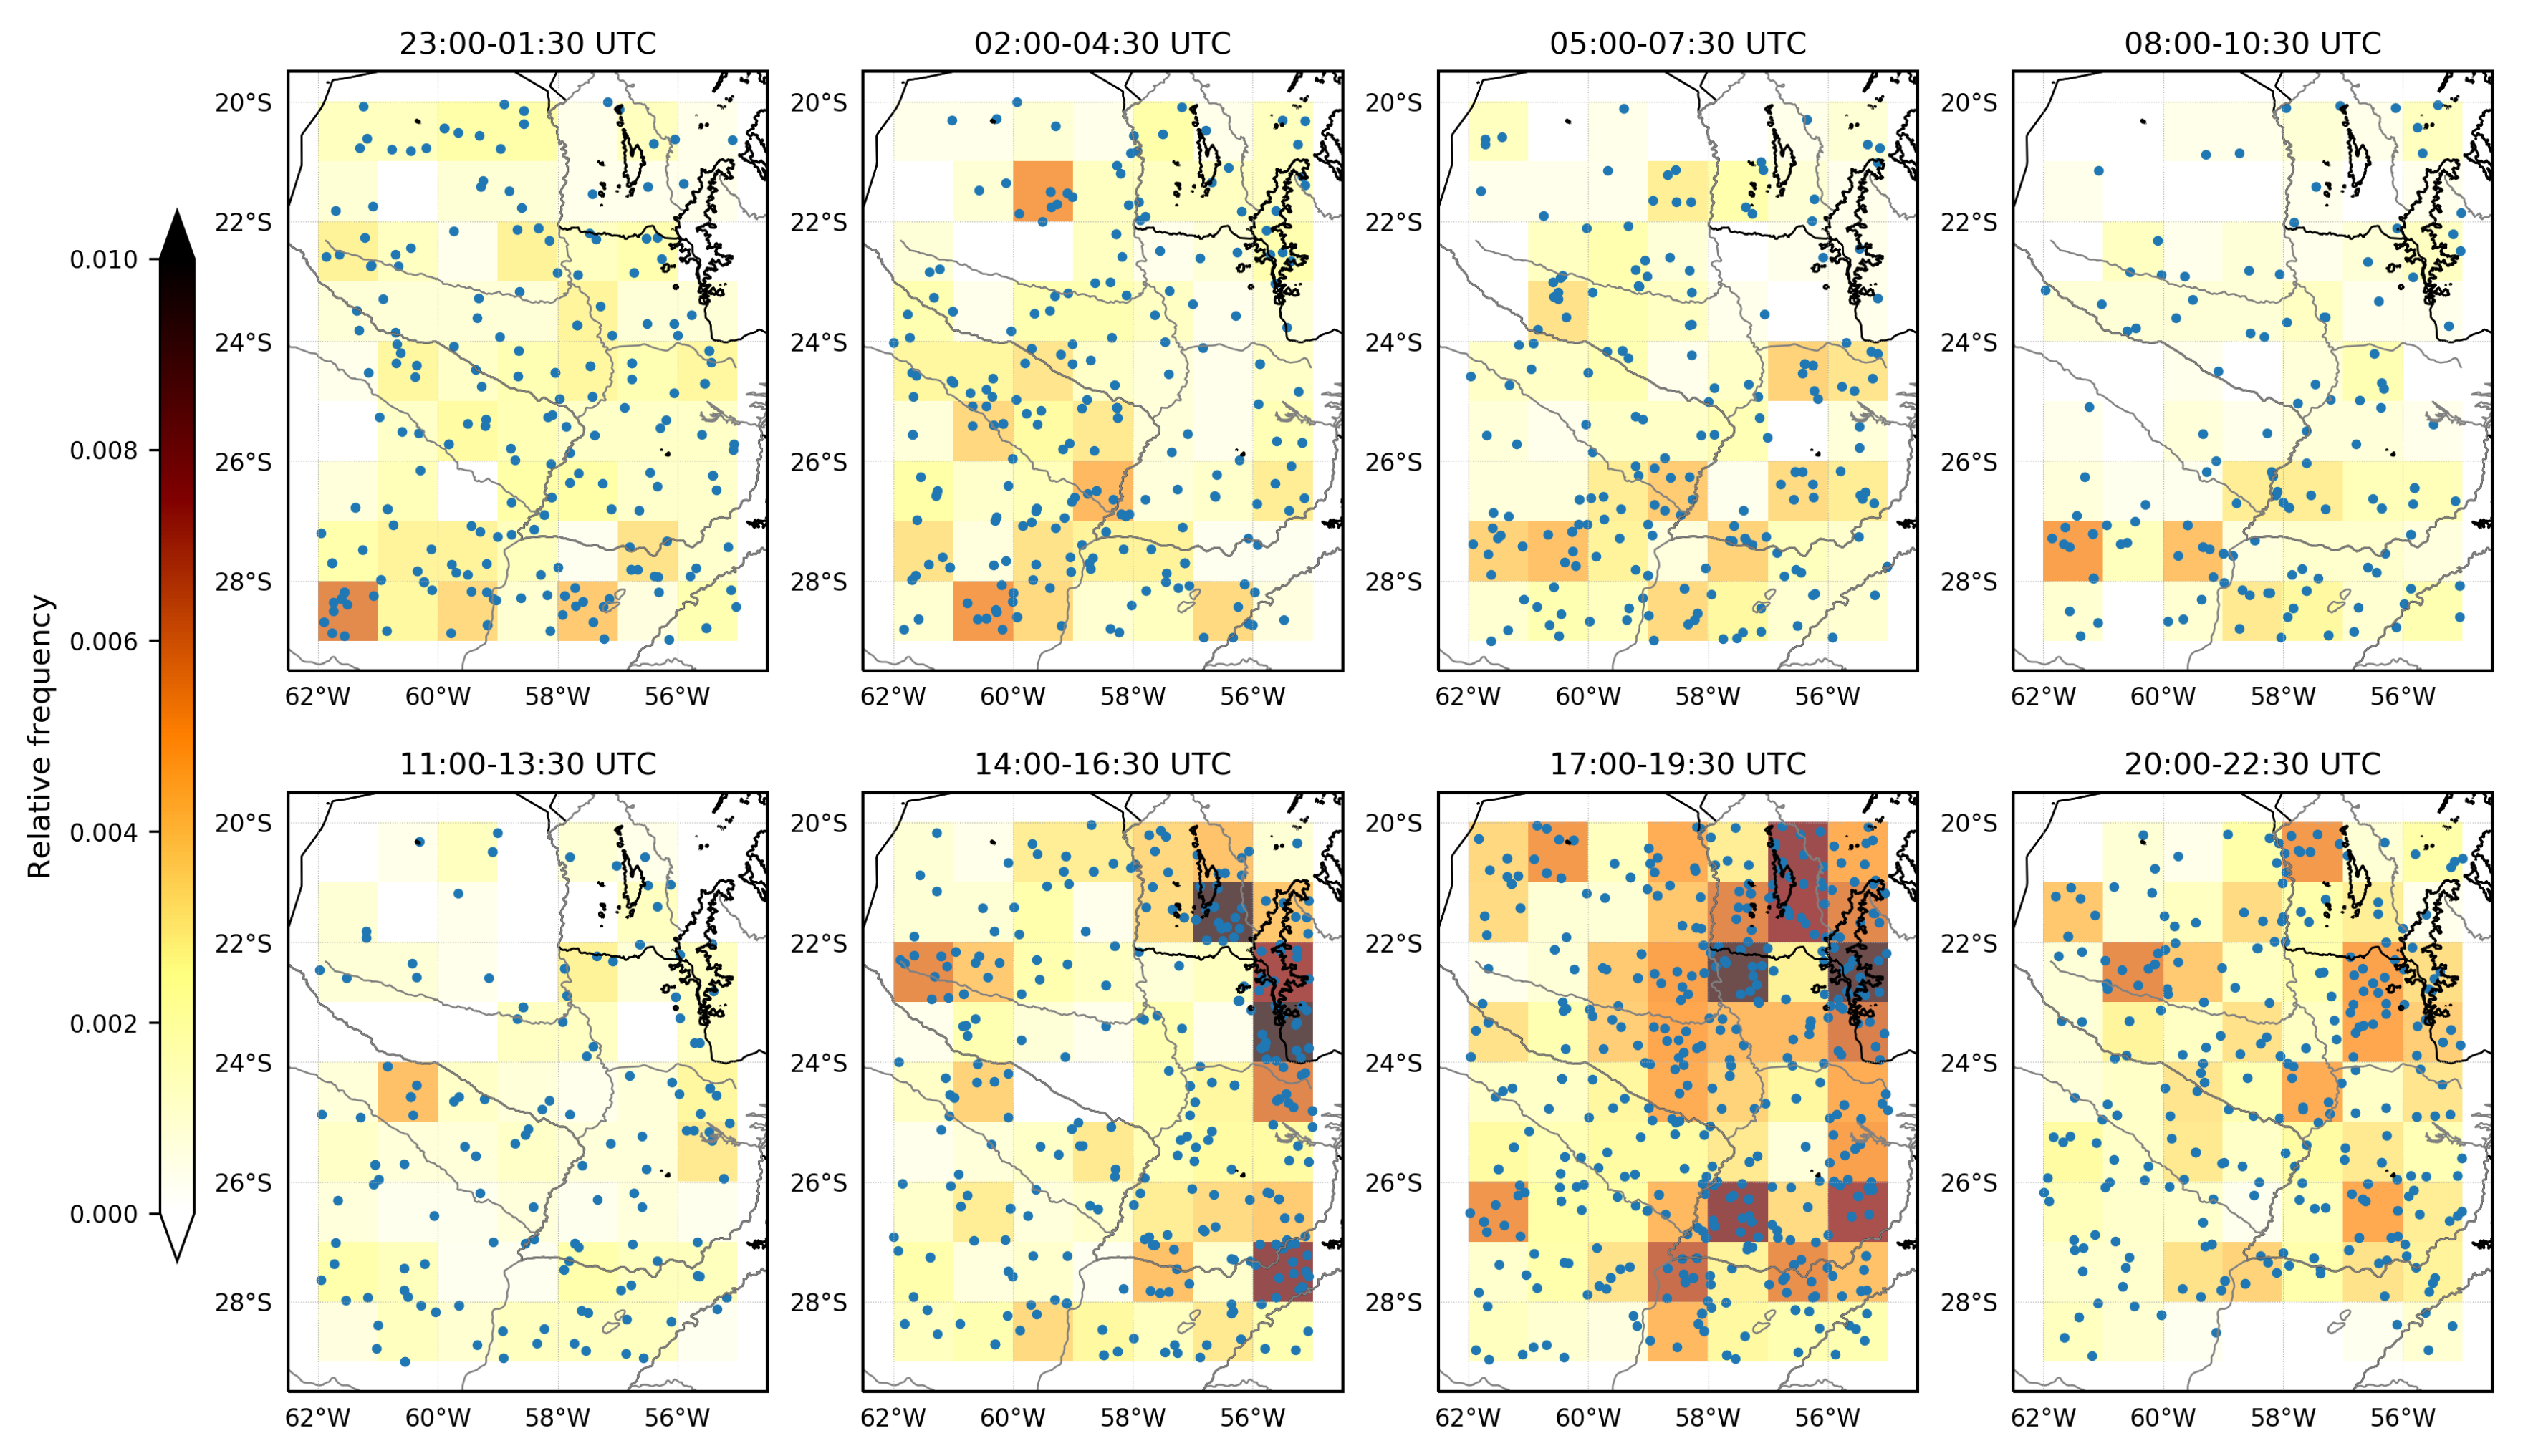
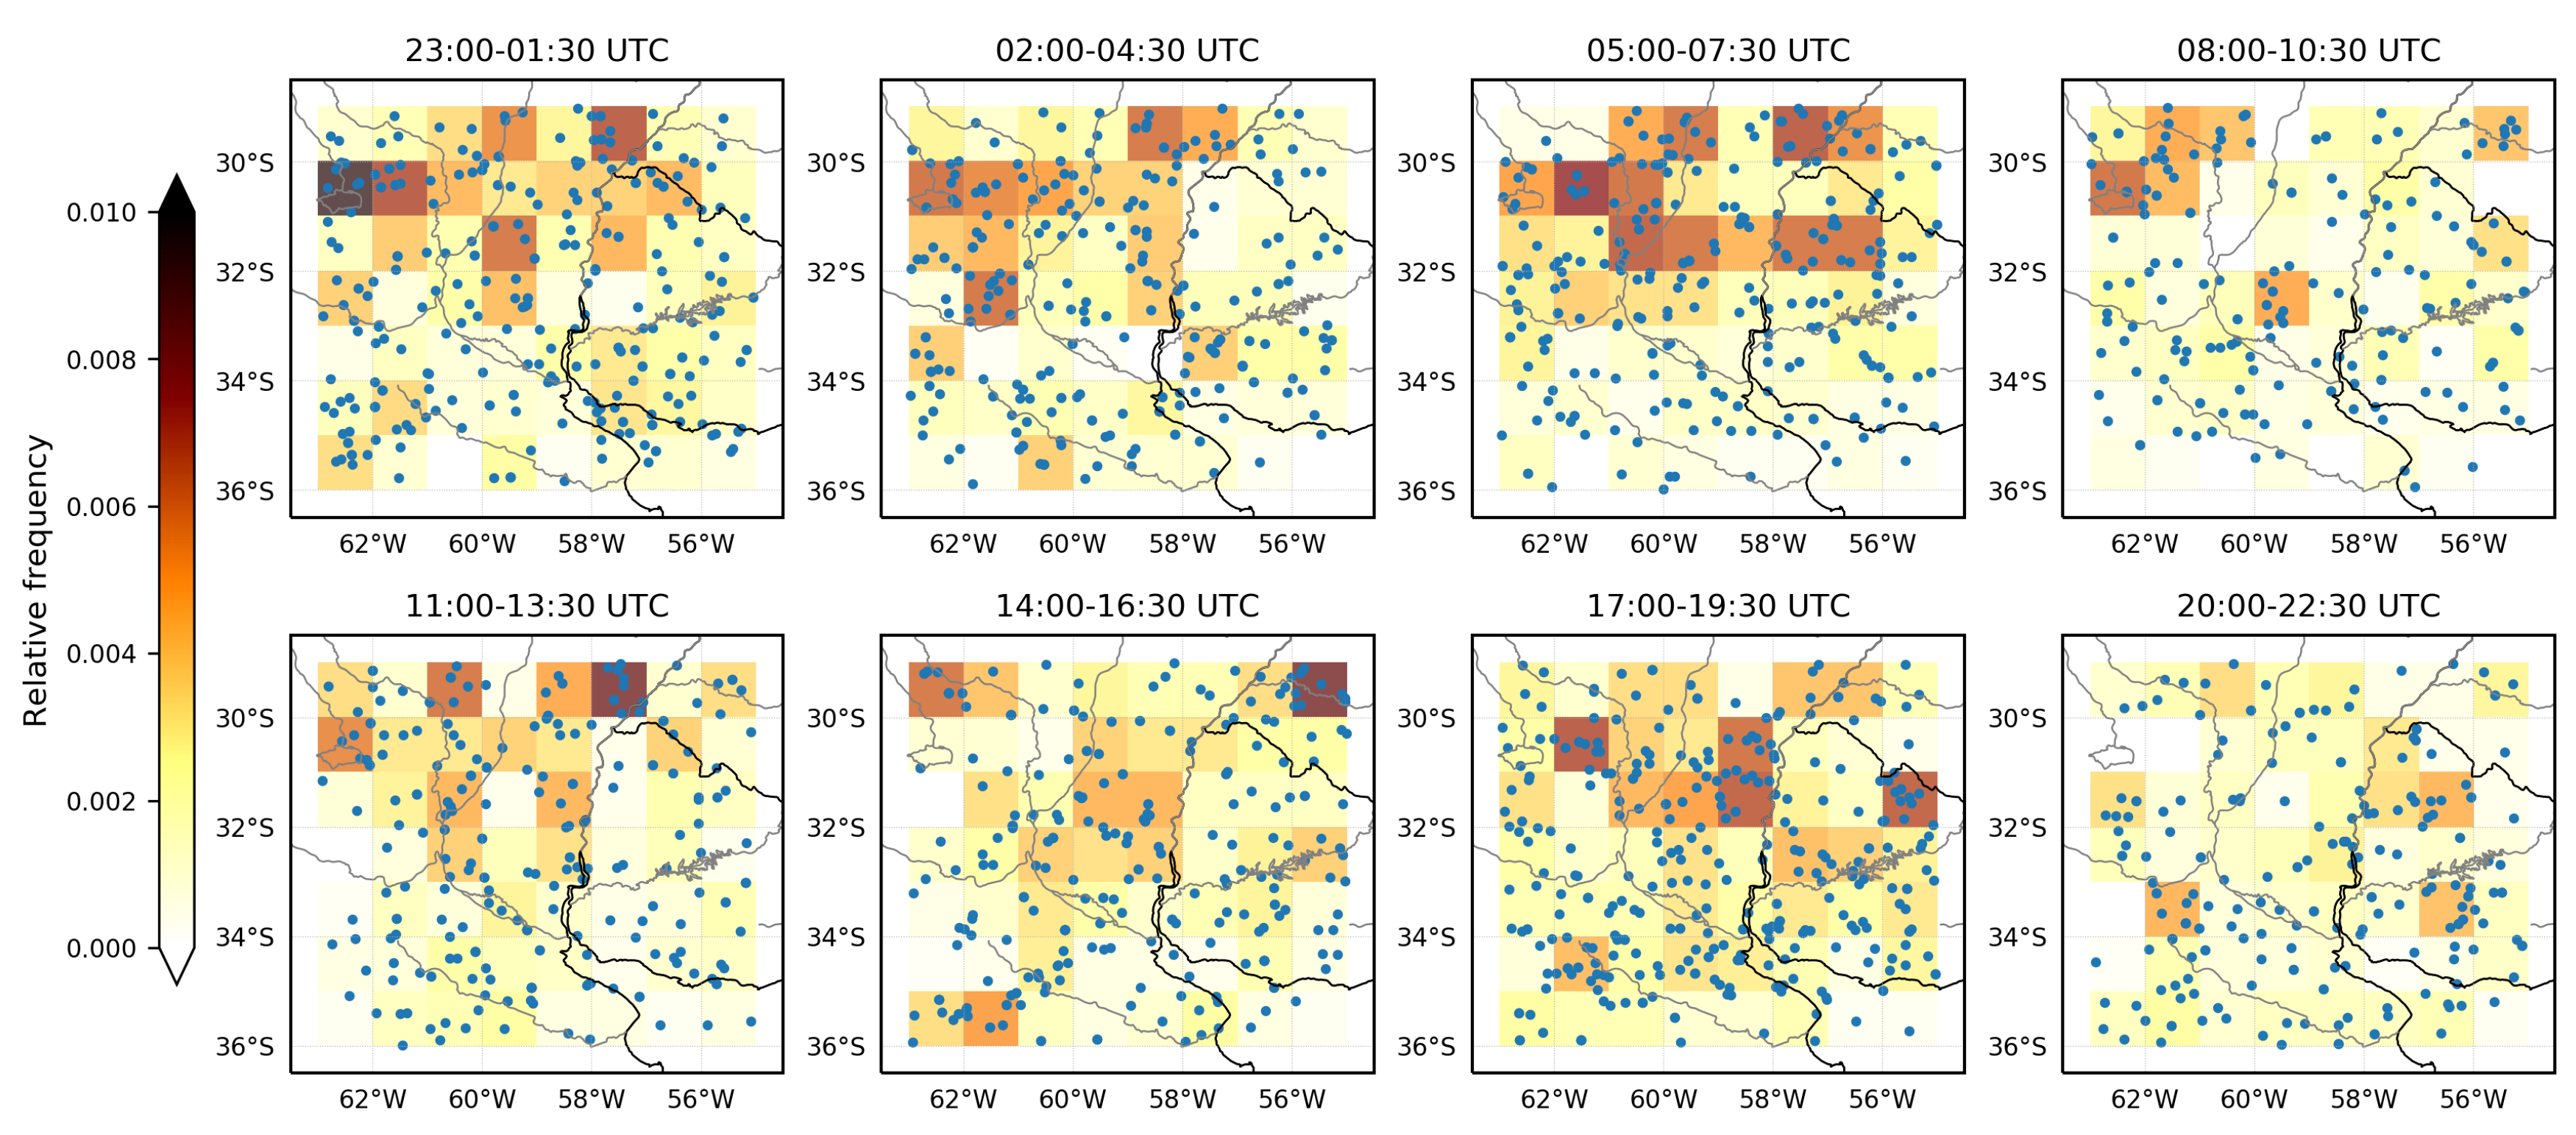
3.2. Convective Initiation Climatology

BAB3T in combination with the extensive list of 1% TRMM ERPFs extreme events makes it possible to derive a robust climatology of CI of these storms in SESA region. As mentioned above, a total of 9593 extreme convective system were tracked backward to their CI location.
Figure 9 shows the relative frequency of TRMM detection (left panel) and calculated initiation locations using BAB3T on 1 × 1 areas (right panel). TRMM sampling, which maximizes near 36 S due to the orbital recurvature at that latitude, was corrected by dividing each bin by TRMM 3A25 total pixel number. On this first simple inspection of the backtracking results, regions with differing storm life cycle behavior are easily identified considering maximum frequency locations and systems propagation. On the western part of the study region, convective systems can be closely linked to topography with maxima over the terrain. However, there are still differences between them, the ones on the northern part tend to propagate less than the ones on the south since the detection maximum location coincides with the initiation one. This suggests that the forcing and environmental conditions on convective development are different for both regions. A maximum of CI frequency can be observed in the southern part of the domain along the foothills of the Andes (from Mendoza to the south), which has been studied climatologically from ground-based radar [46] and satellite studies [5,47] for having a high frequency of convective storms. In addition, the Sierras de San Luis and Sierras de Córdoba also have a high frequency of CI. Both of these regions appear to be CI locations for ERPFs that occupy the zonal region south of 34 S, although there exists a high frequency of CI in the lower terrain east of these mountain features. Further north, CI of ERPFs is also favored in the region extending east and northeast from the northern tip of the Sierras de Córdoba extending to southern Paraguay, across northeast Argentina, and southeastward into southern Brazil and Uruguay. Northwest Argentina has a relatively lower frequency of ERPFs and CI locations, although the Andean Front does provide for a narrow zone focusing ERPF CI north of 30 S. The systems within this region have been shown to have the broadest convective cores and most intense lightning activity per storm on Earth (e.g., [7,10,48]). Note that for the analysis of ERPFs within the analysis domain, their CI locations naturally diminish in probability near the east edge of the region due to the mean northeastward system propagation vector (e.g., [49]).
To further examine regional differences, four subregions are defined inside SESA (Figure 10a): northwestern Argentina (NOA), western central Argentina (WCA) and, considering the large latitudinal extension of the plains, eastern central Argentina and Uruguay (PS) and northeastern Argentina and Paraguay (PN).
An analysis of the monthly CI frequencies for these regions also show four distinct behaviors (Figure 10b). Regions associated with topography (NOA, WCA) show a strong annual cycle with a maximum in the warm season (DJF) and almost no convection initiation in the cool season from May to August. While WCA maximum convective activity begins in November and extends up to January, NOA shows a shift to the summer months with the maximum between December and February. A very different pattern is found for the plains regions (PN and PS) with a weaker annual cycle, especially in the south where convective activity is almost constant throughout the year.
Furthermore, the diurnal cycle of events for the regions analyzed (Figure 10c) shows some distinctive modes of convective lifecycle. First, each of the four regions have an absolute (NOA, PS and PN) or relative (WCA) maximum between 17:00 and 19:00 UTC (14:00–16:00 local time), which coincides with the time of the typical maximum in near-surface temperature and conditional instability, revealing the strong control of thermodynamic diurnal forcing on CI. Additionally, near principal mountain barriers a bimodal distribution is found with a second maximum between 23:00 UTC and 01:00 UTC (20:00 to 23:00 local time) that it is not present on the plains, highlighting the possible existence of a different late day forcing mechanism for CI interacting with topography; an overnight maximum in lightning activity was found in west-central Argentina by Rasmussen et al. [5]. This analysis shows that this secondary evening maximum is at least partially due to the initiation of new convective storms in this time frame, although the mechanisms for CI during this time frame remain a topic for future study. In the PS region, besides an afternoon maximum, the distribution is almost homogeneous during the day. On the northern area, a rather constant frequency is observed during the night and early morning hours with a minimum near and a few hours after sunrise.
Finally, a closer look into the relationship between spatial frequency distribution and diurnal cycle is performed. For this analysis, frequencies have been normalized by the CI sample size in each region. For WCA region (Figure 11), it can be observed that the locations of the two afternoon and evening maxima, that were seen in Figure 10, are clearly different. While in the afternoon (17:00–19:30 UTC) one takes place on the east side of Sierras de Córdoba and San Luis and in a narrow region of the Andes between 34S and 36S and 69W, the evening CI maximum is located on the valley between the Sierras de Córdoba and the Andes. Note that the CI locations determined with BAB3T and the ground-based weather radar observed initiation regions by Mulholland et al. [6] are in good qualitative agreement in terms of both spatial distribution and diurnal cycle over the radar range, which gives confidence that the BAB3T automated technique is robust for determining CI.
A different diurnal cycle position is visible in the case of NOA region (Figure 12). During the local afternoon (17:00–19:30 UTC), convective initiation is taking place on the slope of the topography, but it has a shift to the plains during the evening hours. A remarkably thin zone near the Andean Front between 25–27 S and 64–65 W with a high frequency that remains nearly constant between the afternoon and late night (17:00–01:30 UTC) indicating a favorable region for CI.
Focusing now on the plains regions (Figure 13 and Figure 14), as seen in Figure 10, the hourly distribution is rather homogeneous, except for a maximum between 17:00 UTC and 19:00 UTC. The spatial distribution in both plains regions does not show as clear of a pattern as in the regions with terrain. However, there are some noteworthy features that can be observed. In the PN region, an interaction with the terrain (Sierras de Maracaju) is evident in the afternoon; however, unlike the other topography regions analyzed near the Andes and Sierras de Córdoba and San Luis, there is not a secondary maximum in the evening.
As for the PS region, high frequency values are observed from 23:00 UTC and 13:00 UTC in an area between 30–31 S and 62–63 W that coincides with the location of a large lake called the Mar Chiquita Lagoon. This could imply a favorable environment for convective initiation due to local circulations generated by this body of water, although further studies are needed to understand processes associated with these storms. This satellite climatology over SESA denotes the importance to analyze the variety of physical processes over these geographically and meteorologically distinct regions using BAB3T, furthering the analysis and understanding of the factors involved in the formation of severe weather events.

4. Discussion

The development and later implementation of BAB3T over SESA showed to be a powerful tool to study CI features. Results have shown good agreement with other climatological studies from ground-based radar [6,46] and satellite [5,47] techniques and it will open doors to further studies on CI mechanisms.
To detect the limitations of the proposed technique, which could be important when analysing the CI climatology, the sensitivity of tracking performance to time resolution was evaluated considering that GOES-16 brought a major improvement in both the time and spatial resolution. Particularly over SESA, a large number MDSs hours available during RELAMPAGO-CACTI field campaign could be useful to evaluate the benefits associated with using 1 min time resolution.
To examine the impact of time resolution on tracking, the tracking was repeated for the OTs from 10 November but using a 30 min time step (Figure 15a). OT2 and OT3 trajectories do not differ from what was calculated previously, however, OT1 trajectory merges with the one from OT3 on the first time step. As it can be observed in Figure 7, this convective cell initiated on the boundary of a cold pool generated by OT3’s parent storm and rapidly developed and merged with its anvil. For this storm interaction, 30 min resolution data is insufficient for examining such rapid storm evolution as the overlap technique fails to track and identify the correct CI position. However, the timing and location errors for interactions such as this are likely infrequent considering the large storm climatology presented in this study.
On the other hand, 1-min resolution tracking with MDS TIR does not show differences in the trajectories (Figure 15b). Due to the fact that MDS measurements over the region started at 15 UTC, OT3 could not be tracked backward to its initiation location. For both OT1 and OT2, only a 1 min difference in the time of 235 K TIR first appearance was found. Comparing with ground weather radar observations, an improvement in the estimation of CI locations can be observed (Figure 15c), nevertheless, the maximum distance between the two locations for 15 min and 1 min (star and x symbol, respectively) time steps in tracking is 15 km. While this is only one illustrative example, it is necessary to explore a longer record of data to obtain to further examine the time and horizontal resolution impacts of such storm interactions, however this discussion does describe potential errors that can arise in the determination of CI location.
Furthermore, for future work, a comparison with available ground radar information for a large number of cases should be performed over radars in the SESA region to determine if a threshold of 235 K should be considered as the best threshold corresponding to convective initiation. The results shown herein with a 235 K threshold from the MDS case study show good agreement with ground radar determined CI.
Finally, this technique only provides backward trajectories to the CI initial point. Considering the previous experience using area overlapping techniques as in Vila et al. [21], future work will develop an adaptive threshold temperature tracking technique to consider the entire convective cell cycle.

5. Conclusions

A backward tracking methodology to estimate extreme CI time and location, based on the well-established TIR area overlapping technique, is presented is this work. An adaptive brightness temperature threshold for detection and tracking of convective systems is introduced, and is shown to provide significant improvements in following the evolution of storms compared with fixed threshold techniques, especially in cases of the merging of supercells, identifying MCSs within large cloud shields that are likely distinct storms, and identifying embedded cells in MCSs. Furthermore, BAB3T can be used to relate satellite storm tracks to different extreme convective proxies and information such as TRMM-identified, overshooting tops, or other information such as crowdsourced surface hail reports considering appropriate parallax correction.
The implementation of BAB3T on the 1% most extreme convection detected by TRMM RPFs over SESA, between 2000 and 2013, provided for identifying the most frequent convective initiation regions identified by TRMM as having extreme characteristics. This is particularly important in the region analyzed because ground weather radar information is only limited to particular areas. In spite of growing networks over Argentina and Brazil, the coverage is principally constrained to populated areas and records are short in comparison with satellite information.
Overall, it was found that while the Andean and other regions of significant complex topography are often the focusing mechanism for CI in SESA, the plains regions to the east of the terrain also provides for the CI of TRMM ERPFs, although the spatial distribution of CI locations over the plains regions is homogenous. The climatology analyzed over four distinct geographic regions had widely varying ERPF CI behavior in terms of annual and diurnal cycles. The plains regions in south-central Argentina had a year-long annual CI seasonal cycle, while other regions had a distinct warm season maximum. While ERPF CI was found to maximize in the late afternoon over most regions, some regions were found to contain a distinct late evening peak in ERPF CI. These regions included the valley region between the Andes and the Sierras de Córdoba, as well as the region just east of the slopes of the Andes in northwest Argentina. The complexity in convective system CI annual and diurnal cycles revealed with the large sample size of storms and the new tracking technique developed in this study opens the door for further study of the processes involved in forcing these regional differences, including analysis of the data collected during RELAMPAGO-CACTI. Finally, the advent of GOES-16 and its increased time resolution over SESA and with MDS scanning was examined, and it was found that data at 30 min time resolution, fast-moving systems did not provide for overlap in TIR thresholds, and issues such as this should be considered in interpreting the climatology presented in this study. However, an implementation with 15 min resolution showed that this limitation could be overcome. Future work includes using the methods introduced in this study to GPM ERPFs combined with 10–15 min GOES-16 ABI infrared data in order to reduce uncertainties due to limited time resolution.

Author Contributions

Conceptualization, M.C. and P.S.; methodology, M.C. and L.V.; software, M.C.; writing—original draft preparation, M.C. and P.S.; writing—review and editing, M.C., P.S., D.V., S.W.N. and L.V. All authors have read and agreed to the published version of the manuscript.

Funding

The present work was supported by the projects from Argentina ANPCyT PICT 2017-0221, UBACyT 20020130100618BA, International cooperation project from Argentina CONICET—FAPESP 1278/17 and CONICET—NSF 2356/18 and SPRINT 3/2016—FAPESP 2016/50458-1. SWN would like to acknowledge support by the National Science Foundation (grant AGS-1661799) and Department of Energy Atmospheric Systems Research subcontract 408988 from Pacific Northwest National Laboratory.

Acknowledgments

RMA1 data was provided by Secretaría de Infraestructura y Política Hídrica, Ministerio del Interior, Obras Públicas y Vivienda of the Argentinean National Government framed within the SINARAME Project. The National System of Weather Radars (Sistema Nacional de Radares Meteorológicos, SINARAME) project is an Argentinean effort to expand the radar network over the whole country.

Conflicts of Interest

The authors declare no conflict of interest.

References

  1. Altinger de Schwarzkopf, M.L.; Rosso, L.C. Severe storms and tornadoes in Argentina. In Proceedings of the 12th Conference on Severe Local Storms, San Antonio, TX, USA, 12–15 January 1982; American Meteorological Society: San Antonio, TX, USA, 1982; pp. 59–62. [Google Scholar]
  2. Silva Dias, M.A. An increase in the number of tornado reports in Brazil. Weather Clim. Soc. 2011, 3, 209–217. [Google Scholar] [CrossRef]
  3. Matsudo, C.M.; Salio, P.V. Severe weather reports and proximity to deep convection over Northern Argentina. Atmos. Res. 2011, 100, 523–537. [Google Scholar] [CrossRef]
  4. Mezher, R.N.; Doyle, M.; Barros, V. Climatology of hail in Argentina. Atmos. Res. 2012, 114–115, 70–82. [Google Scholar] [CrossRef]
  5. Rasmussen, K.L.; Zuluaga, M.D.; Houze, R.A. Severe convection and lightning in subtropical South America. Geophys. Res. Lett. 2014, 41, 7359–7366. [Google Scholar] [CrossRef]
  6. Mulholland, J.P.; Nesbitt, S.W.; Trapp, R.J.; Rasmussen, K.L.; Salio, P.V.; Mulholland, J.P.; Nesbitt, S.W.; Trapp, R.J.; Rasmussen, K.L.; Salio, P.V. Convective Storm Life Cycle and Environments near the Sierras de Córdoba, Argentina. Mon. Weather Rev. 2018, 146, 2541–2557. [Google Scholar] [CrossRef]
  7. Zipser, E.J.; Cecil, D.J.; Liu, C.; Nesbitt, S.W.; Yorty, D.P.; Zipser, E.J.; Cecil, D.J.; Liu, C.; Nesbitt, S.W.; Yorty, D.P. Where are the most intense thunderstorms on Earth? Bull. Am. Meteorol. Soc. 2006, 87, 1057–1072. [Google Scholar] [CrossRef] [Green Version]
  8. Cecil, D.J. Passive Microwave Brightness Temperatures as Proxies for Hailstorms. J. Appl. Meteorol. Climatol. 2009, 48, 1281–1286. [Google Scholar] [CrossRef]
  9. Cecil, D.J.; Blankenship, C.B.; Cecil, D.J.; Blankenship, C.B. Toward a Global Climatology of Severe Hailstorms as Estimated by Satellite Passive Microwave Imagers. J. Clim. 2012, 25, 687–703. [Google Scholar] [CrossRef]
  10. Houze, R.A.; Rasmussen, K.L.; Zuluaga, M.D.; Brodzik, S.R. The variable nature of convection in the tropics and subtropics: A legacy of 16 years of the Tropical Rainfall Measuring Mission satellite. Rev. Geophys. 2015, 53, 994–1021. [Google Scholar] [CrossRef]
  11. Ferraro, R.; Beauchamp, J.; Cecil, D.; Heymsfield, G. A prototype hail detection algorithm and hail climatology developed with the advanced microwave sounding unit (AMSU). Atmos. Res. 2015, 163, 24–35. [Google Scholar] [CrossRef] [Green Version]
  12. Bang, S.D.; Cecil, D.J.; Bang, S.D.; Cecil, D.J. Constructing a Multifrequency Passive Microwave Hail Retrieval and Climatology in the GPM Domain. J. Appl. Meteorol. Climatol. 2019, 58, 1889–1904. [Google Scholar] [CrossRef]
  13. Laing, A.G.; Fritsch, J.M.; Laing, A.G.; Fritsch, J.M. The Large-Scale Environments of the Global Populations of Mesoscale Convective Complexes. Mon. Weather Rev. 2000, 128, 2756–2776. [Google Scholar] [CrossRef]
  14. Nesbitt, S.W.; Cifelli, R.; Rutledge, S.A.; Nesbitt, S.W.; Cifelli, R.; Rutledge, S.A. Storm Morphology and Rainfall Characteristics of TRMM Precipitation Features. Mon. Weather Rev. 2006, 134, 2702–2721. [Google Scholar] [CrossRef] [Green Version]
  15. Velasco, I.; Fritsch, J.M. Mesoscale convective complexes in the Americas. J. Geophys. Res. 1987, 92, 9591. [Google Scholar] [CrossRef]
  16. Machado, L.A.T.; Rossow, W.B.; Guedes, R.L.; Walker, A.W. Life Cycle Variations of Mesoscale Convective Systems over the Americas. Mon. Weather Rev. 1998, 126, 1630–1654. [Google Scholar] [CrossRef]
  17. Ferreira, R.N.; Rickenbach, T.M.; Herdies, D.L.; Carvalho, L.M.V.; Ferreira, R.N.; Rickenbach, T.M.; Herdies, D.L.; Carvalho, L.M.V. Variability of South American Convective Cloud Systems and Tropospheric Circulation during January–March 1998 and 1999. Mon. Weather Rev. 2003, 131, 961–973. [Google Scholar] [CrossRef] [Green Version]
  18. Siqueira, J.R.; Rossow, W.B.; Machado, L.A.T.; Pearl, C. Structural Characteristics of Convective Systems over South America Related to Cold-Frontal Incursions. Mon. Weather Rev. 2005, 133, 1045–1064. [Google Scholar] [CrossRef] [Green Version]
  19. Salio, P.; Nicolini, M.; Zipser, E.J.; Salio, P.; Nicolini, M.; Zipser, E.J. Mesoscale Convective Systems over Southeastern South America and Their Relationship with the South American Low-Level Jet. Mon. Weather Rev. 2007, 135, 1290–1309. [Google Scholar] [CrossRef] [Green Version]
  20. Anabor, V.; Stensrud, D.J.; de Moraes, O.L.L. Serial Upstream-Propagating Mesoscale Convective System Events over Southeastern South America. Mon. Weather Rev. 2008, 136, 3087–3105. [Google Scholar] [CrossRef]
  21. Vila, D.A.; Machado, L.A.T.; Laurent, H.; Velasco, I. Forecast and Tracking the Evolution of Cloud Clusters (ForTraCC) Using Satellite Infrared Imagery: Methodology and Validation. Weather Forecast. 2008, 23, 233–245. [Google Scholar] [CrossRef]
  22. Durkee, J.D.; Mote, T.L. A climatology of warm-season mesoscale convective complexes in subtropical South America. Int. J. Climatol. 2009, 30, 418–431. [Google Scholar] [CrossRef]
  23. Rasmussen, K.L.; Houze, R.A., Jr. Convective Initiation near the Andes in Subtropical South America. Mon. Weather Rev. 2016, 144, 2351–2374. [Google Scholar] [CrossRef]
  24. Nesbitt, S.W.; Zipser, E.J. The Diurnal Cycle of Rainfall and Convective Intensity according to Three Years of TRMM Measurements. J. Clim. 2003, 16, 1456–1475. [Google Scholar] [CrossRef] [Green Version]
  25. Liu, C.; Zipser, E.J. Global distribution of convection penetrating the tropical tropopause. J. Geophys. Res. 2005, 110, D23104. [Google Scholar] [CrossRef] [Green Version]
  26. Liu, C.; Zipser, E.J.; Liu, C.; Zipser, E.J. “Warm Rain” in the Tropics: Seasonal and Regional Distributions Based on 9 years of TRMM Data. J. Clim. 2009, 22, 767–779. [Google Scholar] [CrossRef] [Green Version]
  27. Liu, C.; Zipser, E.; Liu, C.; Zipser, E. Differences between the Surface Precipitation Estimates from the TRMM Precipitation Radar and Passive Microwave Radiometer Version 7 Products. J. Hydrometeorol. 2014, 15, 2157–2175. [Google Scholar] [CrossRef]
  28. Fiolleau, T.; Roca, R. Composite life cycle of tropical mesoscale convective systems from geostationary and low Earth orbit satellite observations: method and sampling considerations. Q. J. R. Meteorol. Soc. 2013, 139, 941–953. [Google Scholar] [CrossRef]
  29. Wilson, J.W.; Mueller, C.K. Nowcasts of Thunderstorm Initiation and Evolution. Weather Forecast. 1993, 8, 113–131. [Google Scholar] [CrossRef] [Green Version]
  30. Liu, C.; Zipser, E.J.; Cecil, D.J.; Nesbitt, S.W.; Sherwood, S. A Cloud and Precipitation Feature Database from Nine Years of TRMM Observations. J. Appl. Meteorol. Climatol. 2008, 47, 2712–2728. [Google Scholar] [CrossRef]
  31. Iguchi, T.; Kozu, T.; Meneghini, R.; Awaka, J.; Okamoto, K.; Iguchi, T.; Kozu, T.; Meneghini, R.; Awaka, J.; Okamoto, K. Rain-Profiling Algorithm for the TRMM Precipitation Radar. J. Appl. Meteorol. 2000, 39, 2038–2052. [Google Scholar] [CrossRef]
  32. Brunner, J.C.; Ackerman, S.A.; Bachmeier, A.S.; Rabin, R.M.; Brunner, J.C.; Ackerman, S.A.; Bachmeier, A.S.; Rabin, R.M. A Quantitative Analysis of the Enhanced-V Feature in Relation to Severe Weather. Weather Forecast. 2007, 22, 853–872. [Google Scholar] [CrossRef]
  33. Bedka, K.; Brunner, J.; Dworak, R.; Feltz, W.; Otkin, J.; Greenwald, T.; Bedka, K.; Brunner, J.; Dworak, R.; Feltz, W.; et al. Objective Satellite-Based Detection of Overshooting Tops Using Infrared Window Channel Brightness Temperature Gradients. J. Appl. Meteorol. Climatol. 2010, 49, 181–202. [Google Scholar] [CrossRef]
  34. Dworak, R.; Bedka, K.; Brunner, J.; Feltz, W. Comparison between GOES-12 Overshooting-Top Detections, WSR-88D Radar Reflectivity, and Severe Storm Reports. Weather Forecast. 2012, 27, 684–699. [Google Scholar] [CrossRef] [Green Version]
  35. Wang, P.K.; Cheng, K.Y.; Setvak, M.; Wang, C.K. The origin of the gullwing-shaped cirrus above an Argentinian thunderstorm as seen in CALIPSO images. J. Geophys. Res. Atmos. 2016, 121, 3729–3738. [Google Scholar] [CrossRef] [Green Version]
  36. Sandmæl, T.N.; Homeyer, C.R.; Bedka, K.M.; Apke, J.M.; Mecikalski, J.R.; Khlopenkov, K. Evaluating the Ability of Remote Sensing Observations to Identify Significantly Severe and Potentially Tornadic Storms. J. Appl. Meteorol. Climatol. 2019, 58, 2569–2590. [Google Scholar] [CrossRef]
  37. Marion, G.; Trapp, R.; Nesbitt, S. Using Overshooting Top Area to Discriminate Potential for Large, Intense Tornadoes. Geophys. Res. Lett. 2019, 46, 12520–12526. [Google Scholar] [CrossRef]
  38. Trapp, R.J.; Kosiba, K.A.; Marquis, J.N.; Kumjian, M.R.; Nesbitt, S.W.; Wurman, J.; Salio, P.; Hence, D.A. Multiple-platform and multiple-Doppler radar observations of a supercell thunderstorm in South America during RELAMPAGO. Bull. Am. Meteorol. Soc. 2019, submitted. [Google Scholar]
  39. Fiolleau, T.; Roca, R. An Algorithm for the Detection and Tracking of Tropical Mesoscale Convective Systems Using Infrared Images From Geostationary Satellite. IEEE Trans. Geosci. Remote Sens. 2013, 51, 4302–4315. [Google Scholar] [CrossRef]
  40. Maddox, R.A. Meoscale Convective Complexes. Bull. Am. Meteorol. Soc. 1980, 61, 1374–1387. [Google Scholar] [CrossRef]
  41. Aumann, H.H.; Gregorich, D.; DeSouza-Machado, S.M. AIRS observations of deep convective clouds. In Proceedings of the SPIE, San Diego, CA, USA, 13–17 August 2006; Volume 6301. [Google Scholar]
  42. Hoffmann, L.; Alexander, M.J. Occurrence frequency of convective gravity waves during the North American thunderstorm season. J. Geophys. Res. Atmos. 2010, 115. [Google Scholar] [CrossRef]
  43. Janowiak, J.E.; Joyce, R.J.; Yarosh, Y.; Janowiak, J.E.; Joyce, R.J.; Yarosh, Y. A Real-Time Global Half-Hourly Pixel-Resolution Infrared Dataset and Its Applications. Bull. Am. Meteorol. Soc. 2001, 82, 205–217. [Google Scholar] [CrossRef] [Green Version]
  44. Cadena 3 Argentina. Fuerte Pedrea en Distintos Puntos del Interior de Córdoba. Available online: https://www.cadena3.com/noticia/noticias/fuerte-pedrea-en-distintos-puntos-del-interior-de-cordoba_23446 (accessed on 17 December 2019).
  45. La NUEVA Mañana. Fuerte Temporal en Oncativo, Bell Ville, Corralito y Marcos Juárez. Available online: https://lmdiario.com.ar/contenido/111559/fuerte-temporal-en-oncativo-bell-ville-corralito-y-marcos-juarez (accessed on 17 December 2019).
  46. Rosenfeld, D.; Woodley, W.L.; Krauss, T.W.; Makitov, V.; Rosenfeld, D.; Woodley, W.L.; Krauss, T.W.; Makitov, V. Aircraft Microphysical Documentation from Cloud Base to Anvils of Hailstorm Feeder Clouds in Argentina. J. Appl. Meteorol. Climatol. 2006, 45, 1261–1281. [Google Scholar] [CrossRef]
  47. Romatschke, U.; Houze, R.A., Jr. Extreme Summer Convection in South America. J. Clim. 2010, 23, 3761–3791. [Google Scholar] [CrossRef]
  48. Albrecht, R.I.; Goodman, S.J.; Buechler, D.E.; Blakeslee, R.J.; Christian, H.J. Where Are the Lightning Hotspots on Earth? Bull. Am. Meteorol. Soc. 2016, 97, 2051–2068. [Google Scholar] [CrossRef]
  49. Vidal, L. Convección Extrema Sobre Sudamérica: Estructura Interna, Ciclos de vida e Influencia de la Topografía en la Iniciación. Ph.D. Thesis, Facultad de Ciencias Exactas y Naturales Universidad de Buenos Aires, Buenos Aires, Argentina, 1 September 2014. [Google Scholar]
Figure 1. Southeastern South America (SESA) (black box); countries and cities mentioned in this work; relevant elevations and topography (shaded).
Remotesensing 12 00337 g001
Figure 2. Relative frequency distribution of thermal infrared brightness temperature at the extreme rain precipitation features (ERPFs) centroid. Red dashed line represents the cumulative frequency.
Remotesensing 12 00337 g002
Figure 3. Simplified scheme of adaptive threshold technique. The black dot represents the ERPF centroid location and filled contours different temperature clusters. Bold lines denote the temperature threshold at each time.
Remotesensing 12 00337 g003
Figure 4. 20 October 2012: (a) Thermal infrared (TIR) brightness temperature starting at ERPF detection time until estimated initiation time. The light blue dot represents the centroid of the threshold cluster and the orange star the ERPF location. (b) Tracking trajectories for different techniques. AT (adaptive threshold) and FT (fixed threshold). 500 m height above sea level is added in black solid contour. (c) Time evolution of the size of the tracked system for different temperatures.
Remotesensing 12 00337 g004
Figure 5. Same as Figure 4, but for 28 November 2011.
Remotesensing 12 00337 g005
Figure 6. Same as Figure 4, but for 22 October 2000.
Remotesensing 12 00337 g006
Figure 7. 10 November 2018: (a) GOES-16 TIR brightness temperature starting at Overshooting Tops (OTs, stars) detection time until estimated initiation time. Dots represents the tracking position for each OT associated convective system over time. (b) Tracking trajectories for AT (adaptive threshold) and FT (fixed threshold) techniques for the three OTs detected. 500 m height above sea level is added in black solid contour.
Remotesensing 12 00337 g007
Figure 8. Radar reflectivity PPIs at 1.5 elevation from Argentinean Meteorological Radar 1 (RMA1) at 19:01 UTC (left panel) and 19:17 UTC (right panel). Parallax-corrected convective initiation estimated positions of OT1 and OT2 are indicated with red stars. Each black ring denotes 60 km range from the radar site in Córdoba.
Remotesensing 12 00337 g008
Figure 9. Relative frequency distribution in 1 × 1 boxes of the 99th percentile extreme Tropical Rainfall Measuring Mission (TRMM) rain precipitation features (RPFs) systems (left panel) and their estimated convective initiation areas (right panel). TRMM sampling bias is corrected by dividing each bin by TRMM 3A25 total pixel number.
Remotesensing 12 00337 g009
Figure 10. (a) SESA and the four selected subregions. (b) Annual relative frequency distributions of CI for the subregions. (c) Daily relative frequency distributions of convective initiation (CI) for the subregions.
Remotesensing 12 00337 g010
Figure 11. Diurnal cycle of relative frequency distribution in 1 × 1 boxes of ERPFs estimated convective initiations for the western central Argentina (WCA) region. Relative frequencies are plotted every 3 h starting at 23 UTC from left to right, top to bottom. TRMM sampling bias is corrected by dividing each bin by TRMM 3A25 total pixel number. The dots indicate estimated parallax-corrected CI locations. CI sample size: 1760.
Remotesensing 12 00337 g011
Figure 12. Same as Figure 11, but for the northwestern Argentina (NOA) region. CI sample size: 812.
Remotesensing 12 00337 g012
Figure 13. Same as Figure 11, but for the northeastern Argentina and Paraguay (PN) region. CI sample size: 1931.
Remotesensing 12 00337 g013
Figure 14. Same as Figure 11, but for the eastern central Argentina and Uruguay (PS) region. CI sample size: 1848.
Remotesensing 12 00337 g014
Figure 15. (a) Tracking trajectories for the three OTs detected in 10 November 2018 with 30 min (colors) and 15 min (gray) resolution. (b) Tracking trajectories for the three OTs with 1 min (colors) and 15 min (gray) resolution; 500 m height above sea level is added in black solid contour. (c) RMA1 ground weather radar reflectivity and parallax-corrected estimated positions of OT1 and OT2 convective systems initiations for 1 min (red cross) and 15 min (red star) resolution tracking. Each black ring denotes 60 km range from the radar site in Córdoba.
Remotesensing 12 00337 g015
Table 1. Percentiles of the probability distribution function for each variable.
PCT 85 [K]PCT 37 [K]Ht40 [km]FlashcountVolRain [mm]
99.9th Percentile93.0191.815.5557.8329,026.7
99th Percentile166.8244.912.8215.629,132.9
95th Percentile237.2265.79.871.42175.4

