Urban Nighttime Leisure Space Mapping with Nighttime Light Images and POI Data


1
School of Resource and Environmental Science, Wuhan University, Wuhan 430079, China
2
Research Center of Government GIS, Chinese Academy of Surveying and Mapping, Beijing 100830, China
3
Geographic Information Science (GIS), Department of Geography, University of Zurich—Irchel Winterthurerstr., 190 CH-8057 Zurich, Switzerland
*
Author to whom correspondence should be addressed.
Remote Sens. 2020, 12(3), 541; https://0-doi-org.brum.beds.ac.uk/10.3390/rs12030541
Submission received: 30 December 2019
/
Revised: 25 January 2020
/
Accepted: 3 February 2020
/
Published: 6 February 2020
(This article belongs to the Special Issue Big Data in Remote Sensing for Urban Mapping)
Abstract
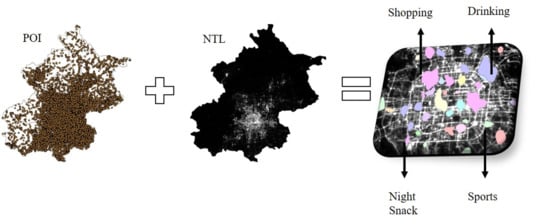
:Urban nighttime leisure spaces (UNLSs), important urban sites of nighttime economic activity, have created enormous economic and social benefits. Both the physical features (e.g., location, shape, and area) and the social functions (e.g., commercial streets, office buildings, and entertainment venues) of UNLSs are important in UNLS mapping. However, most studies rely solely on census data or nighttime light (NTL) images to map the physical features of UNLSs, which limits UNLS mapping, and few studies perform UNLS mapping from a social function perspective. Point-of-interest (POI) data, which can reflect social activity functions, are needed. As a result, a novel methodological UNLS mapping framework, that integrates NTL images and POI data is required. Consequently, we first extracted high-NTL intensity and high-POI density areas from composite data as areas with high nightlife activity levels. Then, the POI data were analyzed to identify the social functions of leisure spaces revealing that nighttime leisure activities are not abundant in Beijing overall, the total UNLS area in Beijing is 31.08 km2, which accounts for only 0.2% of the total area of Beijing. In addition, the nightlife activities in the central urban area are more abundant than those in the suburbs. The main urban area has the largest UNLS area. Compared with the nightlife landmarks in Beijing established by the government, our results provide more details on the spatial pattern of nighttime leisure activities throughout the city. Our study aims to provide new insights into how multisource data can be leveraged for UNLS mapping to enable researchers to broaden their study scope. This investigation can also help government departments better understand the local nightlife situation to rationally formulate planning and adjustment measures.
1. Introduction
Leisure is defined as activity engaged in during free time [1,2]; according to the Athens Charter, in addition to dwelling, work, transportation, and leisure representing one of the four basic functions of a city [3,4,5]. After the reform and opening up program was enacted in 1978, the acceleration of urbanization throughout China has triggered rapid growth of the national economy [6,7,8]. Unfortunately, the proportion of urban nighttime leisure space (UNLS) did not keep pace with the urban growth rate, which led to a decline in the quality of life [9,10,11,12]. Characterizing the spatial distribution of UNLS can facilitate a better understanding of urban form [13], particularly as detecting spatial regularities assists in solving certain social problems in the real world [14,15]. UNLSs, referring to the spaces where urban residents engage in leisure activities between 6:00 P.M. and 6:00 A.M., have wide-ranging impacts on urban economic growth [16], employment [17], urban competitiveness [18], urban vitality [19], and social justice [20,21]; consequently, UNLS is considered one of the key countermeasures to activate the urban economy; and accordingly falls under the scope of this paper [22]. A UNLS map can indicate the socioeconomic activities that are carried out in different urban nighttime areas. However, due to the lack of an effective data source, the UNLS distribution is sometimes difficult to acquire at the regional scale. In addition, social census data always suffer from coarse temporal and spatial resolutions because data on basic districts or areas of arbitrary shape are inaccessible in many countries [23]. Therefore, conducting UNLS mapping at different spatial resolutions using geographical big data as an alternative to traditional social census data is an important and challenging task for the academic community [24,25].
UNLS is an important host of urban nighttime economic activities, and therefore plays an increasingly important role in the urban economy [26]. In addition, urban leisure space is a kind of living entity because of the continuous integration of service providers and scenic spots, thus forming a dynamic space of consumerism. However, this dynamism makes it somewhat difficult for urban policy-makers and planners to manage and enhance the attraction of urban leisure spaces, and it is also difficult for residents and tourists to fully understand and obtain accurate information about the leisure facilities provided [27]. At present, studies on NTLS [28,29,30] are mostly focused on economics [31], sociology [32], public safety [33,34,35], resident health and happiness [36], and urban management [37]. According to the different types of data, the existing research can be divided into the following three categories. (1) Based on survey statistics, Song et al. [10] conducted a questionnaire survey on the daily leisure activities and places of Shanghai residents. The results show that although, the daily leisure time and disposable income of Shanghai urban residents are relatively sufficient, there are few leisure activities available. Compared with the level of leisure in western developed countries, the leisure level of urban residents in Shanghai is still in its primary stage. At present, there is a small number of outdoor leisure places, and their layout is not optimal, in addition, open public green spaces are the most popular type of leisure space. Ngesan et al. [38] used Shah Alam as a case study to develop an open-ended questionnaire by collecting previous research data on nighttime activities, and used the questionnaire as a tool to assess whether Shah Alam would be a suitable night market. Hsieh et al. [39] employed statistical information from the Taiwan Tourism Bureau to understand tourists’ motivations and their preferred leisure activities when they shop at tourist night markets. The result shows that novelty-seeking, exercising, and experiencing local culture and customs are major factors that motivate tourists to shop at tourist night markets: Eating out overwhelmingly dominated the leisure activities (88.5%), followed by everyday shopping (56%), and novelty-seeking (32%). Mohd et al. [40] used a behavior mapping survey and a questionnaire survey to study the nighttime urban public parks between Shah Alam and Putrajava. The results show that urban public parks could provide more benefits and function to the leisure and recreation lifestyles of urban communities. John et al. [41] utilized survey data to examine the leisure and recreation activities of people living in urban residential estates in the Lower Hunter, New South Wales. Their results demonstrate that substantial numbers of respondents are dissatisfied with the provision of recreation resources. There was an expressed need for larger areas of open space and parkland and better facilities for a wider range of age groups. (2) Based on network geographic data, Demi et al. [23] proposed a method to determine the potential of leisure activities from urban spatial network data by using the semantic theme model. Taking the city of Zwolle as an example, network text data and geographical location tags were used to estimate the different types of leisure activities. Revealing that the services and functions of leisure spaces can be identified by combining various text and tag sources from the web. Jing et al. [5] employed the gradient analysis method which integrates a geographic information system (GIS) technology (kernel density analysis), curve fitting analysis, and correlation analysis to theoretically determine the spatial gradient changes among urban leisure places and their significant correlation with the population distribution. (3) Based on NTL data, taking Guangzhou as an example, Guo et al. [42] analyzed the factors that influence the development of nightlife tourism by using NTL engineering data and divided the nightlife scene of Guangzhou into three axes, one core, four centers, and one area. The results show that the government does not fully realize the importance of nighttime tourism. One of the major drawbacks is the limited hours of operation, most tourist attractions close before 6:00 P.M., which limits the development of nighttime tourism.
Although these methods have greatly contributed to UNLS research, previous studies suffer from three recurring issues.
- (1)
- Traditionally, the data sources used for UNLS research involve household surveys or census data collected by the government or research organizations. However, the varying qualities of these surveys and censuses and the substantial monetary and time costs required to conduct these studies hamper efforts to evaluate the UNLS distribution.
- (2)
- With respect to NTLS, most previous methods focused on recessive economic factors without considering the spatial distribution, morphological characteristics, and other influencing factors.
- (3)
- Using NTL data alone to map leisure spaces may result in inaccurate determinations due to the excessively high radiance in specific types of areas such as commercial zones and transportation hubs.
To address these issues, we employ NTL and point-of-interest (POI) data instead of census and questionnaire data for UNLS analysis. NTL data record the NTL intensity at the Earth’s surface, thereby reflecting the magnitude of human activities [43,44]. In addition, NTL images have certain advantages in monitoring the UNLS distribution because of their large spatial coverage, high temporal resolution, and wide availability [8]. In addition, the NTL data is widely used to study urban expansion and relevant sociodemographic activities across a variety of spatial scales, such as population density [45,46], urban extent mapping [47,48], energy consumption [49,50], environmental changes [51,52], and socioeconomic activities [24,53]. Currently, most studies mainly use the following two types of NTL image sources: The Defense Meteorological Satellite Program Operational Line-scan System (DMSP-OLS) and the Suomi National Polar-Orbiting Partnership Visible Infrared Imaging Radiometer Suite (NPP-VIIRS). However, due to the blooming effect, the nighttime leisure spaces observed in the DMSP-OLS dataset are generally larger than the actual area of human activity [54]. In addition, both DMSP-OLS and NPP-VIIRS data are insufficient to reflect human activities at an adequately fine resolution (in terms of the temporal and spatial resolutions).
POI data, which comprise geographic coordinates and reflect socioeconomic features create new opportunities for UNLS mapping at a high resolution [55]. Certain POIs, such as service, leisure, and entertainment areas, are more closely associated with human activities and may indicate a richer UNLS than other POIs. Hence, as NTL images do not possess these features, POI data can be viewed as an analog complement to NTL data [56,57].
The combined advantage of these two data sources, boast considerable potential to achieve better insights into UNLS distribution patterns. The physical features extracted from NTL images and the functional features retrieved from POI data can be combined to characterize UNLSs with great accuracy. To the best of our knowledge, no previous reports have been published on the joint use of NTL and POI data to produce UNLS maps. To bridge this gap, we develop a framework that utilizes NTL images and POI data to conduct UNLS mapping. In the remainder of this paper, we describe the details of the framework and its application to Beijing, China. We also examine the strengths and limitations of the proposed framework and formulate suggestions for future work in this field.
2. Study Area and Dataset
2.1. Study Area
To evaluate the potential of combining NTL images and with POI data for UNLS mapping, we considered Beijing, the capital of China, as our study area (Figure 1). Beijing, which occupies an administrative area of 16,410.54 km2, lacks a tradition of nighttime leisure activity, is trying to stimulate its nighttime consumption potential. To accelerate the development of nighttime leisure spaces in Beijing, the government issued a work report in January 2019 in which a policy was proposed to intensely stimulate the nighttime economy and promote consumption, by encouraging key districts, shopping malls, supermarkets, and convenience stores to extend their business hours appropriately. In addition, plans were developed to build late-night dining halls in select catering districts in Xicheng, Chaoyang, Fengtai, Shijingshan, Sub-Center, and Changping. Moreover, in July 2019, the Beijing Municipal Bureau of Commerce proposed the Further Prospering Night Economy and Promoting Consumption Growth plan in Beijing, the goal of which is to establish a number of functional nighttime landmarks, nighttime business districts, and nighttime living areas in Beijing by the end of 2021. Thus, government departments need to obtain data on the area and location of each nighttime leisure space in a timely and effective way. This urban planning requirement is one of the motivations of this study.
2.2. Data Sources
2.2.1. NTL Images
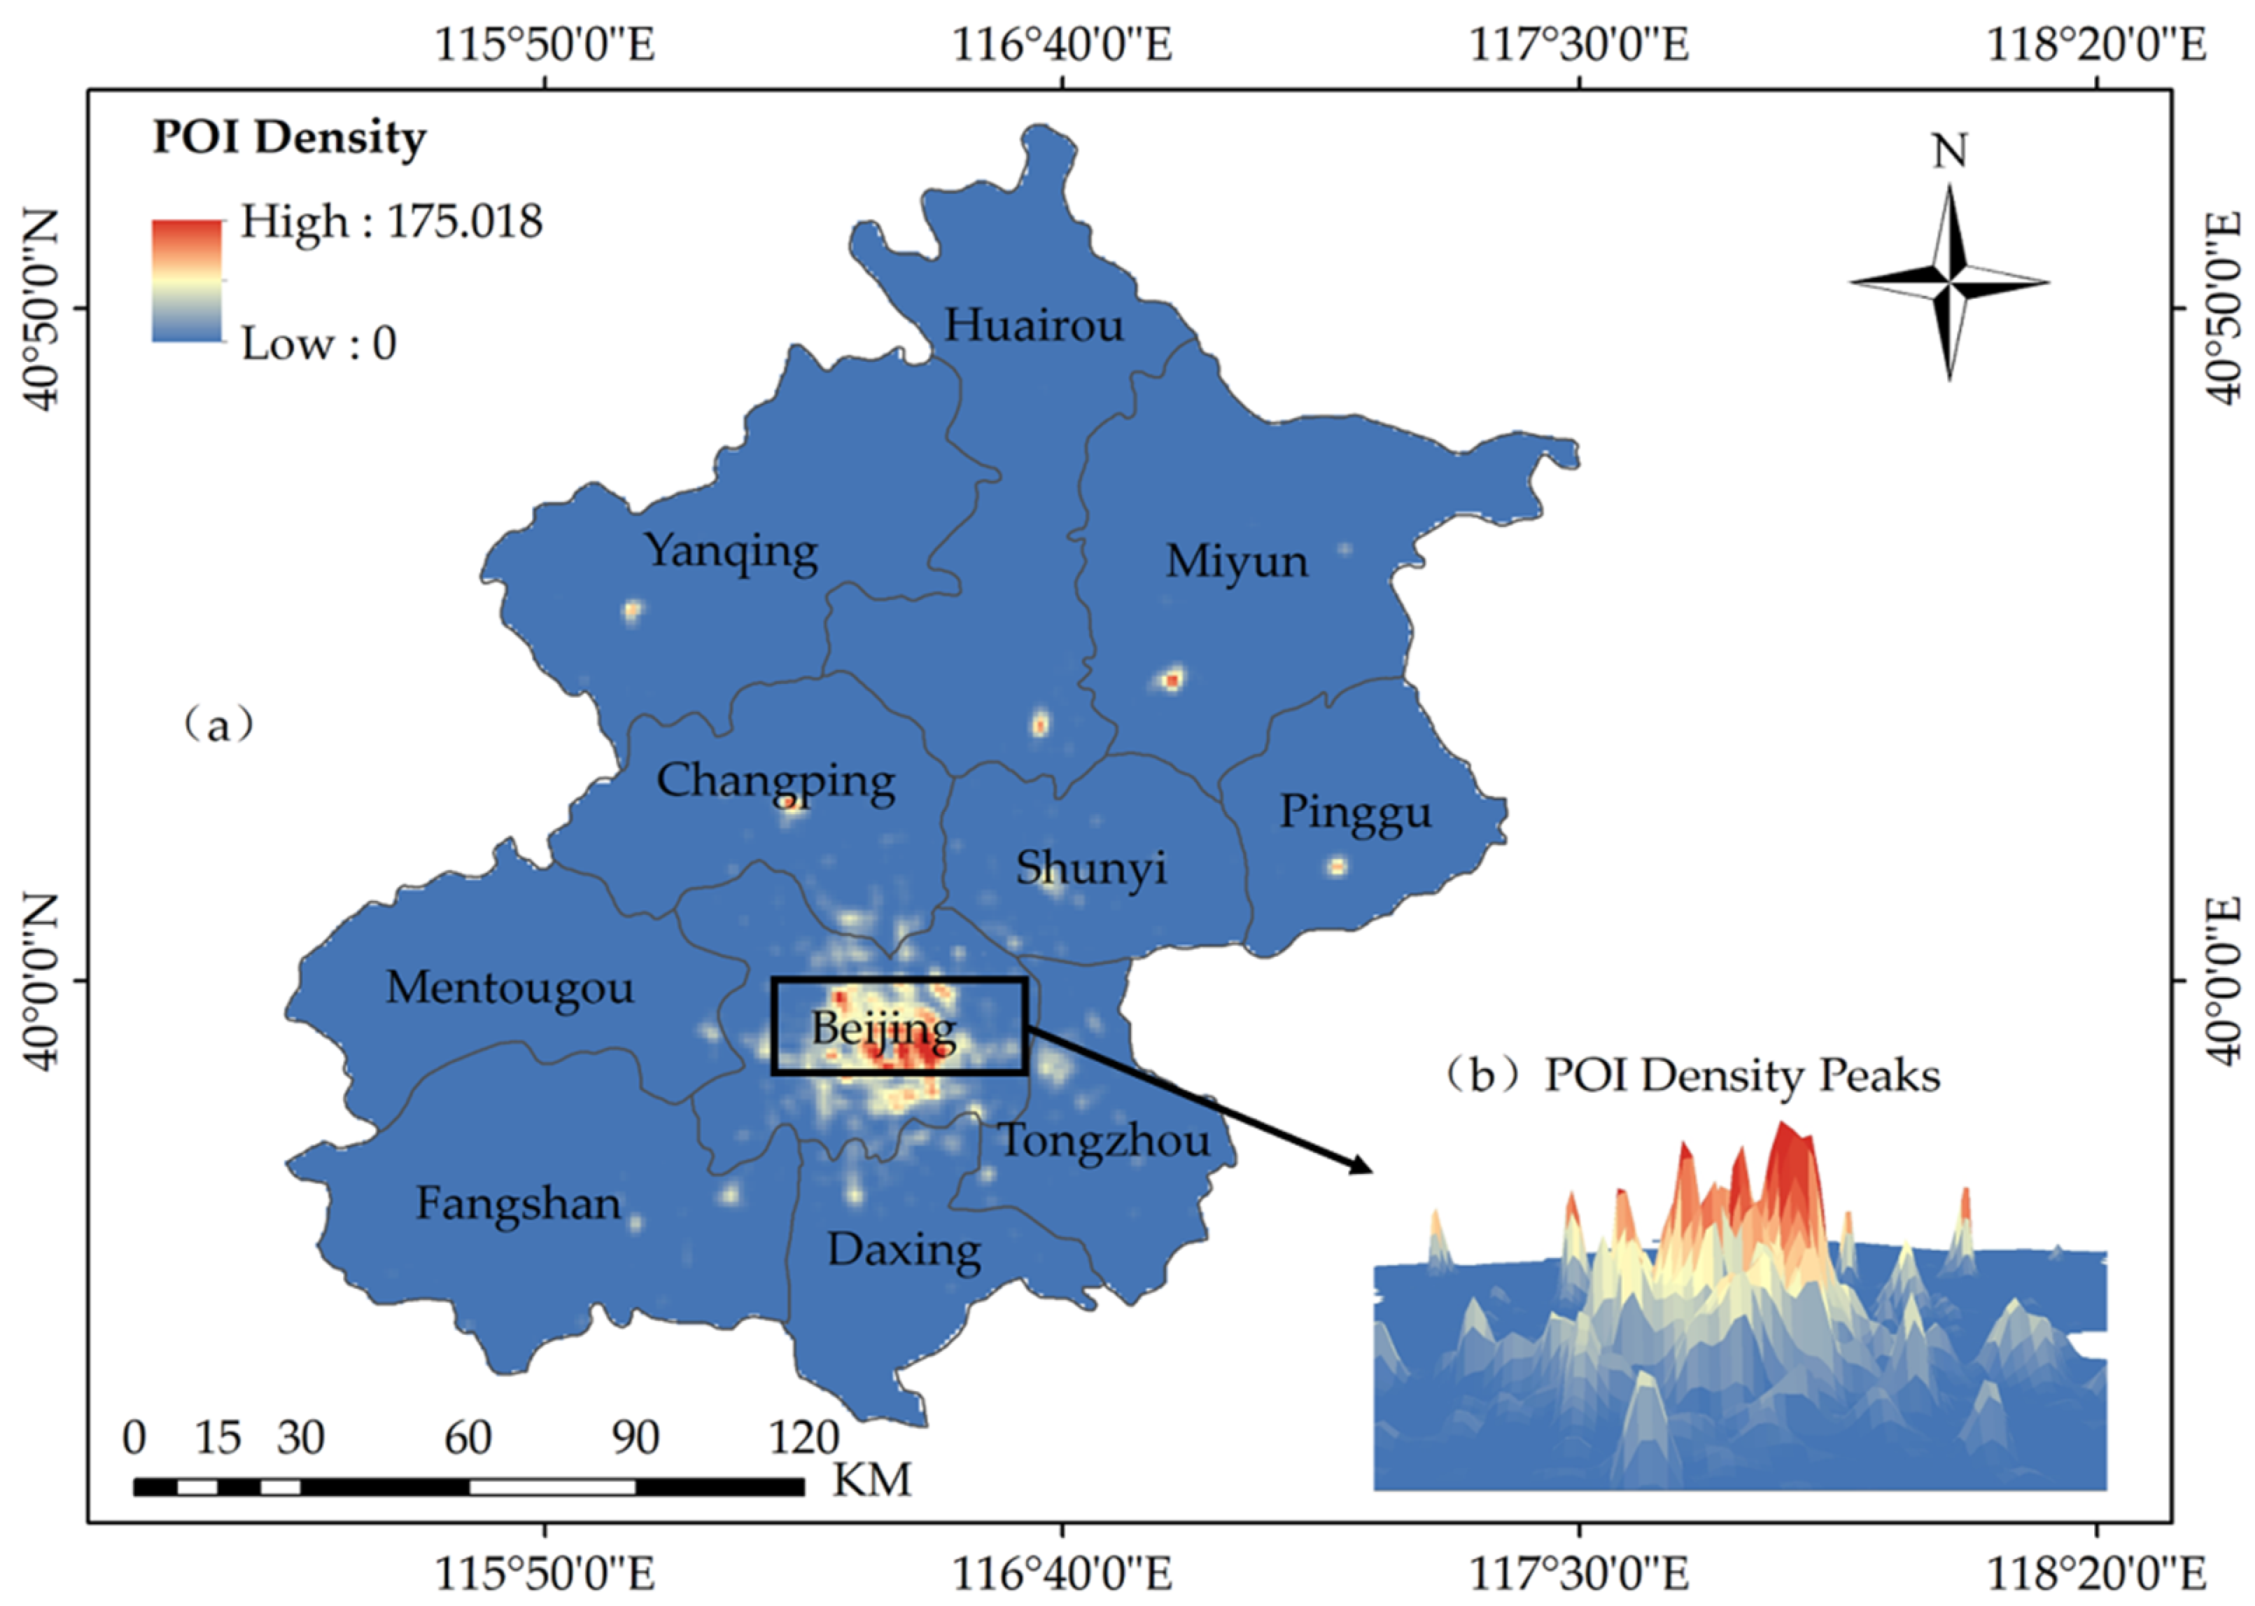
Luojia-1 NTL data taken on 23 November 2018 (http://datasearch.hbeos.org.cn:3000/) were used in this study. We extracted the data for the Beijing region by using the administrative boundary of Beijing as a mask polygon. These Luojia-1 NTL data were converted into the WGS_1984_Web_Mercator_Auxiliary_Sphere projection at a resolution of 130 m (Figure 2); the local visit time is approximately 10 P.M., and the revisit period is 15 days. The NTL intensity may be affected by seasonal vegetation changes [58]. November data were chosen to reduce the effects of leaves on the NTL intensity, and the visit time of 10 P.M. was selected mainly because most business establishments in Beijing are closed after this time. According to a released report of Luojia-1 (http://www.lmars.whu.edu.cn/index.php/en/researchnews/2169.html), the released images are systematically geometric corrected, and the positioning accuracy ranged from 0.49 to 0.93 km. In addition, precise geometric correction is necessary for the experimental image. Twenty ground control points were manually collected to estimate the rational function coefficients using the L1-normal-regularized least squares method [59], which are used to conduct ortho-rectification with the help of the global Shuttle Radar Topography Mission Digital Elevation Model data [60].
The digital number values of the Luojia-1 images were converted into radiance values using the following equation, which is based on a laboratory calibration, provided by the satellite data website:
where denotes the digital number value of a pixel, denotes the bandwidth, and denotes the radiance, in units of The radiometric range of Luojia-1 is 460–980 nm, and therefore, is equal to 5.2 × 10⁻⁷ m. After the radiance of each pixel is calculated, the units are converted into .
2.2.2. POI Data
The POI data used in this study were collected in 2019 from Baidu Map (https://map.baidu.com/), one of the most popular online map service providers in China. We compiled a crawler program and examined the POI data of Beijing using the free interface provided by the Baidu application programming interface (API) (http://lbsyun.baidu.com/index.php?title=webapi/guide/webservice-placeapi). A total of 320,785 POIs were obtained within the study area, and the Baidu POI data include 19 first-level categories and 138 second-level categories. We chose 11 first-level categories related to leisure as the research data (recreation and entertainment, daily life service, dining service, shopping, beauty parlor, business company, sports facility and gym, education and training, cultural media, natural features, and tourist attraction).
2.3. Data Preprocessing to Generate Composite Data
2.3.1. Generating the POI Density Layer
Two steps were followed to generate the POI density layer with POI data: (1) The qualities of POIs vary among different categories, i.e., the number of shopping POIs is greater than the other types. This may result in an unbalanced distribution of the numbers of points among different POI types. Therefore, we regard different types of POIs as having composite functions rather than a single function [61]. Then, kernel density estimation [62] was used to convert each POI category into a smooth and continuous density map. Previous studies have shown that kernel density estimation results were influenced mainly by the bandwidth selection but are less affected by the selected kernel function [63,64]. In this study, we use the spatial variable of Sliverman’s “rule of thumb” to calculate the bandwidth for kernel density estimation (Table 1).
where is the bandwidth; is the number of event points; is the standard distance; is the median distance.
(2) Using the principal component analysis [17], the POI density maps were combined into a composite POI density layer. Due to the strong correlations between the POI density layers of each category, we conducted the principal component analysis to eliminate redundancy. Since the contribution rate of the cumulative squared sum reaches 83.17%, only the first principal component image was used (Figure 3). A change in color from blue to red in Figure 3 corresponds to an increase in the POI density.
2.3.2. Composite POI Density and NTL Intensity Layers
Given that both the POI density and NTL intensity are linearly correlated to the leisure spaces, a multiple linear regression model was built as follows:
where represents the composite data of the study area, and the coefficients and are the weights of the POI density and NTL intensity, respectively. The optimal values of and are mainly obtained through repeated trials. Details will be discussed and explained in Section 4.5. The composite data generated will be used as the data for the subsequent research.
3. Method
3.1. Theoretical Basis
In general, higher NTL intensities and POI densities indicate a higher possibility of nighttime activities. Moreover, specific POI categories are more closely related to nighttime leisure activities than other categories [65]. Therefore, the POI density and NTL intensity for a region can be conceptualized as a continuous surface of the intensity of human nighttime activity, in which the nighttime leisure space is analogous to a mountain on the Earth’s surface topography [66]. Accordingly, by analogy, the detection of UNLSs can be regarded as identifying a mountain, namely, a set of contours, from a numerical composite data surface.
Driven by this analogy between UNLS and topography, we established a detailed workflow for UNLS mapping (Figure 4). This workflow includes four major components. First, we use NTL images and POI density maps generated from POI data to synthesize the composite data. Second, we extract the distributions of high-nighttime activity layers from the composite data. Third, we utilize these distribution layers to conduct functional classification and identify UNLSs using POI data. Finally, we calculate the attributes of UNLSs to reflect the UNLS distribution pattern.
3.2. Localized Contour Tree Generation
3.2.1. Contour Map Generation
To prevent the generated contour lines from being jagged and irregular, a majority filter in ArcGIS was employed to smooth the composite data to attenuate noise within the data. Since the detected NTL intensity and the POI density of an urban leisure space must be higher than a certain threshold value, we first selected a threshold value as the base contour value, which was determined by using the density-curve method [67]. The core idea is that UNLSs are located in areas with high NTL intensities and POI densities. To improve the calculation efficiency of constructing contour trees, the contour interval was set to one.
Since an urban leisure space is associated with a set of concentric closed contours, to avoid the generation of open contour lines at the boundaries of the study area, we choose an external buffer zone of 5 km, however, when extracting a larger area of data, an open contour buffer zone of more than 5 km is not considered in this study, and the detected urban leisure space is defined as an area with a spatial extent of at least 0.1 km2. Specifically, if the area of a closed contour is smaller than 0.1 km2, the contour will be discarded without further consideration. From the perspective of local knowledge, we believe that selecting a threshold value in this manner can ensure that all important urban leisure spaces are included.
3.2.2. Localized Contour Tree
The localized contour tree method is a useful geographic tool that has been used to identify hierarchical relationships from topographic data [68]. In recent years, through improvement and promotion by scholars, this approach also has been successfully used for many purposes, such as map generalization [69], terrain analysis [68], and urban structure analysis [67,70]. In the current work, we use a contour tree to represent the topological relationship between adjacent nodes. A tree consists of a root node, a set of intermediate nodes, and a set of leaf nodes. Each node represents a closed contour, and the boundary between two adjacent closed contours. Each node has only one parent node, but there may be multiple children nodes.
A localized contour tree is constructed by using the tree growing algorithm. There are four steps to generate the contour tree: (1) Locate the seed contours; (2) generate the contour trees; (3) simplify the contour trees; and (4) extract the leaf nodes. Figure 4 shows how to construct contour trees based on sample intensity contour maps of the composite data, how to simplify these contour trees, and how to extract the leaf nodes.
The generation process of local contour trees is demonstrated in Figure 5 as an example. First, we define the seed contour as a closed contour that contains a sink point but does not contain any other contours inside. As shown in Figure 5, there are two seed contours, S and M, which are the first-level contours of the local contour tree; these seed contours are the starting points for generating the local contour tree. Then, we use the breadth-first priority search algorithm to identify and add the next two adjacent closed contours, N and R, around the seed contour M as their parent node to grow the contour tree. The process continues until the outermost closed contour V is included as a root node. Figure 5b depicts a simple two-branch contour tree generated by a two-level UNLS. Next, the contour tree is simplified to reflect the hierarchical structure of the UNLSs. Figure 5b shows that contours M, N, and R belong to the same branch of the contour tree, and there is no topological change along the branch; these contours can be regarded as the same contour, only contour R is retained to represent the whole M-N-R branch. In addition, the last node of the branch, R, represents the boundary of the leisure space. This procedure applies to all similar branches in the contour tree. V represents a composite leisure space containing two independent basic leisure spaces. Finally, we extract all leaf nodes as UNLSs. For example, in Figure 5d, leaf nodes S and R represent two UNLSs, which are delimited by the leaf-node contours of the simplified contour tree.
It should be noted that in the process of growing a contour tree, if the value of the adjacent contour without topological change is greater than the value of its child node contour, for example, if the value of parent node R is greater than the value of child node N, then branch R-N-M proceeds from low to high, thereby forming a black hole against a bright background, and the contour and its branch both need to be discarded.
3.3. UNLSs Distribution
3.3.1. Identifying UNLSs from Contour Trees
An important and meaningful UNLS should have a sustained NTL intensity and POI density that are significantly higher than those of the surrounding areas. In a simplified contour tree, the contour lines corresponding to the leaf nodes represent the spatial extent of the UNLSs.
Since there are many kinds of nighttime activities in addition to leisure activities, there are also different behaviors such as working overtime. Furthermore, airports, hospitals, and residential areas also have high NTL intensities, and thus, these locations may be mistaken as UNLSs. Therefore, not all the leaf nodes representing the range of urban nightlife activity can be considered UNLSs. It is therefore necessary to identify the functional characteristics of these areas through the quantitative indicators of specific POI category, to remove nonleisure spaces and accurately extract UNLSs. In addition, we need to classify the nighttime leisure activities that correspond to the main functions of the corresponding leisure space. Referring to the research of Samuel et al. [71], we divide nighttime leisure activities into the following categories: Entertainment, life, sport, culture, and outdoor leisure activities. With each leisure activity category, the POIs that can best reflect different nighttime leisure activities are reclassified (Table 2).
According to the reclassified POIs, we identify the functional characteristics of leisure spaces by calculating the category ratio index of all UNLSs:
where is the leisure activity category, is the number of POIs in the ith category represented by each leaf node, and is the total number of POIs in the ith category. The largest value represents the functional category of the leaf node.
3.3.2. Derivation of UNLS Attributes
In Table 3, two geometric attributes and four statistical attributes for each nighttime leisure space were calculated, the district (D), total number of leisure space (TN), total circumference (TC), total area (TA), total contour (TC), maximum area (MaxA), and maximum contour (MaxC).
3.4. Uncertainty and Sensitivity Analysis
The reliability and accuracy of UNLSs identified using our proposed method may be influenced by many factors. There are four uncertain factors in this research, namely, the data quality, basic contour, contour interval, and minimum UNLS area. (1) It should be noted that the geometric characteristics of a UNLS, especially its area and intensity, may be affected by the time and season in which the NTL data were collected. For example, an NTL image not only reflects the distribution of UNLSs, but also may include the distributions of streetlights and airports. In autumn, some UNLSs may be partially covered by leaves. In this case, the derived area and NTL intensity of a corresponding UNLS will be significantly underestimated. Therefore, the determination must be corrected by incorporating POI information. (2) When using NTL data and POI data to synthesize composite data, the selected weight coefficients α and β also determine the number and areas of detected UNLSs. When NTL data accounts for a large proportion of the total weight, a great number of small-area of nonleisure spaces may be generated. When POI data accounts for a large proportion of weight, the area UNLSs may be larger than the actual area. Therefore, we choose 0.1 as the interval to calculate the weight values between zero and one. (3) Since our method is based on the generation of contours, the selection of the basic contour and contour interval will also affect the detection result. The primary parameter is the contour threshold value, which is designed to ensure the detected UNLS are indeed UNLSs. (4) A large contour interval may produce fewer contours and decrease the calculation time of our method, but smaller leisure spaces are likely to be missed. Conversely, if the contour interval is small, the detection results will be more accurate and smaller leisure spaces are more likely to be included, but this will lead to an increase in the calculation time. Therefore, three different values (0.5, 1.0, and 1.5) are selected to analyze the sensitivity of the method to the contour interval. At the same time, a value of eight is used as the basic contour threshold. (5) In addition, due to the lack of quantitative UNLS research, the selection of the minimum UNLS area threshold will have an impact on the detection results. Selecting a low threshold may produce many meaningless UNLSs, while selecting an excessively high threshold may result in certain UNLSs being ignored. Therefore, we evaluate a series of minimum area values (0, 0.05, 0.1, 0.15 and 0.2) to estimate the impact of this threshold on the UNLS detection performance, in which the basic contour interval is eight and the contour interval is one.
4. Results
In this study, we utilized composite data generated from NTL images and POI data to map the UNLSs in Beijing, China. The UNLS distribution is suitably reflected. The physical features (i.e., location, shape and area) derived from the composite data effectively describe the physical elements of the UNLSs. The POI data indicate the function of a space, especially in areas with nighttime economic activities. Hence, the use of both data sources is beneficial for identifying the UNLS distribution in an urban area.
4.1. Generating a Contour Map from Composite Data
First, we sample the POI density map of the first principal component image at the same resolution as that of the NTL images. According to Equation (2), we generate composite data from the NTL images and POI data, where is 0.2 and is 0.8. Then, the density contour map of the composite data is generated by using a basic contour line of eight and a contour interval of one. A change from blue to red in Figure 6 reflects a transition in the POI density and NTL intensity from low to high.
4.2. UNLS Distribution
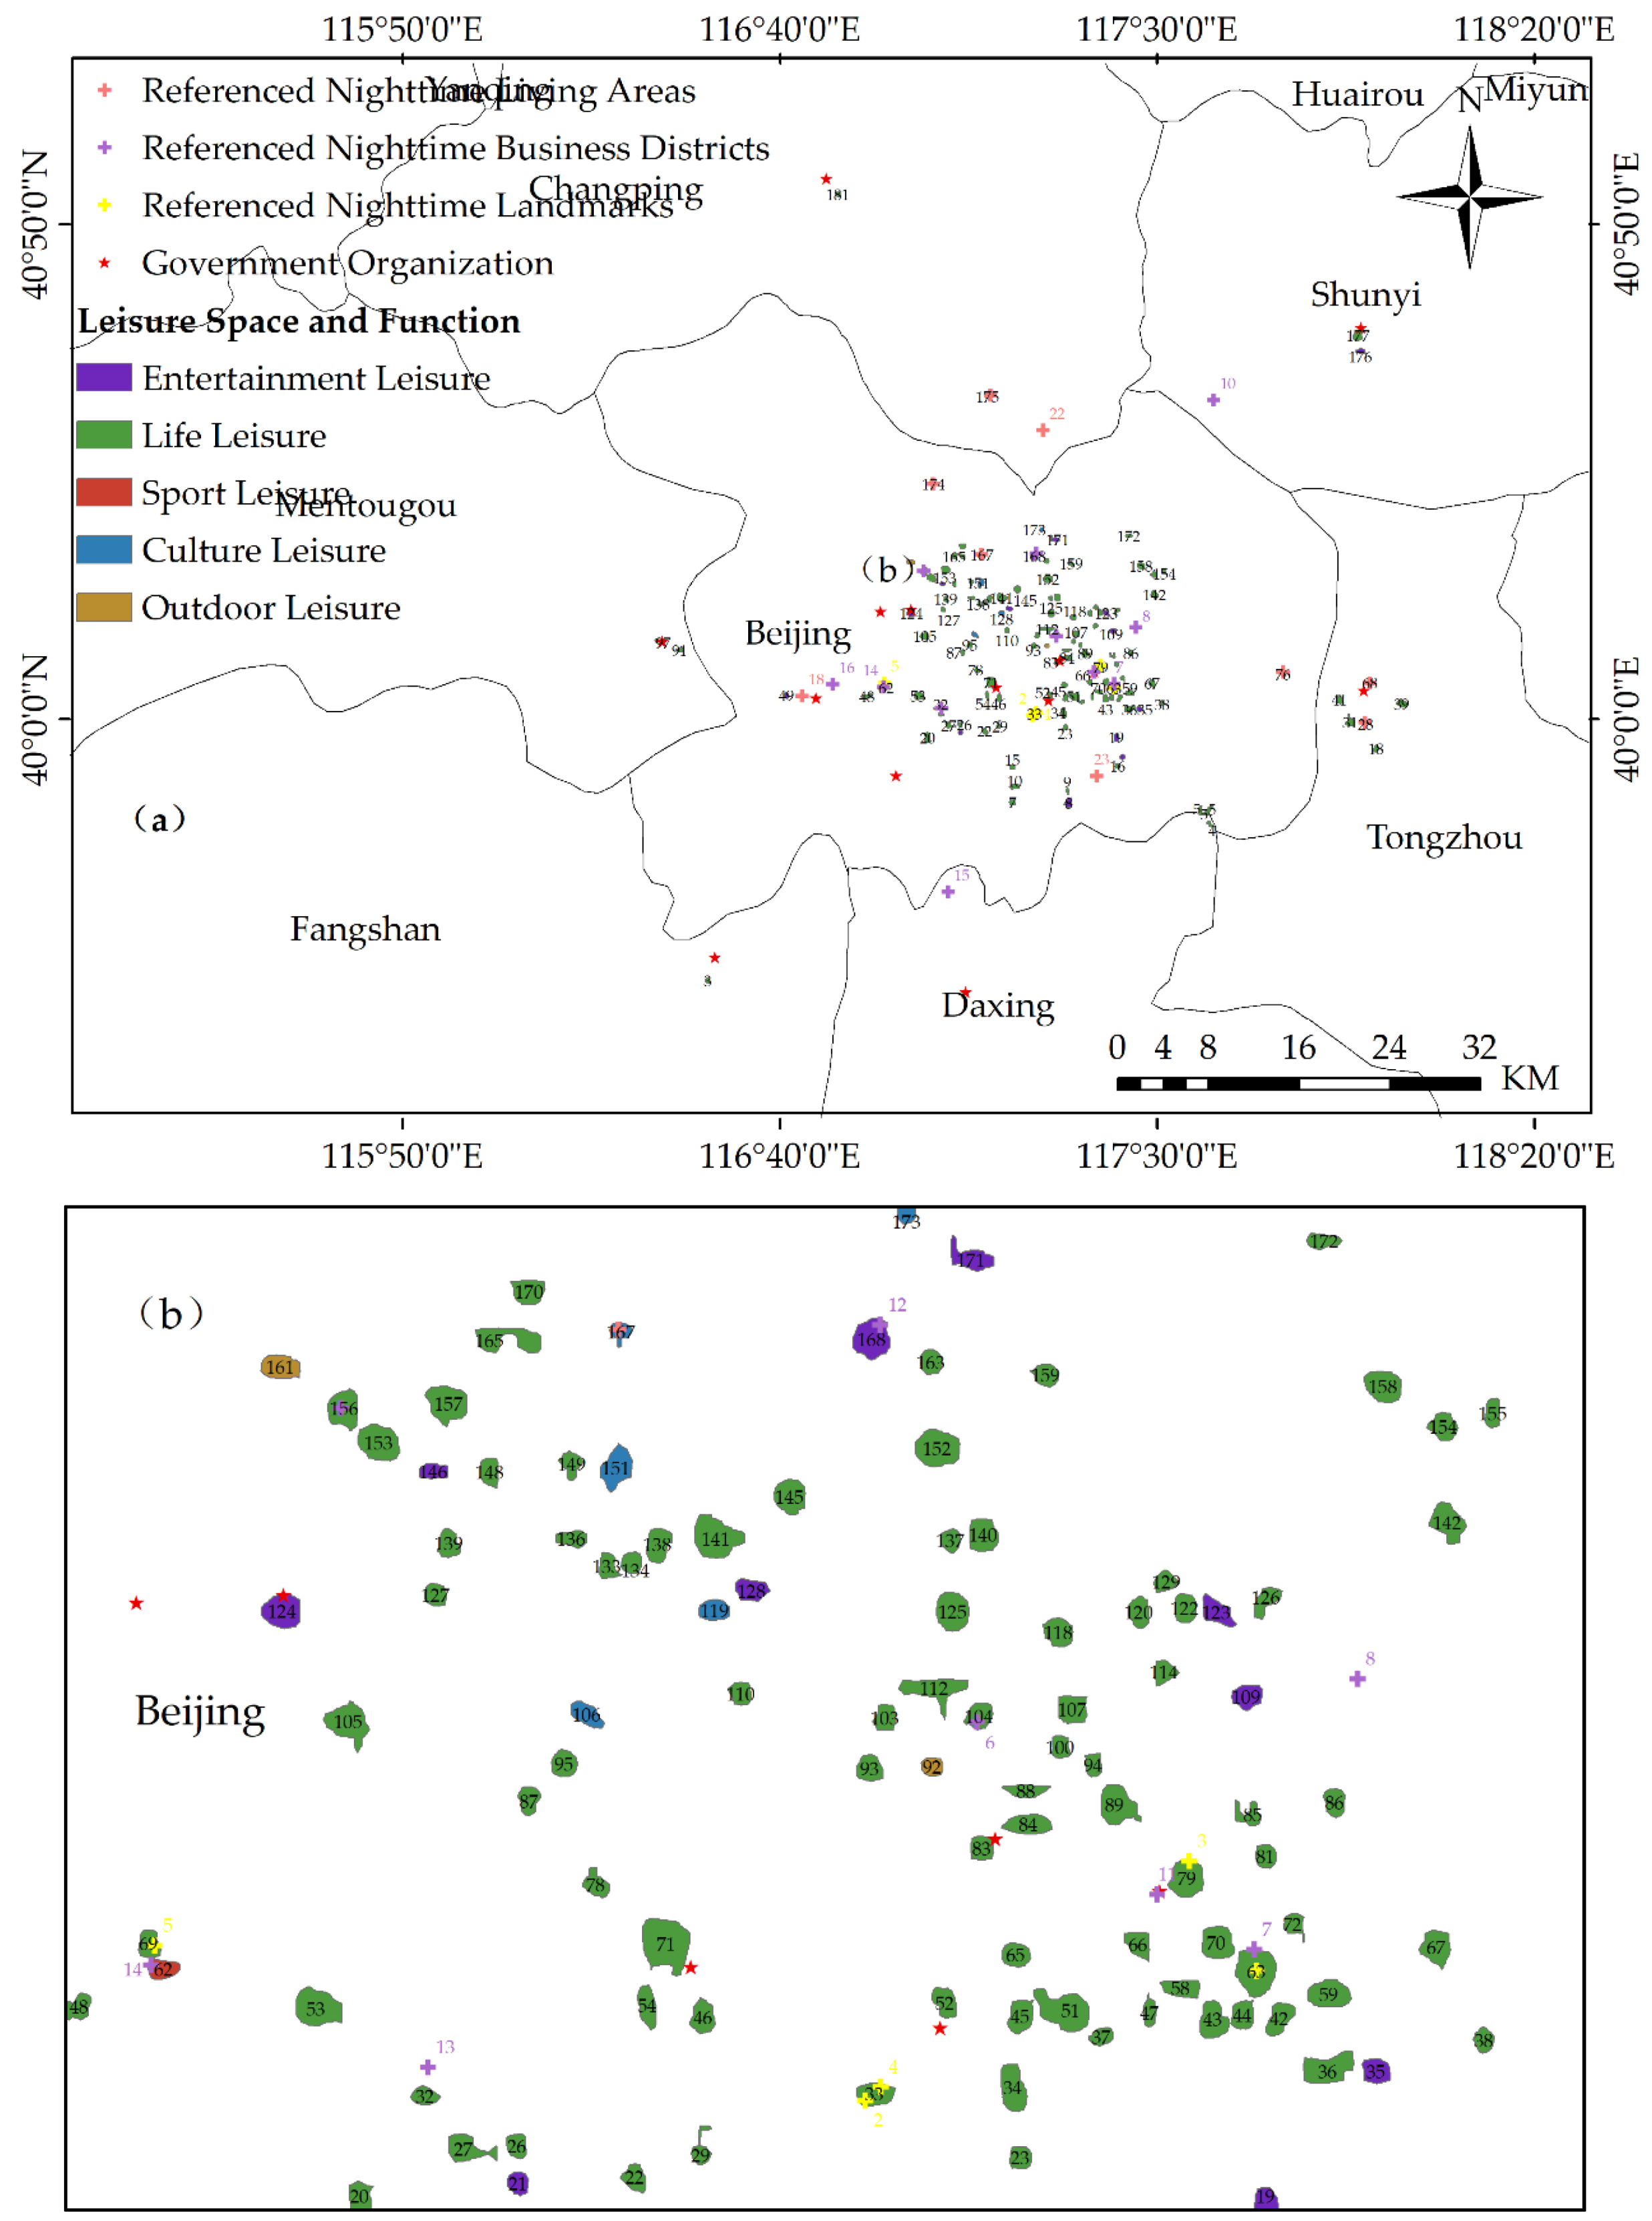
According to the simplified contour map of composite data, Figure 7 depicts the specific geographical locations and scope of these detected UNLSs. This paper deduces 138 leaf nodes, which represent 138 UNLSs. The main area of Beijing has the largest amount of UNLS, accounting for approximately 80% of the total UNLSs. The locations of these UNLSs are associated with Beijing Commercial Street, such as Sanlitun, Wukesong, and Dashilan, etc. Tongzhou has the second largest number of UNLSs, mainly for life leisure activities. Shunyi and Daxing have the third largest number of UNLSs. Fangshan and Yanqing have the fifth largest number of UNLSs. Changping, Huairou, MIyun, Mentougou, and Pinggu, which are located in the suburbs of Beijing, have the fewest UNLSs, most of which are accompanied by government agencies, that is, in these suburbs, nighttime leisure takes place around government agencies.
4.3. Validation of the Identified UNLSs
Since our method can detect the location of each UNLS and their spatial range, our analysis results can be used to evaluate the actual nighttime life development plan of Beijing. The measures in the Further Prospering Night Economy and Promoting Consumption Growth plan issued by the Beijing Municipal Bureau of Commerce are important for assessing the nighttime economic development in Beijing; among these measures, there are important metrics: Nighttime landmarks, nighttime business districts, and nighttime living areas. For the purpose of verification, we manually identified the location of four nighttime landmarks, five nighttime business districts, and eight nighttime living areas (Figure 7), and compared the detected UNLSs with the urban nighttime life circles described in Table 4. All four nighttime landmarks, five out of nine nighttime business districts and eight out of nine nighttime living areas were detected successfully.
4.4. Characteristics of the UNLSs
Table 5 lists the results of the two geometric attributes and four statistical attributes of the 138 UNLSs shown in Figure 7. The total UNLS area in Beijing is 31.08 km2, accounting for 0.2% of the total administrative area of Beijing. The largest UNLS is located in the main urban area, with an area exceeding 0.67 km2, and the smallest UNLS is also located in the main urban area, with an area of only 0.11 km2.
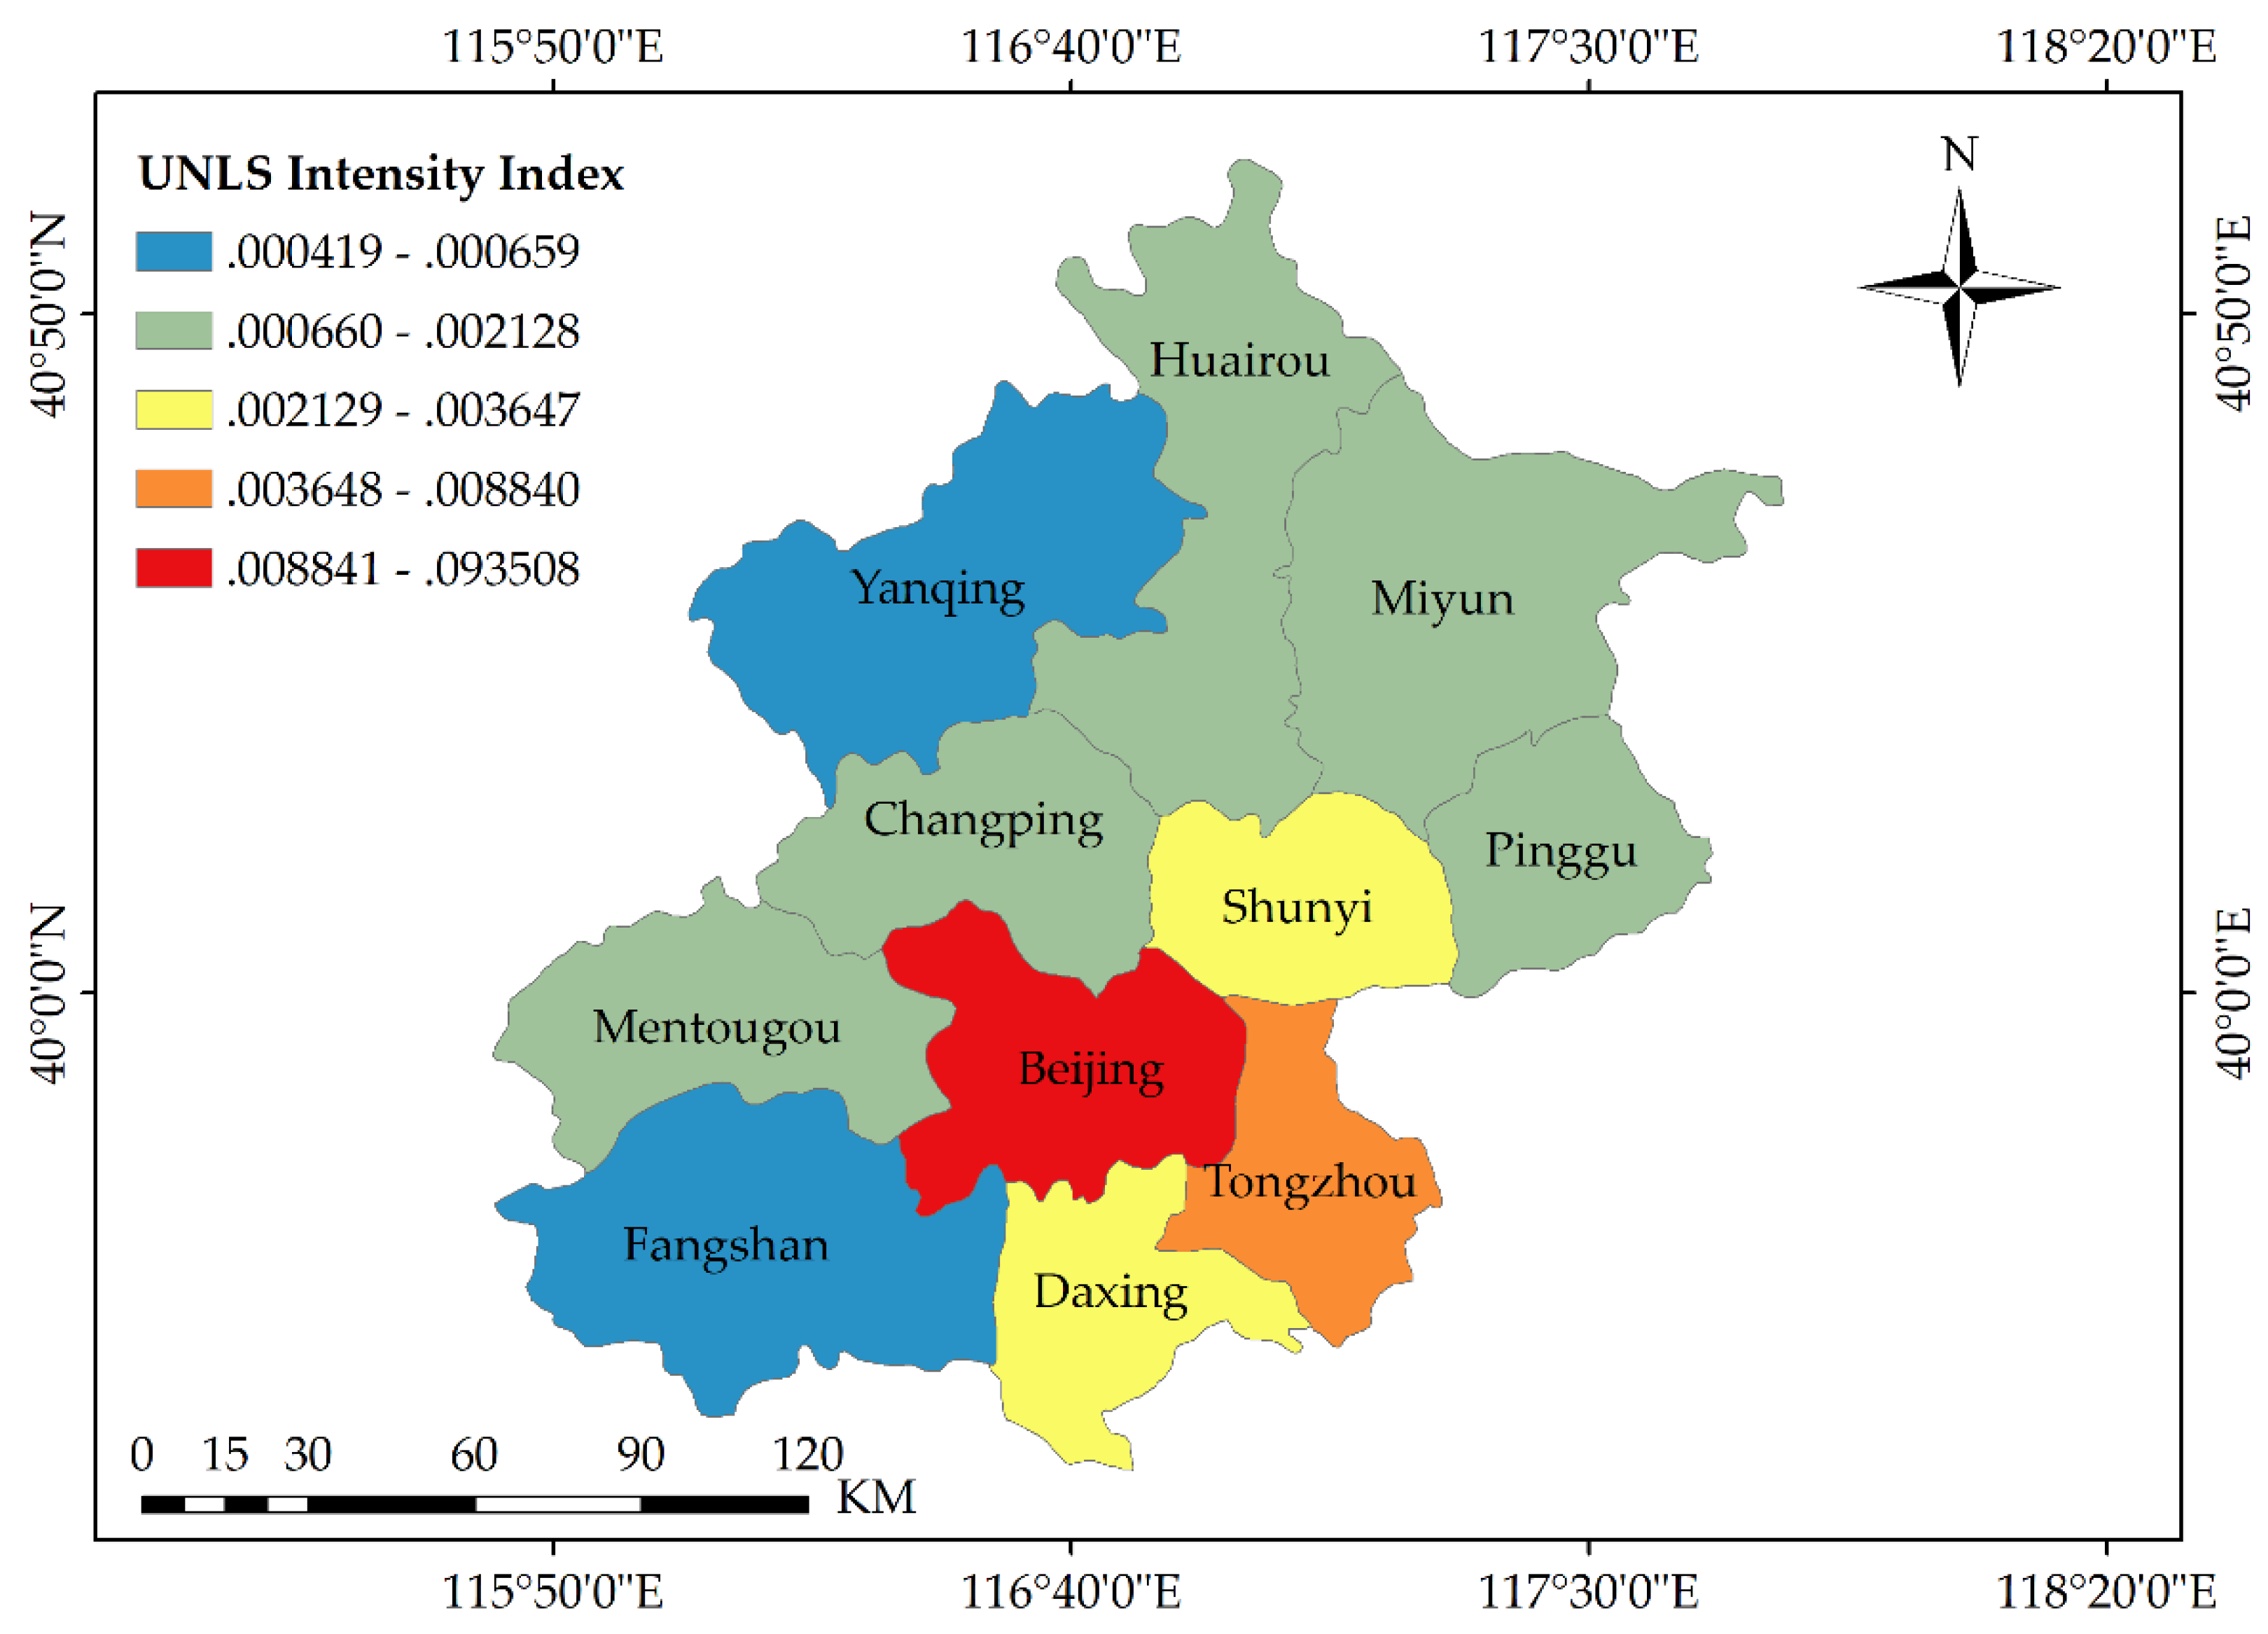
In addition, according to the UNLS distribution in Beijing, we generated a UNLS intensity map of Beijing, as shown in Figure 8; where the intensity index is the ratio of the UNLS area to the total area.
4.5. Uncertainty and Sensitivity Analysis Results
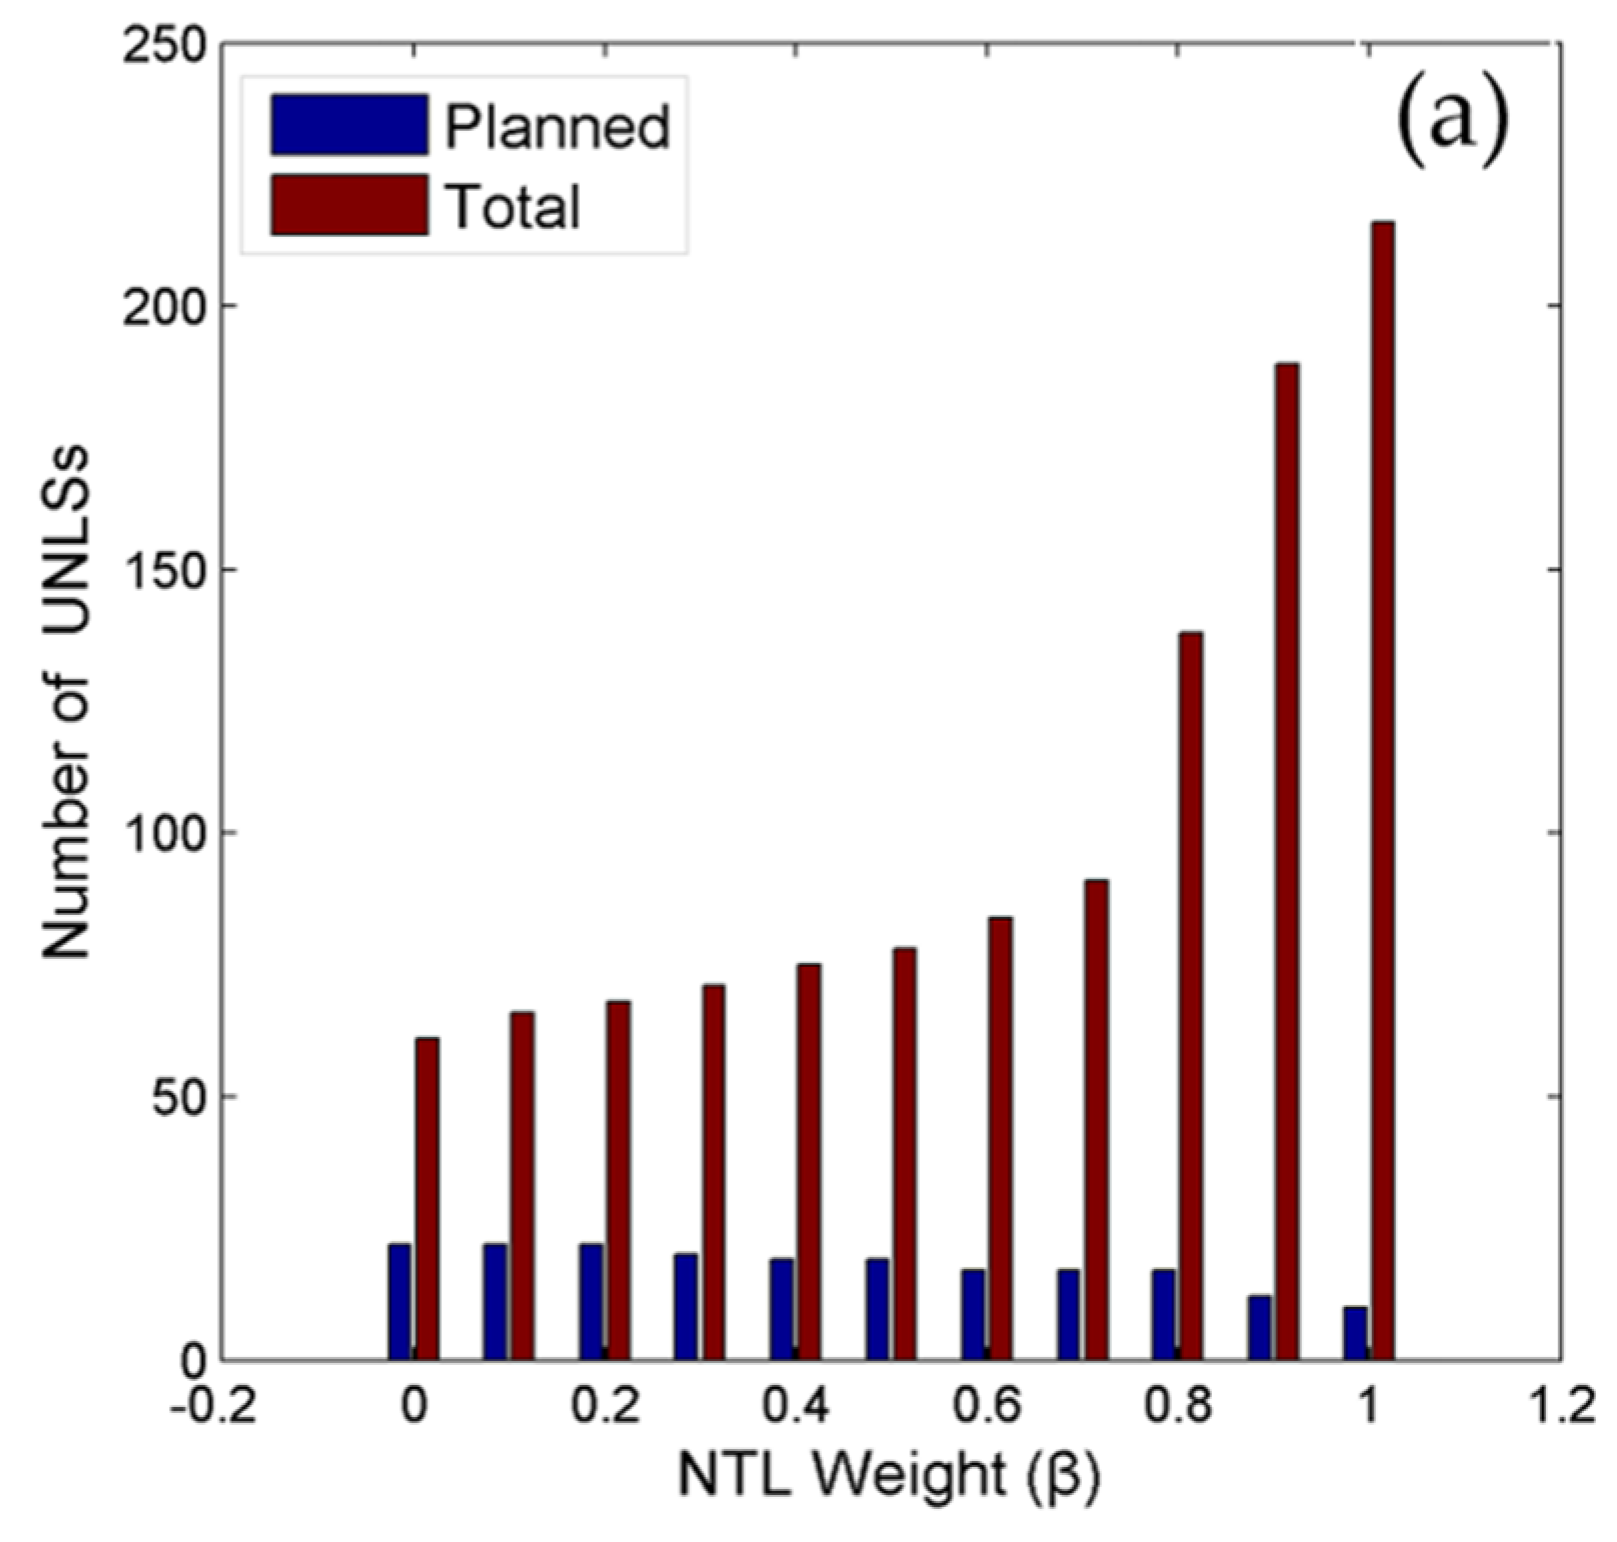
As show in Figure 9a, to verify the impacts of the weights coefficients on the results, the total number of UNLSs in Beijing and the total number of planned UNLSs detected when is between zero and one are counted at 0.1 intervals. The results show that when is relatively small, the total number of UNLSs that can be detected is low, and almost all planned UNLSs can be detected, but there are cases where multiple UNLSs cannot be distinguished. When the value of is relatively large, the total number of UNLSs that can be detected is high, the area of each UNLS is somewhat small, and different UNLSs can be clearly distinguished. In particular, when the value of is 0.8, the total number of detectable UNLSs suddenly increases, but the planned number of UNLSs remains stable. Therefore, we set to 0.8 and the to 0.2.
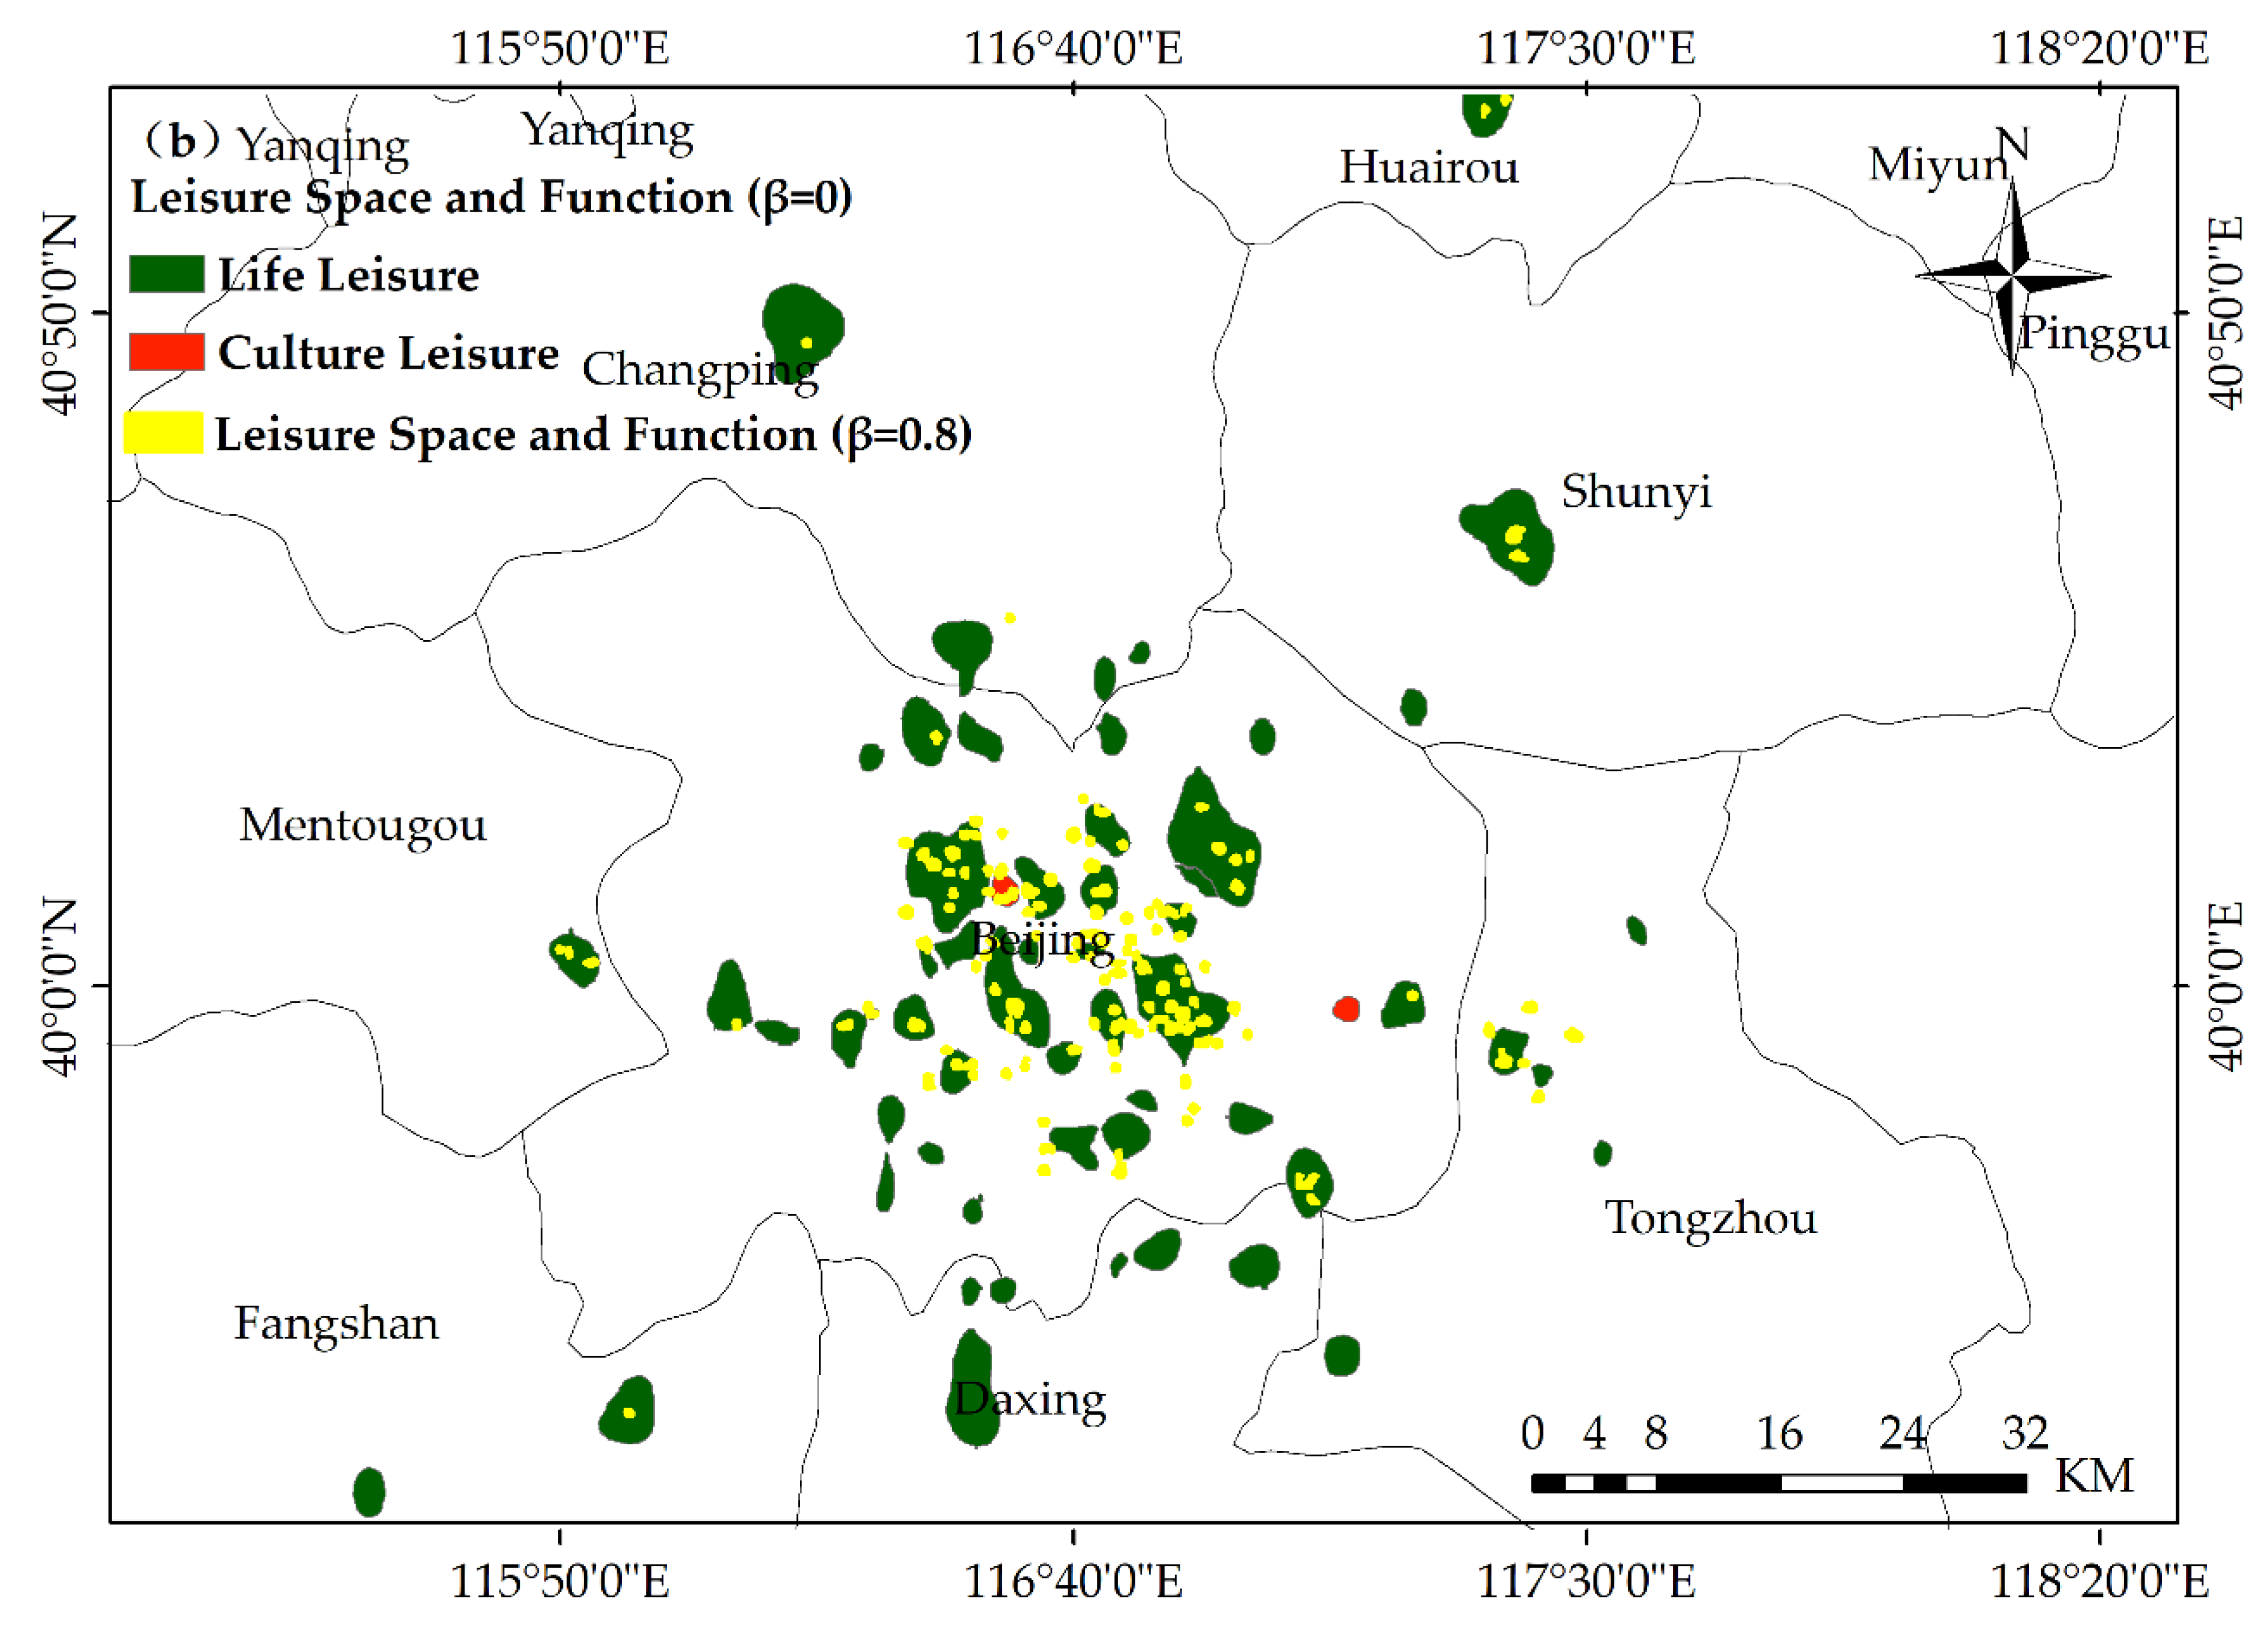
As show in Figure 9b, when , the position of the detected UNLS in Beijing is basically the same as that obtained when . However, when , the area of UNLSs obtained are too large to give the precise distribution. In addition, when , the detected UNLSs are not all open at night.
As shown in Table 6, the UNLS range and locations in the center of Beijing are not sensitive to changes in the basic contour threshold value, partly because the NTL intensities and POI densities of the UNLSs in this area are much higher than those elsewhere in Beijing. Due to the low basic contour threshold value, many small UNLSs outside the Fifth Ring Road can be identified. By comparing the results for basic contour threshold values of four, eight, 12, and 16, we found that at a threshold of four, more UNLSs can be detected in the suburbs, but the average area of 24 additional UNLSs is less than 0.1 km2. When the threshold value is 12, the number of UNLSs and their average area are significantly reduced. When the threshold value is eight, the number of UNLSs is stable, and the average area of UNLS is 0.23 km2. This sensitivity analysis shows that changes in the basic contour only slightly affect the UNLS detection results.
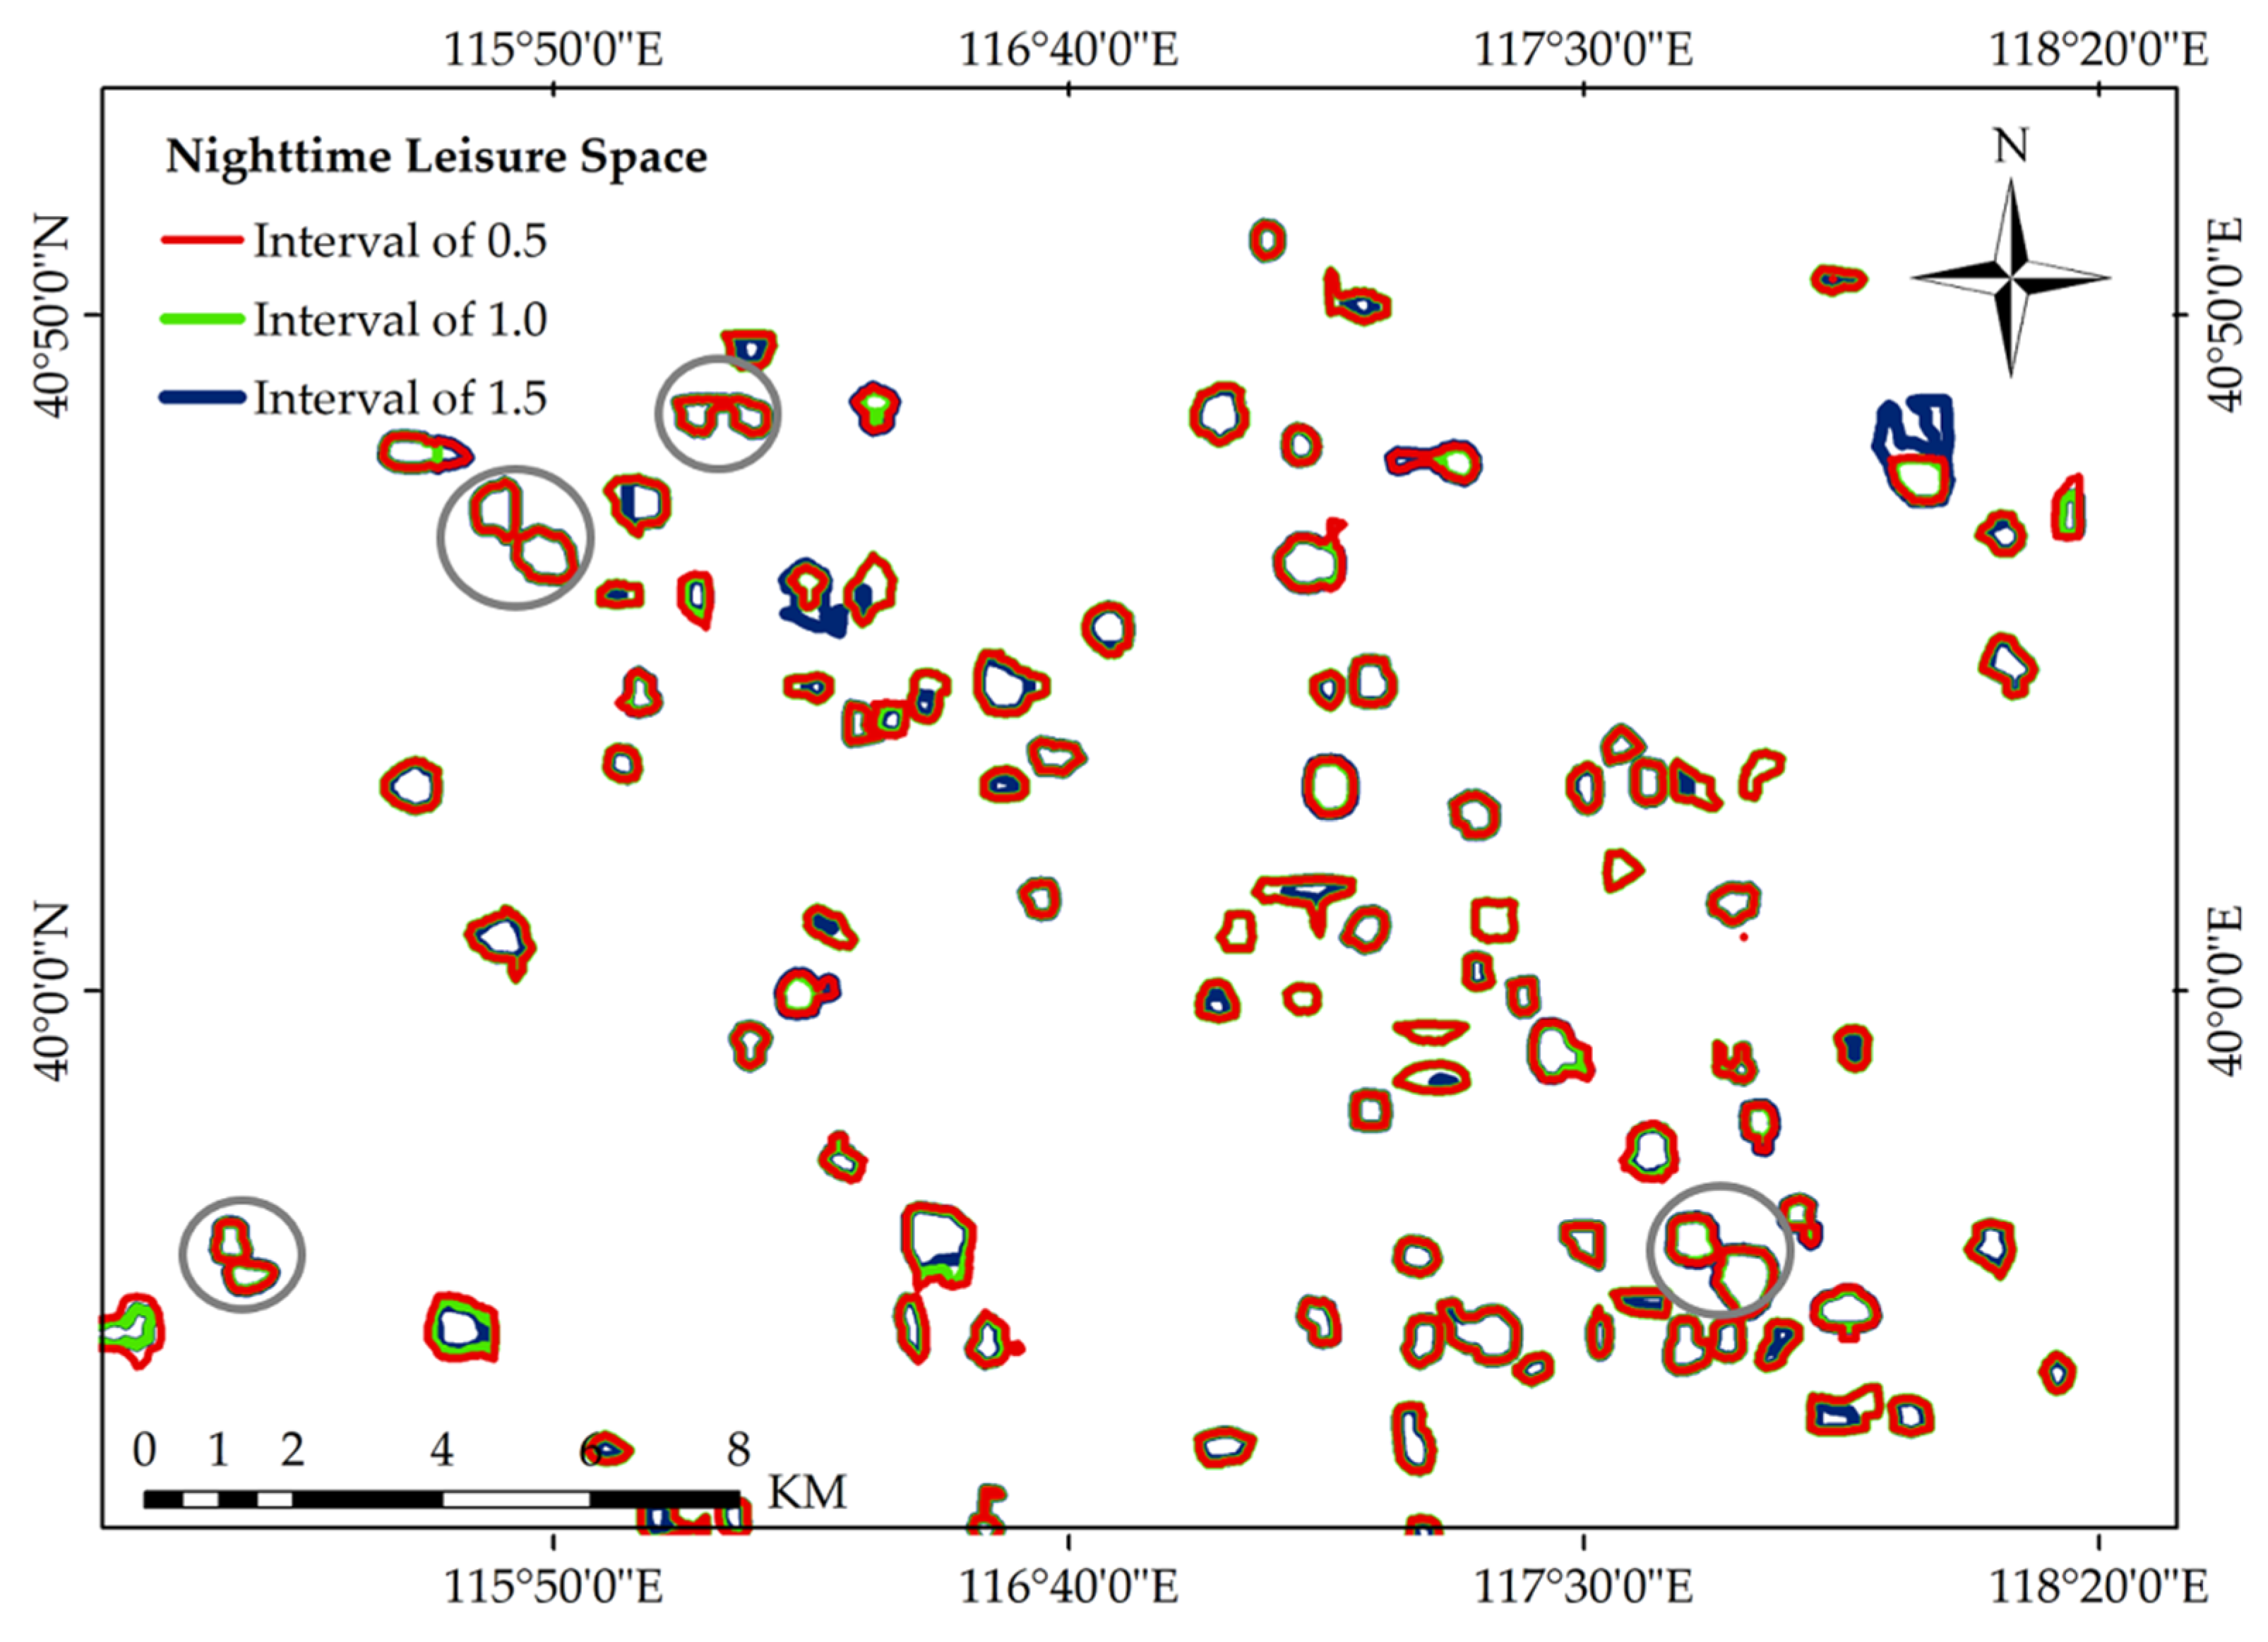
Furthermore, Figure 10 indicates that the result when using a contour interval of one is almost the same as that when using a contour interval of 0.5; that is, the resulting UNLS areas are very similar. Although four additional small UNLSs are detected at a contour interval of 0.5, four small UNLSs were combined into four large UNLSs at a contour interval of one. Therefore, in fact, no additional UNLS is identified. When the contour interval is larger than one, the UNLS area slightly decreases, but the total number of UNLSs remains unchanged. Ultimately, we proposed a contour interval of one. Table 7 indicates a smaller contour interval does not seem to significantly improve the detection results, but the calculation cost greatly increases with a decrease in the contour interval.
Finally, Figure 11 illustrates that when the minimum UNLS area is in the range of 0–0.2 km2, the number of detected UNLSs gradually decreases, but when this parameter is larger than 0.1 km2, the number of UNLSs detected remains the same. This parameter is driven by the specific research area and objectives, and thus should be determined according to the actual situation of the research area.
5. Discussion
In this study, we used NTL images and publicly available social data to identify UNLSs, and we examined the spatial distribution of UNLSs in Beijing. The global UNLS distribution successfully extracted. We deduced the location and morphological and functional attributes of each UNLS from composite data. Available social data can reflect the human activities occurring within a space, especially a UNLS; accordingly, by using POI data, we labeled all detected UNLSs with their functions, as shown in Figure 7. Entertainment and life services clearly occupied a dominant position among the UNLSs. Next, we will discuss the UNLS distribution, and the sensitivity, uncertainty, and drawbacks of the proposed method.
(1) Spatial distribution of the UNLSs in Beijing
From the NTL images and POI data, the distribution, geometric characteristics, and functional attributes of UNLSs were deduced. These characteristics and attributes may be related to the economic functions of the corresponding regions. Business and entertainment play leading roles in the central part of the city. Compared with those in the city center, the nightlife activities in the suburbs are not only small in both quantity and area, but also occur adjacent to government agencies. However, the growth of nighttime economic activities and the expansion of UNLSs in Tongzhou and other places indicate that Tongzhou is likely to become a core of UNLS development in the future.
(2) Superiority of the proposed method
First, our method can not only detect the locations of UNLSs, but can also determine their spatial scope and boundaries; as a result, we were able to quantitatively analyze the morphological characteristics and related indicators of UNLSs. Second, the detected UNLS boundaries are not limited by those of the administrative unit within which the UNLS in located; consequently, the natural form of a UNLS can be reflected. Moreover, the proposed method can determine the nesting level relationship among different UNLSs and is suitable for identifying UNLSs at different scales. Third, we further performed tests using POI data or only UTL data to extract UNLSs. The results with only POI data reveal that because of the large number of POIs, many locations that are not open at night are also considered, and thus, the UNLS area extracted using POI data is too large to tell people exactly where to go at night. However, the area extracted by NTL data alone can be described only as an area with frequent nighttime activities. In other words, not all the areas with frequent nighttime activities are leisure areas; instead, these areas may be important transportation hubs, such as airports. However, when NTL images and POI data are combined, we can identify UNLSs more accurately.
(3) Limitations of the proposed method
Although our approach can generate an UNLS distribution map for a given urban area, there are limitations, including the following. (1) The parameters selected, and linear model selected have uncertainties. The four parameters adopted in our method are based mainly on trial-and-error experiments and empirical knowledge, hence, these parameters may be arbitrary and subjective to a certain degree. In addition, a linear model may not be the best choice for combining two kinds of data. We will further study the data fusion model in subsequent research to obtain an improved model. Furthermore, the qualities of NTL images and POI data are not effectively verified, which may affect the experimental results to a certain extent. (2) Quantifying a UNLS results in a large area. To map in more detail, more quantitative indicators need to be integrated. (3) The socioeconomic factors of UNLSs need to be further analyzed to better reveal how social and spatial relationships dominate nighttime leisure activities.
6. Conclusions
Urban management requires maps of the spatial distribution of UNLSs, but the lack of available data sources poses a challenge to UNLS mapping. In addition, the physical form and function of a UNLS constitute the basis of further investigation. NTL images have the advantages of a large spatial coverage, high temporal resolution, and wide availability, etc. and these advantages enable the dynamic monitoring of UNLSs. POI data, directly reflect human activities, contain rich information on the functions of a space and can significantly complement traditional remote sensing data in the context of UNLS mapping. The physical characteristics derived from composite data and the functional attributes obtained from publicly available data are helpful for describing the utilization of UNLSs in detail. We developed a method to identify UNLSs in a large area and evaluated its effectiveness in Beijing. We successfully identified 138 UNLSs in Beijing, demarcated their boundaries, calculated their areas, and determined the overall UNLS distribution in Beijing. Most of the UNLSs in Beijing are distributed in the center of the city, which may indicate that the suburbanization of Beijing is still in its early stage. As long as there are NTL images and POI data, this method can be used to quickly obtain the UNLS spatial distribution map of any given large area. This is particularly important for developing countries.
In the future, we need to further improve the model, for example, by adopting machine learning to obtain more reasonable parameters to enhance the model accuracy.
Author Contributions
J.L., funding acquisition, project administration; Y.D., methodology, writing—original draft preparation; Y.W., data curation, validation; H.H., conceptualization of this study, supervision; Q.D., software, visualization; F.R., software, visualization. All authors have read and agreed to the published version of the manuscript.
Funding
This study was funded by the National Key Research and Development Plan of China (under project numbers 2017YFB0503601 and 2017YFB0503502).
Acknowledgments
The authors would like to thank the anonymous reviewers and the editor for their constructive comments and suggestions for this paper.
Conflicts of Interest
The authors declare no conflict of interest.
References
- Edginton, C.R.; Chen, P. Leisure as Transformation; Sagamore Publishing: Urbana, IL, USA, 2008. [Google Scholar]
- Michael, J.; Sara, F. Leisure Enhancement; Sagamore Publishing: Urbana, IL, USA, 2012. [Google Scholar]
- Corbusier, L.; Eardley, A. The Athens Charter; Grossman Publishers: New York, NY, USA, 1973. [Google Scholar]
- Gold, J.R. Creating the Charter of Athens: CIAM and the functional city, 1933-43. Town Plan. Rev. 1998, 69, 225. [Google Scholar] [CrossRef]
- Jing, Y.; Liu, Y.; Cai, E.; Liu, Y.; Zhang, Y. Quantifying the spatiality of urban leisure venues in Wuhan, Central China-GIS-based spatial pattern metrics. Sustain. Cities Soc. 2018, 40, 638–647. [Google Scholar] [CrossRef]
- Long, H.; Tang, G.; Li, X.; Heilig, G.K. Socio-economic driving forces of land-use change in Kunshan, the Yangtze River Delta economic area of China. J. Env. Manag. 2007, 83, 351–364. [Google Scholar] [CrossRef]
- Gong, P.; Liang, S.; Carlton, E.J.; Jiang, Q.; Wu, J.; Wang, L.; Remais, J.V. Urbanisation and health in China. Lancet 2012, 379, 843–852. [Google Scholar] [CrossRef]
- Fu, H.; Shao, Z.; Fu, P.; Cheng, Q. The dynamic analysis between urban nighttime economy and urbanization using the DMSP/OLS nighttime light data in China from 1992 to 2012. Remote Sens. 2017, 9, 416. [Google Scholar] [CrossRef] [Green Version]
- Yang, J.J.; Kim, G.T.; Lee, T.J. Parks as leisure spaces for older adults’ daily wellness: a Korean case study. Ann. Leis. Res. 2012, 15, 277–295. [Google Scholar] [CrossRef]
- Song, Y.; Ikeda, T. A Study on Present Shanghai Urban Inhabitants’ Leisure Activities and Sites. J. Asian Arch. Build. Eng. 2005, 4, 301–306. [Google Scholar] [CrossRef] [Green Version]
- Roberts, K. Leisure: The importance of being inconsequential. Leis. Stud. 2011, 30, 5–20. [Google Scholar] [CrossRef]
- Lloyd, K.; Auld, C. Leisure, public space and quality of life in the urban environment. Urban Policy Res. 2003, 21, 339–356. [Google Scholar] [CrossRef]
- Liu, Y.; Jing, Y.; Cai, E.; Cui, J.; Zhang, Y.; Chen, Y. How Leisure Venues Are and Why? A Geospatial Perspective in Wuhan, Central China. Sustainability 2017, 9, 1865. [Google Scholar] [CrossRef] [Green Version]
- Jerrett, M.; Gale, S.; Kontgis, C. Spatial modeling in environmental and public health research. Int. J. Env. Res. Public Health 2010, 7, 1302–1329. [Google Scholar] [CrossRef] [PubMed] [Green Version]
- Kwan, M.P. Beyond space (as we knew it): Toward temporally integrated geographies of segregation, health, and accessibility: Space-time integration in geography and GIScience. Ann. Assoc. Am. Geogr. 2013, 103, 1078–1086. [Google Scholar] [CrossRef]
- Smith, O. Holding back the beers: maintaining ‘youth’identity within the British night-time leisure economy. J. Youth Stud. 2013, 16, 1069–1083. [Google Scholar] [CrossRef]
- Guerrier, Y.; Adib, A. Work at leisure and leisure at work: A study of the emotional labour of tour reps. Hum. Relat. 2003, 56, 1399–1417. [Google Scholar] [CrossRef]
- Cao, Y.; Bai, Z.; Zhou, W.; Ai, G. Gradient analysis of urban construction land expansion in the Chongqing urban area of China. J. Urban Plan. Dev. 2014, 141, 05014009. [Google Scholar] [CrossRef] [Green Version]
- Kim, Y.L. Data-driven approach to characterize urban vitality: how spatiotemporal context dynamically defines Seoul’s nighttime. Int. J. Geogr. Inf. Sci. 2019, 1–22. [Google Scholar] [CrossRef]
- Henderson, K.A. The imperative of leisure justice research. Leis. Sci. 2014, 36, 340–348. [Google Scholar] [CrossRef]
- Stewart, W. Leisure research to enhance social justice. Leis. Sci. 2014, 36, 325–339. [Google Scholar] [CrossRef]
- Xi, L.; Xu, H.; Chen, X.; Chang, L. Potential of NPP-VIIRS Nighttime Light Imagery for Modeling the Regional Economy of China. Remote Sens. 2013, 5, 3057–3081. [Google Scholar]
- van Weerdenburg, D.; Scheider, S.; Adams, B.; Spierings, B.; van der Zee, E. Where to go and what to do: Extracting leisure activity potentials from Web data on urban space. Comput. Env. Urban Syst. 2019, 73, 143–156. [Google Scholar] [CrossRef]
- Chen, X.; Nordhaus, W.D. Using luminosity data as a proxy for economic statistics. Proc. Natl. Acad. Sci. USA 2011, 108, 8589–8594. [Google Scholar] [CrossRef] [PubMed] [Green Version]
- Ballatore, A. The search for places as emergent aggregates. In Spatial Search-Specialist Meeting; Center for Spatial Studies, University of California Santa Barbara: Santa Barbara, CA, USA, 2014. [Google Scholar]
- Ma, T.; Zhou, Y.; Wang, Y.; Zhou, C.; Haynie, S.; Xu, T. Diverse relationships between Suomi-NPP VIIRS night-time light and multi-scale socioeconomic activity. Remote Sens. Lett. 2014, 5, 652–661. [Google Scholar] [CrossRef]
- van der Zee, E.; van der Borg, J.; Vanneste, D. The destination triangle: Toward relational management. In Knowledge Transfer to and within Tourism: Academic, Industry and Government Bridges; Emerald Publishing: West Yorkshire, UK, 2017; pp. 167–188. [Google Scholar]
- Ngesan, M.R.; Karim, H.A.; Zubir, S.S.; Ahmad, P. Urban Community Perception on Nighttime Leisure Activities in Improving Public Park Design. Procedia Soc. Behav. Sci. 2013, 105, 619–631. [Google Scholar] [CrossRef] [Green Version]
- Held, N. Comfortable and safe spaces? Gender, sexuality and ‘race’ in night-time leisure spaces. Emot. Space Soc. 2015, 14, 33–42. [Google Scholar] [CrossRef]
- Marine-Roig, E.; Clavé, S.A. Tourism analytics with massive user-generated content: A case study of Barcelona. J. Destin. Mark. Manag. 2015, 4, 162–172. [Google Scholar] [CrossRef]
- Stevenson, D. The arts and entertainment: Situating leisure in the creative economy. In A Handbook of Leisure Studies; Springer: London, UK, 2006; pp. 354–362. [Google Scholar]
- Liu, H.; Da, S. The relationships between leisure and happiness—A graphic elicitation method. Leis. Stud. 2019, 1–20. [Google Scholar] [CrossRef]
- Jackett, M.; Frith, W. Quantifying the impact of road lighting on road safety—A New Zealand Study. IATSS Res. 2013, 36, 139–145. [Google Scholar] [CrossRef] [Green Version]
- Donnelly, P.G. Newman, Oscar: Defensible Space Theory. Available online: https://ecommons.udayton.edu/soc_fac_pub/30/ (accessed on 23 May 2016).
- Brands, J.; Schwanen, T.; Van Aalst, I. Fear of crime and affective ambiguities in the night-time economy. Urban Stud. 2015, 52, 439–455. [Google Scholar] [CrossRef] [Green Version]
- Mouratidis, K. Built environment and leisure satisfaction: The role of commute time, social interaction, and active travel. J. Transp. Geogr. 2019, 80, 102491. [Google Scholar] [CrossRef]
- Crawford, A.; Flint, J. Urban Safety, Anti-Social Behaviour and the Night-Time Economy; Sage Publications: London, UK, 2009. [Google Scholar]
- Ngesan, M.R.; Karim, H.A. Night time social behavior in urban outdoor spaces of Shah Alam. Procedia-Soc. Behav. Sci. 2012, 50, 959–968. [Google Scholar] [CrossRef] [Green Version]
- Hsieh, A.T.; Chang, J. Shopping and tourist night markets in Taiwan. Tour. Manag. 2006, 27, 138–145. [Google Scholar] [CrossRef]
- Ngesan, M.R.; Zubir, S.S. Place identity of nighttime urban public park in Shah Alam and Putrajaya. Procedia-Soc. Behav. Sci. 2015, 170, 452–462. [Google Scholar] [CrossRef] [Green Version]
- Jenkins, J.M.; Young, T. Urban Development and the Leisure Dilemma: A case study of leisure and recreation in urban residential estates in the Lower Hunter, New South Wales. Ann. Leis. Res. 2008, 11, 77–100. [Google Scholar] [CrossRef]
- Guo, Q.; Lin, M.; Meng, J.H.; Zhao, J.L. The development of urban night tourism based on the nightscape lighting projects—A Case Study of Guangzhou. Energy Procedia 2011, 5, 477–481. [Google Scholar] [CrossRef] [Green Version]
- Elvidge, C.D.; Baugh, K.E.; Kihn, E.A.; Kroehl, H.W.; Davis, E.R.; Davis, C.W. Relation between satellite observed visible-near infrared emissions, population, economic activity and electric power consumption. Int. J. Remote Sens. 1997, 18, 1373–1379. [Google Scholar] [CrossRef]
- Keola, S.; Andersson, M.; Hall, O. Monitoring Economic Development from Space: Using Nighttime Light and Land Cover Data to Measure Economic Growth. World Dev. 2015, 66, 322–334. [Google Scholar] [CrossRef]
- Zhuo, L.; Ichinose, T.; Zheng, J.; Chen, J.; Shi, P.J.; Li, X. Modelling the population density of China at the pixel level based on DMSP/OLS non-radiance-calibrated night-time light images. Int. J. Remote Sens. 2009, 30, 1003–1018. [Google Scholar] [CrossRef]
- Amaral, S.; Monteiro, A.M.; Câmara, G.; Quintanilha, J.A. DMSP/OLS night-time light imagery for urban population estimates in the Brazilian Amazon. Int. J. Remote Sens. 2006, 27, 855–870. [Google Scholar] [CrossRef]
- Zhou, Y.; Smith, S.J.; Elvidge, C.D.; Zhao, K.; Thomson, A.; Imhoff, M. A cluster-based method to map urban area from DMSP/OLS nightlights. Remote Sens. Environ. 2014, 147, 173–185. [Google Scholar] [CrossRef]
- Small, C.; Pozzi, F.; Elvidge, C.D. Spatial analysis of global urban extent from DMSP-OLS night lights. Remote Sens. Environ. 2005, 96, 277–291. [Google Scholar] [CrossRef]
- Doll, C.N.; Pachauri, S. Estimating rural populations without access to electricity in developing countries through night-time light satellite imagery. Energy Policy 2010, 38, 5661–5670. [Google Scholar] [CrossRef]
- Letu, H.; Hara, M.; Yagi, H.; Naoki, K.; Tana, G.; Nishio, F.; Shuhei, O. Estimating energy consumption from night-time DMPS/OLS imagery after correcting for saturation effects. Int. J. Remote Sens. 2010, 31, 4443–4458. [Google Scholar] [CrossRef]
- Davies, T.W.; Bennie, J.; Inger, R.; De Ibarra, N.H.; Gaston, K.J. Artificial light pollution: are shifting spectral signatures changing the balance of species interactions? Glob. Chang. Biol. 2013, 19, 1417–1423. [Google Scholar] [CrossRef] [PubMed] [Green Version]
- Falchi, F.; Cinzano, P.; Duriscoe, D.; Kyba, C.C.; Elvidge, C.D.; Baugh, K.; Portnov, B.A.; Rybnikova, N.A.; Furgoni, R. The new world atlas of artificial night sky brightness. Sci. Adv. 2016, 2, e1600377. [Google Scholar] [CrossRef] [Green Version]
- Zhao, N.; Samson, E.L. Estimation of virtual water contained in international trade products using nighttime imagery. Int. J. Appl. Earth Obs. Geoinf. 2012, 18, 243–250. [Google Scholar] [CrossRef]
- Yang, X.; Ye, T.; Zhao, N.; Chen, Q.; Yue, W.; Qi, J.; Zeng, B.; Jia, P. Population Mapping with Multisensor Remote Sensing Images and Point-Of-Interest Data. Remote Sens. 2019, 11, 574. [Google Scholar] [CrossRef] [Green Version]
- Hu, T.; Yang, J.; Li, X.; Peng, G. Mapping Urban Land Use by Using Landsat Images and Open Social Data. Remote Sens. 2016, 8, 151. [Google Scholar] [CrossRef]
- Chen, W.; Huang, H.; Dong, J.; Zhang, Y.; Yang, Z. Social functional mapping of urban green space using remote sensing and social sensing data. ISPRS J. Photogramm. Remote Sens. 2018, 146, 436–452. [Google Scholar] [CrossRef]
- Liu, Y.; Liu, X.; Gao, S.; Gong, L.; Kang, C.; Zhi, Y.; Chi, G.; Shi, L. Social sensing: A new approach to understanding our socioeconomic environments. Ann. Assoc. Am. Geogr. 2015, 105, 512–530. [Google Scholar] [CrossRef]
- Levin, N. The impact of seasonal changes on observed nighttime brightness from 2014 to 2015 monthly VIIRS DNB composites. Remote Sens. Environ. 2017, 193, 150–164. [Google Scholar] [CrossRef]
- Levin, N.; Johansen, K.; Hacker, J.M.; Phinn, S. A new source for high spatial resolution night time images—The EROS-B commercial satellite. Remote Sens. Environ. 2014, 149, 1–12. [Google Scholar] [CrossRef]
- Jiang, W.; He, G.; Long, T.; Guo, H.; Yin, R.; Leng, W.; Liu, H.; Wang, G. Potentiality of using Luojia 1-01 nighttime light imagery to investigate artificial light pollution. Sensors 2018, 18, 2900. [Google Scholar] [CrossRef] [PubMed] [Green Version]
- Yuan, J.; Zheng, Y.; Xie, X. Discovering regions of different functions in a city using human mobility and POIs. In Proceedings of the 18th ACM SIGKDD International Conference on Knowledge Discovery and Data Mining, Beijing, China, 12–16 August 2012; pp. 186–194. [Google Scholar]
- Deveaux, R.D. Applied smoothing techniques for data analysis. Technometrics 1999, 41, 263. [Google Scholar] [CrossRef]
- Botev, Z.I.; Grotowski, J.F.; Kroese, D.P. Kernel density estimation via diffusion. Ann. Stat. 2010, 38, 2916–2957. [Google Scholar] [CrossRef] [Green Version]
- Silverman, B.W. Density Estimation for Statistics and Data Analysis; Routledge: London, UK, 2018. [Google Scholar]
- Zhao, P.; Kwan, M.P.; Qin, K. Uncovering the spatiotemporal patterns of CO2 emissions by taxis based on Individuals’ daily travel. J. Transp. Geogr. 2017, 62, 122–135. [Google Scholar] [CrossRef]
- Chen, Z.; Yu, B.; Song, W.; Liu, H.; Wu, Q.; Shi, K.; Wu, J. A new approach for detecting urban centers and their spatial structure with nighttime light remote sensing. IEEE Trans. Geosci. Remote Sens. 2017, 55, 6305–6319. [Google Scholar] [CrossRef]
- Deng, Y.; Liu, J.; Liu, Y.; Luo, A. Detecting Urban Polycentric Structure from POI Data. ISPRS Int. J. Geo-Inf. 2019, 8, 283. [Google Scholar] [CrossRef] [Green Version]
- Wu, Q.; Liu, H.; Wang, S.; Yu, B.; Beck, R.; Hinkel, K. A localized contour tree method for deriving geometric and topological properties of complex surface depressions based on high-resolution topographical data. Int. J. Geogr. Inf. Sci. 2015, 29, 2041–2060. [Google Scholar] [CrossRef]
- Guilbert, E. Multi-level representation of terrain features on a contour map. GeoInformatica 2013, 17, 301–324. [Google Scholar] [CrossRef] [Green Version]
- Taubenböck, H.; Standfuß, I.; Wurm, M.; Krehl, A.; Siedentop, S. Measuring morphological polycentricity-A comparative analysis of urban mass concentrations using remote sensing data. Comput. Environ. Urban Syst. 2017, 64, 42–56. [Google Scholar] [CrossRef]
- Samuel, N. Leisure participation and time-use surveys: France. In Free Time and Leisure Participation: International Perspectives; CABI Publishing: Wallingford, UK, 2005; pp. 75–100. [Google Scholar]
Figure 1.
Geographical location of Beijing, China.

Figure 2.
(a) Luojia-1 nighttime light (NTL) intensity map of Beijing. (b) Three-dimensional (3D) view of the NTL peaks in the urban core area.
Figure 2.
(a) Luojia-1 nighttime light (NTL) intensity map of Beijing. (b) Three-dimensional (3D) view of the NTL peaks in the urban core area.

Figure 3.
Kernel density map of the first principal component image.

Figure 4.
Flowchart of the proposed workflow for mapping urban nighttime leisure spaces (UNLSs) in Beijing, China.
Figure 4.
Flowchart of the proposed workflow for mapping urban nighttime leisure spaces (UNLSs) in Beijing, China.

Figure 5.
Localized contour tree generation diagrams. (a) Contour map. (b) Original contour tree. (c) Simplified contour tree. (d) Leaf nodes.
Figure 5.
Localized contour tree generation diagrams. (a) Contour map. (b) Original contour tree. (c) Simplified contour tree. (d) Leaf nodes.

Figure 6.
(a) Contour map of Beijing. (b) Zhongguancun region and (c) Jianguomen region are enlarged to show the details.
Figure 6.
(a) Contour map of Beijing. (b) Zhongguancun region and (c) Jianguomen region are enlarged to show the details.

Figure 7.
(a) Distribution of urban nighttime leisure spaces (UNLSs) in Beijing. (b) The main urban area is enlarged to show the details.
Figure 7.
(a) Distribution of urban nighttime leisure spaces (UNLSs) in Beijing. (b) The main urban area is enlarged to show the details.

Figure 8.
Intensity map of the UNLSs in Beijing.

Figure 9.
(a) Sensitivity of the detected UNLSs to the weight coefficient of . (b) Distribution of the UNLSs in Beijing when .
Figure 9.
(a) Sensitivity of the detected UNLSs to the weight coefficient of . (b) Distribution of the UNLSs in Beijing when .


Figure 10.
Sensitivity of the detected UNLS to the contour interval value.

Figure 11.
Sensitivity of the detected UNLS to the minimum area parameter.


Table 1.
The count and the bandwidth of each category point of interest (POI) in kernel density estimation.
Table 1.
The count and the bandwidth of each category point of interest (POI) in kernel density estimation.
| POI Category | POI Count | Bandwidth |
|---|---|---|
| Recreation and Entertainment | 20,627 | 2287.16 1 |
| Daily Life Service | 26,227 | 1039.75 |
| Dining Service | 33,549 | 1614.73 |
| Shopping | 57,519 | 2107.31 |
| Hotel | 6441 | 2642.06 |
| Beauty Parlor | 3905 | 120.48 |
| Sports Facility and Gym | 1062 | 3694.68 |
| Education and Training | 14,159 | 2476.87 |
| Cultural Media | 1325 | 3959.24 |
| Natural Features | 90 | 2204.38 |
| Tourist Attraction | 5350 | 3105.63 |
1 All values in the table are rounded to two decimal places.
Table 2.
Reclassification of the POIs.
| ID | Leisure Activity Category | Baidu Categories |
|---|---|---|
| 1 | Entertainment | Recreation and Entertainment |
| 2 | Life | Daily Life Service, Dining Service, Shopping, Hotel, Beauty Parlor |
| 3 | Sport | Sports Facility and Gym |
| 4 | Culture | Cultural Media, Education and Training |
| 5 | Outdoor | Natural Features, Tourist Attraction |
| 6 | Nonleisure | Residential Area, Medical and Health Care Service, Finance, Transportation, Governmental Organization, Entrance, Business Company, Automobile Service |
Table 3.
Definitions of the geometric and statistical attributes.
| Attribute | Definition | Further Information |
|---|---|---|
| District (D) | District-Level Administrative Region | Main urban area, Changping, Daxing, Fangshan, Huairou, Mentougou, Miyun, Pinggu, Shunyi, Tongzhou, Yanqing |
| Total Number (TN) | The number of leisure spaces in each district | pcs |
| Total Circumference (TP) | Total circumference of leisure spaces | km |
| Total Area (TA) | Total area of leisure spaces | km2 |
| Total Contour (TC) | Total contour of leisure spaces | |
| Maximum Area (MaxA) | The area of the largest leisure space in each district | km2 |
| Max Contour (MaxC) | The contour of the largest leisure space in each district |
Table 4.
Comparison table between the identified UNLSs and planned nighttime life circles.
| ID | Name | Project | Identified by Our Method | ID in Figure 7 | Supplementary Information |
|---|---|---|---|---|---|
| 1 | Guomao | NL 2 | √ | #63 1 | |
| 2/4 | Qianmen and Dashilan | NL | √ | #33 | |
| 3 | Sanlitun | NL | √ | #79 | |
| 5 | Wukesong | NL | √ | #69 | |
| 6 | Guijie | NBD | √ | #104 | |
| 7 | Shimaotianjie | NBD | √ | #63 | |
| 8/14 | Lansegangwan | NBD | √ | #62 | ID #8 is the blue harbor in Chaoyang District, which is identified. ID #14 is blue harbor in Wukesong, Haidian District, which is not identified. |
| 9/13 | Shibaojie | NBD | √ | #56 | ID #9 is Shibaojie in Zhongguancun, which is identified. ID #13 is Shibaojie in Beijing West Railway Station, which is not included. |
| 10 | Zhongliang | NBD | |||
| 11 | Heshenghui | NBD | |||
| 12 | Olympic Park | NBD | √ | #168 | |
| 15 | Huiju | NBD | |||
| 16 | Langyuan | NBD | |||
| 17 | Shangdi | NLA | #174 | ||
| 18 | Lugu | NLA | √ | ||
| 19 | Liyuan | NLA | √ | #28 | |
| 20 | Yongshun | NLA | √ | #68 | |
| 21 | Wudaokou | NLA | √ | #167 | |
| 22 | Tiantongyuan | NLA | √ | ||
| 23 | Fangzhuang | NLA | √ | ||
| 24 | Changying | NLA | √ | #76 | |
| 25 | Huilongguan | NLA | √ | #175 |
1 # indicates that the nighttime leisure space is detected in our method. 2 NL, NBD, and NLA, respectively represent the nighttime landmarks, the nighttime business districts, and the nighttime living areas, that is, in the measures of Beijing in the Further Prospering Night Economy and Promoting Consumption Growth plan.
Table 5.
Summary of the geometric and statistical attributes of the UNLSs.
| District | Leisure Space ID | TN | TC | TA | TC | MaxA | MaxC |
|---|---|---|---|---|---|---|---|
| Main urban area | #52#7#8#9#10#15#16#172#19#20#21 #22#23#26#27#29#3#32#33#34#35# 36#37#38#42#43#45#46#47#48#49# 51#52#53#54#58#59#62#63#65#66# 67#69#70#71#72#76#78#79#81#83# 84#85#86#87#88#89#92#93#94#95# 100#103#104#105#106#107#109#11 0#112#114#118#119#120#1223123# 124#125#126#127#128#129#133#13 4#136#137#138#139#140#141#142# #145#146#148#149#151#152#153#1 54#155#156#157#158#159#161#163 #165#167#168#170#171#172#173#1 74 | 114 | 216.87 1 | 25.45 | 2429 | 0.67 | 41 |
| Changping | #175#181 | 2 | 2.70 | 0.27 | 24 | 0.15 | 16 |
| Daxing | #4 #5 2 | 2 | 4.29 | 0.37 | 27 | 0.22 | 15 |
| Fangshan | #3 | 1 | 1.45 | 0.15 | 15 | 0.15 | 15 |
| Huairou | #187#188#189 | 3 | 5.46 | 0.44 | 52 | 0.17 | 21 |
| Mentougou | #91#97#101 | 3 | 4.56 | 0.41 | 29 | 0.20 | 10 |
| Miyun | #190#192#193 | 3 | 5.23 | 0.55 | 66 | 0.29 | 26 |
| Pinggu | #179#180 | 2 | 3.47 | 0.32 | 38 | 0.21 | 19 |
| Shunyi | #176#177 | 2 | 6.18 | 0.89 | 28 | 0.62 | 17 |
| Tongzhou | #18#28#31#39#41#68 | 6 | 14.29 | 1.86 | 61 | 0.47 | 13 |
| Yanqing | #197 | 1 | 2.29 | 0.37 | 17 | 0.38 | 17 |
| Sum | 138 | 266.79 | 31.08 | 2786 | 3.53 | 210 |
1 All values in the table are rounded to two decimal places. 2 Number #5 traverses two regions, the main urban area and Daxing.
Table 6.
Impact of the basic contour threshold value on the detection of UNLSs.
| Threshold | Number of UNLSs | Total Area of UNLSs |
|---|---|---|
| 4 | 162 | 32.42 |
| 8 | 138 | 31.08 |
| 12 | 125 | 28.31 |
| 16 | 97 | 21.24 |
Table 7.
Impact of the contour interval on the detection of UNLSs.
| Contour Interval | Number of UNLSs | Total Area of UNLSs |
|---|---|---|
| 0.5 | 142 | 31.62 |
| 1.0 | 138 | 31.08 |
| 1.5 | 138 | 30.73 |
© 2020 by the authors. Licensee MDPI, Basel, Switzerland. This article is an open access article distributed under the terms and conditions of the Creative Commons Attribution (CC BY) license (http://creativecommons.org/licenses/by/4.0/).
Share and Cite
MDPI and ACS Style
Liu, J.; Deng, Y.; Wang, Y.; Huang, H.; Du, Q.; Ren, F. Urban Nighttime Leisure Space Mapping with Nighttime Light Images and POI Data. Remote Sens. 2020, 12, 541. https://0-doi-org.brum.beds.ac.uk/10.3390/rs12030541
AMA Style
Liu J, Deng Y, Wang Y, Huang H, Du Q, Ren F. Urban Nighttime Leisure Space Mapping with Nighttime Light Images and POI Data. Remote Sensing. 2020; 12(3):541. https://0-doi-org.brum.beds.ac.uk/10.3390/rs12030541
Chicago/Turabian StyleLiu, Jiping, Yue Deng, Yong Wang, Haosheng Huang, Qingyun Du, and Fu Ren. 2020. "Urban Nighttime Leisure Space Mapping with Nighttime Light Images and POI Data" Remote Sensing 12, no. 3: 541. https://0-doi-org.brum.beds.ac.uk/10.3390/rs12030541
Note that from the first issue of 2016, this journal uses article numbers instead of page numbers. See further details here.