A New Individual Tree Crown Delineation Method for High Resolution Multispectral Imagery


1
Key Laboratory of Digital Earth Science, Aerospace Information Research Institute, Chinese Academy of Sciences, Beijing 100094, China
2
School of Electronic, Electrical and Communication Engineering, University of Chinese Academy of Sciences, Beijing 100094, China
3
Department of Earth and Space Science and Engineering, York University, Toronto, ON M3J 1P3, Canada
*
Author to whom correspondence should be addressed.
Remote Sens. 2020, 12(3), 585; https://0-doi-org.brum.beds.ac.uk/10.3390/rs12030585
Submission received: 30 December 2019
/
Revised: 7 February 2020
/
Accepted: 8 February 2020
/
Published: 10 February 2020
(This article belongs to the Special Issue Individual Tree Detection and Characterisation from UAV Data)
Abstract
:In current individual tree crown (ITC) delineation methods for high-resolution multispectral imagery, either a spectral band or a brightness component of the multispectral image is employed in delineation with reference to edges or shapes of crowns, whereas spectra of tree crowns are seldom taken into account. Such methods normally perform well in coniferous forests with obvious between-crown shadows, but fail in dense deciduous or mixed forests, in which tree crowns are close to each other, between-crown shadows and boundaries are unobvious, whereas adjacent tree crowns may be of distinguishable spectra. In order to effectively delineate crowns in dense deciduous or mixed forests, a new ITC delineation method using both brightness and spectra of the image is proposed in this study. In this method, a morphological gradient map of the image is first generated, treetops of multi-scale crowns are extracted from the gradient map and refined regarding the spectral differences between neighboring crowns, the gradient map is segmented using a watershed approach with treetops as markers, and the resulting segmentation map is refined to yield a crown map. Evaluated on images of a rainforest and a deciduous forest, the proposed method more accurately delineated adjacent broad-leaved tree crowns with similar brightness but different spectra than the other two typical ITC delineation algorithms, achieving a delineation accuracy of up to 76% in the rainforest and 63% in the deciduous forest.
1. Introduction
As one of the important targets for the management and protection of ecological resources, forests play an important role in soil and water conservation [1]. Since forests can provide measurable economic, environmental, social, and health benefits, issues surrounding the efficient management and application of forest resources have attracted widespread concern [2]. A comprehensive inventory of forest resources, as a basic step for achieving efficient management, has attracted an increasing number of forestry researchers to join in related studies [3], especially studies related to individual tree crown (ITC) delineation from remotely sensed data [4].
The measurement of some forest parameters, such as crown area [5], stem diameter [6], tree height, tree growth, and crown closure, is performed at individual tree level and requires information about individual trees. The accuracy of ITC delineation is not only related to the accuracy of the subsequent species identification, gap analysis, and estimation of stand-level characteristics such as above-ground biomass and forest carbon [7], but also highly relevant to a variety of forest-related activities, such as silviculture treatment, biodiversity assessment [8], saw timber volume, and bioenergy supply [9].
Until now, numerous ITC delineation methods using remote sensing data have been proposed, such as those based on valley following [10,11], between-tree shadow identification [12], region growing [13], edge detection [14,15], watershed segmentation [16], and three-dimensional (3-D) modeling [17]. These methods have been successfully applied in coniferous forests, but work poorly in dense deciduous and mixed forests with complicated structures [18,19,20,21].
The poor performance of delineation on deciduous forests is mainly due to their more complex structures compared to coniferous forests. Coniferous crowns have characteristic conical shapes, obvious treetops, and significant inter-crown valleys; thus, can be easily identified [22]. In contrast, a deciduous crown normally has an elliptic shape, a slightly flat treetop, and multiple main branches which resemble individual trees, making it difficult to identify the main stem. Additionally, in dense deciduous forests, the branches of neighboring crowns are interleaved, resulting in less obvious inter-crown boundaries, and making it difficult to delineate crowns only according to their boundaries [23].
Some ITC delineation approaches attempted to improve delineation accuracy by considering scale size [15,24]. For instance, Gaussian filtering has been used to smooth the imagery prior to segmentation, in order to suppress spurious branches, but it is difficult to determine an optimal filter size [25]. To improve the situation, some multi-scale ITC delineation approaches were proposed, such as identifying tree crown contours at each scale level and selecting seed points from the detected local peak scales [14], choosing three different scales and performing crown extraction at each scale [24], pre-processing the multispectral image using wavelet transform and then delineating tree crowns [26], and adopting nonlinear multi-scale fitting to improve the goodness of fit of tree crowns at different scales [27]. Despite the successes, those algorithms underperform in dense forests, due to the fact that the scales of the tree crowns span a large range, whereas the scales used in these algorithms were sparse and limited, and thus leading to incomplete detection of multi-scale crowns.
Some attempts of ITC delineation were tried from the perspectives of the multi-scale and spatial morphology of tree crowns. The shape of a tree crown can be taken as a semi-ellipsoid of different scales with the outermost branches attached [28]. After the tree crown is sliced into several layers from top to bottom, a disk can be fitted into each resulting slice. The diameter of the bottom disk represents the horizontal size of the tree crown [22]. Based on such a concept, a series of tree crown slices can be obtained by previously setting multiple scales to characterize the multi-scale features of the tree crown, and a unique treetop can be obtained by integrating multiple corresponding slices. A treetop is generally taken as a local maximum of radiation and near the center of the tree crown. However, in this concept, a treetop is no longer simply taken a point in the remote sensing image, but a maximum value region within each horizontal slice of the tree crown [29]. The area of this maximum region is affected by the crown sizes corresponding to each slice. The area and location of the local maximum region describing the same crown vary with the size of the crown slice. There are as many maximum regions as horizontal slices at the corresponding scales [15,24]. Therefore, how to select scales and integrate the corresponding maximum regions found in horizontal slices of different scales is an urgent problem to be solved.
To solve this problem, Jing et al. [22] selected three dominant tree crown scales, including small, medium, and large, delineated three layers of tree crowns at the triple scales, and integrated the three layers into one layer of multi-scale tree crowns. Although the multi-scale of tree crowns and the integration of multi-scale tree crowns were addressed, the three sparse scales artificially selected do not fully characterize the continuous multi-scale of crowns, and an effective integration of continuous multi-scale is urgent. Therefore, Jing et al. [30] proposed a continuous multi-scale integration scheme and a corresponding ITC delineation method called Crown Slices from Imagery (CSI). The latter was successfully applied in coniferous forests, but underperforms in dense deciduous forests. This method tends to merge the treetops of adjacent deciduous tree crowns but fails to separate closely connected deciduous crowns, leading to under-segmentation and low delineation accuracy.
The ITC delineation approaches mentioned above work well in coniferous forests, but fail in dense deciduous or mixed forests, mainly due to the unobvious shadows between deciduous crowns. In those algorithms, although a multispectral image is taken as the input, only one spectral band or a bright component of the image is utilized, and the spectra in the image is ignored. As a consequence, those algorithms would fail to separate neighboring crowns once the spectral contrast in a single band is insufficient to determine the boundaries of tree crowns [3]. The availability of multispectral information is the advantage of remote sensing images; however, few studies were carried out on ITC delineation utilizing this advantage. Determining how to incorporate spectral information into ITC delineation has been a bottleneck of current ITC delineation. Some scholars are exploring in this area. Xiao et al. [31] used a pulse-coupled neural network and morphological reconstruction in the spectral feature space to distinguish tree crowns from the background, but the experimental image used was not a dense forest. Yang et al. [3] proposed a watershed segmentation method for ITC delineation from high-resolution multispectral aerial imagery, but only part of the crowns in the image was delineated in experiment, and the whole delineation accuracy was unknown. Duan et al. [32] performed a coarse extraction of tree crowns with respect to image spectral and textural characteristics and achieved an accuracy of 84% on unmanned aerial vehicle images. Asner et al. [33] detected dead trees in Hawaiian forests successfully using a spectral mapping index. Those studies well demonstrated the abilities of spectra in tree crown delineation, but few algorithms were suitable in dense deciduous or mixed forests.
In order to effectively delineate crowns in dense deciduous or mixed forests, a new ITC delineation method fully using the spectral, shape, and multi-scale features of tree crowns is proposed in this study. In this method, a morphological gradient map of the image is first generated, treetops of multi-scale crowns are extracted from the gradient map and refined regarding the spectral differences between neighboring crowns; the gradient map is segmented using a watershed approach with treetops as markers, and the resulting segmentation map is refined to yield a crown map. Mainly based on spectral and multi-scale features of tree crowns, this method is called SMS for brevity.
This paper is organized as follows: the study areas and experimental data are introduced in Section 2.1, the flowchart and the details of each step of the proposed method are described in Section 2.2, Section 2.3, Section 2.4, Section 2.5 and Section 2.6, experimental results and their assessments are demonstrated in Section 3, and discussion and conclusion are provided in Section 4 and Section 5, respectively.
2. Materials and Methods
2.1. Study Sites
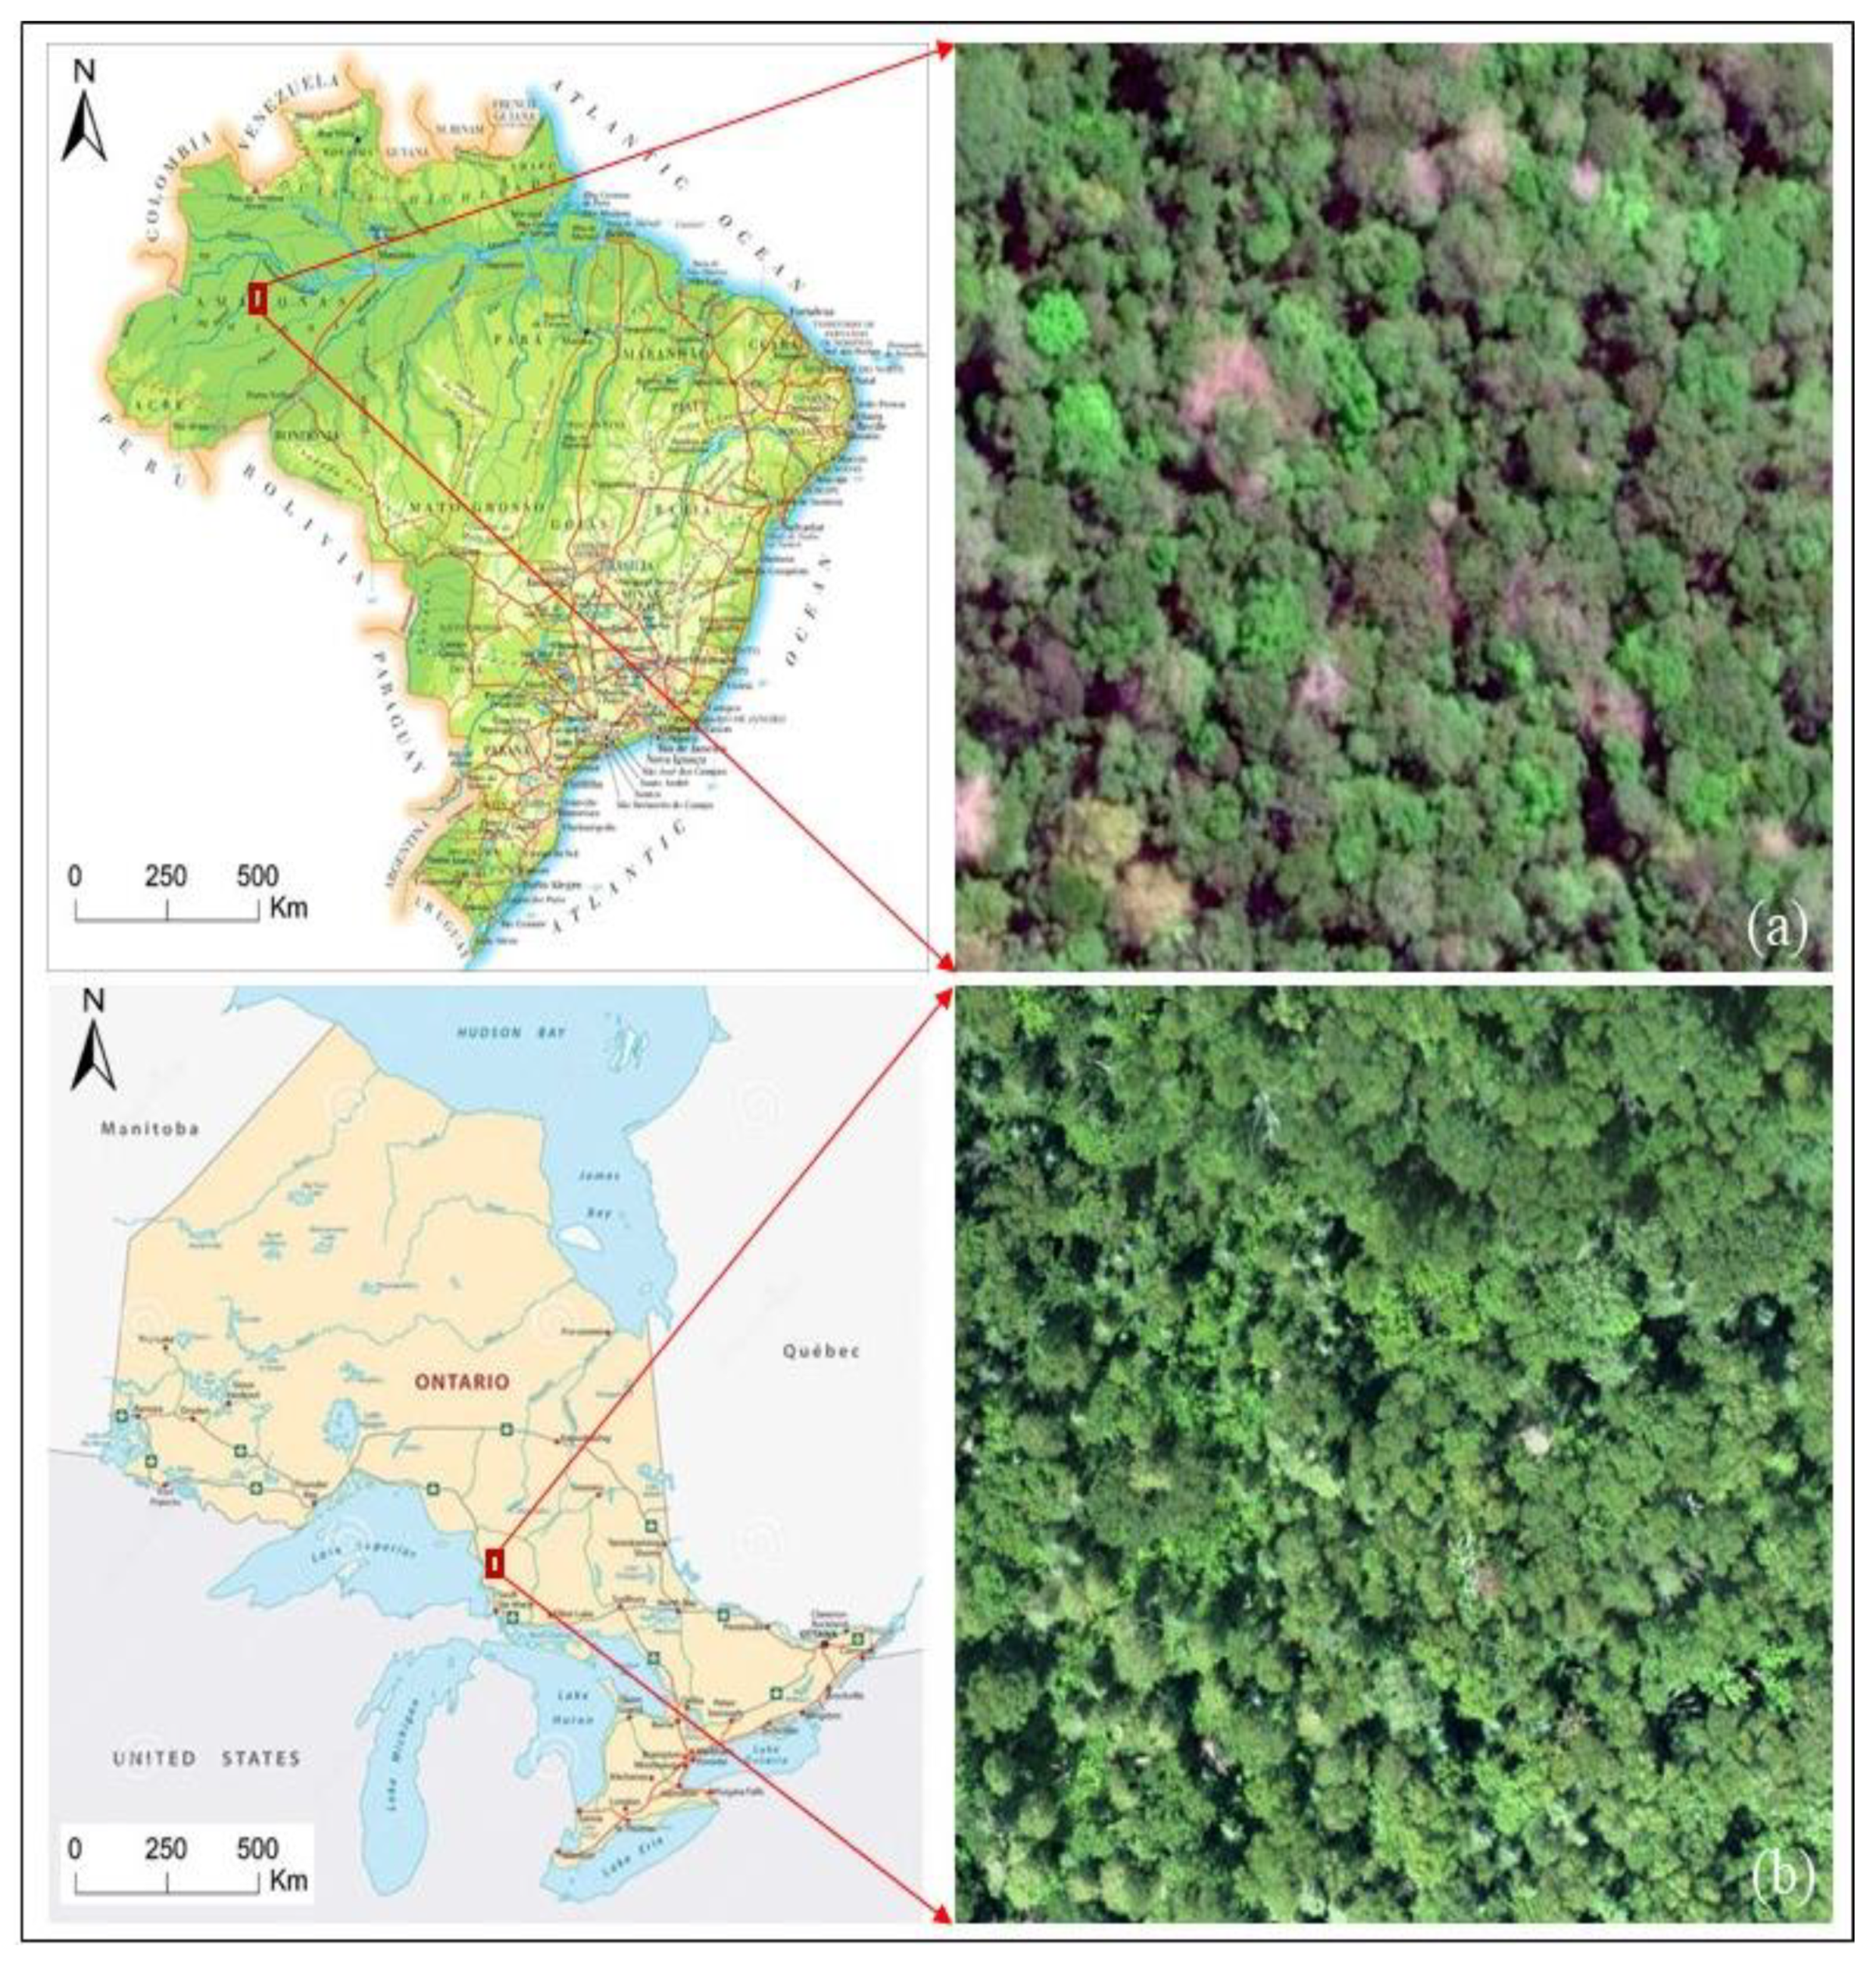
In order to evaluate the SMS method proposed, two plots covering different forest types were employed in the experiment. Plot one (3°26′52″–3°26′56″S, 65°19’14″–65°19′42″W) is located in the Amazon rainforest (Figure 1a) and a 564 × 495 image of this plot was downloaded from Google Earth, which was acquired in August 2015, and has a spatial resolution of 0.3 m and tree spectral bands. In this plot, plant species rich in diversity and are interspersed with each other, and stands, consist of dense crowns with different shapes, structures, and distinctive colors. Plot two (46°33′43″–46°34′03″N, 83°25′13″–83°25′20″W) is located at Sault Ste. Marie, Ontario, Canada and a 700 × 633 aerial image with 0.15 m spatial resolution of this plot was acquired in August 2009 (in Figure 1b). This deciduous forest consists of various-sized bushes, trees, and forbs, aged from 40 to 90 years. Aspen, white birch and sugar maple, are the most common deciduous species in this plot. Both of the acquired images have three spectral bands: blue, green, and red.
2.2. Methods
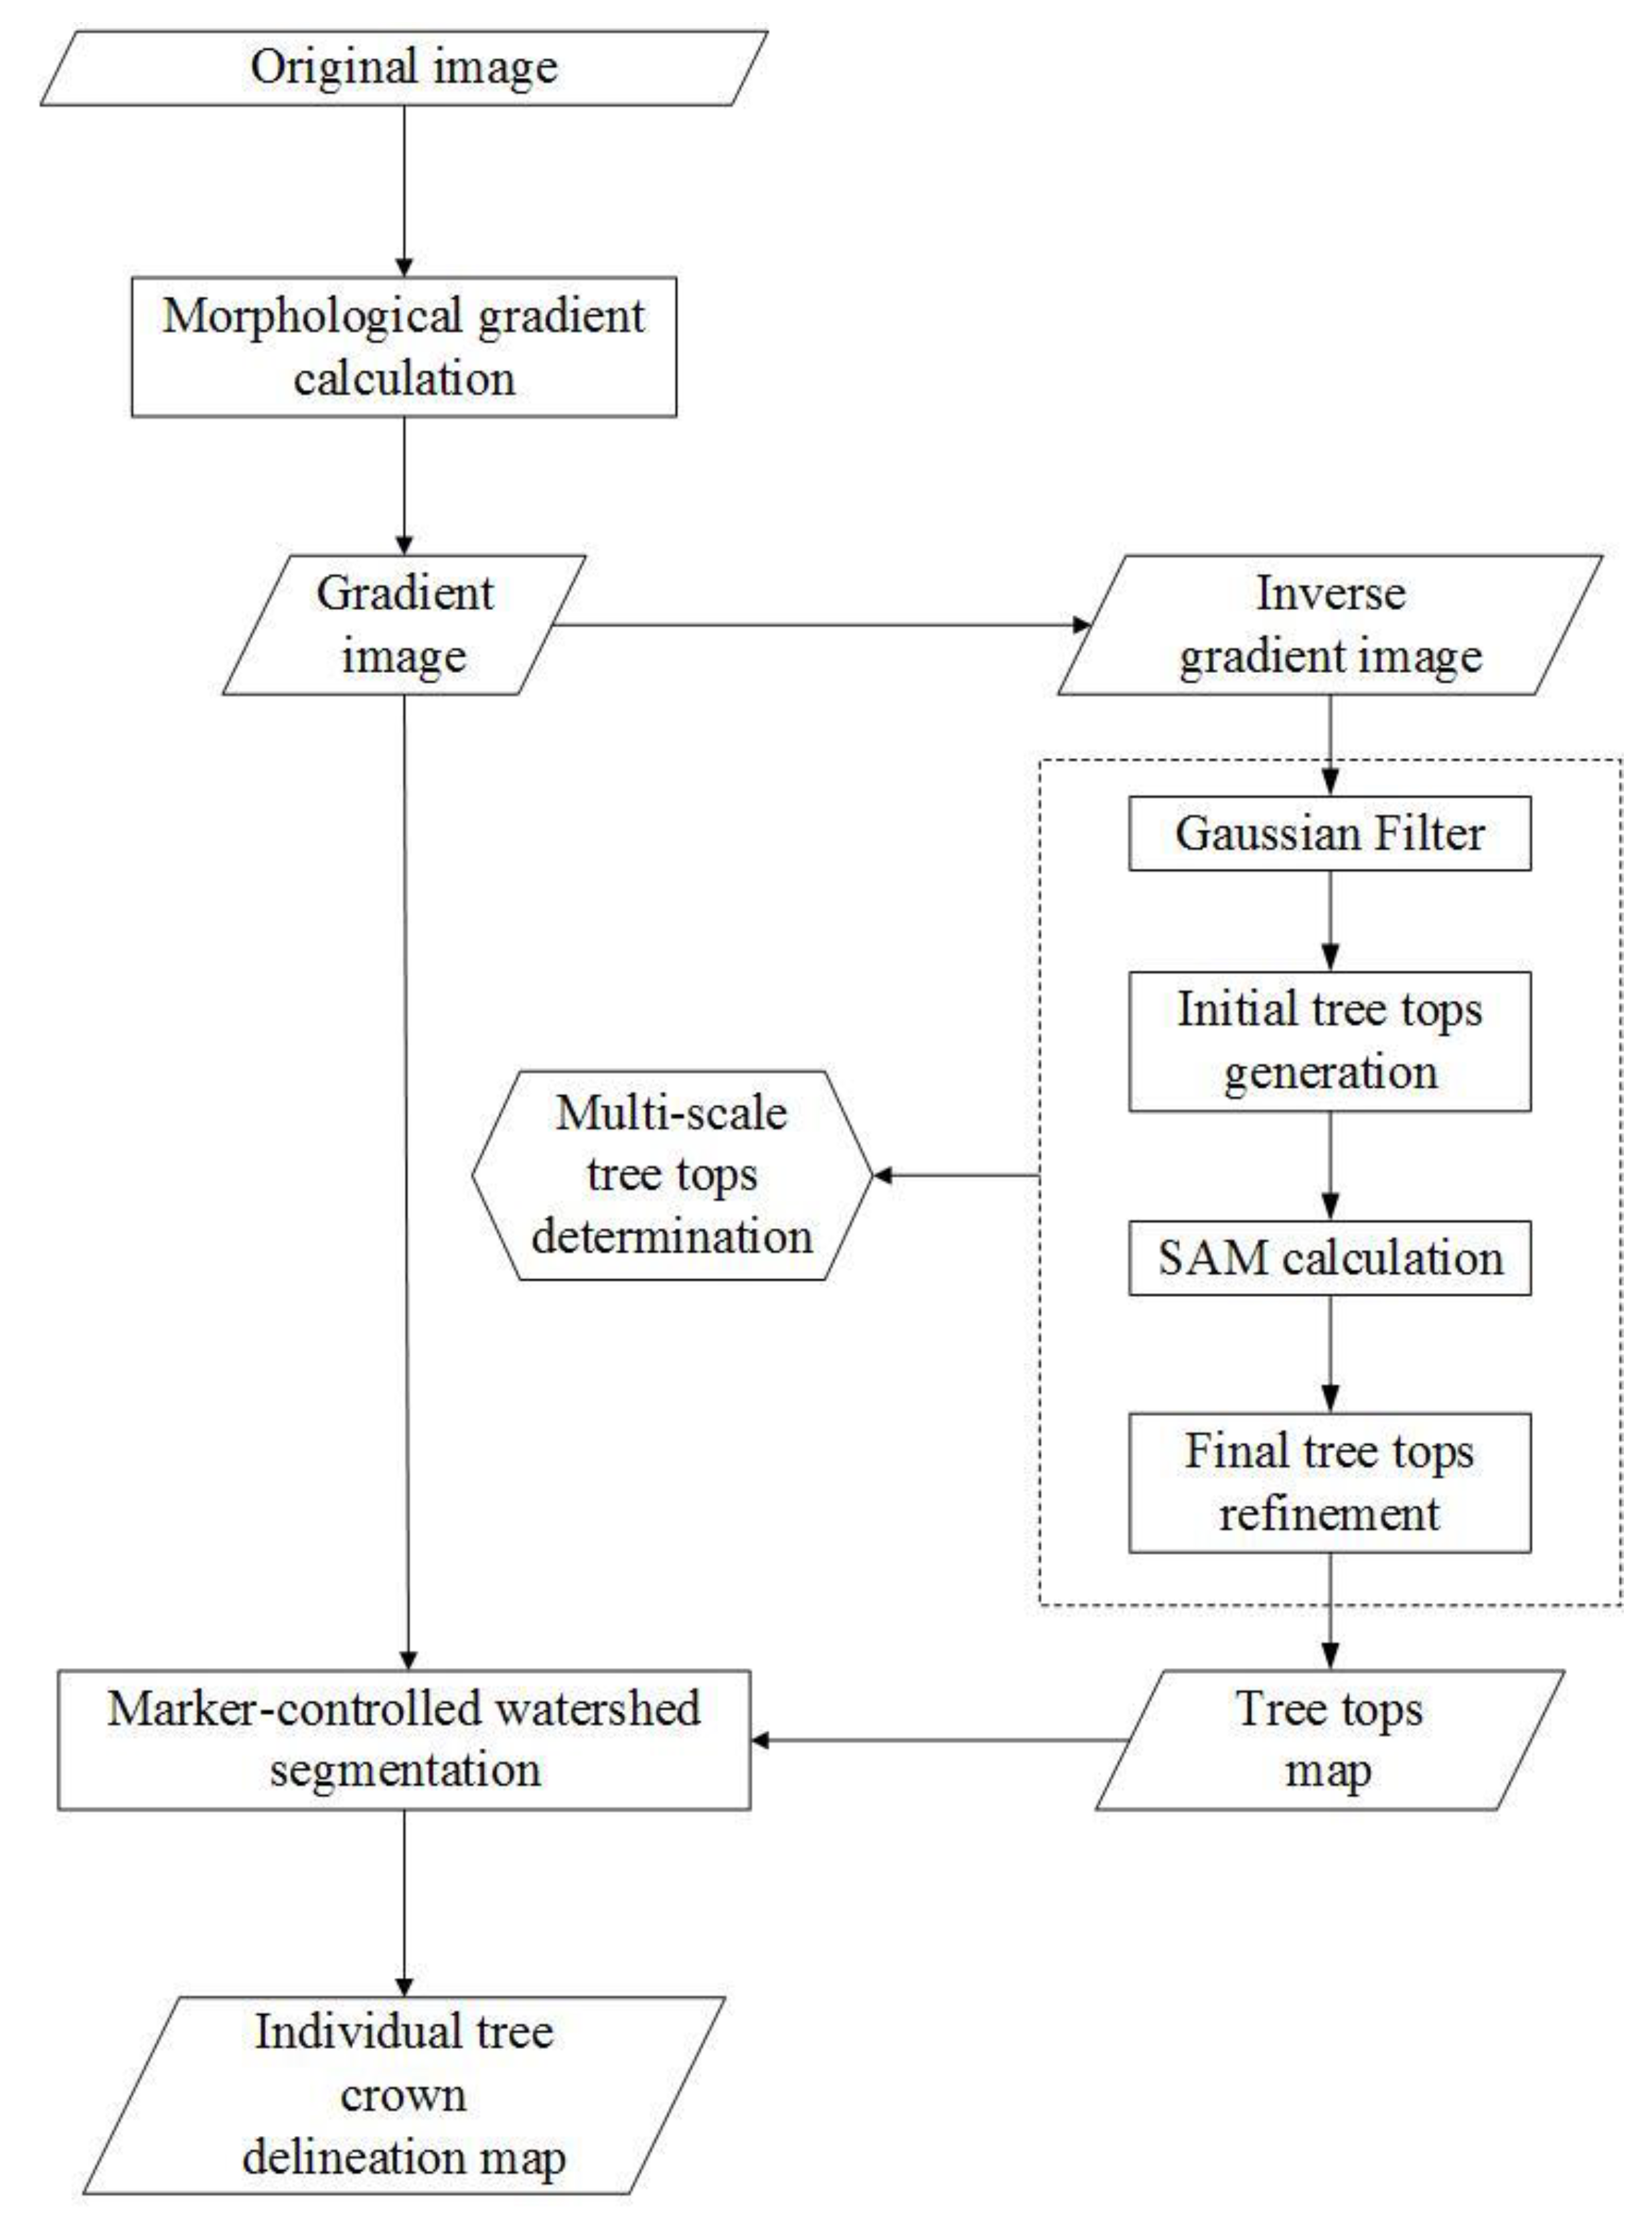
To improve the delineation in deciduous and mixed forests, a new ITC delineation method for multispectral imagery was proposed in this study. This method is based on morphological gradient image and Spectral Angle Mapper, and is called SMS for brevity. The flowchart of this method mainly consists of four steps, as follows (Figure 2): (1) using a mathematical morphological method to obtain a morphological gradient image of the multispectral image and further an inverse gradient image; (2) automatically extracting initial treetops by multi-scale filtering and morphological operations with regard to tree crown shape; (3) integrating the multiple resulting layers of initial treetops with reference to the spectra of tree crowns; and (4) segmenting the gradient image using a marker-controlled watershed segmentation approach to obtain a final tree crown delineation map.
2.3. Calculating Morphological Gradient Image
Morphology is a mathematical tool for analyzing images based on morphological structural elements (SE) [34]. The basic idea of morphology is to use a structural element with a certain shape that is equivalent to a filtering window in signal processing to measure and extract the corresponding shape in the image to achieve the purpose of analyzing and identifying the image. Basic morphological operations include morphological dilation and erosion, which are generally defined for grey images [35].
For a grey image, its morphological gradient is defined as the arithmetic difference between the dilation of the image and the erosion of the image [36]. Plaza et al. [37] extended this strategy to multidimensional image fields and put forward multidimensional dilation and multidimensional erosion. Based on this theory, Li et al. [38] proposed a vector-based method for calculating the gradient image of a multispectral image.
The process of calculating this kind of morphological gradient image is as follows: applying multidimensional dilation and multidimensional erosion to the multispectral image, respectively; calculating the difference between the resulting dilated and eroded images; and finally, integrating the resulting multi-band difference image to a single-band gradient image [39]. For a multispectral image f, its morphological gradient image G is calculated as below:
where dist denotes Euclidean distance, d is multi-band dilation, e is multi-band erosion, and (x, y) denotes spatial coordinates.
Compared with a gradient image calculated from a single spectral band, the morphological gradient image obtained above reflects the complete spectral differences between adjacent image objects, in which the boundaries between neighboring tree crowns with different spectral are enhanced and the pixels with similar spectra within each crown are suppressed.
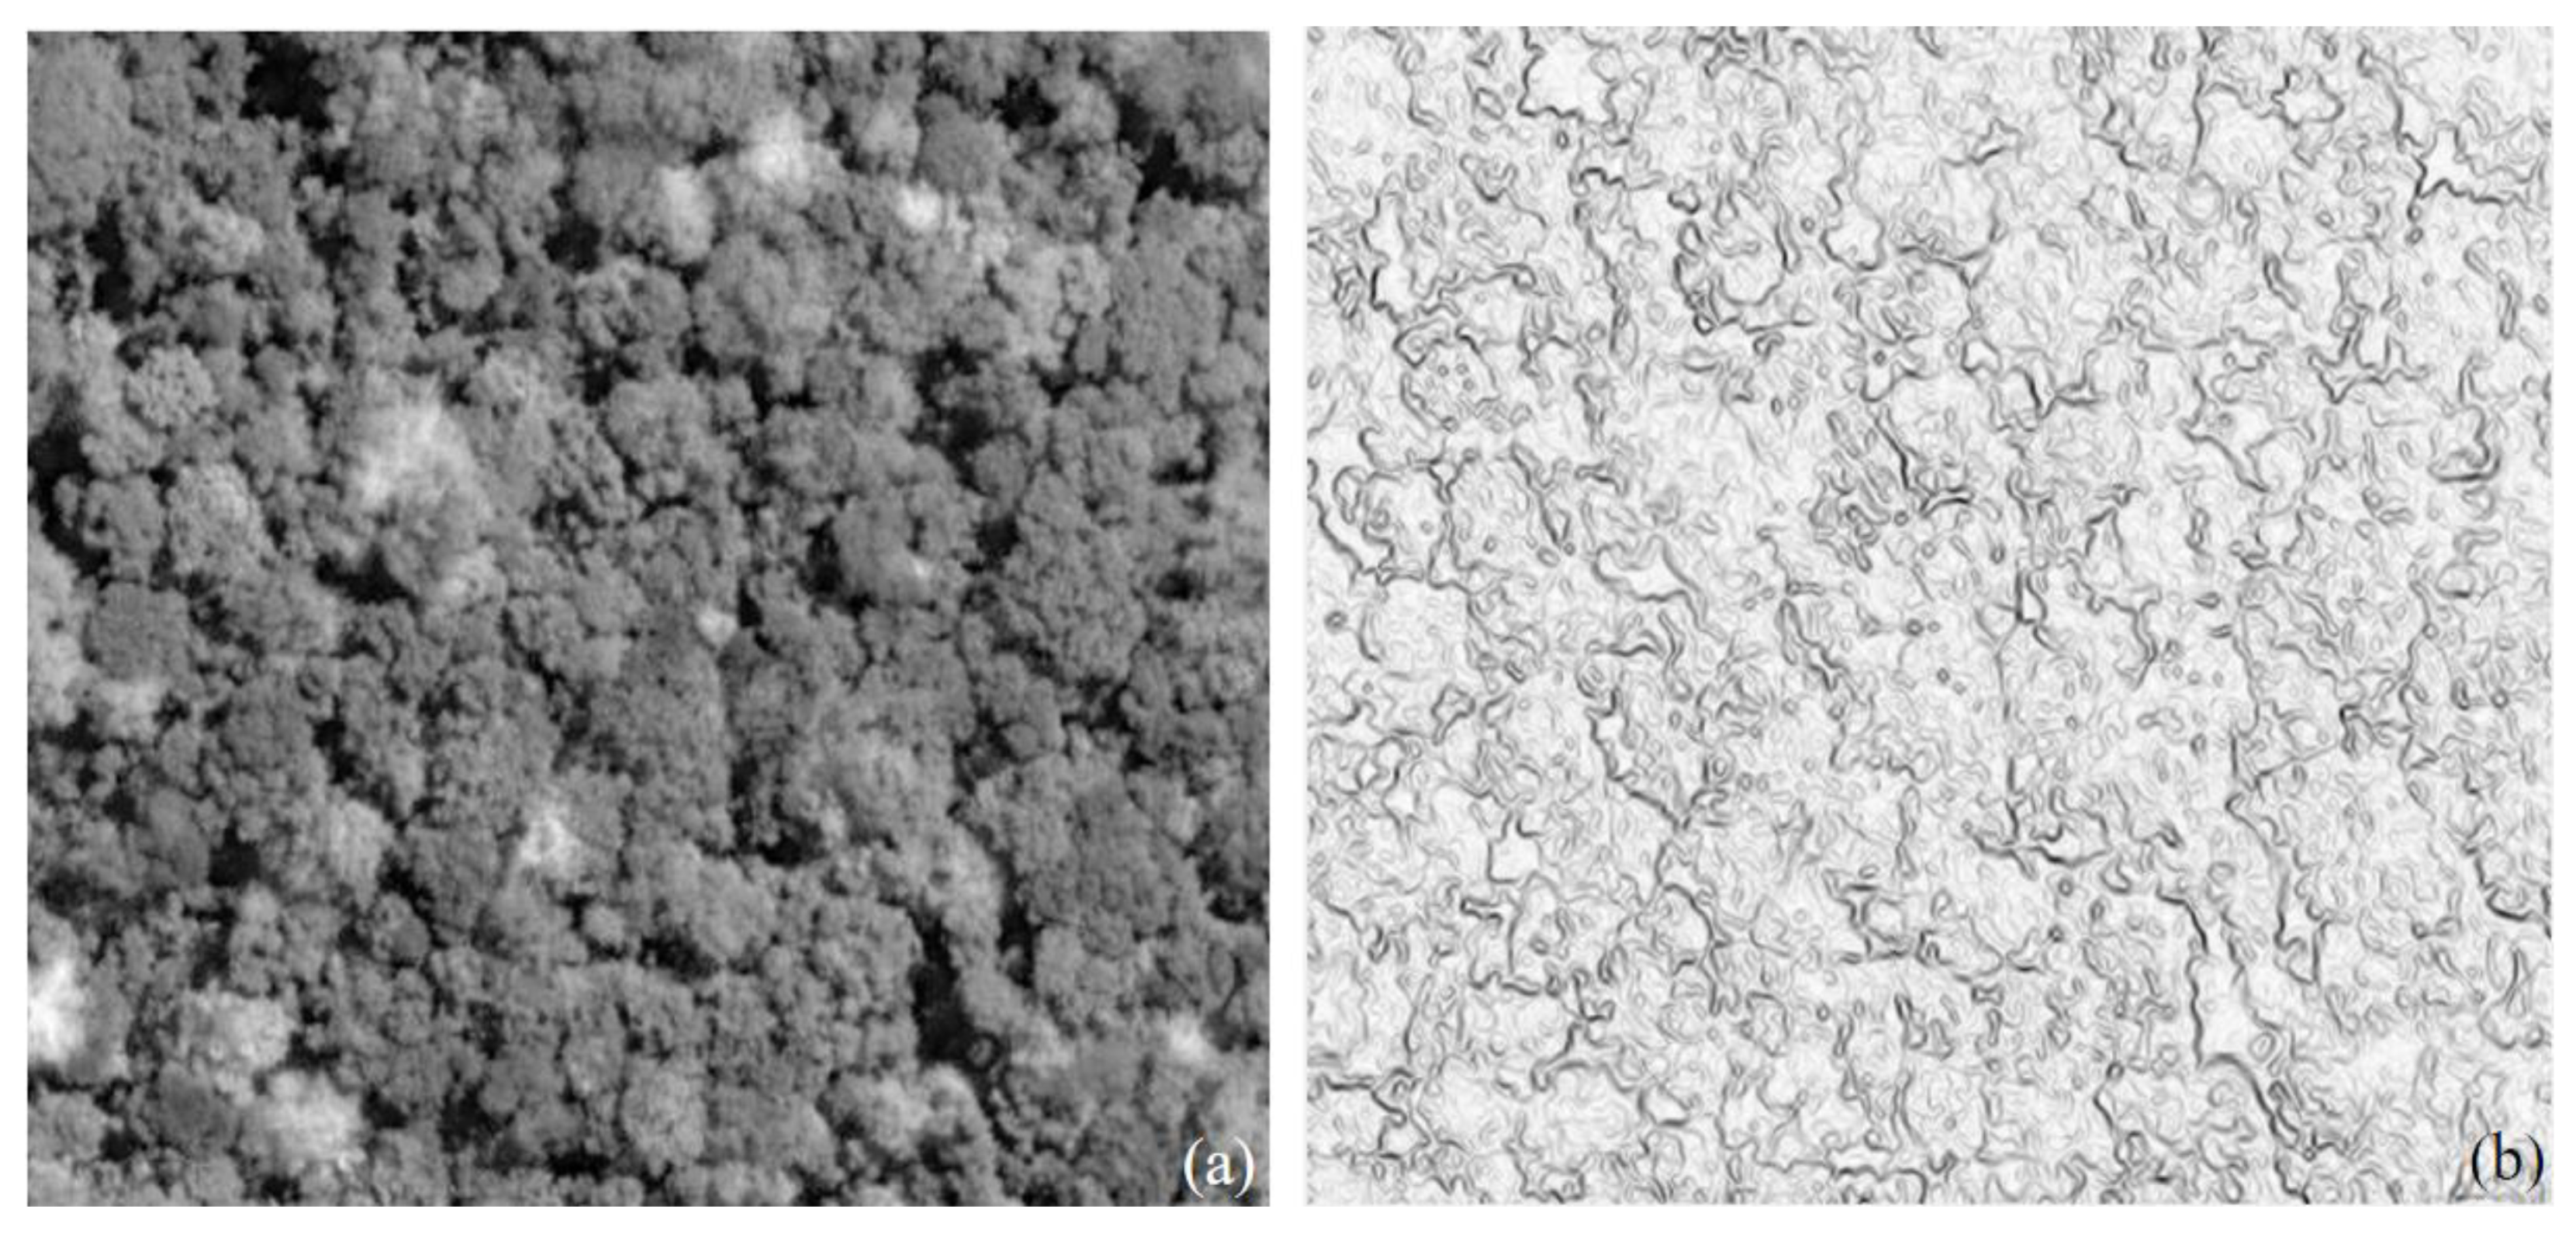
In current ITC delineation algorithms, either a spectral band or a brightness component of the original multispectral image is frequently used as the input, such as the first principle component (PC1) of the original image [26] or the intensity component of a three-channel image. Such a gray image contains the brightness information of the original image, but no spectra. In the method proposed in this study, an inverse version MG(f) of the gradient image is used, which could be calculated as follows:
where Imax denotes the maximum brightness of the image. In this study, was set as 255.
It is well known that a brightness component and a gradient image of a multispectral image contain different information. Figure 3a,b are the PC1 and the inverse gradient image of the multispectral image of the plot 2. As demonstrated in Figure 3a, between-crown shadows reveal in the PC1 clearly, whereas the enhanced edges of tree crowns displays in the inverse gradient image.
2.4. Determining Initial Treetops
Treetops are normally the prerequisite of ITC delineation. In the new ITC delineation method, treetops are extracted from the inverse gradient image, instead of a brightness component, such as PC1 or intensity component of the multispectral image, as does in CSI method. The main steps of initial treetop extraction process of treetops is to take each crown as a series of horizontal slices and the maximum area in each slice as the treetop, and then integrate a series of treetops into a ‘real’ treetop with respect to the shape and spectra of crowns. This process is improved from the CSI method [30]. The main processes for finding initial treetops are described as follows:
Step 1: Set a series of scales {S1: 2: Sn} in pixels. This scale series characterizes the multi-scale of crowns in image and determine the term of standard deviation (σ) of the Gaussian filters employed in the next step. The minimum scale S1 and maximum scale Sn in this series correspond to the smallest and the largest diameters of the crowns of interest, respectively. Crowns out of the scale series will be ignored. The interval is set as 2 pixels, in order to yield continuous scales, so that all-size tree crowns of interest can be detected.
Step 2: Smooth the gradient image to suppress branches using a Gaussian filter. The size and sigma (standard deviation, σ) of the filter are set to S1 pixels × S1 pixels and 0.3 × S1 pixels, respectively, where S1 is the minimum scale described above. After the filtering, branches smaller than the window size of the Gaussian filter will be effectively suppressed, and larger tree crowns will be retained. Assuming a crown normally contains at least three branches, coefficient of 0.3 is empirically set in order to simulate the shape of branches using a Gaussian filter [22,40]. This filtering process was completed in MATLAB programming language.
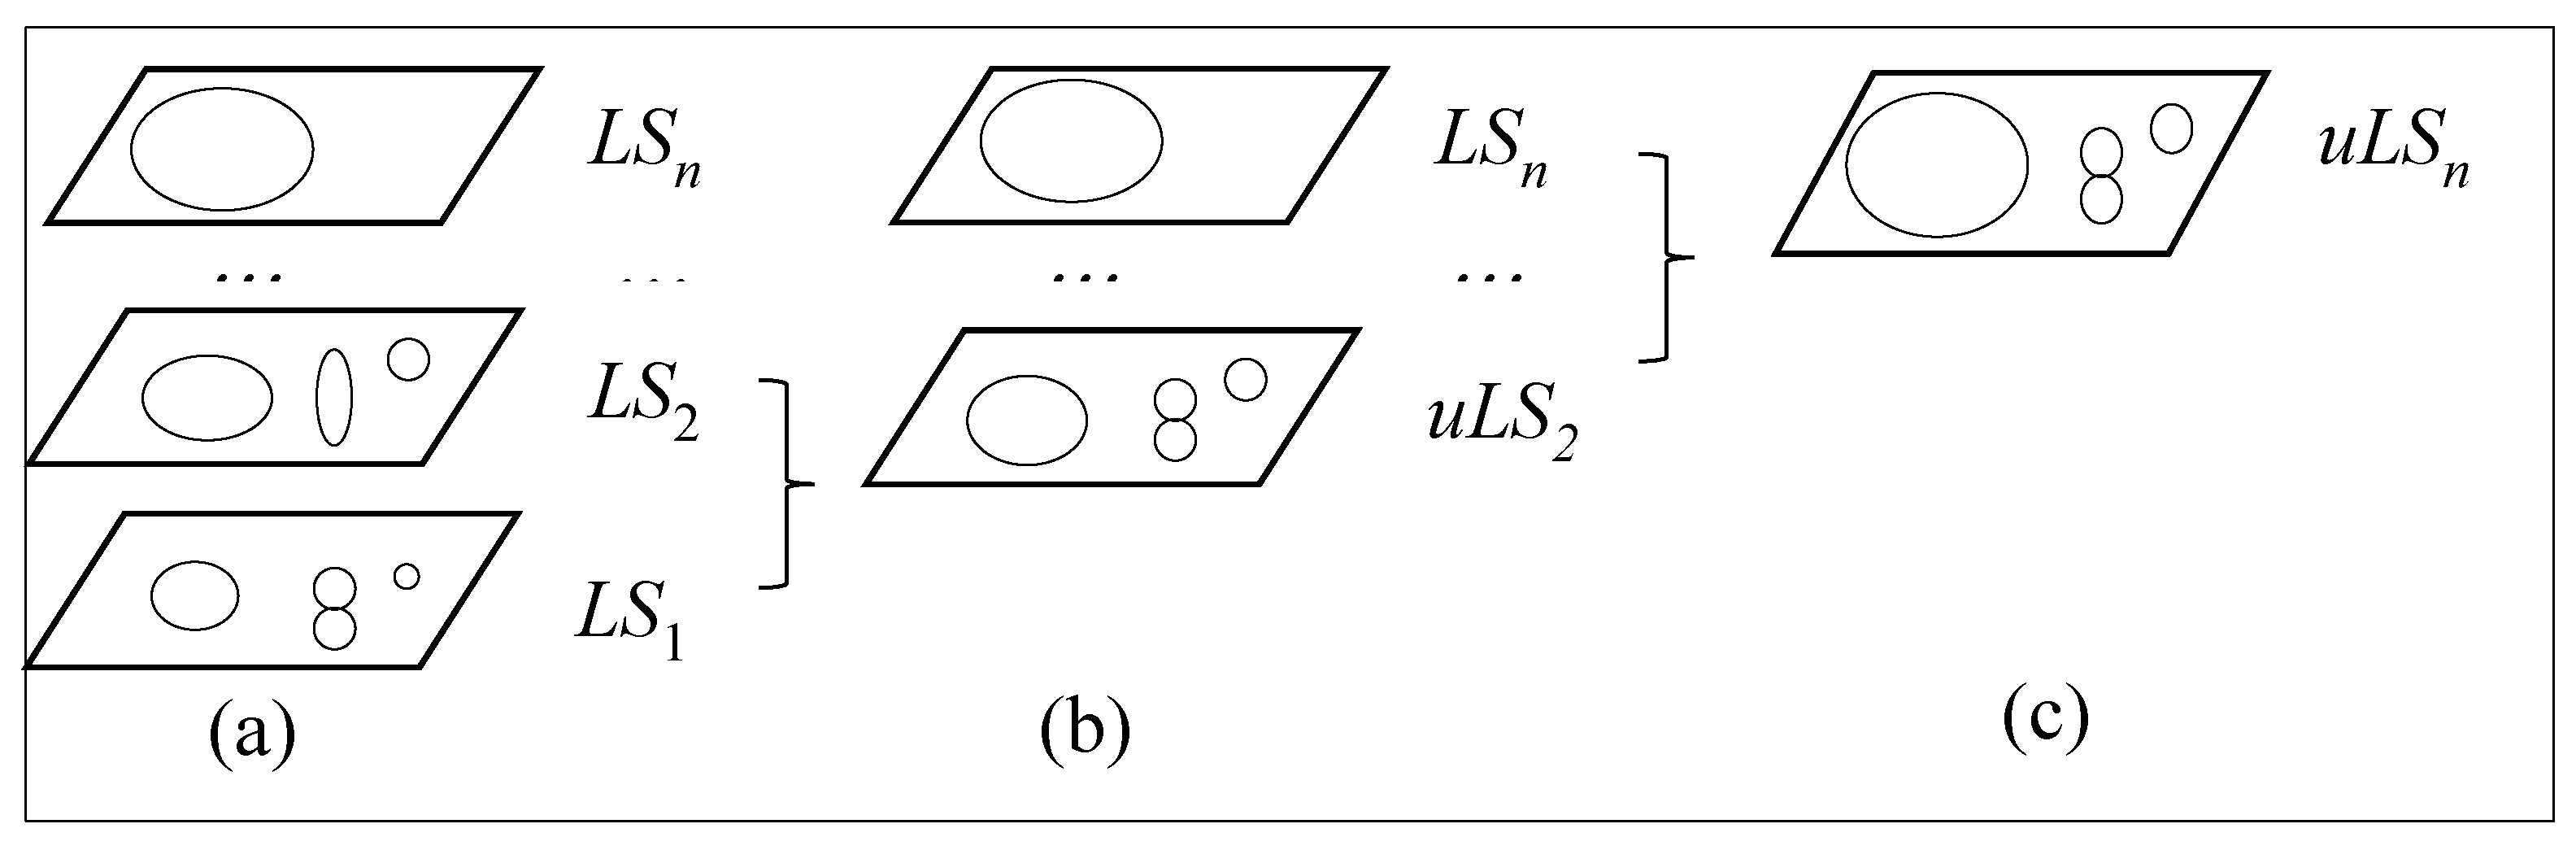
Step 3: Morphologically filter the gradient image with a disk structural element of sizes equal to the series of slices {S1: 2: Sn}, and extracting the local maximum regions in each resulting filtered image as a layer of horizontal slice, LSi (I = 1,…, n). The resulting multiple layers of slices construct a series of horizontal slices, {LS1, LS2,…, LSn}, as demonstrated in Figure 4a.
Step 4: Integrate the series of slices {LS1, LS2, …, LSn} to obtain a final layer uLSn. In this iterative process (Figure 4b,c), the first layer LS1 and the second layer LS2 are combined to form an updated version uLS2 of LS2, which is then combined with the third layer LS3 to form a updated version of LSn. The process keeps on until an updated version uLSn of the top layer is obtained.
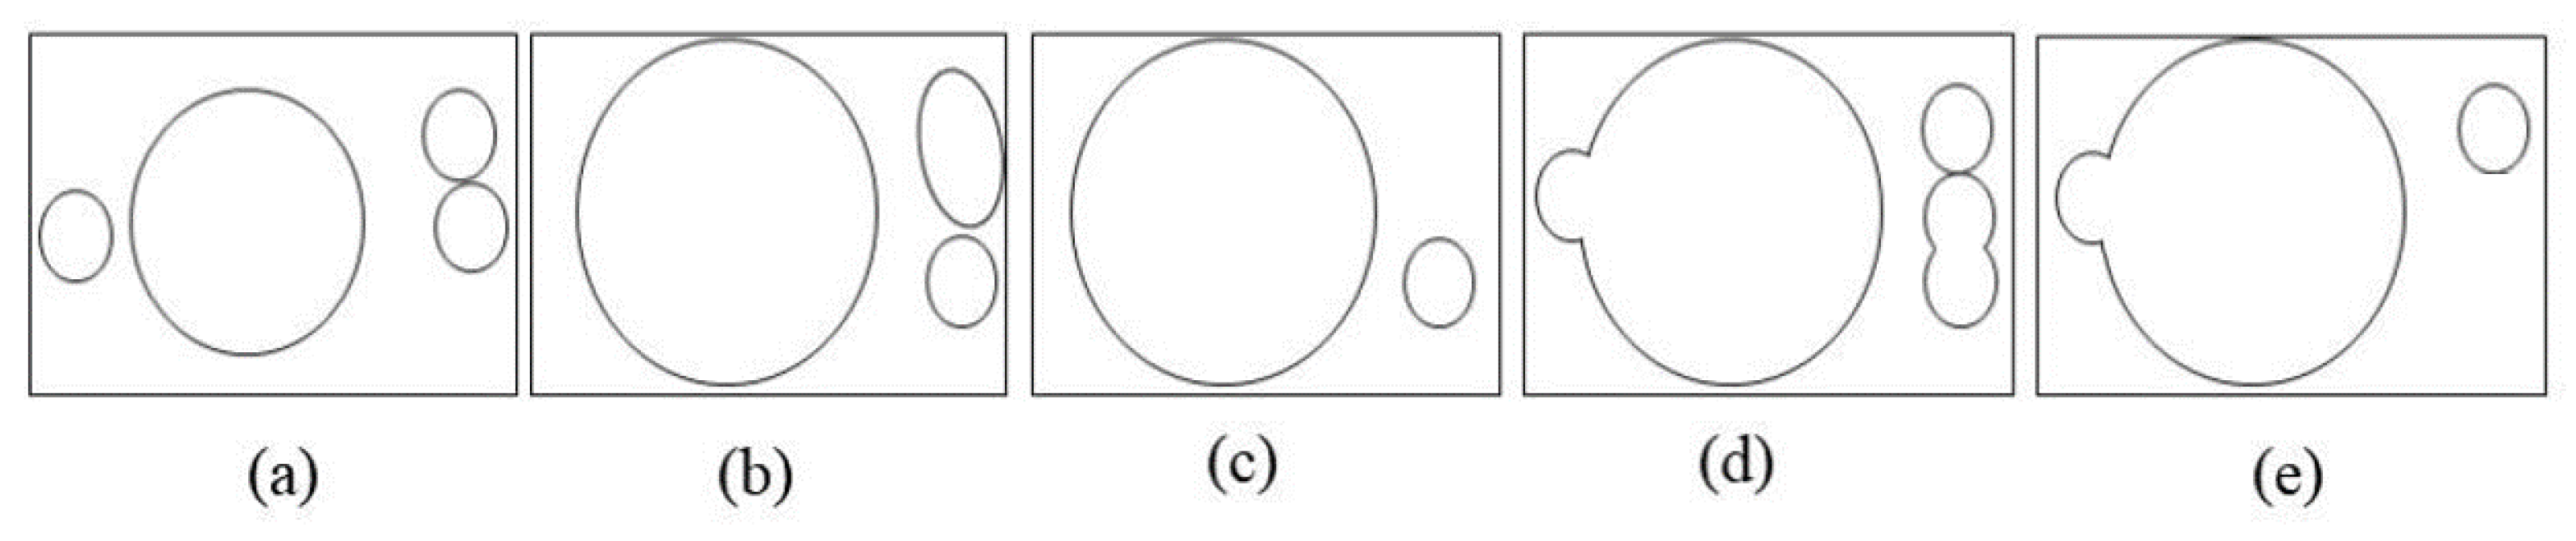
Taking the i − th layer (Figure 5a) and (i + 1) − th layer (Figure 5b) as the fine layer and the coarse layer, respectively, the integration processing of the two layers mainly consists of three steps, as follows:
Step 4.1: Sift each layer with reference to roundness of objects to remove false treetops. In this process of discriminating treetops, once the roundness of an object in the layer is lower than a threshold, the object will be eliminated from the layer. In the sifted layer (Figure 5c), only the treetops with high roundness values will be retained.
Roundness is a measure of how similar a segment area is to a circle [28,41], which is defined as follows:
where c denotes the roundness of the segment, A is the area of the segment, and r is the largest distance between the centroid and the border of the segment.
Different image objects have different roundness values. As demonstrated in Figure 6, when an image object consists of one, two, three, and four identical tree crown(s), its roundness value is 1.0, 0.5, 0.66, and 0.73, respectively. Therefore, the roundness threshold can be set as an arbitrary value within the range of 0.5–1 to separate one-crown objects and multiple-crown objects. A coniferous crown in field has a roundness around 0.85 [28], slightly lower than the identical value of 1, as a compromise, the roundness threshold was set as 0.6 in this study.
Step 4.2: Combine the fine layer and the coarse layer. The two previously sifted layers are combined into a new layer using a logic ‘OR’ operation (Figure 5d), and the latter is further refined with reference to the roundness of objects. In the re-shifted combined layer (Figure 5e), only treetops are retained, whereas slices of tree clusters are eliminated.
Thus, the initial treetops based on the shape characteristics of tree crowns were determined. Through the above multi-scale processing, treetops could be comprehensively identified according to the structure of tree crowns. However, spectra of crowns are rarely taken into account in the process, especially in the integration of treetops at different scales (the step 4 above), in which the treetops are recognized only by the shape and structure factors of crowns. As a consequence, once a slice of a tree cluster with a high roundness value partially or completely cover the slices of multiple tree crowns at a finer scale, the later may be falsely integrated into a treetop, thus leading to a false treetop and an omission error in the final tree crown inventory.
2.5. Refining Initial Treetops
Therefore, it is necessary to make a further judgment of the results of the treetops identified in the first part of this process.
In order to refine treetops and reduce omission errors in the final tree crown map, a spectral index, Spectral Angle Mapper (SAM), is used in the processes of determining final treetops and the following crown delineation in this study. The index of SAM is a common distance metric for two spectra comparisons [42]. The smaller the SAM, the higher the similarity. Given two pixels a and b in the form of n-D vector, the cosine value of their spectral angle θ is:
where and represent spectral band i of pixels a and b, respectively, and n is the number of spectral bands. The larger the cosine value is, the more similar the two spectra are, and the more likely they belong to the same type of feature.
In practical applications, a reference spectrum is often chosen at first, and then, the angle between the target spectrum and the reference spectrum is calculated to judge the similarity between them. Because the spectral angle quantifies the spectral difference between two pixels, and therefore, can be employed to judge the spectral homogeneity between treetops. In the SMS method proposed in this study, SAM is employed to improve the process of treetops determination (step 4 described above) in the CSI method. Taking the i − th layer (Figure 5a) and (i + 1) − th layer (Figure 5b) as the fine layer and the coarse layer, respectively. The detailed judgment process is as follows:
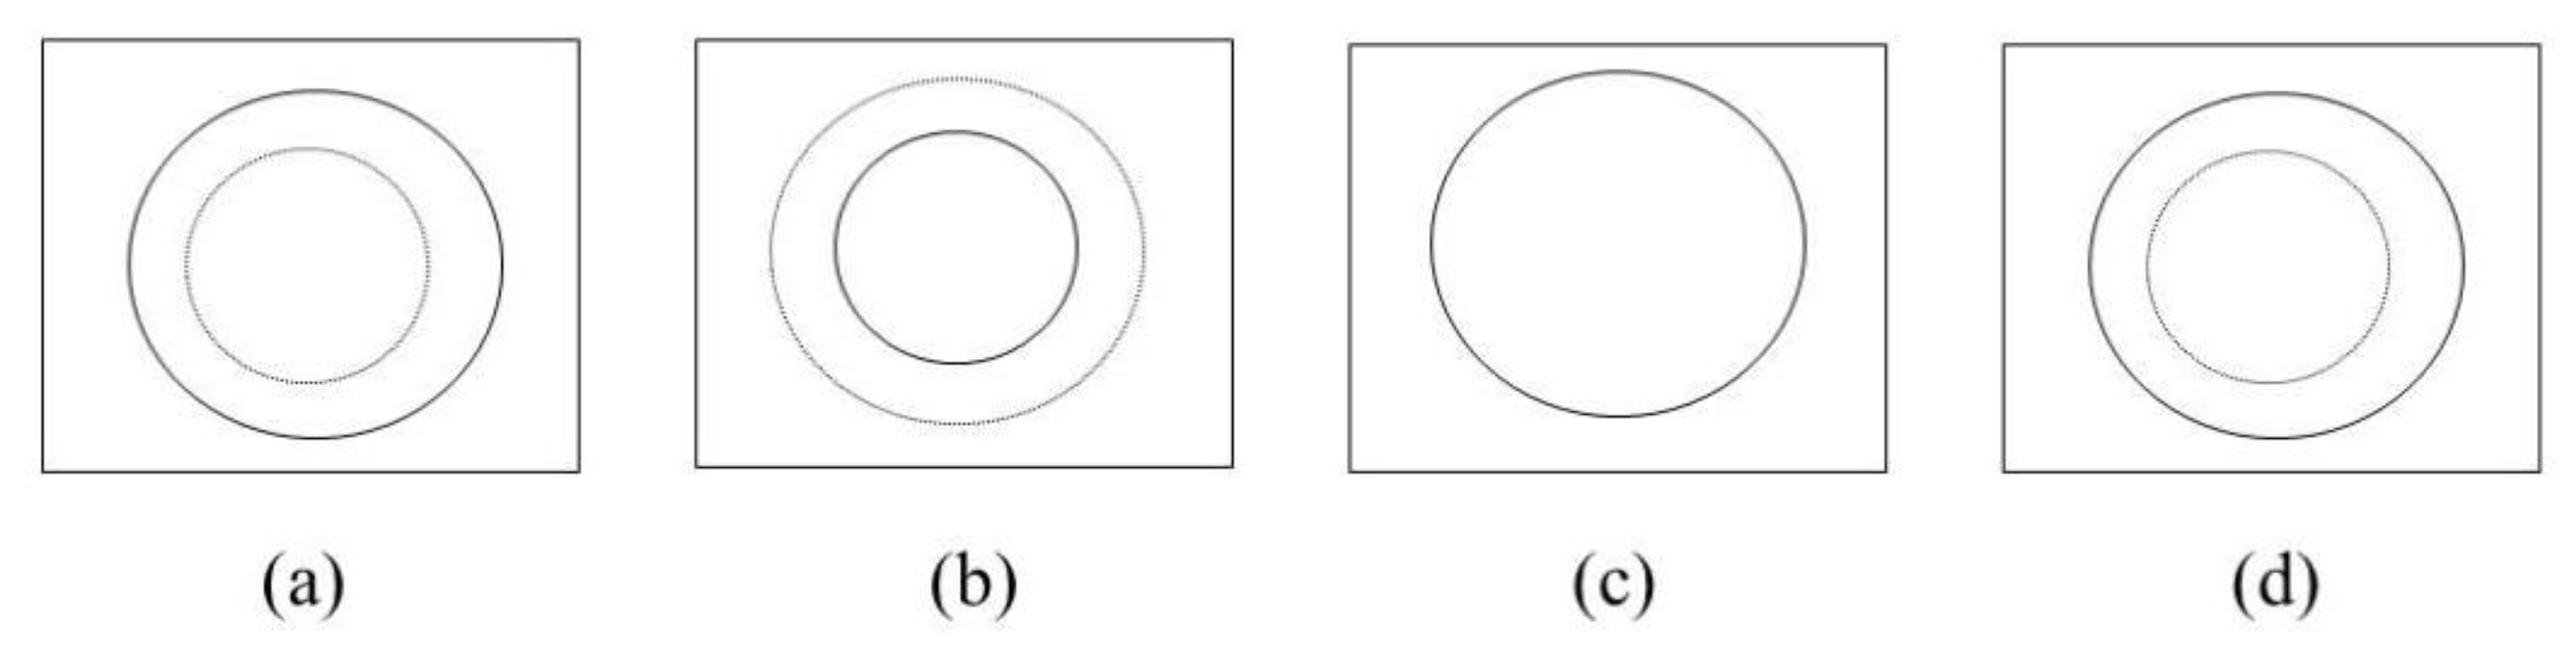
Step 1: Locate and mark the position of each treetop in the initial output result (Figure 7a and Figure 8a) obtained in step 4.2 of Section 2.4, and find the corresponding area on the fine layer (Figure 7b and Figure 8b) and the coarse layer (Figure 7c and Figure 8c) at the same coordinates.
Step 2: Judge whether the fine layer or the coarse layer has a treetop in the corresponding area. If either image does not have a treetop in the area, directly output the two layers using a logic ‘OR’ operation (Figure 7d). If both layers have at least one treetop at the location, proceed to the next step. Taking TC and TF as the abbreviations of the treetop in the coarse layer and fine layer, respectively.
Step 3: Calculate the average spectra of TC as the reference spectra.
Step 4: Find the treetop in the subareas of the fine layer region, and calculate the average spectra of each TF as the spectra of target.
Step 5: Calculate the cosine values of SAM between each TF and TC.
Step 6: Integrate the TFs and TC with reference to an SAM threshold (Figure 7 and Figure 8). If the SAM value of each TF is larger than the SAM threshold, indicating that all TFs are spectrally similar to TC and will be directly integrated with the latter using a logic ‘OR’ operation (Figure 7d). The resulting integrated layer contains the TC and all TFs. If any TF has an SAM value smaller than the threshold, it means that there is no spectra similarity in these TFs. The treetops in the fine layer stand for different tree crowns and they should not be integrated. In this case, the output result only retains the TFs (Figure 8e).
The threshold value of SAM is obtained based on the statistical results of all SAM values calculated on the image and fine tuning. First, the rough value is determined according to the statistical law, then the precise value is further adjusted in a small range according to the effect of delineation. The purpose of adjustment is to achieve greater delineation accuracy. In this study, the rough value was determined according to the mode of statistical results, other statistical values such as average also could be taken. It should be noted that this threshold is not a constant and varies with forest imagery of target. For example, in the rainforest and deciduous forest, the SAM threshold was finally set as 0.9992 and 0.998, respectively based on the statistical results and fine tuning.
Step 7: For all the treetops in the output results obtained in step 4.2 of Section 2.4, repeat operations Step 1 to Step 6 on each treetop to obtain the final treetop map.
2.6. Marker-Controlled Watershed Segmentation
The idea of a watershed segmentation algorithm first came from watershed topography, in which the pixel values are regarded as topographic relief, so the entire image can be divided into a series of catchments as zones of influence for each local minimum [26,43]. Based on the similarity between geographic reliefs and tree crown surfaces, the watershed segmentation approach [44,45] is widely used to segment imagery for tree crown delineation. Similar to the operations for terrain, the inversion of the treetops layer is first taken as local minima and markers. Then, the relief is ‘flooded’ from the markers, and boundaries are established where different sources of flooding water meet. These boundaries constitute a watershed, and the watersheds that surround each area are labeled as a basin [46].
Conventional watershed segmentation algorithms for ITC delineation are typically implemented on two types of image. One type is the grey or single-band image generated after the transformation of the original image, which cannot ensure that the watershed outlines match the boundaries of the real tree crowns. Another type is the gradient image generated from the grey or single-band image, which would fail to segment neighboring trees when the spectral contrast in a single spectral band is weak. In this study, a vector-based morphological gradient image and the final treetops after refinement were used to obtain the final tree crown segmentation map through marker-controlled watershed segmentation. This method can not only identify the real boundaries of tree crowns but also distinguish adjacent tree crowns with similar brightness but obvious color differences. The method was implemented in MATLAB® 2017a to generate the final tree crown delineation map.
2.7. Determining the Accuracy Indices
The commonly used precision evaluation methods include qualitative evaluation and quantitative evaluation. In this study, the method of visual evaluation was first adopted as the preliminary evaluation. The match between the delineation lines and the real tree crowns was assessed visually. Then, quantitative evaluation was carried out for a more accurate evaluation. It is difficult or even impossible to obtain an actual ground-based crown map directly. Therefore, for the methods evaluated in this paper, the accuracy of the quantitative evaluation were not an absolute measure but a relative one. In the process of evaluation, a reference crown map was generated by an independent and experienced manual delineation professional for superposition analysis with the target crown map generated by the delineation methods employed in this paper. In addition, all segments in the tree crown map of target were divided into five categories according to their spatial relationships between the reference segments and the target segments [8,22]. The whole evaluation process and the statistics of the number of these five categories were completed automatically in the designed programming language. The five evaluation categories are as follows:
- (a)
- Merged—there are multiple reference crowns for which more than half the area is covered by a target segment at the corresponding position.
- (b)
- Missing—a reference crown covers more than half the area of no target segment at the corresponding position.
- (c)
- Nearly matched—for a reference crown and a target segment, their overlap exceeds 50% of only one segment.
- (d)
- Matched—for a reference crown and a target segment, their total respective overlaps exceed 50%.
- (e)
- Split—there is a complete crown in the reference crown, but there are multiple segments with more than half the area in the target crown at its corresponding position.
Based on the above definitions, both the matched and nearly matched crowns can be taken as correctly delineated crowns or equal segments, both the missed and merged crowns represent omission errors, and the split crowns represent commission errors.
3. Results
3.1. The Tree Crown Delineation Results of the Rainforest
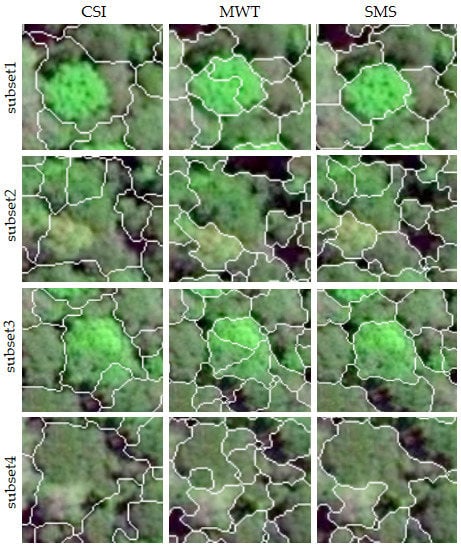
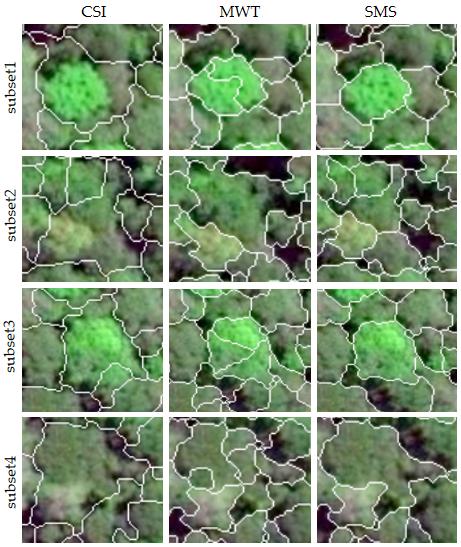
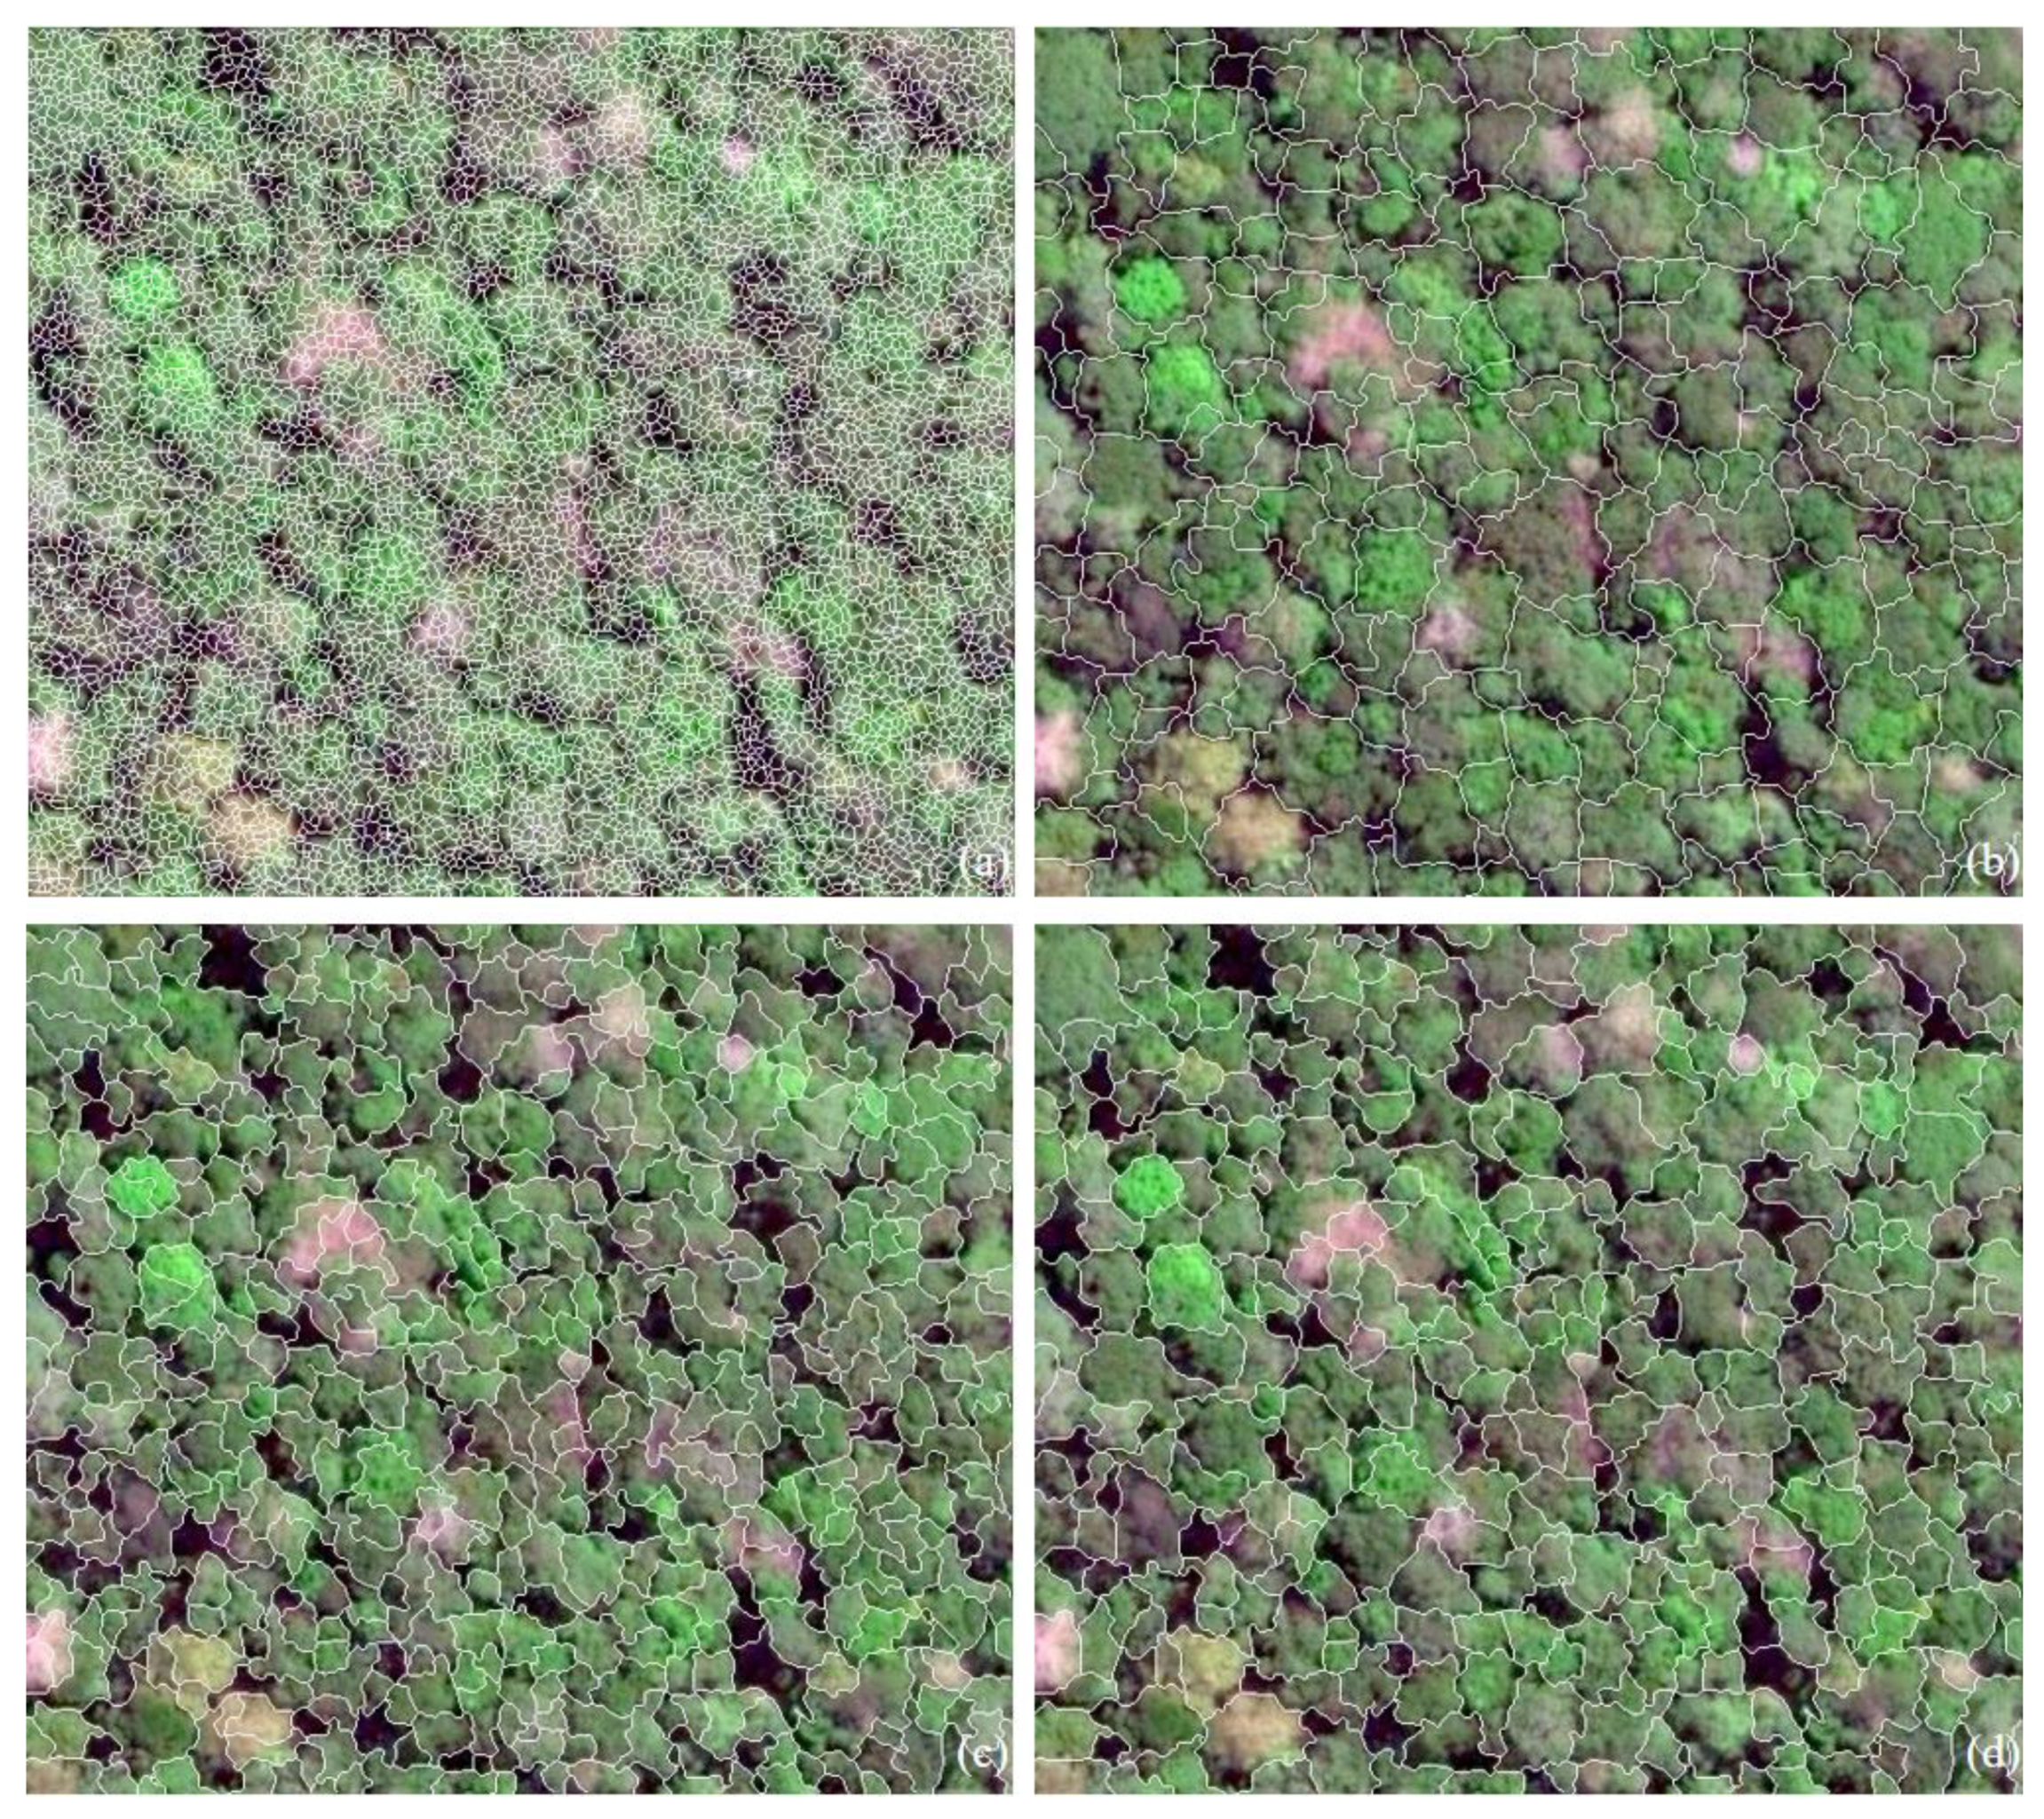
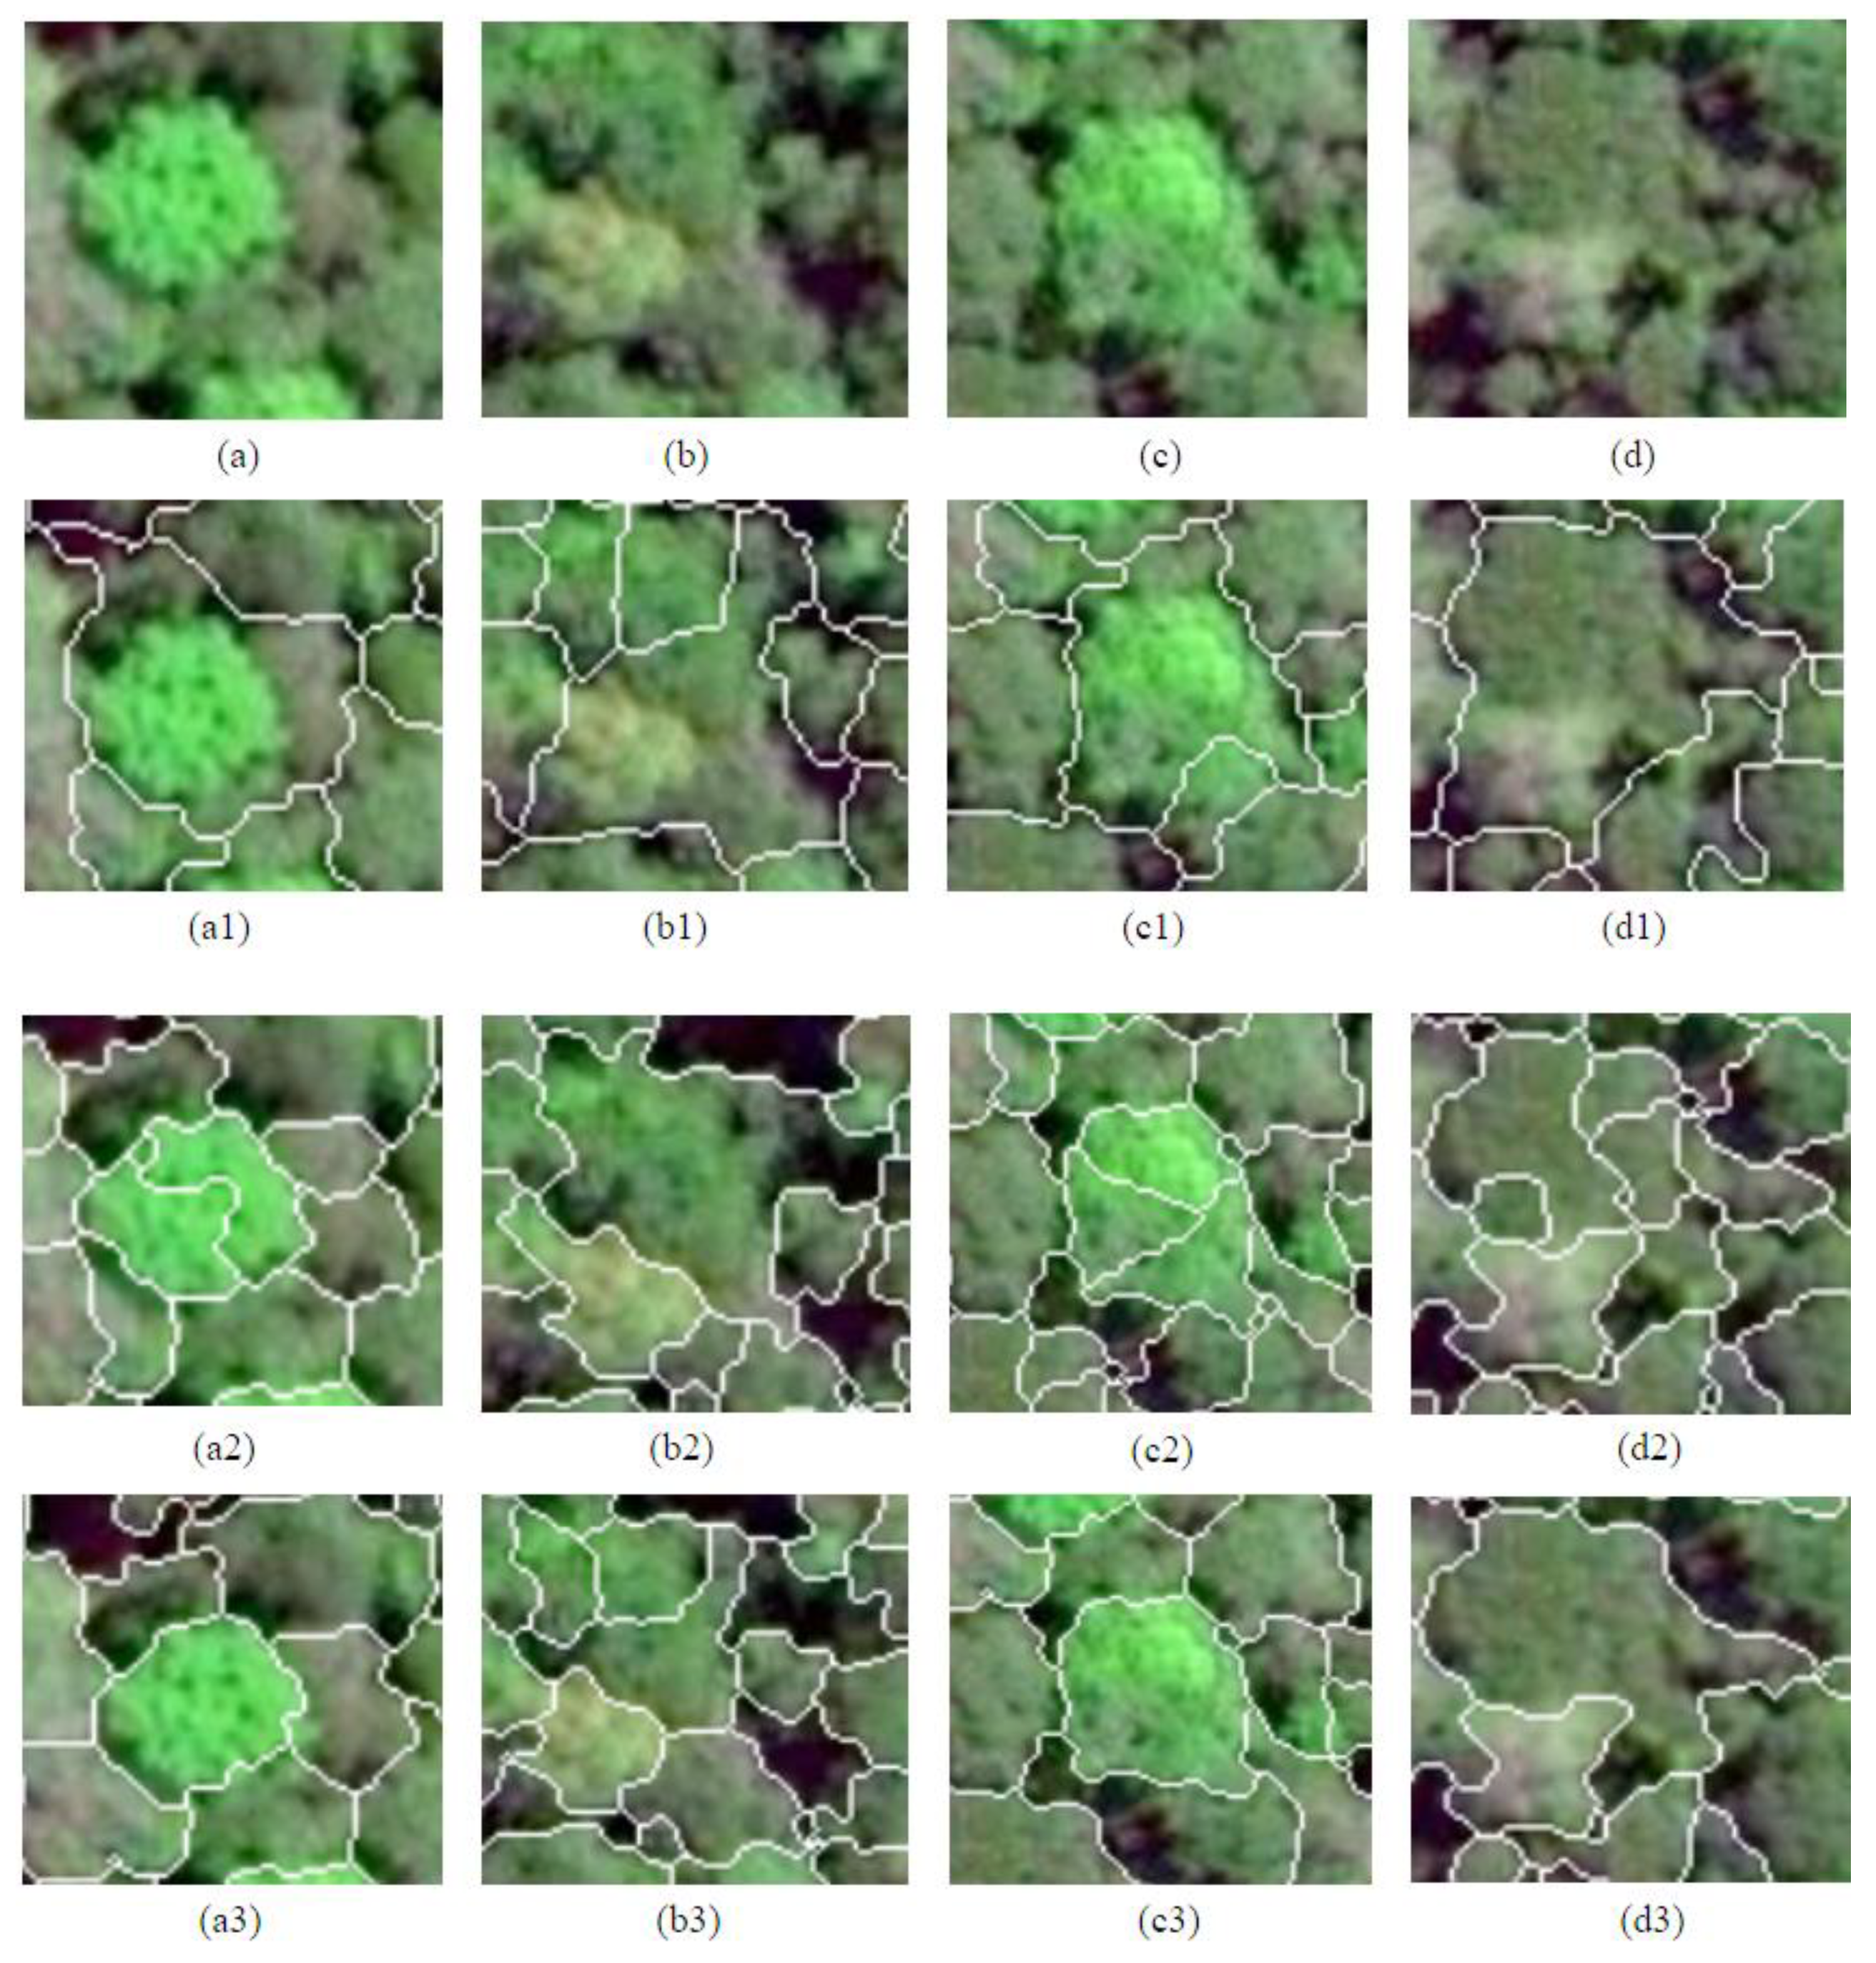
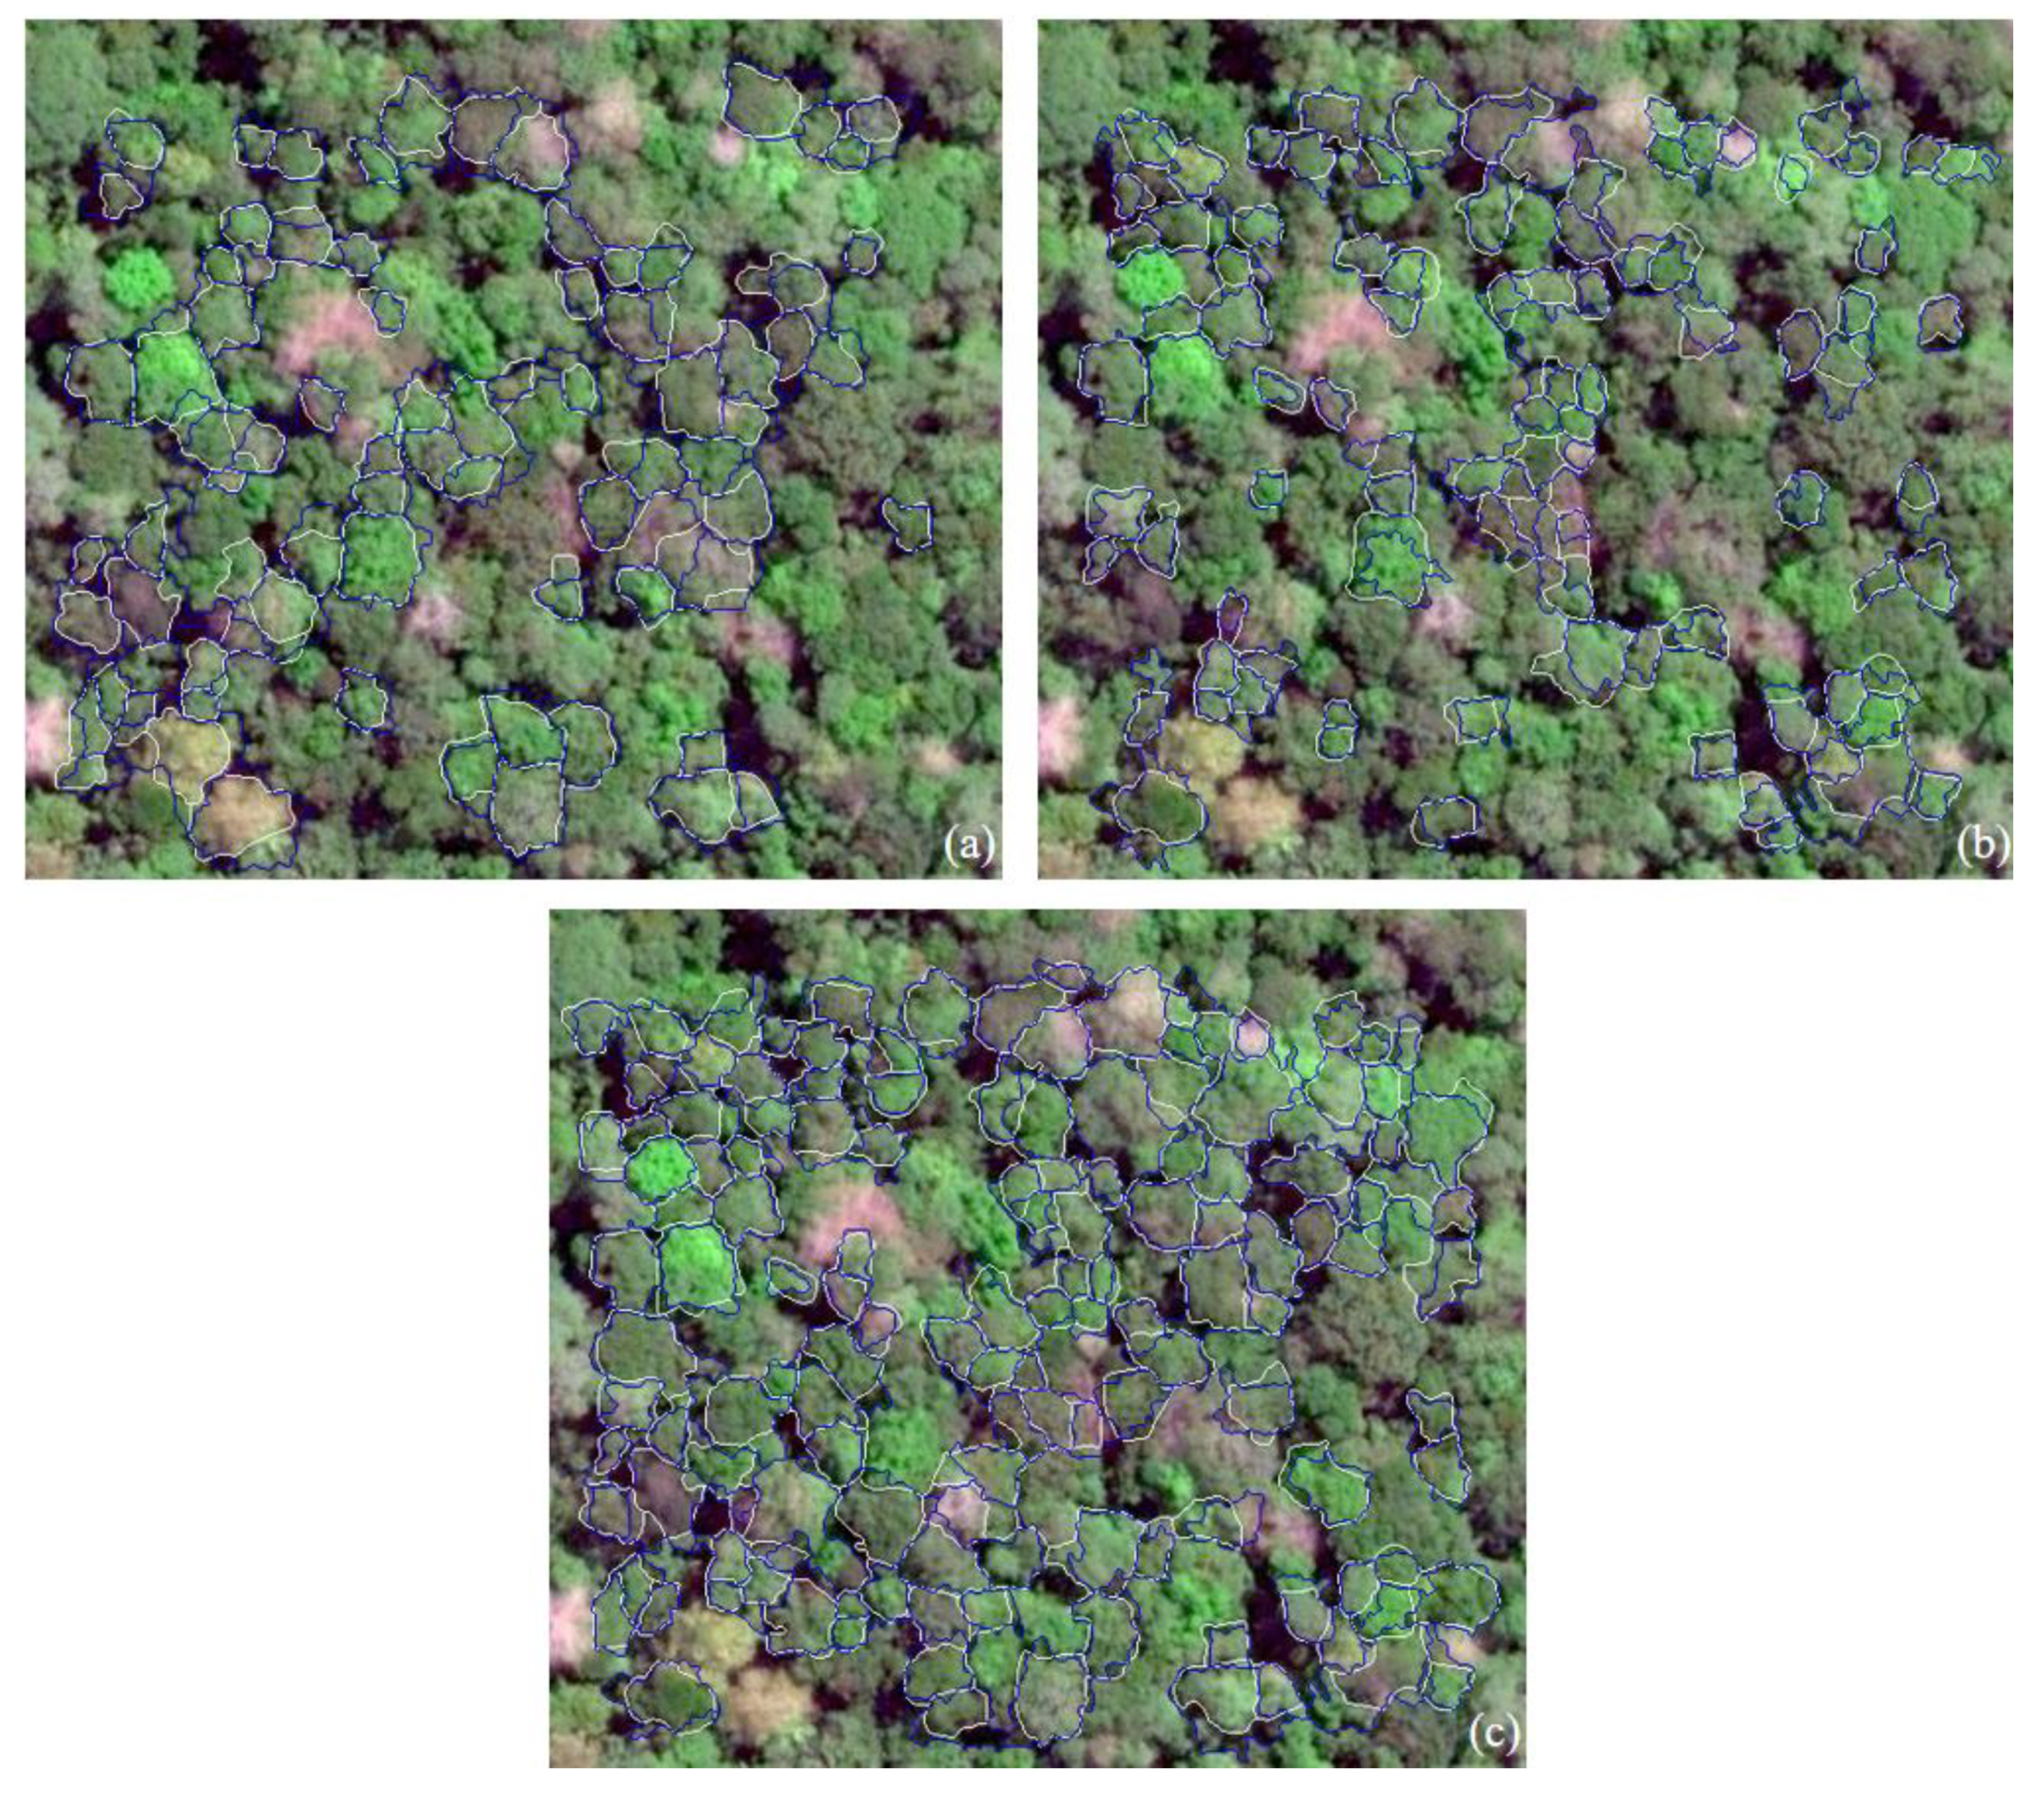
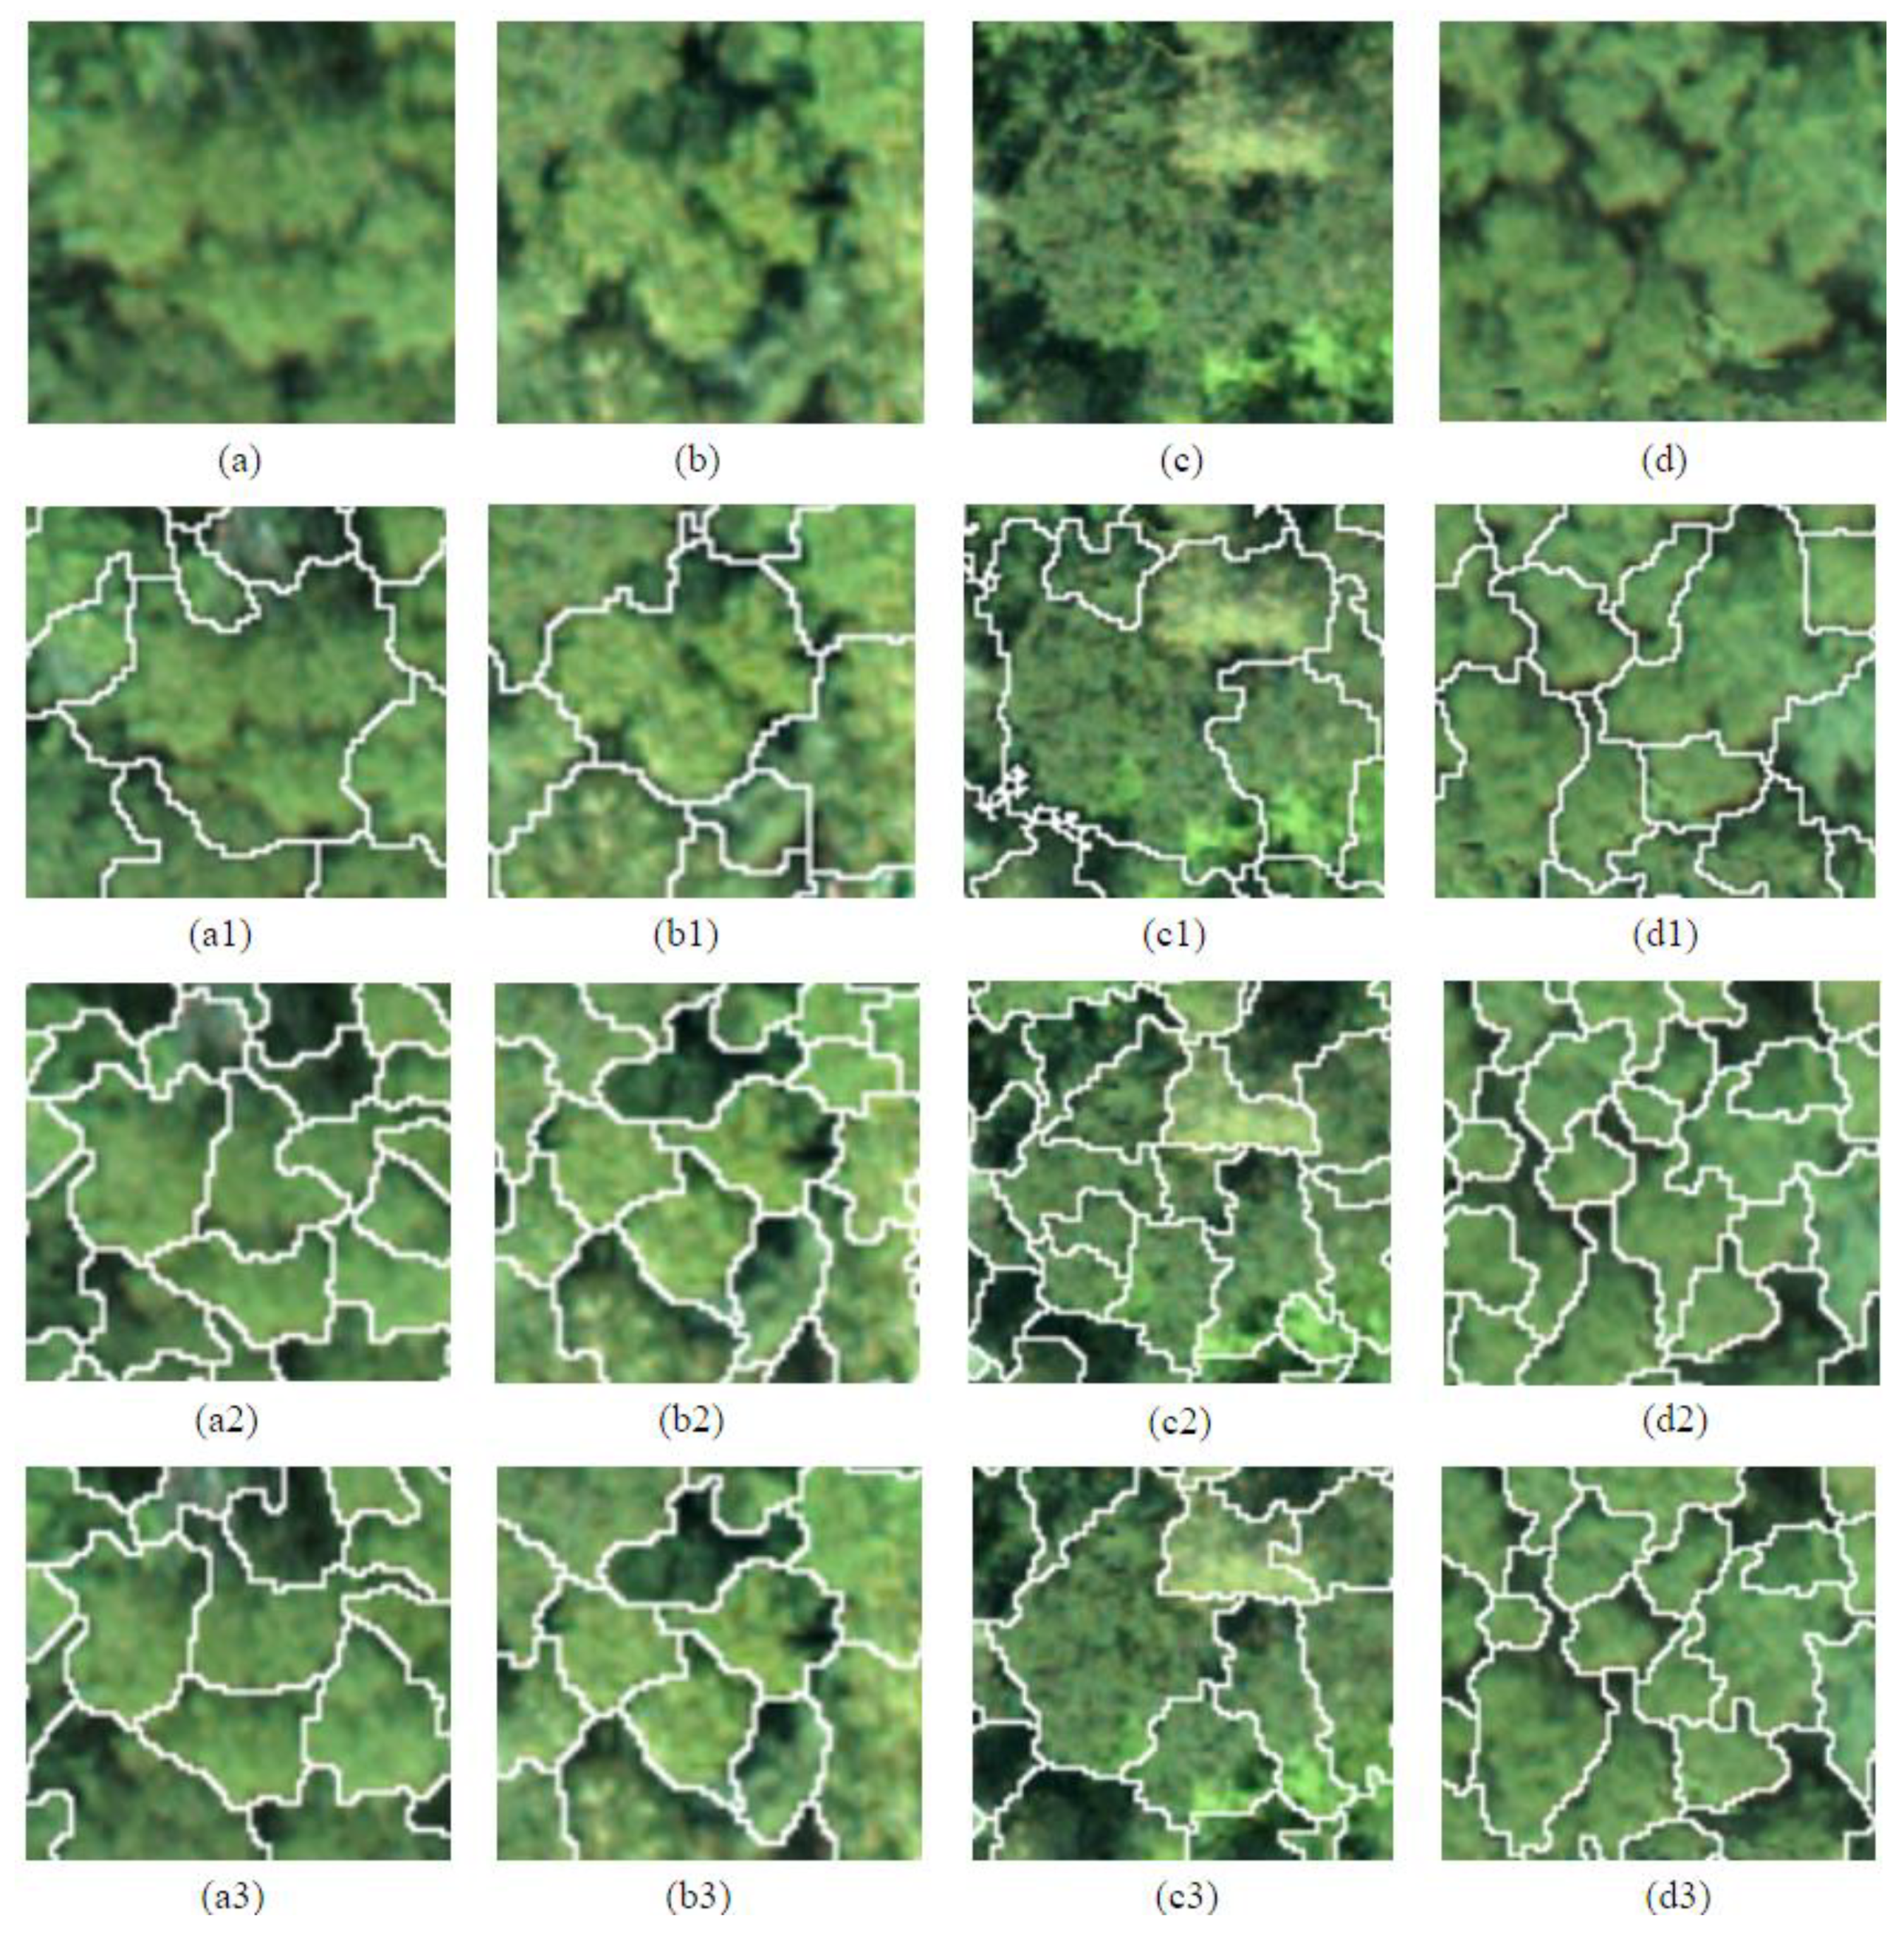
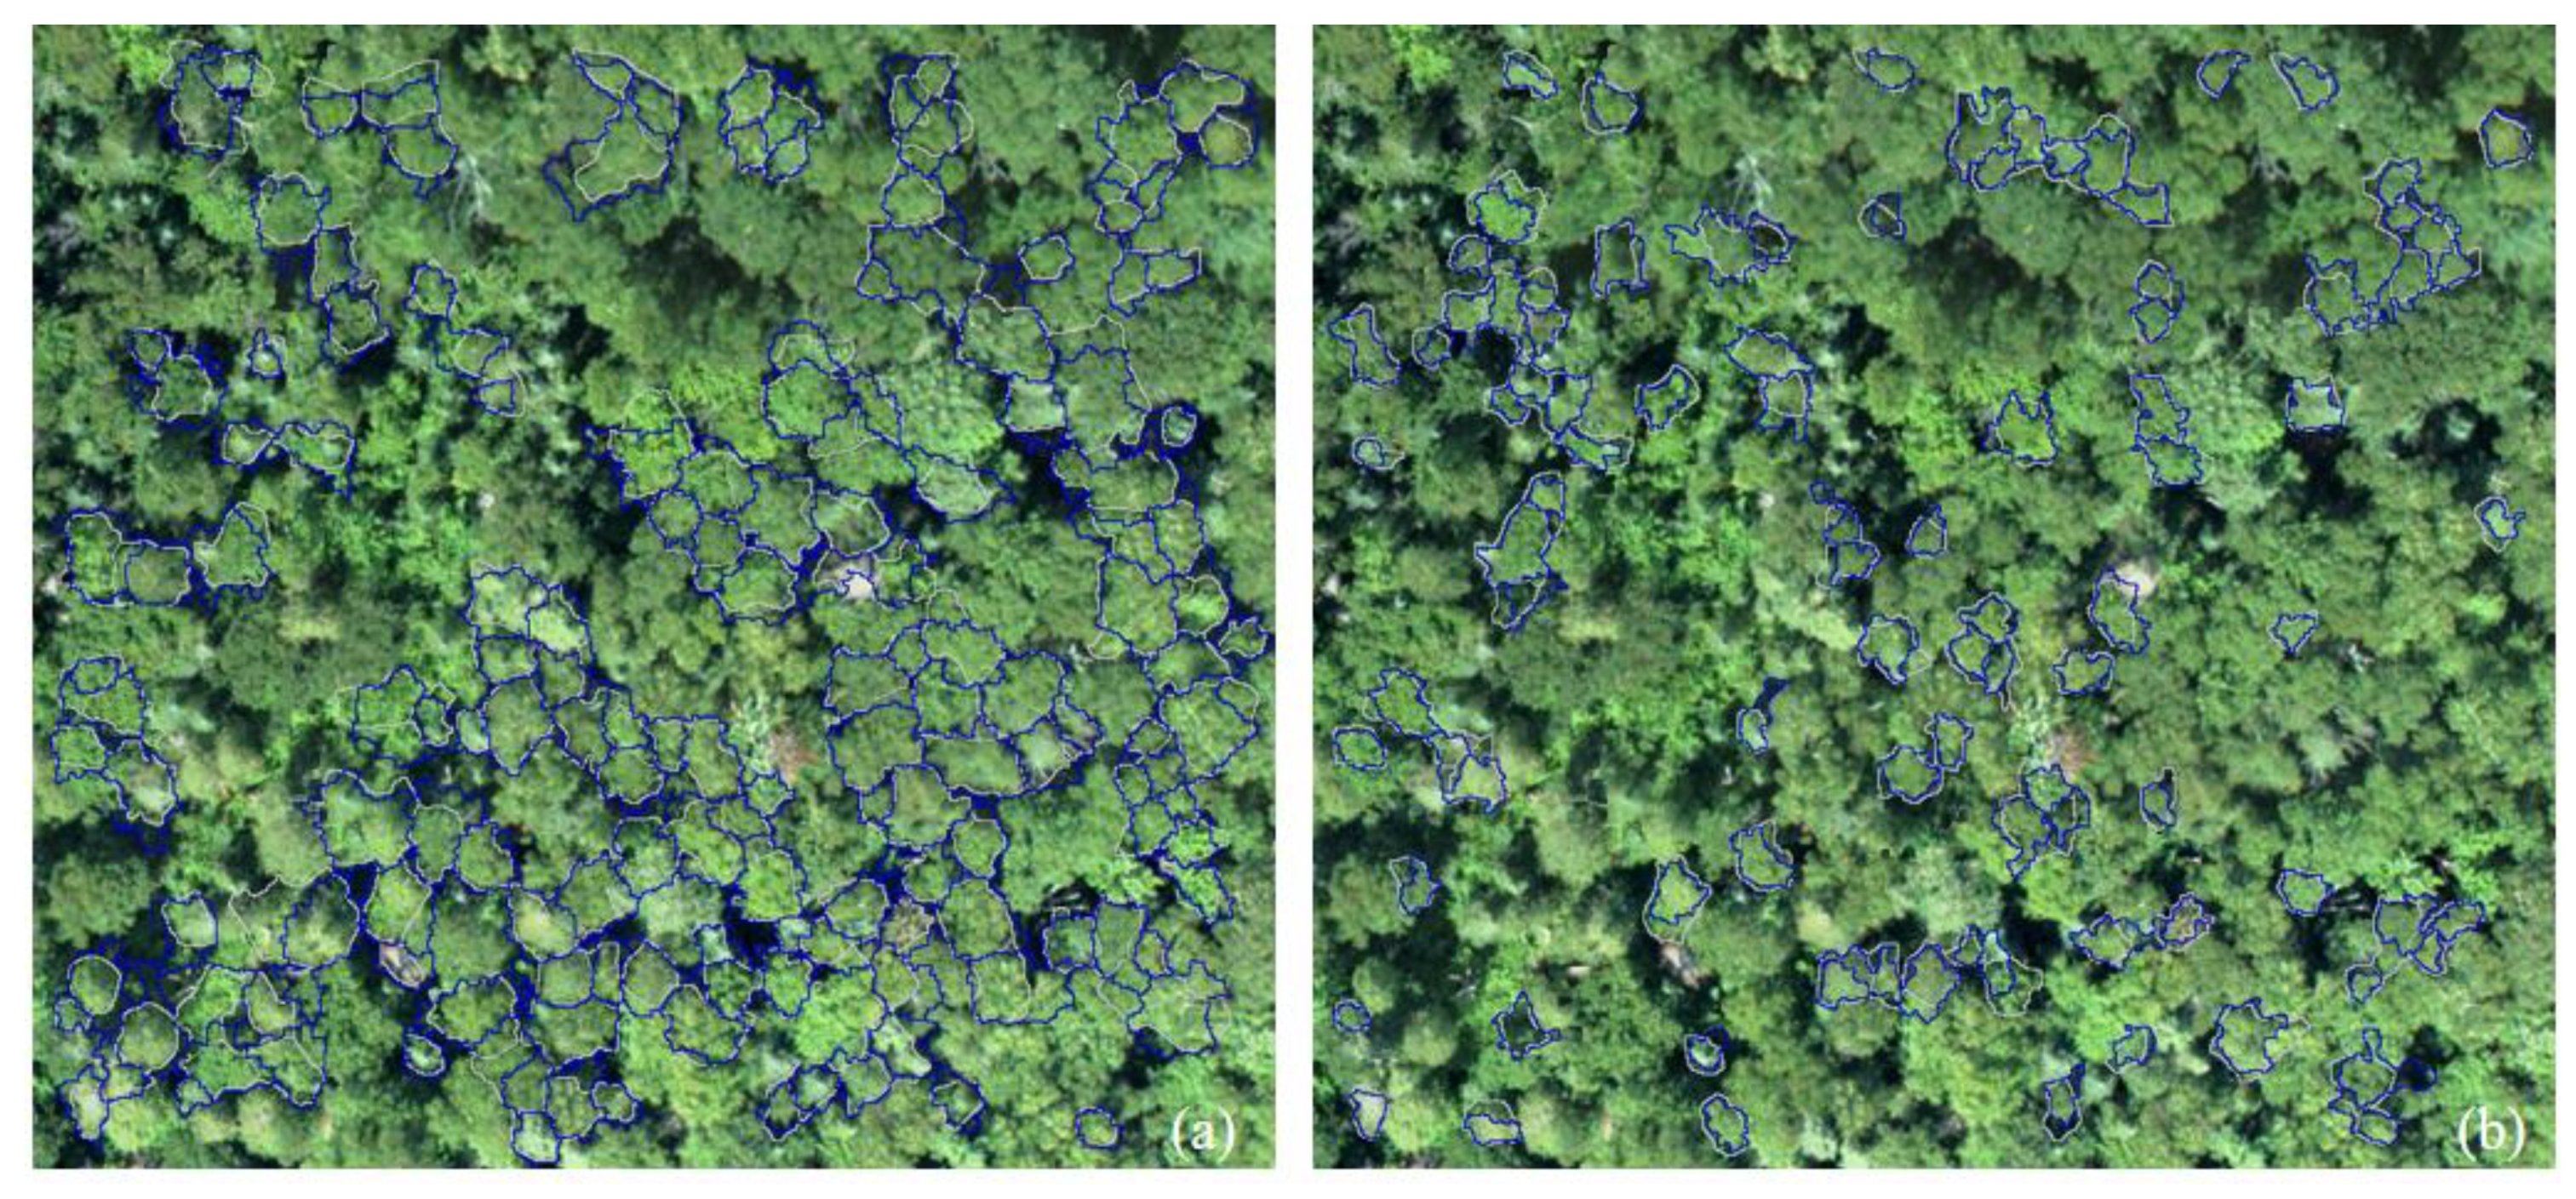
In order to evaluate the performances of the SMS method proposed, the traditional watershed segmentation method, the commonly used marker-controlled watershed segmentation (MWT) method, and the CSI method were also considered in the experiment. The final tree crown maps of the rainforest plot generated by the four methods are shown in Figure 9, some subsets of the maps are shown in Figure 10, the correctly delineated segments (matched and nearly matched target tree crowns) along with the corresponding reference tree crowns are shown in Figure 11, and the accuracy statistics of the maps are listed in Table 1. There are no detailed subsets displaying and precision statistics for the severe over-segmented tree crown map produced by the traditional watershed segmentation method.
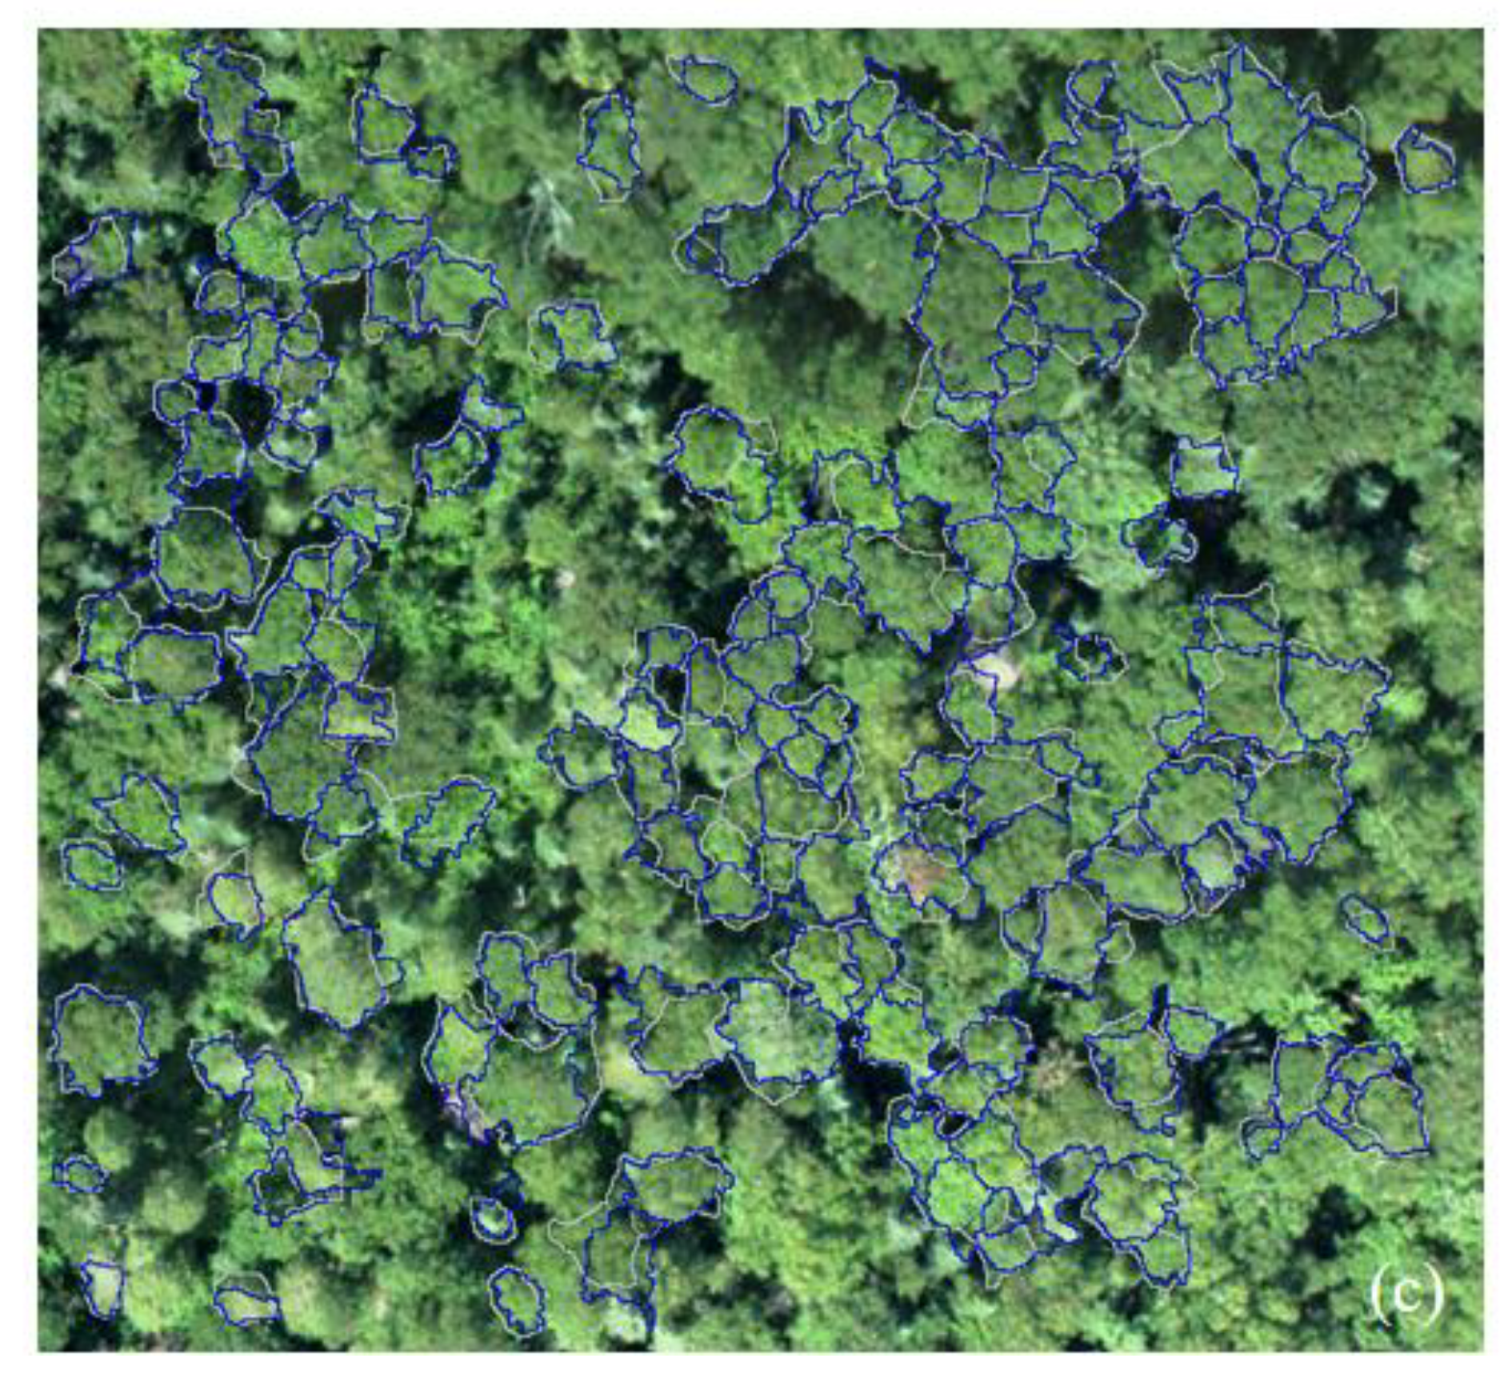
As can be seen from Figure 9 and Figure 10, the SMS method proposed in this study delineated more tree crowns with different colors and complete shapes than the three other methods employed in this experiment. Meanwhile, the shadow areas in the tree crown map generated by the SMS method are also delineated along edges. As can be seen from Table 1, 157 of the 205 reference crowns in the rainforest plot were properly delineated by the SMS method, 24 were merged, 7 were missed, and 17 were split, achieving an accuracy of 76.59%, which was improved by 25% as compared with the CSI method. In addition, the CSI method offers an omission error of 43.90%, whereas the SMS method yields a significantly lower value of 15.12%. It is demonstrated that the proposed method can effectively distinguish more tree crowns than the CSI method. The MWT method, as an improved version of the traditional watershed segmentation, is also apt to produce over-segmentation. In the experiment, the MWT approach offered a commission error of 35.61%, whereas the proposed SMS method gave a substantially lower commission error of 8.29%, indicating that the proposed new method can effectively reduce over-segmentation and commission error. Moreover, as illustrated in Figure 11, the correctly delineated segments (matched and nearly matched reference crowns) coincide well with the SMS-generated target segments (superimposed in blue), visually supporting the idea that the proposed new method can effectively delineate multi-scale tree crowns of different spectra within a closed forest.
3.2. The Tree Crown Delineation Results of the Deciduous Forest
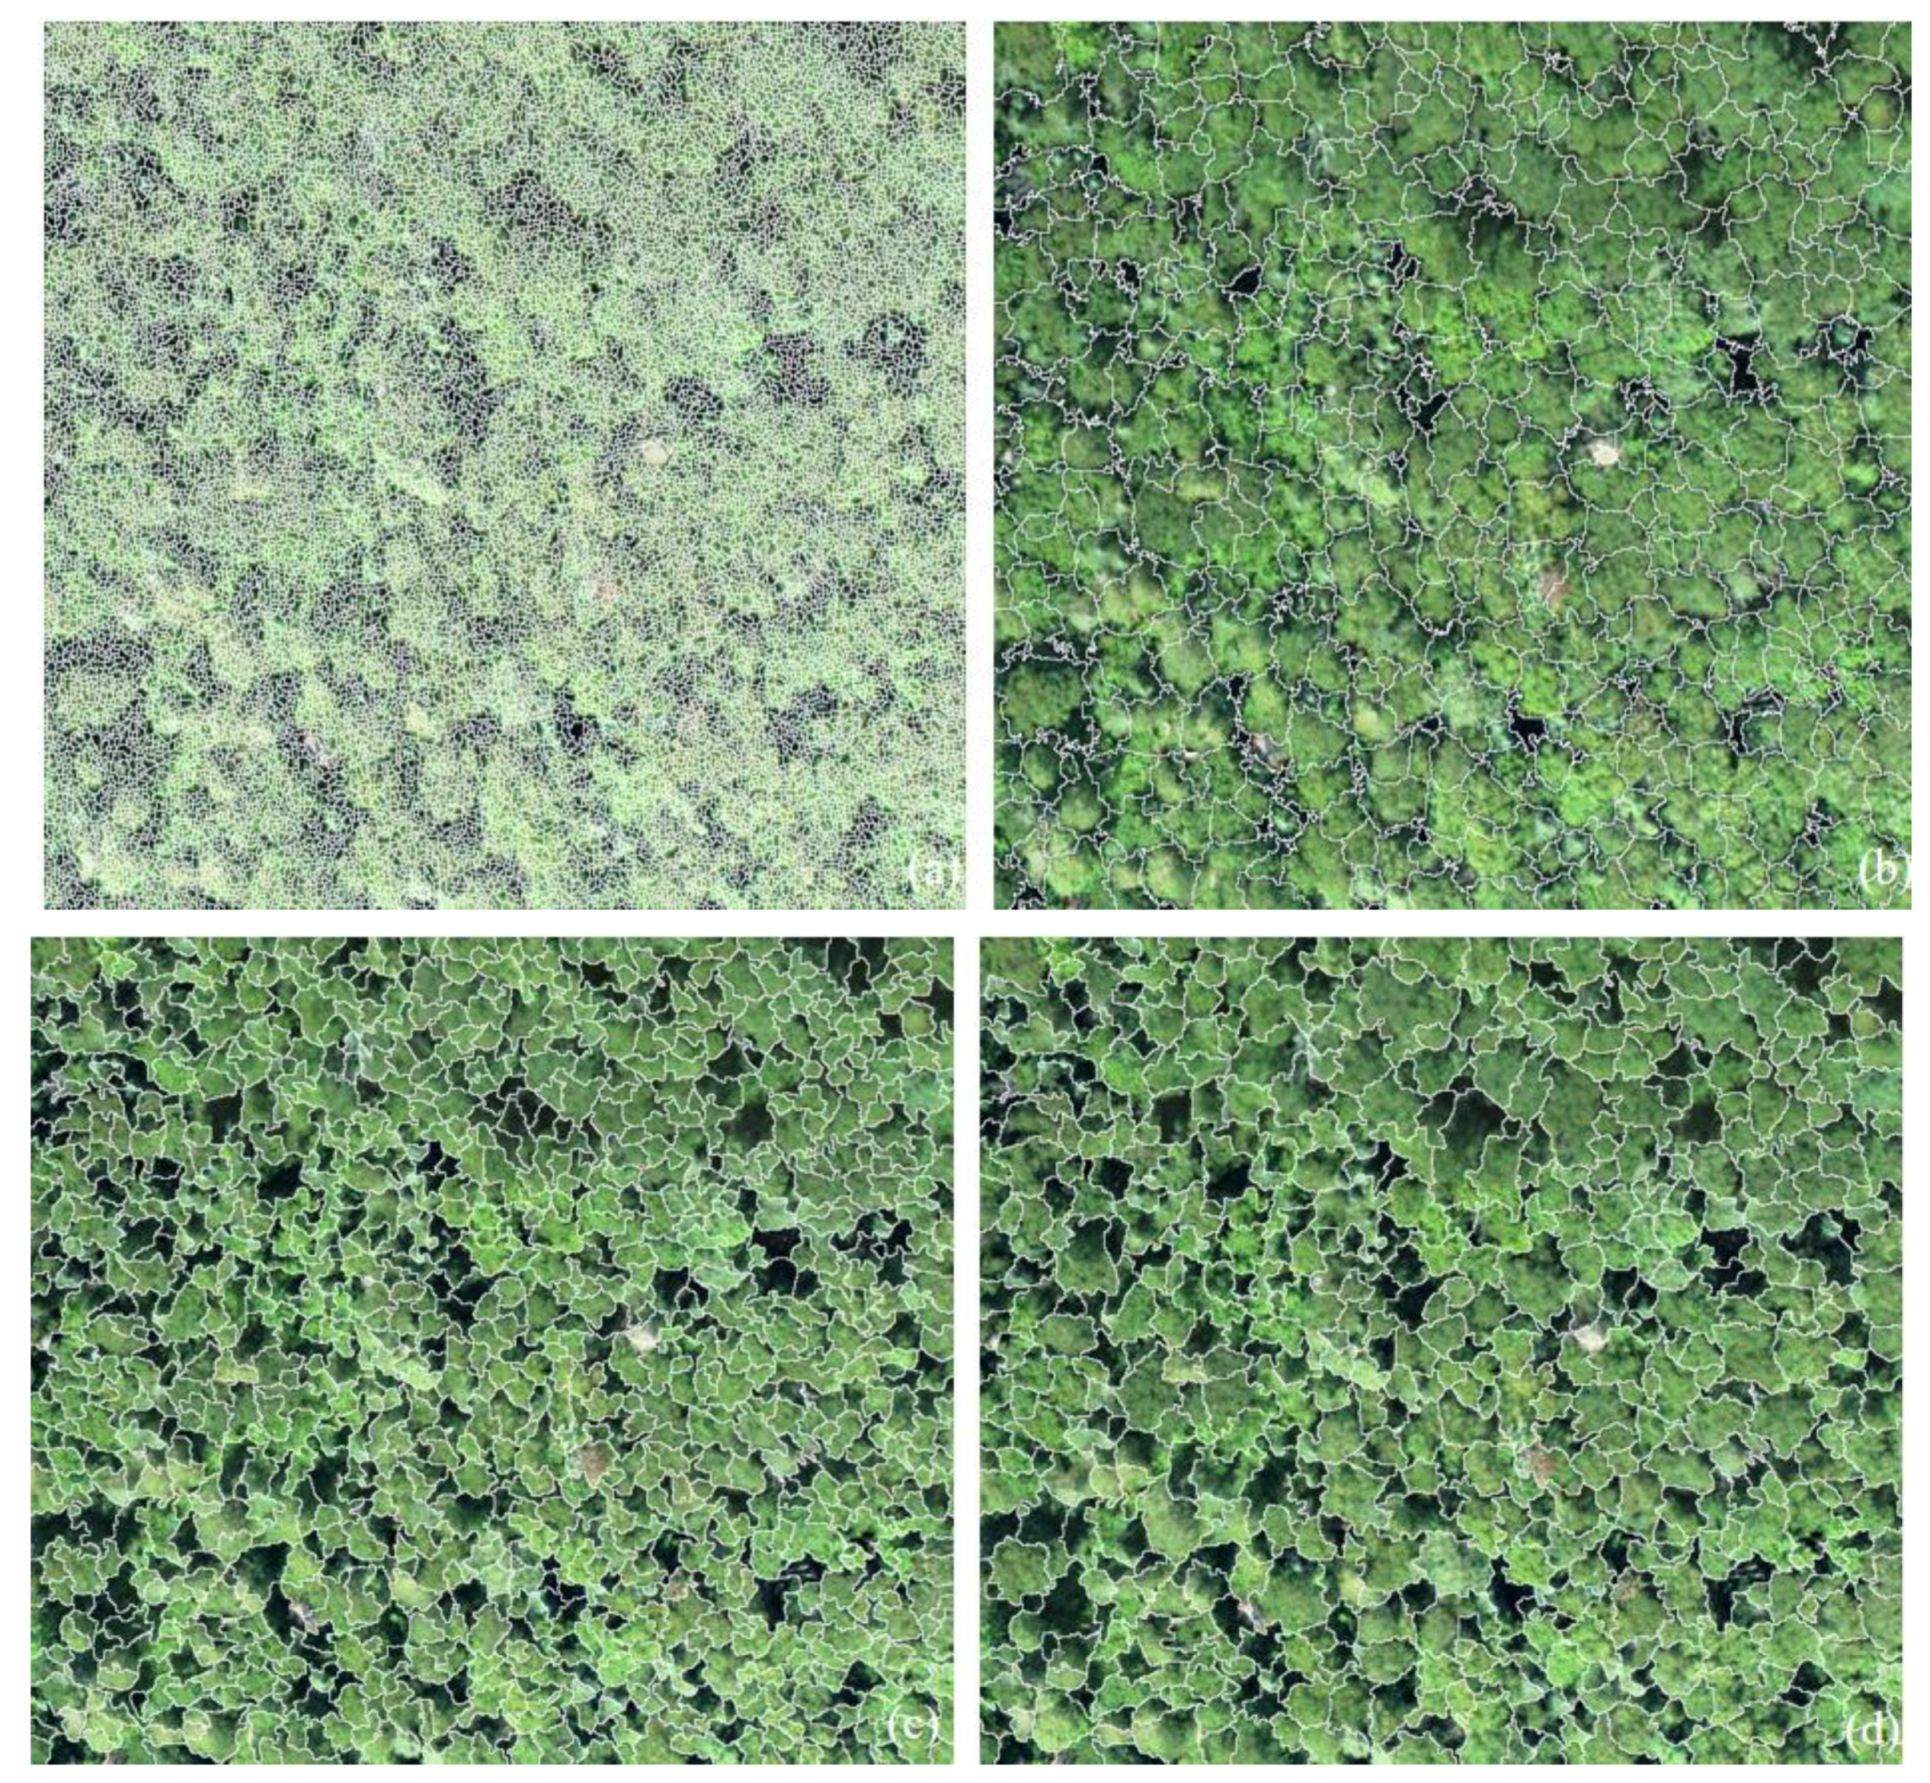
Besides the rainforest, the deciduous forest was also used to evaluate the performances of the SMS method proposed in this study. The final tree crown maps of the deciduous forest generated by the four methods (the traditional watershed segmentation, MWT, CSI, and the SMS methods) are shown in Figure 12, subsets of the maps are shown in Figure 13, the correctly delineated crowns along with the corresponding reference crowns are shown in Figure 14, and the accuracy statistics of the tree crown maps are shown in Table 2.
As can be seen from the detailed subsets of the deciduous forest image in Figure 12, the SMS method proposed was more effective to distinguish and delineate adjacent tree crowns. The boundaries of the tree crowns generated by the SMS method coincide with the edges of the reference tree crowns significantly better than those obtained by the CSI method. As shown in Table 2, 225 of the 356 reference crowns were properly delineated, 39 of the 356 reference crowns were merged, 40 were missed, and 152 were split by the SMS method. The SMS method offered an accuracy of 63.20%, about 9 percent higher than that yield by the CSI method, and an omission error of 22.19%, nearly 11 percent lower than that produced by the CSI method. Obviously, the MWT method produced plenty of split deciduous crowns, a high commission error of 47.47% and a low accuracy of 45.51%. As a contrast, the SMS proposed method effectively improved delineation, offering a significantly reduced commission error of 14.61% and a substantially improved accuracy of 63.20%.
4. Discussion
Based on spectral and multi-scale characteristics of tree crowns, an improved framework for individual tree crown delineation was proposed in this study. The framework makes full use of the spectral, vertical structure, and shape characteristics of tree crowns in multispectral imagery.
In this new method, an inverse morphological gradient image was employed rather than a commonly used brightness image, which synthetically retains the distinct spectral features of tree crowns. Multi-scale integration of slices of crowns was used based on the vertical structure of tree crowns, reducing the uncertainty of single-scale assessment of the vertical structure of tree crowns and retaining its multilevel features. Taking each treetop as a maximum region rather than a single point conforms to the true horizontal structure of the tree crown and effectively reduces the over-segmentation of the final delineation result. In the integration of multi-scale treetops of layers with respect to shape and spectra of crowns, crowns with distinct non-circular shapes will be removed and adjacent crowns with distinct spectral differences were separated, thus improving treetops and reducing the under-segmentation of the final crown maps.
Compared with the commonly used marker-controlled watershed segmentation method, the proposed SMS method is obviously more complicated, consisting of several iterative steps and a few parameters in the implementation process. However, it has been demonstrated in the experiment that those parameters are critical to the accuracy of deciduous tree crown delineation. Besides the commonly used marker-controlled watershed segmentation, the traditional watershed segmentation was also for comparison in the experiment, and offered significantly over-segmented tree crown maps. As an improved version of it, the marker-controlled watershed segmentation (MWT) provided a slight improvement in the delineation results. However, there were still obvious over-segmentation phenomena and serious commission error. In the MWT method, the markers are normally determined at a single scale, and it is difficult to take into account multiple scales. In fact, in this study, the markers at multiple scales were experimented in the MWT method, but it was difficult to determine an optimal one and the resulting crown maps would be unsatisfactory. When the scale was small, branches would be false taken as markers, and the delineation maps would be over-segmented. When the scale was slightly larger, small treetops would be ignored, and the resulting crown maps would be seriously under-segmented. The puzzle was effectively solved by taking into account multi-scale, although several parameters related had to be manually set, including a series of scales of crowns, a roundness threshold, and an SAM threshold, and multiple layers of treetops of crowns had to be recognized and iteratively integrated. This process avoids tedious trials of searching for a single optimal scale and improves the integrity of tree crowns of different scales.
Unlike the Crown Slices from Imagery (CSI) method, the SMS method can separate and delineate adjacent crowns with similar brightness but different spectra, which are prevalent in rainforests, deciduous, and mixed forests. The dividing lines generated by the SMS method can better fit the edges of the tree crown, while those obtained by the CSI method had mismatches in between-crown valleys. These mismatches were caused by multi-scale filtering. Although multi-scale filtering can suppress branches and objects with significantly different shapes or small sizes to avoid over-segmentation to some extent, it can also blur between-crown valleys in the original grey image. The CSI method takes the original grey image exactly as the base image for watershed segmentation, so it is difficult to make the CSI results coincide with the real crown boundaries.
However, in the new method, the gradient map is used to maintain the edge of the crown and such misalignment is eliminated because the segmentation lines go along the between-crown boundaries in the gradient map when watershed segmentation performs. Since the original CSI method works well in coniferous forests, as an improved version of the CSI method, the SMS approach was not specifically experimented in coniferous forests in this study. In fact, the new method aims at solving the problem of the lack of spectral data in ITC delineation and can enhance between-crown boundaries by integrating the spectral differences between adjacent tree crowns, thus it’s more suitable for dense deciduous forests and rainforests with abundant spectra.
High resolution three-band RGB imagery was used in this study to illustrate the universality and reproducibility of the SMS method proposed in this paper. Actually, the SMS method is suitable to multispectral images of three bands or any other dimensions and works better with the increase of band number. It is clear that, as the band number increases, the spectral differences between tree crowns will increase, along with the spectral angle between tree crowns. Large spectral differences will facilitate differentiating adjacent tree crowns. Readers could easily use the forest image download from the Google earth to reproduce and apply the SMS method in their own study. In addition, the spatial resolution of the images in the SMS method should be at decimeter level so that that the tree crowns in images can be correctly recognized and precisely delineated.
Due to the iterative and traversal process of the refined judgment of the multiple layers of treetops in the SMS method, the time and computation complexity are increased compared to current ITC delineation methods with simpler processes and fewer thresholds (such as the CSI method, the commonly used marker-controlled watershed employed in this study). Although the new method is not perfect in terms of computation complexity, it results in significant improvements in the accuracy of the delineated boundaries of the tree crown. Accurate crown boundaries provide the basis for subsequent forest analyses, such as fine forest survey. This research provides a novel perspective on ITC delineation based on spectral and multi-scale characteristics of deciduous tree crowns for future studies. Some image de-correlation and image decomposition can be utilized to enhance the spectral differences between tree crowns. Additionally, experiments using remote sensing data of more than three bands will be carried out in future work.
5. Conclusions
The main aim of this study was to propose an improved algorithm to solve the problem of automatic individual tree crown delineation in dense mixed forests, especially the rainforest and deciduous forest. To verify the effectiveness of the proposed method, two different remote sensing images were used and three other common methods were compared. The results show that the proposed method successfully extracted the tree crown with similar luminance but different spectra by using Spectral Angle Mapper value and ensured the integrity of tree crowns by using multi-scale. The relative delineation accuracy in the experimental rainforest and deciduous forest was up to 76.59% and 63.20%, respectively, namely, improved by 25% and 10% compared with the initial Crown Slices from Imagery (CSI) method. When compared with the commonly used marker-controlled watershed segmentation, the accuracies of the proposed method improved by 20% and 18% for the tree crown maps of the rainforest and deciduous forest, respectively. Based on the two experimental results, the proposed method was applicable to both the rainforest and deciduous forest, but better suited to rainforest areas in terms of the overall delineation accuracy. Combined with the experimental images that can be seen intuitively, the number of crowns with different colors in the rainforest is significantly larger than that in the deciduous forest, we conclude that the proposed method has more potential to delineate tree crowns with abundant spectral data in the image. Moreover, the tree crowns delineated by the proposed method can better fit the edges, because the gradient has the feature of well maintaining the edge of the image.
Author Contributions
L.Q. designed and completed the experiment and drafted the manuscript; L.J. and B.H. designed the methodology and provided feedback on the manuscript; H.L. and Y.T. gave comments on the method and modified the manuscript. All authors assisted in writing and improving the paper. All authors have read and agreed to the published version of the manuscript.
Funding
This study was funded by the Aerospace Information Research Institute, Chinese Academy of Sciences (grant no.: Y951150Z2F), the Science and Technology Major Project of Xinjiang Uygur Autonomous Region (No. 2018A03004) and the National Natural Science Foundation of China (No. 41972308).
Acknowledgments
The authors want to thank the Key Laboratory of Digital Earth Science for supporting this research with the hardware device. In addition, we are grateful to the anonymous reviewers who provided helpful comments and suggestions to improve the manuscript.
Conflicts of Interest
The authors declare no conflict of interest.
References
- Bulatov, D.; Wayand, I.; Schilling, H. Automatic Tree-Crown Detection in Challenging Scenarios. Int. Arch. Photogramm. Remote Sens. Spat. Inf. Sci. 2016, 41, 575–582. [Google Scholar] [CrossRef]
- Edmondson, J.L.; Stott, I.; Davies, Z.G.; Gaston, K.J.; Leake, J.R. Soil Surface Temperatures Reveal Moderation of the Urban Heat Island Effect by Trees and Shrubs. Sci. Rep. 2016, 6, 33708. [Google Scholar] [CrossRef] [Green Version]
- Yang, J.; He, Y.; Caspersen, J. A Multi-Band Watershed Segmentation Method for Individual Tree Crown Delineation from High Resolution Multispectral Aerial Image. IEEE Geosci. Remote Sens. Symp. 2014, 7, 1588–1591. [Google Scholar]
- Moradi, A.; Satari, M.; Momeni, M. Individual Tree of Urban Forest Extraction from Very High Density LiDAR Data. Int. Arch. Photogramm. Remote Sens. Spat. Inf. Sci. 2016, 41, 337–343. [Google Scholar] [CrossRef]
- Chemura, A.; Van Duren, I.; Van Leeuwen, L.M. Determination of the Age of Oil Palm from Crown Projection Area Detected from Worldview-2 Multispectral Remote Sensing Data: The Case of Ejisu-Juaben District, Ghana. ISPRS J. Photogramm. Remote Sens. 2015, 100, 118–127. [Google Scholar] [CrossRef]
- Yin, W.; Yang, J.; Yamamoto, H.; Li, C. Object-Based Larch Tree-Crown Delineation Using High-Resolution Satellite Imagery. Int. J. Remote Sens. 2015, 36, 822–844. [Google Scholar] [CrossRef]
- Allouis, T.; Durrieu, S.; Vega, C.; Couteron, P. Stem Volume and Above-Ground Biomass Estimation of Individual Pine Trees from LiDAR Data: Contribution of Full-Waveform Signals. IEEE J. Sel. Top. Appl. Earth Obs. Remote Sens. 2013, 6, 924–934. [Google Scholar] [CrossRef]
- Hu, B.; Li, J.; Jing, L.; Aaron, J. Improving the Efficiency and Accuracy of Individual Tree Crown Delineation from High-Density LiDAR Data. Int. J. Appl. Earth Obs. Geoinf. 2014, 26, 145–155. [Google Scholar] [CrossRef]
- Saarinen, N.; Vastaranta, M.; Näsi, R.; Rosnell, T.; Hakala, T.; Honkavaara, E.; Wulder, M.A.; Luoma, V.; Tommaselli, A.M.G.; Imai, N.N.; et al. Assessing Biodiversity in Boreal Forests with UAV-Based Photogrammetric Point Clouds and Hyperspectral Imaging. Remote Sens. 2018, 10, 338. [Google Scholar] [CrossRef] [Green Version]
- Gougeon, F.A. A Crown-Following Approach to the Automatic Delineation of Individual Tree Crowns in High Spatial Resolution Aerial Images. Can. J. Remote Sens. 1995, 21, 274–284. [Google Scholar] [CrossRef]
- Ke, Y.; Quackenbush, L.J. A Comparison of Three Methods for Automatic Tree Crown Detection and Delineation from High Spatial Resolution Imagery. Int. J. Remote Sens. 2011, 32, 3625–3647. [Google Scholar] [CrossRef]
- Warner, T.A.; Lee, J.Y.; McGraw, J.B. Delineation and Identification of Individual Trees in the Eastern Deciduous Forest. In Proceedings of the International Forum: Automated Interpretation of High Spatial Resolution Digital Imagery for Forestry, Victoria, BC, Canada, 10–12 February 1998; Hill, D.A., Leckie, D.G., Eds.; Natural Resources Canada, Canadian Forest Service, Pacific Forestry Centre: Victoria, BC, Canada, 1998; pp. 81–91. [Google Scholar]
- Erikson, M. Segmentation of Individual Tree Crowns in Colour Aerial Photographs Using Region Growing Supported by Fuzzy Rules. Can. J. For. Res. 2003, 33, 1557–1563. [Google Scholar] [CrossRef]
- Brandtberg, T.; Walter, F. Automated Delineation of Individual Tree Crowns in High Spatial Resolution Aerial Images by Multiple-Scale Analysis. Mach. Vis. Appl. 1998, 11, 64–73. [Google Scholar] [CrossRef]
- Koch, B.; Heyder, U.; Weinacker, H. Detection of Individual Tree Crowns in Airborne LiDAR Data. Photogramm. Eng. Remote Sens. 2006, 72, 357–363. [Google Scholar] [CrossRef] [Green Version]
- Chen, Q.; Baldocchi, D.; Gong, P.; Kelly, M. Isolating Individual Trees in a Savanna Woodland Using Small Footprint LiDAR Data. Photogramm. Eng. Remote Sens. 2006, 72, 923–932. [Google Scholar] [CrossRef] [Green Version]
- Gong, P.; Sheng, Y.; Biging, G.S. 3D Model-Based Tree Measurement from High Resolution Aerial Imagery. Photogramm. Eng. Remote Sens. 2002, 68, 1203–1212. [Google Scholar]
- Stagakis, S.; González-Dugo, V.; Cid, P.; Guillén-Climent, M.L.; Zarco-Tejada, P.J. Monitoring Water Stress and Fruit Quality in an Orange Orchard Under Regulated Deficit Irrigation Using Narrow-Band Structural and Physiological Remote Sensing Indices. ISPRS J. Photogramm. Remote Sens. 2012, 71, 47–61. [Google Scholar] [CrossRef] [Green Version]
- Dalponte, M.; Ørka, H.O.; Ene, L.T.; Gobakken, T.; Næsset, E. Tree Crown Delineation and Tree Species Classification in Boreal Forests Using Hyperspectral and ALS Data. Remote Sens. Environ. 2014, 140, 306–317. [Google Scholar] [CrossRef]
- Martin, W.; Michael, W.; Mallet, C.; Brédif, M.A. Classification-Segmentation Framework for the Detection of Individual Trees in Dense MMS Point Cloud Data Acquired in Urban Areas. Remote Sens. 2017, 9, 277–305. [Google Scholar]
- Grigorijs, G.; Stefan, M.; Shaun, L.; Andrew, E. Efficiency of Individual Tree Detection Approaches Based on Light-Weight and Low-Cost UAS Imagery in Australian Savannas. Remote Sens. 2018, 10, 161. [Google Scholar] [CrossRef] [Green Version]
- Jing, L.; Hu, B.; Noland, T.; Li, J. An Individual Tree Crown Delineation Method Based on Multi-Scale Segmentation of Imagery. ISPRS J. Photogramm. Remote Sens. 2012, 70, 88–98. [Google Scholar] [CrossRef]
- Fang, F.; Im, J.; Lee, J.; Kim, K. An Improved Tree Crown Delineation Method Based on Live Crown Ratios from Airborne LiDAR Data. Giscience Remote Sens. 2016, 53, 402–419. [Google Scholar] [CrossRef]
- Chloe, B.; Heiko, B.; Kirsten, B.; James, E.; Sam, M.; Suárez, J. Individual Tree Crown Delineation from Airborne Laser Scanning for Diseased Larch Forest Stands. Remote Sens. 2017, 9, 231. [Google Scholar] [CrossRef] [Green Version]
- Brandtberg, T. Individual Tree-Based Species Classification in High Spatial Resolution Aerial Images of Forests Using Fuzzy Sets. Fuzzy Sets Syst. 2002, 132, 371–387. [Google Scholar] [CrossRef]
- Wang, L.A. Multi-scale Approach for Delineating Individual Tree Crowns with Very High Resolution Imagery. Photogramm. Eng. Remote Sens. 2010, 76, 371–378. [Google Scholar] [CrossRef]
- Yang, J.; He, Y.; Caspersen, J.P.; Jones, T.A. Delineating Individual Tree Crowns in an Uneven-Aged, Mixed Broadleaf Forest Using Multispectral Watershed Segmentation and Multiscale Fitting. IEEE J. Sel. Top. Appl. Earth Obs. Remote Sens. 2016, 10, 1390–1401. [Google Scholar] [CrossRef]
- Bernd, M.W.; Heipke, C. Automatic Extraction and Delineation of Single Trees from Remote Sensing Data. Mach. Vis. Appl. 2007, 18, 317–330. [Google Scholar]
- Palenichka, R.; Doyon, F.; Lakhssassi, A.; Zaremba, M.B. Multi-Scale Segmentation of Forest Areas and Tree Detection in LiDAR Images by the Attentive Vision Method. IEEE J. Sel. Top. Appl. Earth Obs. Remote Sens. 2013, 6, 1313–1323. [Google Scholar] [CrossRef]
- Jing, L.; Hu, B.; Li, J.; Noland, T.; Guo, H. Automated Tree Crown Delineation from Imagery Based on Morphological Techniques. IOP Conf. Ser. Earth Environ. Sci. 2014, 17, 012066. [Google Scholar] [CrossRef] [Green Version]
- Xiao, Z.; Shi, J.; Chang, Q. Automatic Image Segmentation Algorithm Based on PCNN and Fuzzy Mutual Information. In Proceedings of the 9th IEEE International Conference on Computer and Information Technology, CIT 2009, Xiamen, China, 11–14 October 2009; Volume 1, pp. 241–245. [Google Scholar]
- Duan, F.; Wan, Y.; Deng, L. A Novel Approach for Coarse-To-Fine Windthrown Tree Extraction Based on Unmanned Aerial Vehicle Images. Remote Sens. 2017, 9, 306. [Google Scholar] [CrossRef]
- Asner, G.P.; Martin, R.E.; Keith, L.M.; Heller, W.P.; Hughes, M.A.; Vaughn, N.R.; Hughes, R.F.; Balzotti, C. A Spectral Mapping Signature for the Rapid Ohia Death (ROD) Pathogen in Hawaiian Forests. Remote Sens. 2018, 10, 404. [Google Scholar] [CrossRef] [Green Version]
- Haralick, R.M.; Sternberg, S.R.; Zhuang, X. Image Analysis Using Mathematical Morphology. IEEE Trans. Pattern Anal. Mach. Intell. 1987, 4, 532–550. [Google Scholar] [CrossRef]
- Sternberg, S.R. Grayscale Morphology. Comput. Vis. Graph. Image Process. 1986, 35, 333–355. [Google Scholar] [CrossRef]
- Soille, P. Morphological Image Analysis: Principles and Applications. Sens. Rev. 1999, 28, 800–801. [Google Scholar]
- Plaza, A.; Martínez, P.J.; Pérez, R.M.; Plaza, J. Spatial/Spectral Endmember Extraction by Multidimensional Morphological Operations. IEEE Trans. Geosci. Remote Sens. 2002, 40, 2025–2041. [Google Scholar] [CrossRef] [Green Version]
- Li, P.; Xiao, X. Multispectral Image Segmentation by a Multichannel Watershed-Based Approach. Int. J. Remote Sens. 2007, 28, 4429–4452. [Google Scholar] [CrossRef]
- Li, P.; Guo, J.; Song, B.; Xiao, X. A Multilevel Hierarchical Image Segmentation Method for Urban Impervious Surface Mapping Using Very High Resolution Imagery. IEEE J. Sel. Top. Appl. Earth Obs. Remote Sens. 2011, 4, 103–116. [Google Scholar] [CrossRef]
- Deng, G.; Cahill, L.W. An Adaptive Gaussian Filter for Noise Reduction and Edge Detection. In Proceedings of the 1993 IEEE Conference Record Nuclear Science Symposium and Medical Imaging Conference, San Francisco, CA, USA, 31 October–6 November 1993; pp. 1615–1619. [Google Scholar]
- Costa, L.D.F.; Cesar, R.M., Jr. Shape Analysis and Classification: Theory and Practice; CRC Press: Boca Raton, FL, USA, 2000; p. 680. [Google Scholar]
- Kruse, F.A.; Lefkoff, A.B.; Boardman, J.W.; Heidebrecht, K.B.; Shapiro, A.T.; Barloon, P.J.; Goetz, A.F.H. The Spectral Image Processing System (SIPS)—Interactive Visualization and Analysis of Imaging Spectrometer Data. Remote Sens. Environ. 1993, 44, 145–163. [Google Scholar] [CrossRef]
- Wang, L.; Gong, P.; Biging, G.S. Individual Tree-Crown Delineation and Treetop Detection in High-Spatial-Resolution Aerial Imagery. Photogramm. Eng. Remote Sens. 2004, 70, 351–358. [Google Scholar] [CrossRef] [Green Version]
- Beucher, S.; Lantuejoul, C. Use of Watersheds in Contour Detection. In Proceedings of the International Workshop on Image Processing, Realtime Edge and Motion Detection/Estimation, Rennes, France, 17–21 September 1979; pp. 12–21. [Google Scholar]
- Vincent, L.; Soille, P. Watersheds in Digital Spaces: An Efficient Algorithm Based on Immersion Simulations. IEEE Trans. Pattern Anal. Mach. Intell. 1991, 13, 583–598. [Google Scholar] [CrossRef] [Green Version]
- Niccolai, A.; Hohl, A.; Niccolai, M.; Oliver, C.D. Integration of Varying Spatial, Spectral and Temporal High-Resolution Optical Images for Individual Tree Crown Isolation. Int. J. Remote Sens. 2010, 31, 5061–5088. [Google Scholar] [CrossRef]
Figure 1.
The locations of the two experimental plots. The rainforest (a) and the deciduous forest (b).
Figure 1.
The locations of the two experimental plots. The rainforest (a) and the deciduous forest (b).

Figure 2.
The overall process of the proposed method.

Figure 3.
The first principle component (PC1) (a) and inverse gradient image (b).

Figure 4.
The integration of the series of slices. Initial layers (a), updated layers (b) and final layer (c).
Figure 4.
The integration of the series of slices. Initial layers (a), updated layers (b) and final layer (c).

Figure 5.
Integrating two layers of slices at different scales. Fine layer (a), coarse layer (b), sifted coarse layer (c), combined layer (d), and re-sifted combined layer (e).
Figure 5.
Integrating two layers of slices at different scales. Fine layer (a), coarse layer (b), sifted coarse layer (c), combined layer (d), and re-sifted combined layer (e).

Figure 6.
An image objects composed by one (a), two (b), three (c), or four (d) identical crown.

Figure 7.
Demonstration of the judgment process when there is only one treetop in the fine layer. Combined layer (a), fine layer (b), coarse layer (c), final output layer (d).
Figure 7.
Demonstration of the judgment process when there is only one treetop in the fine layer. Combined layer (a), fine layer (b), coarse layer (c), final output layer (d).

Figure 8.
Demonstration of the judgment process when there is more than one treetop in the fine layer. Combined layer (a), fine layer (b), coarse layer (c), final output layer if all the Spectral Angle Mapper (SAMs) are greater than the threshold (d), final output layer if any of the SAMs is less than the threshold (e).

Figure 9.
The tree crown maps of the rainforest plot obtained by the traditional watershed segmentation (a), the Crown Slices from Imagery (CSI) (b), commonly used marker-controlled watershed segmentation (MWT) (c), and the proposed spectral and multi-scale features (SMS) (d) methods, respectively.
Figure 9.
The tree crown maps of the rainforest plot obtained by the traditional watershed segmentation (a), the Crown Slices from Imagery (CSI) (b), commonly used marker-controlled watershed segmentation (MWT) (c), and the proposed spectral and multi-scale features (SMS) (d) methods, respectively.

Figure 10.
Subsets of the rainforest plot (a–d) and the subsets of the tree crown maps obtained by the Crown Slices from Imagery (CSI) (a1–d1), the commonly used marker-controlled watershed segmentation (MWT) (a2–d2), and the proposed (SMS) (a3–d3) methods, respectively.
Figure 10.
Subsets of the rainforest plot (a–d) and the subsets of the tree crown maps obtained by the Crown Slices from Imagery (CSI) (a1–d1), the commonly used marker-controlled watershed segmentation (MWT) (a2–d2), and the proposed (SMS) (a3–d3) methods, respectively.

Figure 11.
The correctly delineated crowns (in blue) obtained by the Crown Slices from Imagery (CSI) (a), the commonly used marker-controlled watershed segmentation (MWT) (b), and the proposed (SMS) (c) methods, respectively, and the corresponding references (in white) of the rainforest plot.
Figure 11.
The correctly delineated crowns (in blue) obtained by the Crown Slices from Imagery (CSI) (a), the commonly used marker-controlled watershed segmentation (MWT) (b), and the proposed (SMS) (c) methods, respectively, and the corresponding references (in white) of the rainforest plot.

Figure 12.
The tree crown maps of the deciduous forest plot obtained by the traditional watershed segmentation (a), the Crown Slices from Imagery (CSI) (b), the commonly used marker-controlled watershed segmentation (MWT) (c), and the proposed (SMS) (d) methods, respectively.
Figure 12.
The tree crown maps of the deciduous forest plot obtained by the traditional watershed segmentation (a), the Crown Slices from Imagery (CSI) (b), the commonly used marker-controlled watershed segmentation (MWT) (c), and the proposed (SMS) (d) methods, respectively.

Figure 13.
Subsets of the deciduous forest plot (a–d) and the subsets of the tree crown maps obtained by the Crown Slices from Imagery (CSI) (a1–d1), the commonly used marker-controlled watershed segmentation (MWT) (a2–d2), and the proposed (SMS) (a3–d3) methods.
Figure 13.
Subsets of the deciduous forest plot (a–d) and the subsets of the tree crown maps obtained by the Crown Slices from Imagery (CSI) (a1–d1), the commonly used marker-controlled watershed segmentation (MWT) (a2–d2), and the proposed (SMS) (a3–d3) methods.

Figure 14.
The correctly delineated crowns (in blue) obtained by the Crown Slices from Imagery (CSI) (a), the commonly used marker-controlled watershed segmentation (MWT) (b), and the proposed (SMS) (c) methods, respectively, and the corresponding references (in white) of the deciduous forest plot.
Figure 14.
The correctly delineated crowns (in blue) obtained by the Crown Slices from Imagery (CSI) (a), the commonly used marker-controlled watershed segmentation (MWT) (b), and the proposed (SMS) (c) methods, respectively, and the corresponding references (in white) of the deciduous forest plot.


Table 1.
The accuracy statistics of the tree crown maps of the rainforest plot generated by the Crown Slices from Imagery (CSI), the commonly used marker-controlled watershed segmentation (MWT), and the proposed method (SMS) with reference to the same manually delineated tree crown map.
Table 1.
The accuracy statistics of the tree crown maps of the rainforest plot generated by the Crown Slices from Imagery (CSI), the commonly used marker-controlled watershed segmentation (MWT), and the proposed method (SMS) with reference to the same manually delineated tree crown map.
| Methods | Total Segments | Merged | Missing | Nearly Matched | Matched | Spilt | Accuracy (%) | Omission Error (%) | Commission Error (%) |
|---|---|---|---|---|---|---|---|---|---|
| CSI | 205 | 75 | 15 | 30 | 76 | 9 | 51.71 | 43.90 | 4.39 |
| MWT | 205 | 10 | 7 | 25 | 90 | 73 | 56.10 | 8.29 | 35.61 |
| SMS | 205 | 24 | 7 | 21 | 136 | 17 | 76.59 | 15.12 | 8.29 |
Table 2.
The accuracy statistics of the tree crown maps for the deciduous forest plot generated by the Crown Slices from Imagery (CSI) method, the commonly used marker-controlled watershed segmentation (MWT), and the proposed method (SMS), with reference to the same manually delineated tree crown map.
| Methods | Total Segments | Merged | Missing | Nearly Matched | Matched | Spilt | Accuracy (%) | Omission Error (%) | Commission Error (%) |
|---|---|---|---|---|---|---|---|---|---|
| CSI | 356 | 77 | 44 | 45 | 156 | 34 | 54.46 | 33.99 | 9.55 |
| MWT | 356 | 5 | 20 | 67 | 95 | 169 | 45.51 | 7.02 | 47.47 |
| SMS | 356 | 39 | 40 | 68 | 157 | 52 | 63.20 | 22.19 | 14.61 |
© 2020 by the authors. Licensee MDPI, Basel, Switzerland. This article is an open access article distributed under the terms and conditions of the Creative Commons Attribution (CC BY) license (http://creativecommons.org/licenses/by/4.0/).
Share and Cite
MDPI and ACS Style
Qiu, L.; Jing, L.; Hu, B.; Li, H.; Tang, Y. A New Individual Tree Crown Delineation Method for High Resolution Multispectral Imagery. Remote Sens. 2020, 12, 585. https://0-doi-org.brum.beds.ac.uk/10.3390/rs12030585
AMA Style
Qiu L, Jing L, Hu B, Li H, Tang Y. A New Individual Tree Crown Delineation Method for High Resolution Multispectral Imagery. Remote Sensing. 2020; 12(3):585. https://0-doi-org.brum.beds.ac.uk/10.3390/rs12030585
Chicago/Turabian StyleQiu, Lin, Linhai Jing, Baoxin Hu, Hui Li, and Yunwei Tang. 2020. "A New Individual Tree Crown Delineation Method for High Resolution Multispectral Imagery" Remote Sensing 12, no. 3: 585. https://0-doi-org.brum.beds.ac.uk/10.3390/rs12030585
Note that from the first issue of 2016, this journal uses article numbers instead of page numbers. See further details here.