1. Introduction
Human beings are facing, and will continue to face, challenges that affect the harmony and sustainable development of the society for a long time, such as population, resources, and environment. Among all environmental problems, geological environment is one of the most prominent [
1,
2,
3]. For one thing, the geological environment is a necessary carrier and a basic environment for all human life and engineering activities. For another, it is fragile and difficult, or even impossible to restore. Landslide is a dire threat to people’s lives and property and social public safety [
4,
5,
6]. Geological disasters very frequently occur in China and cause tremendous loss, especially in the western mountainous areas with complex topographic and geological conditions. Landslides in these areas are generally characterized by suddenness. There is no forewarning that can be directly observed and perceived beforehand since landslide is triggered by external factors (such as heavy rainfall, earthquakes, etc.). Therefore, quick and automatic information extraction of sudden landslides has become a hot topic, also a hot potato, of the day in the landslide research in the world [
7,
8].
In the field of remote sensing, the extraction of landslide information that is based on satellite images or aerial images is mainly realized through the spectrum, shape, and texture features of landslides that are shown in images that are different from other surface features [
9]. In the early application, the identification of landslide information and boundary extraction were mainly actualized by means of manual digitization. This method is featured by high accuracy, but, when it is necessary to process the data of a large region or to meet the disaster emergency demand, the manual digitalization operation mode is of no advantage in time and cost. In addition, if the region is segmented into several regions for different interpreters to interpret, it is inevitable that the subjectivity of different interpreters will be brought into the interpretation results [
10,
11]. With the development of digital image processing technology, increasing image classification algorithms have been applied to the extraction of landslide information. The reflectivity difference (spectrum information) of different surface features on the remote sensing image is used to extract the landslide region and non-landslide region. Generally, the landslide region shows a high reflectivity on the remote sensing image, which is easy to be distinguished from surface features with low reflectivity, but it is easy to be confused with bare land because the bare land also has high reflectivity [
12]. Additionally, this kind of pixel-oriented method makes the classification result easily produce "salt and pepper" noise. In recent years, with the launch of more and more earth observation satellites with high-resolution sensors, the data sources for research are more and more abundant, and the object-oriented image analysis method comes into being. In the object-oriented image analysis method, the available information, such as spectrum, shape, texture, context semantics, and terrain on remote sensing images are comprehensively selected to extract the information of surface features [
13,
14,
15,
16,
17].
In recent years, with the development of machine learning technology, more and more algorithms have been applied to the remote sensing identification of landslides. At present, the widely used machine learning algorithms include support vector machine (SVM), random forest (RF), artificial neural network (ANN), convolutional neural network (CNN), deep convolutional neural network (DCNN), etc. [
18,
19,
20,
21,
22,
23]. The conventional object-oriented image analysis method requires acquiring a large number of image features for subsequent classification, and carrying out a large number of feature selection experiments, which is very time-consuming and difficult to obtain accurate features completely. Deep learning (DL) and transfer learning (TL) are the fastest-developing machine learning methods that are applied to remote sensing image classification in recent years, which can automatically extract features from the original images and the extracted deep features are often very effective for processing complex images [
24,
25,
26]. However, the problem is that the features outputted by the deep learning method are highly abstract, and the boundaries of actual surface features cannot be accurately obtained, and the classification result is different from the boundaries of the actual surface features. However, the object-oriented image analysis method is based on homogeneity to segment and obtain the boundaries of surface features, usually the results of segmentation are consistent with the actual boundaries of surface features. Therefore, a method integrating transfer learning and object-oriented image analysis is proposed in this paper by combining the respective advantages of the two methods. Firstly, the multi-resolution segmentation algorithm obtains an irregular segmented object, and then a regular image block is generated according to the barycenter of the segmented object, so that the segmented object that is obtained by the object-oriented method is combined with the transfer learning. The rest of this paper are organized, as follows: In
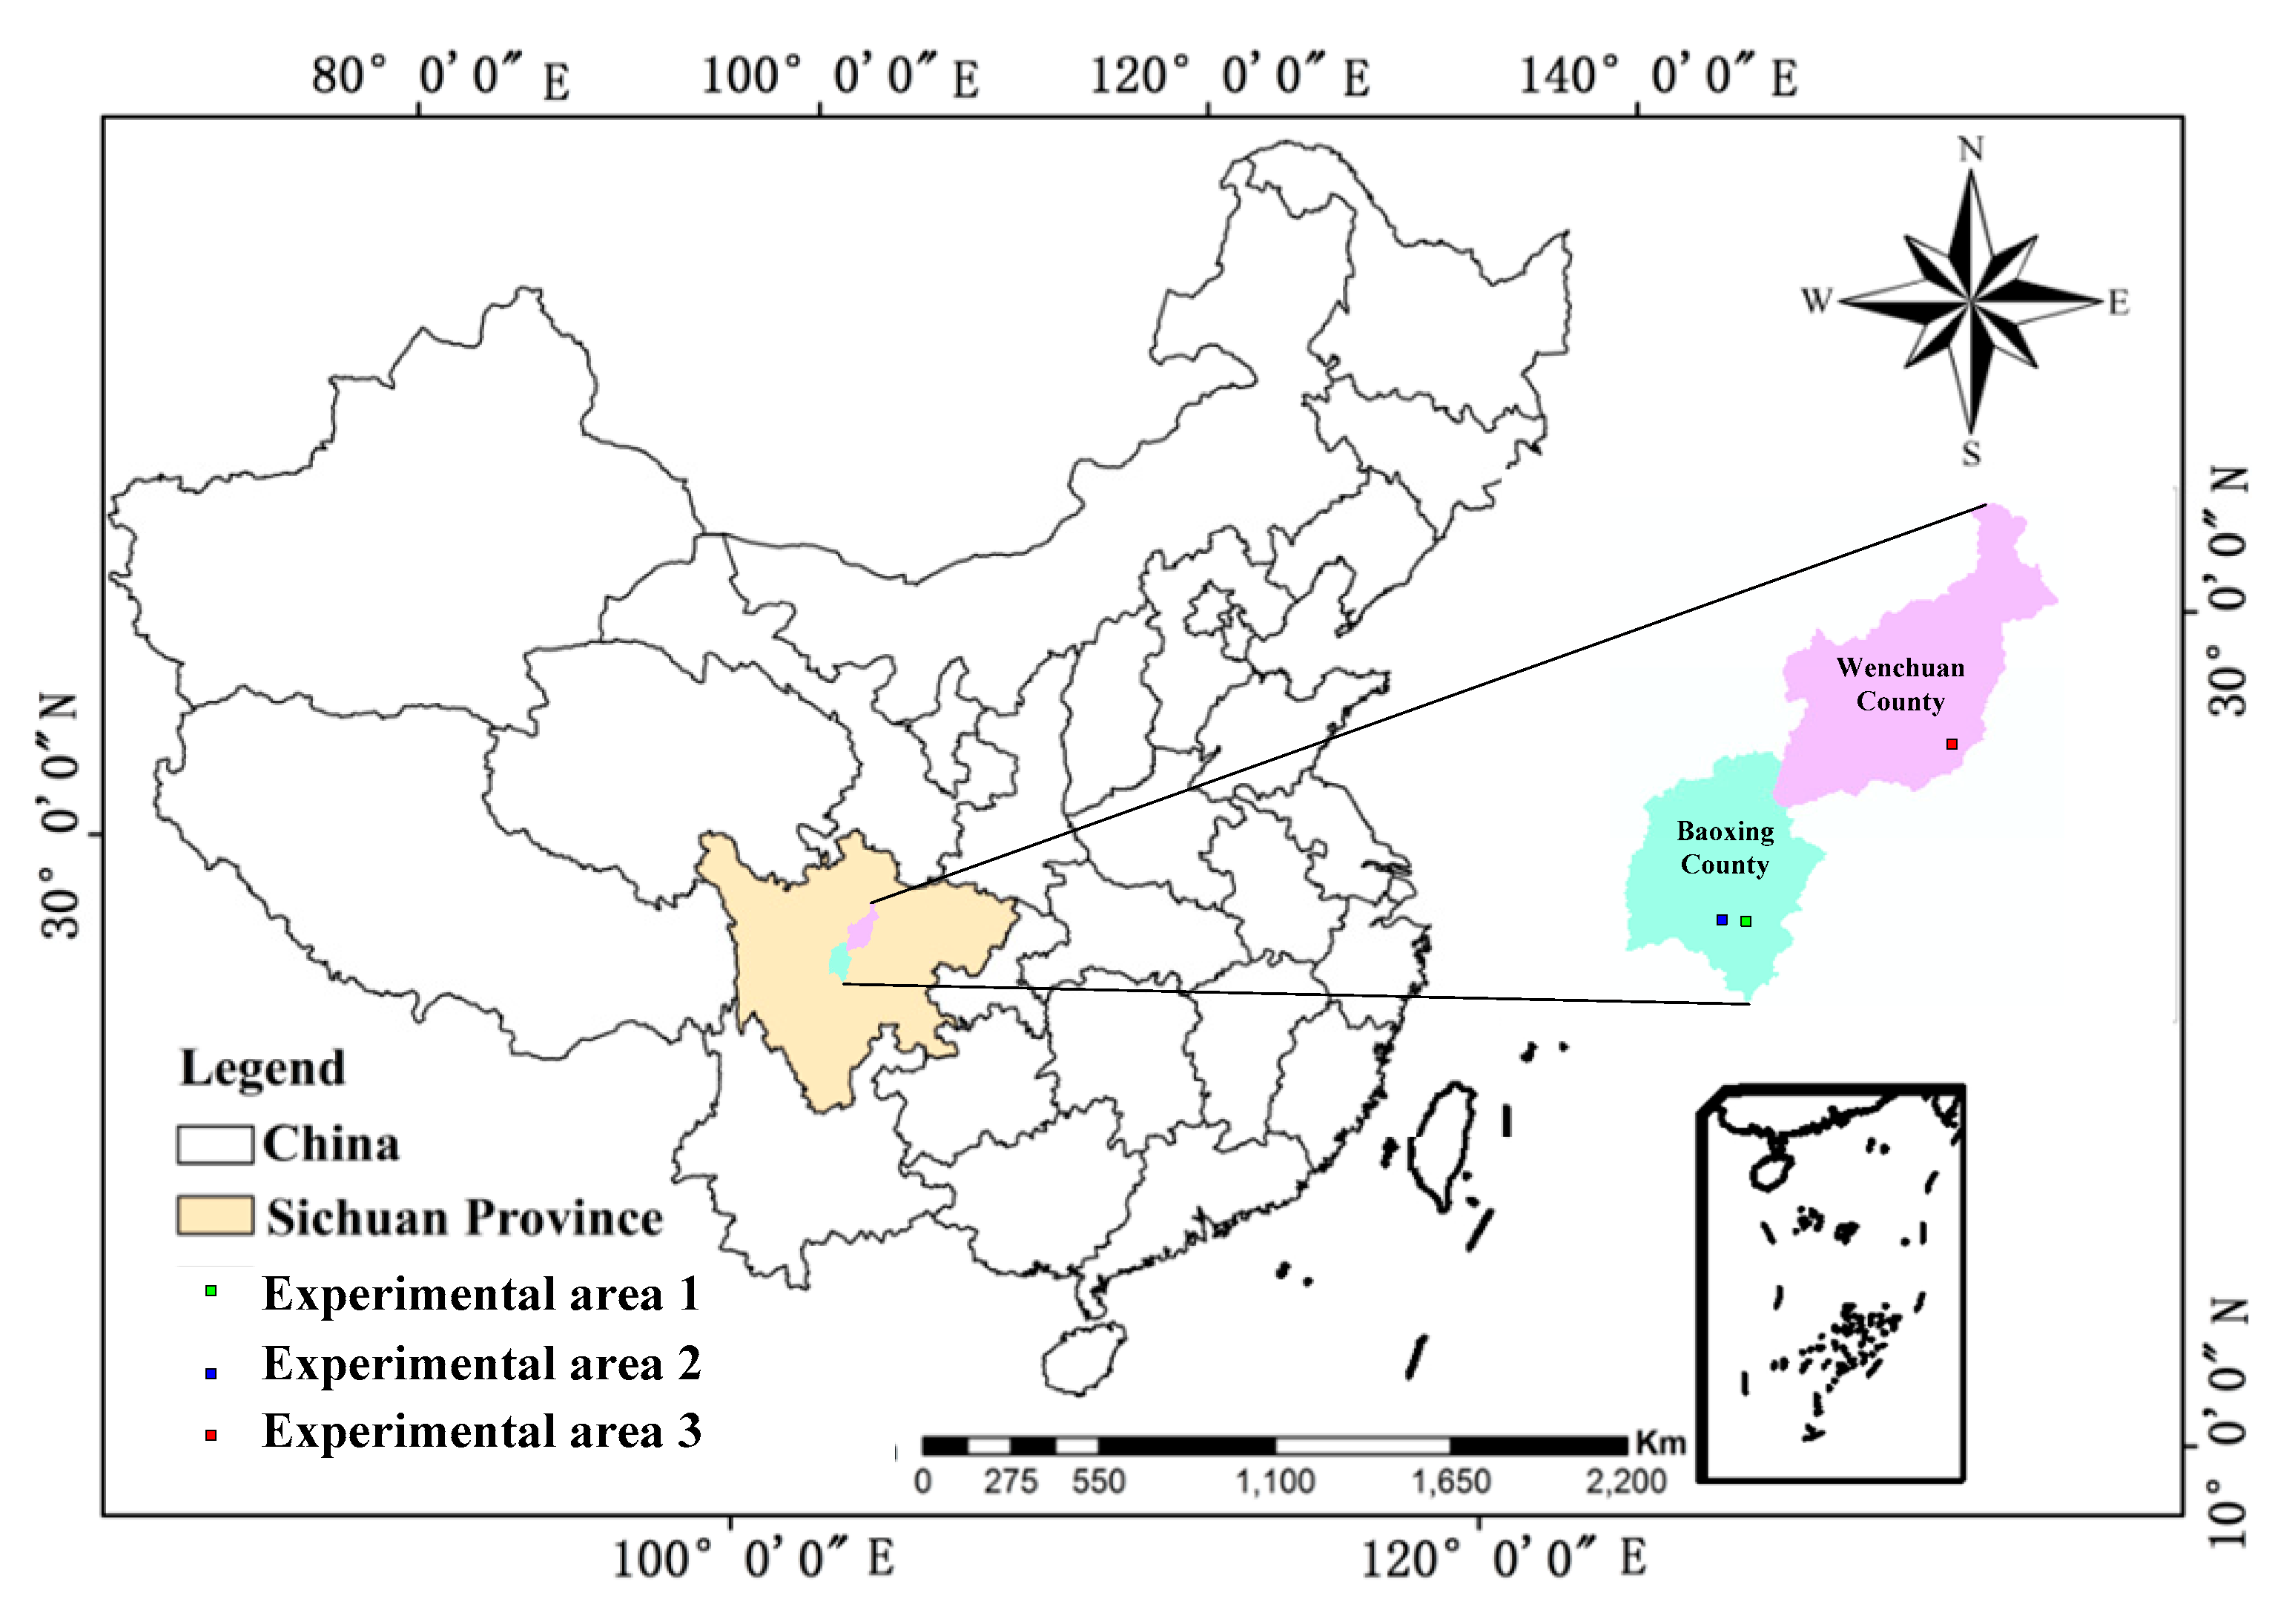
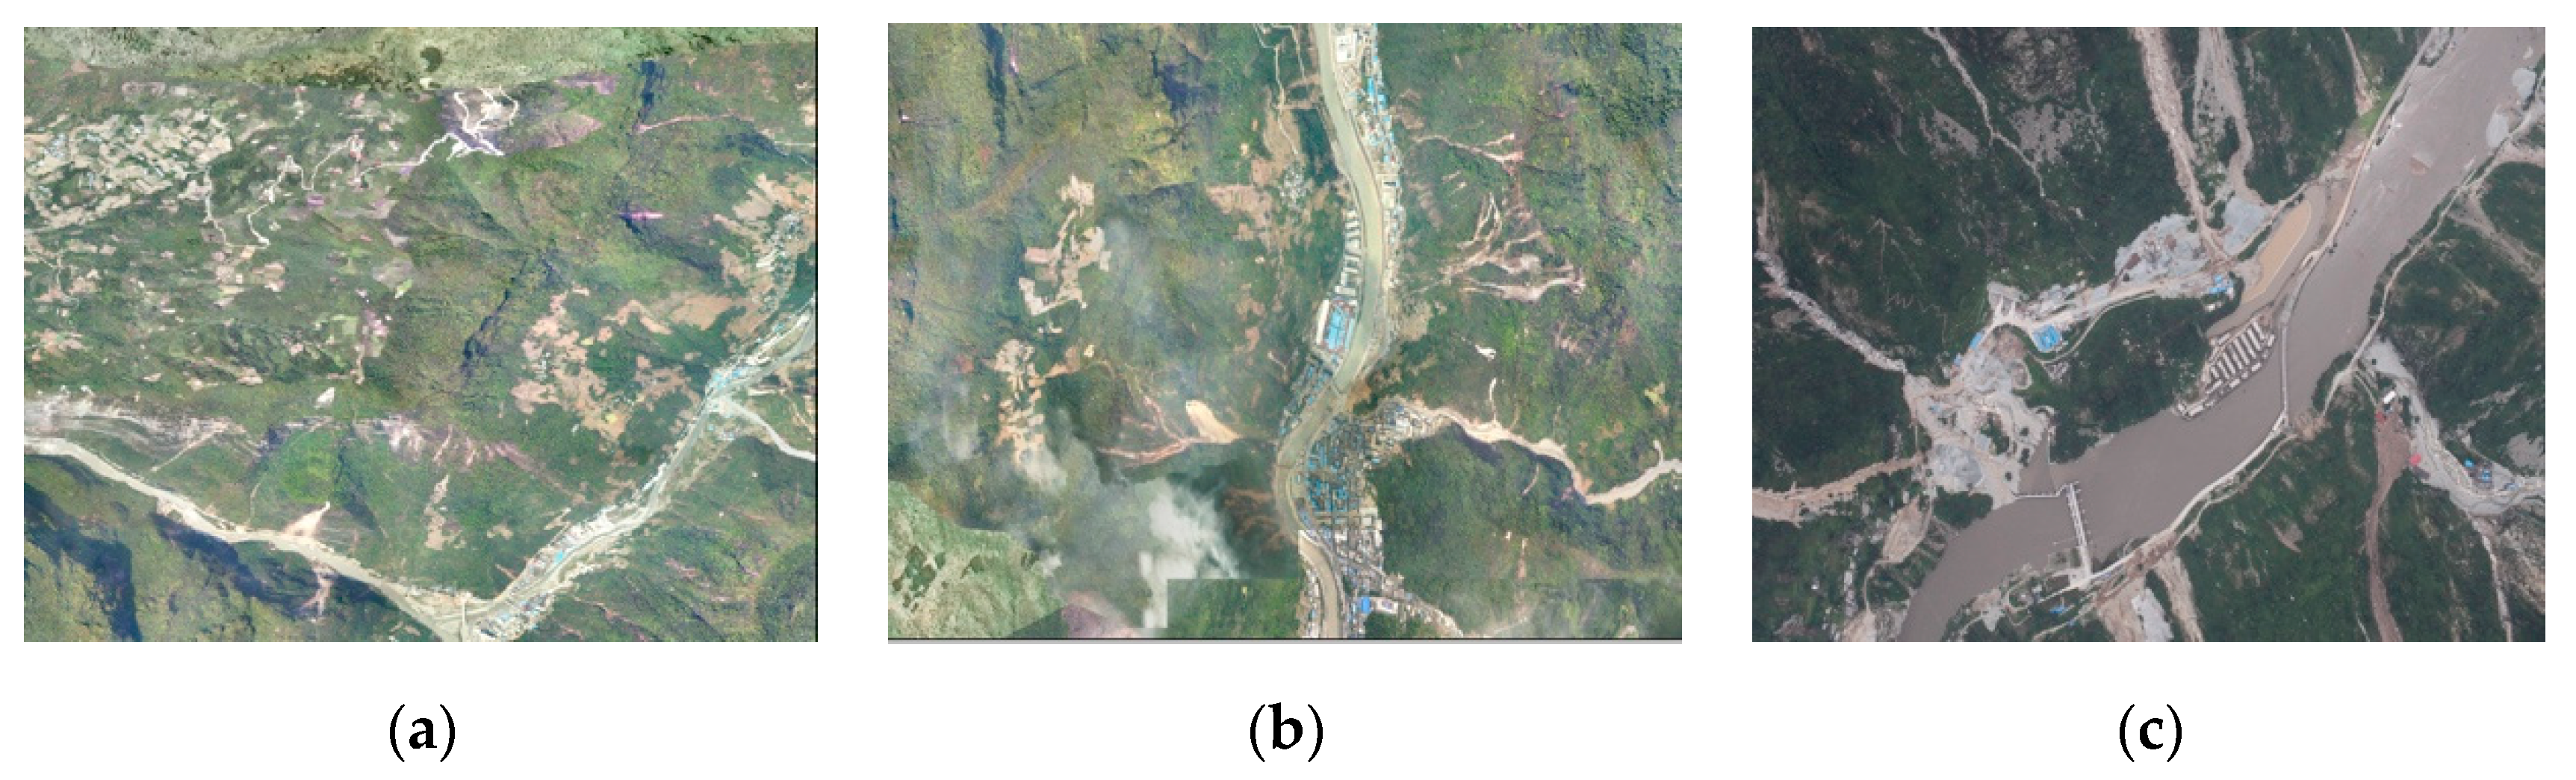
Section 2, three research sites selected in the experiment are introduced. In
Section 3, the availability of four deep learning models Histograms of Oriented Gradients (HOG), Bag of Visual Word (BOVW), CNN, and TL) for landslide feature extraction were compared, and the realization process of the proposed method and the experiment steps are described in detail. The experiment results are given in
Section 4 and discussed in
Section 5. Finally, the full text is summarized in
Section 6.
3. Methods
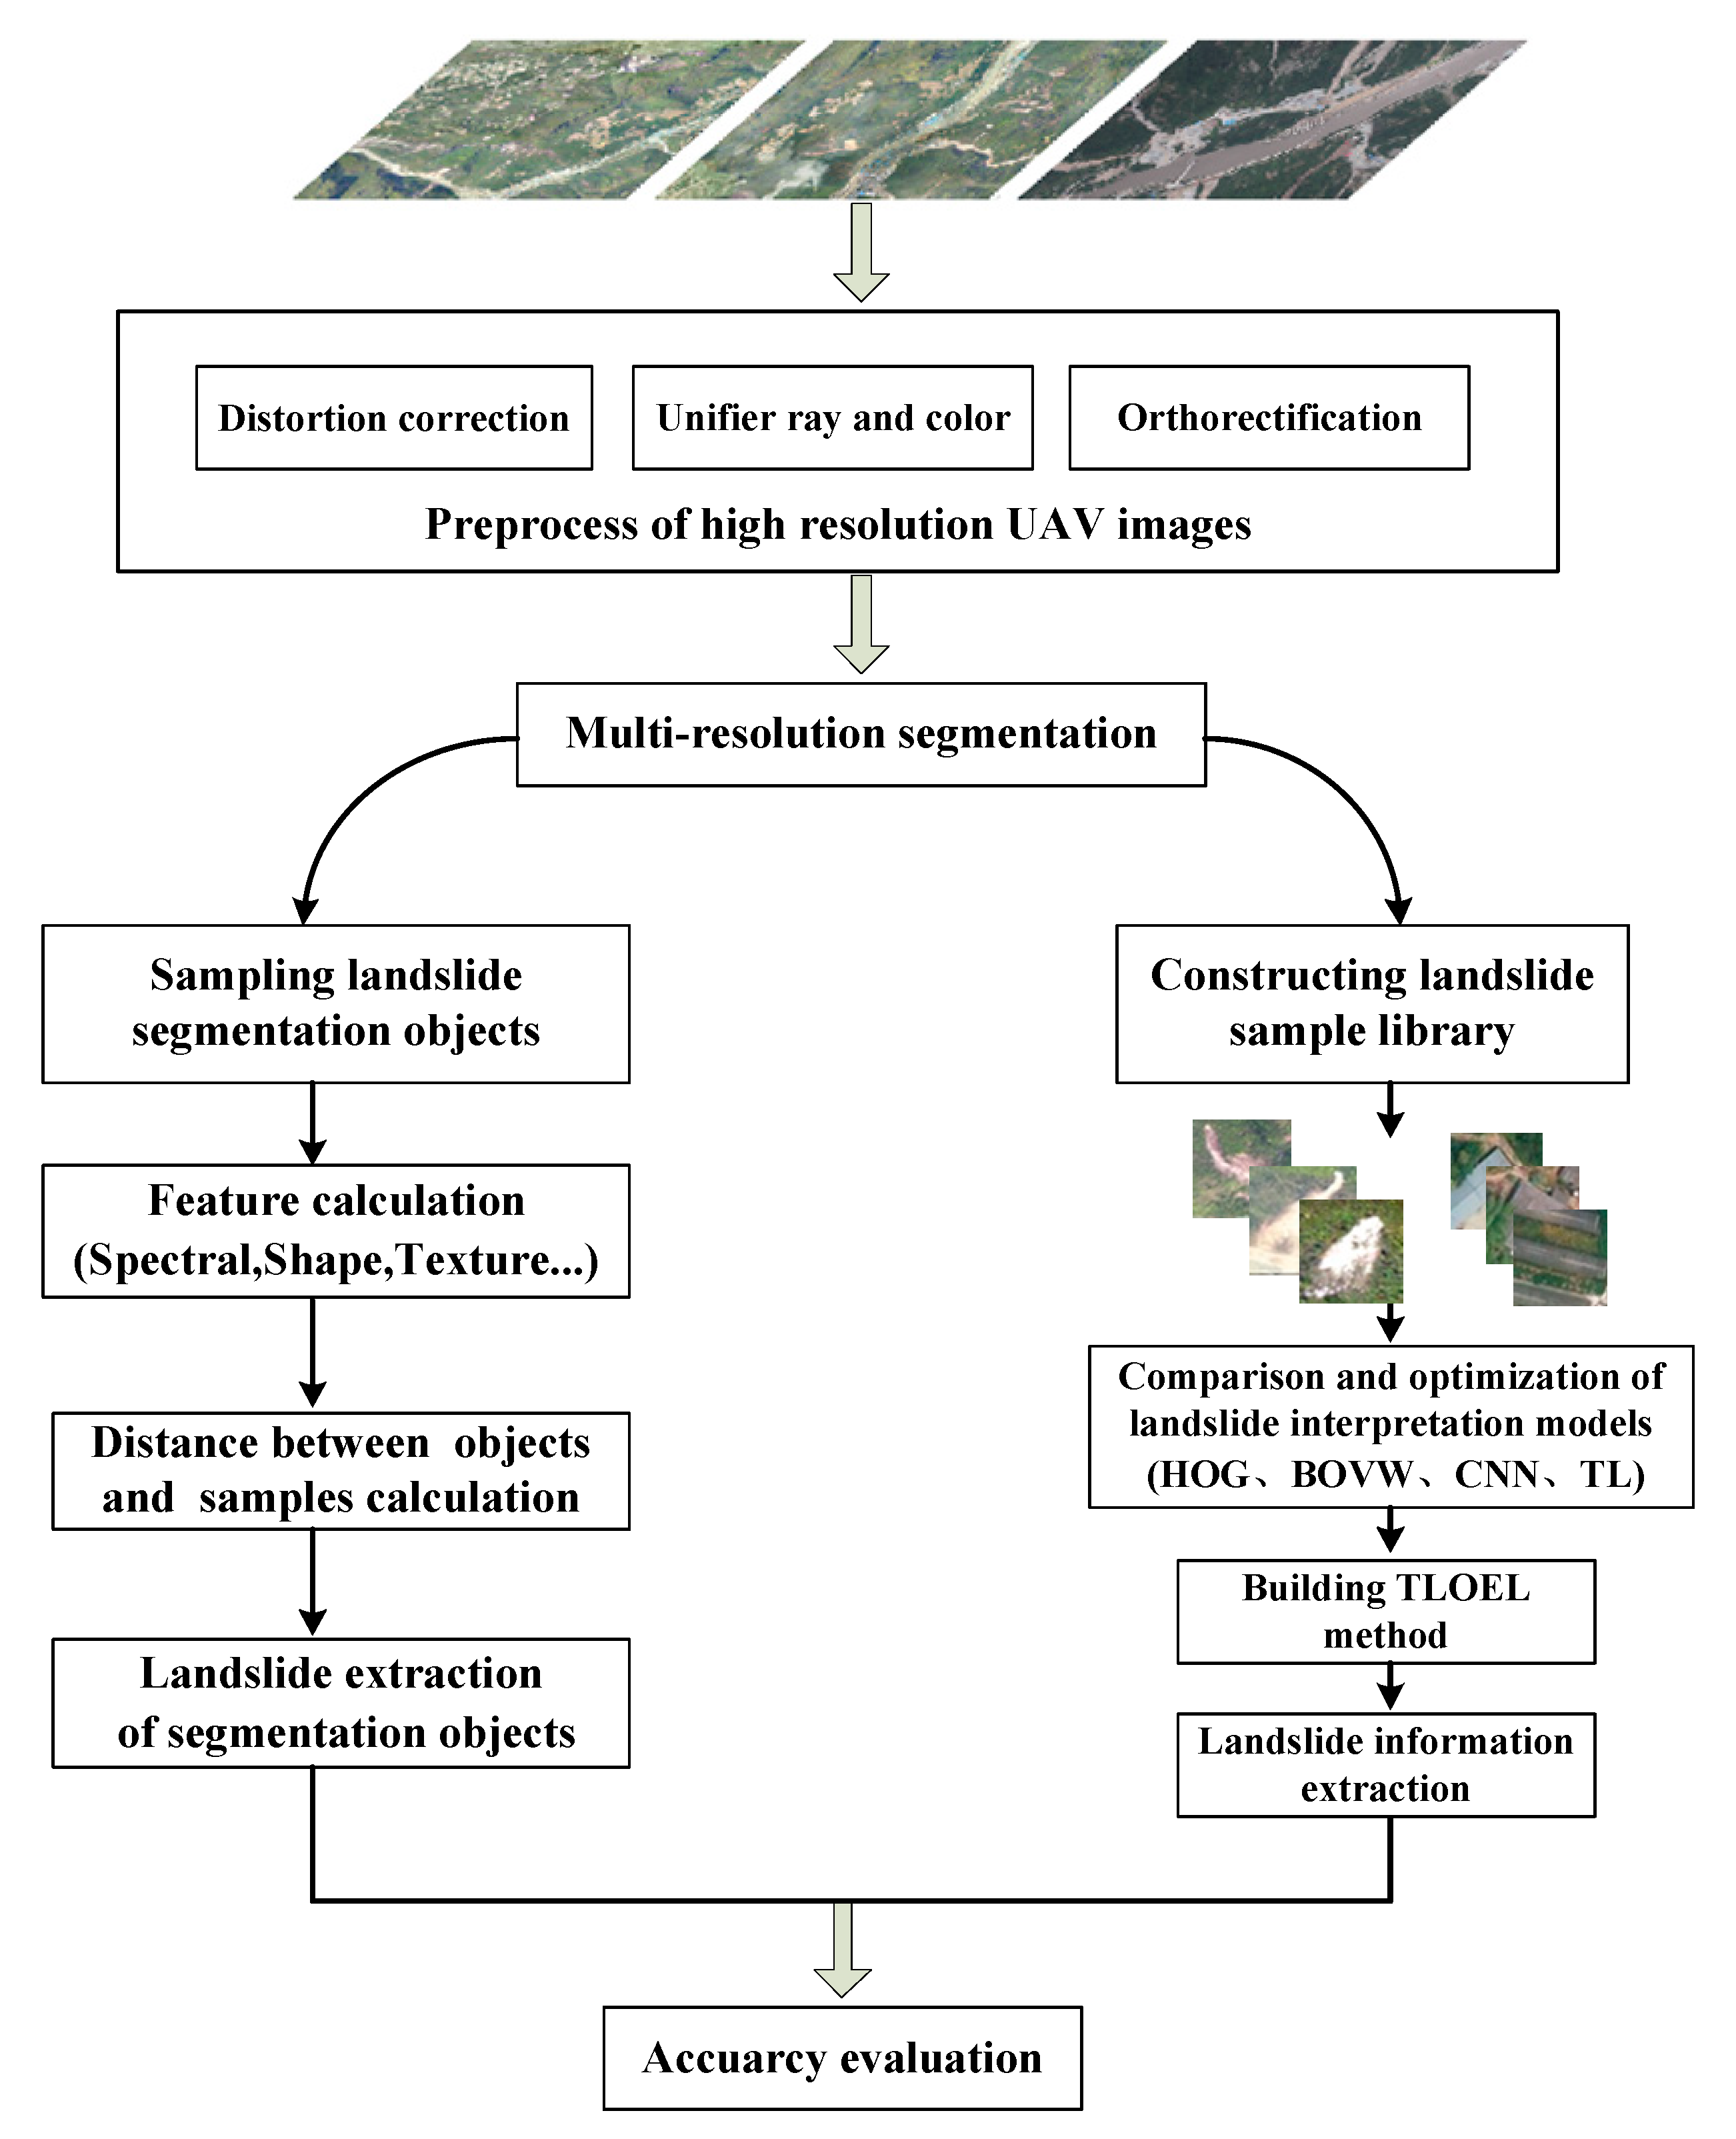
Firstly, the acquired UAV images were pre-processed to generate orthoimages. Subsequently, the image objects were obtained by multi- resolution segmentation, and calculating the barycenter of each object was undertaken to generate the samples for deep learning landslide (including positive and negative samples). Next, HOG, BOVW, CNN, and TL landslide feature models were compared, and found that the TL model had the best feature extraction effect. Therefore, TL model and object-oriented image analysis (TLOEL) method based on TL model and object-oriented image analysis was proposed. Finally, the TLOEL method was compared with the NNC method.
Figure 2 shows the research process of this paper.
3.1. Preprocess of High-Resolution Images
The digital camera on UAV is of non-metric type, so the images are subject to serious lens distortion. Therefore, distortion correction shall be carried out based on distortion parameters of the camera. Meanwhile, the exposure time intervals and different weather conditions in the flight course will result in chromatic aberration, so color and light uniformizing shall be carried out with the mask method. Preliminary image sorting and positioning can be carried out for matching homologous points of adjacent image pairs based on the aircraft attitude parameters recorded by the flight control system. After the matching of homologous points, block adjustment can be made based on the conditions of collinearity equation. After that, the coordinates of ground control points may be incorporated to realize absolute orientation, so as to obtain the corrected orthoimages [
27,
28].
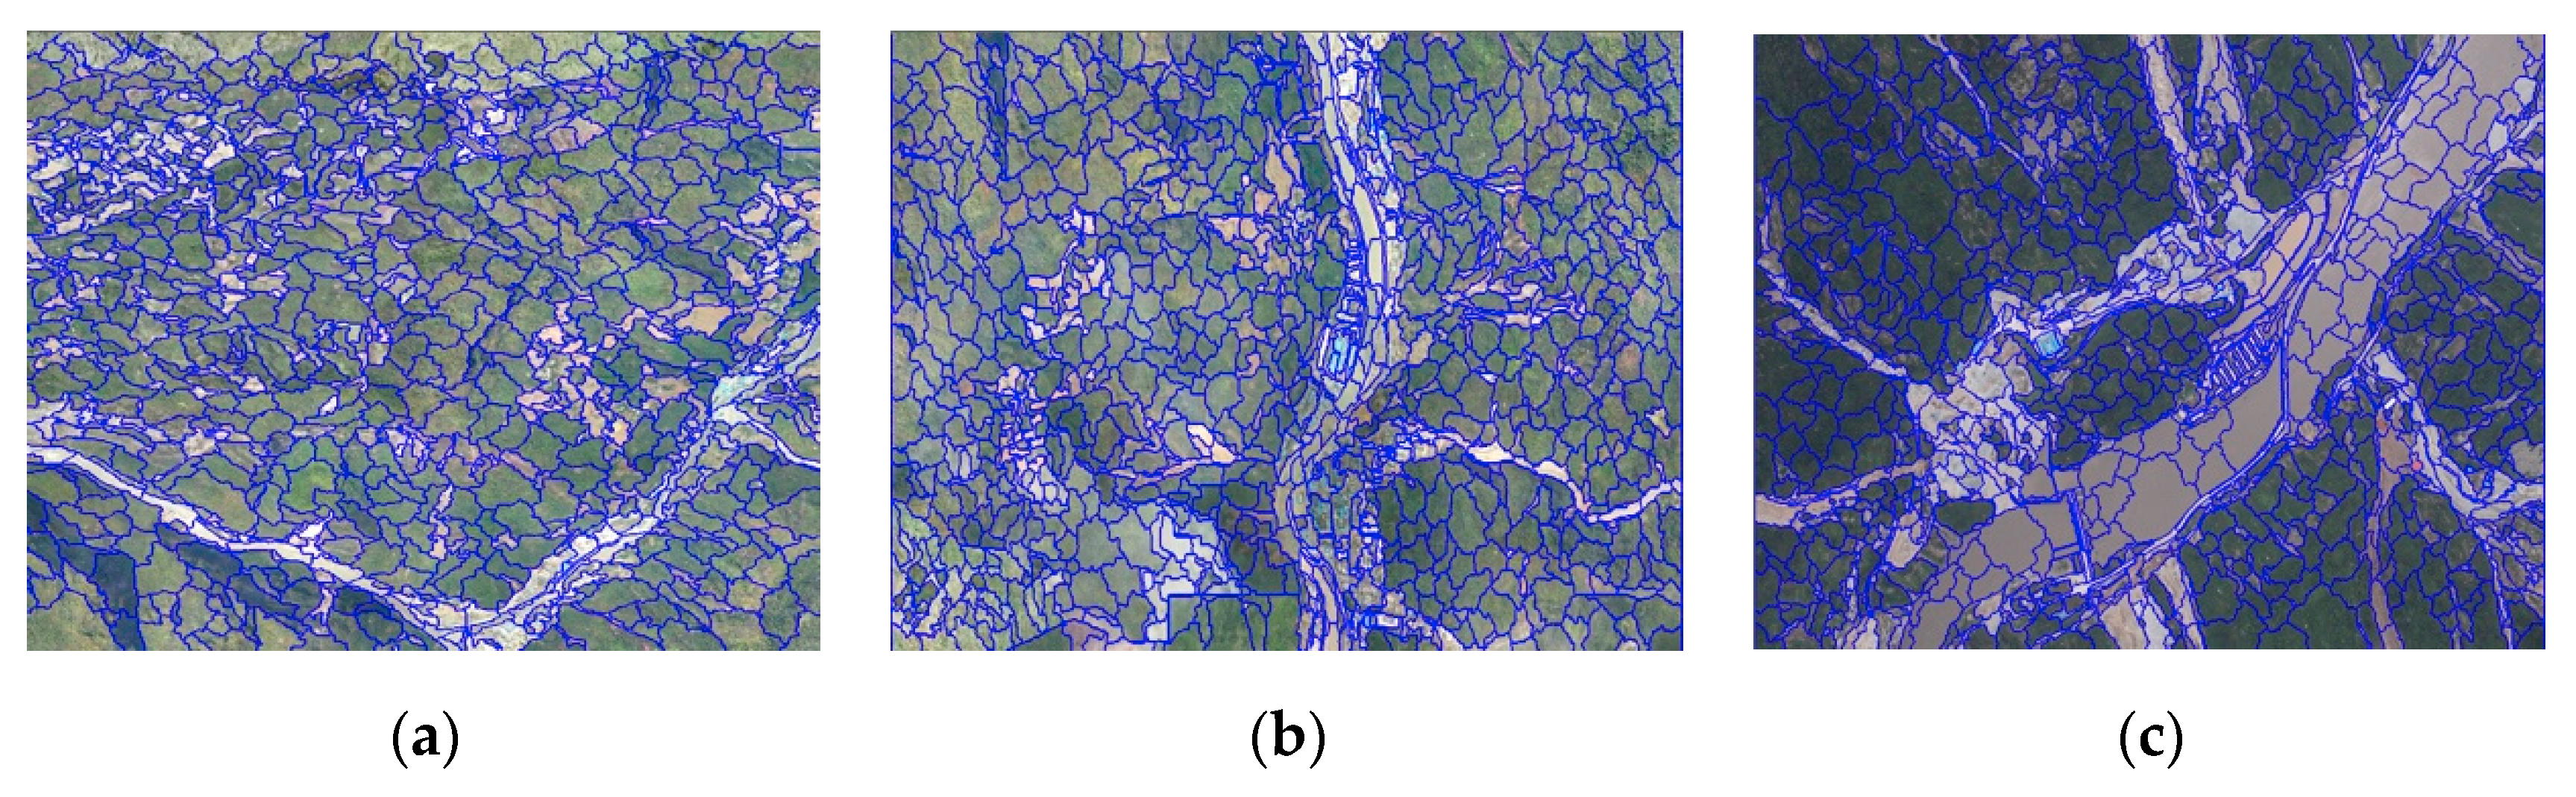
3.2. Segmentation
Image segmentation is the first step of the experiment to form a basic classification unit (object) with high homogeneity. Multi-resolution segmentation has proved to be a successful segmentation algorithm in many applications. In the research stated in this paper, the multi-resolution segmentation algorithm of uniform rule is used in the eCognation 9.0 software to generate the segmented objects for the three experiment areas [
29]. Using the multi-resolution segmentation algorithm requires setting three parameters: segmentation scale, color/shape ratio, and smoothness/compactness ratio. Among them, the most important parameter is segmentation scale, which determines the heterogeneity inside the object. Specifically, when the segmentation scale is too large to the classification target object, undersegmentation occurs, and small objects are "submerged" by large objects, thus resulting in mixed objects. When the segmentation scale is too small to the classification target object, over-segmentation occurs, which causes the segmentation result to be "broken" and increases the calculation burden of the subsequent classification process. The color/shape ratio reflects the ratio of spectral uniformity to shape uniformity. The smoothness/compactness ratio is used to define the smoothness or compactness of each object.
3.3. Constructing Landslide Sample Library
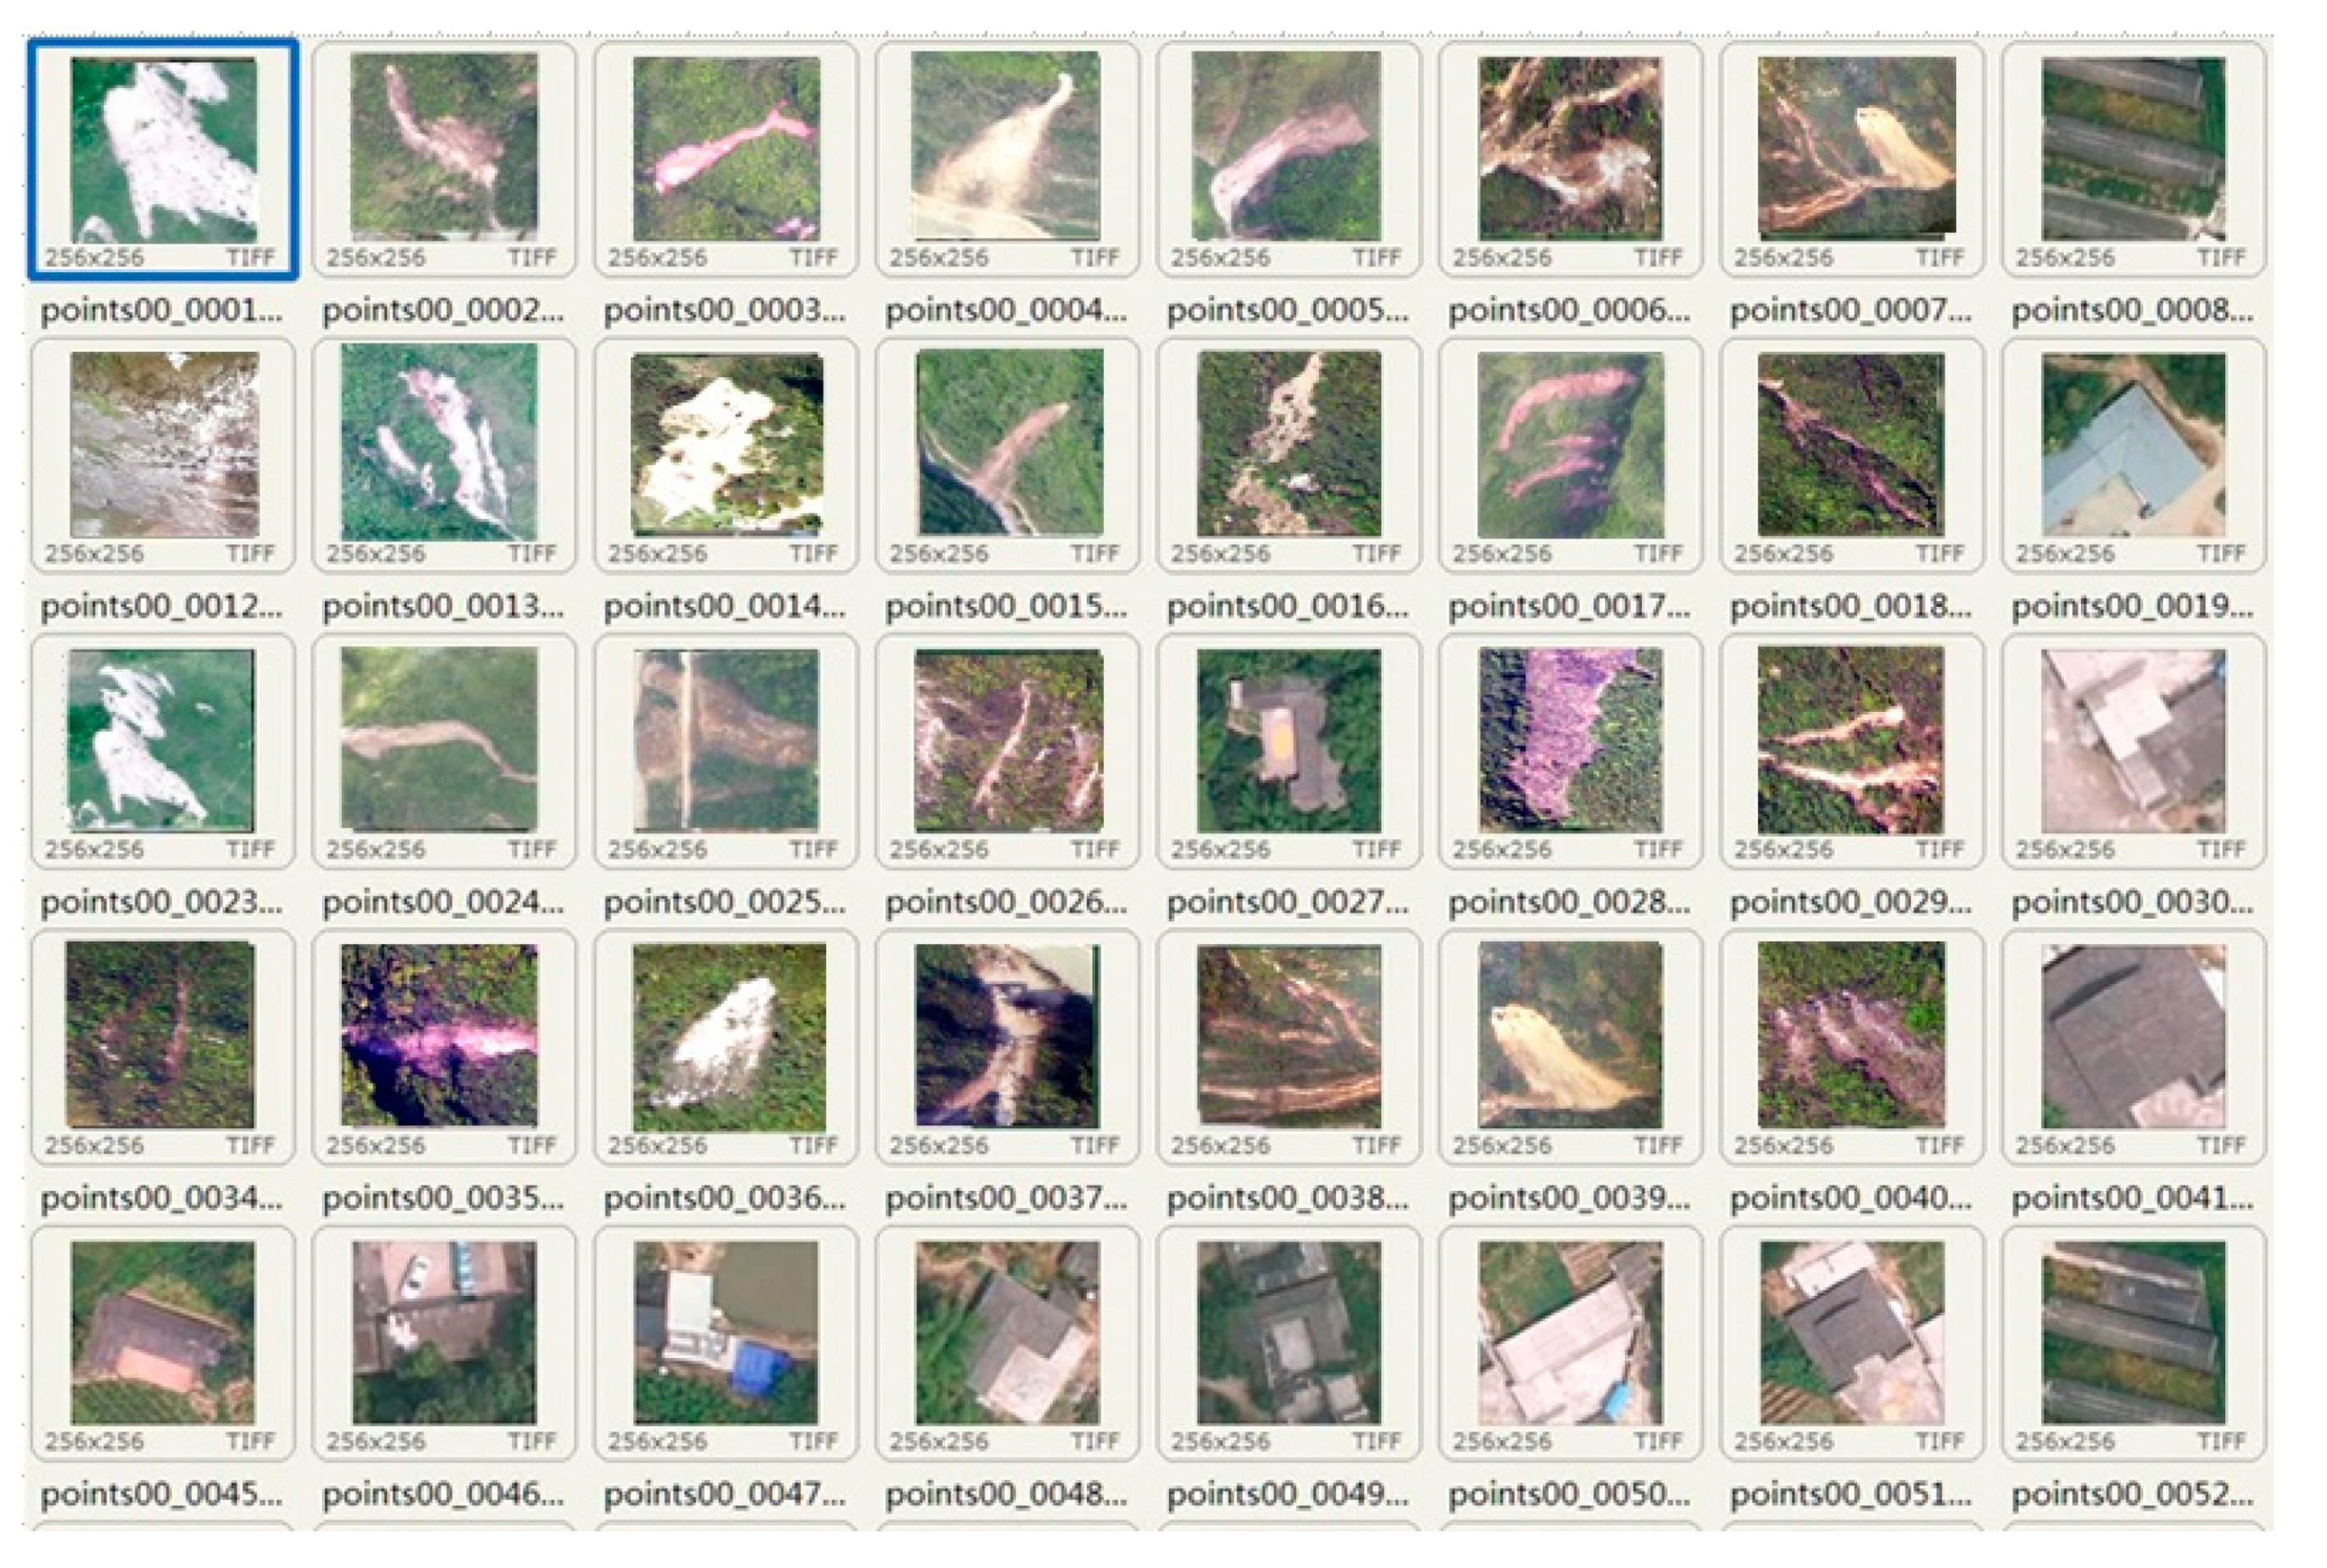
Image objects with irregular boundaries must be transformed into image blocks with regular shapes and fixed sizes in order to combine the TL model with the object-oriented image analysis method. The size of image block is related to the depth of CNN and it is limited to computer hardware (e.g., memory capacity). Through experiments and comparative literature, it is found that it is most suitable to choose 256 × 256 pixels as the size of image block instead of the super large CNN learning frame [
30].
During the experiment, it is found that there is a lot of work to manually build a landslide sample library with positive and negative samples, so this paper studies how to realize automatic batch cutting of image blocks that are based on ArcGIS Python secondary development package (ArcPy). The image blocks after cutting are divided into positive and negative samples by visual interpretation.
The specific process flow for building a landslide sample library is as follows:
(1) Calculate a barycentric point position of each segemented objects, and take the barycentric point position as the center of the image block.
(2) Automatically generate the boundary of image block on the ArcPy platform, and clip to generate an image block according to the boundary and store it.
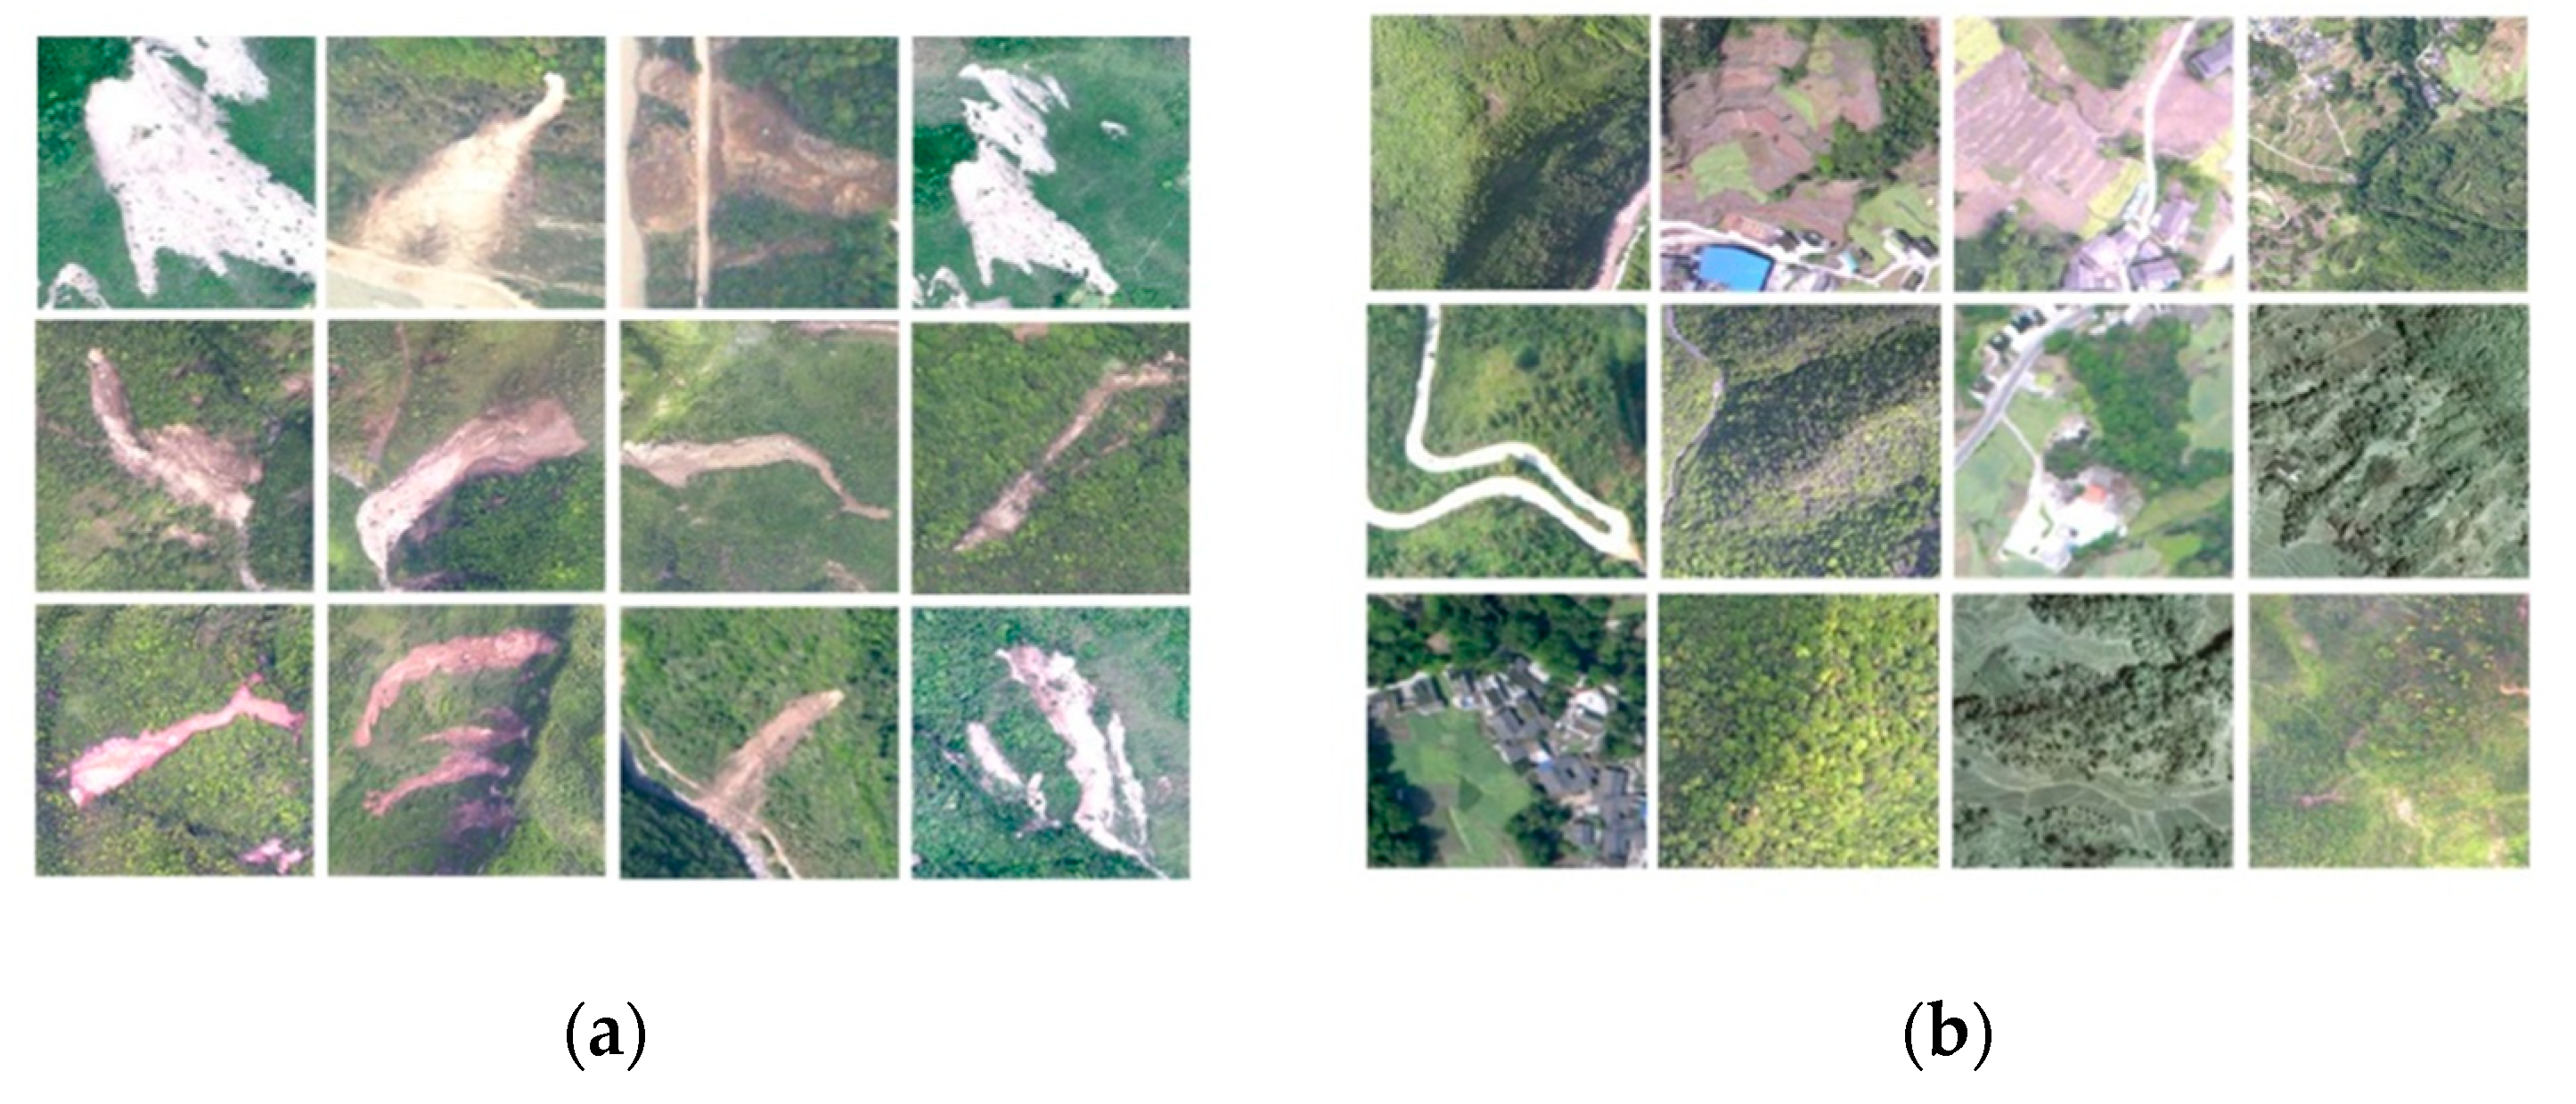
(3) Visually identify and distinguish an image block containing a landslide, storing the image block as a positive sample, and storing the remaining image blocks as negative samples, and removing the image blocks with no practical significance or the image blocks with too cluttered surface features.
3.4. Building Landslide Interpretation Model
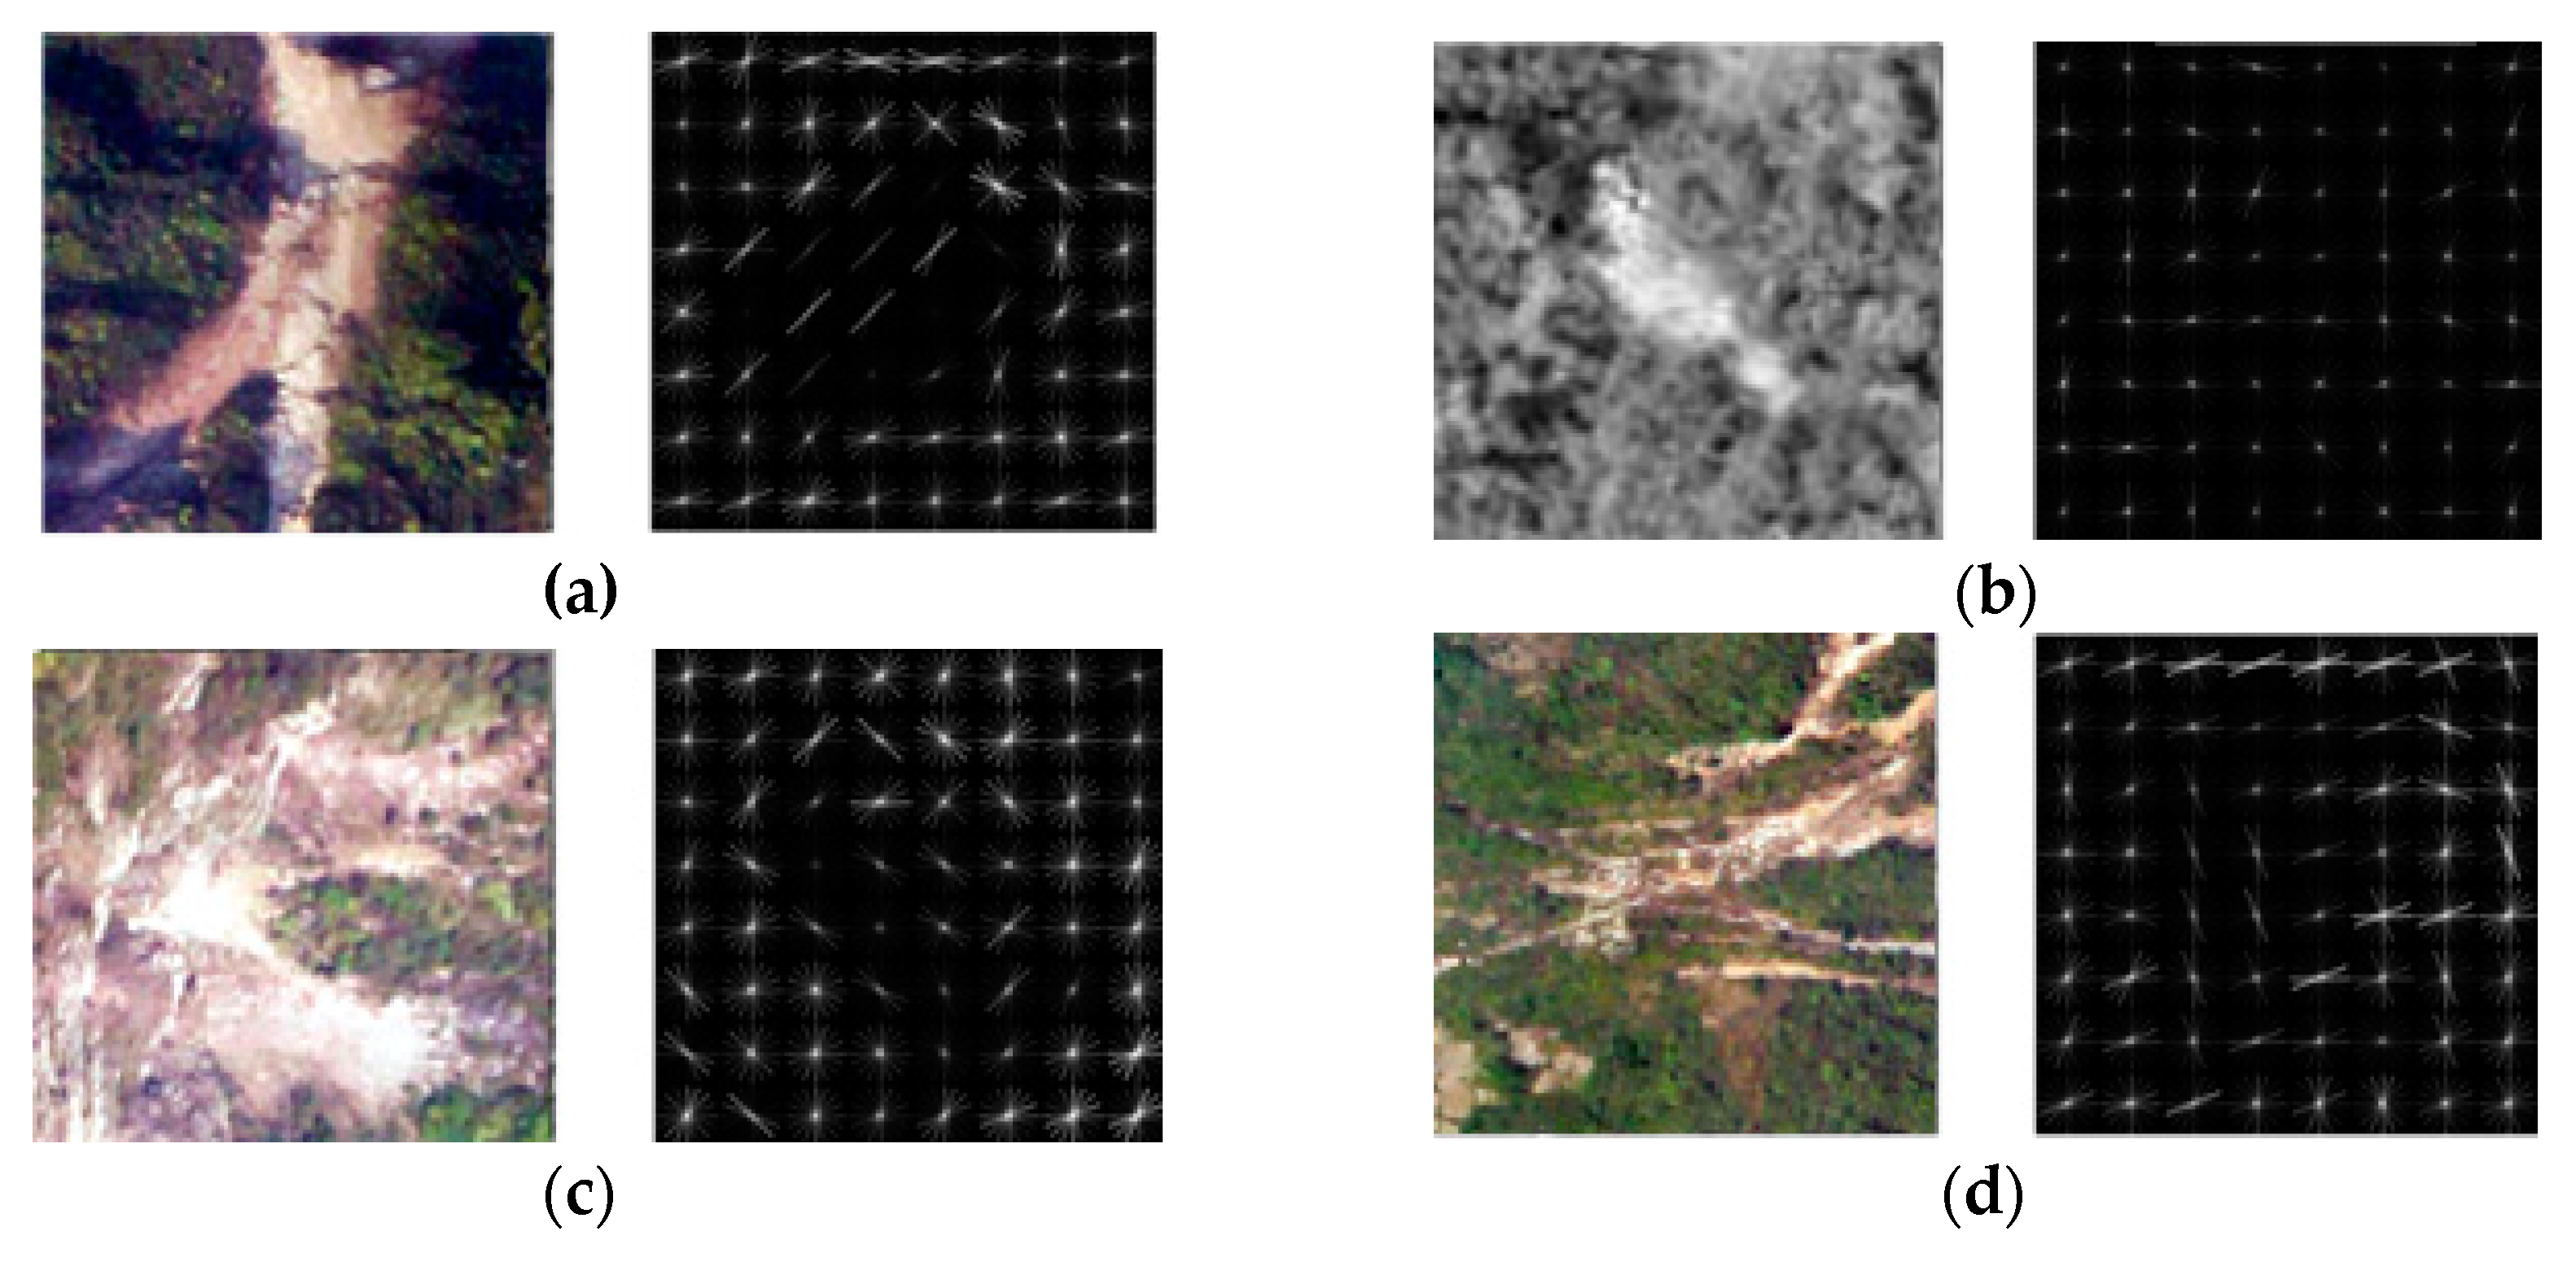
3.4.1. Landslides Feature Extraction Based on HOG Model
Dalal proposed HOG on CVPR in 2005 [
31]. When compared with deep learning, it is a common shallow feature that is used in computer vision and pattern recognition to describe the local texture of an image, applied as a feature descriptor to perform object detection.
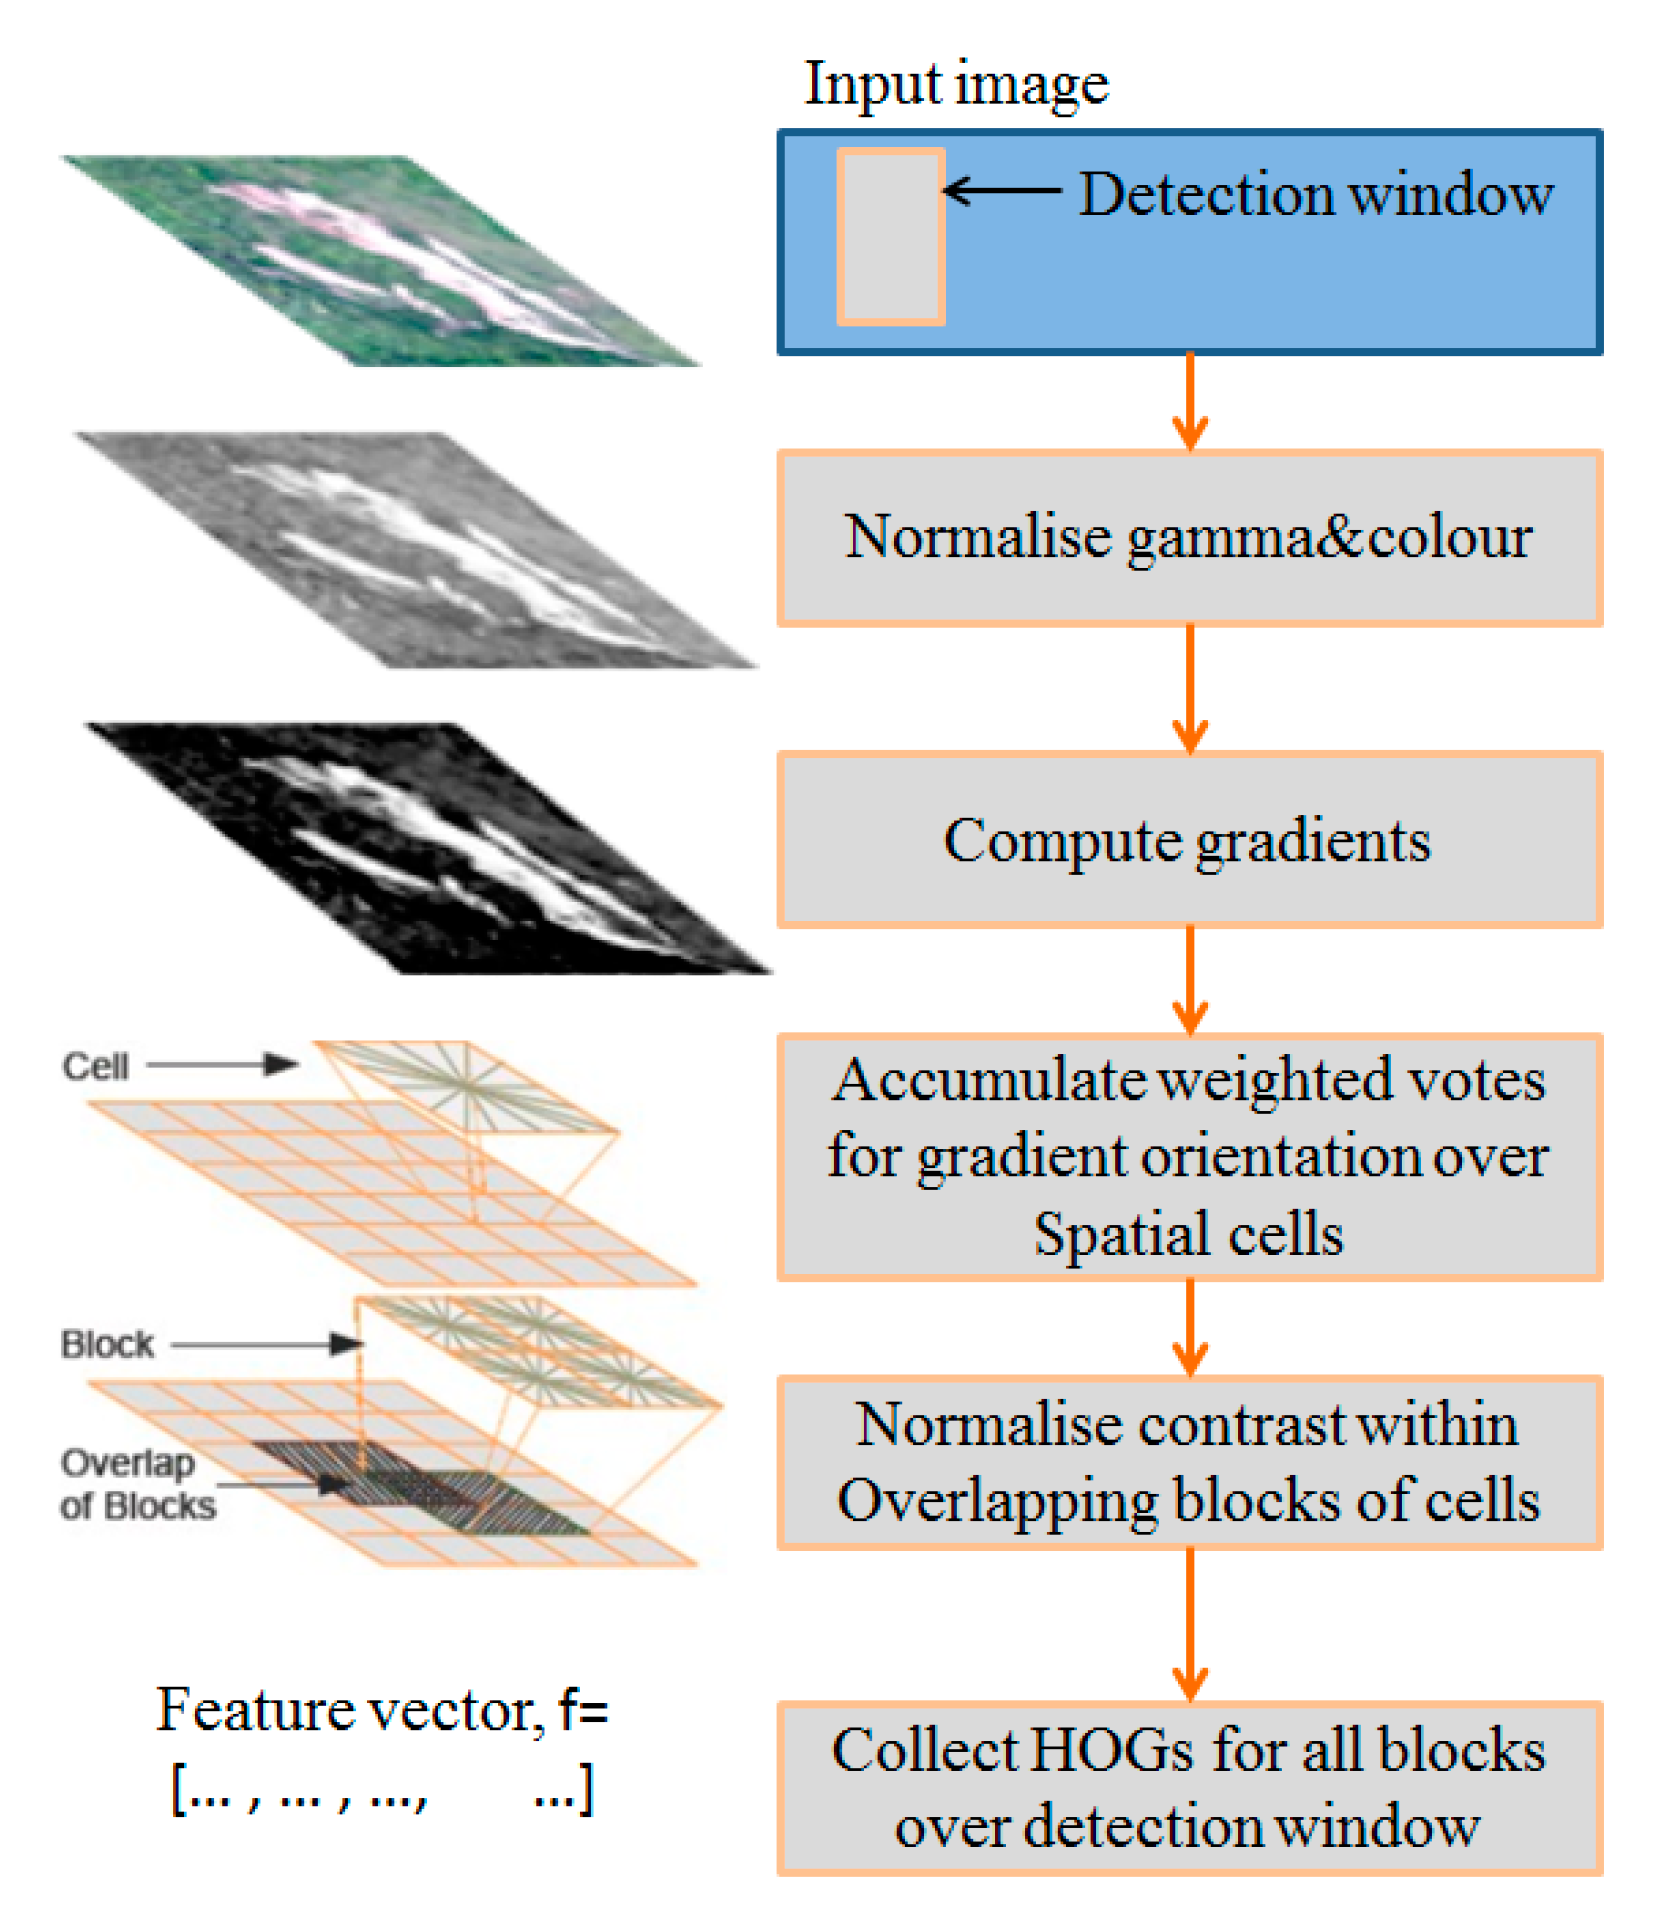
Figure 3 shows the process of HOG feature extraction.
First, divide the images into several blocks by statistics. Afterwards, calculate the distribution of edge intensity histogram separately. Finally, assemble the block histograms together to get feature descriptors of the images. As HOG operates on the local grid unit of the image and the space field is small, it can keep well the original image geometry and optical deformation. The combination of HOG features and SVM classifiers has been widely used in image identification. The HOG feature can be used to distinguish them while considering that there is a gradient change between the landslide area and the surrounding environment in a high-resolution image.
3.4.2. Landslides Feature Extraction Based on BOVW Model
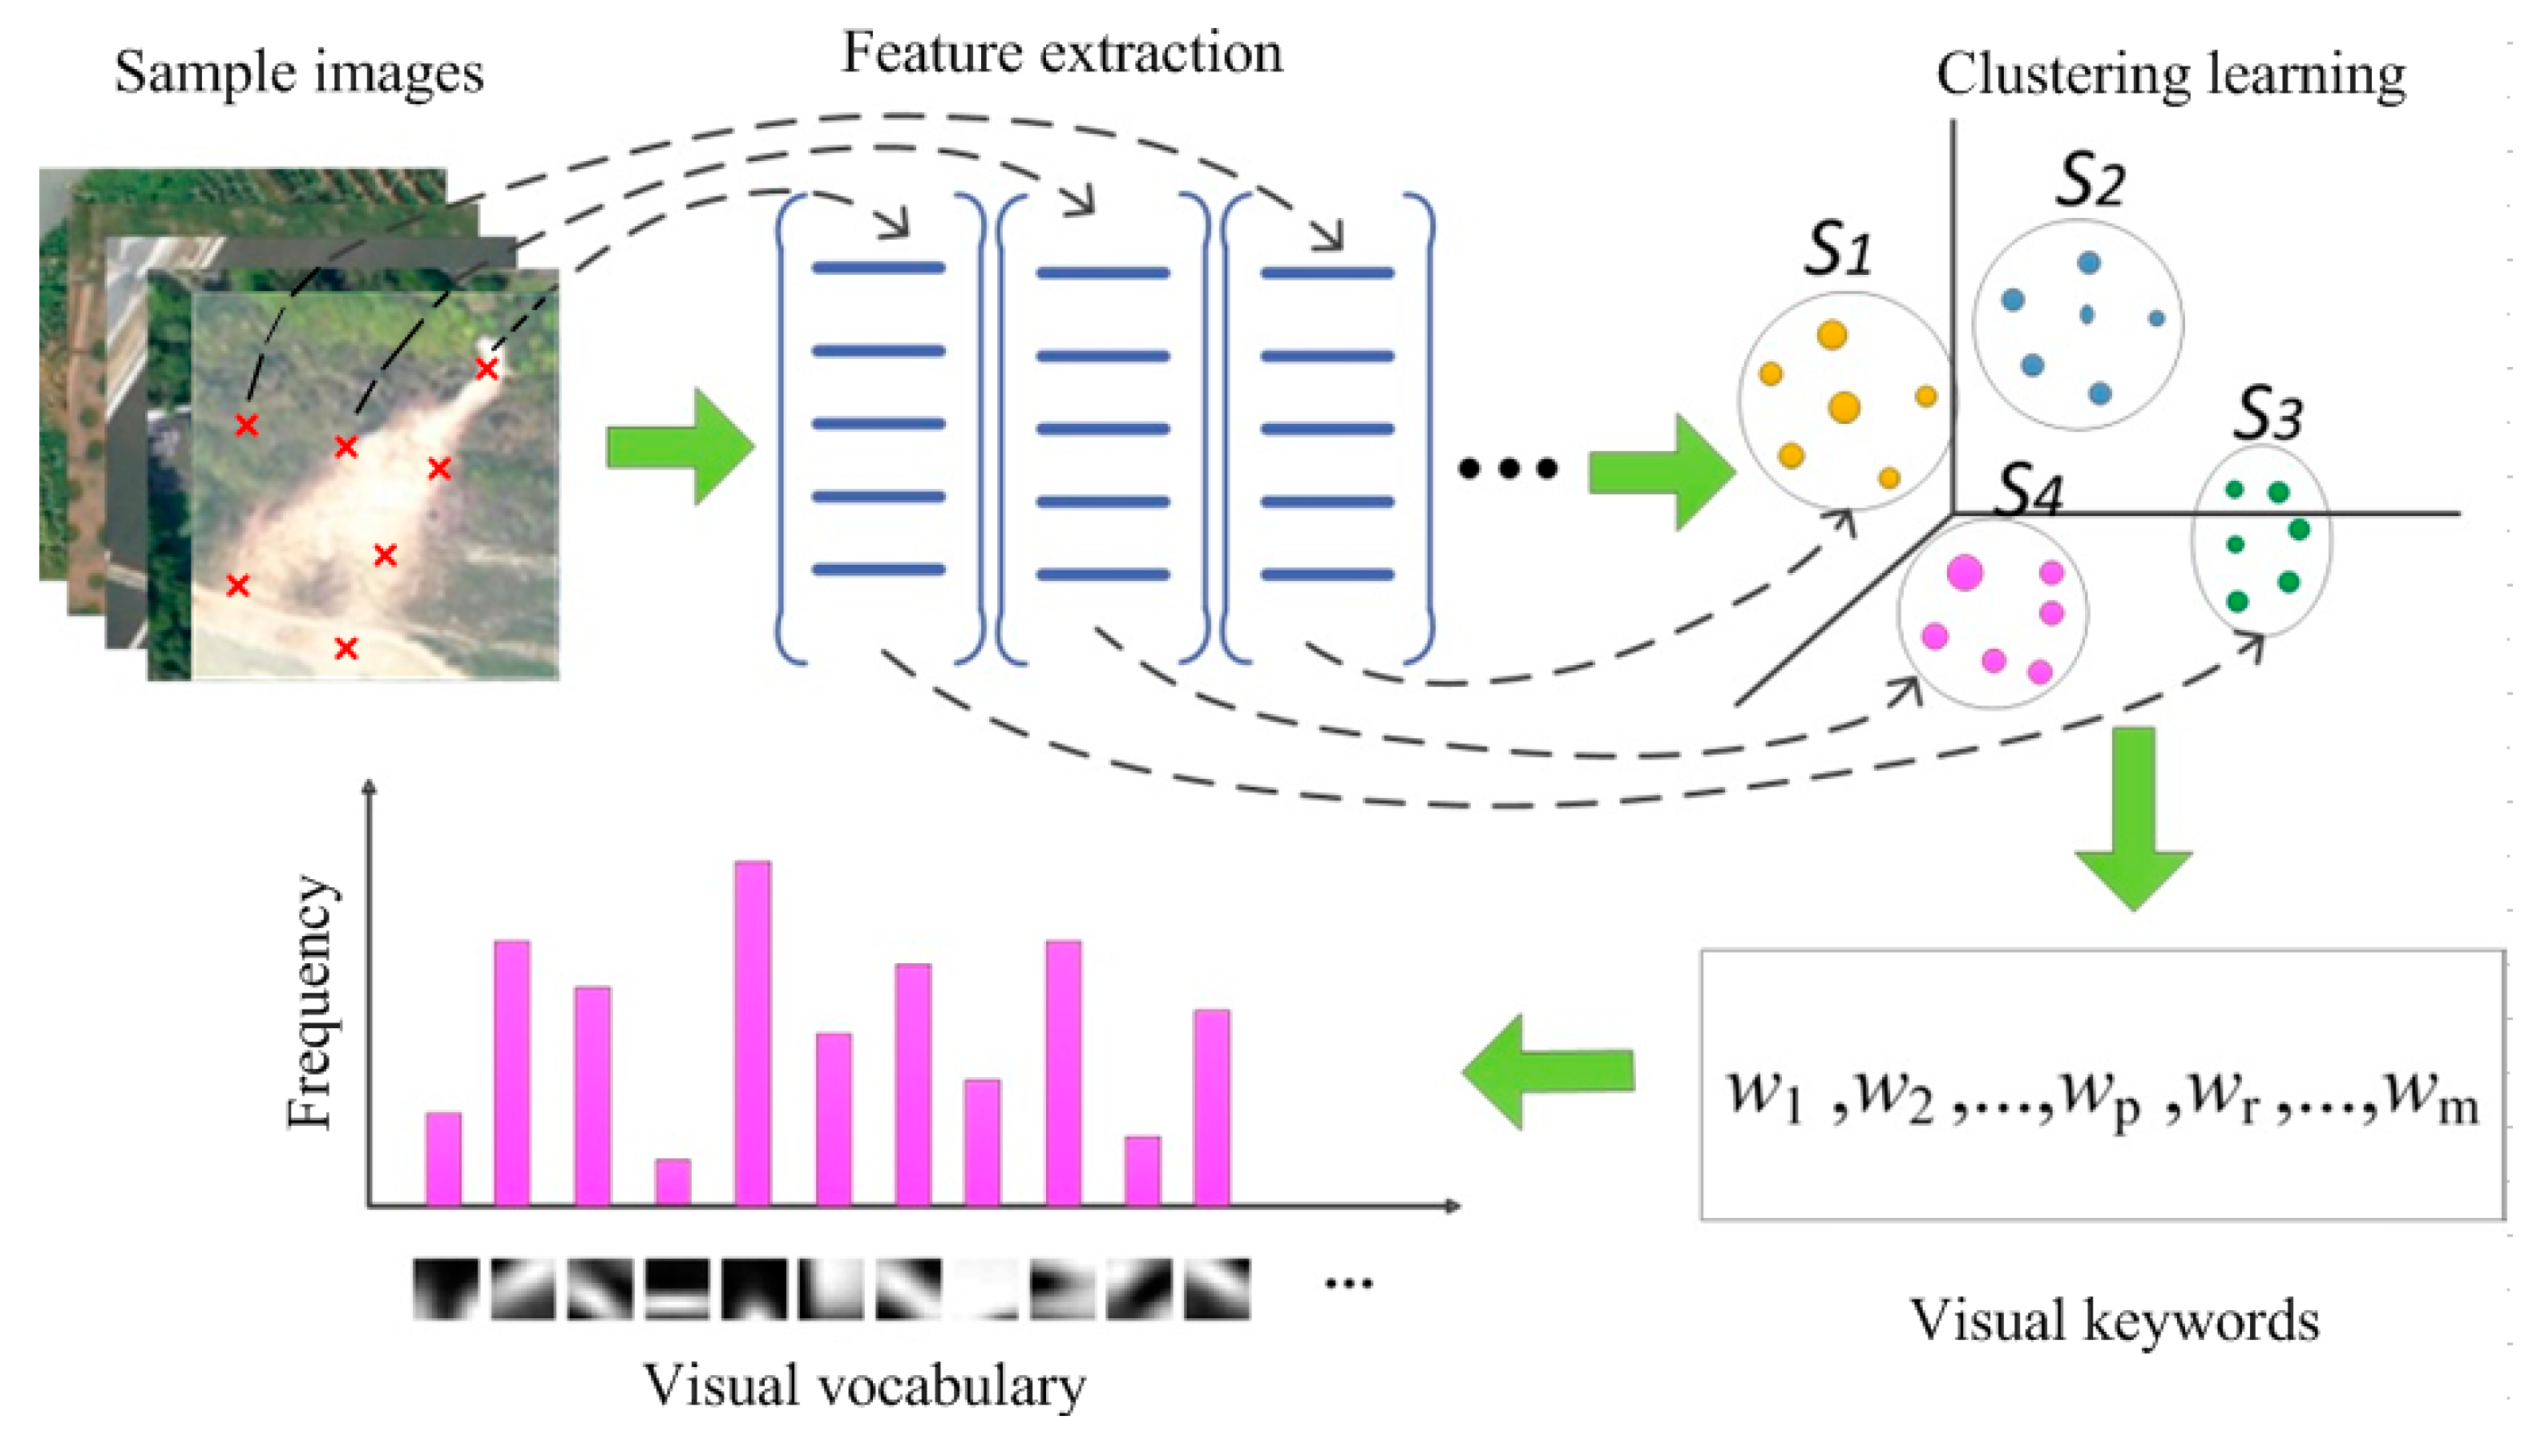
BOVW is an image representation model using Bag of Words (BOW). It can map two-dimensional image information into a set of visual keywords, which effectively compresses the description of the image and saves the local features of the image. The BOVW model extracts low-level features from images in the sample library, and then, given the number of cluster centers, clusters these low-level features with an unsupervised algorithm, such as K-means [
32]. Here is a sequence of observations
. Each of the observed value is a d-dimensional real-value vector. The goal of K-means is to divide these n observations into k sequences
,
, such as:
where
is the average of
.
Visual keywords (“vocabulary: represented by w1, w2, ..., w
p, w
r, ..., w
m” in Figure 5) are obtained through the cluster centers, mapping each feature extracted from the images to the nearest visual vocabulary, where the image can be represented as a histogram feature descriptor.
Figure 4 shows the feature extraction process.
3.4.3. Landslides Feature Extraction Based on CNN Model
CNN was mainly used to identify distortion-invariant (e.g. displacement, scaling) two-dimensional graphics in previous applications [
33]. As CNN’s feature detection layer learns with training data, implicit feature extraction is adopted instead of the explicit one when CNN is used. Neurons of the same feature map are set to have the same weights, so the network can learn in parallel, which is a big advantage of CNN relative to a simple neural network [
34,
35].
Feature extraction is to abstract the image information and obtain a set of feature vectors that can describe the image. Extraction is the key to image classification and selection determines the final result of classification. Manual visual interpretation can produce good classification results for new data and tasks, accompanied by large workload, low efficiency, subjective randomness, and non-quantitative analysis [
36]. The middle and low-level features perform well in specific classification and identification tasks. However, high-resolution image is a far cry from an ordinary natural image—the spatial spectrum changes greatly, so the middle and low levels feature extraction is not able to produce a good result in high-resolution images. With the continuous advancement in deep learning, by inputting data to extract the features layer-by-layer from bottom to top, mapping the relationships between bottom signals and top lexemes can be established, so that the high-level features of the landslide can be obtained to better present the landslide in a high-resolution image [
37].
CNN avoids explicit feature sampling and learns implicitly from the training data, which distinguishes it from other neural-network-based classifiers. Feature extraction is integrated into the multi-layer perceptron through structural reorganization and weights reduction, so that gray-scale images can be directly processed and, therefore, CNN can be directly used to process image-based classification [
38]. It has many advantages in image processing. (1) Input images match network topology perfectly. (2) Feature extraction and pattern classification are performed simultaneously and simultaneously generate results in training. (3) Weight sharing reduces the training parameters of the network and makes the structure of the neural network simpler and more adaptable [
39,
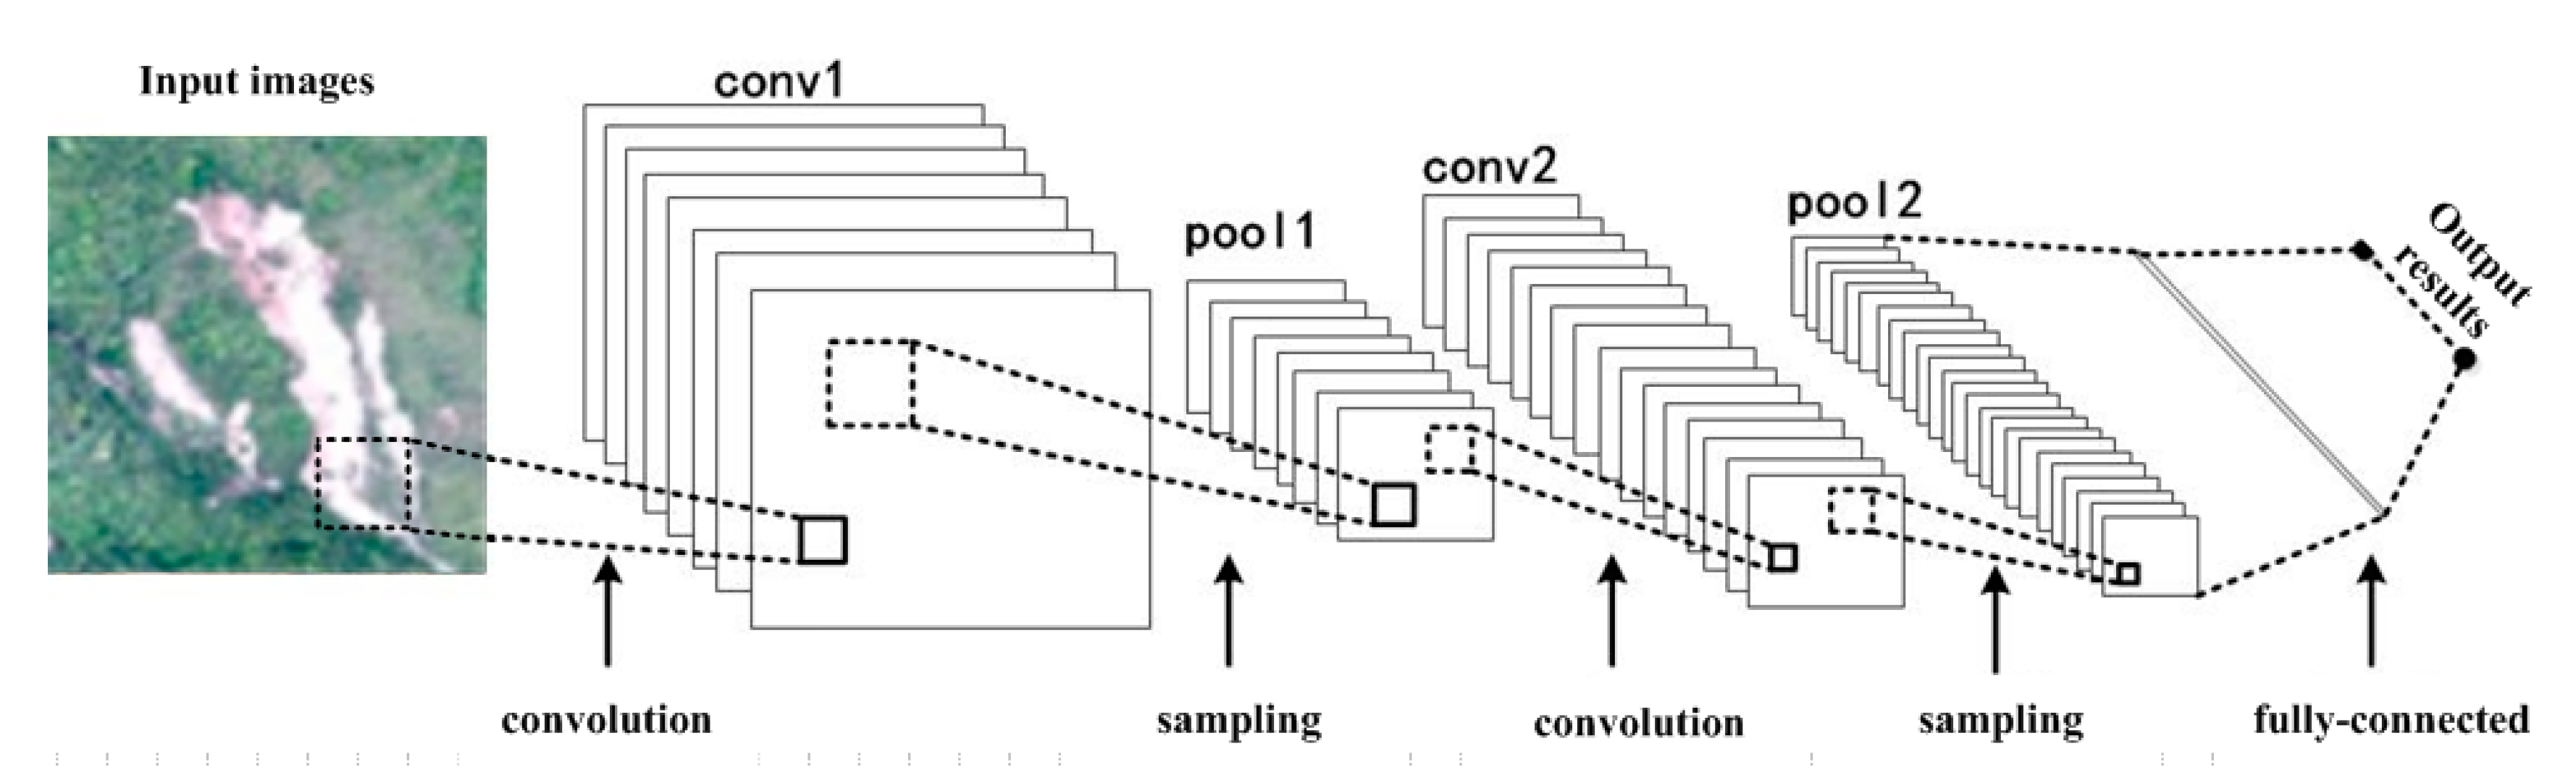
40]. A basic convolutional neural network structure can be divided into three layers, namely feature extraction layer, feature mapping layer, and feature pooling layer. A deep convolutional network can be established by stacking multiple basic network structures, as shown in
Figure 5. Conv1 and conv2 represent convolutional layer 1 and convolutional layer 2, and pool1 and pool2 represent pooling layer 1 and pooling layer 2.
(1) Feature extraction layer: This layer is the feature extraction layer. The input of each neuron is connected with the local receptive field of the previous layer and extracts the local features. Assume that the input image
I is a two-dimensional matrix, the size of which is
, use a trainable filter group
, the size of which is
, to compute the convolution, and the step size is
. Finally, there is a
Y output of
size. Where:
where
represents the input convolutional layer,
represents the convolutional kernel parameters,
represents the deviation value, and * represents the convolution operation. Each filter corresponds to a specific feature.
(2) Feature mapping layer: A nonlinear function is used to map the results of the filter layer to ensure the validity of the feature, and the feature map
F is obtained.
where,
is the activation function. Tanh, sigmoid, and softplus are common activation functions. Tanh is a variant of sigmoid, whose value range is [0,1]. The linear correction unit ReLU is the closest to the activation model of biological neurons after stimulation and has certain sparsity. The calculation is simple, which is helpful to improve the effect [
41].
(3) Feature pooling layer: Theoretically, features can be acquired through convolution and then directly used to train the classifier. However, the feature dimensions of any medium-sized image are in millions after convolution, and the classifier is easily overfitted after direct training. Therefore, the pooling of convolution features, or downsampling, is needed.
is the convolution feature map, which is divided into disjoint regions with a size of
, and then calculate the average value (or maximum value) of these regions and taken as the pooling feature
, whose size is
. The pooled feature dimension is greatly reduced to avoid overfitting and it is robust.
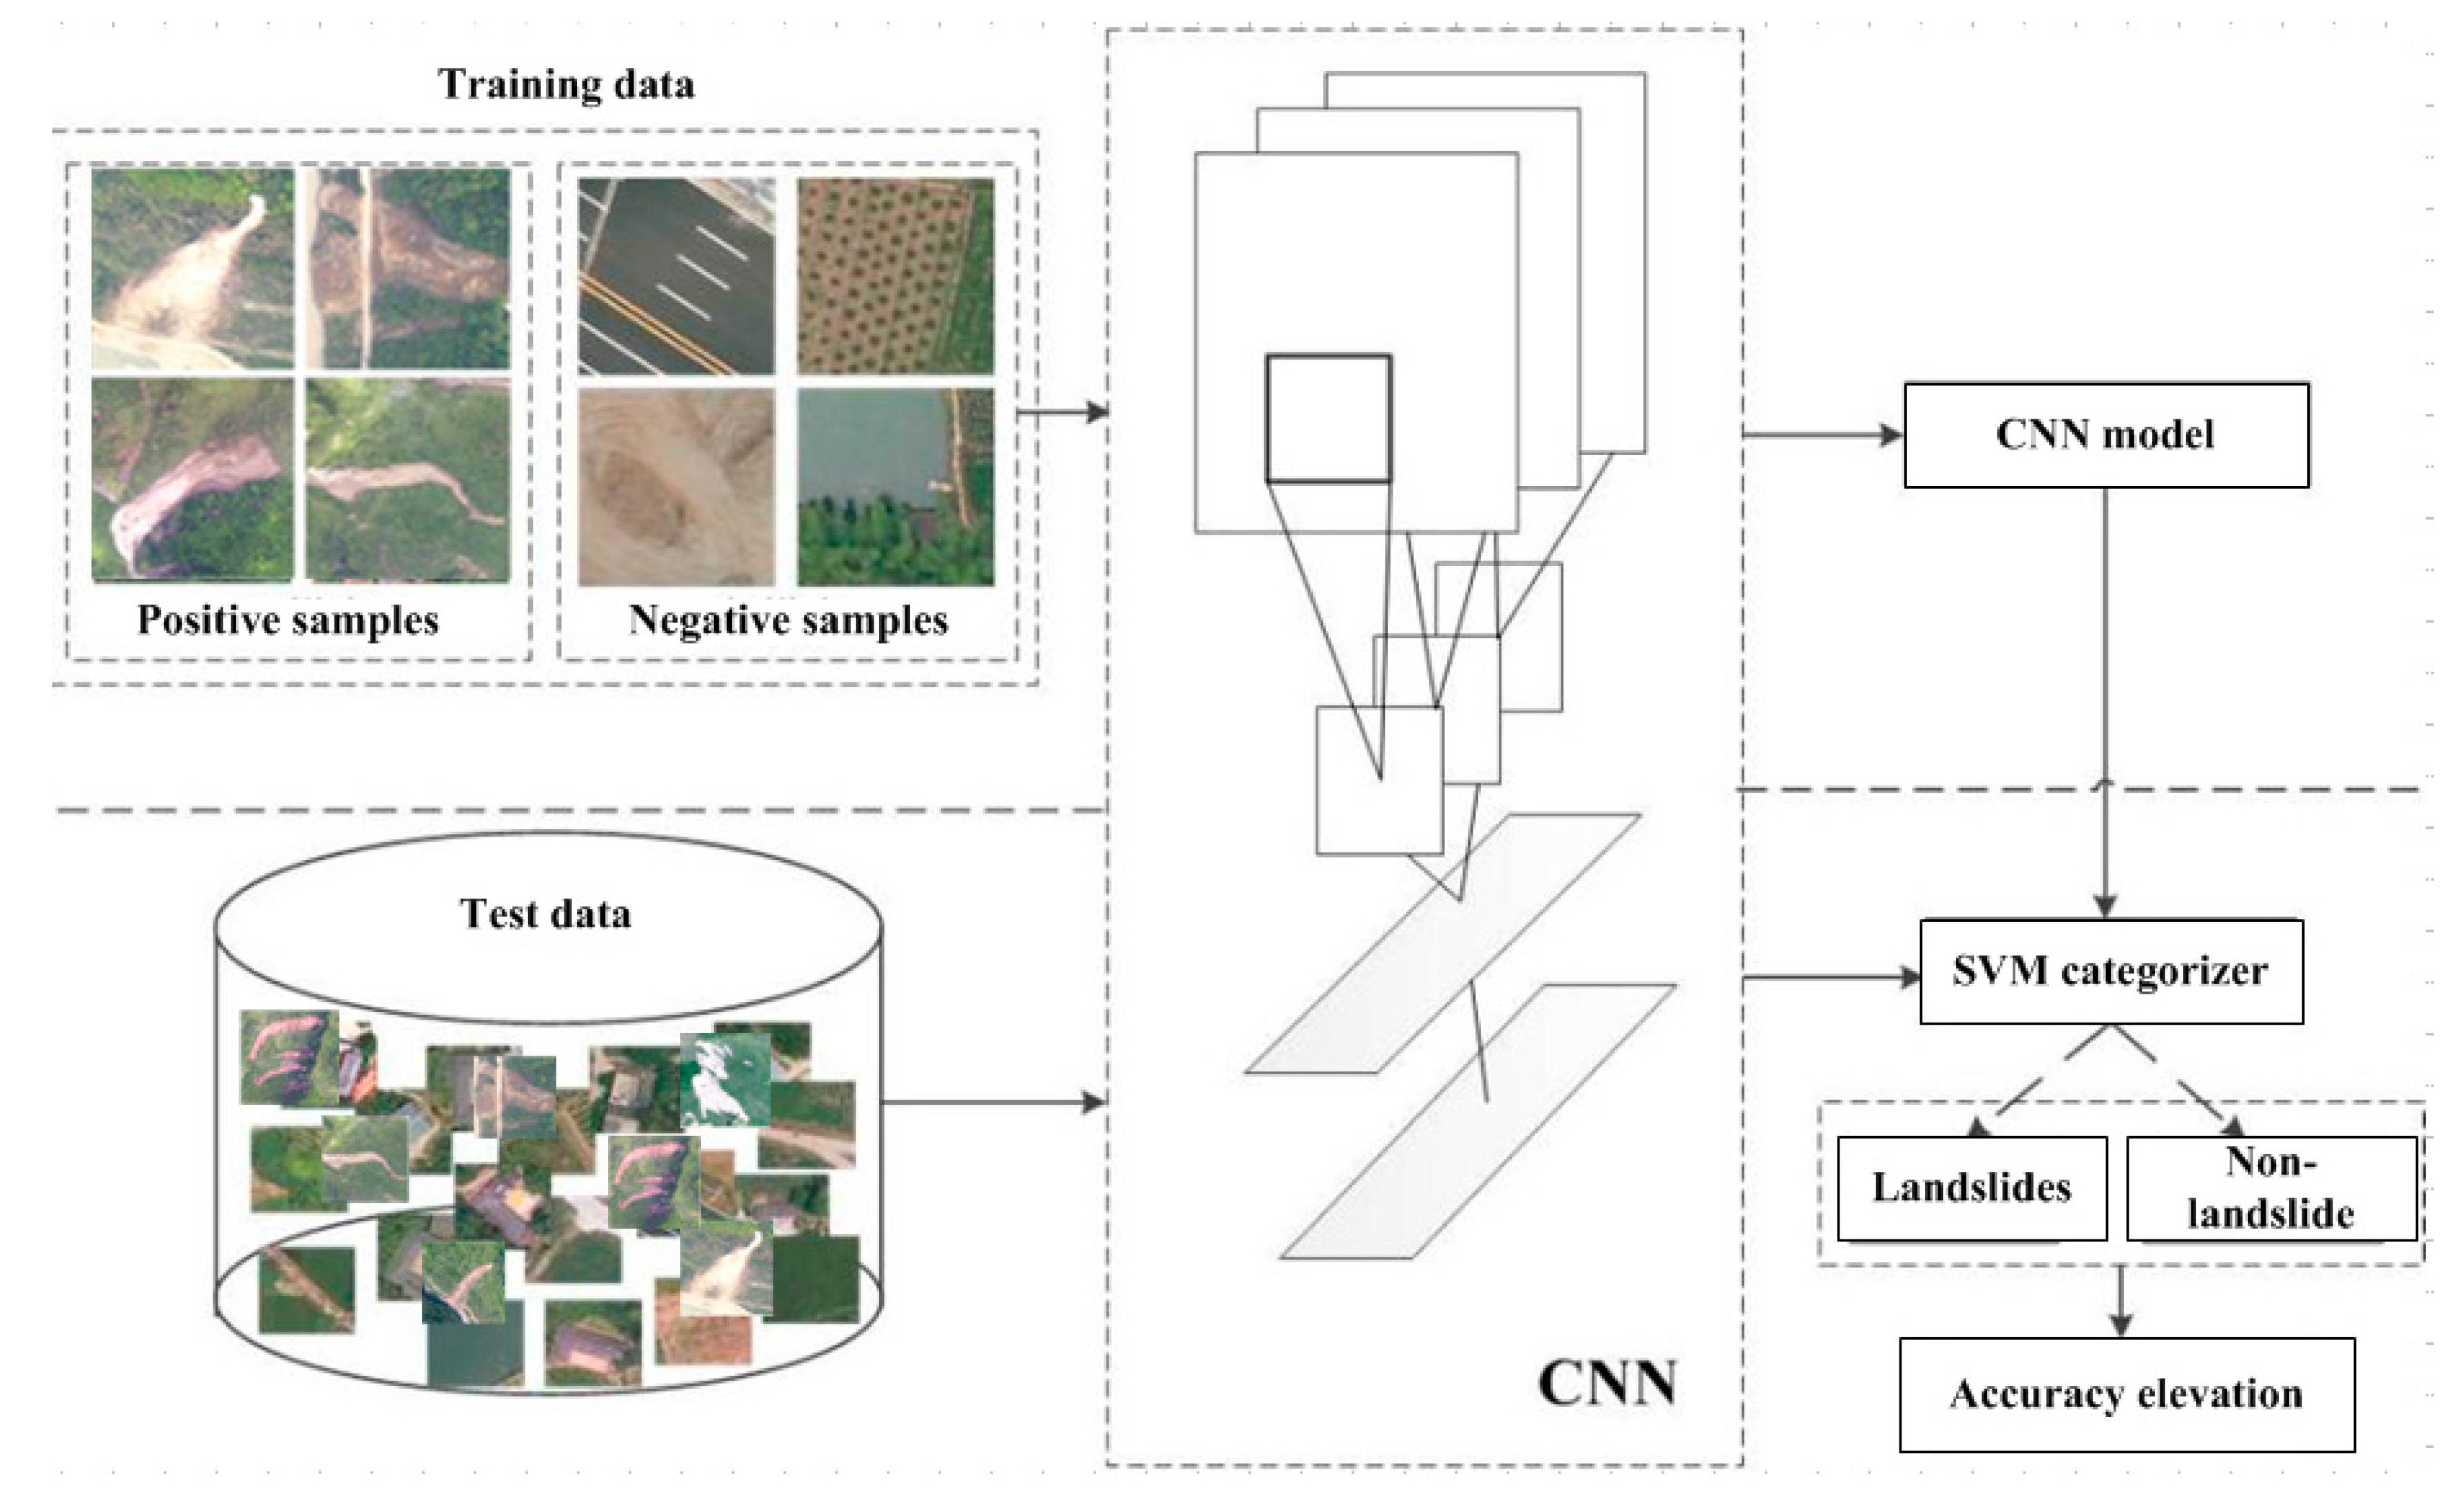
Figure 6 is the flow chart of the CNN-based landslide interpretation model.
3.4.4. Landslides Feature Extraction Based on TL Model
In the process of training a deep learning model, problems, such as insufficient training samples, often occur. The emergence of TL has aroused extensive attention and research. Technologies that are related to machine learning and data mining have been used in many practical applications [
42]. In traditional machine learning framework, the task of learning is to learn a classification model with sufficient training data. In the field of image identification, the first step is to label a large amount of image data manually and, then, based on the machine learning method, obtain a classification model, which is used to classify and identify the test images. Traditional machine learning needs to calibrate a lot of training data for each field, which will cost a lot of manpower and material resources. However, without a large number of labeled data, many studies and applications that are related to learning cannot be carried out. Generally, traditional machine learning assumes that training data and test data obey the same data distribution. However, in many cases, this assumption cannot be met, which might lead to the expiration of training data. This often requires re-labeling a large number of training data to meet the needs of training, but it is very expensive to label new data because it requires a lot of manpower and material resources.
There are many connections between the target detection of remote sensing image and natural image in nature; in many ways, they are thought of as the same problem. The goal of transfer learning is to transfer knowledge from the existing priori sample data and use the knowledge learned from an environment to help the learning task in the new environment. Moreover, there is no strict assumption, as traditional machine learning theory requires that the training data and test data should have the same distribution [
43]. The weight of a new category and a classification model applicable to the target task are obtained through pre-training models in the existing classification data set, removing the neural network on top of the training model, and retraining an output layer through the target task data set. This method can shorten the training time of the model and improve work efficiency [
44,
45]. At present, there are many labeled natural image libraries. For example, the typical ImageNet library labeled by Stanford University, which contains millions of labeled images, includes more than 15 million high-resolution images with labels. These images are divided into more than 22,000 categories, thus making it the largest labeled image library in image identification field. The pre-training model is obtained by learning the method of image feature extraction from ImageNet library with the method of transfer learning on features.
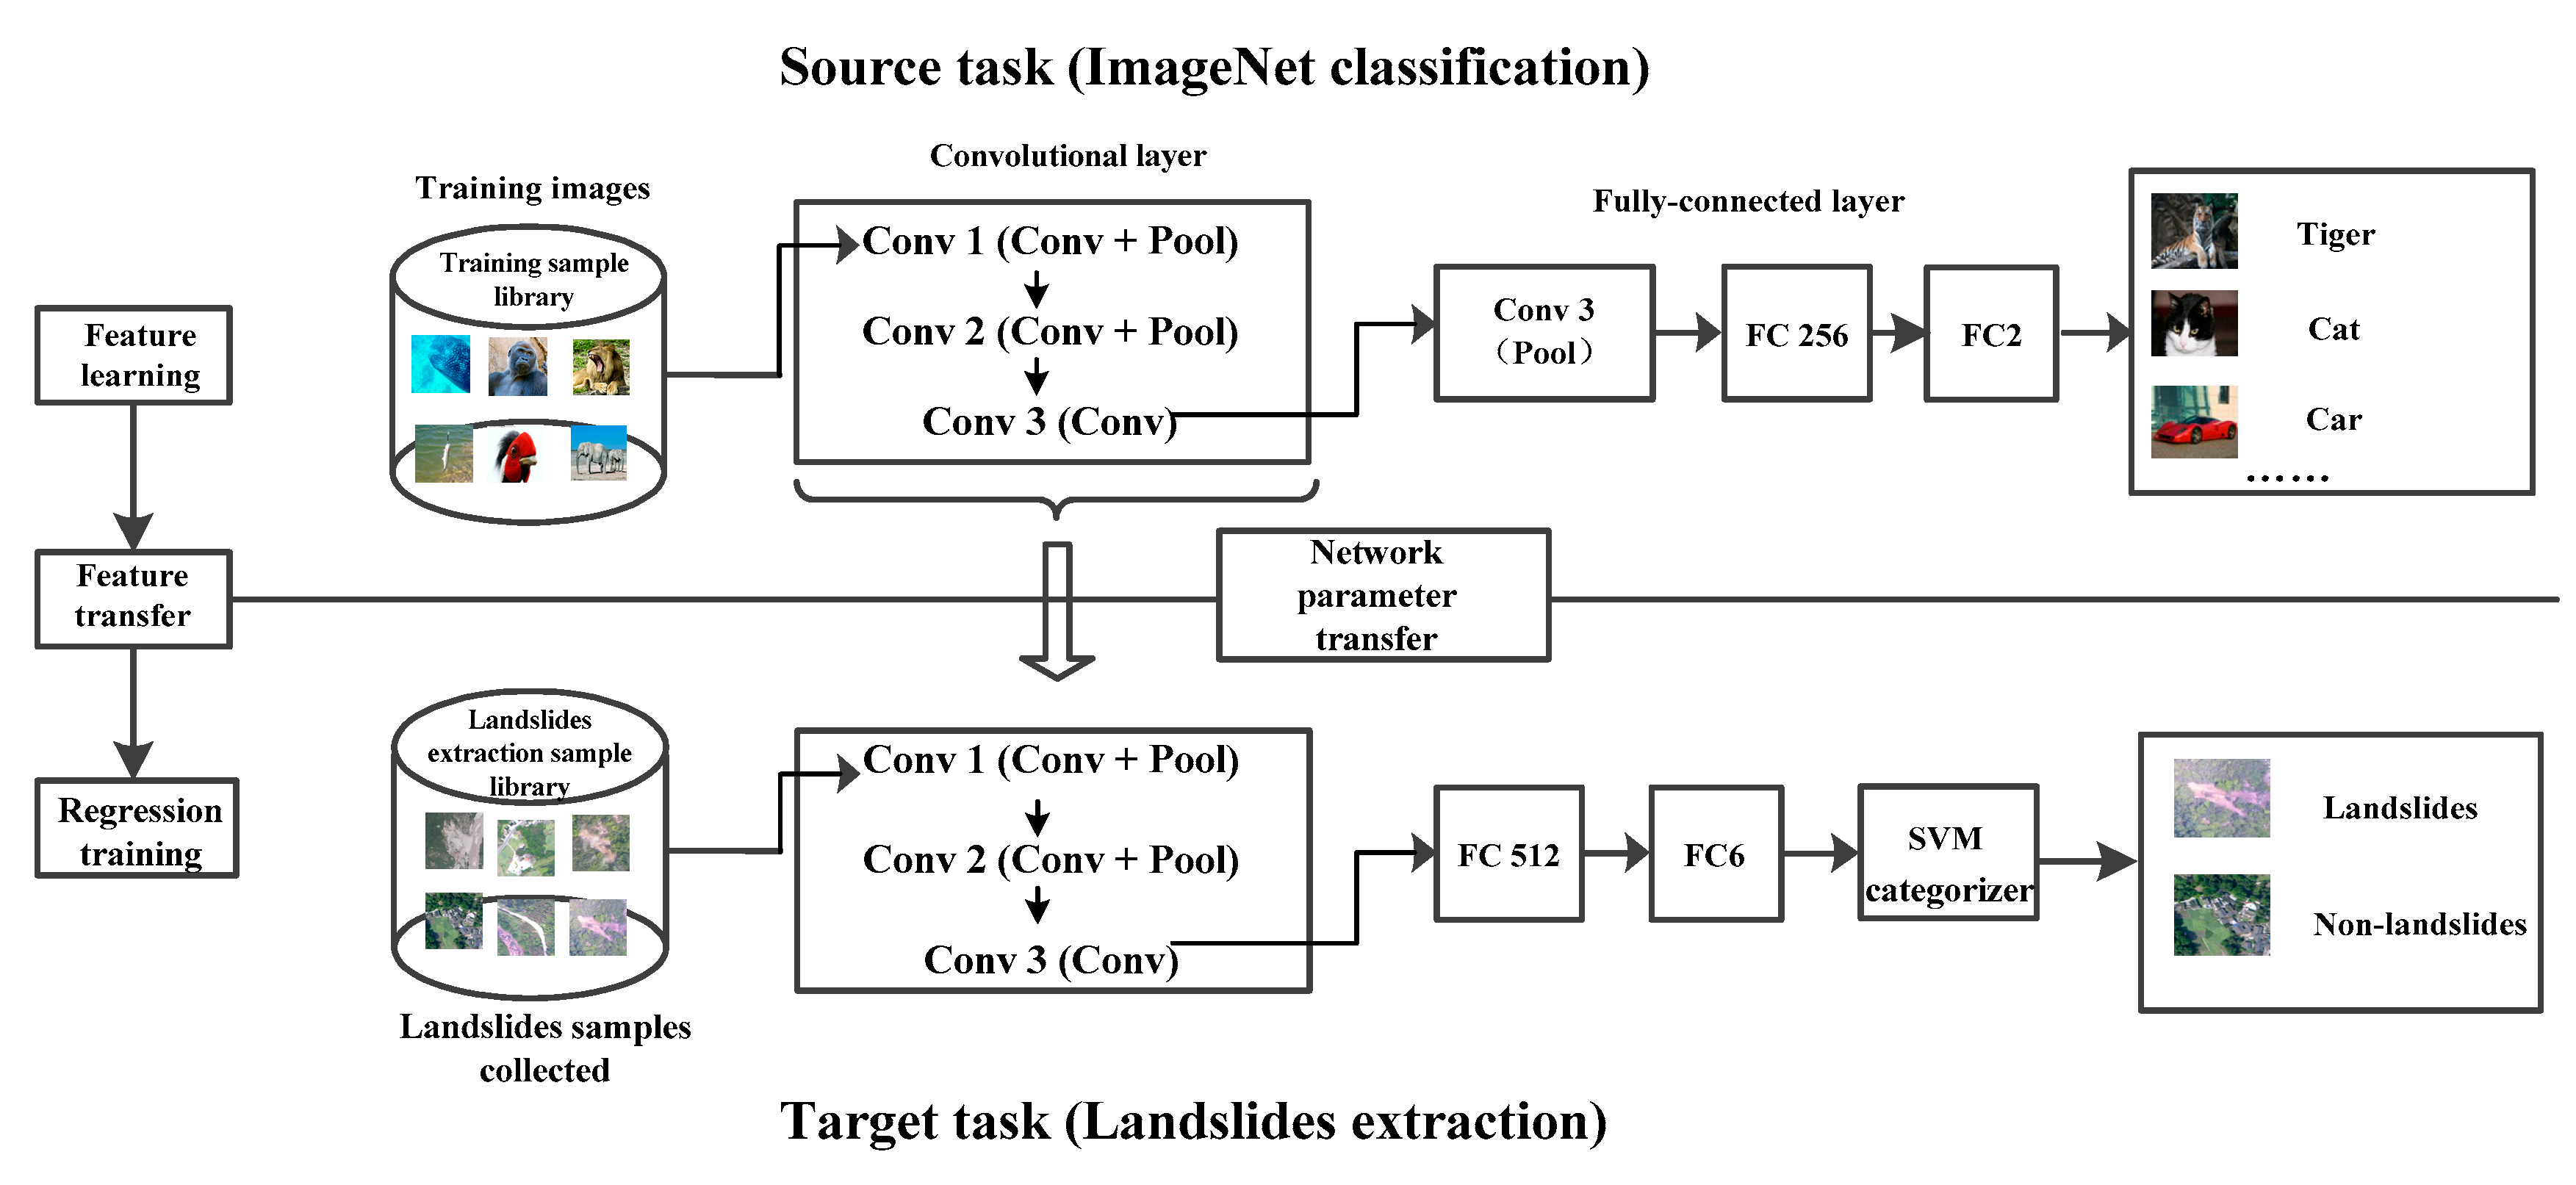
Figure 7 is the framework of the landslide interpretation model that is described in this paper, which is obtained through transfer learning. It mainly includes three parts, namely feature learning, feature transfer, and landslide interpretation model training. Source task is the scene classification in the original deep learning. The classification model of the target task is built by transferring the network parameters and the results of the source task to the optimized target task. In
Figure 7, conv represents convolutional layer, pool represents pooling layer, and FC represents the fully-connected layer.
3.4.5. Reliability Evaluation of Landslide Feature Extraction Model
There are many methods for evaluating the landslide feature extraction results. The Confusion Matrix is used to verify the accuracy of the interpretation model, in accordance with the quantitative research needs of this paper [
46].
Table 1 shows the evaluation indicator system.
Where TP represents the positive is predicted to be a positive value; TN indicates that the negative is predicted to be a negative value; FP means that the negative is predicted to be a positive value; and, FN indicates that the positive is predicted to be a negative value. Precision, ACC, and Recall rate are defined, as shown in Formula (4).
3.5. Combination of Object-oriented Image Analysis and TL Model
The core concept of the object-oriented classification method is that the single pixel is taken as the minimum cell under a specific scale and calculated with its neighborhood pixels in the principle of being the most suitable for each other to obtain the object of segmentation with the best homogeneity; when the segmentation on a certain scale has been completed, the new object of segmentation is taken as a cell to continue the calculation of adjacent objects and then merge to generate the object under the new scale until merging under such scale has been completed [
47]. As the object-oriented classification method regards the body as an integral object, such body also has such features as spatial form, geometric length, and neighborhood relationship, in addition to the spectral characteristic under this ideological system and, therefore, its accuracy is lifted to a certain extent in comparison with that of the pixel-oriented method. Although making use of object-oriented image segmentation technology can effectively realize segmentation in ground object target, it is difficult to obtain the specific attribute information on the ground object. The structure of landslide has certain space geometry and texture features, yet it is very difficult to accurately identify the landslide from mass and abundant remote sensing data by the traditional classification method and it possesses obvious advantages to realize the structural features of a complex system by CNN interpretation.
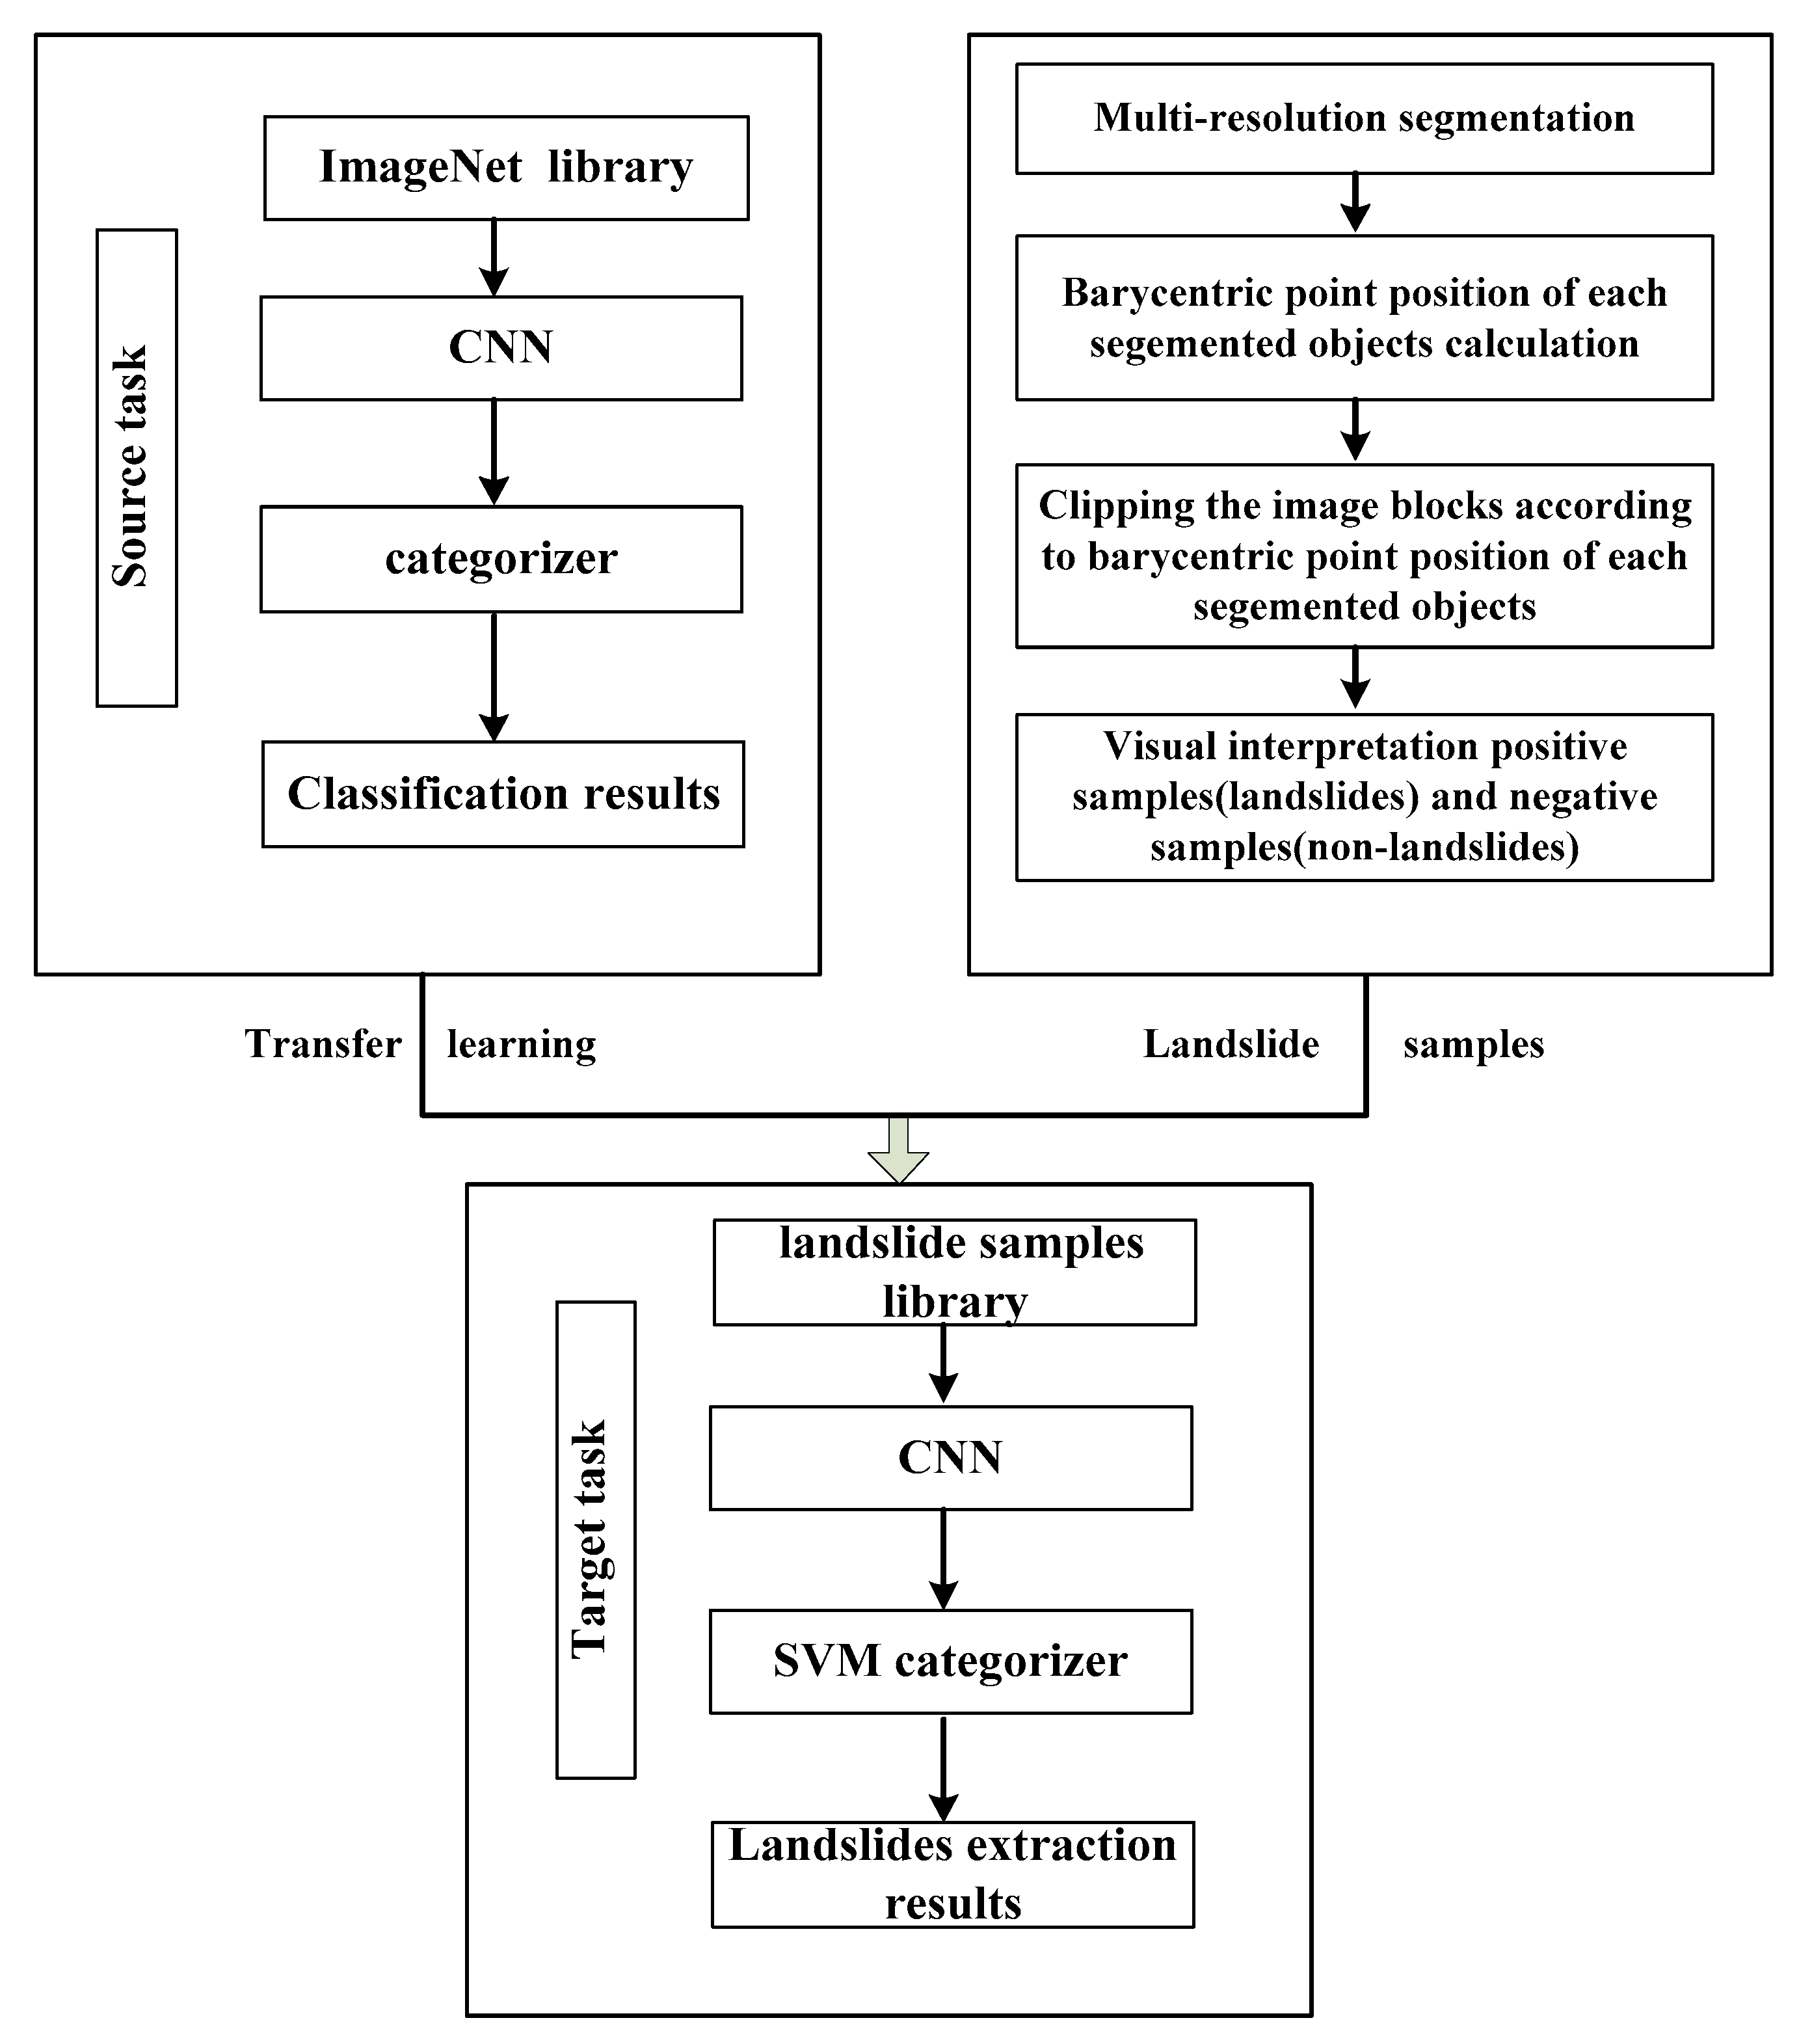
In the process of landslides information extraction from high-resolution images, the feature extraction determines the final accuracy. A great number of samples are required to support the feature extraction due to the huge difference between high-resolution images and ordinary natural images and great change in spatial spectrum, but there is a limited number of landslides in the research region and less collectible samples and, hence, this article combines the aforesaid TL model and the object-oriented image analysis to establish a method for landslide information extraction from high-resolution UAV images that can realize large-scale scattered landslide information extraction. The process of TLOEL method is as shown in
Figure 8.
3.6. Landslide Information Extraction by NNC Method
The NNC method is a mature classification method in view of its simple operation, high efficiency, and wide application scope [
48]. The control group researched in the paper is the nearest neighbor classification method. The specific process is as follows: First, the sample object is selected and statistically analyzed to obtain relevant feature values, such as texture, spectrum, shape, and neighborhood information, so as to build a multi-dimensional feature space. Afterwards, the distance difference between the object to be classified and the sample is calculated, and the object to be classified is classified into the class according to the distance relationship of the features and the membership function to determine which sample class is nearest to the object to be classified. As shown in Formula (5).
Where, is feature distance, is the feature, is the sample object, is the object to be classified, is the standard deviation of feature value, is the feature value of feature of sample object , and is the feature value of feature of object to be classified .
3.7. Accuarcy Evaluation
The accuracy of information extraction from different ground objects is known as the classification accuracy, and it is a common standard for testing the degree of advantages and disadvantages of the classification rules. We usually modify the final classification results according to the result of assessment on the classification accuracy, and if such assessment is low, it is necessary to improve the rule definition. The methods for assessment on the classification accuracy generally fall into two categories: one refers to the qualitative accuracy assessment methods by artificial visual interpretation and the other refers to the quantitative accuracy assessment methods [
49]. The artificial visual interpretation method gives consideration to certain reliability on the premise of rapid assessment, but only interpretation professionals can carry out related operation, which results in large subjectivity of the assessment results; serious divergence between the results evaluated by field investigation and visual interpretation, respectively, indicates an undesirable classification, so it is required to set the feature rules for reclassification and the accuracy assessment will not be made until the classification results are relatively identical. The accuracy assessment is usually shown in percentage and the accuracy assessment method widely applied at present is called the confusion matrix method, which is defined, as follows:
where
represents the total number of pixels which are assigned to Category
from those subordinate to Category
in the research region and
represents the total number of categories. In the confusion matrix, the greater value in the leading diagonal indicates a higher reliability in the classification results.
The common indexes of assessment on classification accuracy include overall accuracy, product’s accuracy, user’s accuracy, and Kappa coefficient in addition to the confusion matrix.
(1) Overall Accuracy (OA) refers to the specific value of a total number of all correct classifications and that of samplings and reflects the degree of correctness of all categories in the classification results of images. It is calculated in the following formula:
(2) Product’s Accuracy (PA) refers to the specific value of the number of pixels in correct classification from a single category and the total number of pixels in reference data of such category. It is calculated in the following formula:
(3) User’s Accuracy (UA) refers to the specific value of the number of pixels in correct classification from a single category and the total number of pixels in such category and it indicates the probability that a classified pixel authentically represents such category. It is calculated in the following formula:
(4) The Kappa coefficient refers to an assessment index to judge the extent of coincidence between two images and range from 0 to 1. It indicates how much the classification method selected is better than the method that the single pixel is randomly assigned to any category. It is calculated in the following formula:
where n represents the total number of categories,
represents the pixel value at Line i and Row j in the confusion matrix, N represents the total number of samples, and
and
are, respectively, sums of rows and lines in the confusion matrix. The Kappa coefficient is calculated by comprehensive utilization of all information in the confusion matrix and, therefore, can be used as a comprehensive index for an assessment on classification accuracy.
5. Discussion
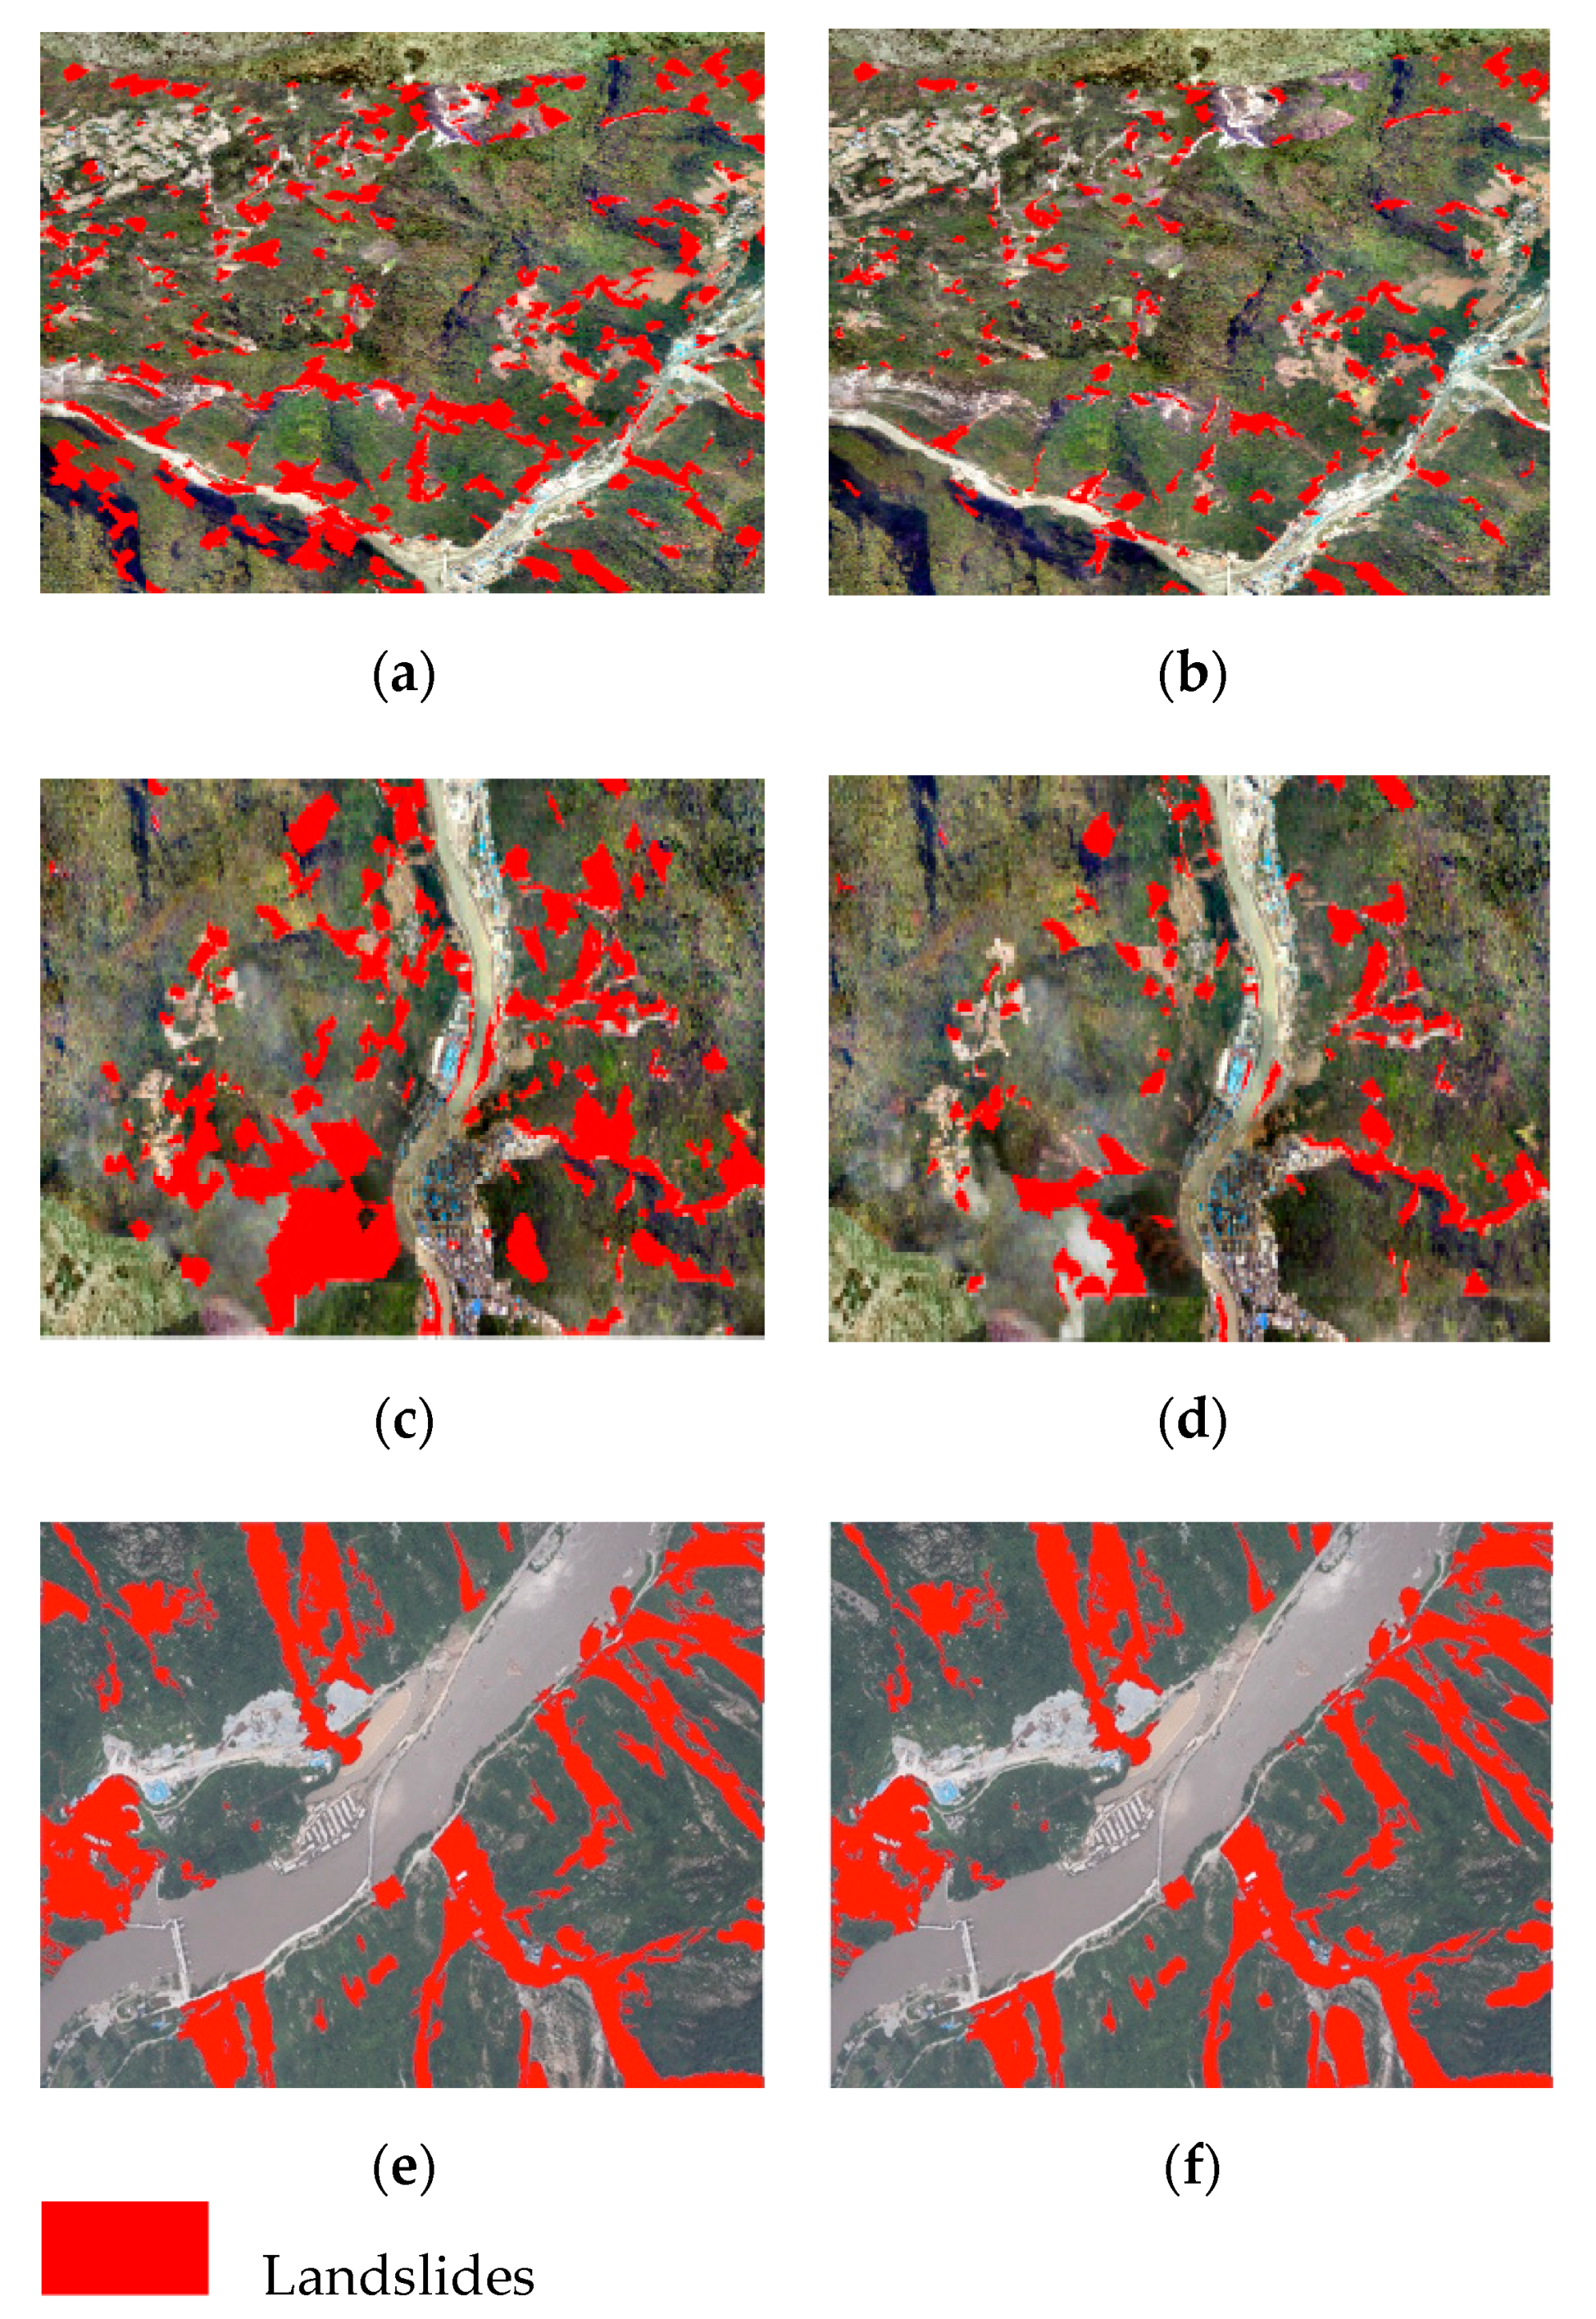
It can be found that the landslides in experimental images 1 and 2 are secondary disasters caused by earthquakes through analysis and field investigation. Most of them are rock landslides, and the spectral and texture characteristics of rock landslides are very similar to those of bare rock masses. This leads to the NNC method misclassifying some bare rock masses into landslides. The TLOEL method has missing classification situation when extracting such landslides. Some of them are muddy landslides; the spectral characteristics of these landslides are similar to those of bare land. NNC method misclassifies some bare land into landslides. Although the TLOEL method has fewer misclassification, it also has some missing classification. The landslide in experiment image 3 is a landslide caused by rainfall. It is difficult to extract the landslide from turbid water and bare rock. The NNC method has the situation of missing classification and misclassifying bare rock into landslides. The TLOEL method has less misclassification, but there are also some missing classifications.
Generally speaking, TLOEL method has certain universality after the completion of sample database construction. For the same task workload, when compared with visual interpretation, this method has obvious advantages in interpretation efficiency, and it has higher accuracy than NNC landslide extraction method. However, in the process of object-oriented image analysis, simple image segmentation will obtain a large number of image objects, and subsequent information extraction will have a large amount of calculation. Landslides usually occur in areas with large topographic fluctuations. In the process of landslide extraction, the Digital Elevation Model (DEM) and slope stability model (e.g., shallow land sliding stability model) can be used to calculate the stability degree of the surface in the certain area [
51]. By assigning the stability degree as a weight to the segmented image object, the region with high stability can be eliminated, and the number of objects participating in the subsequent operation can be reduced.
Through the above calculation results, it can be seen that the TLOEL method that is proposed in this paper has advantages for large-scale and scattered distribution landslide extraction, but, at the same time, it is still a complicated work to obtain training samples. In fact, many regions have historical images and historical thematic maps. If these historical data can be used in current interpretation tasks, it will inevitably improve the accuracy and efficiency of interpretation. In future research, besides feature transfer learning, we can also consider design a transfer method for surface feature category labels (associated knowledge) based on two temporal invariant object detection, so as to realize the transfer of "category interpretation knowledge of invariant surface features" from the source domain to the target domain, and to establish a new feature-object mapping relationship.
6. Conclusions
In the paper, wide hazardous areas of landslides in mountainous areas in southwestern China were researched, a landslide sample database was set up, the optimal feature extraction model, namely the transfer learning model, is selected by comparison, and a high-resolution remote sensing image landslide extraction method is proposed by combining this model with the object-oriented image analysis method. This method effectively combines the deep learning in the field of computer with the field of disaster remote sensing, and then improves the automation of landslide information acquisition in the field of high-resolution remote sensing. In addition, the landslide sample database that was established in the paper will provide important data reference for the research of the same type of landslides in southwestern China. While considering that historical archived images and surface feature category maps are available for some researched areas, how to further explore the relationship between historical data and current images and establishing the knowledge transfer framework between historical data and current images will be the key research items in the next step.


