Evaluation of Global Solar Irradiance Estimates from GL1.2 Satellite-Based Model over Brazil Using an Extended Radiometric Network

Abstract
:
1. Introduction
2. GL Model Overview
3. Data and Methods
3.1. GL Satellite Product
3.2. Ground Data
3.3. Data Quality Control
3.4. Performance Metrics and Analysis
4. Results
4.1. Comparing GL with Two Ground-Based Reference Networks
4.2. Monthly Evaluation
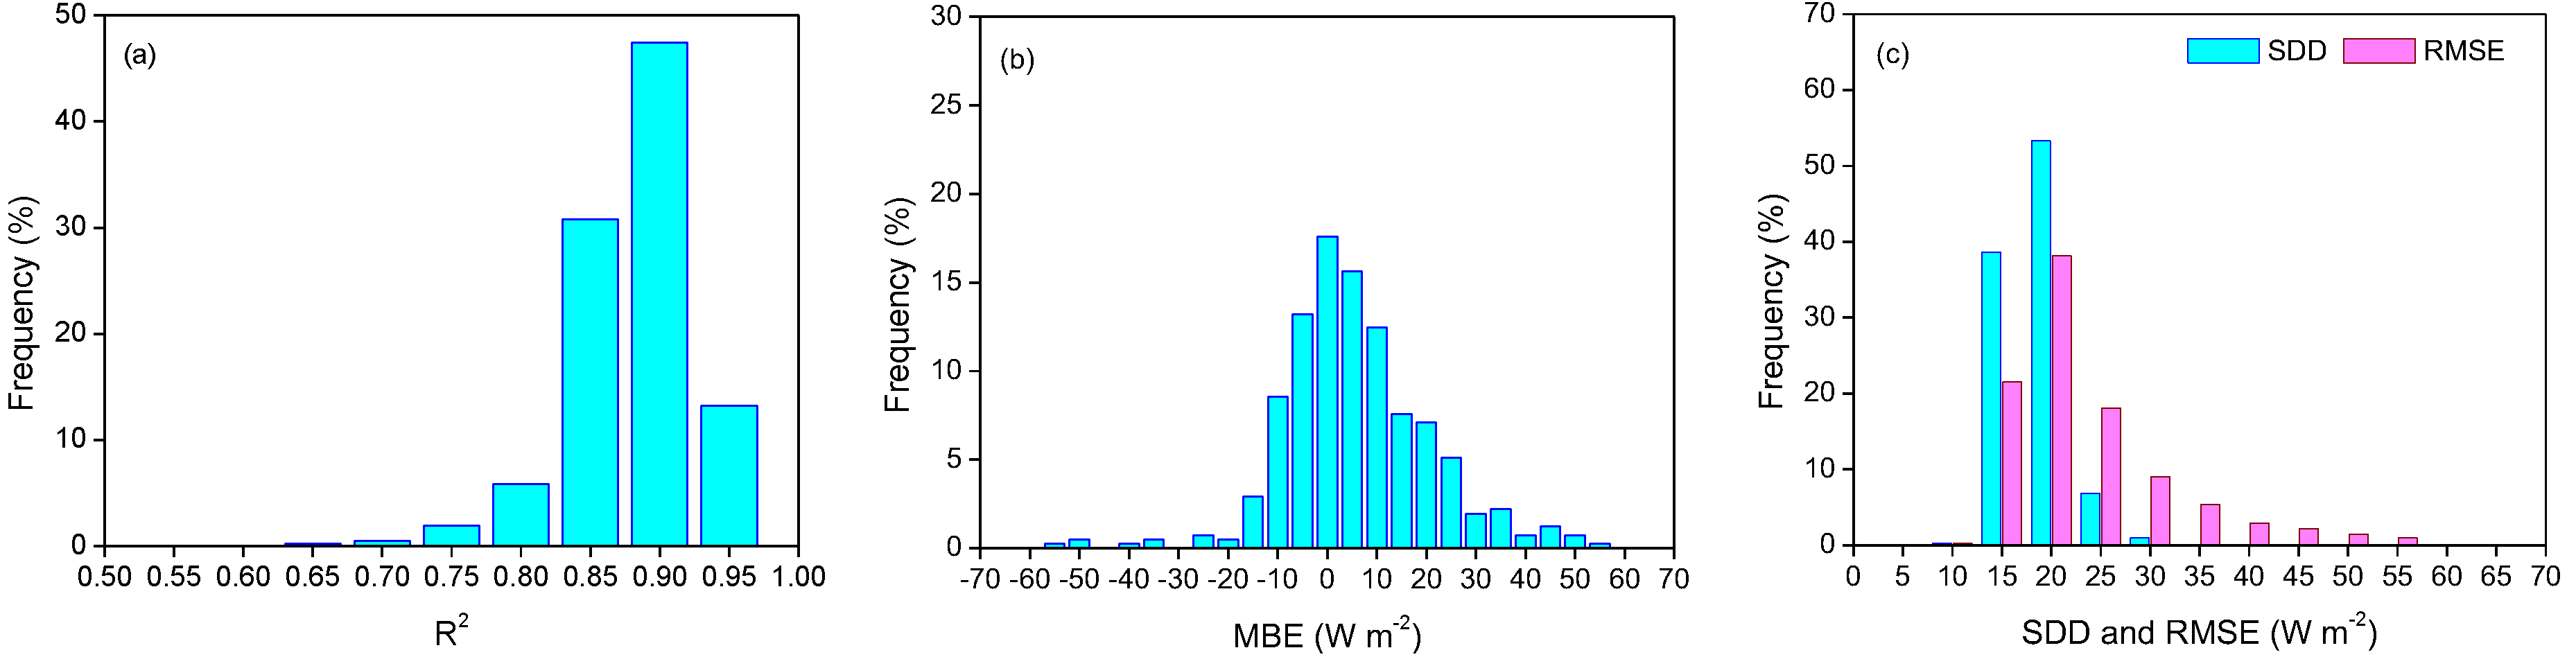
4.3. Daily Evaluation
5. Discussion
6. Conclusions
Author Contributions
Funding
Acknowledgments
Conflicts of Interest
Abbreviations
| ABI | Advanced Baseline Imager |
| AOD | Aerosol optical depth |
| BSRN | Baseline Surface Radiation Network |
| CMSAF | Satellite Application Facility on Climate Monitoring |
| CPTEC | Center for Weather Forecast and Climate Studies |
| DJF | December–February |
| DSA | Satellite and Environmental System Division |
| G | Measured global solar irradiance |
| GL | GLobal radiation model |
| GOES | Geostationary Operational Environmental Satellite |
| GSIP | GOES Surface and Insolation Product |
| INMET | Brazilian National Institute of Meteorology |
| INPE | National Institute for Space Research |
| ITCZ | Intertropical Convergence Zone |
| JJA | June–August |
| MAM | March–May |
| MBE | Mean bias error |
| MODIS | Moderate Resolution Imaging SpectroRadiometer |
| NASA | National Aeronautics and Space Administration |
| NCEP | National Centers for Environmental Prediction |
| NIR | Near-infrared |
| R2 | Coefficient of determination |
| RMSE | Root mean square error |
| SARAH | Solar surfAce RAdiation Heliosat |
| SBDART | Santa Barbara DISORT Atmospheric Radiative Transfer model |
| SDD | Standard deviation of the differences |
| SolRad-Net | Solar Radiation Network |
| SON | September–November |
| SONDA | Environmental Data Organization System |
| SRB | Surface Radiation Budget |
| UMD | University of Maryland |
| UV | Ultraviolet |
| VIS | Visible |
References
- Schulz, J.; Albert, P.; Behr, H.-D.; Caprion, D.; Deneke, H.; Dewitte, S.; Dürr, B.; Fuchs, P.; Gratzki, A.; Hechler, P.; et al. Operational climate monitoring from space: The EUMETSAT Satellite Application Facility on Climate Monitoring (CM-SAF). Atmos. Chem. Phys. 2009, 9, 1687–1709. [Google Scholar] [CrossRef] [Green Version]
- Trenberth, K.E.; Fasullo, J.T.; Kiehl, J. Earth’s Global Energy Budget. Bull. Am. Meteor. Soc. 2009, 90, 311–323. [Google Scholar] [CrossRef]
- Wang, K.; Wang, P.; Li, Z.; Cribb, M.; Sparrow, M. A simple method to estimate actual evapotranspiration from a combination of net radiation, vegetation index, and temperature. J. Geophys. Res. 2007, 112, D15107. [Google Scholar] [CrossRef]
- Bois, B.; Pieri, P.; Van Leeuwen, C.; Wald, L.; Huard, F.; Gaudillere, J.P.; Saur, E. Using remotely sensed solar radiation data for reference evapotranspiration estimation at a daily time step. Agric. For. Meteorol. 2008, 148, 619–630. [Google Scholar] [CrossRef] [Green Version]
- Abraha, M.G.; Savage, M.J. Comparison of estimates of daily solar radiation from air temperature range for application in crop simulations. Agric. For. Meteorol. 2008, 148, 401–416. [Google Scholar] [CrossRef]
- Martins, F.R.; Abreu, S.L.; Pereira, E.B. Scenarios for solar thermal energy applications in Brazil. Energy Policy 2012, 48, 640–649. [Google Scholar] [CrossRef]
- Polo, J.; Bernardos, A.; Navarro, A.A.; Fernandez-Peruchena, C.M.; Ramírez, L.; Guisado, M.V.; Martínez, S. Solar resources and power potential mapping in Vietnam using satellite-derived and GIS-based information. Energy Convers. Manag. 2015, 98, 348–358. [Google Scholar] [CrossRef]
- WMO. WMO-No. 8. In Guide to Meteorological Instruments and Methods of Observation, 7th ed.; WMO: Geneva, Switzerland, 2008. [Google Scholar]
- Sengupta, M.; Habte, A.; Kurtz, S.; Dobos, A.; Wilbert, S.; Lorenz, E.; Stoffel, T.; Renne, D.; Gueymard, C.; Myers, D.; et al. Best Practices Handbook for the Collection and Use of Solar Resource Data for Solar Energy Applications; NREL/TP-5D00-63112; National Renewable Energy Laboratory: Golden, Colorado, 2015. Available online: http://www.nrel.gov/docs/fy15osti/63112.pdf (accessed on 1 July 2019).
- Tarpley, J.D. Estimating incident solar radiation at the Earth’s surface from geostationary satellite data. J. Appl. Meteorol. 1979, 18, 1172–1181. [Google Scholar] [CrossRef] [Green Version]
- Gautier, C.; Diak, G.; Masse, S. A simple physical model to estimate incident solar radiation at the surface from GOES satellite data. J. Appl. Meteorol. 1980, 19, 1005–1012. [Google Scholar] [CrossRef] [Green Version]
- Cano, D.; Monget, J.M.; Aubuisson, M.; Guillard, H.; Regas, N.; Wald, L. A method for the determination of global solar radiation from meteorological satellite data. Sol. Energy 1986, 37, 31–39. [Google Scholar] [CrossRef] [Green Version]
- Stuhlmann, R.; Rieland, M.; Raschke, E. An improvement of the IGMK model to derive total and diffuse solar radiation at the surface from satellite data. J. Appl. Meteorol. 1990, 29, 586–603. [Google Scholar] [CrossRef] [Green Version]
- Pinker, R.T.; Laszlo, I. Modeling surface solar irradiance for satellite applications on a global scale. J. Appl. Meteorol. 1992, 31, 194–211. [Google Scholar] [CrossRef] [Green Version]
- Rigollier, C.; Lefevre, M.; Wald, L. The method Heliosat-2 for deriving shortwave solar radiation from satellite images. Sol. Energy 2004, 77, 159–169. [Google Scholar] [CrossRef] [Green Version]
- Perez, R.; Ineichen, P.; Moore, K.; Kmiecik, M.; Chain, C.; George, R.; Vignola, F. A new operational model for satellite-derived irradiances: Description and validation. Sol. Energy 2002, 73, 307–317. [Google Scholar] [CrossRef] [Green Version]
- Hammer, A.; Heinemann, D.; Hoyer, C.; Kuhlemann, R.; Lorenz, E.; Mueller, R.; Beyer, H.G. Solar Energy Assessment Using Remote Sensing Technologies. Remote Sens. Environ. 2003, 86, 423–432. [Google Scholar] [CrossRef]
- Janjai, S.; Laksanaboonsong, J.; Nunez, M.; Thongsathitya, A. Development of a method for generating operational solar radiation maps from satellite data for a tropical environment. Sol. Energy 2005, 78, 739–751. [Google Scholar] [CrossRef]
- Pinker, R.T.; Frouin, R.; Li, Z. A review of satellite methods to derive surface shortwave irradiance. Remote Sens. Environ. 1995, 51, 108–124. [Google Scholar] [CrossRef]
- Polo, J.; Zarzalejo, L.F.; Ramírez, L. Solar radiation derived from satellite images. In Modeling Solar Radiation at the Earth’s Surface, 1st ed.; Badescu, V., Ed.; Springer: Berlin/Heidelberg, Germany, 2008; pp. 449–461. [Google Scholar]
- Huang, G.; Ma, M.; Liang, S.; Liu, S.; Li, X. A LUT- based approach to estimate surface solar irradiance by combining MODIS and MTSAT data. J. Geophys. Res. 2011, 116, D22201. [Google Scholar] [CrossRef] [Green Version]
- Vernay, C.; Pitaval, S.; Blanc, P. Review of satellite-based surface solar irradiation databases for the engineering, the financing and the operating of photovoltaic systems. Energy Procedia 2014, 57, 1383–1391. [Google Scholar] [CrossRef]
- Polo, J.; Wilbert, S.; Ruiz-Arias, J.A.; Meyer, R.; Gueymard, C.; Súri, M.; Martín, L.; Mieslinger, T.; Blanc, P.; Grant, I.; et al. Preliminary survey on site-adaptation techniques for satellite-derived and reanalysis solar radiation datasets. Sol. Energy 2016, 132, 25–37. [Google Scholar] [CrossRef]
- Pereira, E.B.; Martins, F.R.; Abreu, S.L.; Couto, P.; Stuhlmann, R.; Colle, S. Effects of burning of Biomass on satellite estimations of solar irradiation in Brazil. Sol. Energy 2000, 68, 91–107. [Google Scholar] [CrossRef]
- Ceballos, J.C.; Bottino, M.J.; Souza, J.M. A simplified physical model for assessing solar radiation over Brazil using GOES 8 visible imagery. J. Geophys. Res. 2004, 109, D02211. [Google Scholar] [CrossRef]
- Pereira, E.B.; Martins, F.R.; Ruther, R.; Abreu, S.L. Atlas Brasileiro de Energia Solar, 1nd ed.; INPE: São José dos Campos, Brazil, 2006. [Google Scholar]
- Pereira, E.B.; Martins, F.R.; Gonçalves, A.R.; Costa, R.S.; Lima, F.J.L.; Ruther, R.; Abreu, S.L.; Tiepolo, G.M.; Pereira, S.V.; Souza, J.G. Atlas Brasileiro de Energia Solar, 2nd ed.; INPE: São José dos Campos, Brazil, 2017. [Google Scholar]
- Ceballos, J.C.; Moura, G.B.A. Solar Radiation Assessment Using Meteosat 4-VIS Imagery. Sol. Energy 1997, 60, 209–219. [Google Scholar] [CrossRef]
- Tarasova, T.A.; Fernandez, J.P.R.; Pisnichenko, I.A.; Marengo, J.A.; Ceballos, J.C.; Bottino, M.J. Impact of New Solar Radiation Parameterization in the Eta Model on the Simulation of Summer Climate over South America. J. Appl. Meteorol. Clim. 2006, 45, 318–333. [Google Scholar] [CrossRef] [Green Version]
- Gonçalves, L.G.G.; Shuttleworth, W.J.; Vila, D.; Larroza, E.; Bottino, M.J.; Herdies, D.L.; Aravequia, J.A.; Mattos, J.G.Z.; Toll, D.L.; Rodell, M.; et al. The South American Land Data Assimilation System (SALDAS) 5-Yr Retrospective Atmospheric Forcing Datasets. J. Hydrometeorol. 2009, 10, 999–1010. [Google Scholar] [CrossRef]
- Ceballos, J.C. Algunas características del régimen de radiación solar en Argentina, período 1996–2006. In Proceedings of the X Congreso Argentino de Meteorología (X Congremet), Buenos Aires, Argentina, 5–9 October 2009; pp. 1–8. [Google Scholar]
- Costa, S.M.S.; Negri, R.; Jezus, N.F.; Schmit, T.J.; Arai, N.; Lima, W.F.A.; Ceballos, J.C.; Rodrigues, J.V.; Machado, L.A.T.; Pereira, S.; et al. A Successful Practical Experience on Dedicated Geostationary Operational Environmental Satellites- GOES -10/12 Supporting Brazil. BAMS 2018, 99, 33–47. [Google Scholar] [CrossRef]
- Bradley, A.V.; Gerard, F.F.; Barbier, N.; Weedon, G.P.; Anderson, L.O.; Huntingford, C.; Aragão, L.E.O.C.; Zelazowski, P.; Arai, E. Relationships between phenology, radiation and precipitation in the Amazon region. Glob. Chang. Biol. 2011, 17, 2245–2260. [Google Scholar] [CrossRef]
- Pinto, L.I.C.; Costa, M.H.; Diniz, L.M.F.; Sediyama, G.C.; Pruski, F.F. Comparação de produtos de radiação solar incidente à superfície para a América do sul. Rev. Bras. Meteorol. 2010, 25, 469–478. [Google Scholar] [CrossRef]
- Bastos, E.J.B.; Souza, J.M.; Rao, T.V.R. Potential evapotranspiration estimates for Northeast Brazil using GOES-8 data. Rev. Bras. Eng. Agrícola Ambient. 2000, 4, 348–354. [Google Scholar] [CrossRef]
- Ortega, A.; Escobar, R.; Colle, S.; Abreu, S.L. The state of solar energy resource assessment in Chile. Renew. Energy 2010, 35, 2514–2524. [Google Scholar] [CrossRef]
- Ricchiazzi, P.; Yang, S.; Gautier, C.; Sowle, D. SBDART: A research and teaching software tool for plane-parallel radiative transfer in the Earth's atmosphere. Bull. Am. Meteor. Soc. 1998, 79, 2101–2114. [Google Scholar] [CrossRef] [Green Version]
- Lacis, A.A.; Hansen, J.E. A parameterization for the absorption of solar radiation in the Earth’s atmosphere. J. Atmos. Sci. 1974, 31, 118–133. [Google Scholar] [CrossRef]
- Porfirio, A.C.S.; Ceballos, J.C. A method for estimating direct normal irradiation from GOES geostationary satellite imagery: Validation and application over Northeast Brazil. Sol. Energy 2017, 155, 178–190. [Google Scholar] [CrossRef]
- INMET. Brazilian Climatological Normals 1981–2010. Brasília, Brazil; 2018. Available online: http://www.inmet.gov.br/portal/index.php?r= clima/normaisClimatologicas (accessed on 1 July 2019).
- Gueymard, C.A.; Myers, D.R. Solar radiation measurement: Progress in radiometry for improved modeling solar radiation at the earth’s surface. In Modeling Solar Radiation at the Earth's Surface, 1st ed.; Badescu, V., Ed.; Springer: Berlin/Heidelberg, Germany, 2008; pp. 1–27. [Google Scholar]
- Gueymard, C.A.; Ruiz-Arias, J.A.R. Extensive worldwide validation and climate sensitivity analysis of direct irradiance predictions from 1-min global irradiance. Sol. Energy 2016, 128, 1–30. [Google Scholar] [CrossRef]
- Long, C.N.; Dutton, E.G. BSRN Global Network Recommended QC Tests, V2.0. BSRN Technical Report (2002). Available online: http://ezksun3.ethz.ch/bsrn/admin/dokus/qualitycheck.pdf (accessed on 1 July 2019).
- Marie-Joseph, I.; Linguet, L.; Gobinddass, M.L.; Wald, L. On the applicability of the Heliosat-2 method to assess surface solar irradiance in the Intertropical Convergence Zone, French Guiana. Int. J. Remote Sens. 2013, 34, 3012–3027. [Google Scholar] [CrossRef] [Green Version]
- Ma, Y.; Pinker, R.T. Modeling shortwave radiative fluxes from satellites. J. Geophys. Res. 2012, 117, D23202. [Google Scholar] [CrossRef]
- Müller, R.; Pfeifroth, U.; Träger-Chatterjee, C.; Trentmann, J.; Cremer, R. Digging the METEOSAT Treasure—3 Decades of Solar Surface Radiation. Remote Sens. 2015, 7, 8067–8101. [Google Scholar] [CrossRef] [Green Version]
- Lefèvre, M.; Blanc, P.; Espinar, B.; Gschwind, B.; Ménard, L. The HelioClim-1 Database of Daily Solar Radiation at Earth Surface: An Example of the Benefits of GEOSS Data-CORE. IEEE J.-STARS 2014, 7, 1745–1753. [Google Scholar] [CrossRef] [Green Version]
- Urraca, R.; Gracia-Amillo, A.M.; Huld, T.; Martinez-de-Pison, F.J.; Trentmann, J.; Lindfors, A.V.; Riihelä, A.; Sanz-Garcia, A. Quality control of global solar radiation data with satellite-based products. Sol. Energy 2017, 158, 49–62. [Google Scholar] [CrossRef]
- Xia, S.; Mestas-Nuñez, A.M.; Xie, H.; Vega, R. An Evaluation of Satellite Estimates of Solar Surface Irradiance Using Ground Observations in San Antonio, Texas, USA. Remote Sens. 2017, 9, 1268. [Google Scholar] [CrossRef] [Green Version]
- Riihelä, A.; Kallio, V.; Devraj, S.; Sharma, A.; Lindfors, A.V. Validation of the SARAH-E Satellite-Based Surface Solar Radiation Estimates over India. Remote Sens. 2018, 10, 392. [Google Scholar] [CrossRef] [Green Version]
- Urraca, R.; Gracia-Amillo, A.M.; Koubli, E.; Huld, T.; Trentmann, J.; Riihelä, A.; Lindfors, A.V.; Palmer, D.; Gottschalg, R.; Antonanzas-Torres, F. Extensive validation of CM SAF surface radiation products over Europe. Remote Sens. Environ. 2017, 199, 171–186. [Google Scholar] [CrossRef] [PubMed] [Green Version]
- Porfirio, A.C.S.; Ceballos, J.C.; Enoré, D.P.; Costa, S.M.S. Validation of three satellite-based solar radiation products: Preliminary analysis over Northeast and South of Brazil. In Proceedings of the XX Congresso Brasileiro de Meteorologia (XX CBMET), Maceió, Brazil, 27–30 November 2018; pp. 1–6. Available online: https://www.researchgate.net/publication/339001756_VALIDATION_OF_THREE_SATELLITE-BASED_SOLAR_RADIATION_PRODUCTS_PRELIMINARY_ANALYSIS_OVER_NORTHEAST_AND_SOUTH_OF_BRAZIL (accessed on 3 February 2020). (In Portuguese).
- Porfirio, A.C.S. Uma Contribuição à Modelagem de Aerossol e Componentes da Radiação Solar No Modelo GL. Ph.D. Thesis, Brazilian National Institute of Space Research, São José dos Campos, Brazil, 2017; p. 99. [Google Scholar]


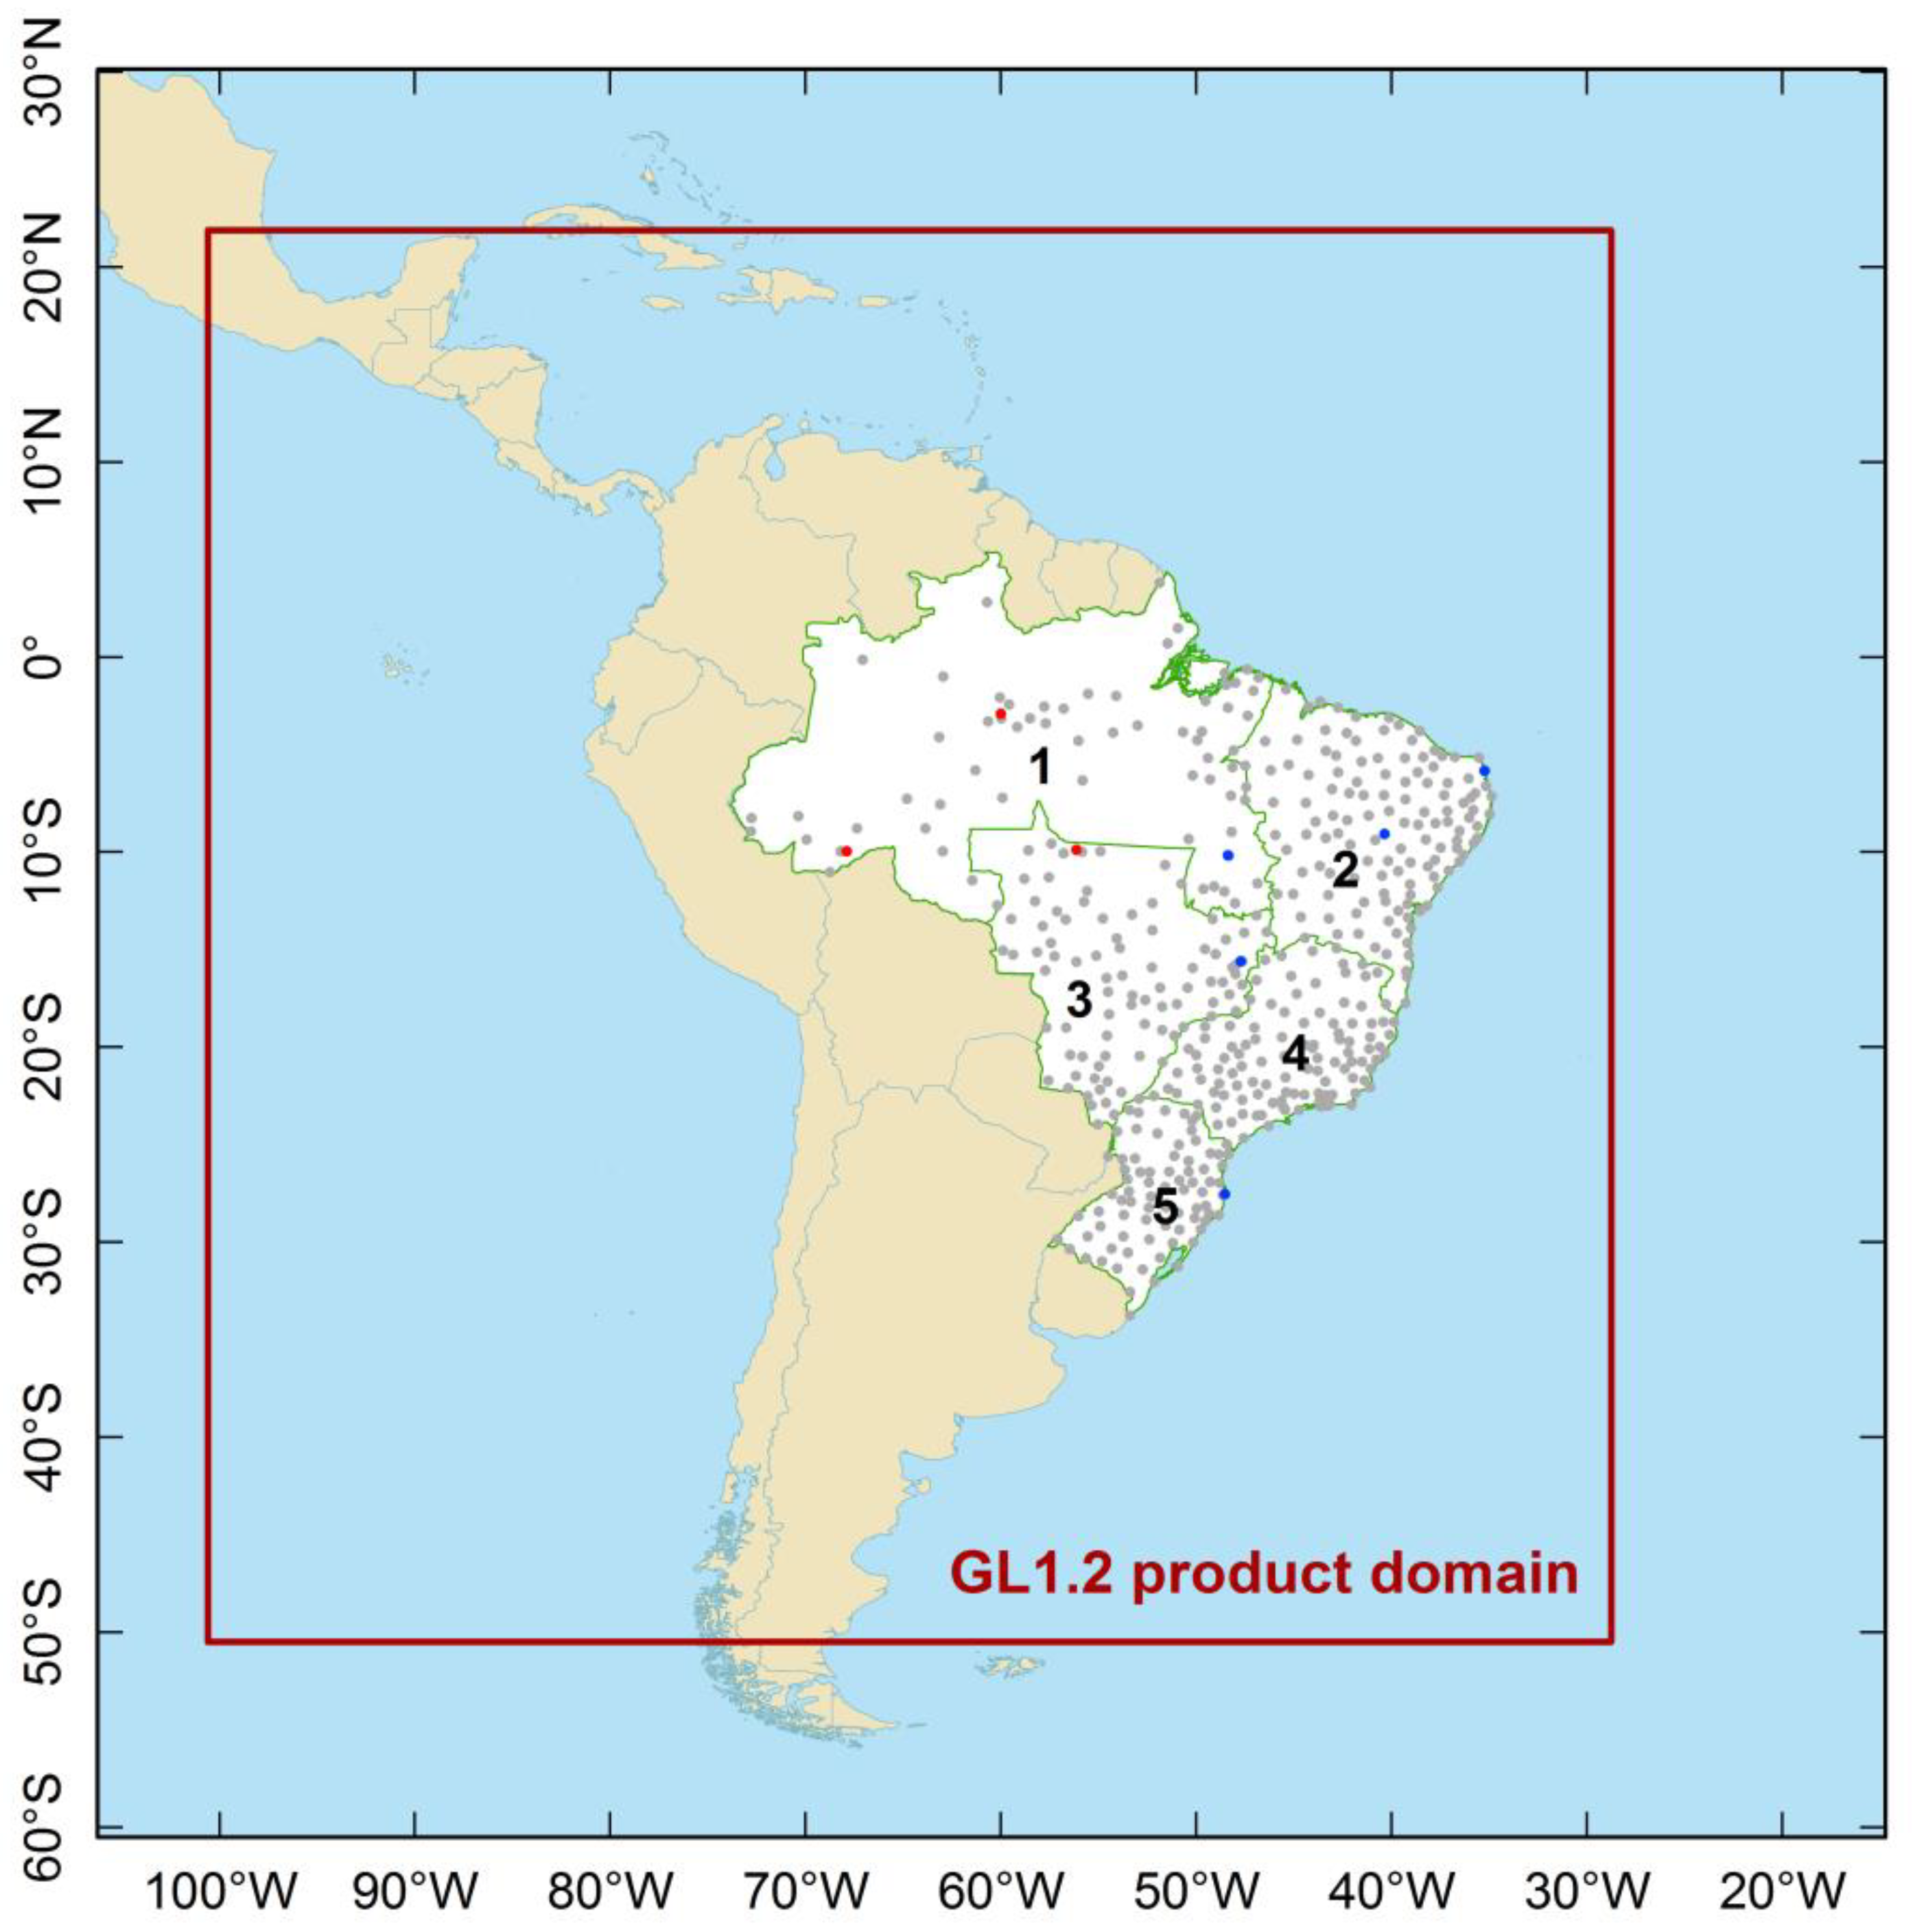
| Network | Number of Stations | Temporal Resolution | Website |
|---|---|---|---|
| INMET | 409 | 60 min | http://www.inmet.gov.br/ |
| SONDA | 5 | 1 min | http://sonda.ccst.inpe.br/ |
| SolRad-Net | 3 | 1−2 min | https://solrad-net.gsfc.nasa.gov/ |
| Station Name | Network | MBE | SDD | Distance | |
|---|---|---|---|---|---|
| W m−2 | % | W m−2 | km | ||
| Florianópolis | INMET | −2.8 | −1.6 | 22.0 | 10 |
| SONDA/BSRN | 4.0 | 2.2 | 22.4 | ||
| Petrolina | INMET | - | - | - | 42 |
| SONDA/BSRN | 0.0 | 0.0 | 16.5 | ||
| Natal | INMET | 4.9 | 2.1 | 17.9 | 4 |
| SONDA | −2.0 | −0.8 | 15.6 | ||
| Brasília | INMET | 3.0 | 1.4 | 20.0 | 30 |
| SONDA | 5.8 | 2.6 | 18.8 | ||
| Palmas | INMET | 32.8 | 15.7 | 19.6 | 8 |
| SONDA | 25.6 | 11.3 | 19.2 | ||
| Alta Floresta | INMET | 22.9 | 11.0 | 23.0 | 24 |
| SolRad-Net | 18.0 | 8.1 | 20.2 | ||
| Manaus | INMET | 16.8 | 9.0 | 19.7 | 24 |
| SolRad-Net | 17.1 | 9.5 | 22.4 | ||
| Rio Branco | INMET | 16.2 | 8.1 | 25.7 | 32 |
| SolRad-Net | 8.2 | 4.0 | 21.7 |
| Region | Mean | MBE | RMSE | SDD | R2 | Valid Months | |||||
|---|---|---|---|---|---|---|---|---|---|---|---|
| W m−2 | W m−2 | % | W m−2 | % | W m−2 | ||||||
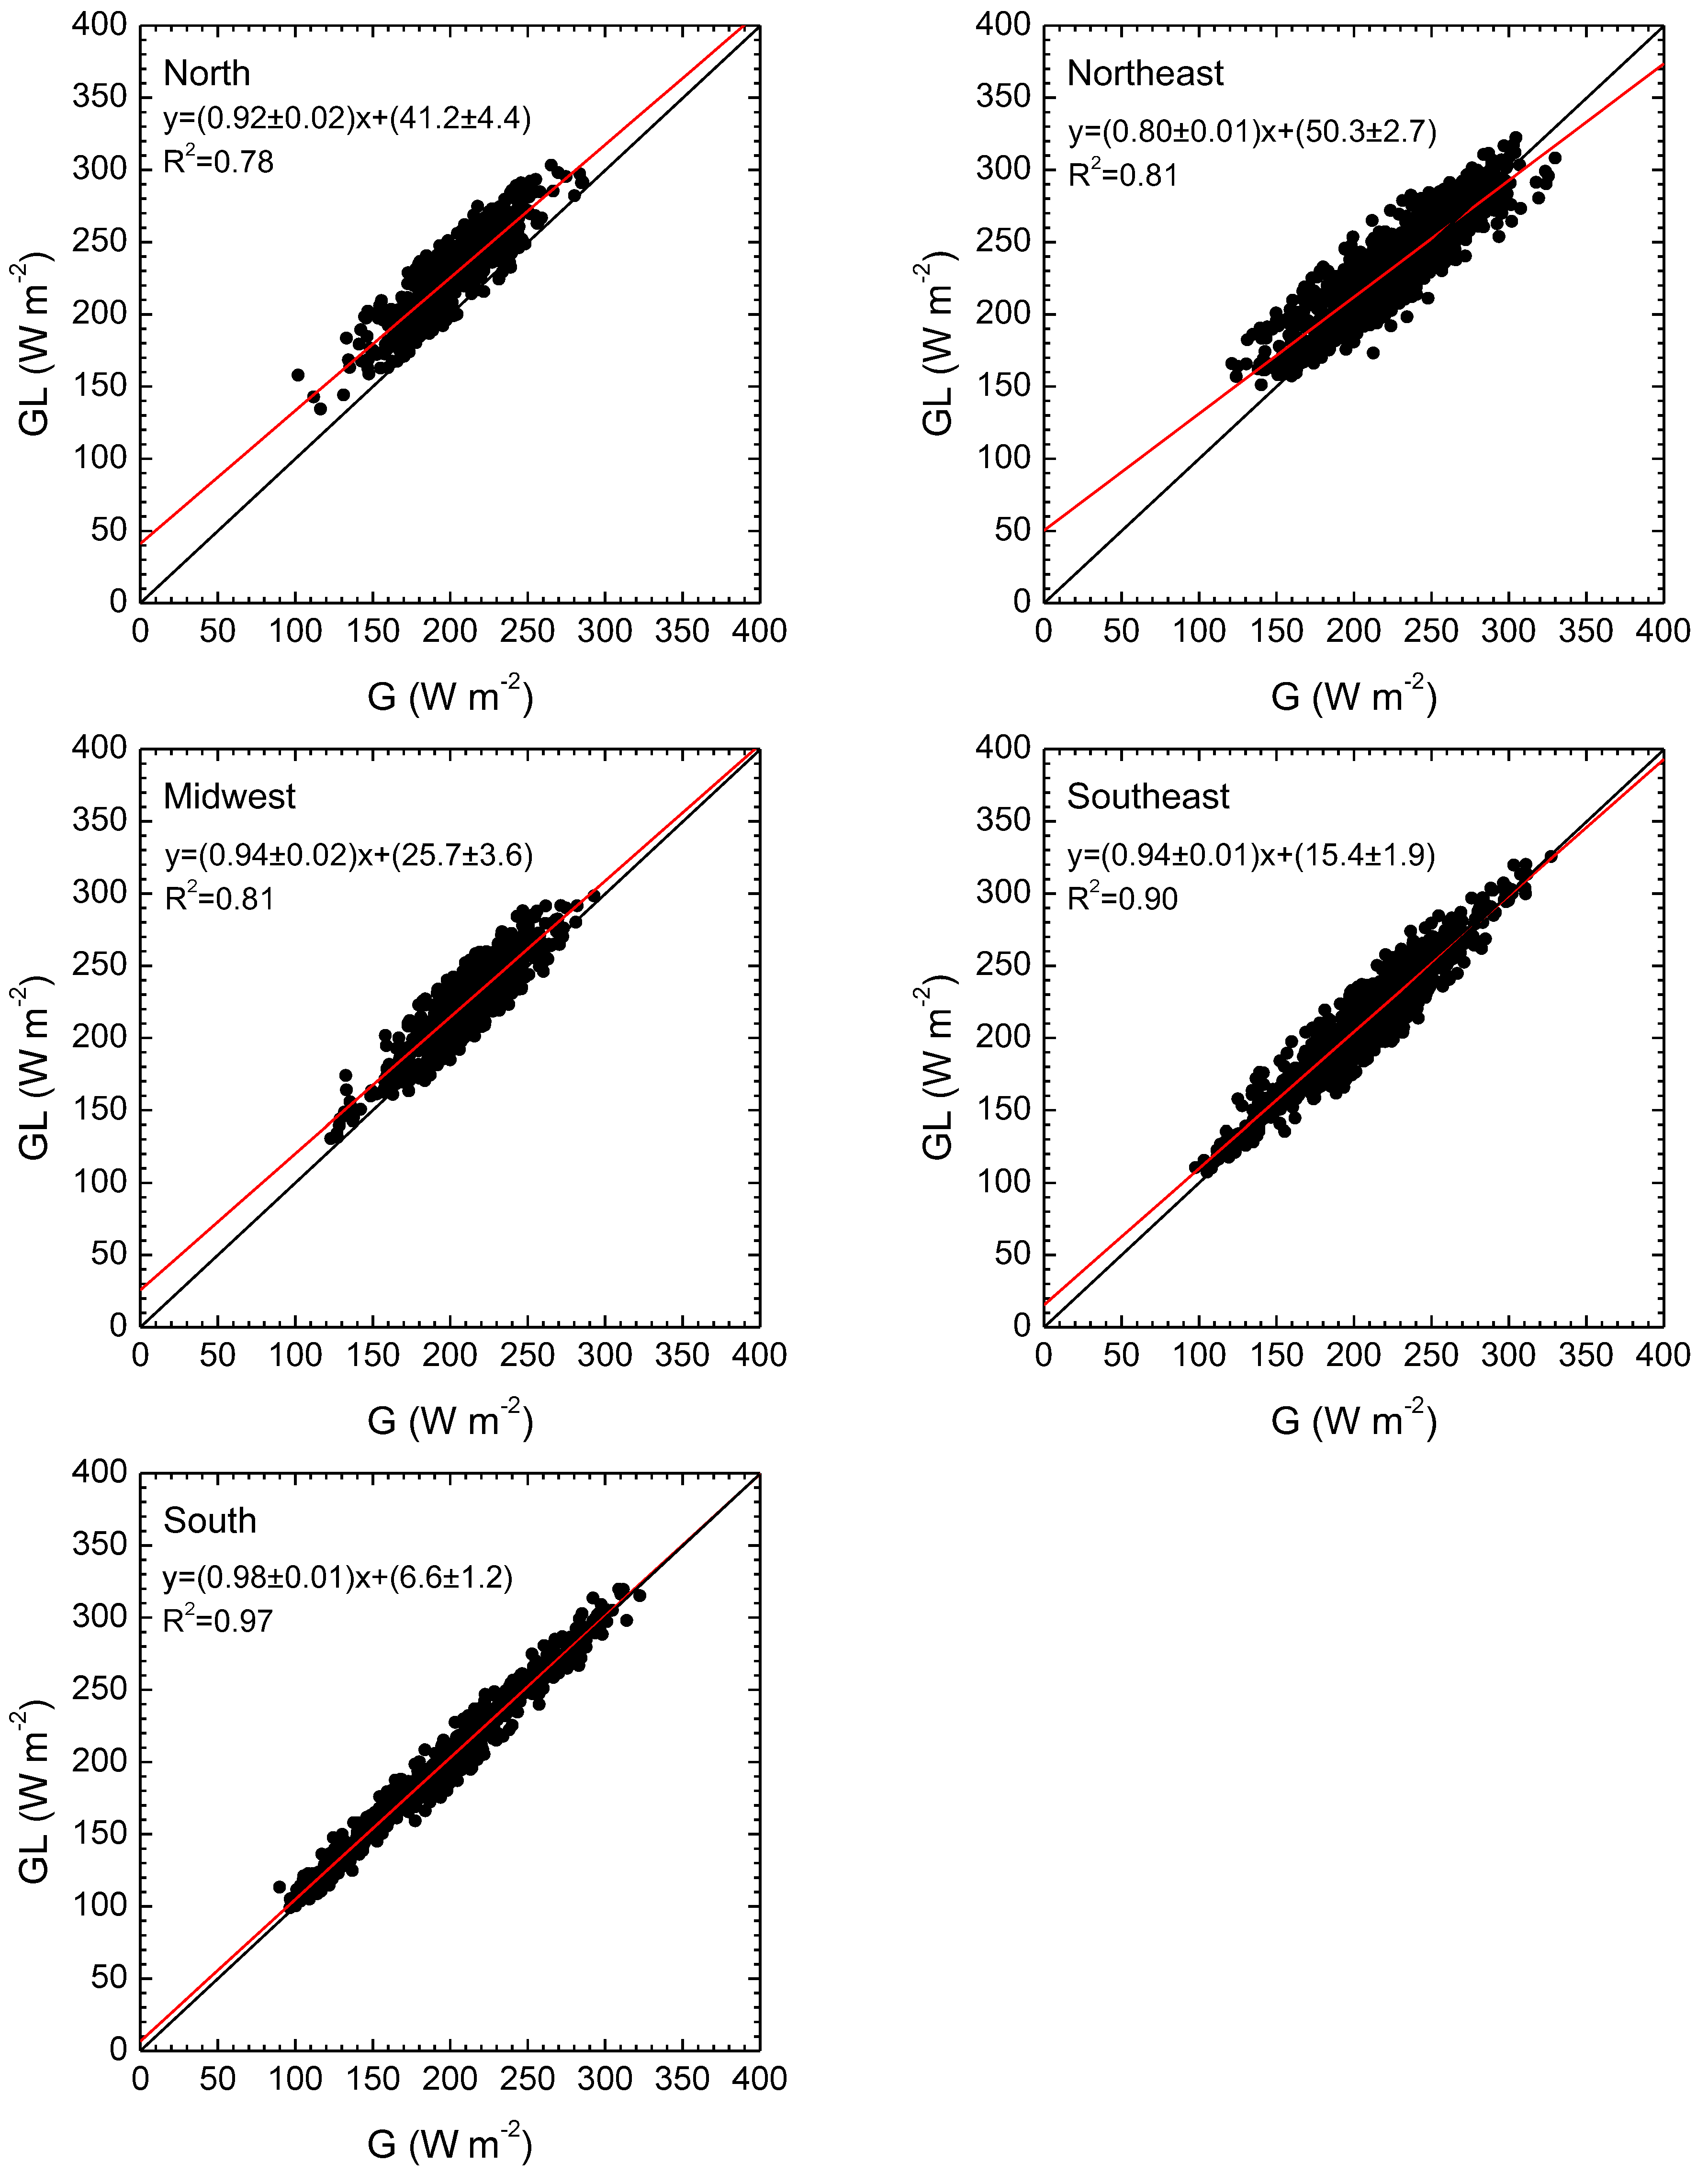
| North | 201.1 | 25.3 | 12.6 | 28.9 | 14.3 | 13.9 | 0.78 | 506 | |||
| Northeast | 230.2 | 5.8 | 2.5 | 16.6 | 7.2 | 15.6 | 0.81 | 1184 | |||
| Midwest | 214.1 | 13.6 | 6.3 | 18.3 | 8.5 | 12.3 | 0.81 | 731 | |||
| Southeast | 208.6 | 3.6 | 1.7 | 12.5 | 6.0 | 12.0 | 0.90 | 1079 | |||
| South | 194.3 | 3.1 | 1.6 | 8.8 | 4.5 | 8.2 | 0.97 | 725 |
| Region | Mean | MBE | RMSE | SDD | R2 | Valid Days | ||
|---|---|---|---|---|---|---|---|---|
| W m−2 | W m−2 | % | W m−2 | % | W m−2 | |||
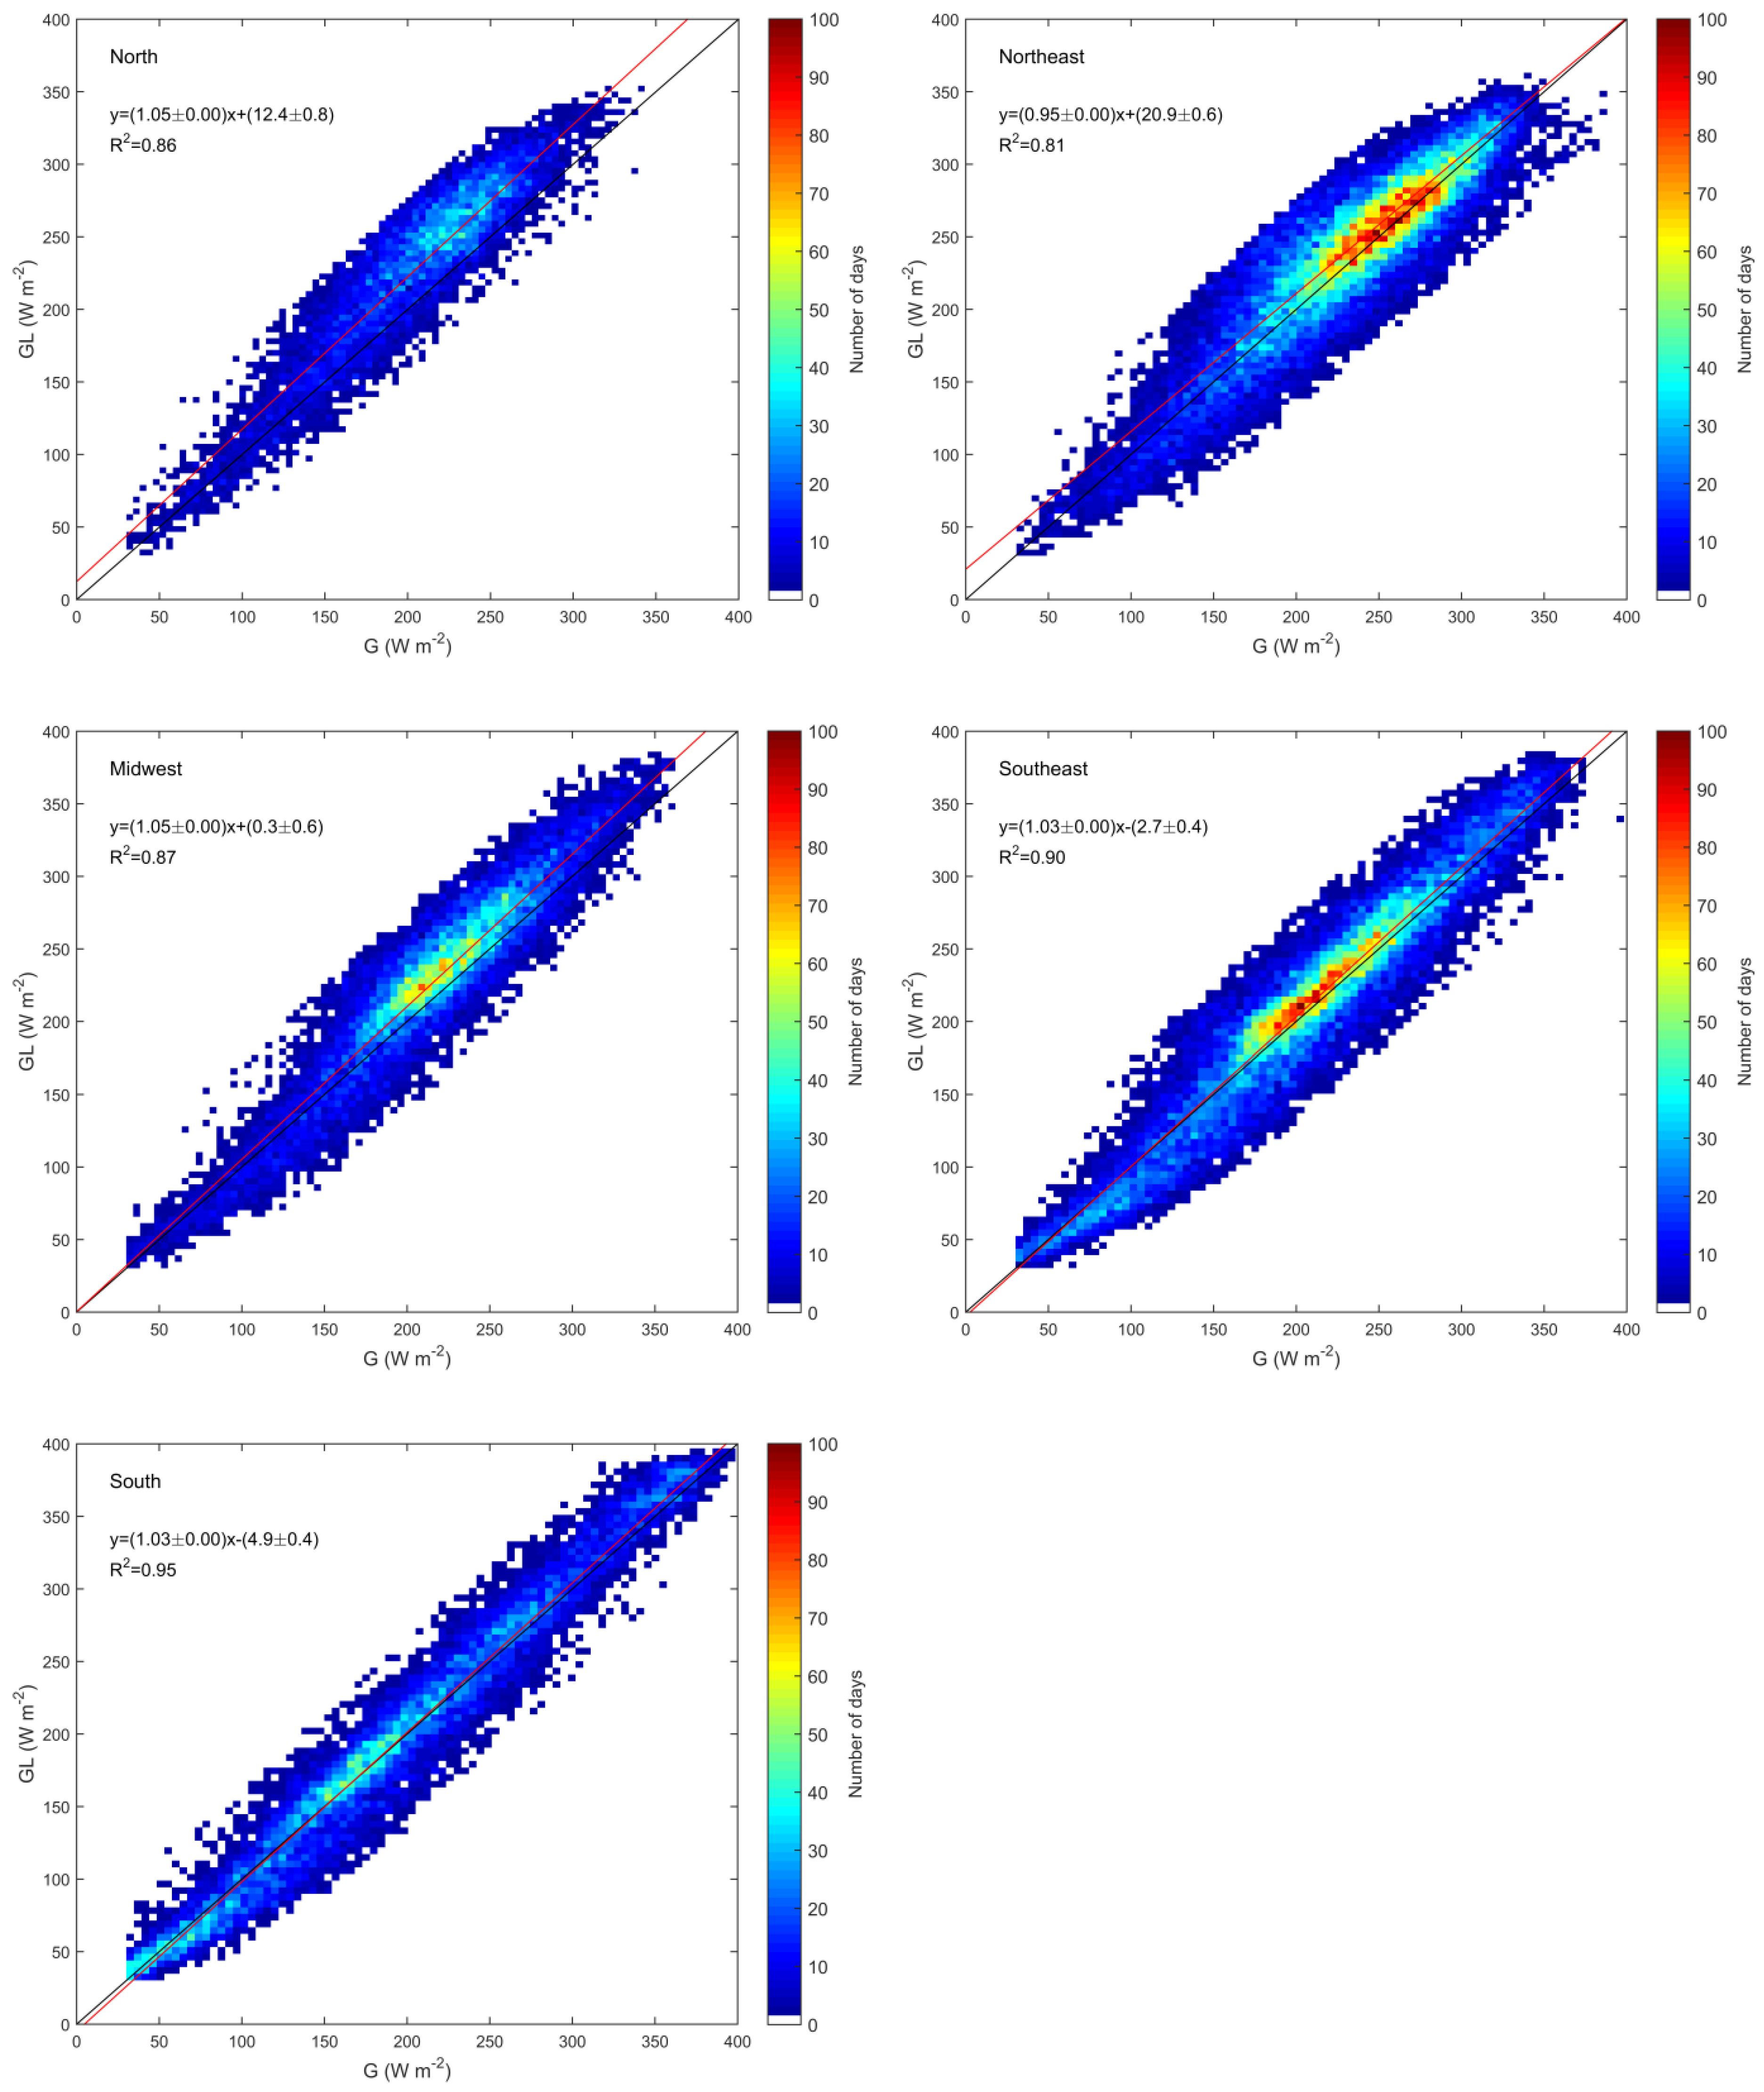
| North | 199.7 | 23.5 | 11.7 | 33.4 | 16.7 | 23.7 | 0.86 | 12,889 |
| Northeast | 228.8 | 4.9 | 2.1 | 26.7 | 11.6 | 24.9 | 0.81 | 31,074 |
| Midwest | 213.1 | 12.7 | 5.9 | 27.0 | 12.7 | 23.9 | 0.87 | 18,429 |
| Southeast | 206.9 | 3.6 | 1.7 | 24.4 | 11.8 | 24.1 | 0.90 | 27,396 |
| South | 195.2 | 2.5 | 1.2 | 21.1 | 10.8 | 20.9 | 0.95 | 17,924 |
© 2020 by the authors. Licensee MDPI, Basel, Switzerland. This article is an open access article distributed under the terms and conditions of the Creative Commons Attribution (CC BY) license (http://creativecommons.org/licenses/by/4.0/).
Share and Cite
Porfirio, A.C.S.; Ceballos, J.C.; Britto, J.M.S.; Costa, S.M.S. Evaluation of Global Solar Irradiance Estimates from GL1.2 Satellite-Based Model over Brazil Using an Extended Radiometric Network. Remote Sens. 2020, 12, 1331. https://0-doi-org.brum.beds.ac.uk/10.3390/rs12081331
Porfirio ACS, Ceballos JC, Britto JMS, Costa SMS. Evaluation of Global Solar Irradiance Estimates from GL1.2 Satellite-Based Model over Brazil Using an Extended Radiometric Network. Remote Sensing. 2020; 12(8):1331. https://0-doi-org.brum.beds.ac.uk/10.3390/rs12081331
Chicago/Turabian StylePorfirio, Anthony C. S., Juan C. Ceballos, José M. S. Britto, and Simone M. S. Costa. 2020. "Evaluation of Global Solar Irradiance Estimates from GL1.2 Satellite-Based Model over Brazil Using an Extended Radiometric Network" Remote Sensing 12, no. 8: 1331. https://0-doi-org.brum.beds.ac.uk/10.3390/rs12081331