Low-cost Fiberoptic Probe for Ammonia Early Detection in Fish Farms


1
Telecommunications Laboratory (LABTEL), Graduate Program in Electrical Engineering Federal University of Espírito Santo, Fernando Ferrari avenue, Vitória-ES 29075-910, Brazil
2
Physics Department & I3N, Universidade de Aveiro, Campus Universitário de Santiago, 3810-193 Aveiro, Portugal
*
Author to whom correspondence should be addressed.
Remote Sens. 2020, 12(9), 1439; https://0-doi-org.brum.beds.ac.uk/10.3390/rs12091439
Submission received: 15 April 2020
/
Revised: 27 April 2020
/
Accepted: 29 April 2020
/
Published: 1 May 2020
(This article belongs to the Special Issue Remote Sensing of the Aquatic Environments)
Abstract
:Recirculating aquaculture systems (RAS) are complex systems in which there is an interaction between the fish biomass and water chemistry, where small variations in the environment can lead to major effects in the production. Ammonia is one of the key limiting factors in RAS and its early detection in small concentrations prevents fish mortality and improves the production quality. Aiming at this background, this paper presents a low-cost fiberoptic probe for the early detection of ammonia. The sensor was based on the chemical interaction between the Oxazine 170 perchlorate layer, deposited in an uncladed polymer optical fiber (POF), and the ammonia dissolved in water. In addition, a thin metallic layer (composed by gold and palladium) was deposited in the fiber end facet and acted as a reflector for the optical signals, enabling the use of the proposed sensor in reflection mode. Different configurations of the sensor were tested, where the effects of polydimethylsiloxane (PDMS) protective layer, thermal treatments, and the use on reflection or transmission modes were compared in the assessment of ammonia concentrations in the range of 100 ppb to 900 ppb. Results showed a better performance (as a function of the sensor sensitivity and linearity) of the sensor with the annealing thermal treatment and without the PDMS layer. Then, the proposed fiberoptic probe was applied on the ammonia detection in high-salinity water, where ammonia concentrations as low as 100 ppb were detected.
1. Introduction
Aquaculture is the fastest growing food production sector in the world [1] and is therefore responding to the demands of ensuring sustainable global food security. Global aquaculture production has grown by nearly 7% per year. These demands are expected to continue to rise in response to projections of increased global population and the associated need for new protein sources. The marine fish aquaculture industry in Europe is dominated by Atlantic salmon (Salmo salar) in the north and by gilthead seabream (Sparus aurata) and European seabass (Dicentrarchus labrax) in the south.
Since the publication of the European Commission’s 2013 Strategic Guidelines on the sustainable development of European aquaculture [2], the Commission has worked closely with Member States to address the barriers hampering the development of the sector while launching several campaigns to promote sustainable and competitive fish farming. A large part of this expansion and species diversification is expected to take place in land-based aquaculture facilities or intensive systems where water is reused in some form, such as recirculating aquaculture systems (RAS).
RAS are currently operating for many different species and have recently been developed to the large industrial scale. The highly technological RAS allows a very high degree of water reuse, normally in the range of 95–99% when compared to the water consumption in a flow-through system. Such facilities need to be designed for safe operation in the long-term, involving continuous and close monitoring of several critical parameters to safeguard fish welfare and profitability. The benefits of RAS are the reduced fresh and saltwater usage, reduced land requirement due to the high stocking density, reduced wastewater effluent volume, increased biosecurity by effectively treating disease outbreaks, and independence from weather and variable environmental conditions. Indeed, RAS satisfy the objectives of European Union for sustainable aquaculture by producing food while sustaining natural resources with a minimum ecological impact. However, RAS are complex systems where fish biomass and water chemistry/quality interact and where small variations may result in suboptimal conditions. These variations may cause stress and reduced feed intake and may ultimately result in reduced growth performance or even mortalities [3].
Ammonia is a limiting factor for producing fish in RAS [4,5], but the tolerance affecting mortality and growth varies [6]. Different water quality parameters affect the kinetics of the RAS biological filters (BF) [7], causing variation in ammonia removal. This gives rise to the dilemma of how to control and limit ammonia levels in order to optimize production under different conditions. Tolerance to ammonia varies between fish species and within different life stages and physiological status (starved, stresses, and health status) of the same species [8,9]. Furthermore, the type of rearing conditions may play a part. Other water quality parameters like temperature, carbon dioxide, oxygen, and salinity may also interact and influence the fish response to water quality and stress [8], which again can vary between different fish farms, and even throughout a production cycle. In addition, ammonia tolerance depends on how the fish acclimate to ammonia [10] and to changing water quality [11]. Not least, the different efficiency in which different RAS system convert ammonia to less toxic N-compounds varies depending on the RAS-design [12]. Acute levels of ammonia lead to acute mortality, while chronic levels of ammonia lead to suboptimal conditions for the fish. These suboptimal conditions are difficult to monitor but may result in reduced appetite and growth and eventually increased mortality [13]. Even in well-managed RAS, this is probably a common issue due to the many and intricate interactions between the fish and the other water quality parameters mentioned. The Food and Agriculture Organization (FAO) of the United Nations has advised that the ammonia levels should cover a range of at least 1-100 ng/mL [14,15].
In this way, water quality and toxicity levels in recirculation systems are critical, and ammonia is an important parameter which is closely linked to the fish excretion and efficacy of the BF. Growth and stocking density (biomass production and loading) are the main factors affecting the ammonia fluctuations and load in RAS [7]. The existing sensors for ammonia are generally used in sewage treatment plants and do not give consistent values in saltwater systems [9]. Moreover, there is a lack of available technology to add sensing elements before and after the BF and degassing column of a RAS.
In this respect, suitable multipoint monitoring elements for ammonia are essential. The use of optical fiber sensor-based devices offers many well-known and desirable features for label-free methods when compared with conventional electrical transducers. Examples are size, immunity to electromagnetic interference, cost, light path control, remote sensor deployment, high transmission rate, multiple sensors just on a single fiber and the use of biocompatible and biofunctionalized materials, and intrinsic safety and inert nature, which enables them to have minimal impact on the environment [16]. These advantages motivate the use of optical fiber sensors in medicine [17], environmental monitoring [18], and antibody detection [19]. Optical fiber sensors are selected for such applications due to their operational safety in aqueous environments and ease of introduction into the tanks, which eliminates the need to take samples to be tested in external instruments. Additionally, sensing can be performed with either a handheld probe or as a set of remotely operated devices along an optical fiber cable.
The optical fiber sensors approach for ammonia assessment is generally related to the use of nanoparticles or dyers that interact with the dissolved ammonia, resulting in intensity [20] or wavelength [21] variations in the optical fiber probe. An optical fiber interferometer was proposed by the authors of [21] for the ammonia detection. Using a nanocomposite coating, the sensor was able of detecting ammonia concentrations as low as 14 ppm, which is higher than the lower bound of ammonia detection in RAS [14]. In addition, wavelength-based sensors need an optical spectrum analyzer, which is generally a high-cost equipment. In order to obtain a low-cost sensor system, intensity variation-based systems have been proposed, such as the one presented by the authors of [22], where the luminescence from the nanoparticles upconversion was used on the sensor development. In this case, the sensor was tested in a range of 100-10000 ppm, i.e., far greater than the ammonia levels recommended in water. Similar techniques employed dyers in the lateral section of an optical fiber to evaluate the differences in the fluorescence as function of the ammonia levels [23]. The authors of [24] proposed a porous waveguide with a combination of copolymers as pH indicator, where ammonia concentrations as low as 10 ppm were measured. Then, with further improvements in the Oxazine 170 perchlorate deposition in polymer optical fibers (POFs), the authors of [20] proposed a highly sensitive ammonia sensor with detection limit of 1.4 ppm, the sensor was tested in stagnated and dynamic water. However, the approach was based on the transmission mode, which, for field applications, can lead to practical disadvantages on the sensor positioning. Moreover, intensity variation-based sensors are also sensitive to light source power deviations, and self-compensation techniques for these deviations need to be addressed for a higher resolution of the sensors.
Considering this background, this paper presents a low-cost POF sensor to cover the ammonia levels required by RAS and suitable to add in critical locations of a RAS, in which the proposed sensor was based on the reaction between the POF cladding with Oxazine 170 perchlorate and the water-dissolved ammonia. Such reaction led to variations in the evanescent field, resulting in optical power variations. In addition, a reflector was manufactured in the optical fiber tip in order to operate in the reflection mode, which brought important advantages regarding to the sensor positioning inside the water tank. Another advantageous feature was the possibility of using unclad POFs recycled from the LCD monitors (as depicted by the authors of [25]) for the sensor manufacturing, where the cladding was based on the Oxazine 170 perchlorate solution.
2. Sensors Development and Experimental Setup
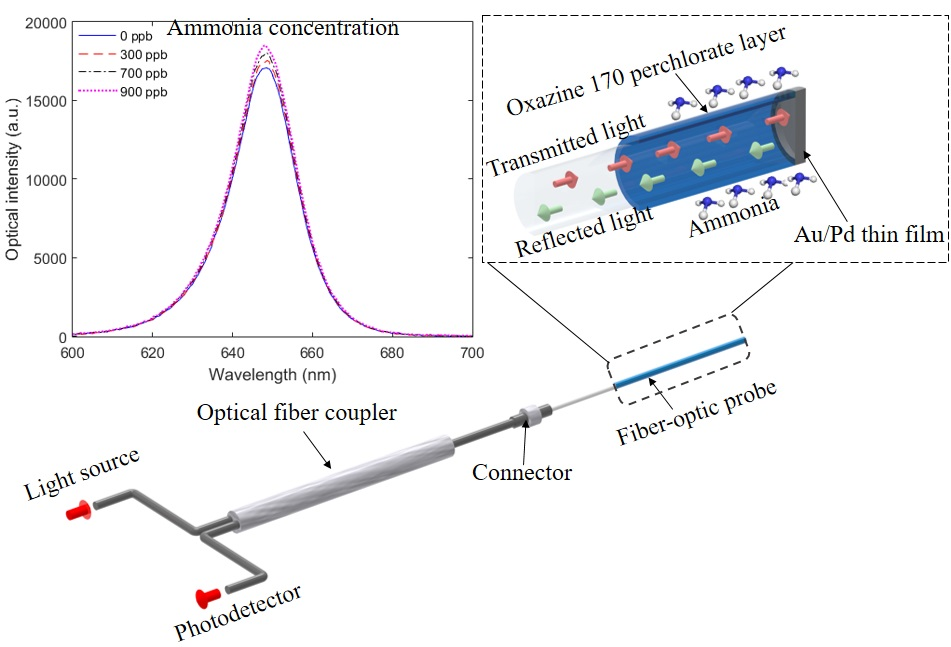
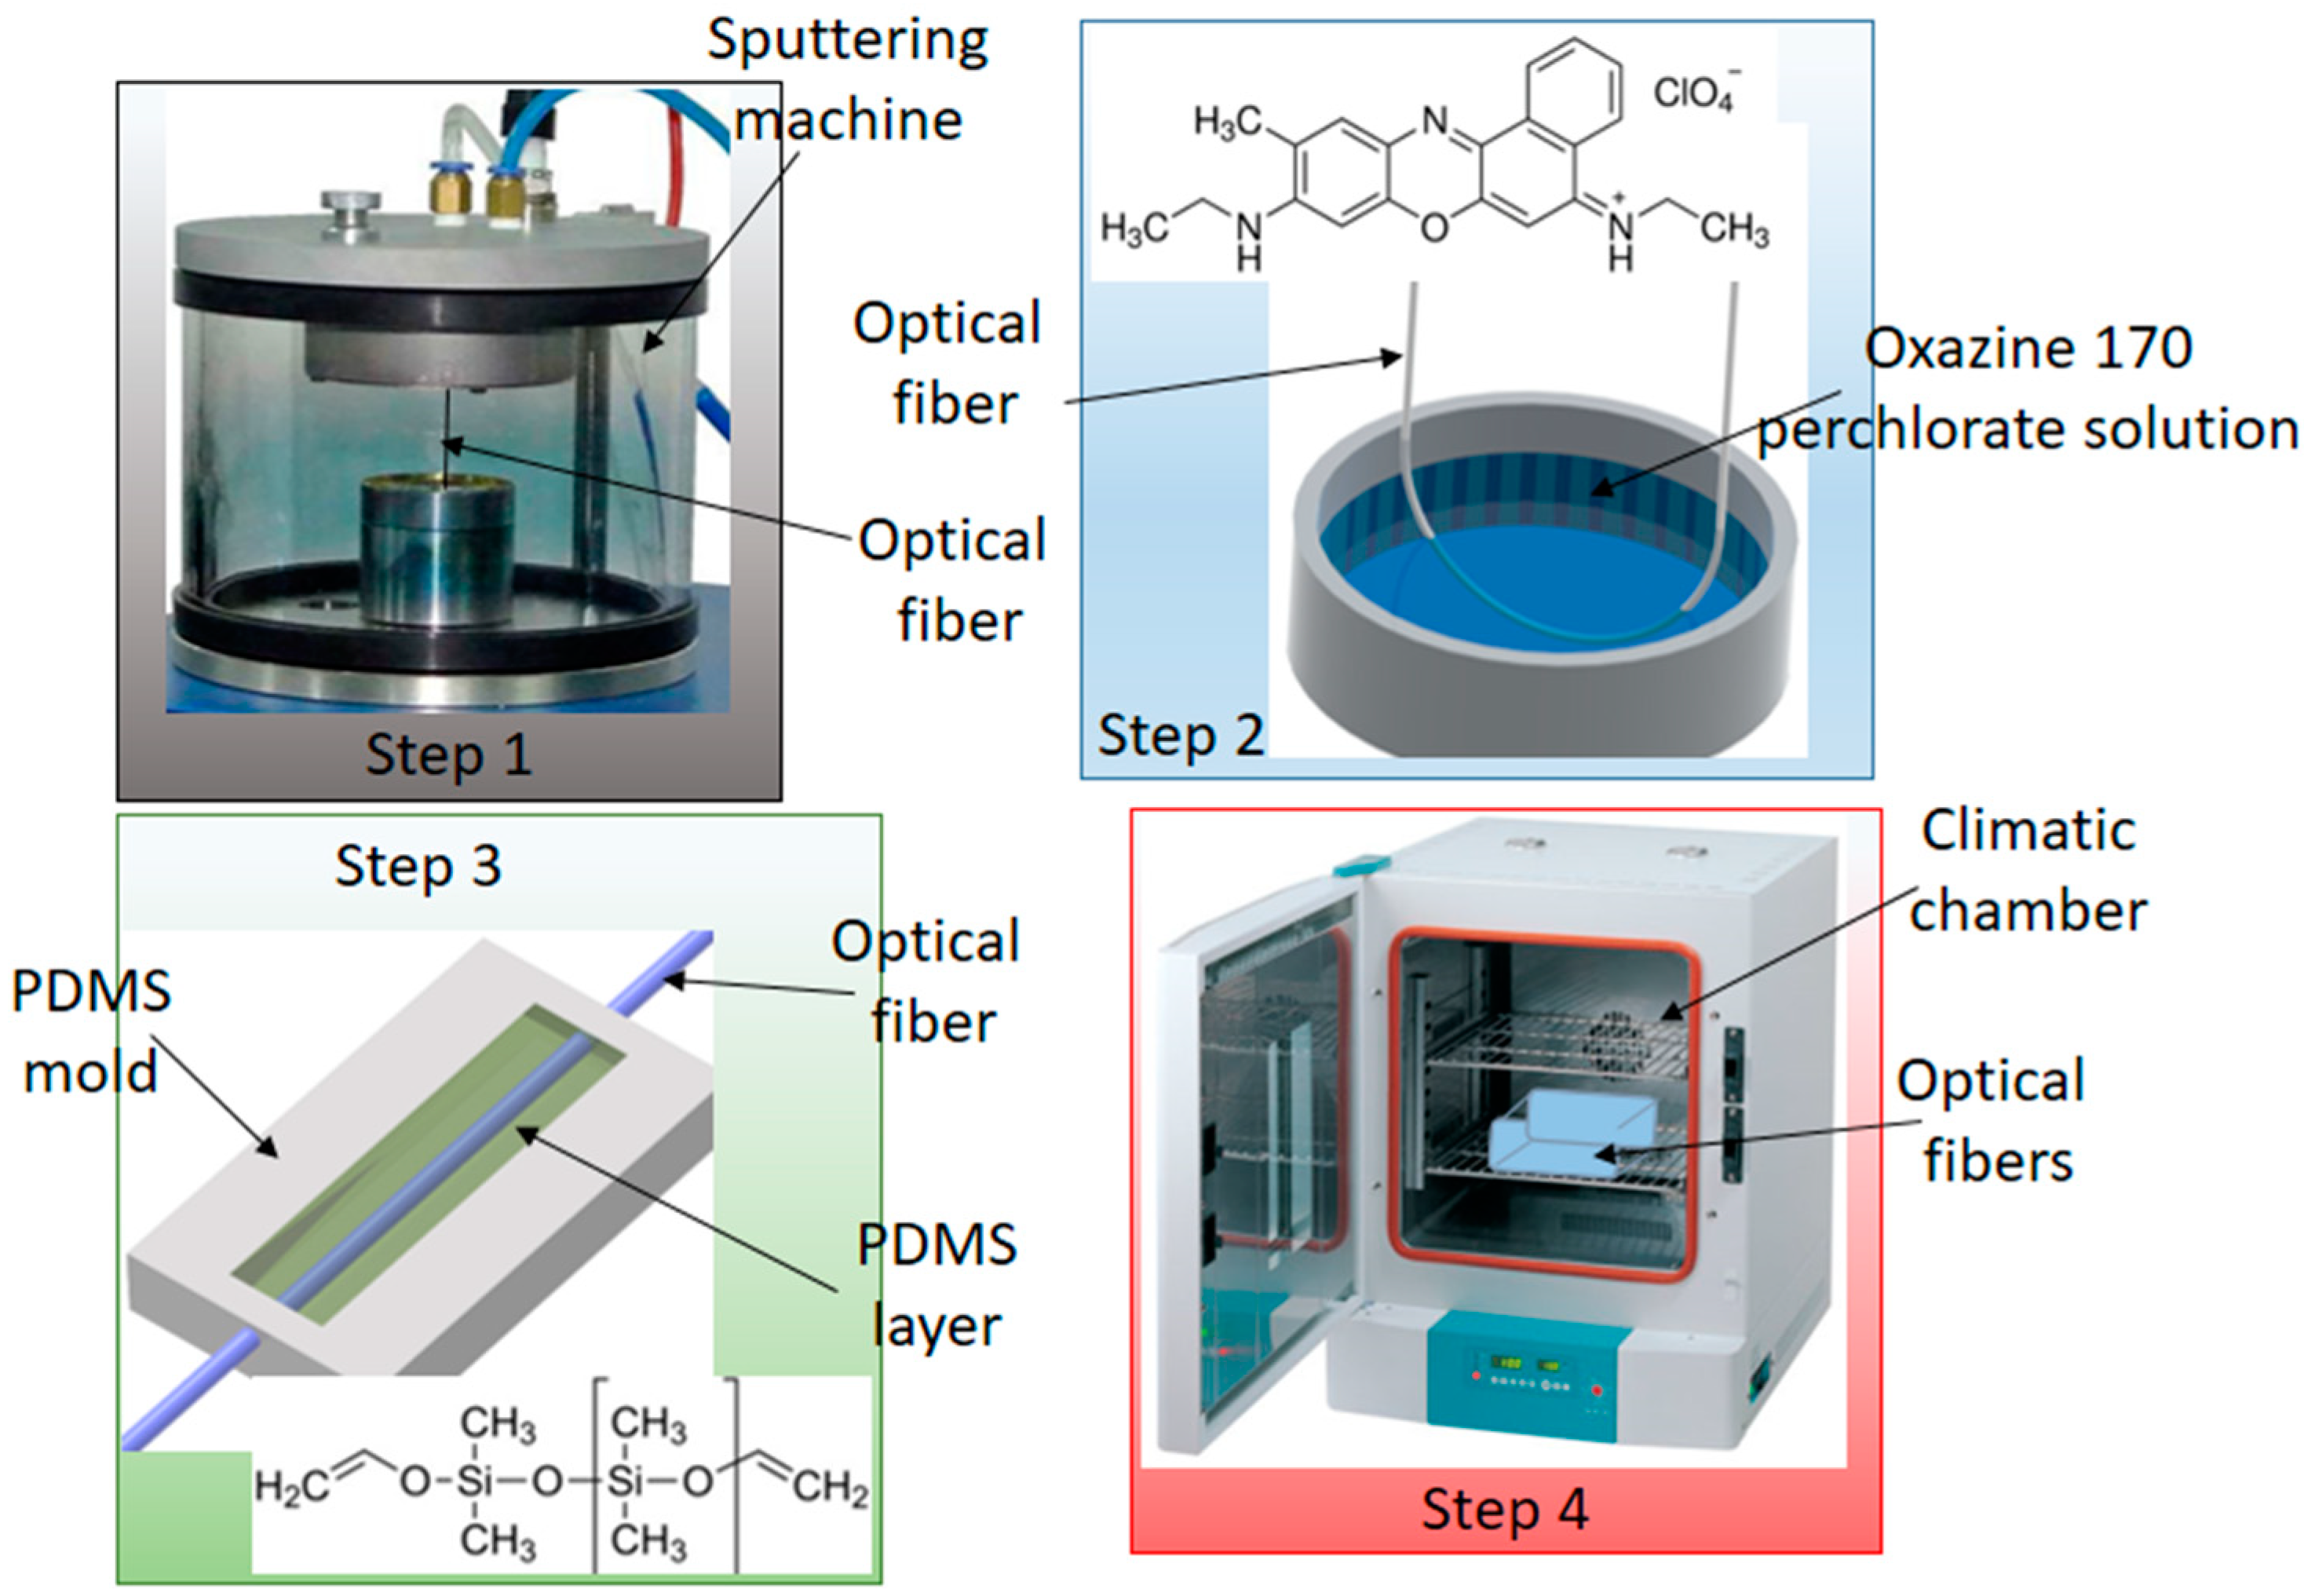
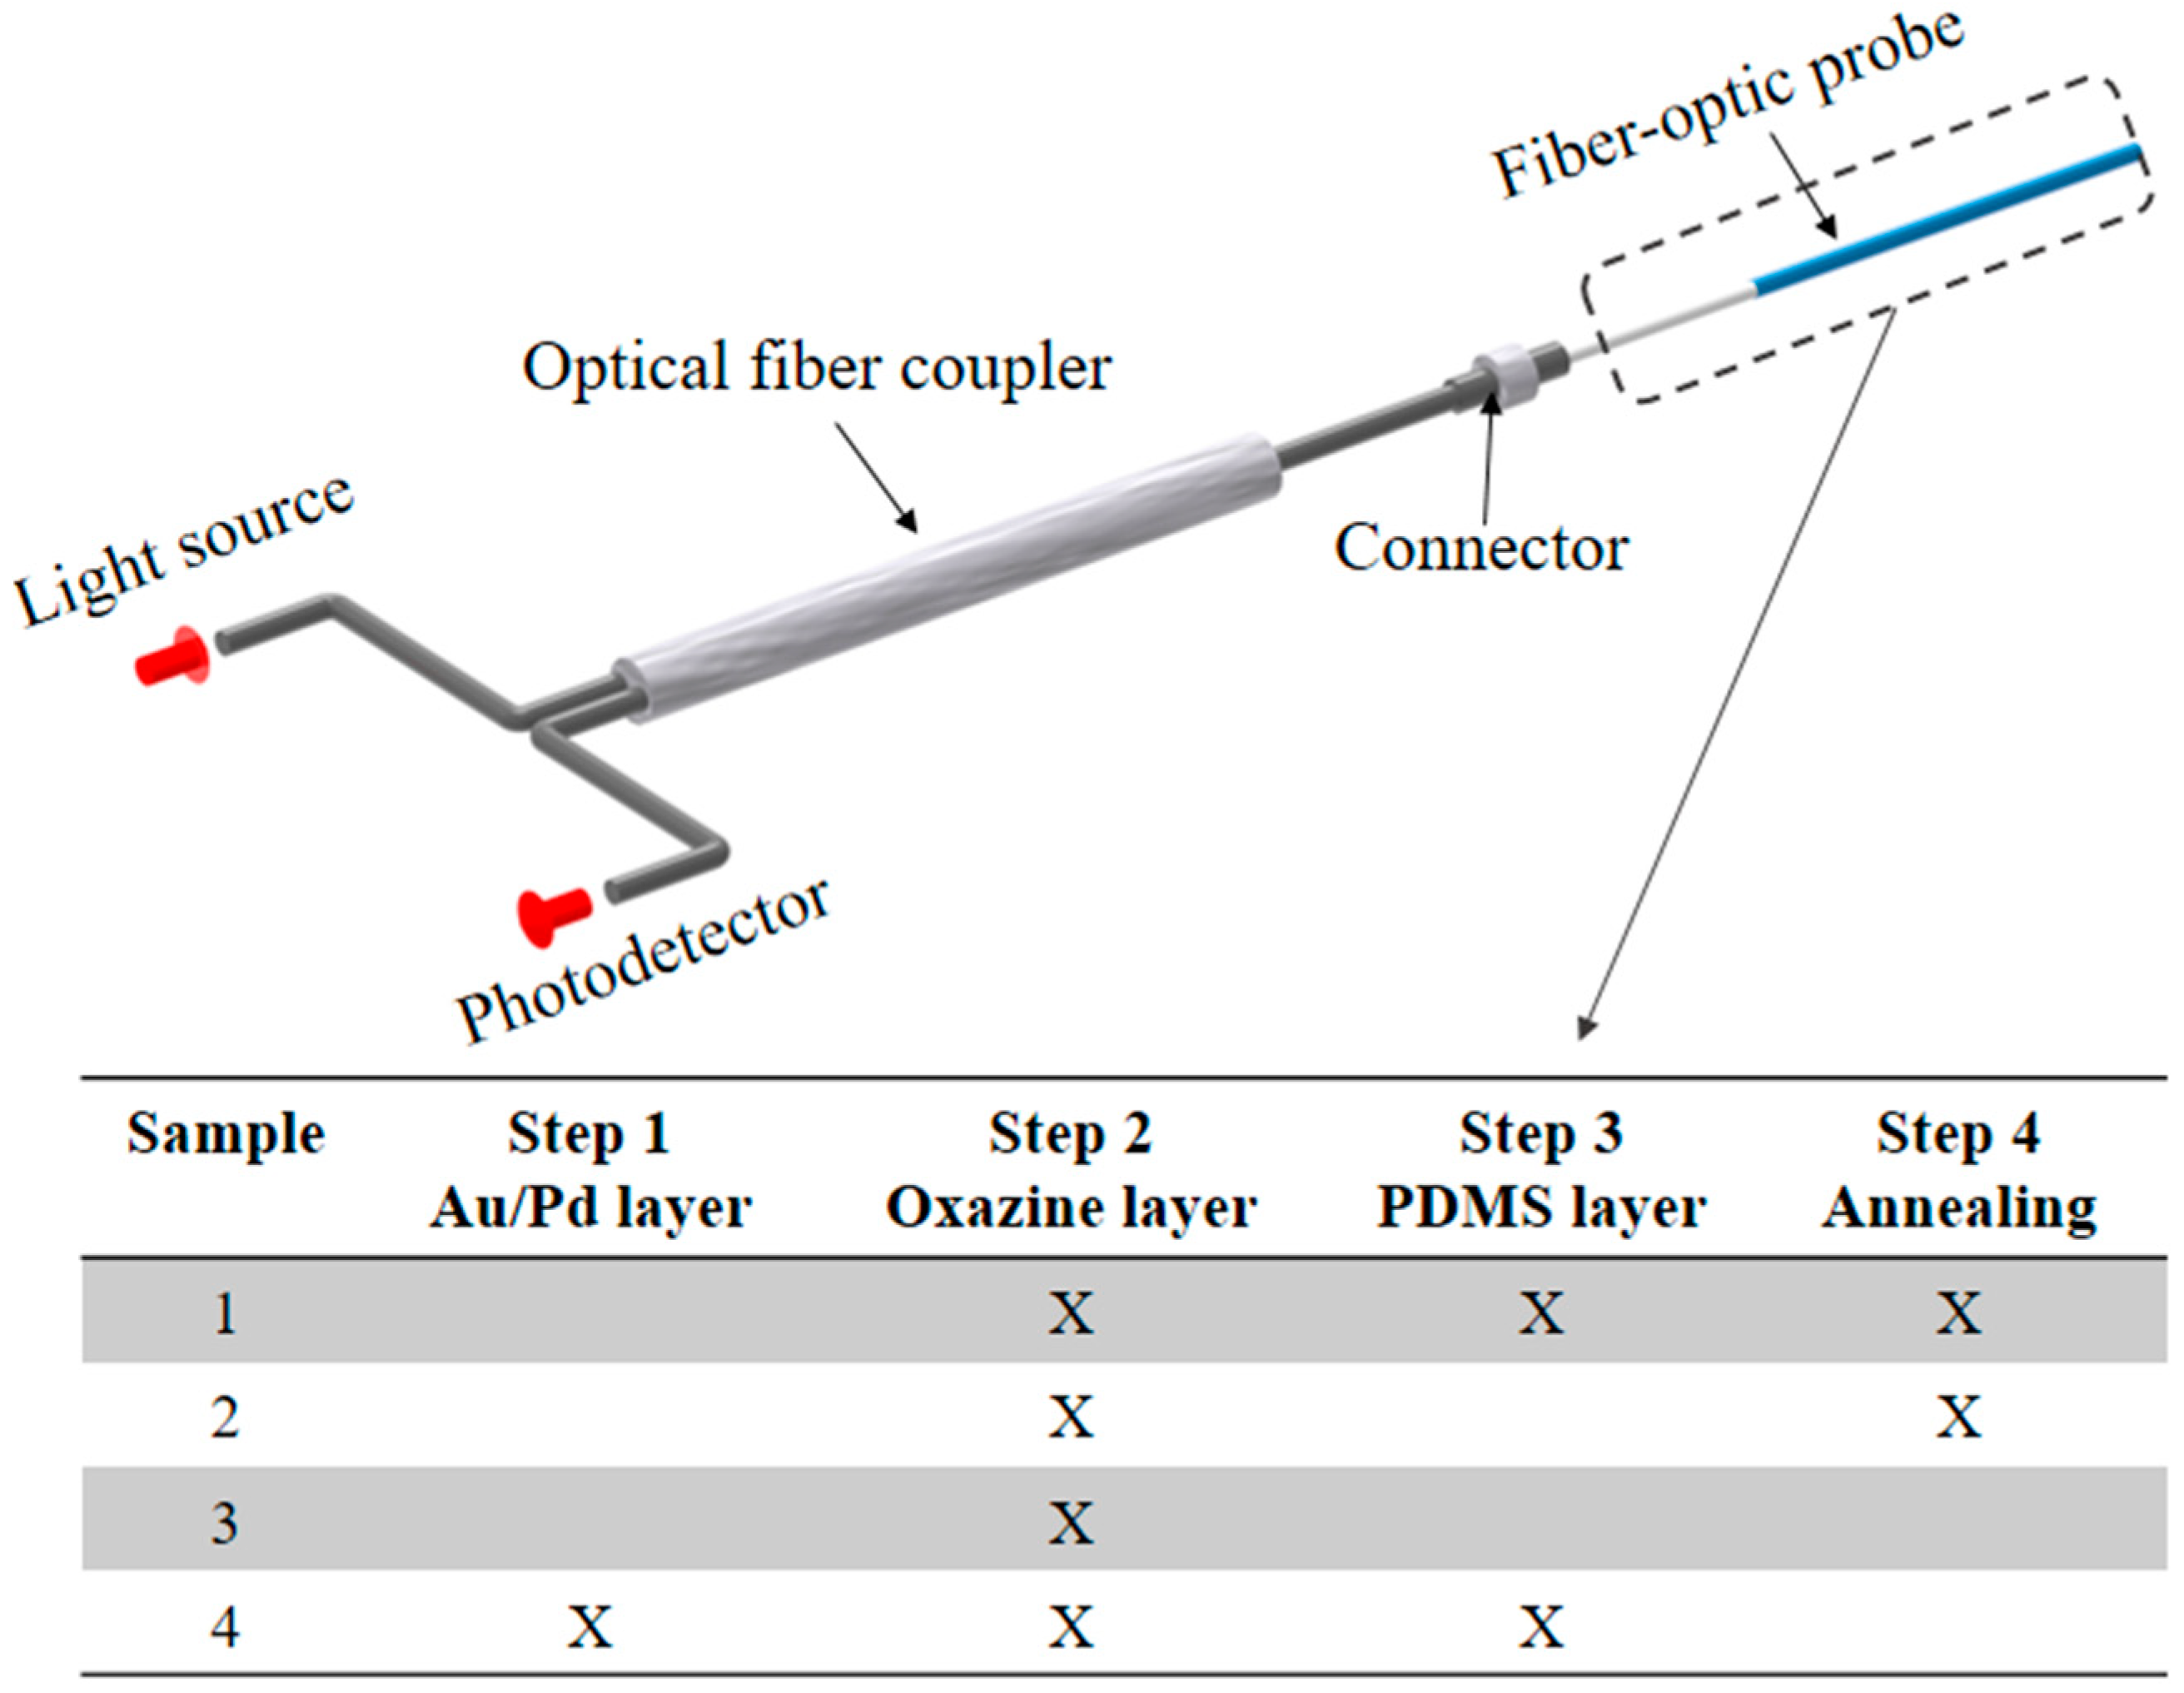
An uncladed multimode POF with polymethyl methacrylate (PMMA) core was used on the fabrication of the optical fiber probe with a 980-µm core (ESKA Mitsubishi, Japan). The fiber diameter was about 1 mm and the fabrication of the proposed ammonia sensor occurred in a few steps, as summarized in Figure 1. The first step involved the gold-palladium (Au/Pd) thin layer deposition using a sputter coater. The sputter target was composed of 20% palladium and 80% gold. The POF end facet was positioned on the sputter target and the Au/Pd thin layer was created, where this layer acted as a mirror and reflects the optical signals, which enabled the use of the proposed sensor in the reflection mode.
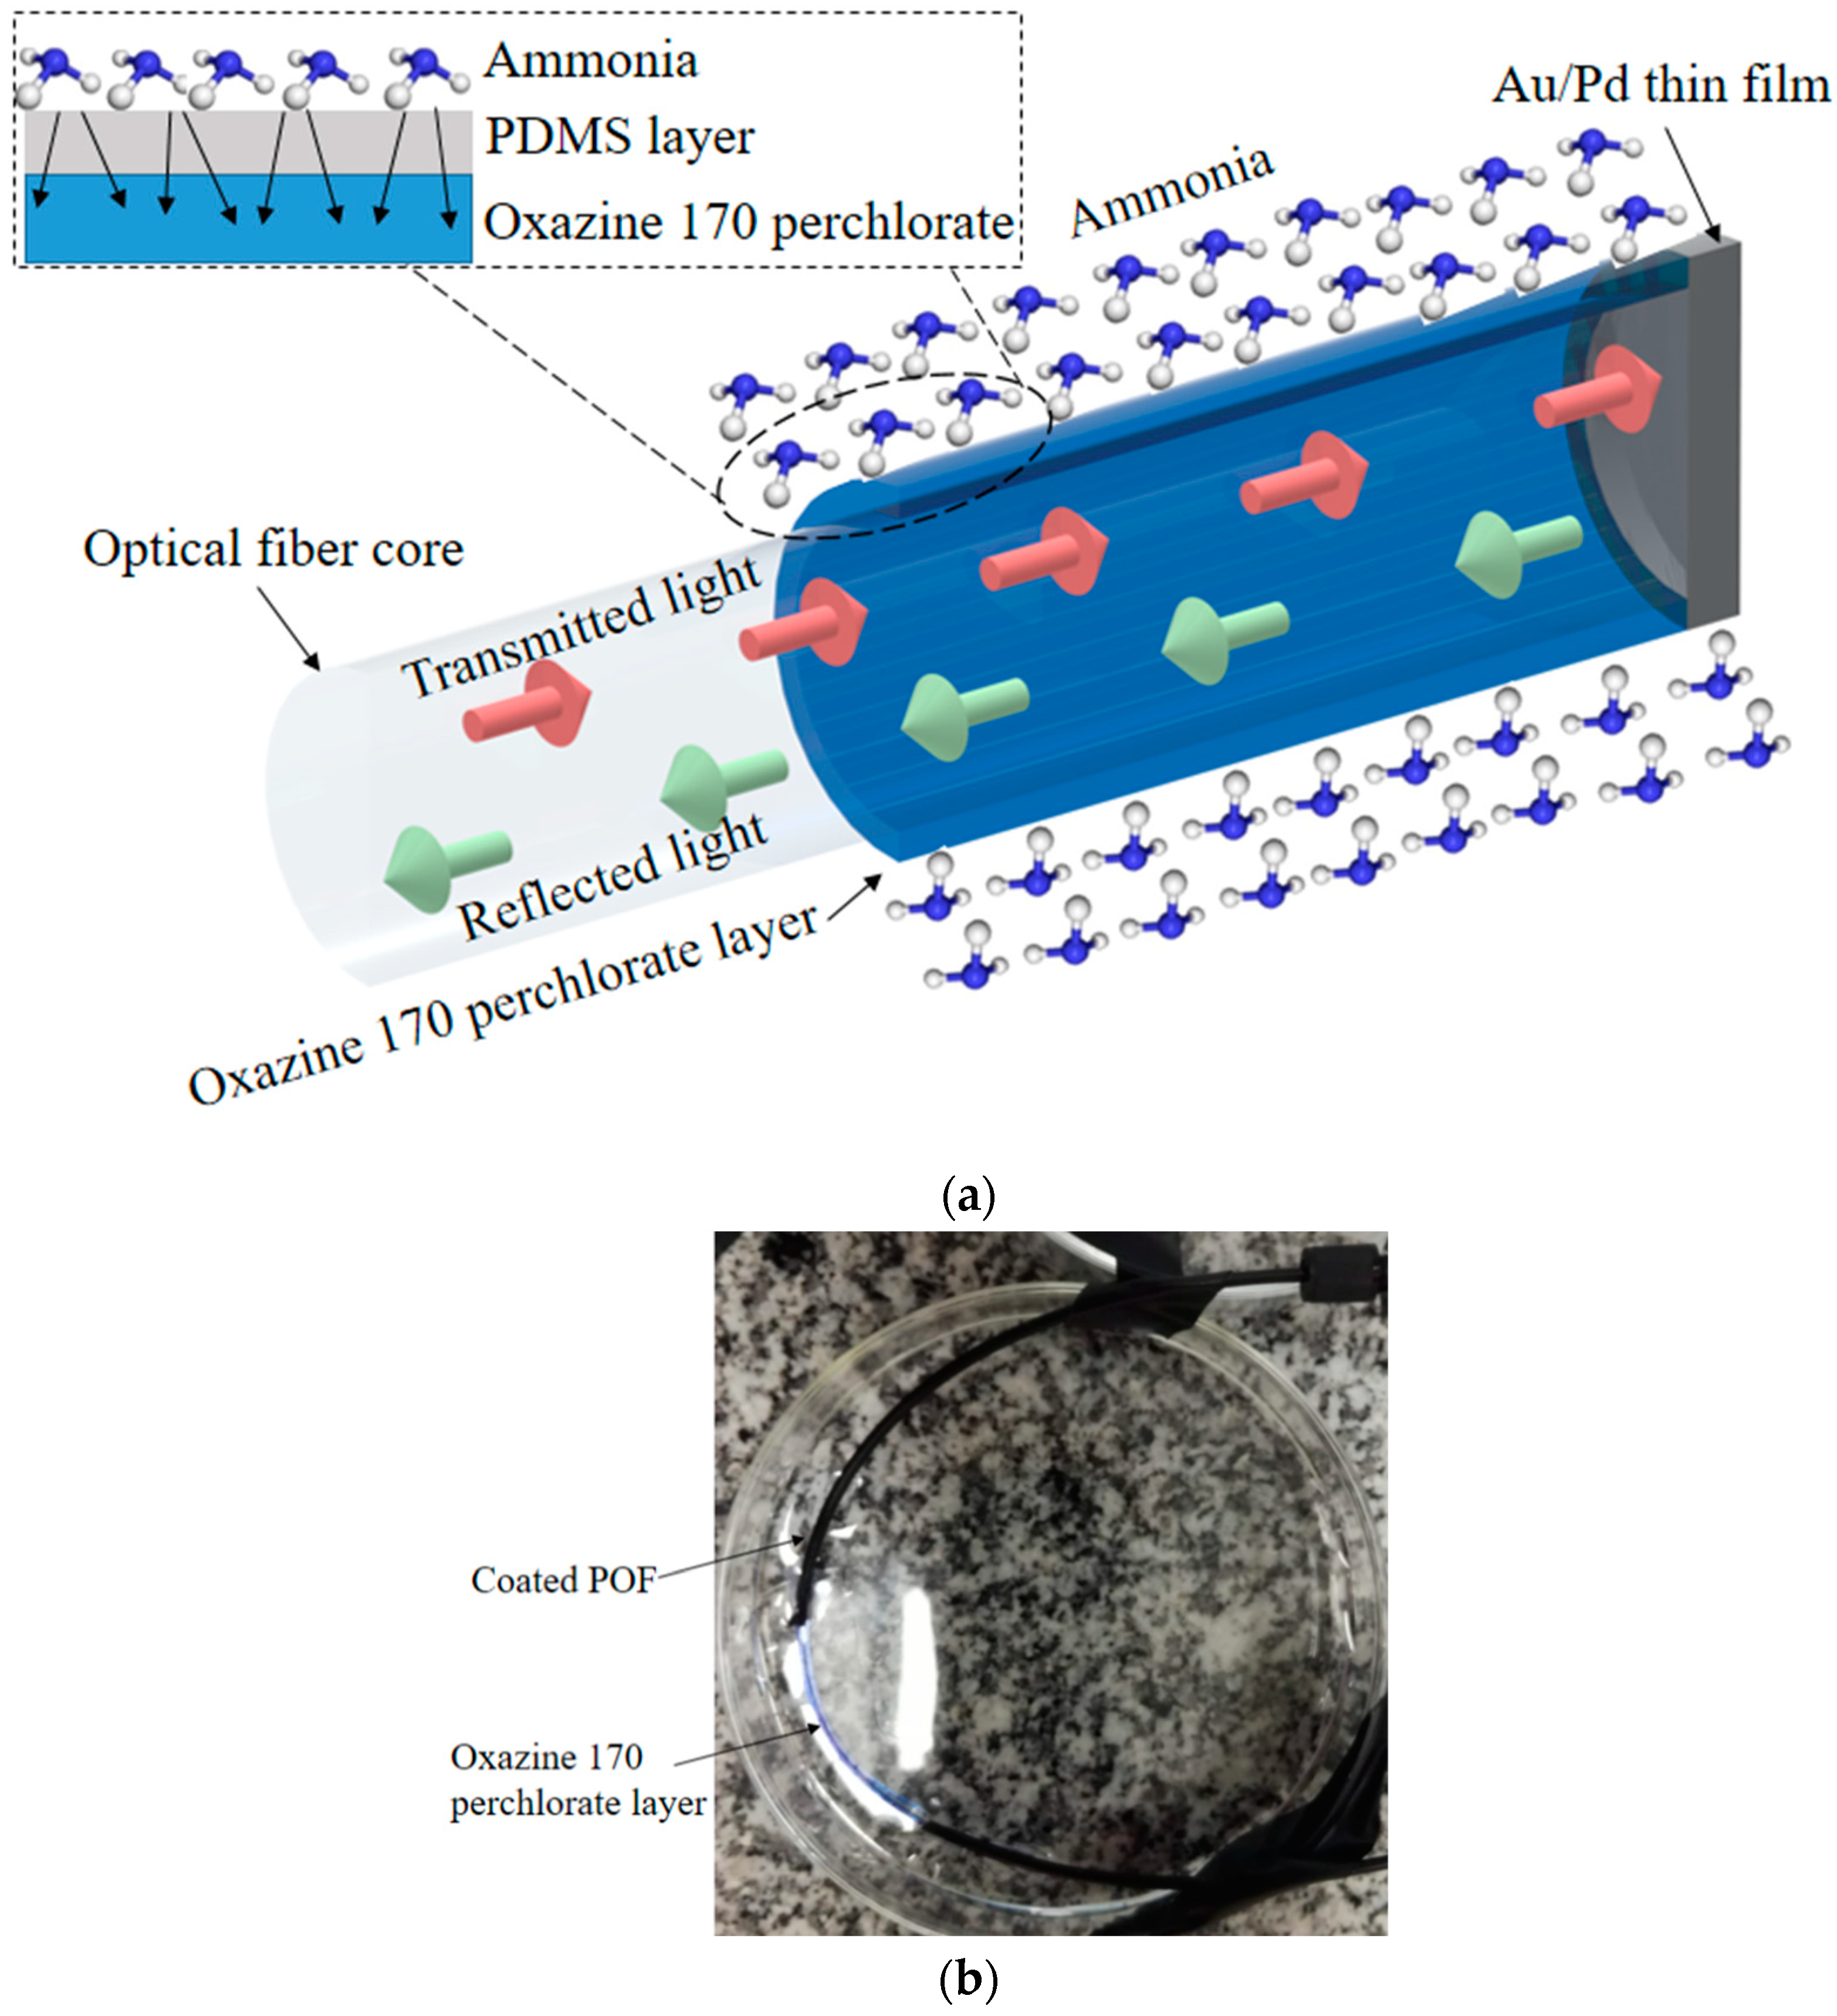
Then, in the second step, the Oxazine 170 perchlorate was deposited on the fiber uncladed region by dip coating. The Oxazine 170 perchlorate deposition followed the methods discussed by the authors of [20], where a dye solution was prepared using 1 mg of Oxazine dissolved in 100 mL of distillated water though a temperature-controlled magnetic stirrer. The uncladed region of the POF was dipped in the Oxazine solution (without dipping the fiber end facet, which had the Au/Pd thin layer) for about 2 hours at 70 °C, as shown in Step 2 of Figure 1, where an u-bend was made on the fiber to position it without dipping its end facet. Thereafter, the fiber was removed, and the temperature of the solution was decreased to 20 °C. After the solution reached the input temperature (20°C), the fiber was dipped again for 10 hours. The Oxazine 170 perchlorate dipping step was the one in which the sensor element was fabricated. The operation principle of the proposed sensor was based on the chemical reactions between the dissolved ammonia and the Oxazine layer on the uncladed POF. Such reactions led to differences in the evanescent field, which resulted in the optical power variation in the POF. The operation principle of the proposed sensor is depicted in Figure 2a, whereas a photograph of the sensor (Sample 3) is shown in Figure 2b.
The chemical reaction between the Oxazine and the ammonia occurs at aqueous solution or in the presence of moisture, which is in accordance with the proposed application, i.e., ammonia sensing on water tanks. However, the direct contact between the sensor and the water can result in a lower lifespan of the proposed sensor if the water can remove the Oxazine layer. For this reason, in the third step (after the Oxazine 170 perchlorate deposition), a polydimethylsiloxane (PDMS) layer was applied. The PDMS layer was also applied by dip coating the optical fiber in the region where the Oxazine was deposited. As proposed by the authors of [20], the optical fiber was dipped in a water container before the application of the PDMS layer in order to create a region with entrapped water, which was needed for the chemical reactions between the Oxazine and ammonia. Then, the fiber was dipped in the PDMS curing agent solution with 24 hours for the layer curing. In this case, there was an additional mechanism in the sensor operation principle, which was the ammonia diffusion in the PDMS layer due to the pressure difference between the layer and the solution containing ammonia [20]. A schematic representation of the ammonia diffusion is presented in Figure 2a inset, where the pressure gradients in conjunction with the ammonia concentration resulted in higher ammonia diffusion into the PDMS layer. This additional mechanism can lead to higher response times for the sensor when compared with the one without the PDMS layer. However, as presented in previous works [20], the ammonia diffusion was fast (of a few seconds), and it was expected that the sensors with and without the PDMS layer would present similar response times. Nevertheless, the ammonia diffusion was also related with its concentration. For this reason, in the tests with variation of ammonia concentration, the sensor with the PDMS layer presented lower linearity than the one without this layer, which can be attributed to the concentration dependency of the ammonia diffusion.
In the last step, a thermal annealing was performed in the fiberoptic probe, where the sensor was positioned inside a climatic chamber at about 50 °C for 6 hours in order to reduce residual stresses created in the fiber during its manufacturing or during the previous steps of the sensor fabrication. In addition, the thermal annealing also accelerated the PDMS curing and provided a better adhesion of the Oxazine coating layer on the uncladed POF.
For the fiberoptic probe interrogation unit, an optical fiber coupler 2x1 IF 562 (Industrial Fiber Optics, USA) with 50:50 coupling ratio was used. The light source, comprising of a red laser (Phywe, Germany) centered at 650 nm (optical power of 4 mW) and a photodetector IF-D92 (Industrial Fiber Optics, USA), was positioned in the two input ports, whereas the other port was positioned in the fiberoptic probe. The photodetector was connected to a microcontroller with a 16-bit analog-to-digital converter FRDM KL25Z (NXP, Netherlands). The proposed probe was positioned inside a container filled with distillated water in which different concentrations of ammonium hydroxide solutions were injected. In this case, the ammonia concentration in the solutions ranged from 100 ppb to 900 ppb. In addition, the sensors were tested in sodium chloride solutions to verify its capability of detecting ammonia in high-salinity conditions, which are commonly found in fish farms.
In order to evaluate each of the steps for the fiberoptic probe fabrication, different set of samples (with three samples) were fabricated using different combinations of the steps. Figure 3 shows the experimental setup and the indication of which steps were used in each set of samples. It is worth mentioning that all samples were subjected to Step 2, in which the sensing layer was created, which resulted in similar Oxazine 170 perchlorate thickness of 35±5 µm for all samples. The comparison between samples was based on the sensitivity and linearity as a function of the ammonia concentration. In the first analysis, the sensors operating at reflection and transmission modes (with and without Step 1, respectively) were compared (Samples 2 and 4). Thereafter, the influence of the PDMS layer on the sensor responses was analyzed (Samples 1 and 2). Finally, annealed and nonannealed samples were compared, i.e., Samples 2 and 3. In the last test, the differences between the proposed fiberoptic probe spectral responses at high-salinity water were obtained with a spectrometer at the wavelength range of 400 nm to 900 nm USB4000 (Ocean Optics, USA) in order to verify if there were any variations in the spectral responses due to the water salinity.
3. Results and Discussion
First, a statistical analysis was performed for each sample, where 15 consecutive measurements of each ammonia concentration were analyzed. In this case, one-way ANOVA was applied for each sample result to verify if there were significant statistical differences between measurements for a specific sample set. The one-way ANOVA tests perform for each sample and ammonia concentrations showed a p-value lower than 0.05 in all cases. These results indicate that there were no significant statistical differences in 15 measurement for each sample in different ammonia concentrations.
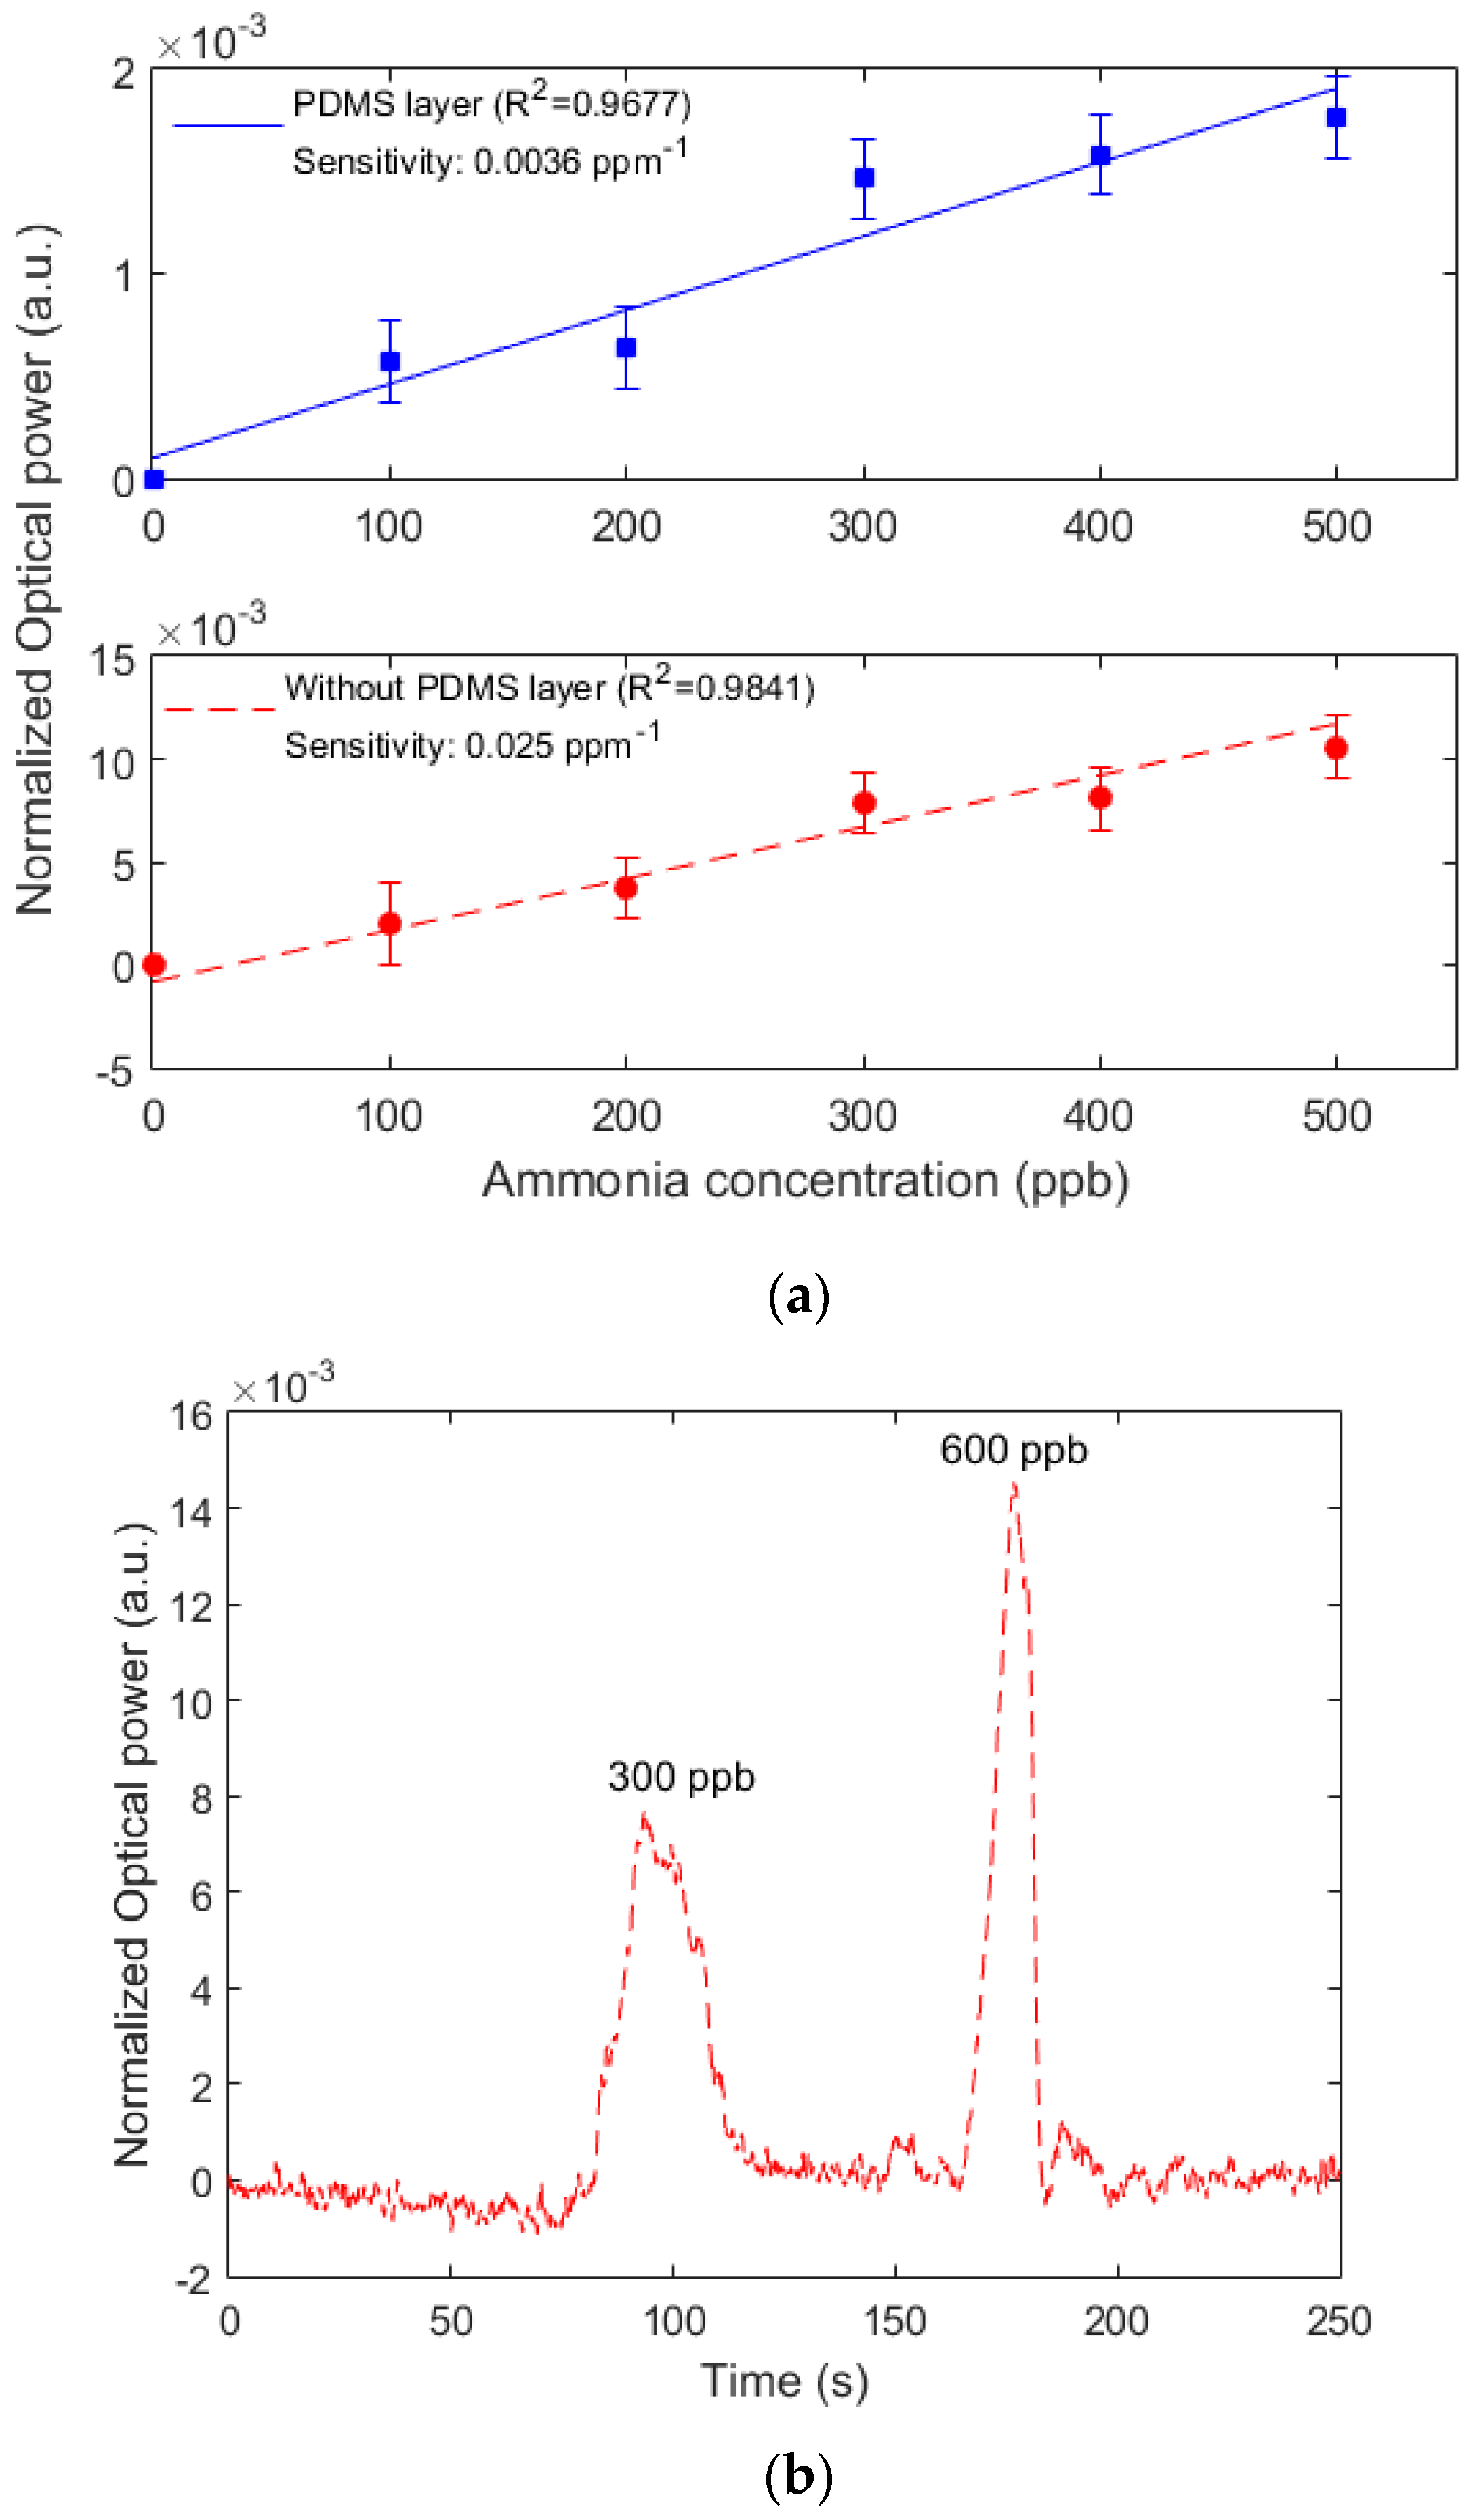
Figure 4a shows the mean and standard deviation results of the sensors with and without the PDMS layer for six ammonia concentrations in distillated water, from 0 ppb to 500 ppb in 100-ppb steps. It is worth mentioning that the responses were not in the same plot due to the larger differences in the sensors’ sensitivities. In addition, the linearity of the sensors was presented as the determination coefficient (R2) between the sensors’ responses and a linear regression. The results in Figure 4a show that the PDMS layer led to lower linearity of the sensor when compared with the samples without the PDMS layer. Although some differences in the sensors’ sensitivities were expected due to some minor differences in the Oxazine layer thickness, there was a high difference in the sensitivity of the sensors with and without the PDMS layer. The sensors without the additional PDMS layer had a sensitivity of 0.025 ppm−1, which was seven-times higher than the one obtained from the sensor with the PDMS layer (0.0036 ppm−1). Therefore, concerning the sensors’ performance, the sensor without the PDMS layer was preferable for the proposed application. It is worth noting that the fiberoptic probe without the PDMS layer can have lower lifespan than the one with the PDMS protection. This feature can be verified in Figure 4a by the lower standard deviation of the probe with PDMS layer. However, the sensors were fabricated with low-cost methods (a few U$ per sensor) and with easy assembly that enabled a scalable production and the replacement of probes in field applications.
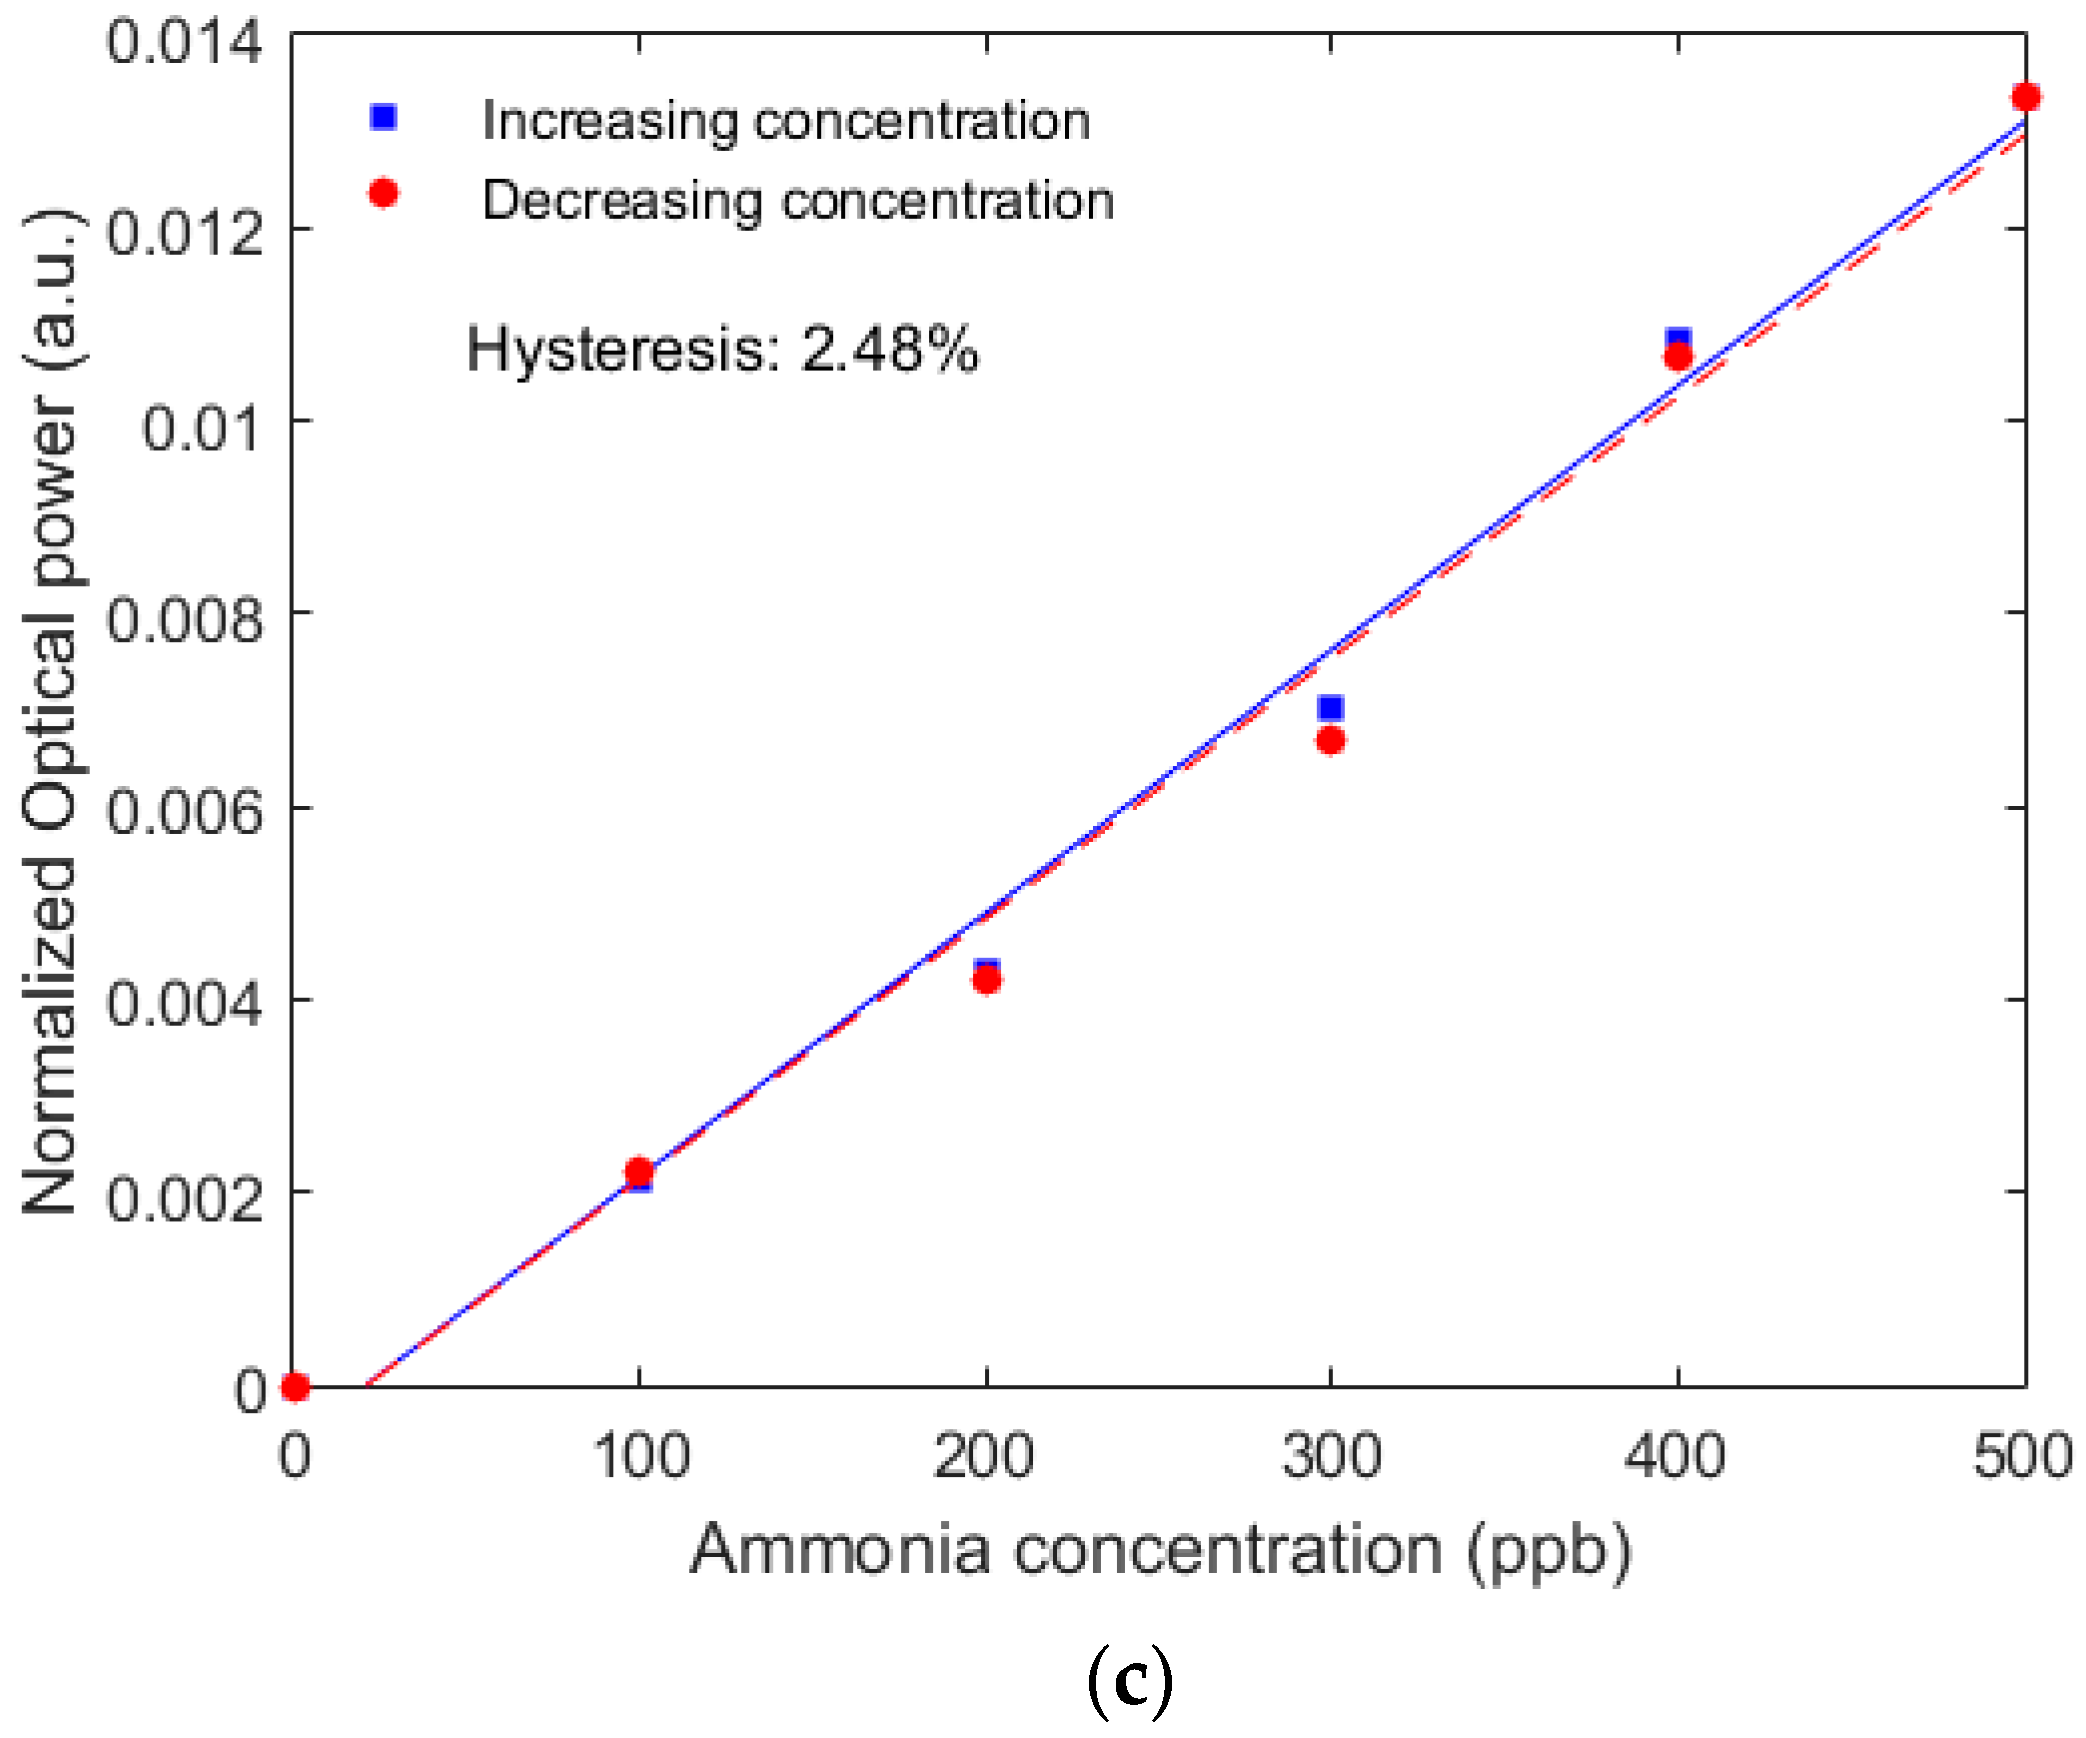
In order to verify the sensor repeatability and reusability of the sensor without the PDMS layer (since it presented a better performance when compared with the one with PDMS layer), Figure 4b shows the results of the sensor as a function of time for two consecutive cycles, one in 300-ppb concentration, where the sensor was kept in this concentration for about 10 seconds, and the other in 600-ppb concentration. It is possible to observe in both cases that the sensor presented a response reversibility, since the normalized optical power returned to its initial value when the sensor was not immersed in ammonia solutions, where response times close to 5 seconds were found for both increasing and decreasing concentrations of ammonia. As another performance analysis of the sensor, its hysteresis was analyzed in cycles of ammonia concentration. As shown in Figure 4c, the sensor presented low hysteresis of 2.48%, which indicates the suitability of the sensor in detecting ammonia concentrations in dynamic cycles with low errors.
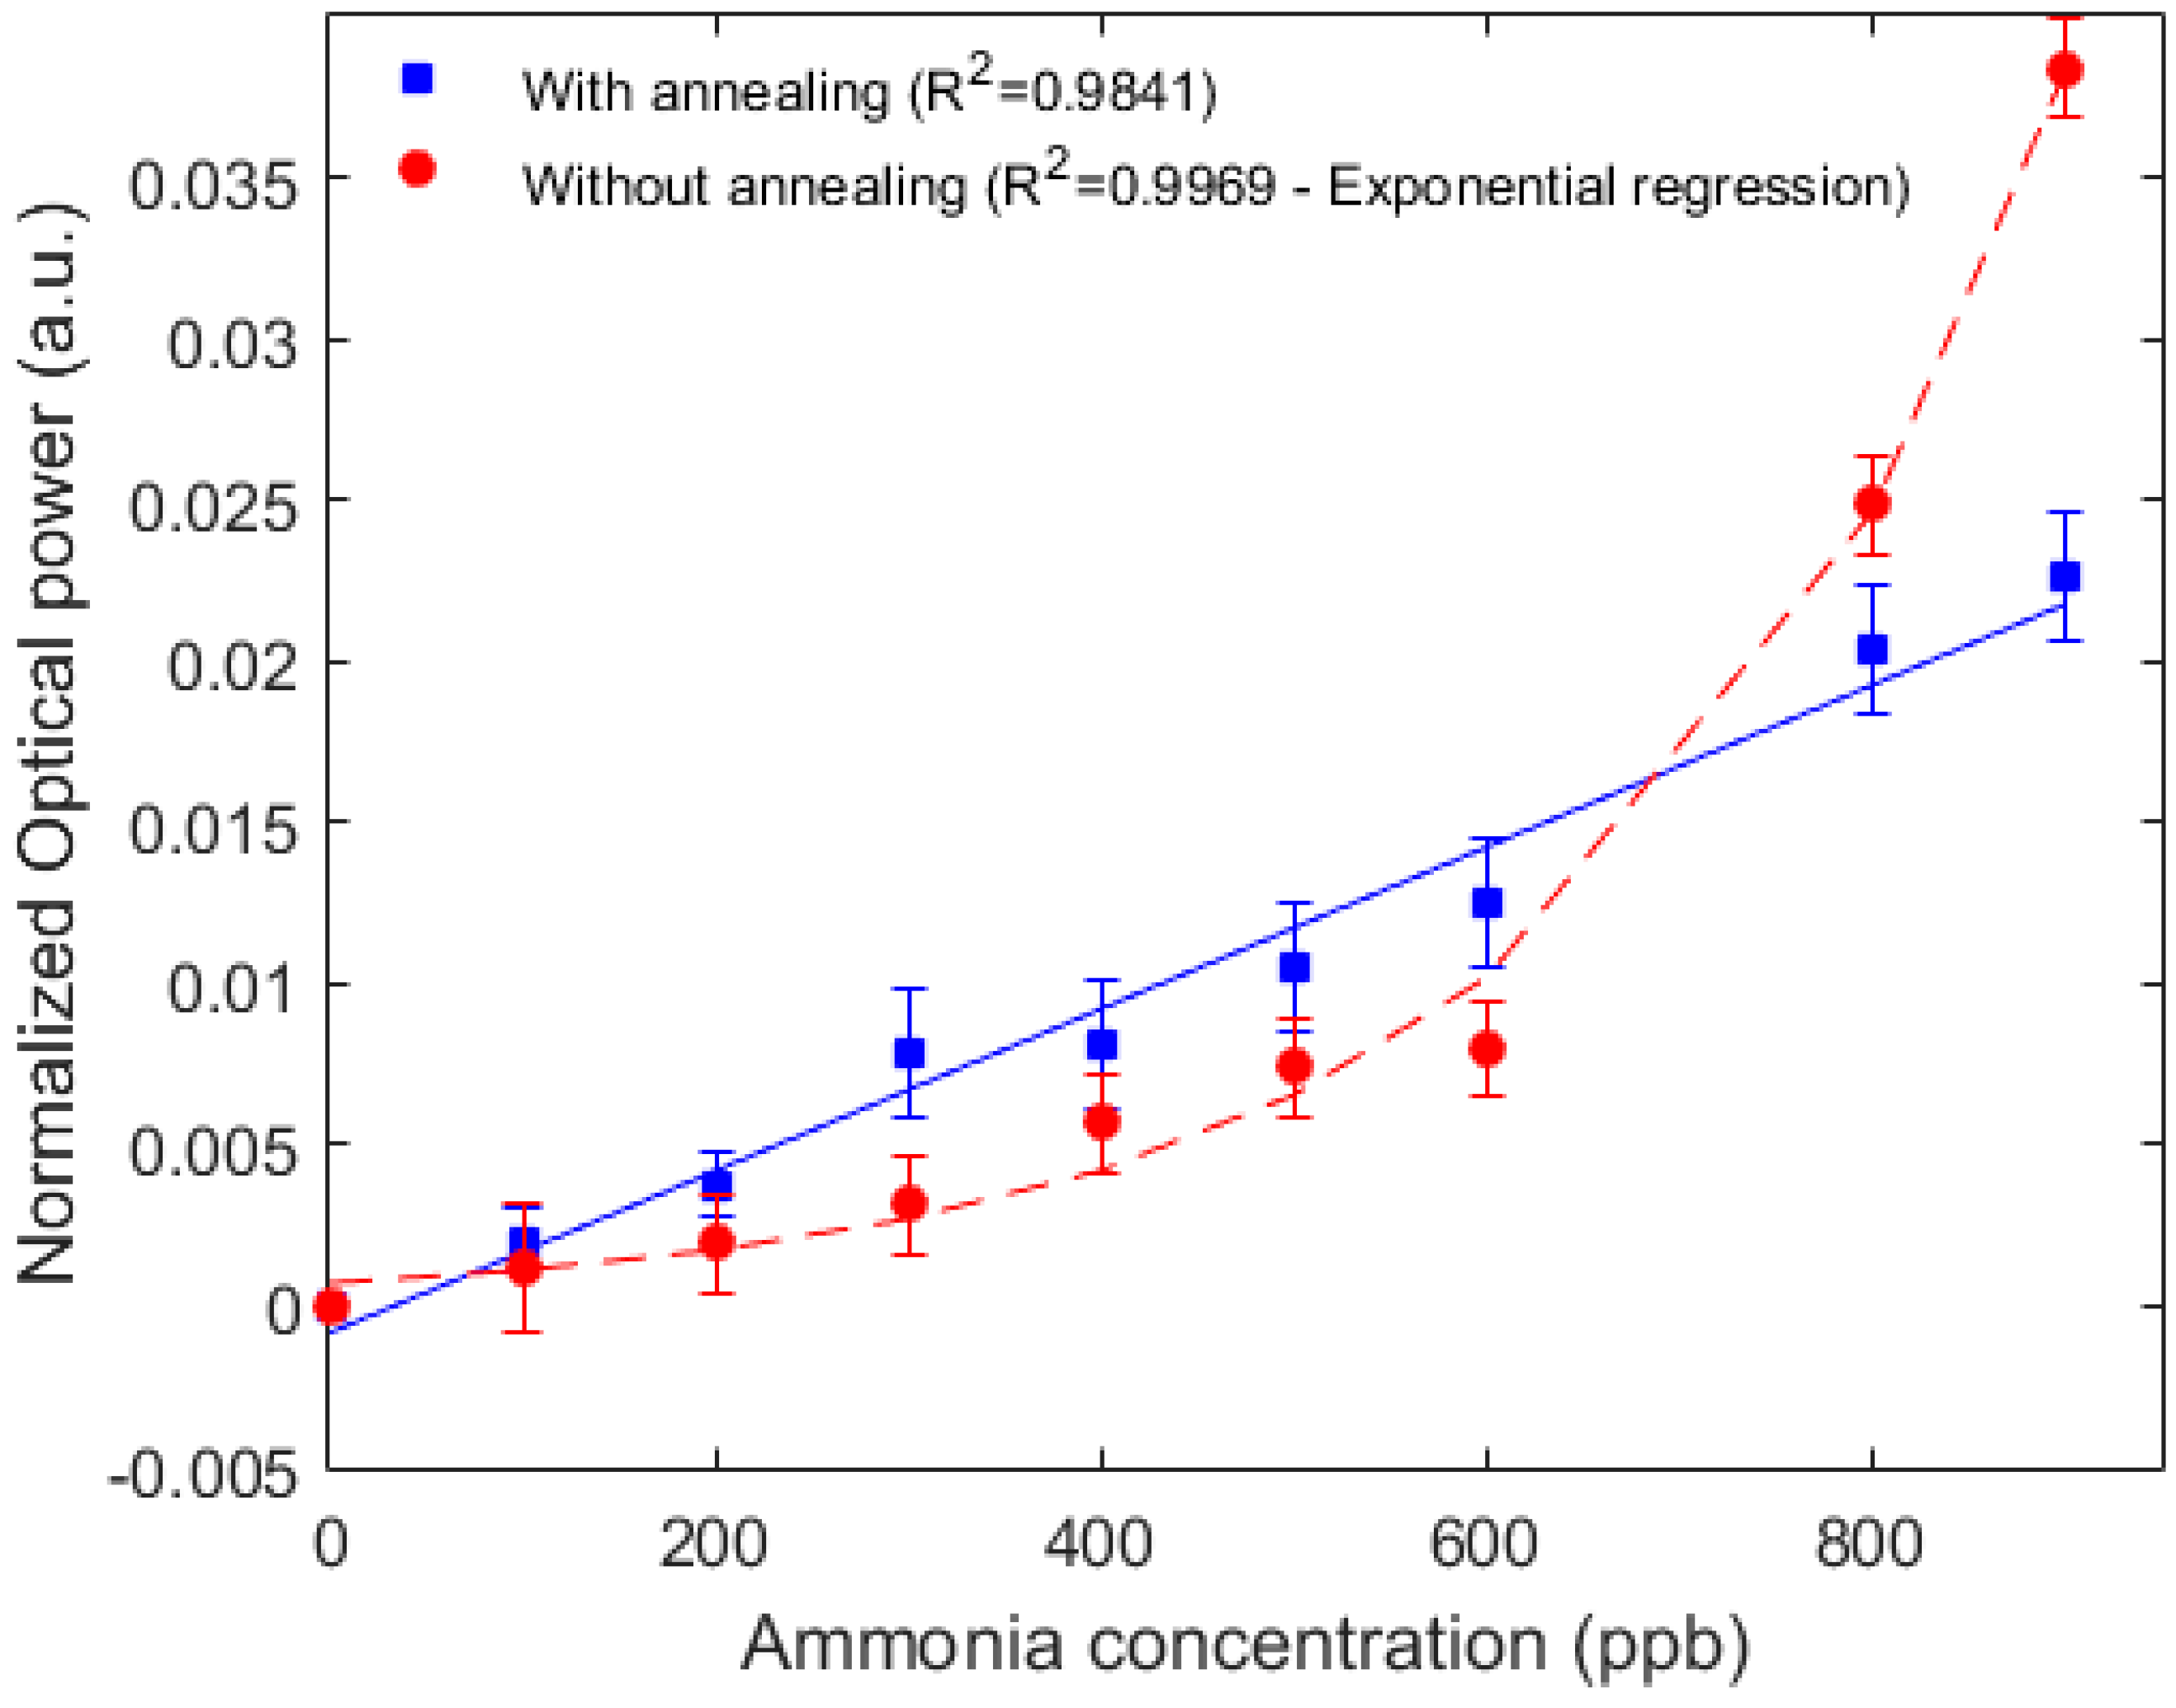
Regarding to the thermal treatment effects on the sensors’ performance, Samples 2 and 3 were tested in a larger range of ammonia concentrations (from 0 ppb to 900 ppb) (see Figure 5). The results show that the nonannealed samples presented a nonlinear behavior that could be accurately represented by an exponential regression. Nevertheless, in concentrations below 60 ppb, the nonannealed samples showed lower sensitivity than the annealed ones. The annealed samples showed a high linearity, with R2 as high as 0.98. However, the sensitivity of nonannealed samples was higher than the annealed one for ammonia concentrations higher than 600 ppb. For early ammonia detection, a sensor with higher linearity in low concentrations of ammonia is desirable. For this reason, the annealed samples were preferable for the proposed application, but it is worth noting that in environments with high ammonia concentrations, the nonannealed samples may lead to a sensor system with higher resolution in the ammonia detection.
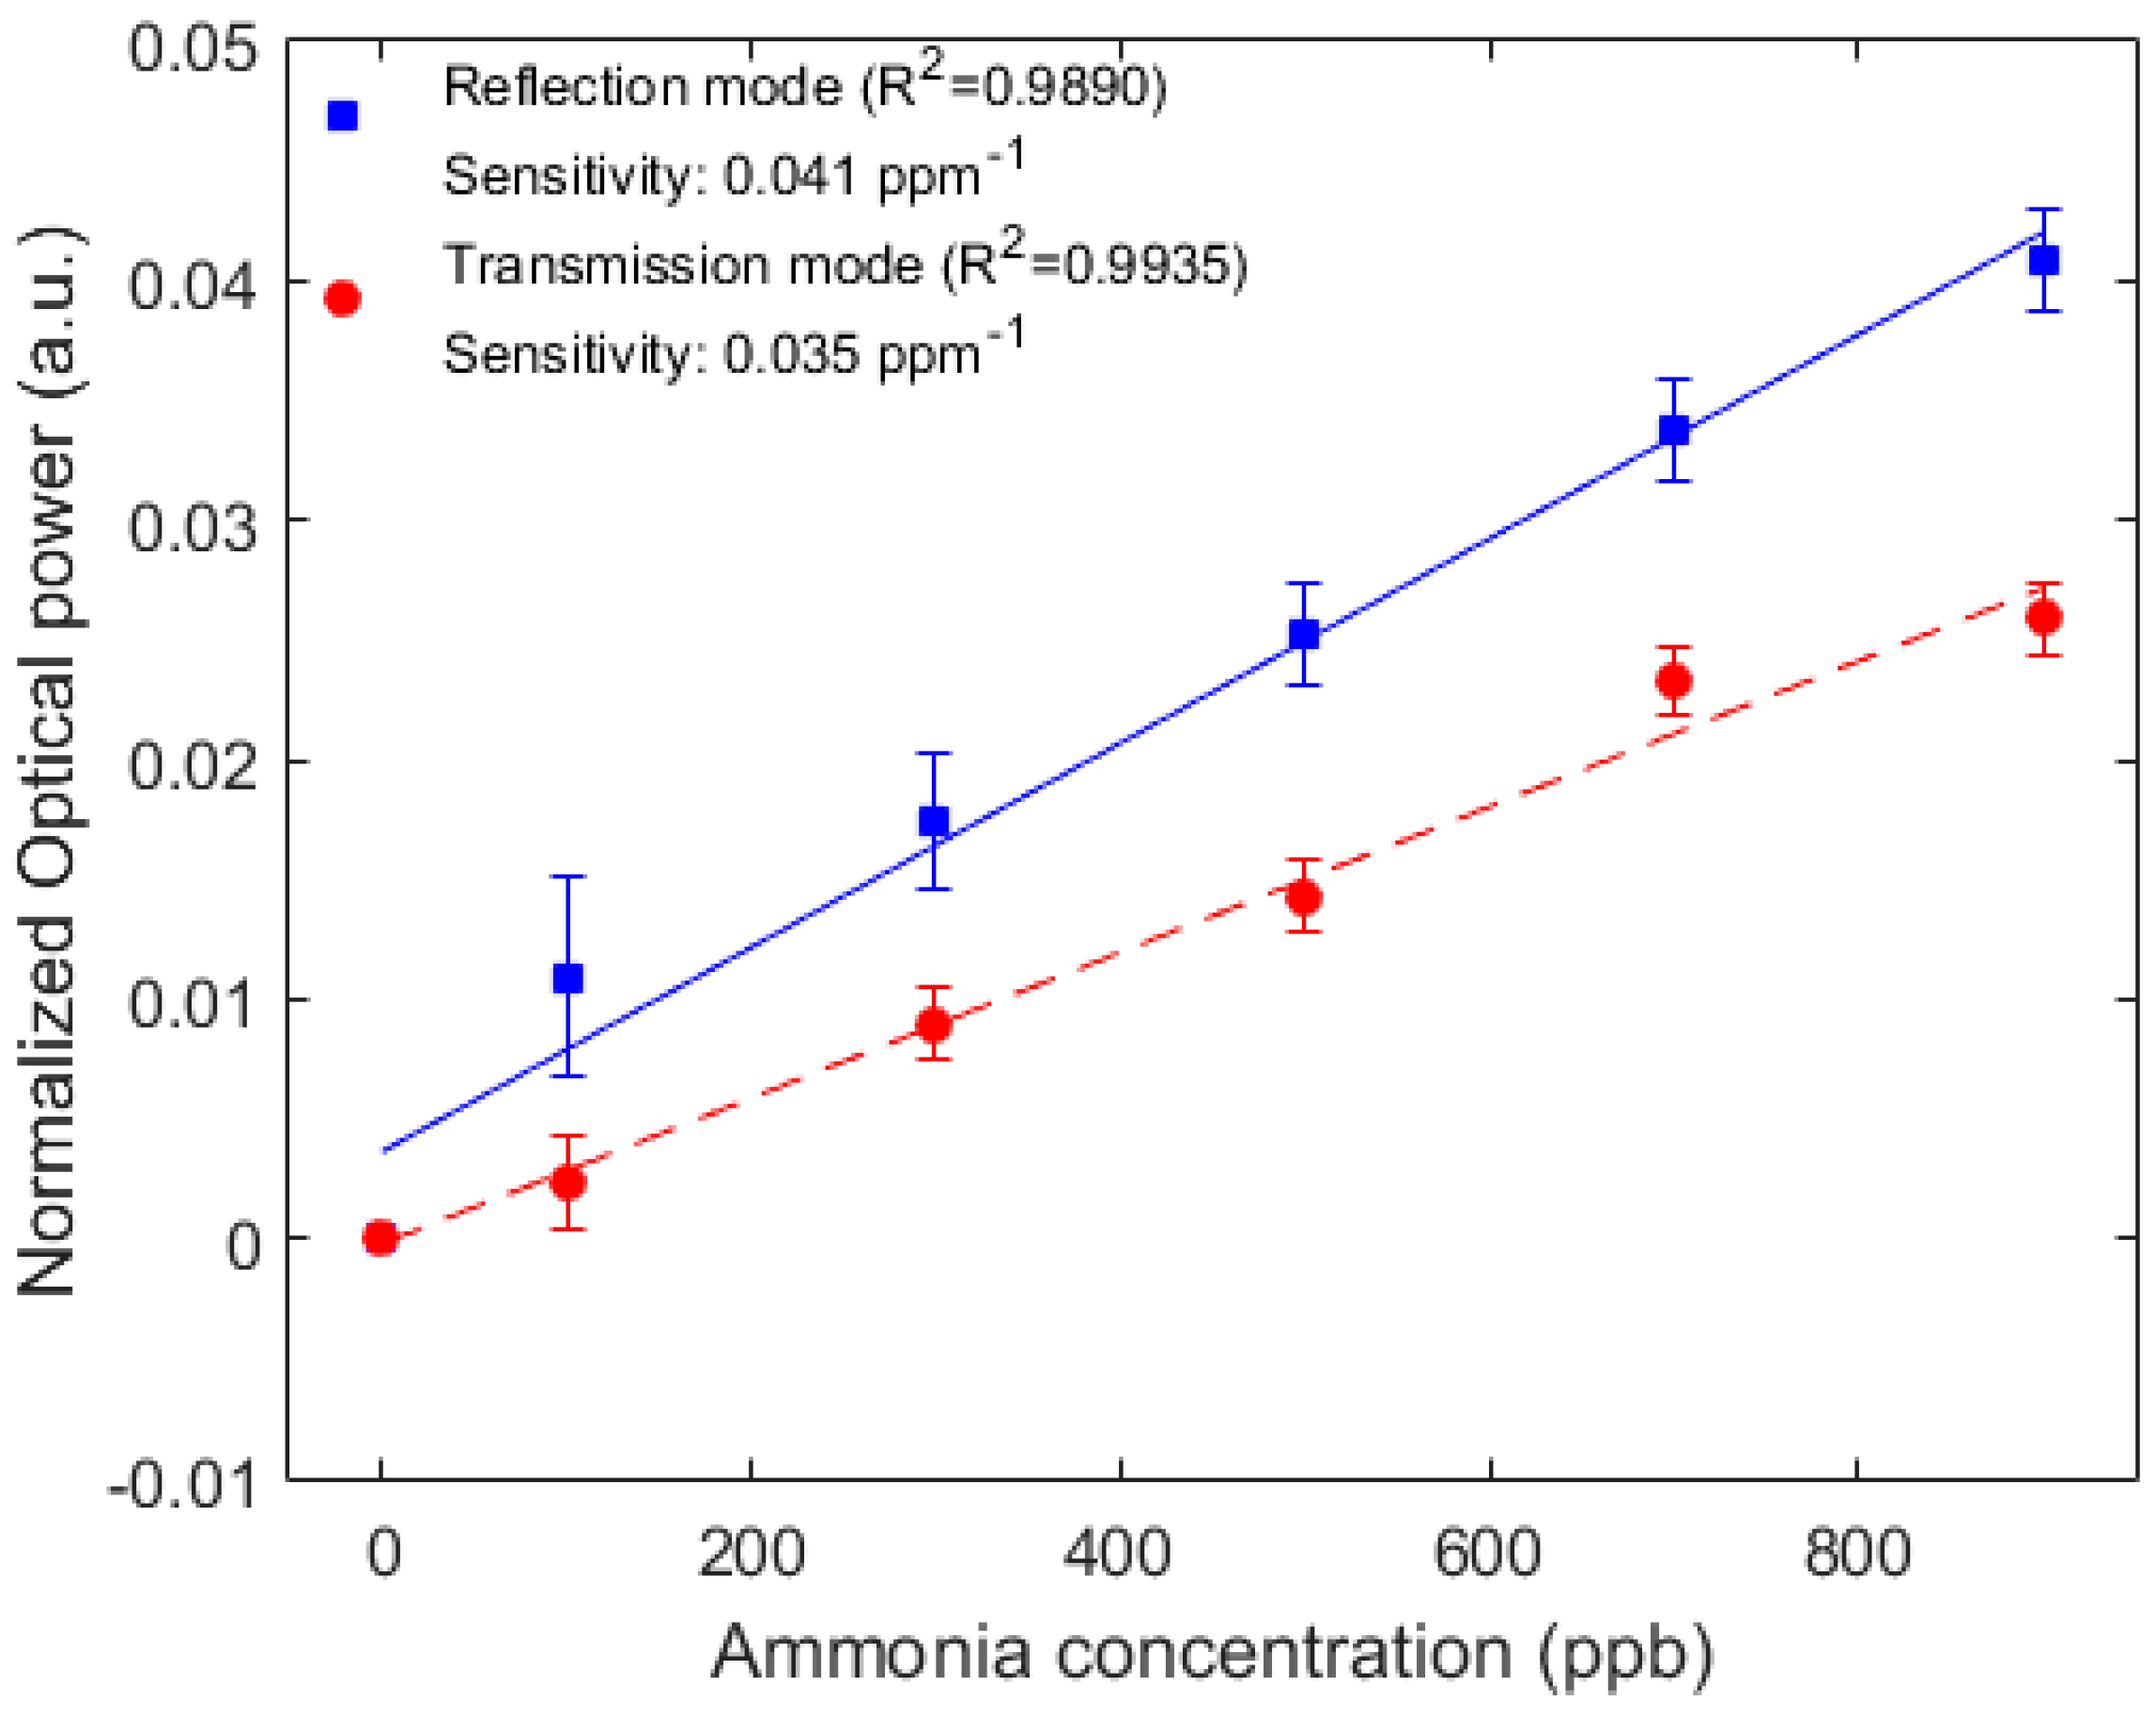
The tests performed in the fiberoptic probes operating at transmission and reflection modes are presented in Figure 6, where both sensors presented similar sensitivities, i.e., 0.035 ppm−1 and 0.041 ppm−1 for transmission and reflection fiberoptic probes, respectively. Regarding to the sensors’ linearity, the transmission mode presented higher linearity than the one of the reflection mode. However, the R2 values of both sensors were close to each other, which indicates compatibility between both operation modes. Therefore, due to the necessity of regular substitution of the probes and to facilitate their installation, the probe in the reflection mode was the preferable one, since both modes had similar performance.
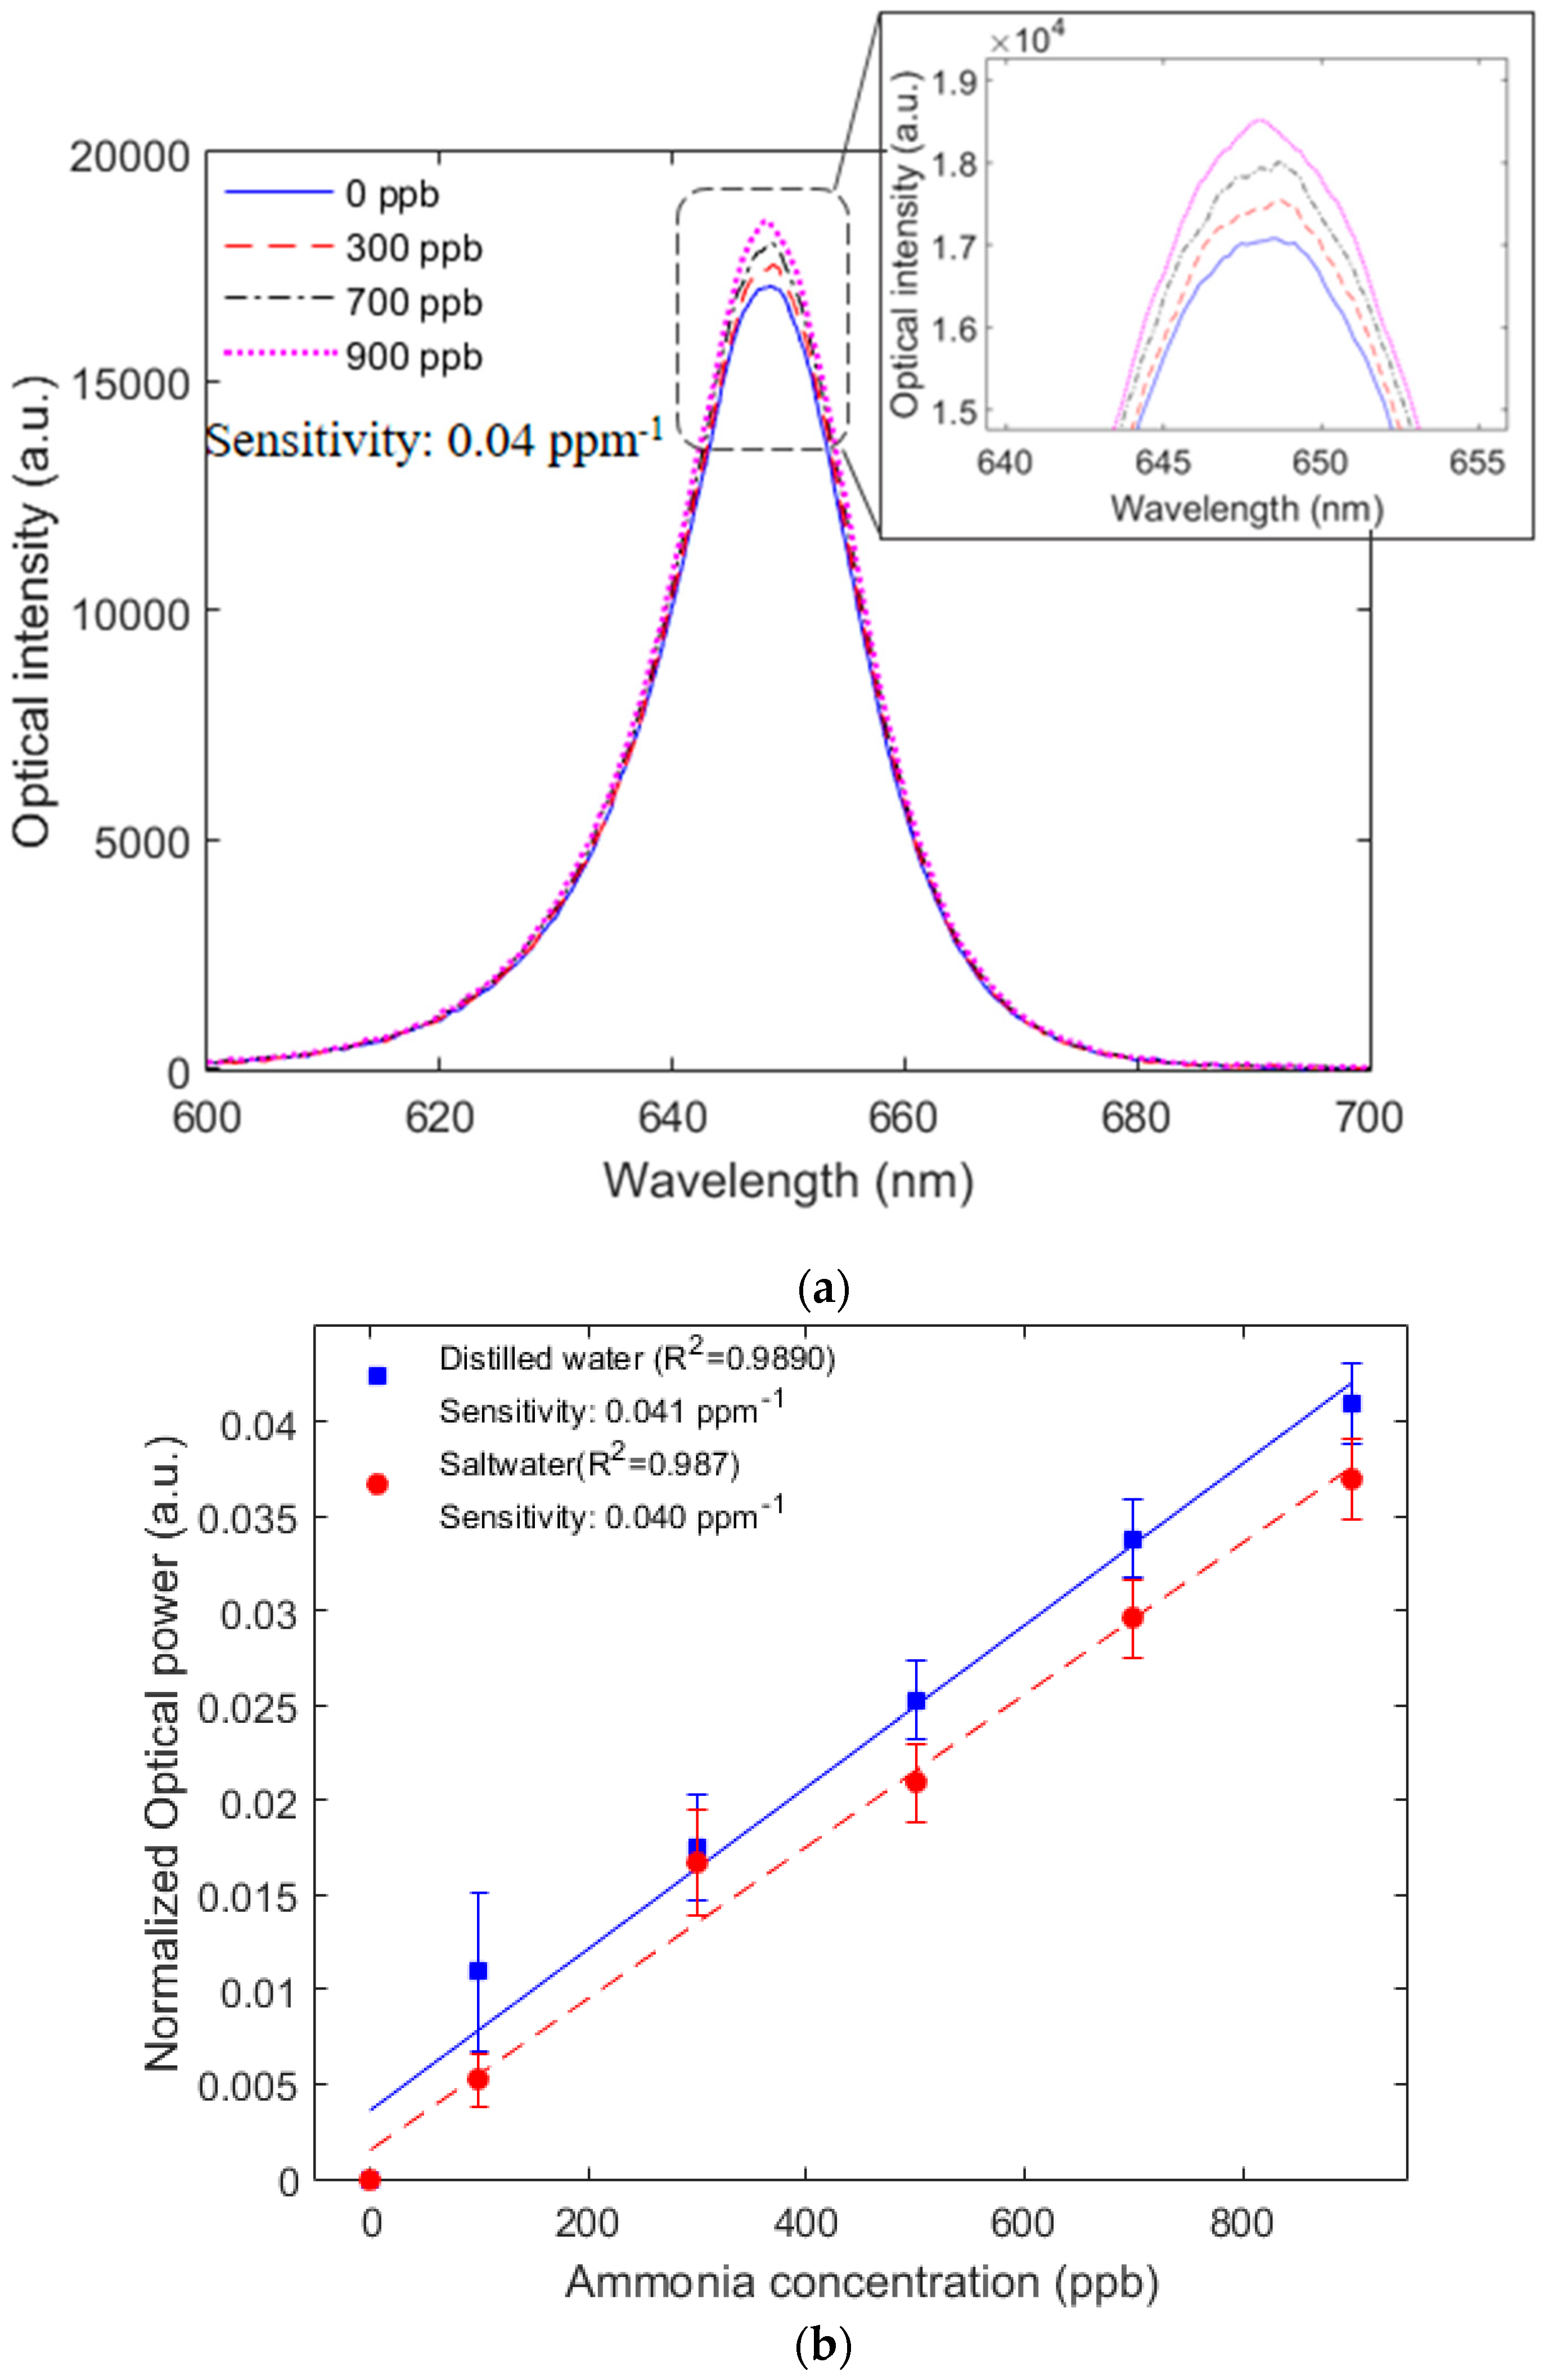
Then, the fiberoptic probe in the reflection mode with annealing and without the PDMS layer (Samples 1 and 2 in Figure 3) was tested in a sodium chloride solution to simulate an environment with high-salinity water as observed in RAS. Figure 7a presents the spectra of the sensors at each ammonia concentration to verify if the water salinity leads to other variations in the reflected spectrum (such as shift in the wavelength or spectral width) besides the intensity variation. However, the results in Figure 7a show only an amplitude (or intensity) variation on the reflected spectra, which indicate a similar performance of the sensor when compared with the results in distillated water. The Figure 7a inset shows the magnified view of the peaks, where the differences in the peak intensities can be observed. In addition, the proposed sensor was able to detect ammonia concentrations as low as 100 ppb with a straightforward and low-cost sensor approach, which can be used in many RAS industries for early detection of ammonia. Figure 7b shows the comparison between the sensor responses at distillated water and saltwater, where it is possible to observe that the sensor presented similar responses with a slight sensitivity reduction in saltwater. However, considering the standard deviations between measurements, the upper limit of the sensitivity in saltwater was 0.041 ppm−1, whereas the lower limit of the sensitivity in distilled water was 0.040 ppm−1. This analysis indicates that there were no significant sensitivity differences in sensors responses in distilled water and saltwater.
4. Conclusions
This paper presented the design and validation of a fiberoptic probe for ammonia detection. The sensor was based on the chemical reaction between Oxazine 170 perchlorate coating applied in an uncladed POF. Different design options were investigated, including the use of a PDMS layer in order to increase the sensor lifespan as well as thermal treatments (e.g., annealing) and their influence on the sensor performance parameters. Namely, the sensitivity and linearity were investigated. The transmission and reflection operation modes of the sensor were also investigated, where a thin layer of Au/Pd was deposited in the POF end facet in order to create a reflector for the probe operation in reflection mode. The sensor was tested not only in distillated water, but also in high-salinity water to emulate different operation conditions. Table 1 presents a comparison between different optical sensors for ammonia detection.
The proposed fiberoptic probe shows its feasibility on early ammonia detection, where concentrations as low as 100 ppb can be estimated with the proposed design. Compared with previously reported sensors in Table 1, the proposed sensor presented the lowest detection limit and highest sensitivity. Therefore, the proposed probe can be applied in different fish farms, including the ones with RAS, as a low-cost method for water quality assessment. In addition, with the development of recycled uncladed POFs [25], the proposed approach can be applied in such fibers for an even higher reduction of the system cost. In future works, the integration of this system with a multiplexing technique for the development of multiple probes and its application in a RAS system will be investigated.
Author Contributions
Conceptualization, A.G.L.-J. and C.M.; methodology, A.G.L.-J. and C.M.; formal analysis, A.G.L.-J., A.F. and C.M; investigation, A.G.L.-J. and C.M.; resources, A.F and C.M.; writing—original draft preparation, A.G.L.-J.; writing—review and editing, A.G.L.-J., A.F. and C.M; funding acquisition, A.F. and C.M. All authors have read and agreed to the published version of the manuscript.
Funding
This research is financed by FAPES (85426300 and 84336650), CNPq (304049/2019-0 and 427054/2018-4) and Petrobras (2017/00702-6). C. Marques acknowledges Fundação para a Ciência e a Tecnologia (FCT) through the CEECIND/00034/2018 (iFish project) and this work was developed within the scope of the project i3N, UIDB/50025/2020 & UIDP/50025/2020, financed by national funds through the FCT/MEC. This work is also funded by national funds (OE), through FCT, I.P., in the scope of the framework contract foreseen in the numbers 4, 5 and 6 of the article 23, of the Decree-Law 57/2016, of August 29, changed by Law 57/2017, of July 19.
Acknowledgments
The authors would like to thank Tiago Silva, from Department of Materials and Ceramic Engineering (DEMaC), University of Aveiro, for his valuable support during the Au/Pd thin layer deposition.
Conflicts of Interest
The authors declare no conflict of interest.
References
- FAO Aquaculture Development. Available online: http://www.fao.org/aquaculture/en/ (accessed on 20 March 2020).
- European Environment Agency Aquaculture Production in Europe. Available online: Eea.europa.eu/data-and-maps/indicators/aquaculture-production-4 (accessed on 20 March 2020).
- Ogawa, K.; Ito, F.; Nagae, M.; Nishimura, T.; Yamaguchi, M.; Ishimatsu, A. Effects of acid stress on reproductive functions in immature carp, Cyprinus Carpio. Water Air Soil Pollut. 2001, 130, 887–892. [Google Scholar] [CrossRef]
- Besson, M.; Komen, H.; Aubin, J.; De Boer, I.J.M.; Poelman, M.; Quillet, E.; Vancoillie, C.; Vandeputte, M.; Van Arendonk, J.A. Economic values of growth and feed efficiency for fish farming in recirculating aquaculture system with density and nitrogen output limitations: A case study with African catfish (clarias gariepinus). J. Anim. Sci. 2014, 92, 5394–54052. [Google Scholar] [CrossRef] [PubMed] [Green Version]
- Fivelstad, S. Waterflow requirements for salmonids in single-pass and semi-closed land-based seawater and freshwater systems. Aquac. Eng. 1988, 7, 183–200. [Google Scholar] [CrossRef]
- Ruyet, J.P.L.; Chartois, H.; Quemener, L. Comparative acute ammonia toxicity in marine fish and plasma ammonia response. Aquaculture 1995, 136, 181–194. [Google Scholar] [CrossRef]
- Chen, S.; Ling, J.; Blancheton, J.P. Nitrification kinetics of biofilm as affected by water quality factors. Aquac. Eng. 2006, 34, 179–197. [Google Scholar] [CrossRef]
- Conte, F.S. Stress and the welfare of cultured fish. Appl. Anim. Behav. Sci. 2004, 86, 205–223. [Google Scholar] [CrossRef]
- Randall, D.; Tsui, T.K. Ammonia toxicity in fish. Mar. Pollut. Bull. 2002, 45, 17–23. [Google Scholar] [CrossRef]
- Wright, P.A.; Wood, C.M. Seven things fish know about ammonia and we don’t. Respir. Physiol. Neurobiol. 2012, 184, 231–240. [Google Scholar] [CrossRef]
- Foss, A.; Kristensen, T.; Åtland, Å.; Hustveit, H.; Hovland, H.; Øfsti, A.; Imsland, A.K. Effects of water reuse and stocking density on water quality, blood physiology and growth rate of juvenile cod (Gadus morhua). Aquaculture 2006, 256, 255–263. [Google Scholar] [CrossRef]
- Badiola, M.; Basurko, O.C.; Piedrahita, R.; Hundley, P.; Mendiola, D. Energy use in recirculating aquaculture systems (RAS): A review. Aquac. Eng. 2018, 81, 57–70. [Google Scholar] [CrossRef]
- Rodrigues, R.V.; Schwarz, M.H.; Delbos, B.C.; Sampaio, L.A. Acute toxicity and sublethal effects of ammonia and nitrite for juvenile cobia Rachycentron canadum. Aquaculture 2007, 271, 553–557. [Google Scholar] [CrossRef]
- Kolarevic, J.; Takle, H.; Felip, O.; Ytteborg, E.; Selset, R.; Good, C.M.; Baeverfjord, G.; Åsgård, T.; Terjesen, B.F. Molecular and physiological responses to long-term sublethal ammonia exposure in Atlantic salmon (Salmo salar). Aquat. Toxicol. 2012, 124–125, 48–57. [Google Scholar] [CrossRef] [PubMed] [Green Version]
- Bregnballe, J. A Guide to Recirculation Aquaculture; Food and Agriculture Organization of the United Nations (FAO), EUROFISH International Organisation: Rome, Italy, 2015; p. 100. [Google Scholar]
- Alwis, L.; Sun, T.; Grattan, K.T.V. Developments in optical fibre sensors for industrial applications. Opt. Laser Technol. 2016, 78, 62–66. [Google Scholar] [CrossRef]
- Majchrowicz, D.; Kosowska, M.; Sankaran, K.J.; Sobaszek, M.; Haenen, K. Nitrogen-doped diamond film for optical investigation of hemoglobin concentration. Materials 2018, 11, 109. [Google Scholar] [CrossRef] [Green Version]
- Zhang, Y.; Peng, H.; Qian, X.; Zhang, Y.; An, G.; Zhao, Y. Recent advancements in optical fiber hydrogen sensors. Sens. Actuators B Chem. 2017, 244, 393–416. [Google Scholar] [CrossRef] [Green Version]
- Emiliyanov, G.; Høiby, P.E.; Pedersen, L.H.; Bang, O. Selective serial multi-antibody biosensing with TOPAS microstructured polymer optical fibers. Sensors 2013, 13, 3242–3251. [Google Scholar] [CrossRef] [Green Version]
- Jalal, A.H.; Yu, J.; Agwu Nnanna, A.G. Fabrication and calibration of Oxazine-based optic fiber sensor for detection of ammonia in water. Appl. Opt. 2012, 51, 3768. [Google Scholar] [CrossRef]
- Mohammed, H.A.; Rashid, S.A.; Abu Bakar, M.H.; Ahmad Anas, S.B.; Mahdi, M.A.; Yaacob, M.H. Fabrication and characterizations of a novel etched-tapered single mode optical fiber ammonia sensors integrating PANI/GNF nanocomposite. Sens. Actuators B Chem. 2019, 287, 71–77. [Google Scholar] [CrossRef]
- Mader, H.S.; Wolfbeis, O.S. Optical ammonia sensor based on upconverting luminescent nanoparticles. Anal. Chem. 2010, 82, 5002–5004. [Google Scholar] [CrossRef]
- Chu, C.-S.; Chen, Y.-F. Development of ratiometric optical fiber sensor for ammonia gas detection. In Proceedings of the 2017 25th Optical Fiber Sensors Conference (OFS), Jeju, South Korea, 24–28 April 2017. [Google Scholar]
- Zhou, Q.; Kritz, D.; Bonnell, L.; Sigel, G.H. Porous plastic optical fiber sensor for ammonia measurement. Appl. Opt. 1989, 28, 2022. [Google Scholar] [CrossRef]
- Prado, A.R.; Leal-Junior, A.G.; Marques, C.; Leite, S.; de Sena, G.L.; Machado, L.C.; Frizera, A.; Ribeiro, M.R.N.; Pontes, M.J. Polymethyl methacrylate (PMMA) recycling for the production of optical fiber sensor systems. Opt. Express 2017, 25, 30051. [Google Scholar] [CrossRef] [PubMed]
- Ozhikandathil, J.; Badilescu, S.; Packirisamy, M. Polymer composite optically integrated lab on chip for the detection of ammonia. J. Electrochem. Soc. 2018, 165, B3078–B3083. [Google Scholar] [CrossRef] [Green Version]
Figure 1.
Schematic representation of the steps for the samples preparation.

Figure 2.
(a) Operation principle of the proposed sensors. The arrows are only a schematic representation, since the polymer optical fiber (POF) used had multiple propagating modes instead of just the ones presented in the figure. Figure inset shows ammonia diffusion in the sensing layer. (b) Photograph of the proposed sensor (Sample 3).

Figure 3.
Experimental setup for the sensor’s response acquisition. The description of which steps were followed for each set of samples is also shown.
Figure 3.
Experimental setup for the sensor’s response acquisition. The description of which steps were followed for each set of samples is also shown.

Figure 4.
(a) Comparison between the fiberoptic probe responses with and without the PDMS layer as a function of the ammonia concentration. (b) Fiberoptic probe responses without PDMS layer as a function of time for two consecutive ammonia concentration cycles. (c) Hysteresis analysis of the proposed fiberoptic probe for ammonia detection.


Figure 5.
Comparison between the fiberoptic probe responses with and without annealing as a function of the ammonia concentration.
Figure 5.
Comparison between the fiberoptic probe responses with and without annealing as a function of the ammonia concentration.

Figure 6.
Comparison between the fiberoptic probe responses in the transmission and reflection mode as a function of the ammonia concentration.
Figure 6.
Comparison between the fiberoptic probe responses in the transmission and reflection mode as a function of the ammonia concentration.

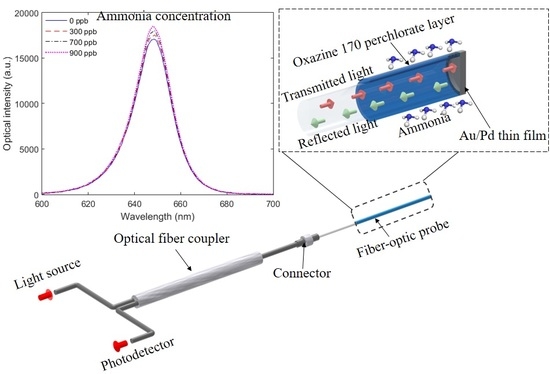
Figure 7.
(a) Fiberoptic probe reflected spectra for different ammonia concentrations in high-salinity water. (b) Comparison between the sensors responses as a function of the ammonia concentration in distilled water and saltwater.
Figure 7.
(a) Fiberoptic probe reflected spectra for different ammonia concentrations in high-salinity water. (b) Comparison between the sensors responses as a function of the ammonia concentration in distilled water and saltwater.


Table 1.
Comparison between lowest measured concentration and sensitivities of different ammonia sensors.
Table 1.
Comparison between lowest measured concentration and sensitivities of different ammonia sensors.
| Sensor | Lowest Measured Concentration | Sensitivity |
|---|---|---|
| Upconverting nanoparticles [22] | 2.5 mM (about 42.5 ppm) | Not reported (estimated 0.0011 ppm−1) |
| Intensity variation-transmission [20] | 1.4 ppm | Not reported |
| Etched-tapered interferometer [21] | 14.2 ppm | 300 a.u./% (0.03 a.u./ppm) |
| PDMS composite [26] | 2.0 ppm | 0.0382 V/ppm |
| Proposed sensor-reflection | 0.1 ppm | 0.041 ppm−1 |
© 2020 by the authors. Licensee MDPI, Basel, Switzerland. This article is an open access article distributed under the terms and conditions of the Creative Commons Attribution (CC BY) license (http://creativecommons.org/licenses/by/4.0/).
Share and Cite
MDPI and ACS Style
Leal-Junior, A.G.; Frizera, A.; Marques, C. Low-cost Fiberoptic Probe for Ammonia Early Detection in Fish Farms. Remote Sens. 2020, 12, 1439. https://0-doi-org.brum.beds.ac.uk/10.3390/rs12091439
AMA Style
Leal-Junior AG, Frizera A, Marques C. Low-cost Fiberoptic Probe for Ammonia Early Detection in Fish Farms. Remote Sensing. 2020; 12(9):1439. https://0-doi-org.brum.beds.ac.uk/10.3390/rs12091439
Chicago/Turabian StyleLeal-Junior, Arnaldo G., Anselmo Frizera, and Carlos Marques. 2020. "Low-cost Fiberoptic Probe for Ammonia Early Detection in Fish Farms" Remote Sensing 12, no. 9: 1439. https://0-doi-org.brum.beds.ac.uk/10.3390/rs12091439
Note that from the first issue of 2016, this journal uses article numbers instead of page numbers. See further details here.