Secular Changes in Atmospheric Turbidity over Iraq and a Possible Link to Military Activity

1
Porter School of Earth Sciences and Environment, Department of Geography and Human Environment, Faculty of Exact Sciences, Tel Aviv University, Tel Aviv 6997801, Israel
2
Department of Physics, Michigan Technological University, Houghton, MI 49931, USA
*
Author to whom correspondence should be addressed.
Remote Sens. 2020, 12(9), 1526; https://0-doi-org.brum.beds.ac.uk/10.3390/rs12091526
Submission received: 21 April 2020
/
Accepted: 6 May 2020
/
Published: 11 May 2020
(This article belongs to the Special Issue Monitoring Pollution Sources Using Remote Sensing Technologies Current Understanding, Limitations and Future Directions of Research)
Abstract
:We examine satellite-derived aerosol optical depth (AOD) data during the period 2000–2018 over the Middle East to evaluate the contribution of anthropogenic pollution. We focus on Iraq, where US troops were present for nearly nine years. We begin with a plausibility argument linking anthropogenic influence and AOD signature. We then calculate the percent change in AOD every two years. To pinpoint the causes for changes in AOD on a spatial basis, we distinguish between synoptically “calm” periods and those with vigorous synoptic activity. This was done on high-resolution 10 km AOD retrievals from the Moderate Resolution Imaging Spectroradiometer (MODIS) sensor (Terra satellite). We found spatiotemporal variability in the intensity of the AOD and its standard deviation along the dust-storm corridor during three studied periods: before Operation Iraqi Freedom (OIF) (1 March 2000–19 March 2003), during OIF (20 March 2003–1 September 2010), and Operation New Dawn (OND; 1 September 2010–18 December 2011), and after the US troops’ withdrawal (19 December 2011–31 December 2018). Pixels of military camps and bases, major roads and areas of conflict, and their corresponding AOD values, were selected to study possible effects. We found that winter, with its higher frequency of days with synoptically “calm” conditions compared to spring and summer, was the best season to quantitatively estimate the impact of these ground-based sources. Surprisingly, an anthropogenic impact on the AOD signature was also visible during vigorous synoptic activity. Meteorological conditions that favor detection of these effects using space imagery are discussed, where the effects are more salient than in surrounding regions with similar meteorological conditions. This exceeds expectations when considering synoptic variations alone.
1. Introduction
The World Meteorological Organization defines a dust or sand storm as “An ensemble of particles of dust or sand energetically lifted to great heights by a strong and turbulent wind” (https://cloudatlas.wmo.int/dust-storm-or-sandstorm.html) [1,2]. Dust storms lead to contamination, salinization, and acidity of the soil surface, with a wide range of economic ramifications and health-related hazards [3]. They also change the radiative forcing balance, impact the chemical structure of the atmosphere by interacting with atmospheric gases and clouds [4], and affect atmospheric turbidity. The latter is used to assess air pollution, as well as to estimate the attenuation caused by solar radiation [5]. Our main question in this paper is whether intense and prolonged military activity in Iraq increased the intensity of dust storms and affected subsequent long-term changes in aerosol optical depth (AOD), observable from space.
Iraq, or Lower Mesopotamia, is considered to be one of the world’s largest dust sources, with a high annual number of dust-storm days [6,7,8,9]. Sissakian et al. [9] noted that during the course of one year, the Iraqi Ministry of the Environment recorded 122 dust storms and 283 dusty days. The intense dust production in this region can be explained by a combination of factors, including climatic conditions, wind patterns, topography, and anthropogenic impact. For example, soil surfaces disturbed by extended human activity may be especially susceptible to wind erosion and dust generation [10]. However, the exact causes remain controversial.
Indeed, the debate concerning the impact of the Middle East war zone on dust-storm activity shows no signs of abating. Opposing viewpoints have been expressed in recently published papers, as well as in the mainstream media. One side argues that increased dust-storm activity is caused by human factors, such as the abandonment of agricultural land and reduced irrigation [11,12,13,14,15], while the other side counters with favorable meteorological conditions as the cause [16,17,18,19].
It seems plausible that intense military traffic over unpaved arid surfaces, combined with abandoned agricultural lands, might promote, if not initiate, dust emissions. There is an increasing number of scientists becoming involved in the timely exploration of the impact of the Iraq War on air pollution levels in the region. Recently, Lelieveld et al. [20] and Krotkov et al. [21] analyzed global NOx and SO2 concentrations and showed that the Iraqi War conflict caused dramatic changes in the country. Over the Persian Gulf, the authors reported that satellite-derived SO2 levels increased between 2005 and 2010 and then decreased between 2010 and Lelieveld et al. [20] quantified NO2 over Baghdad, showing an over 10% per year increase until 2011, followed by a decline at nearly the same rate. Increasing dust-storm frequency ascribed to military activity was first reported by Oliver in 1945 using ground-based observations [22]. This author reported that the frequency of dust storms before World War II was eight per year in 1939–1940, rising to 51 in 1941–1942, falling to 20 in 1943–1944, and declining to four in 1944–1945 [22].
Definition of the Problem and Addressed Questions
Observation and Question 1: We observed an increase in the average AOD value (in all seasons) over Iraq from 2004–2012 (Figure 1). Was this induced by the anthropogenic impact or was it a result of changing meteorological conditions? To study the possible link between anthropogenic impact and satellite-derived AOD, we compared monthly AOD averages above Iraq and seven adjacent countries with similar prevailing synoptic conditions and identified periods with the least synoptic impact.
Observation and Question 2: Comparing Iraq to other countries in the region by calculating their monthly average AOD values during 2000–2018, we observed that Kuwait and Saudi Arabia also showed an increasing trend in AOD, during the same time period as that seen in Iraq (Figure 2). Whereas the amplitude was larger for Kuwait, in Iraq the amplitude was much larger than for Saudi Arabia. However, the largest decrease in AOD after 2011 was observed for Iraq. Furthermore, Iraq exhibited a different temporal AOD pattern compared to Jordan and Syria. Is it possible to identify a local anthropogenic impact on AOD levels despite the strong regional synoptic impact and AOD seasonality?
To answer both of these questions, we mapped possible sources of anthropogenic pollution in Iraq (US bases and camps). Next, we sought to decouple the synoptic effects from the local background conditions. Here we studied the Iraqi War zone, with particular attention to dust storms and corresponding changes in air turbidity and tried to quantitatively estimate the possible anthropogenic impact.
2. Theoretical Estimation: The Impact of Anthropogenic Signal on AOD
Before embarking on our detailed study, we present a back-of-the-envelope calculation to illustrate the plausibility of observing the effect on AOD from space. We employed a simple extinction (AOD) vs. mass loading (M) relation; as an example, in Cachorro and Tanré [23] for the visible channel of 550 nm. The relation yields AOD = 0.9 M5/6, where M is the mass loading in grams per square meter (g/m2) and 15 daily values were used for the 1987 campaign. To have a reliably detectable effect from space (conservatively, 0.1 change in AOD), M must change by about 0.1 g/mTaking 10,000 m for the height of an atmospheric column, we obtain a threshold of about 1 kg/m2 base of the atmospheric column, for an observable effect. Thus, the question becomes whether continued military activity can eventually add about 1 kg of fine particulate matter per column to be observable from space.
A plausibility of a simple relation between M and AOD is suggested by the following argument. PM2.5 or PM10 particles are much larger than the relevant (light) wavelength and therefore their extinction cross-section can be approximated as twice the geometric one. Therefore, the AOD scales as the total particle surface area, and one would expect the AOD to scale as volume2/3 or M2/. However, empirically, as Cachorro and Tanré [23] show, the exponent varies between 2/3 and 5/6, depending on the size distribution. In terms of the relevance of atmospheric residence time, the latter is practically infinite, or at least lasts throughout the duration of the alleged effect (several years in our case). Physically, this holds when the particle drift (settling) speed in the gravitational field is smaller than the turbulent (or molecular) diffusion’s characteristic velocity. This is the case for, say, PM2.5 or PM10, and this is the case discussed in our paper.
If we rely on a WikiLeaks source (Table 1) that reported on the presence of nine squadrons, each with 18–24 aircrafts and several helicopters, taking off and landing twice a day, along with tanks, etc., the emitted pollution mass is orders of magnitude greater than the required threshold amount per square meter and readily compensates for the potentially sparse pixels. Note that the takeoff of a single aircraft or helicopter produces ~1 kg of 10 µm diameter particles (PM10) [24,25,26,27,28].
3. Estimation of AOD Using Satellite Data: General Methodology
There were four major steps in our analyses. First, we analyzed a time-series of AOD and its spatial pattern over the Middle Eastern countries using high-resolution 10 km Moderate Resolution Imaging Spectroradiometer (MODIS) satellite images during the entire study period (2000–2018). Second, we differentiated between synoptically calm and stormy periods. Third, we estimated the percent change on a pixel basis during all studied years for Middle Eastern countries, with a special focus on Iraq. Then, we mapped possible sources of ground anthropogenic pollution, such as highways, military camps, and battlefields. At this stage, we identified locations with the largest change in AOD during different periods and compared these results to the ground sources. Finally, in the fourth step, we analyzed spatial and temporal AOD patterns. Below is a detailed description of our analyses.
3.1. Study Periods
The Iraq War was known as Operation Iraqi Freedom (OIF) from March 2003 to September 2010, and then renamed Operation New Dawn (OND) in September 2010 (until December 2011) to reflect the reduced role of US troops. OIF involved military operations, including the extensive deployment of US and coalition force military personnel. Here we study the change in AOD and its standard deviation (stdev) between different periods, defined as: Period 1 (1 March 2000–19 March 2003), Period 2 (20 March 2003–31 December 2011), and Period 3 (1 January 2012–31 December 2018).
It should be noted that from 2003 to 2005, the war was between the US-led invasion and Iraqi forces, as well as Islamist and nationalist insurgents. In addition, in early 2006, Iraq’s conflict became a fight between Sunni insurgents and former Saddam Hussain loyalists, whereas in 2014, the Iraqi insurgency escalated to a civil war in northern Iraq, leading to the rise of ISIL (The Islamic State of Iraq and the Levant), also known as ISIS (the Islamic State of Iraq and Syria).
3.2. Study Area
The climate in Iraq is characterized by long, hot, and dry summers, followed by short, cool winters. Summer is characterized by the largest number of dust storms [8,9,29,30,31]. These dust storms are caused mainly by variations in the pressure gradient, coming from the Iraqi-Syrian desert [31,32,33]. Storm frequency tends to be higher in the southeast, because of the increasing fetch of the prevailing northwesterly wind, and dust may be carried down to the Persian Gulf [34]. On regional and local scales, shamal and sharki winds generate sandstorms lasting from hours to days, which result in suspension and subsequent transport of dust throughout the country [35,36,37].
Despite the relatively large distances between Iraq and the other Middle Eastern countries considered in our analyses, from a meteorological perspective, Saudi Arabia, Egypt, and central-southern parts of Iraq are all dominated by the ‘warm desert climate (Bwh)’ class, based on the Köppen climate classification system [38]. Prospero et al. [6] used Total Ozone Mapping Spectrometer measurements and confirmed that over the entire Arabian Peninsula and Middle Eastern regions, dust storms are characterized by a distinct annual cycle, with low activity during the winter, strengthening between March and April, and peaking in June and July [39,40].
3.3. Building a Database: The Iraq War in Official Reports and Publicly Available Sources
The datasets created and/or downloaded for our study are summarized in Table 1.
For circumstantial evidence of the intensity of the military activity, we examined the list of coalition military operations detailed on the publicly available Wikipedia page at https://en.wikipedia.org/wiki/List_of_coalition_military_operations_of_the_Iraq_War. We selected all geographical locations where the report specified that a military battle occurred and mapped all of those locations using ArcGIS (version 10.3). We assumed that during the military fighting, the desert surface was subjected to mechanical disturbances; however, to remain conservative, we ignored all other military operations, such as raids to secure roads, humanitarian aid, and operations designed to search and seize bomb makers, weapon caches, etc.
Various sources confirmed the large presence of US army and coalition forces in Iraq. The official reports of Brookings Institution (“Iraq Index”, https://www.brookings.edu/iraq-index/) stated that the number of US ground troops fluctuated between 140,000 and 183,000 until May 2009, with 30,000 extra troops in the capital of Baghdad. In 2007, there was a massive increase in US-led troops on the ground, peaking at 170,300 in November, whereas throughout 2008, the conflict largely de-escalated [41]. The total Iraqi security forces increased during 2003–2011, with 30,000 in June 2003, 145,300 in June 2005, and 670,000 in March 2011 (https://www.brookings.edu/iraq-index/). The size of the Iraqi Army at the time of the US invasion was 375,000 (disbanded in 2003).
We also used real-world datasets containing circumstantial evidence of land-surface damage, such as the Uppsala Conflict Data Program’s Georeferenced Event Dataset (http://ucdp.uu.se/) [42]. We mapped the locations of all military camps (during 2003–2011, pixel number = 95). Next, we mapped the locations of airports and all known military air bases (https://data.humdata.org/dataset/ourairports-irq). We treated the locations of oil fields as anthropogenic signals (http://www.globalsecurity.org/military/world/iraq/maps-demo.htm) and determined whether they overlayed the military signal. We further mapped the coalition forces’ path of invasion based on publicly available data at https://www.vox.com/a/maps-explain-crisis-iraq.
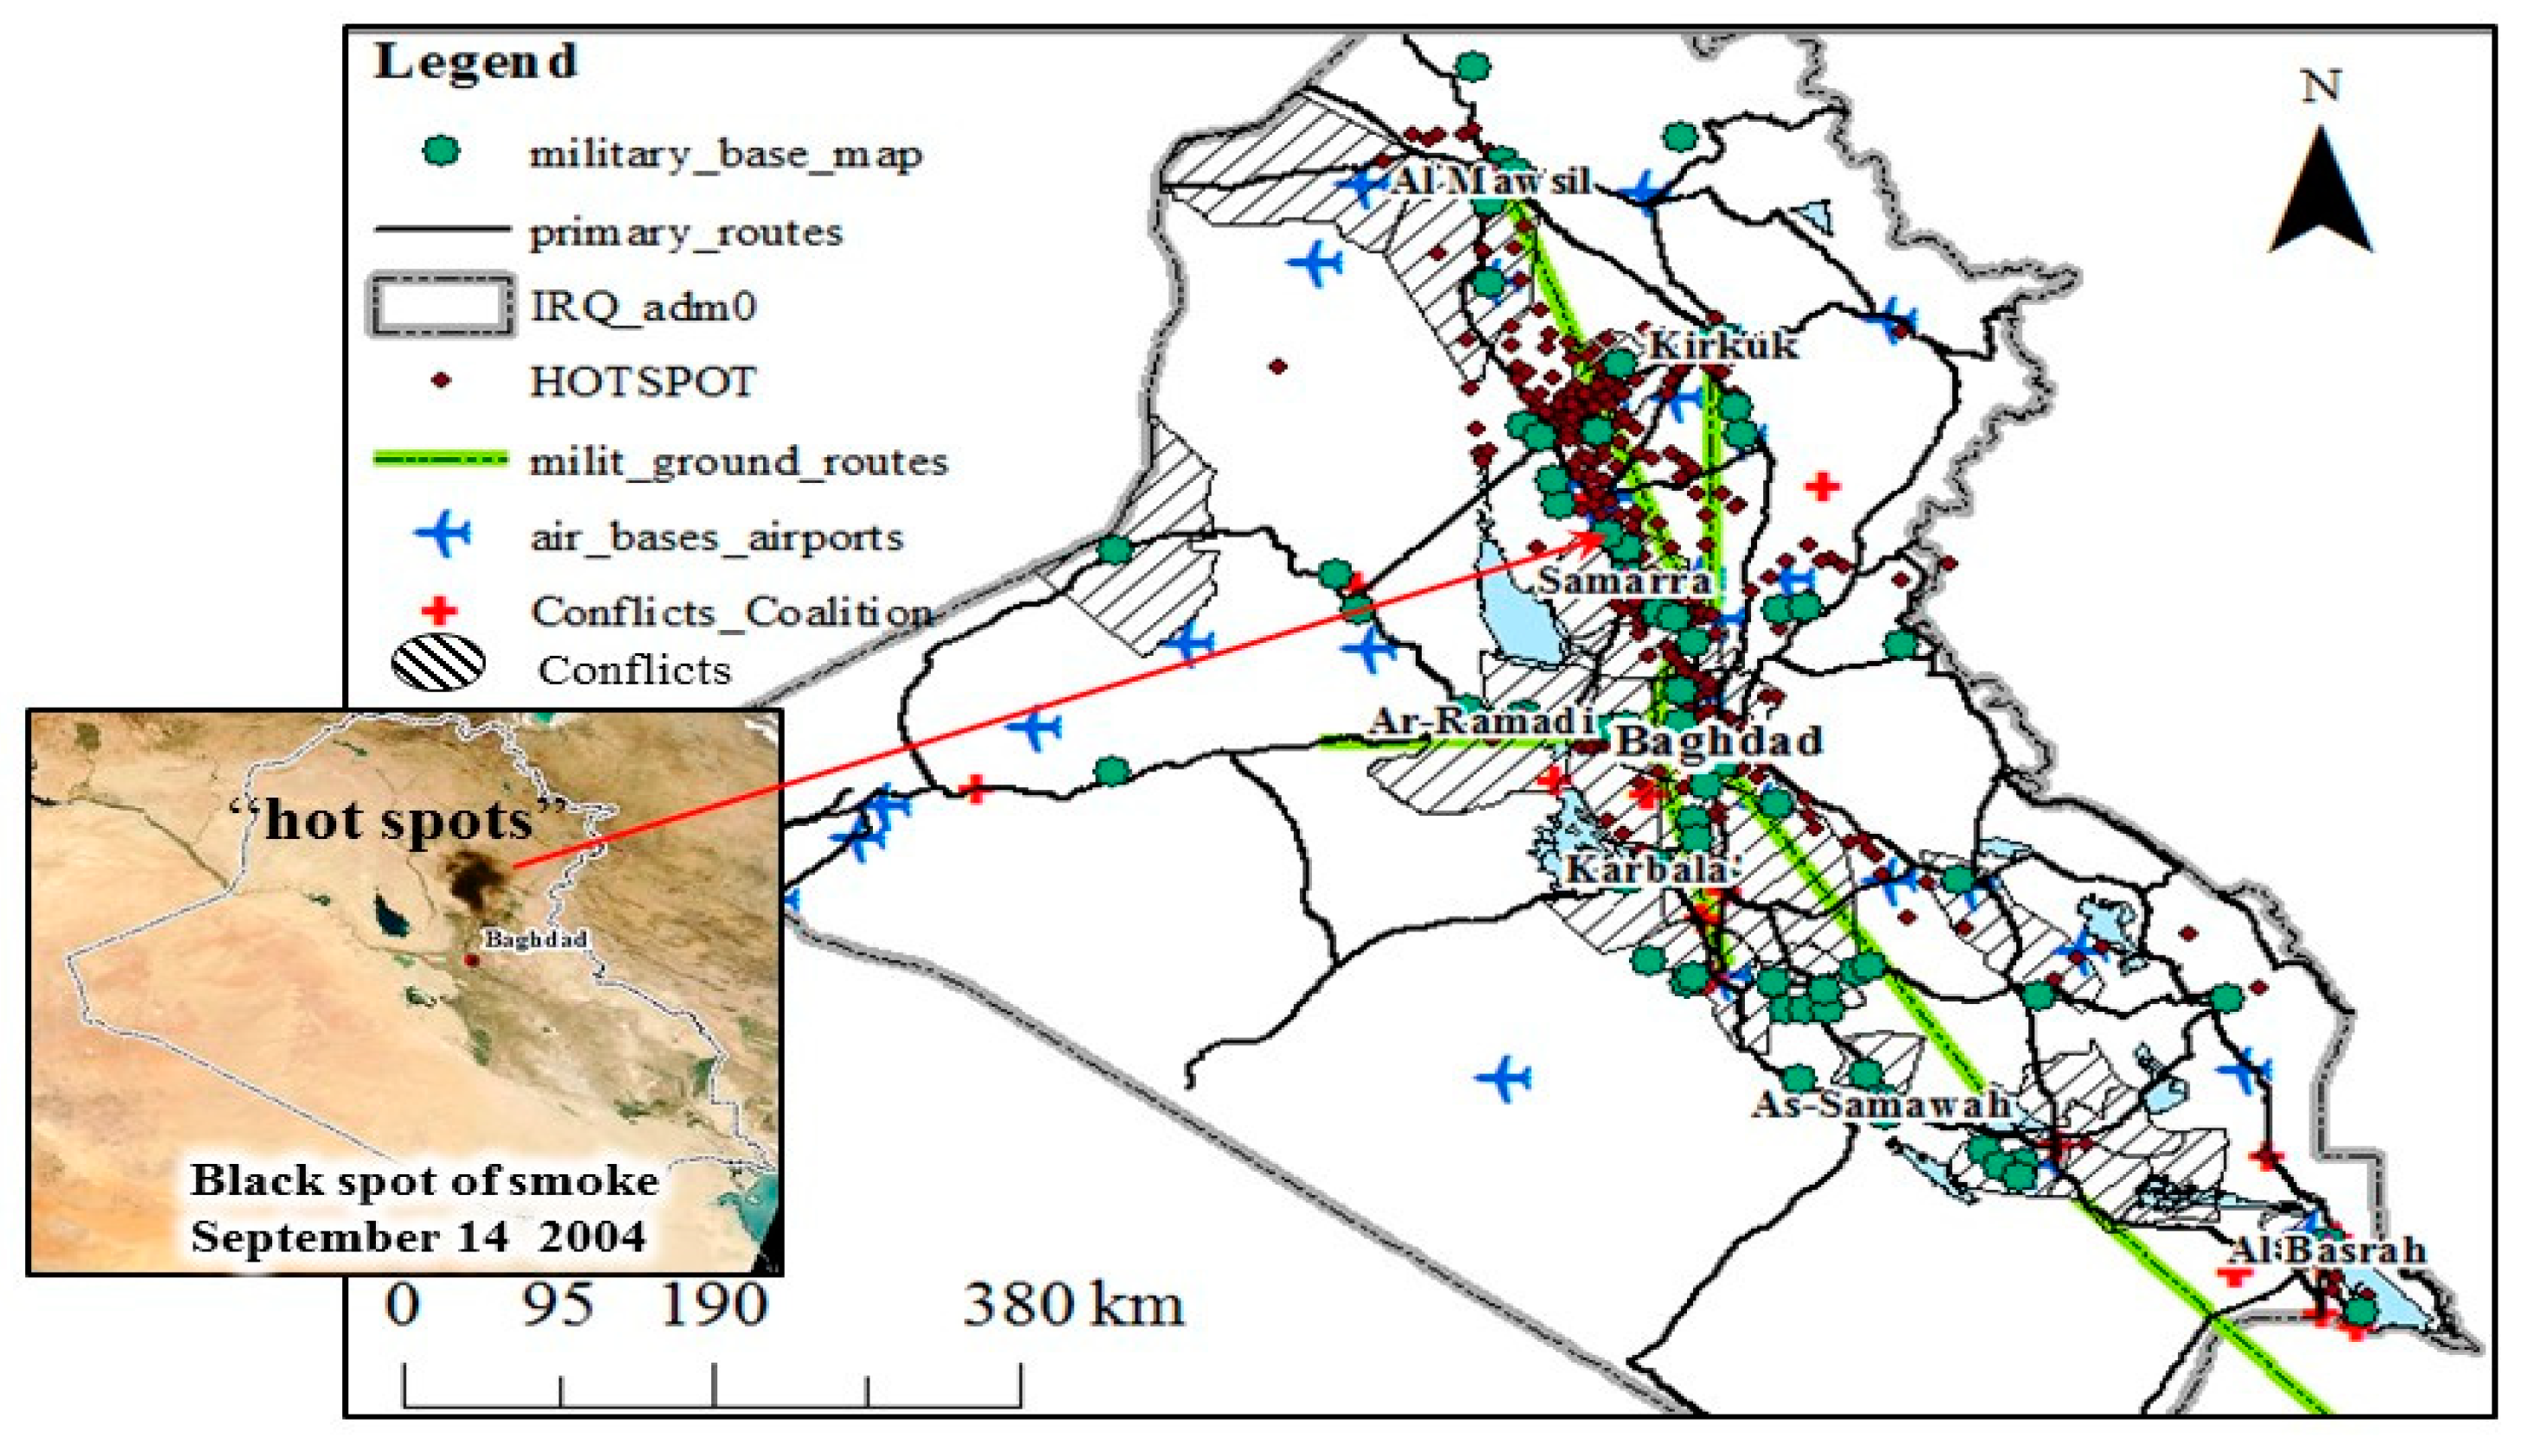
Finally, we conducted a comprehensive analysis of daily images observed by MODIS Terra (1030 h) and Aqua (~1330 h) platforms (MOD21KM reflectance product), searching for evidence of smoke clouds as confirmation of ground anthropogenic activities. An example of such images and their representative smoke locations is shown in Figure 3. Smoke clouds can be indicative of bombings or explosions. In general, the type of fuel and how hot it burns define the color of the plume. For example, a hotter fire will convert more fuel into elemental carbon, forming tiny particles that absorb light and appear in the sky as black smoke. These black spots of smoke can indicate the presence of military activity. We note, however, that all visible large smoke clouds can be attributed not only to military origin (e.g., explosions, smoke caused by heavy clashes between sides, air strikes, tank battles, etc.) but also to oil fires and burn pits. We assumed that if these hot spots are dynamic in time and space they might serve as evidence of military activity on the ground surface, whereas static hot spots were suspected of being of natural origin.
3.4. Satellite-Retrieved AOD Data
We used monthly averaged MODIS Level 2 (MOD04) Collection 6.1 aerosol data from the Terra platform, produced at a spatial resolution of 10 km2 × 10 km2 (at nadir view angle). The data were downloaded in GeoTIFF format from the National Aeronautics and Space Administration (NASA) Earth Observations data source (Table 1). The aerosol product included the Deep Blue algorithm to obtain AOD over bright land areas. We used a combined Deep Blue–Dark Target (SDS AOD_550_Dark_Target_Deep_Blue_Combined). The merged product was a single file with different parameters (AOD_550_Dark_Target_Deep_Blue_Combined) comprised of high-quality Dark Target (quality assurance (QA) = 2 and 3 over land, and QA >0 over the ocean) and Deep Blue (QA = 2 and 3, with 2 = good and 3 = very good). More details about the MODIS AOD retrieval are reported in Remer et al. [43,44] and Levy et al. [45].
3.5. Decoupling Regional Synoptic and Local Anthropogenic Impact
We sought periods during which the synoptic impact was minimal, to identify the possible anthropogenic impact; we therefore distinguished between synoptically stormy and calm years and seasons. The following analyses were carried out.
We calculated the percent change in AOD on a two-year basis across the period 2000–For each country in the region, we used the yearly averaged AOD. We started the estimation with percent change between 2000 and 2001, 2001 and 2002, and so on, up to that between 2017 and 2018. We assumed that an increase in AOD in all countries would represent a synoptic-dominated feature, whereas an increase for only a particular country would imply a larger contribution from local conditions. Similar analyses can be conducted for AOD decreases between the years. Specifically, a decrease in AOD for most countries would better indicate the impact of local sources, as synoptic conditions are likely to diminish over that time. Here, we averaged all pixels and calculated the percent change in AOD for each country for all time periods. All countries were then compared to Iraq.
For our analyses of spatial patterns, we largely selected periods when most of the countries exhibited an average “negative change” or decrease in AOD. We followed the simple logic that the synoptic conditions in the region were relatively uniform, with no large synoptic impact. We analyzed periods with at least 10%–20% average decrease in AOD for most countries. These years were compared to high-synoptic-impact years. We also investigated the change in “war” and “post-war” periods for years with both calm and severe storm conditions.
3.6. Searching for a Possible Local Pollution Source Contribution to AOD
First, we calculated monthly, seasonal, and yearly AOD and AOD stdev averages above Iraq during 2000–2018 and compared them to adjacent countries in the region. Next, we generated the time-averaged AOD maps and their stdev in each grid cell over the three periods (defined in Section 3.1). Specifically, analyses of stdev might provide additional support for a contribution from local sources. It has been shown that during regional pollution transport, the AOD variance is relatively low [46,47]. Kishcha et al. [46] studied seasonal variations of the AOD stdev at six AErosol RObotic NETwork (AERONET) sites, supported by Modern Era Retrospective analysis for Research and Applications (MERRA) aerosol reanalysis (version 2, MERRA-2), for a 15-year period (2002–2018). The authors concluded that in the case of remote aerosol dominance, the AOD stdev is almost three times lower than in seasons with a predominance of local sources.
Next, we estimated the percent change in AOD over military bases. The AOD values of all pixels where military bases had been located were extracted. The percent change for all of these locations was estimated on a seasonal basis. The change in AOD values was analyzed between Periods 1 and 2 and between Periods 2 and 3. In addition, the percent change was estimated for the entire country.
4. Results
4.1. AOD Change during Synoptically Calm vs. Stormy Periods
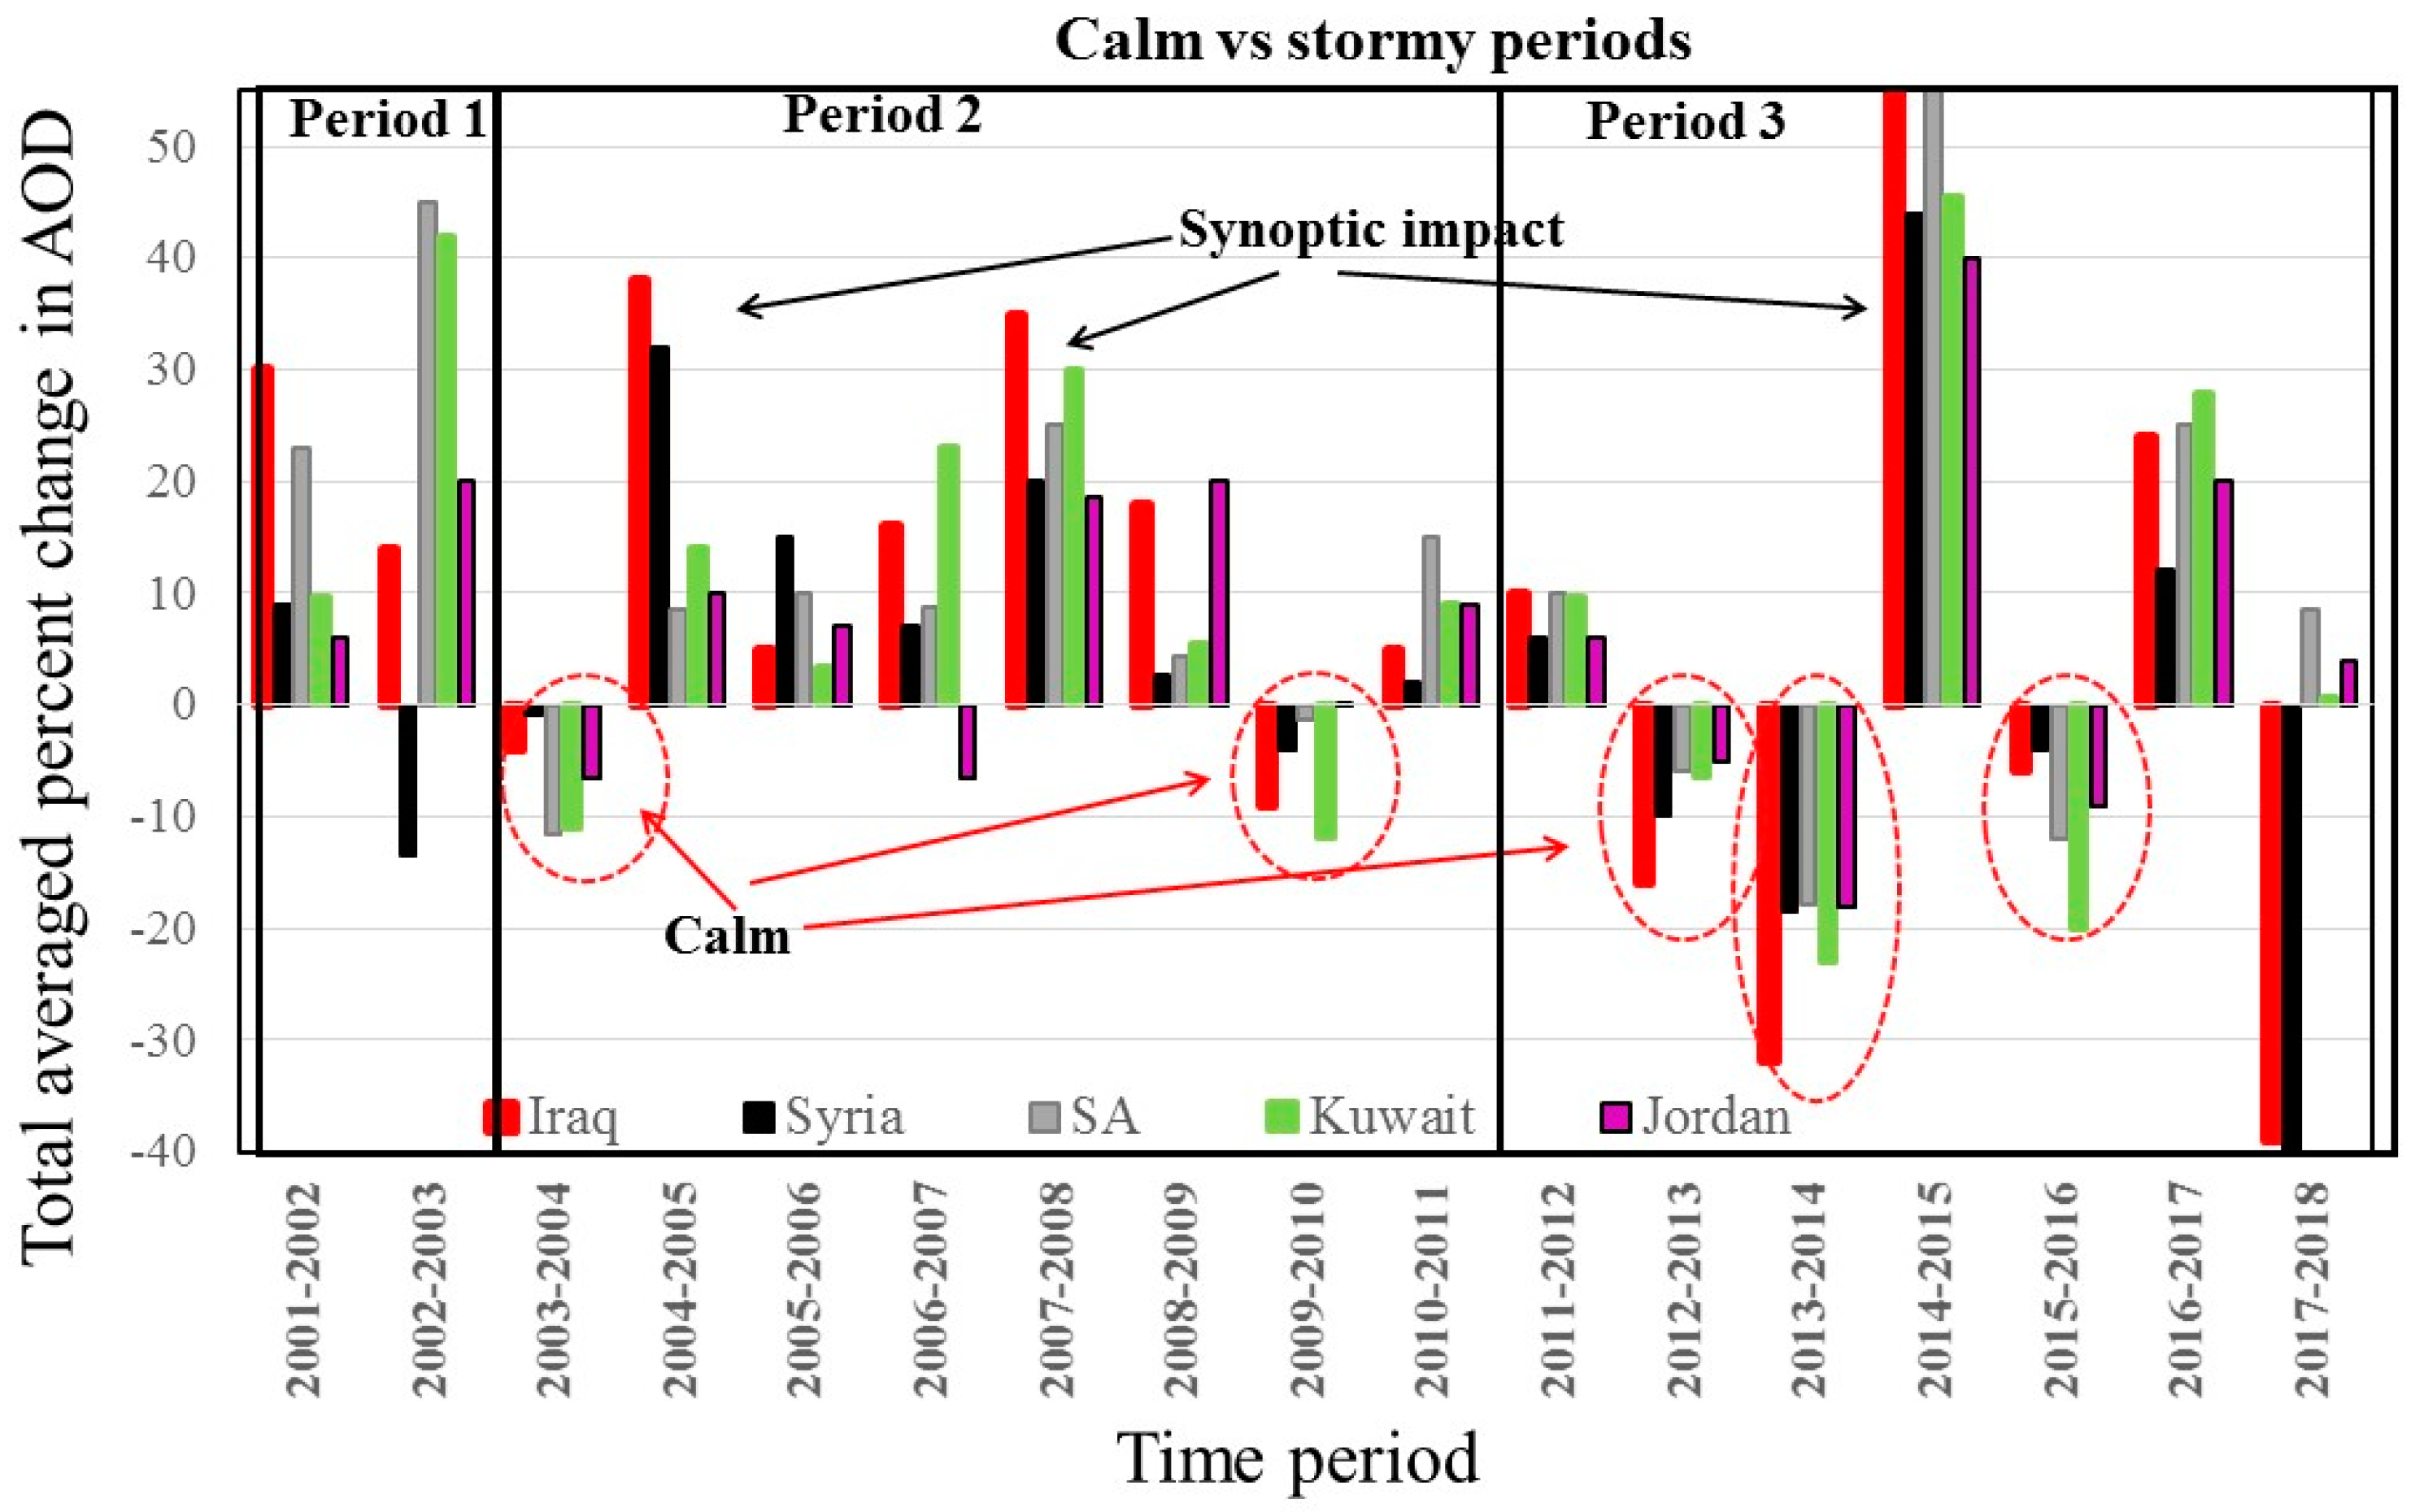
The average percent change in AOD for different time frames is shown in Figure 4. There are periods with relative increases in AOD and those with relative decreases. The calm periods are circled in red and indicated by red arrows, whereas years with synoptic impact are shown by black arrows. There was a large increase in AOD in 2007–2008 for most of the countries and in 2008–2009 for Iraq and Jordan. These years are known as periods of extensive drought conditions and severe dust storms in the region [9,12,48]. Next, we examined the spatial pattern variability during the selected time periods with a special emphasis on locations of spatial change and explored whether these changes could be attributed to local sources or to synoptic patterns.
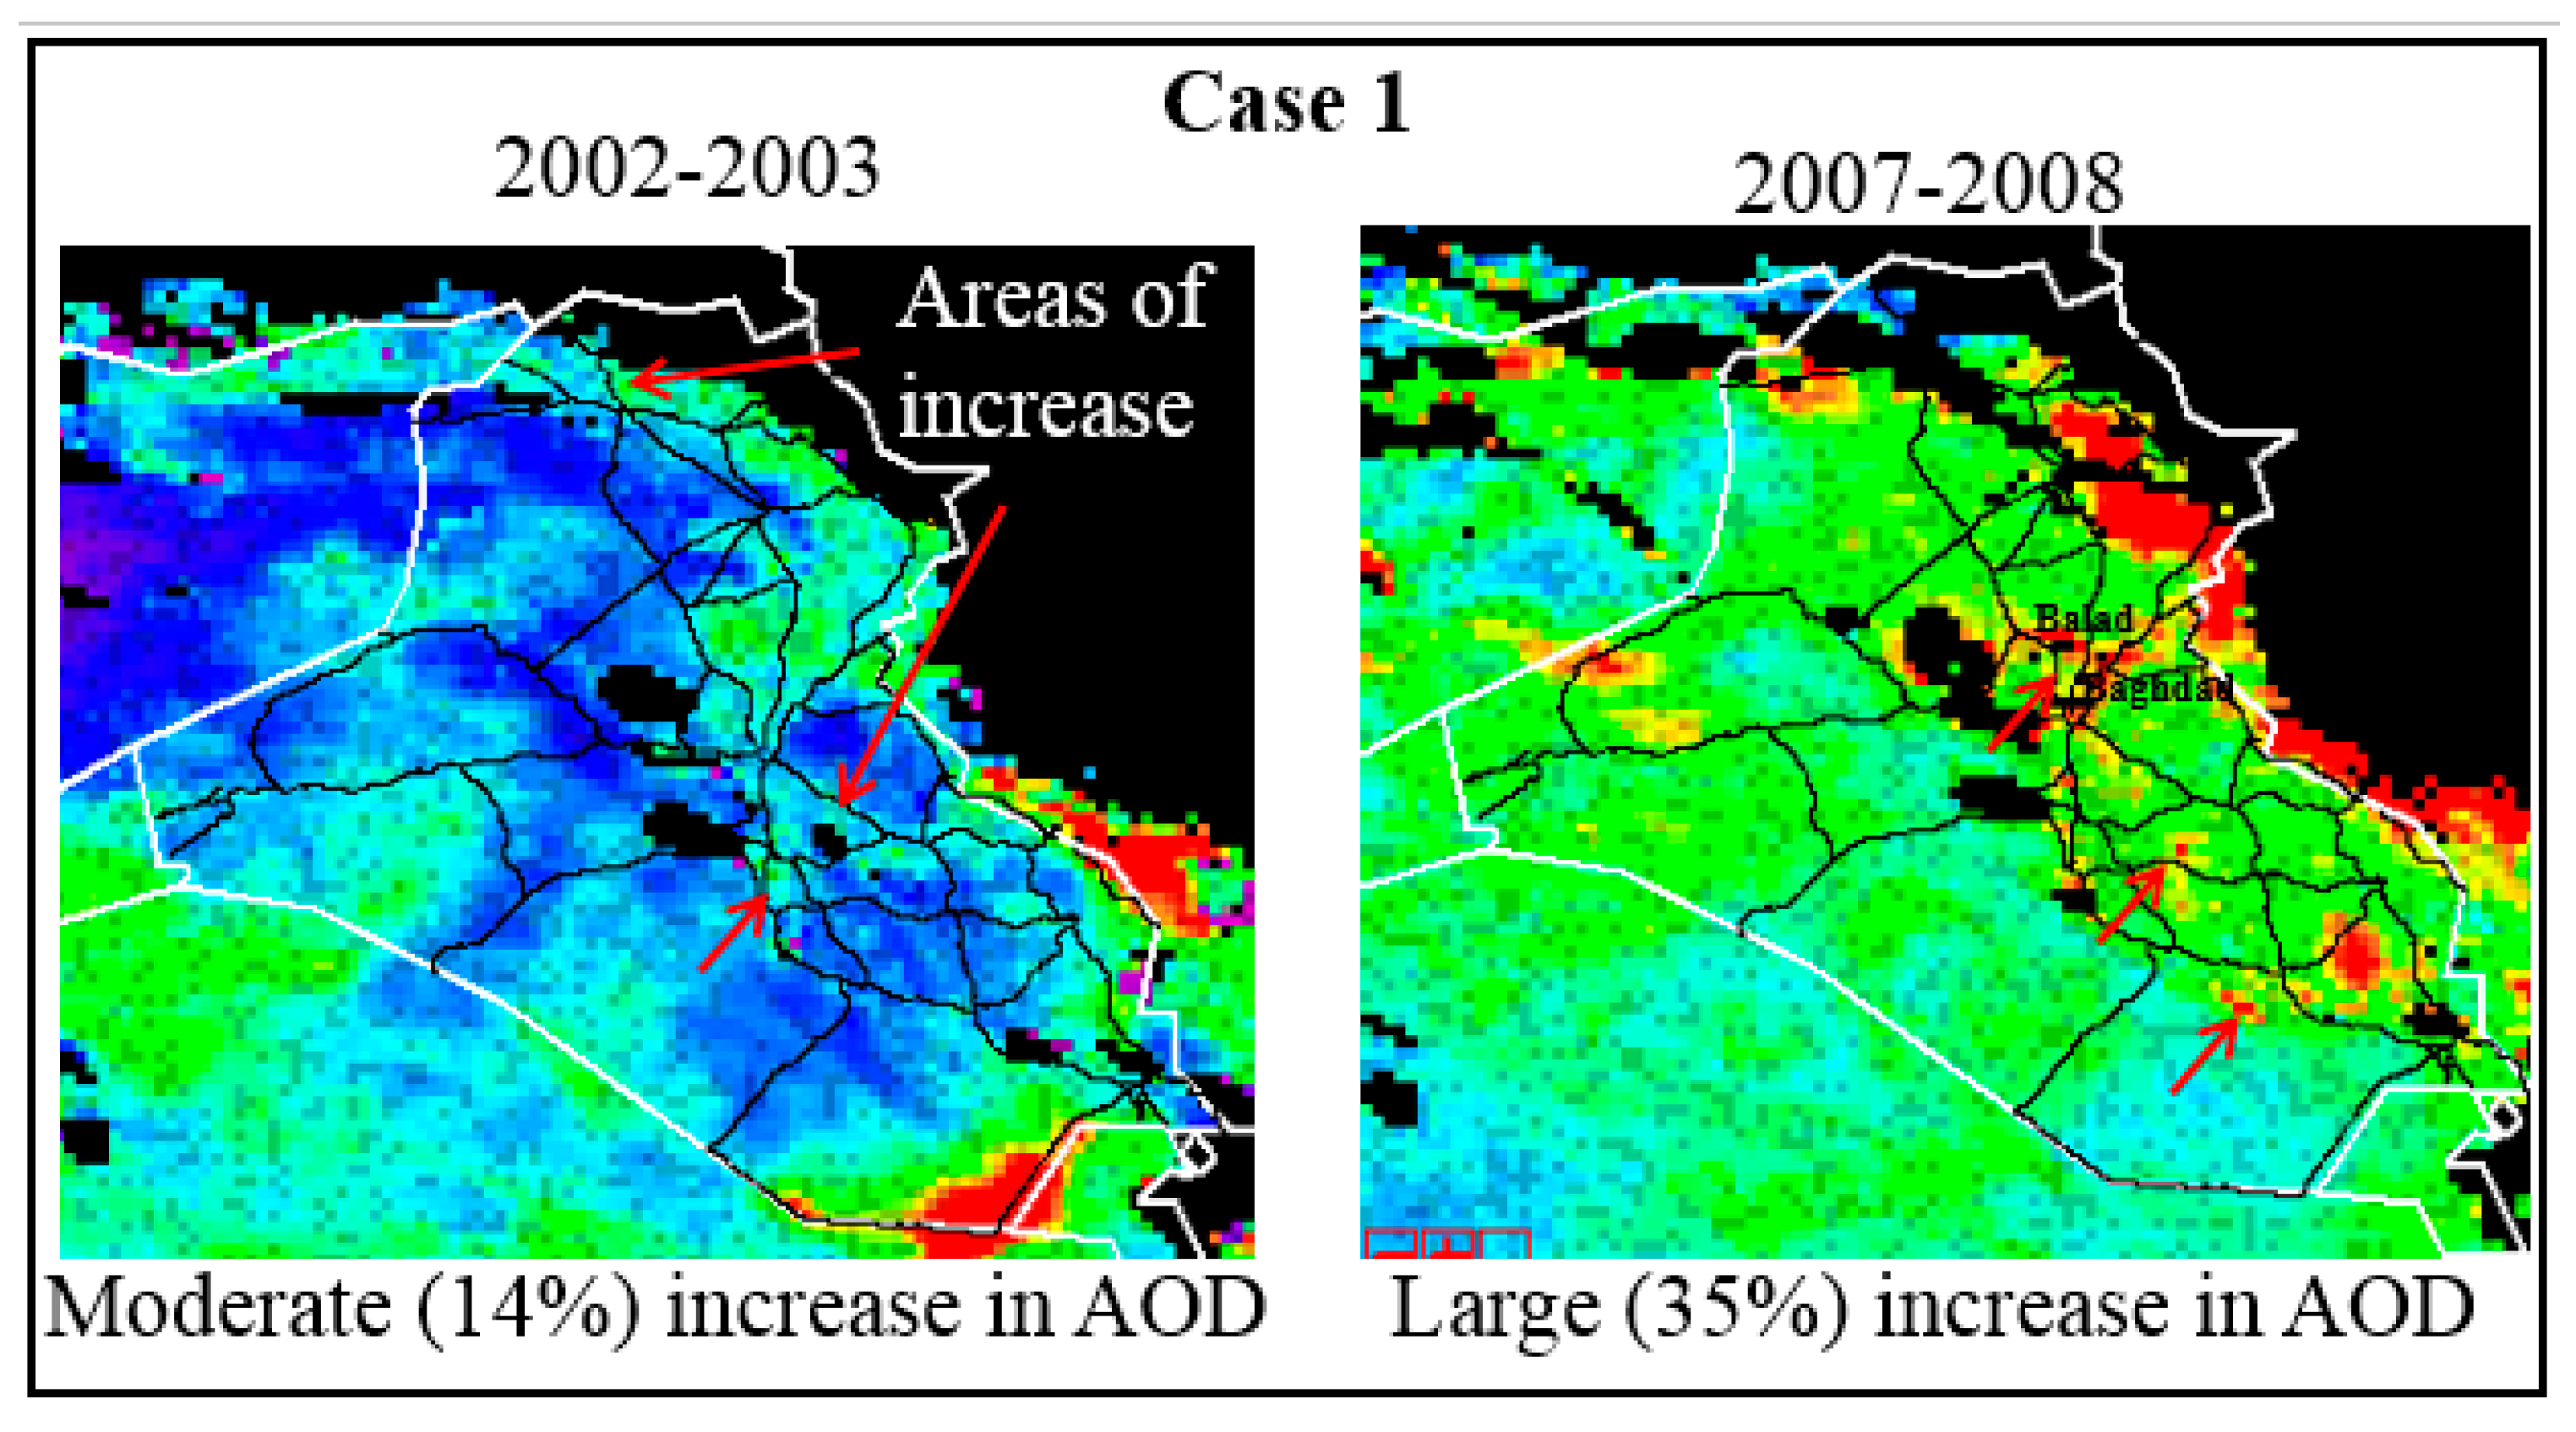
Figure 5 shows the average percentage change for selected time periods: “in war” and “post-war”. Here we present three case studies: a large synoptic impact during the period of military presence (Case 1); a small synoptic impact during the same time period for comparison (Case 2); and a reference “post-war” period showing a general decrease in AOD (Case 3).
Case 1 shows moderate (14%) to large (35%) increases in AOD during two periods: (i) the transition from “before US troop entrance” in 2002 to US presence in 2003, and (ii) an “in-war” increase between 2007 and 2008. As can be seen, along the major roads and in urban areas, there are locations with an over 100% increase in AOD, specifically near Baghdad, in the areas of Balad, Al-Taji, and Baqubah, next to the Al-Samawah military bases and others, as shown in Figure 3. The enhanced AOD signal in Baqubah is of special interest and the result is not surprising: the city and its province became the headquarters of Al Qaeda in Mesopotamia, with the worst fighting during 2007–2008 and a large number of military operations (e.g., sources report the involvement of about 10,000 US and Iraqi troops in the battle of Baqubah in 2007). The enhanced AOD signal suggests that during large synoptic events, uplifted anthropogenic particles may reside longer in the atmosphere. For example, with aerosols of 1 µm particle size, the period of resuspension may reach 0.95–9.5 years, whereas fine clay particles can be lifted to a height of 77 km (the threshold wind velocity is 15 m/s [49,50,51].
We can state that dust-storm periods better highlight the ground anthropogenic impact. However, under these conditions, it is difficult to quantitatively estimate the anthropogenic impact on the AOD loads (110% increase for the “hot spot” locations compared to 50%–60% in adjacent areas). A similar trend was evident in all of the other images with large AOD increases.
Case 2 shows examples of a relatively large estimated decrease in AOD. Contrary to Case 1, it is easier to quantitatively estimate the change in AOD over certain locations during relatively “calm” synoptic years. As can be seen, during 2003–2004 and 2009–2010, there was an average estimated increase of 7.3% and 7.8%, respectively, in AOD over the highways.
Case 3 shows post-war years and years that were relatively calm synoptically (as evidenced from Figure 4). There is a large decrease in AOD over locations that, during the in-war periods, had exhibited increased AOD values. The “decrease” pattern is visible despite the distinct signature of synoptic dust plumes that cover relatively larger areas.
4.2. Seasonal Pattern of AOD
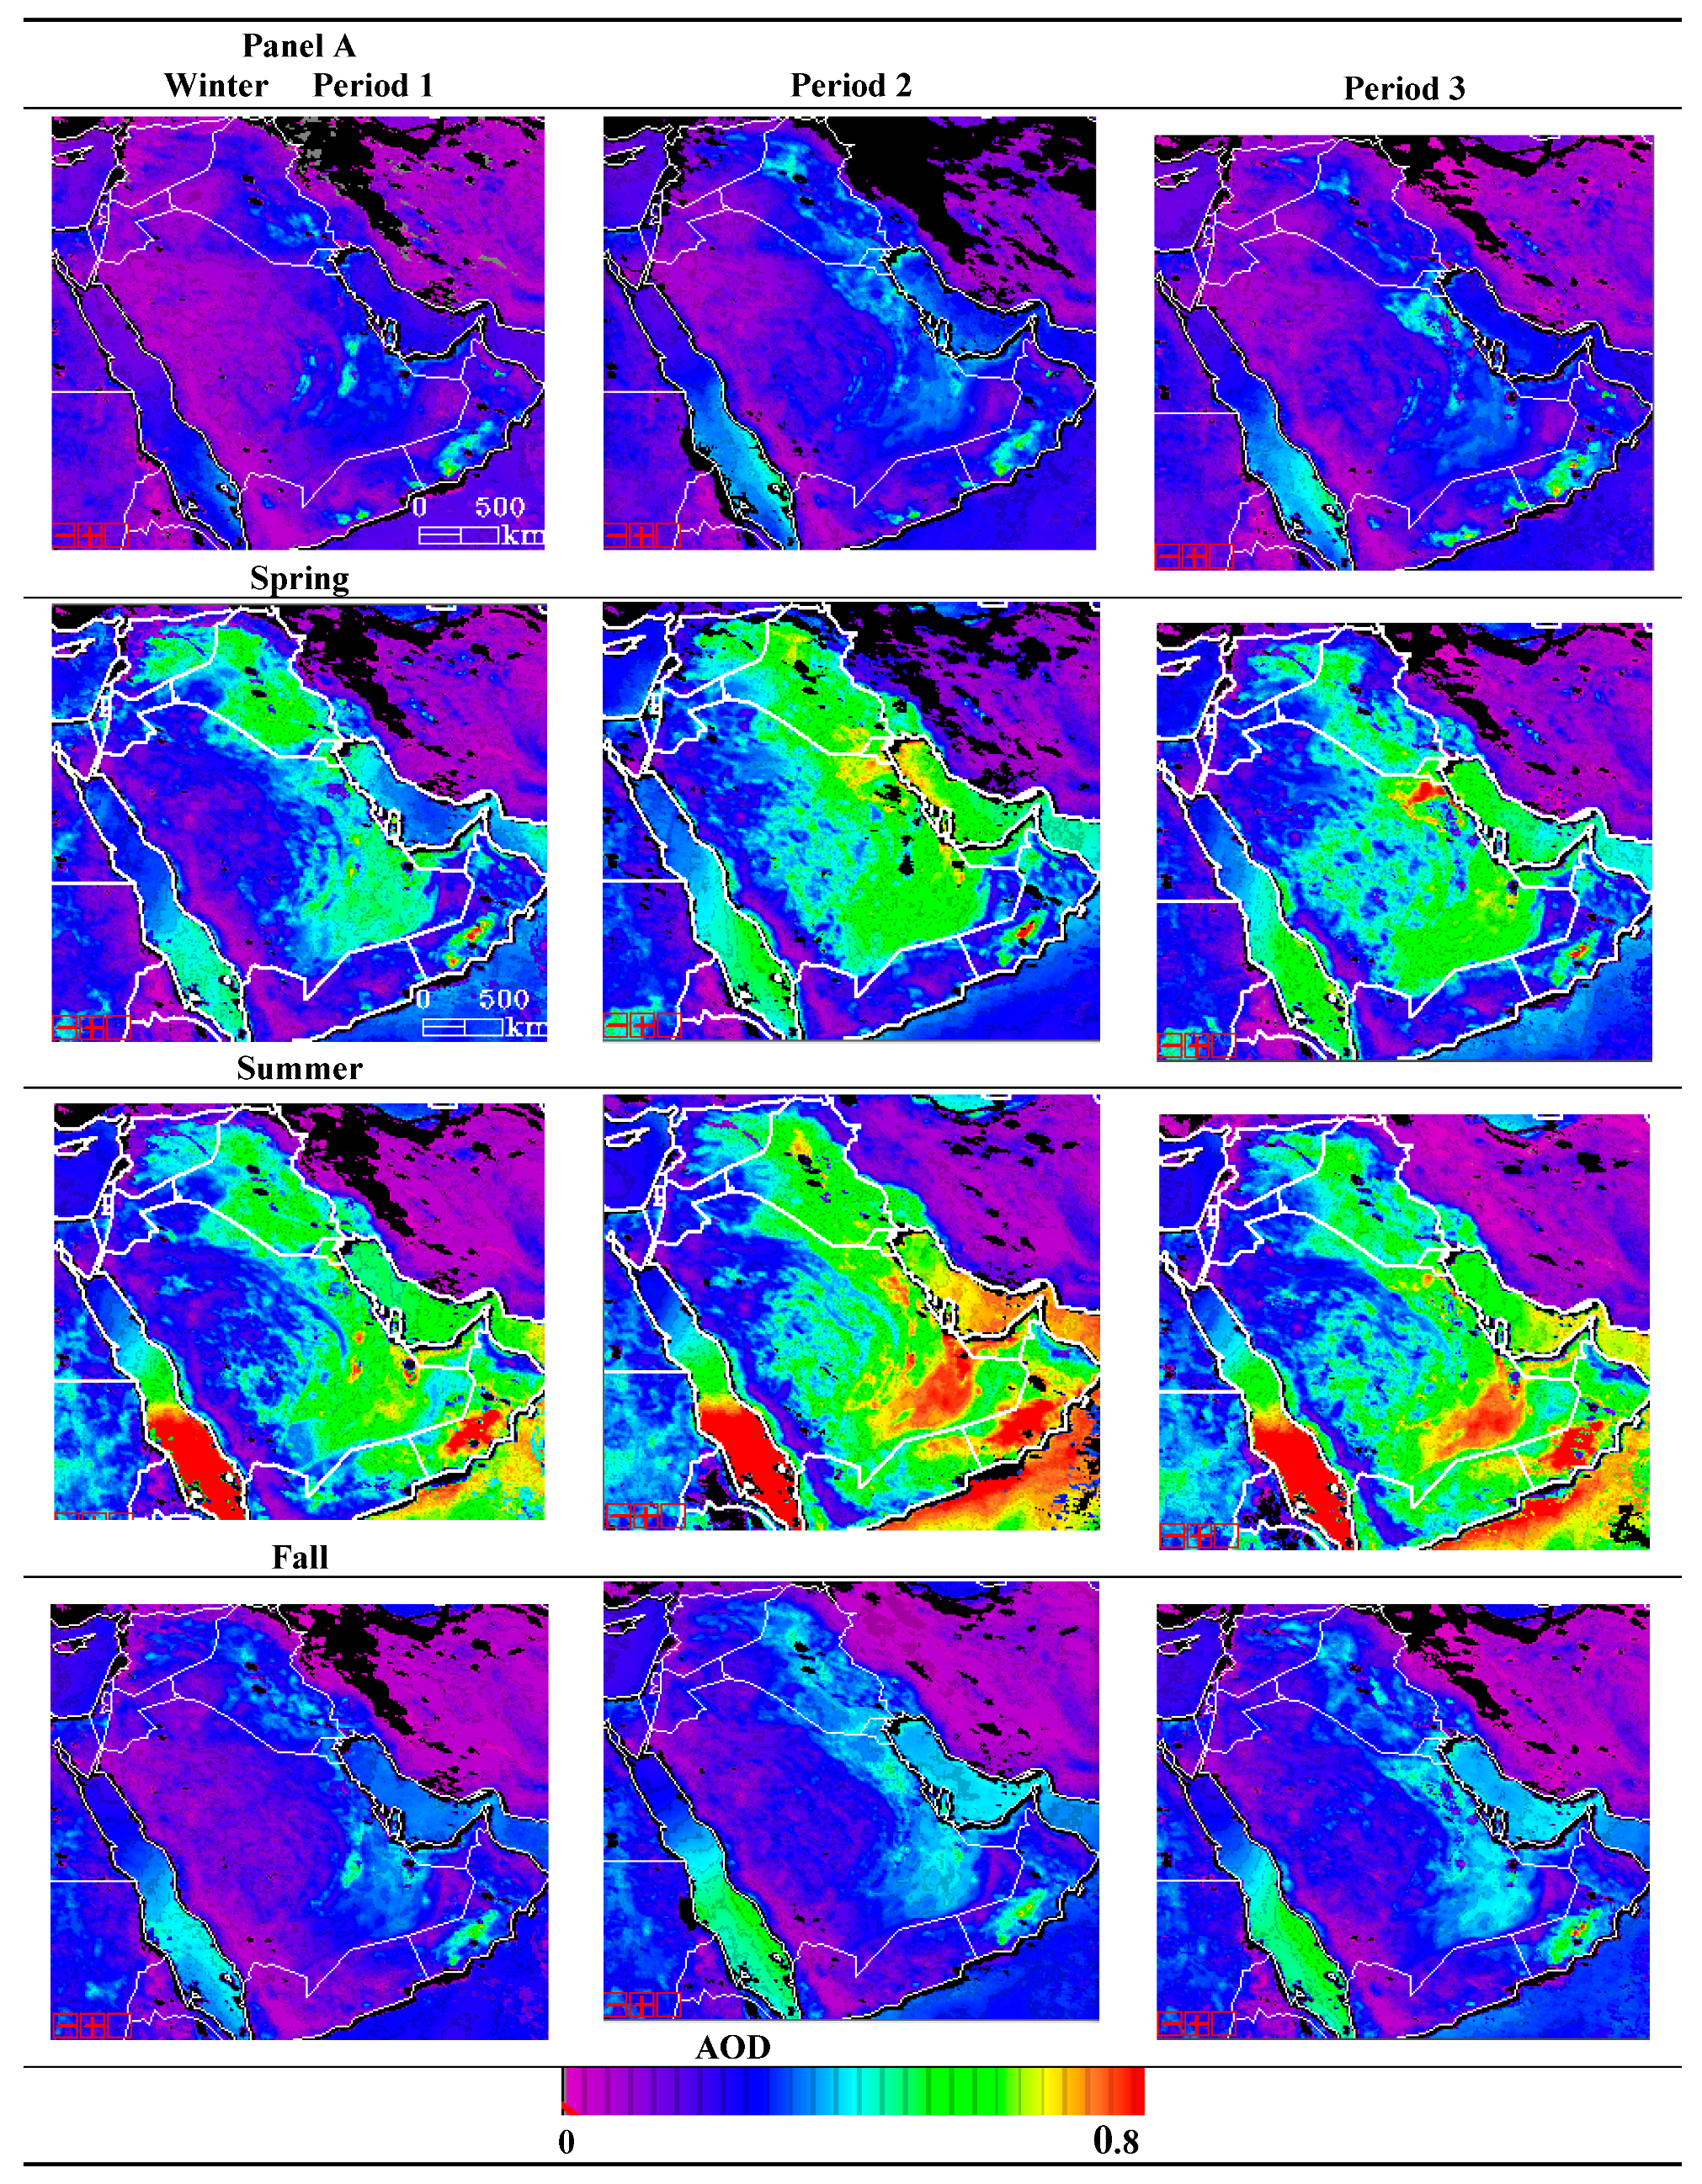
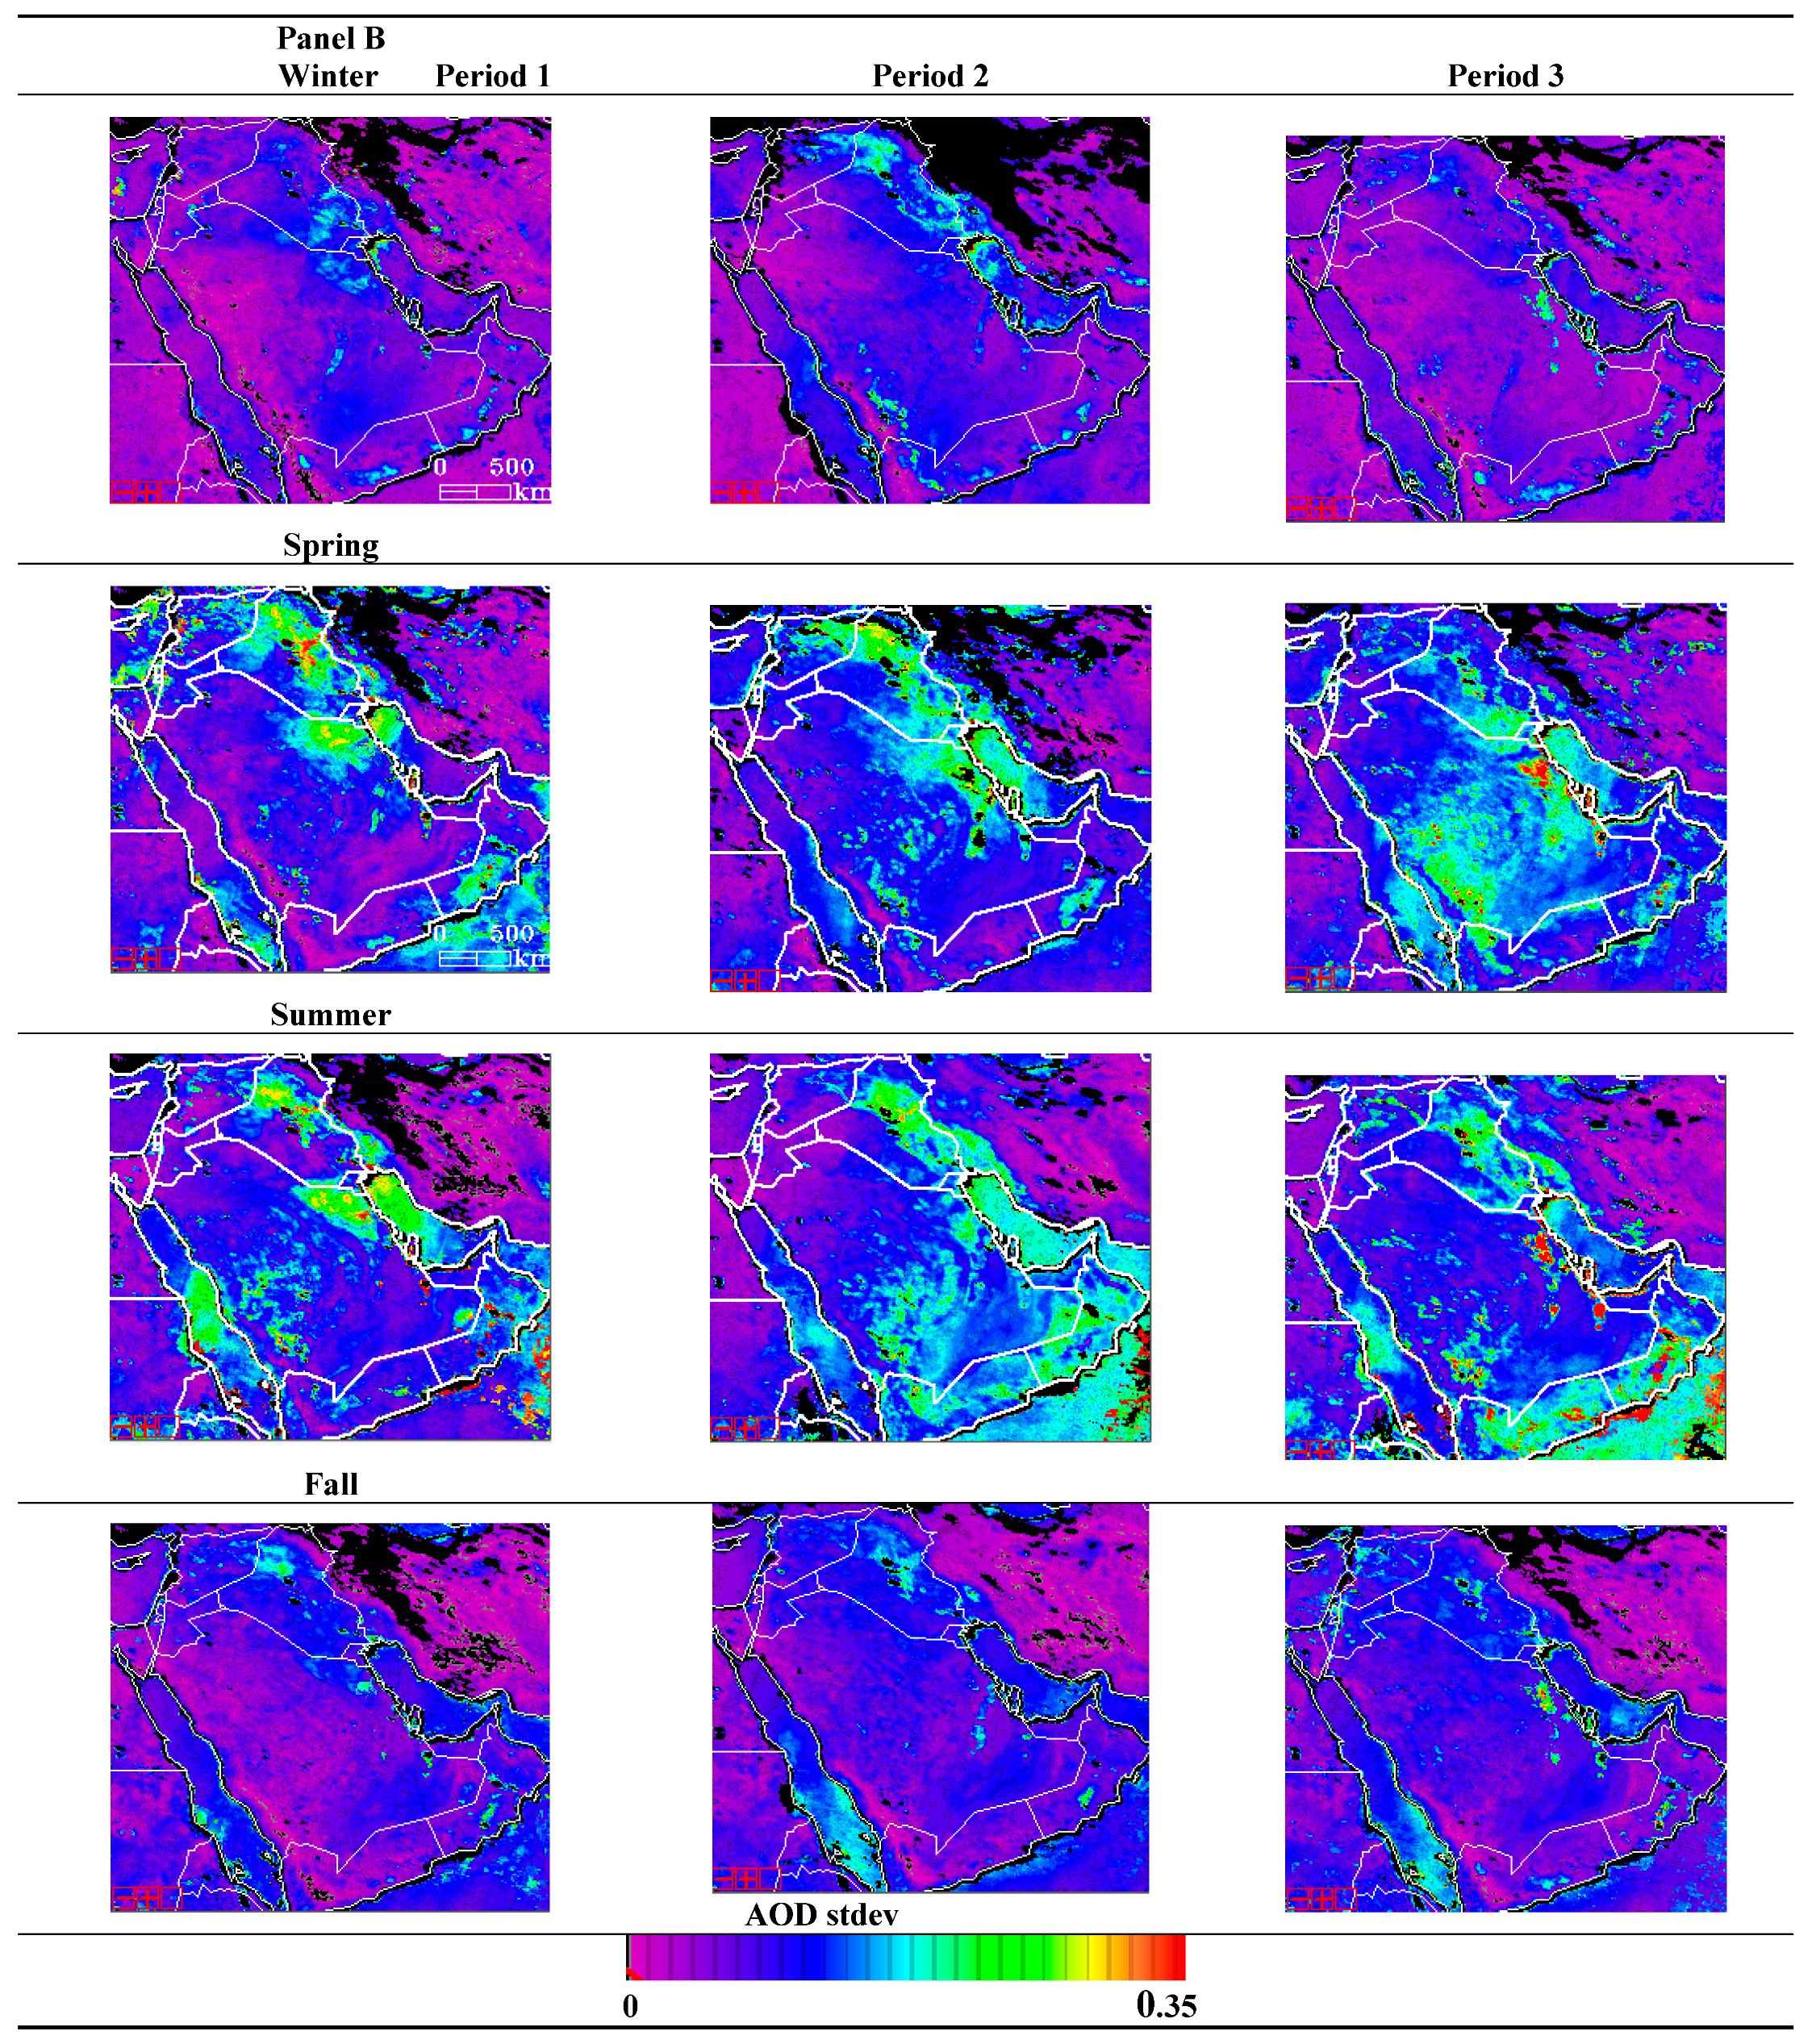
Figure 6A,B shows seasonal average values of AOD and AOD stdev, respectively, over the Middle East and Arabian Peninsula during the three studied periods (see Section 3.1). The most remarkable feature is large spatial and seasonal variability of the aerosol concentrations. In general, larger AOD values begin in spring, reaching a maximum in summer, followed by a decrease in fall and winter. Furthermore, over Iraq, along the Mesopotamia plains, there is a distinct spatial northwestern pattern of aerosol loadings, in accordance with the prevailing shamal wind direction [12,13,52,53,54].
Figure 6 shows that the seasonal variability in AOD indeed follows the general trend of increasing AOD toward spring–summer and a substantial decrease in fall–winter. Moreover, on a temporal scale, we see an increase in AOD intensity in Period 2 compared to Periods 1 and 3, for all seasons. Can this increase also be attributed to anthropogenic activity?
During strong dust storms, the dust particles may reach up to 5 km in altitude [35,36,55,56,57,58]. If an anthropogenic impact also exists, the war-related dust can easily reach high altitudes. This effect is visible in the satellite data over long periods, thus contributing to the elevated AOD values in spring–summer during the second period. Furthermore, an increase in combustion activities is also expected during the war period. We would also expect a larger influence from local variable sources, which are likely attributed to military services and battles. These small particles emitted from these variable and additional sources can stay advective for several days or even longer (depending on meteorological conditions and particle size), and if moved above the boundary layer, they can be transported long distances [57,58]. Additionally, during the summer in the dust-belt region, the boundary layer becomes relatively deep, reaching 3–5 km [35], whereas in the winter it is shallow, reaching 1.5–2 km [58,59]. In this regard, we can speculate that elevated AOD values during spring–summer are related to advected mixed pollution sources whereas during fall–winter, pollution is more concentrated near the ground (due to the low boundary layer). As evident from Figure 6, pollution during the relatively calm season was much larger during the second period.
Iraq, compared to all other countries in the region, had the largest AOD stdev during Period 2 for all seasons. We also noted areas of relatively high AOD stdev during Periods 1 and 3, but these were much smaller than the corresponding area in Period 2. In spring and summer, again, there is evidence of some “hot spots”, similar to Figure 5.
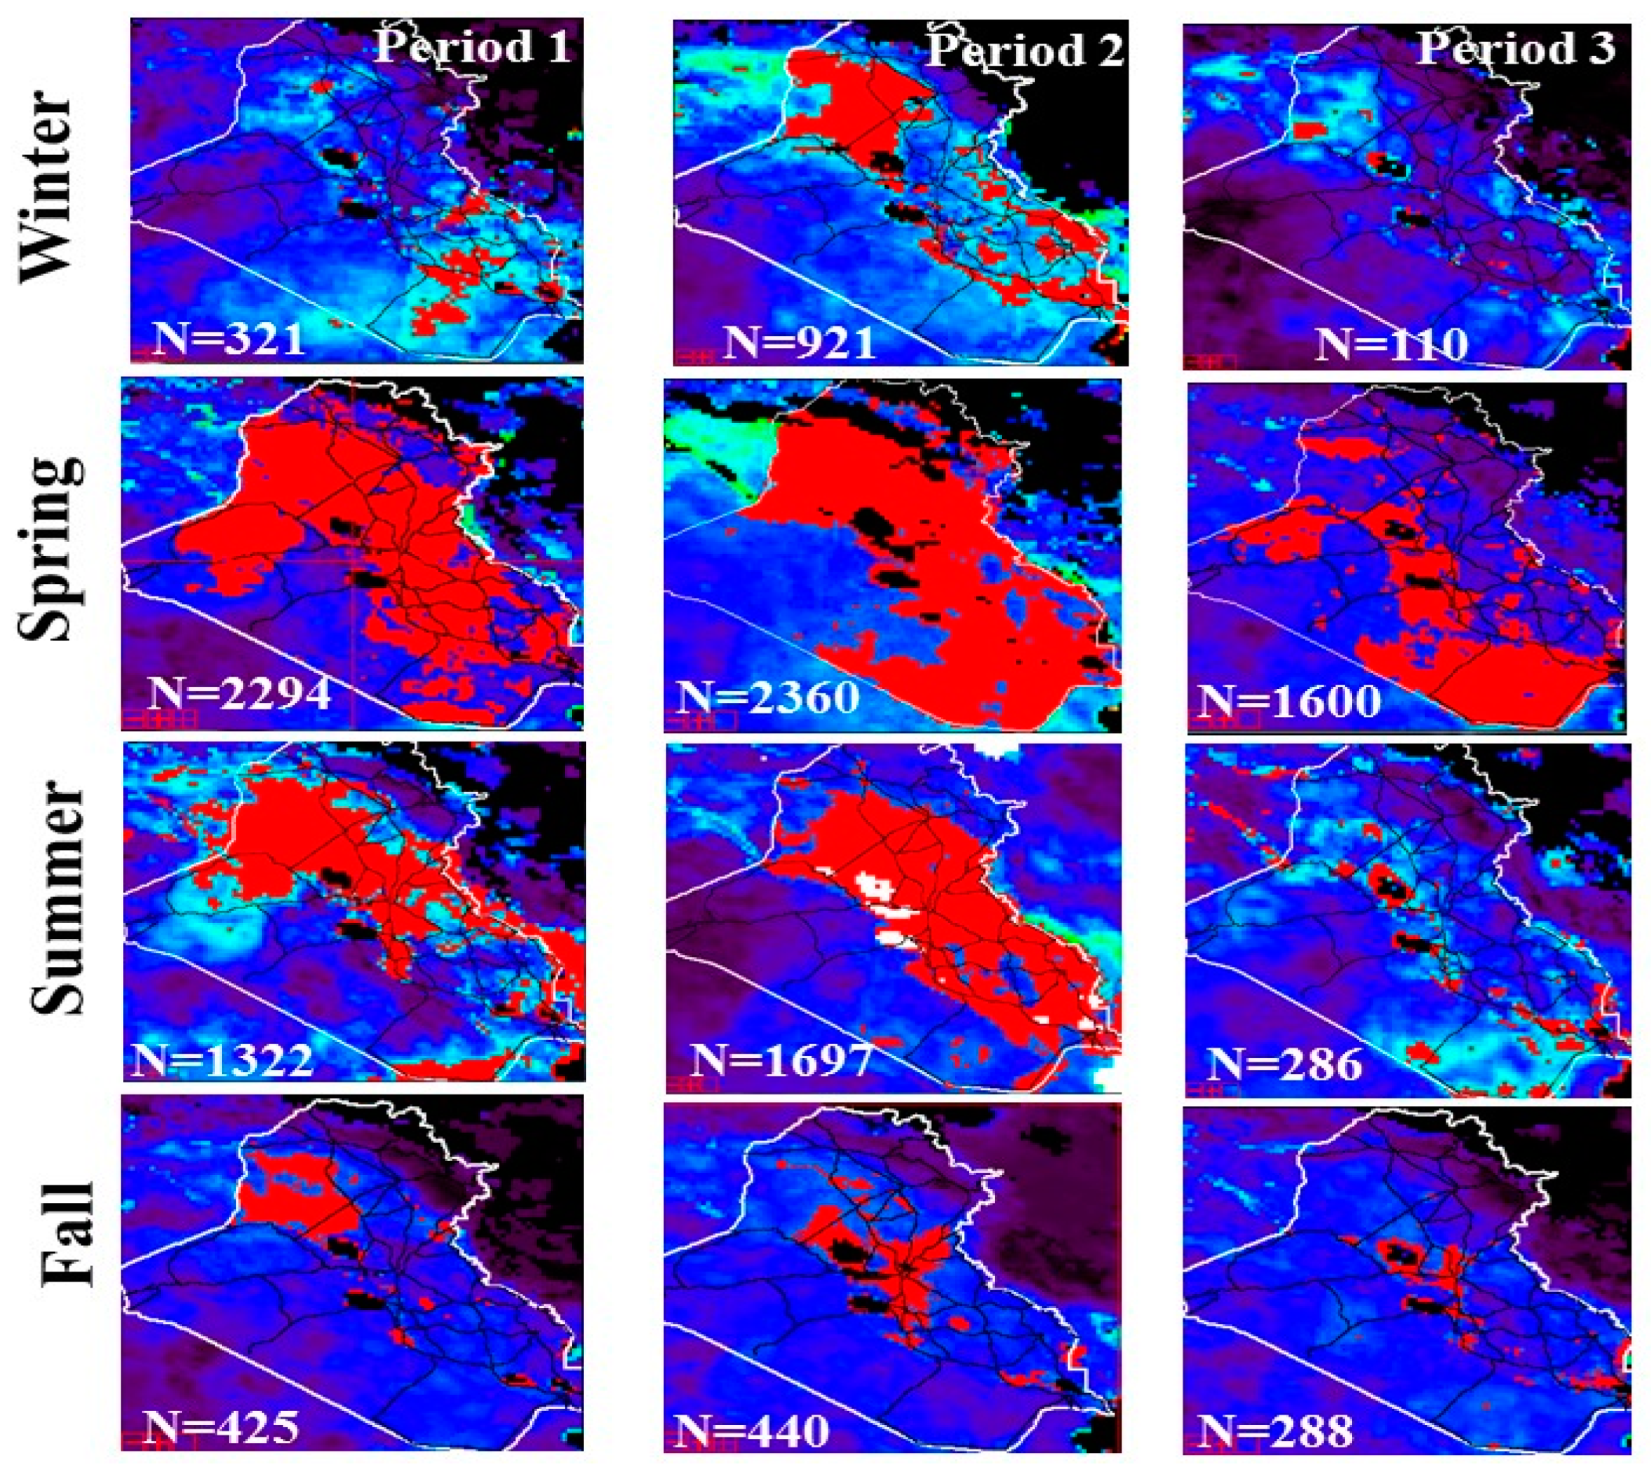
To further investigate the spatial and temporal variability in AOD stdev, in Figure 7, we selected all pixels with relatively high stdev, above 0.15 (shown in red), and estimated the percent change in AOD (stdev) between each of the three periods. For all seasons, there was a change in the spatial pattern of the high stdev pixels. Once again, the largest change was in winter. We estimated a 186% increase of AOD stdev pixels above 0.15 from Period 1 to 2, followed by a decrease of 88% from Period 2 to 3. Spring and fall showed relatively small increases in high AOD stdev pixels (from Period 1 to 2) (3% and 3.6%, respectively), but a large decrease in AOD stdev from Period 2 to 3 (32% and 34%, respectively), whereas during the summer, the increase was 28% (from Period 1 to 2) followed by an 80% decrease (in Period 3). Although the increase of 3.6% during fall might seem to be a small change, the spatial location of these pixels shifted from north to central Iraq.
4.3. Possible Contribution of Local Sources to AOD
To analyze the possible contribution of local sources to AOD, we selected two synoptic seasons: calm and stormy. Here we expected to see “localized” features or “hot spots” above military locations, but would these be observable under both seasonal conditions?
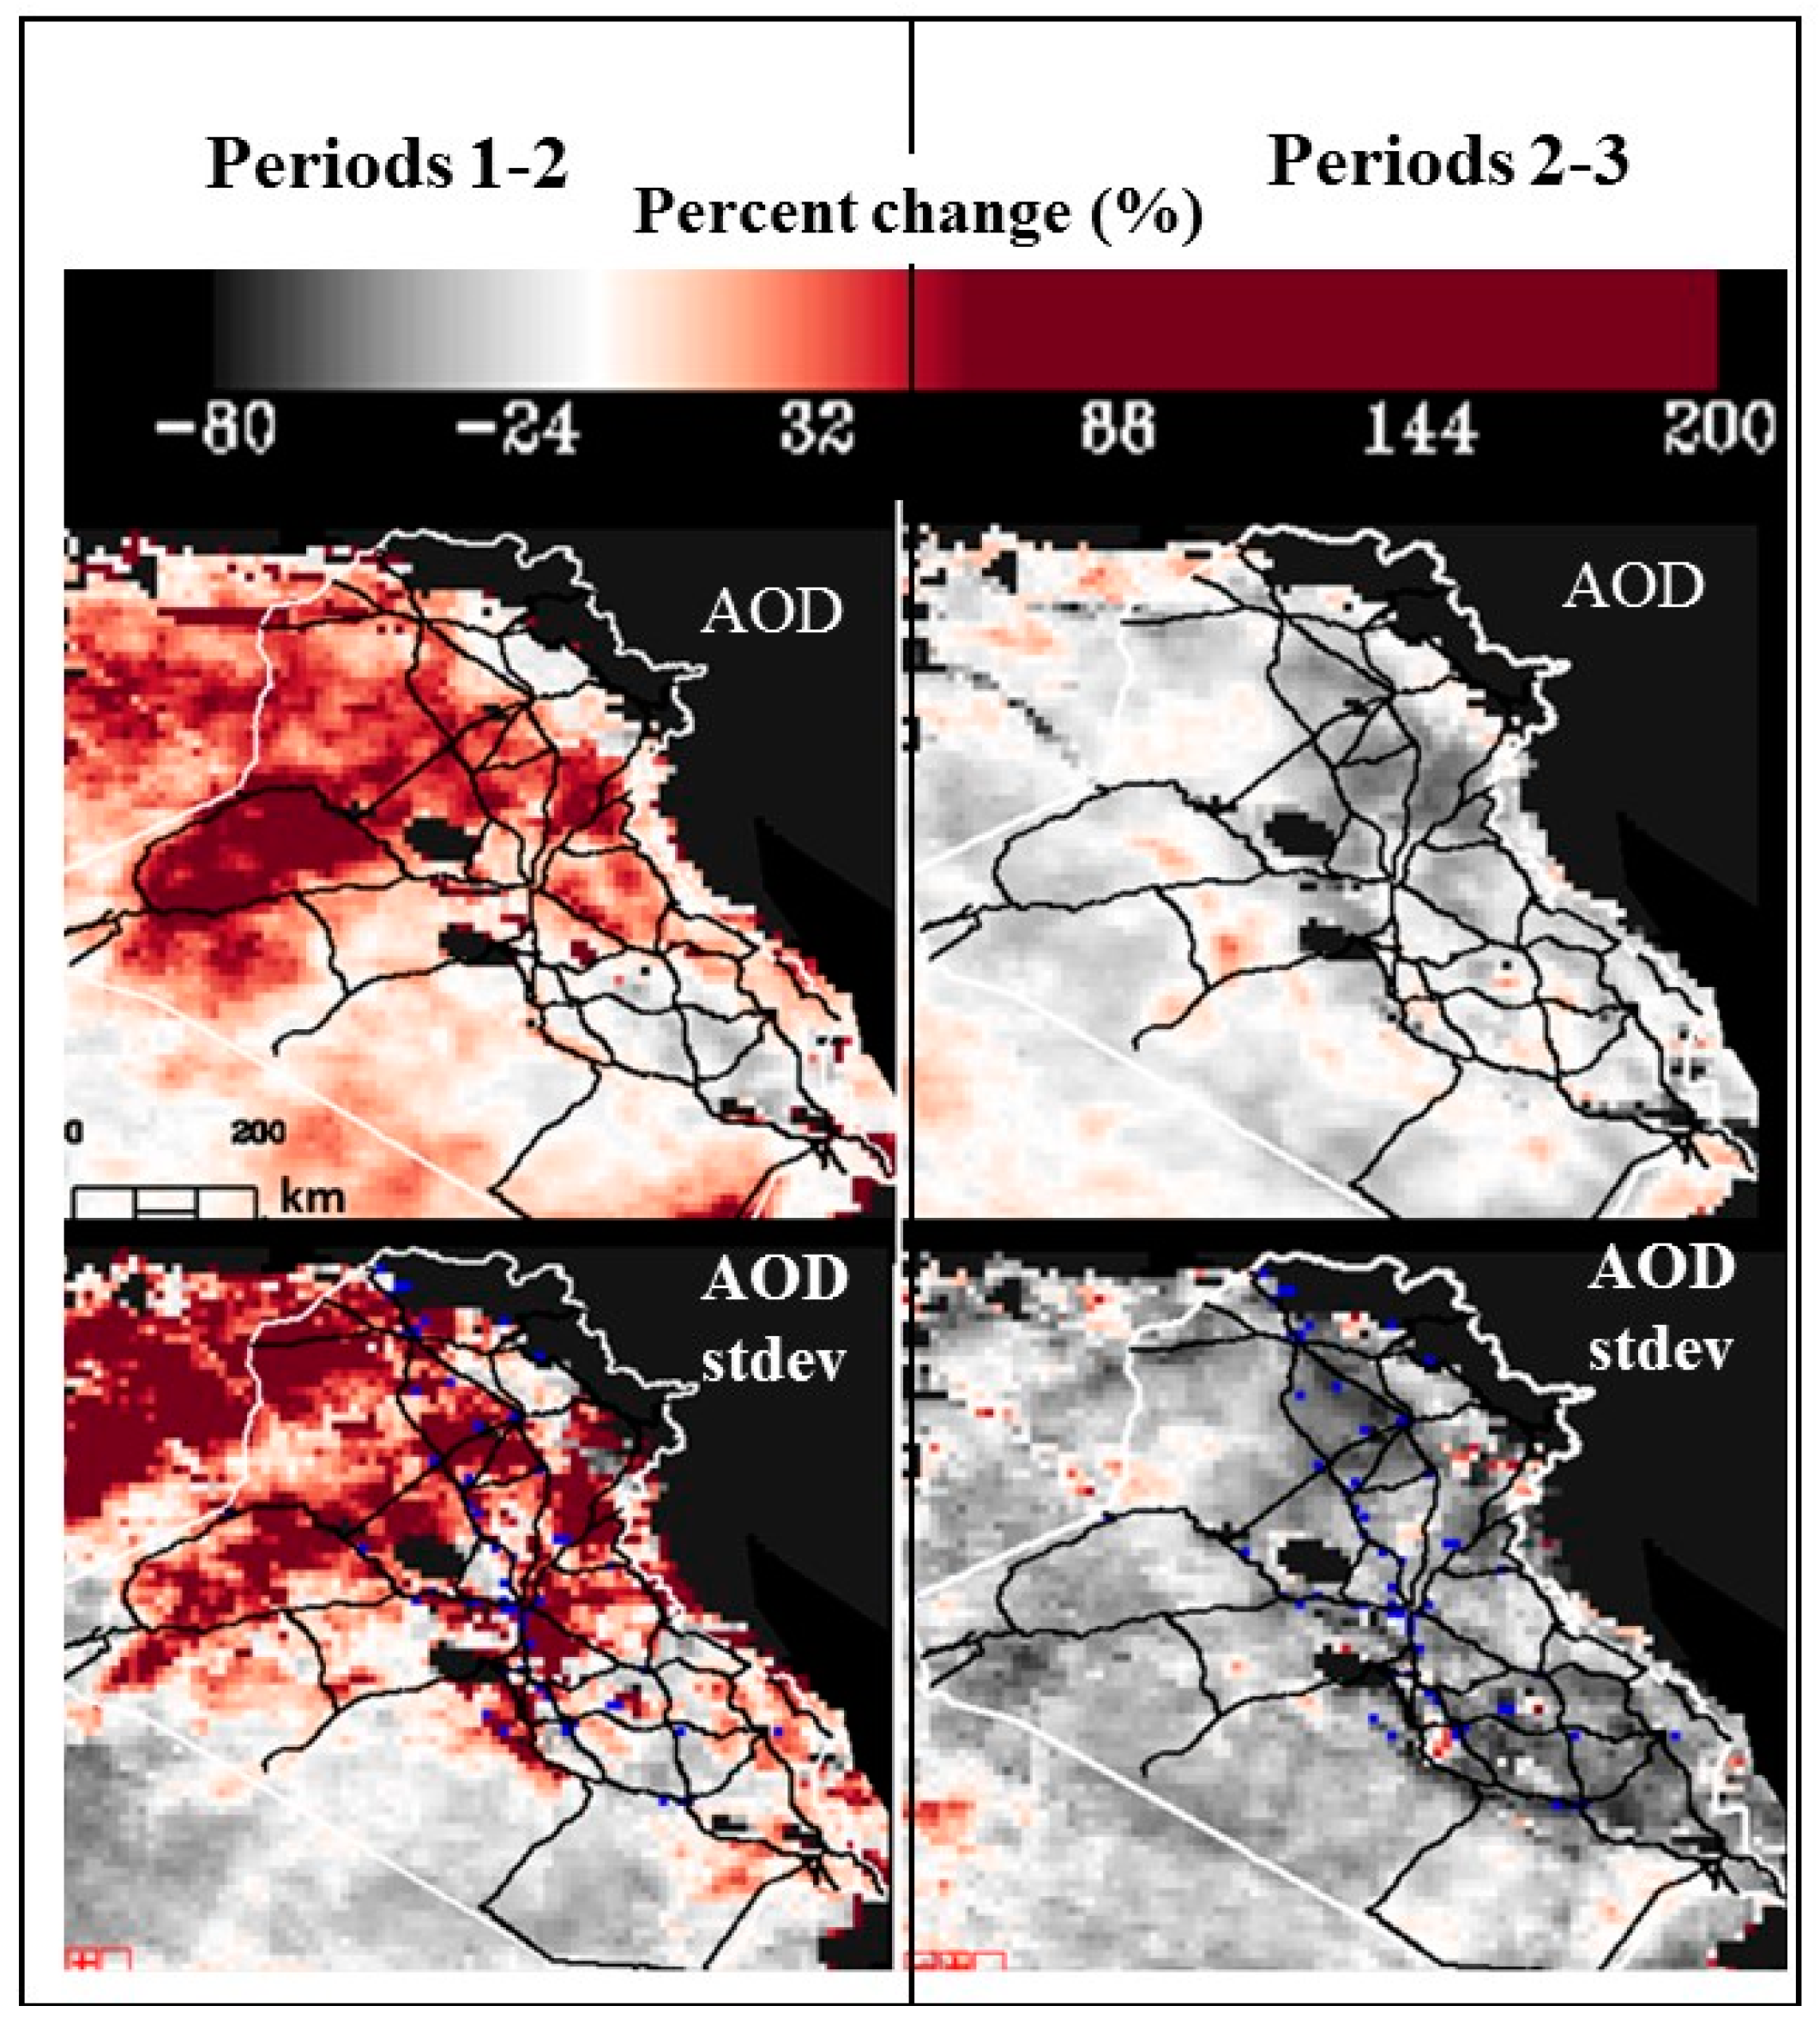
Table 2 shows changes in AOD and AOD stdev (in percent) over military locations between Periods 1 and 2, and Periods 2 and 3. Around 65–70 pixels (available retrievals) were analyzed. For all seasons, the locations mirrored the “increase–decrease” change for both AOD and AOD stdev values (Figure 8, military locations are highlighted in blue). In the winter case (Figure 8), AOD changed over almost all military sites. The high AOD stdev values observed during the winter again suggested a large contribution from local sources. When comparing AOD trends (Table 2 and Table 3), it can be seen that over Iraq as a whole, the increase in AOD was much lower than over the military location pixels. This result indicates a stronger influence of anthropogenically related sources on the AOD trends during the second period.
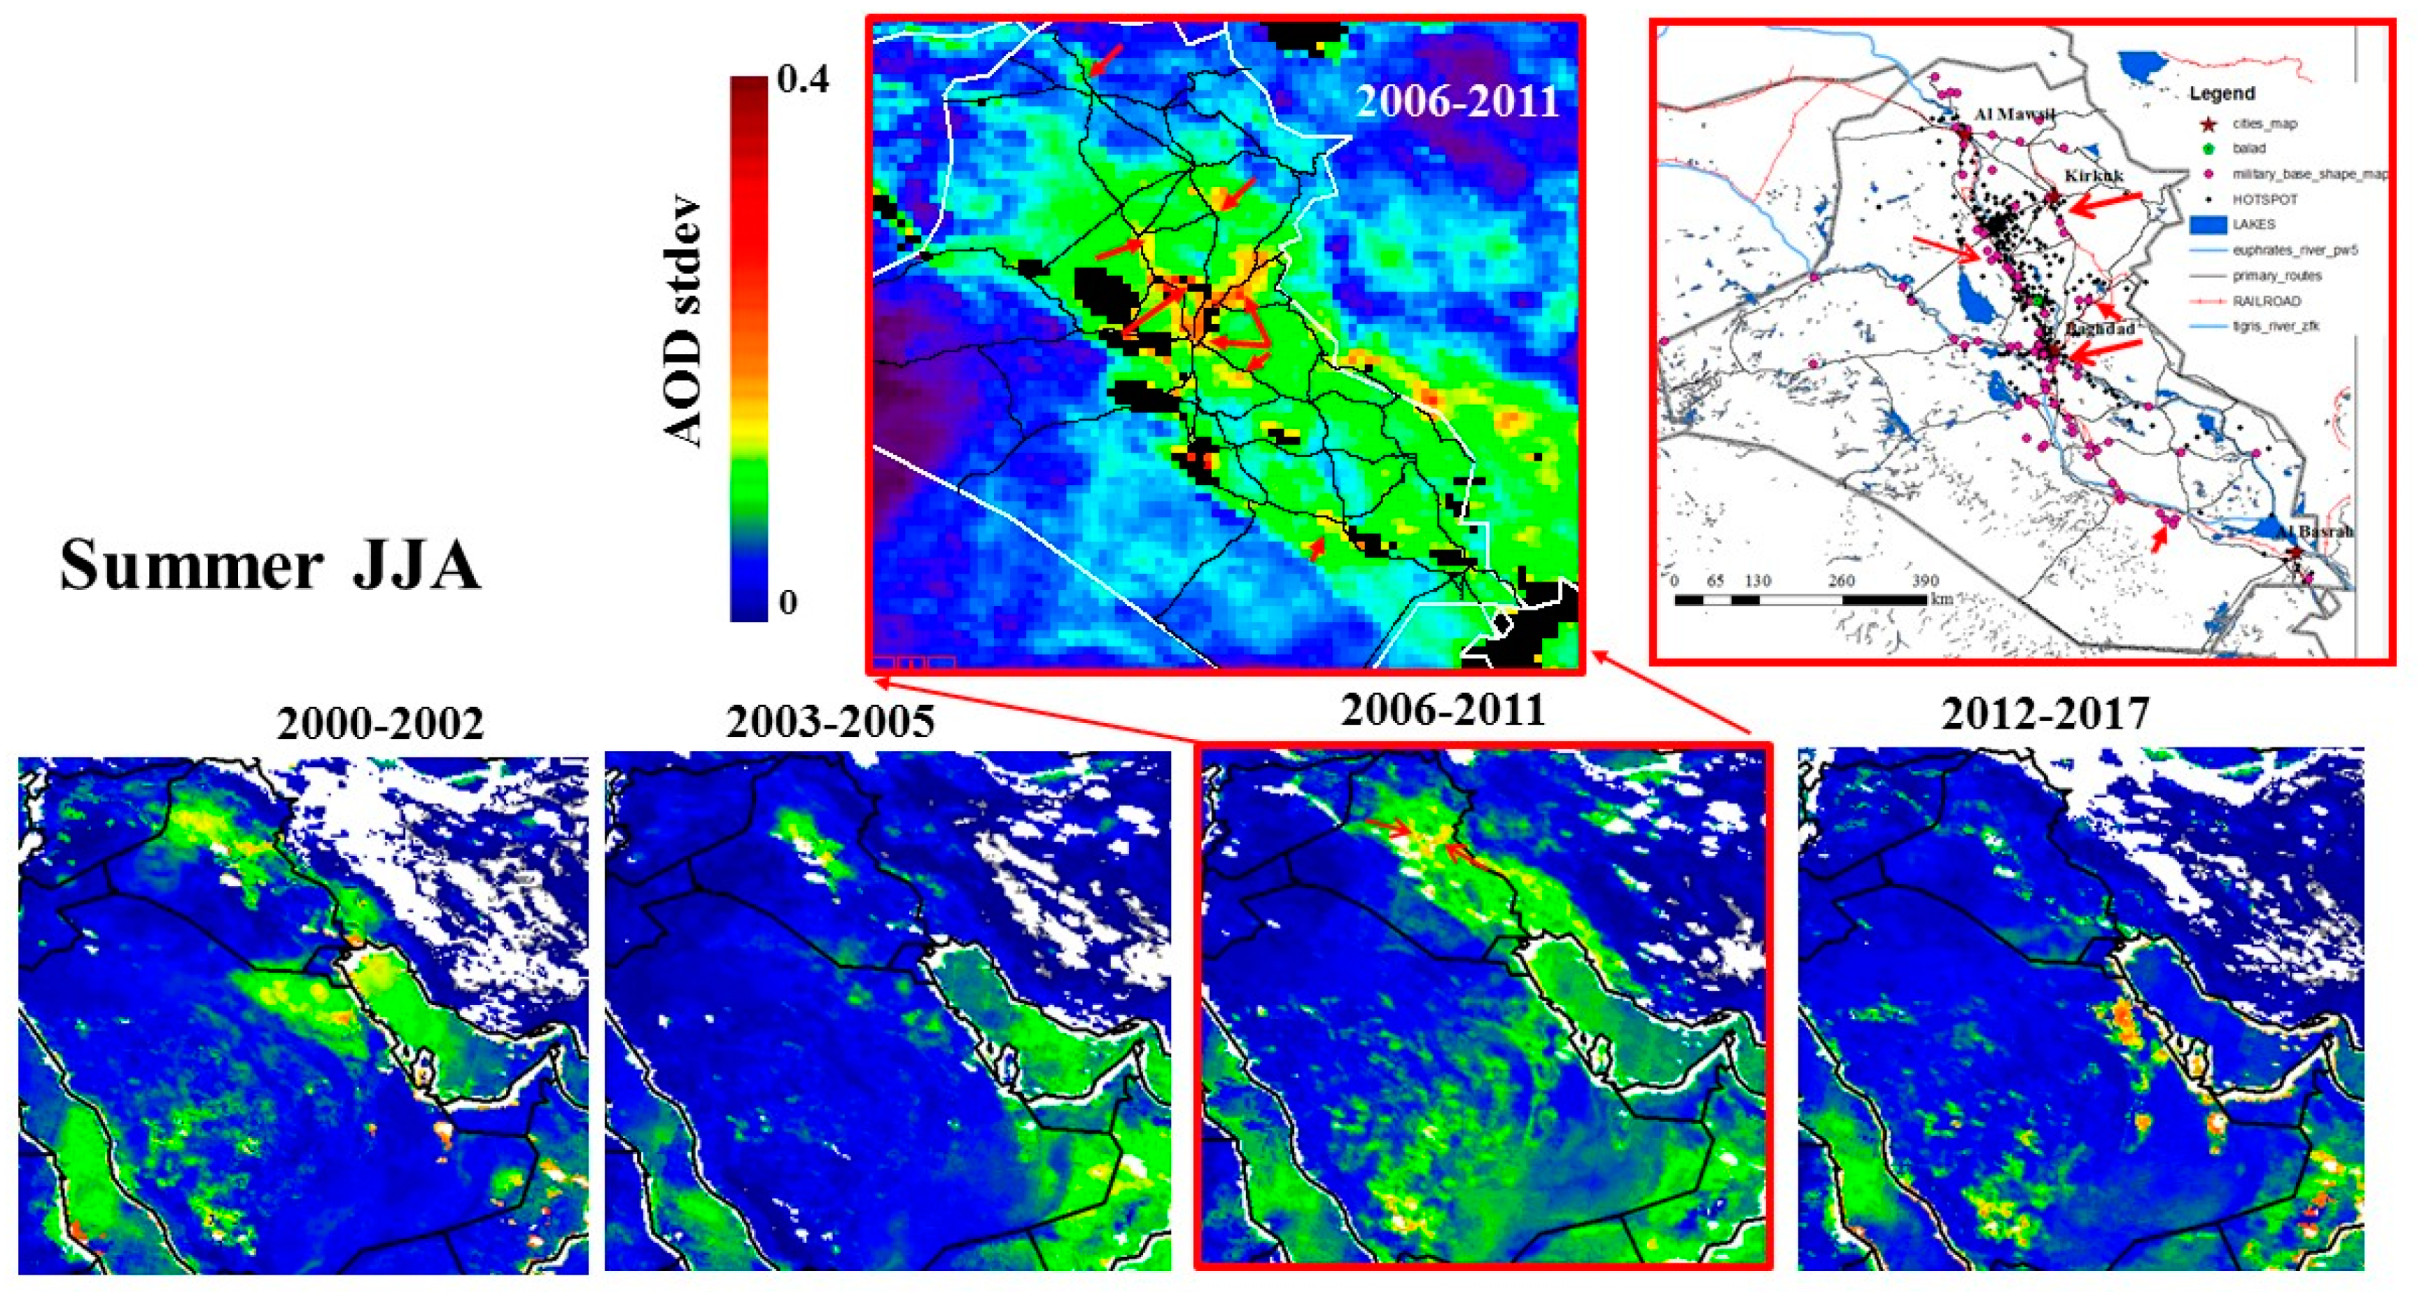
High values of percent change were estimated for summer. This result is not surprising, since during the second period, dust storms over the Fertile Crescent have been dramatically increased due to drought shift after 2008. Here we applied a similar logic by looking at specific locations where the increase was visible. To highlight this change, we investigated AOD stdev rather than AOD [46,47] (Figure 9). We selected two periods of intense dust-storm activity on the ground: 2003–2005 and 2006–2011. Relatively large stdev values can be attributed not only to the large variability in natural-produced dust by changes in synoptic meteorological conditions and changes in rainfall pattern but also to a contribution of local sources. Al Taji and Balad military camps near Baghdad, and those in Baghdad and Baqubah are highlighted by magenta arrows. These “localized” structures might indicate layered pollution of mixed sources (e.g., smoke and dust) [59].
4.4. Pollution Level by Means of Ground-Monitoring Sites
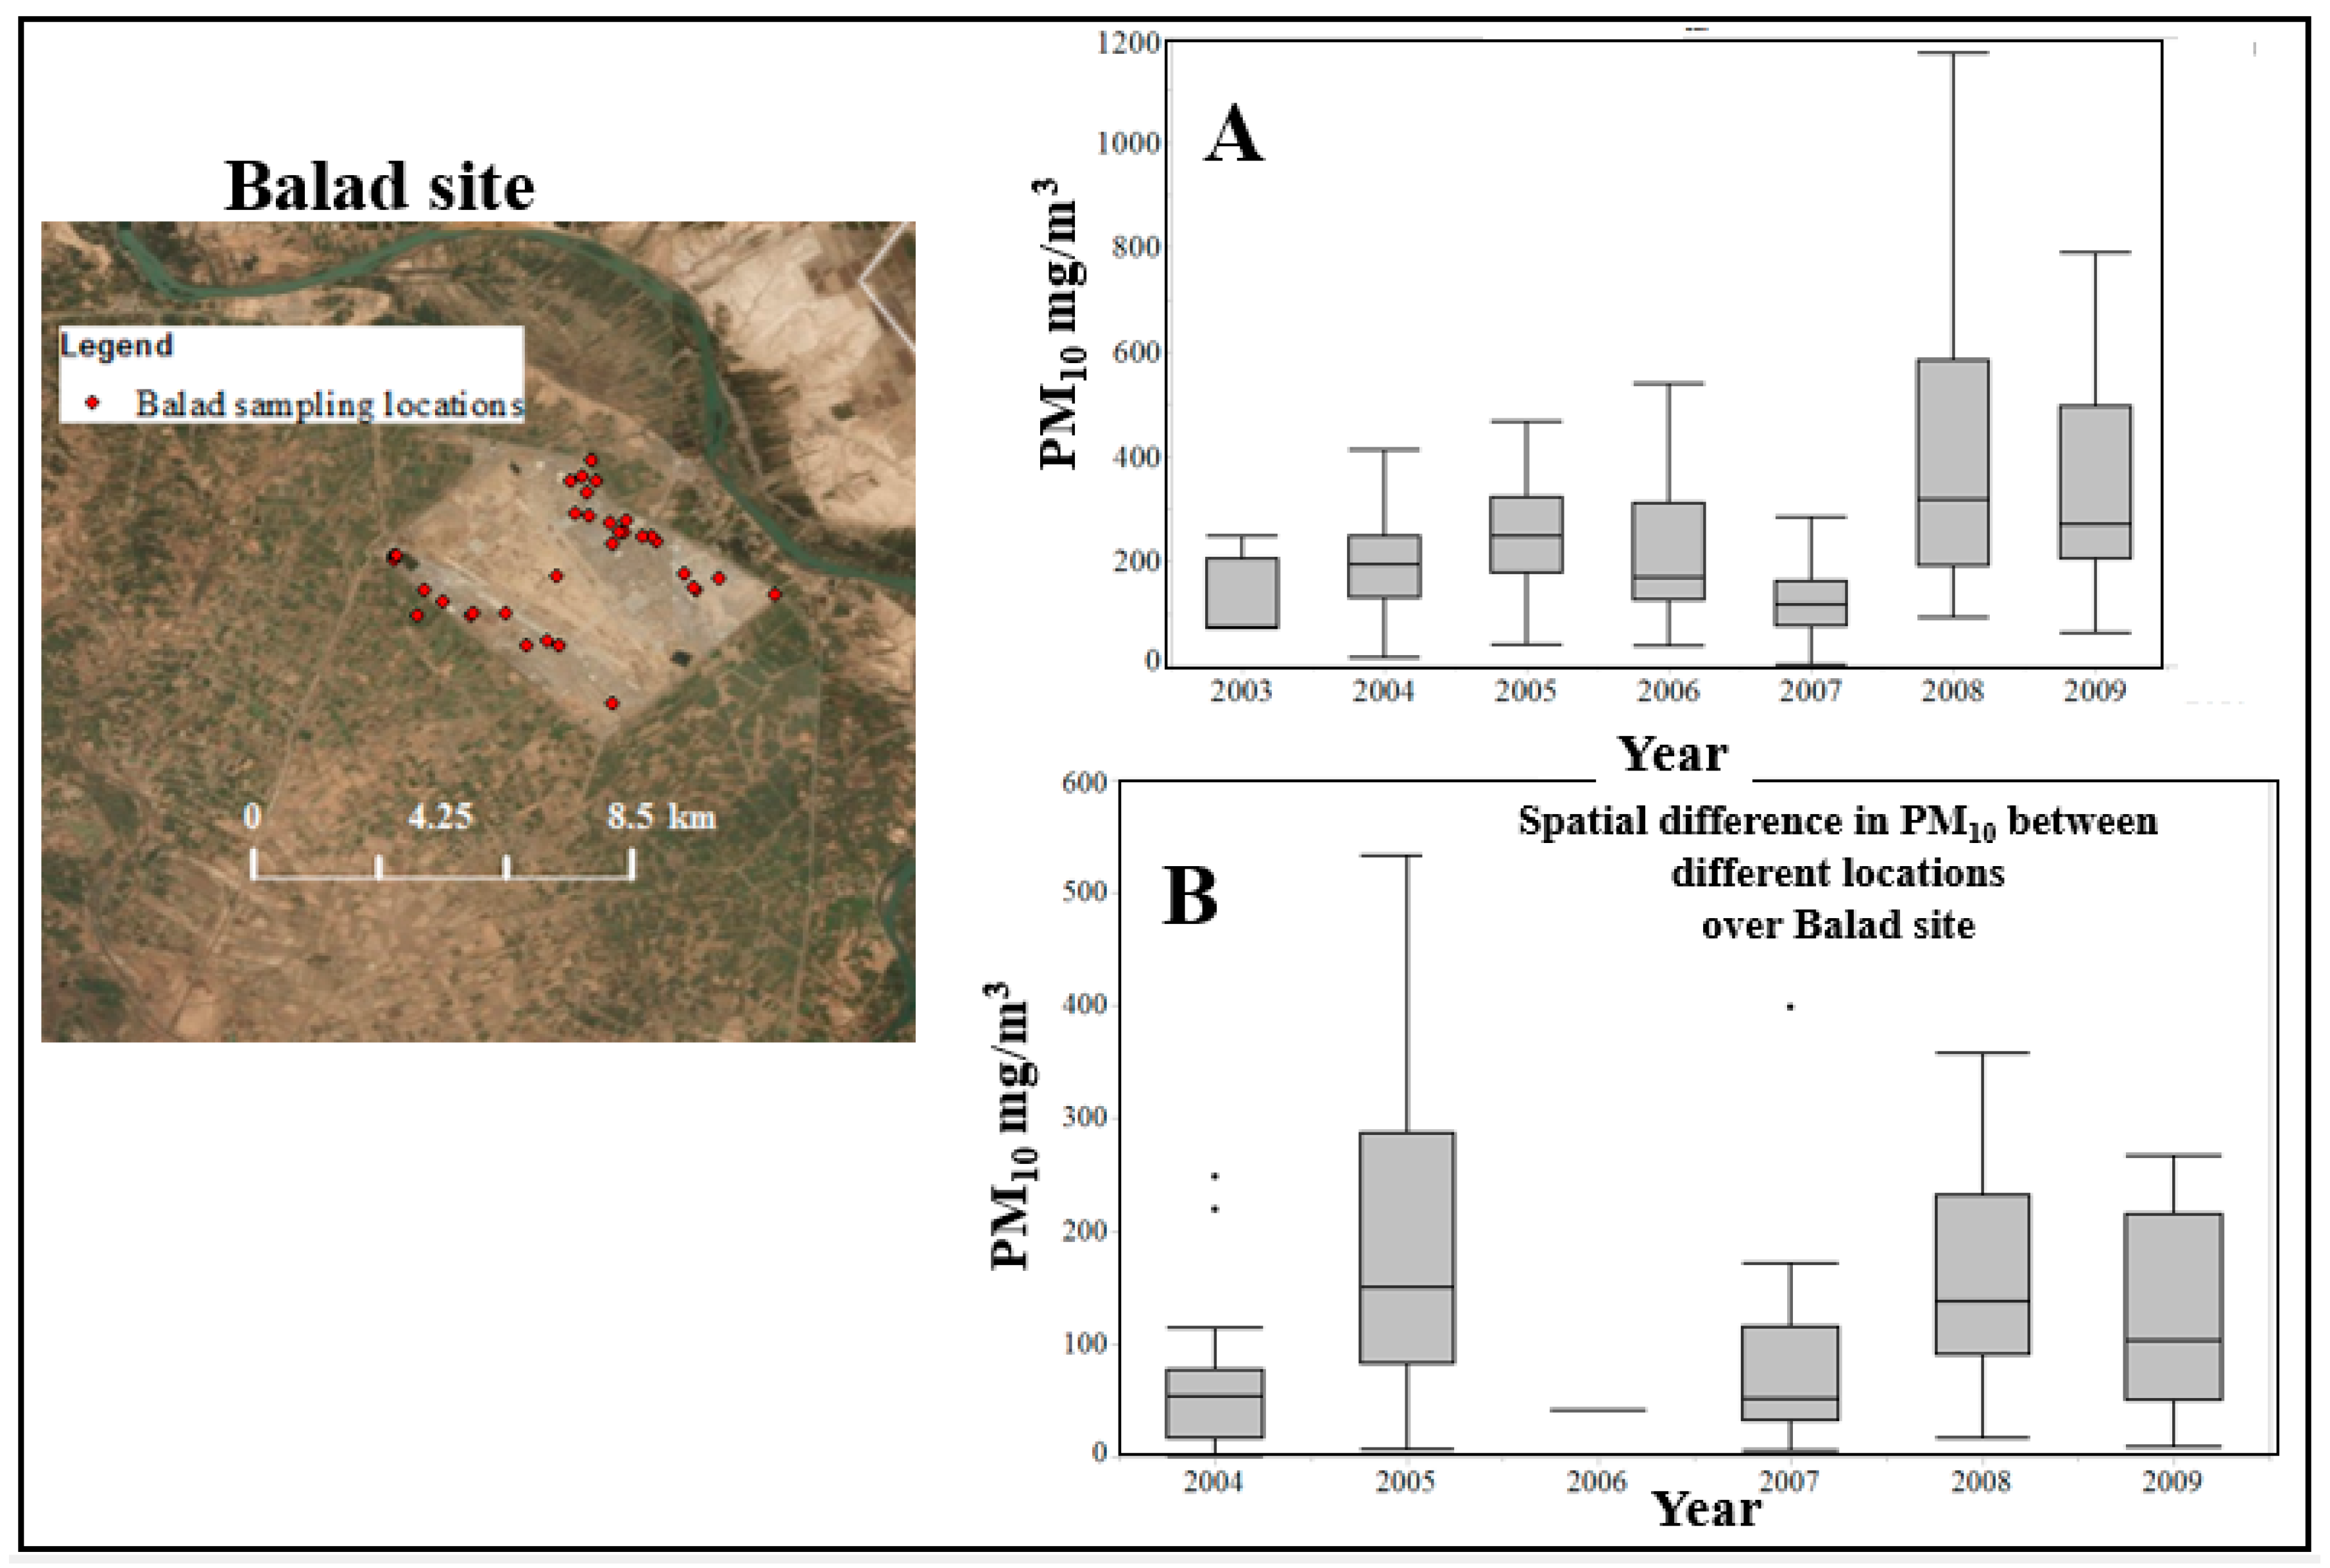
Figure 10 shows PM10 concentrations measured at the Balad military air base during 2004–2009 from publicly available data [60]. There were more than 10 sampling locations. Two of these were located near burn pits, whereas others were alongside the base. For our analyses, we selected days with at least 3–4 available measurements.
As can be seen from Figure 10A, there was an increase in PM10 concentration toward 2005, with a maximum measured in Figure 10B highlights the spatial variability in PM10 (the difference between maximum and minimum measured PM10 concentrations over a single day). It should be noted that the air base covers over 24 km2 with diverse anthropogenic activity. Sampling sites were initially selected to measure this variability. The relatively large spatial variability in PM10 in Balad air base was also observed using our analysis of satellite-retrieved AOD values. Specifically, the percent increase in AOD during relative calm periods and in AOD stdev during stormy periods was detectable from space.
5. Discussion
One might argue that it is obvious that military/anthropogenic activities will have a visible impact on dust loadings. Undeniably, troop transport and maneuvering, and ground trenches destroy the topsoil layer, facilitating the development of dust and/or sandstorms [61]. However, to the best of our knowledge, evidence for a secular signature of such an anthropogenic impact on atmospheric turbidity is scarce. This is because (i) the atmospheric signal is relatively weak against the surface background and (ii) it is difficult to disentangle meteorological effects from the anthropogenic effects, where changing wind directions and velocities largely diminish the impact [25,26,27,28,29]. In the case of Iraq, there are strong northwestern shamal and sharki winds that result in dust transport affecting the whole country [8].
Other studies have also confirmed the presence of war-related contaminants in dust and soil samples, serving as evidence of long-range transport of contaminated pollution or anthropogenic impact on soil quality. For example, carbon-bearing dust from Iraq was detected in water samples from Japan and other countries in East Asia [62,63]. Of additional concern is the burning of waste on military bases, a problem that has been largely covered by the media. According to the Institute of Medicine report at Joint Base Balad in Iraq, up to 200 tons of waste were burned daily in 2007 [63]. The question here is the ability of remote-sensing imagery to detect the war-related signal and to differentiate the signals from anthropogenic vs. natural dust. Generally, good complimentary sources of data, if available, are active remote sensing measurements [64], geostationary [65], and hyperspectral monitoring of dust pollution [66,67,68].
Past evidence indicates that impacts of armed conflicts on the natural environment often linger for years. A famous example is the bombing of Kuwaiti oil wells in the early 1990s, which resulted in extensive near-term air, water, and land pollution [69,70]; drastic damage to the desert surface [32,34] and its ground cover [61], and changes in surface sediment and morphological features leading to land-surface degradation over the long term [70,71,72,73]. Specifically, Koch and El-Baz [71] showed that the Gulf War remobilized 17% of Kuwait’s sand sheets, reclassifying geomorphic features and changing the landscape. Misak et al. [61] reported that during the second and third Gulf Wars (1990–1991 and 2003, respectively), the terrestrial ecosystem was severely damaged by military operations, having different onsite (e.g., terrain deformation) and offsite (an increase in the rates of sand transport and dust fallout) impacts. Therefore, the steep increase and decrease in AOD values observed here paralleling the military activity in Iraq strongly suggest cause and effect.
6. Concluding Remarks
In this study, we examined the origin of AOD changes over Iraq and adjacent areas during the period 2000–2018, based on Terra-MODIS AOD observations. The analyses were divided into three time periods: 1 March 2000–19 March 2003 (before OIF); 20 March 2003–31 December 2011 (presence of US forces); and 1 January 2012–31 December 2018 (post-war). We demonstrated spatiotemporal variability in AOD and AOD stdev intensity along the dust-storm corridor between the three studied periods. Seasonal AOD and AOD stdev images exhibited anthropogenic signatures on spatial and temporal scales. This anthropogenic signature is visible regardless of season, but its quantitative estimation would be more challenging during intense dust storm activity.
It was easier to quantitatively estimate the anthropogenic impact during synoptically calm periods (~7%–10%). We showed that winter, with a higher frequency of synoptically “calm” days, was the best season to estimate the changes in AOD above military locations. Surprisingly, the anthropogenic impact on AOD signature was also visible during seasons with vigorous synoptic activity. For all seasons, we identified the higher AOD increase in areas close to military camps and main roads in the central part of Iraq. Our results therefore are the first to show this effect and also better highlight the impact of war and anthropogenic activities in AOD increase.
Author Contributions
A.C. and A.K. conceived the project. A.C. performed the statistical and image data processing analysis. A.C. and A.K. analyzed the data. Both authors wrote the paper. All authors have read and agreed to the published version of the manuscript.
Funding
Our study was partially supported by NSF AGS-1639868 and by Grant No. RPGA 1501 from the Environment Health Fund (EHF), Israel.
Acknowledgments
The authors acknowledge the help of MODIS atmospheric product PI and Robert Levy with the algorithm structure. Discussions with Yoav Linzon from TAU, Albert Ansmann from TROPOS, and Gadi Kostinsky are gratefully acknowledged. Results of our study were partially supported by NSF AGS-1639868 and by Grant No. RPGA 1501 from the Environment Health Fund (EHF), Israel. The authors also wish to thank the anonymous reviewers for their very constructive comments.
Conflicts of Interest
The authors declare no conflicts of interest.
References
- The World Meteorological Organization Definitions to Dust/Sand Storms. Available online: https://cloudatlas.wmo.int/dust-storm-or-sandstorm.html (accessed on 10 May 2020).
- Sivakumar, M.V.K.; Das, H.P.; Brunini, O. Impacts of present and future climate variability and change on agriculture and forestry in the arid and semi-arid tropics. In Increasing Climate Variability and Change; Springer: Dordrecht, The Netherlands, 2005. [Google Scholar] [CrossRef]
- Middleton, N.; Kang, U. Sand and dust storms: Impact mitigation. Sustainability 2017, 9, 1053. [Google Scholar] [CrossRef] [Green Version]
- Goudie, A.S.; Middleton, N.J. Desert Dust in the Global System; Springer: Berlin/Heidelberg, Germany, 2006. [Google Scholar] [CrossRef]
- López, G.; Batlles, F.J. Estimate of the atmospheric turbidity from three broad-band solar radiation algorithms. A comparative study. Ann. Geophys. 2004, 22, 2657–2668. [Google Scholar] [CrossRef]
- Prospero, J.M.; Ginoux, P.; Torres, O.; Nicholson, S.E.; Gill, T. Environmental characterization of global sources of atmospheric soil dust identified with the Nimbus 7 Total Ozone Mapping Spectrometer (TOMS) absorbing aerosol product. Rev. Geophys. 2002, 40, 1002. [Google Scholar] [CrossRef]
- Kutiel, H.; Furman, H. Dust storms in the Middle East: Sources of origin and their temporal characteristics. Indoor Built Environ. 2003, 12, 419–426. [Google Scholar] [CrossRef]
- Ginoux, P.; Prospero, J.M.; Gill, T.E.; Hsu, N.C.; Zhao, M. Global-scale attribution of anthropogenic and natural dust sources and their emission rates based on MODIS Deep Blue aerosol products. Rev. Geophys. 2012, 50, 1–35. [Google Scholar] [CrossRef]
- Sissakian, V.; Al-Ansari, N.; Knutsson, S. Sand and dust storm events in Iraq. Nat. Sci. 2013, 5, 1084–1094. [Google Scholar] [CrossRef] [Green Version]
- Wheaton, E. Frequency and severity of drought and dust storms. Can. J. Agric. Econ. 1990, 38, 695–700. [Google Scholar] [CrossRef]
- Tsiouri, V.; Kakosimos, K.E.; Kumar, P. Concentrations, sources and exposure risks associated with particulate matter in the Middle East Area—A review. Air Qual. Atmos. Health 2015, 8, 67–80. [Google Scholar] [CrossRef]
- Notaro, M.; Yu, Y.; Kalashnikova, O.V. Regime shift in Arabian dust activity, triggered by persistent Fertile Crescent drought. J. Geophys. Res. Atmos. 2015, 120, 10229–10249. [Google Scholar] [CrossRef]
- Sotoudeheian, S.; Salim, R.; Arhami, M. Impact of Middle Eastern dust sources on PM10 in Iran: Highlighting the impact of Tigris-Euphrates basin sources and Lake Urmia desiccation. J. Geophys. Res. Atmos. 2016, 121, 14018–14034. [Google Scholar] [CrossRef]
- Chin, M.; Diehl, T.; Tan, Q.; Prospero, J.M.; Kahn, R.A.; Remer, L.A.; Yu, H.; Sayer, A.M.; Bian, H.; Geogdzhayev, I.V.; et al. Multi-decadal aerosol variations from 1980 to 2009: A perspective from observations and a global model. Atmos. Chem. Phys. 2014, 14, 3657–3690. [Google Scholar] [CrossRef] [Green Version]
- Draxler, R.R.; Gillette, D.A.; Kirkpatrick, J.S.; Heller, J. Estimating PM10 air concentrations from dust storms in Iraq, Kuwait and Saudi Arabia. Atmos. Environ. 2001, 35, 4315–4330. [Google Scholar] [CrossRef]
- Pu, B.; Ginoux, P. The impact of the Pacific Decadal Oscillation on springtime dust activity in Syria. Atmos. Chem. Phys. 2016, 16, 13431–13448. [Google Scholar] [CrossRef] [Green Version]
- Parolari, A.J.; Li, D.; Bou-Zeid, E.; Katul, G.G.; Assouline, S. Climate, not conflict, explains extreme Middle East dust storm. Environ. Res. Lett. 2016, 11, 114013. [Google Scholar] [CrossRef] [Green Version]
- Flohr, P.; Fleitmann, D.; Zorita, E.; Sadekov, A.; Cheng, H.; Bosomworth, M.; Edwards, L.; Matthews, W.; Matthews, R. Late Holocene droughts in the Fertile Crescent recorded in a speleothem from northern Iraq. Geophys. Res. Lett. 2017, 44, 1528–1536. [Google Scholar] [CrossRef] [Green Version]
- Klingmüller, K.; Pozzer, A.; Metzger, S.; Stenchikov, G.L.; Lelieveld, J. Aerosol optical depth trend over the Middle East. Atmos. Chem. Phys. 2016, 16, 5063–5073. [Google Scholar] [CrossRef] [Green Version]
- Lelieveld, J.; Beirle, S.; Hörmann, C.; Stenchikov, G.; Wagner, T. Abrupt recent trend changes in atmospheric nitrogen dioxide over the Middle East. Sci. Adv. 2015, 1, 2–6. [Google Scholar] [CrossRef] [Green Version]
- Krotkov, N.A.; McLinden, C.A.; Li, C.; Lamsal, L.N.; Celarier, E.A.; Marchenko, S.V.; Swartz, W.H.; Bucsela, E.J.; Joiner, J.; Duncan, B.N.; et al. Aura OMI observations of regional SO2 and NO2 pollution changes from 2005 to 2014. Atmos. Chem. Phys. 2016, 16, 4605–4629. [Google Scholar] [CrossRef] [Green Version]
- Oliver, F.W. Dust-storms in Egypt and their relation to the war period, as noted in Maryut, 1939-45. Geogr. J. 1945, 106, 26–49. [Google Scholar] [CrossRef]
- Cachorro, V.; Tanré, D. The correlation between particle mass loading and extinction: Application to desert dust aerosol content estimation. Remote Sens. Environ. 1997, 60, 187–194. [Google Scholar] [CrossRef]
- Moosmüller, H.; Varma, R.; Arnott, W.P.; Kuhns, H.D.; Etyemezian, V.R.; Gillies, J.A. Scattering cross section emission factors for visibility and radiative transfer applications: Military vehicles traveling on unpaved roads. J. Air Waste Manag. Assoc. 2005, 55, 1743–1750. [Google Scholar] [CrossRef] [PubMed] [Green Version]
- Gillies, J.A.; Kuhns, H.D.; Engelbrecht, J.P.; Uppapalli, S.; Etyemezian, V.R.; Nikolich, G. Particulate emissions from U.S. Department of Defense artillery backblast testing. J. Air Waste Manag. Assoc. 2007, 57, 551–560. [Google Scholar] [CrossRef] [PubMed] [Green Version]
- Gillies, J.A.; Etyemezian, V.R.; Kuhns, H.D.; Moosmuller, H.; Engelbrecht, J.P.; King, J.; Uppapalli, S.; Nikolich, G.; McAlpine, J.; Gillette, D.; et al. Particulate Matter Emissions for Dust from Unique Military Activities; SERDP Project SI-1399, 2007 Annual Report; Desert Research Institute: Reno, NV, USA, December 2007. [Google Scholar]
- Gillies, J.A.; Etyemezian, V.R.; Kuhns, H.D.; Moosmuller, H.; Engelbrecht, J.P.; King, J.; Uppapalli, S.; Nikolich, G.; McAlpine, J.; Zhu, D.; et al. Particulate Matter Emissions Factors for Dust from Unique Military Activities; SERDP Project SI-1399, Final Report; Desert Research Institute: Reno, NV, USA, June 2010. [Google Scholar]
- Caldwell, T.G.; McDonald, E.V.; Young, M. Soil disturbance and unsaturated hydraulic response at the US Army National Training Center, Ft. Irwin, California. J. Arid Environ. 2008, 67, 456–472. [Google Scholar] [CrossRef]
- Kaskaoutis, D.; Houssos, E.; Rashki, A.; Francois, P.; Legrand, M.; Goto, D.; Bartzokas, A.; Kambezidis, H.; Takemura, T. The Caspian Sea–Hindu Kush Index (CasHKI): A regulatory factor for dust activity over southwest Asia. Glob. Planet. Chang. 2015, 137, 10–23. [Google Scholar] [CrossRef]
- Rezazadeh, M.; Irannejad, P.; Shao, Y. Climatology of the Middle East dust events. Aeolian Res. 2013, 10, 103–109. [Google Scholar] [CrossRef]
- Yu, Y.; Notaro, M.; Kalashnikova, O.V.; Garay, M.J. Climatology of summer Shamal wind in the Middle East. J. Geophys. Res. Atmos. 2016, 121, 289–305. [Google Scholar] [CrossRef] [Green Version]
- Al-Dabbas, M.A.; Ayad, A.M.; Al-Khafaji, R.M. Dust storms loads analyses—Iraq. Arab. J. Geosci. 2012, 5, 121–131. [Google Scholar] [CrossRef]
- Hamidi, M.; Kavianpour, M.R.; Shao, Y. Synoptic analysis of dust storms in the Middle East. Asia-Pac. J. Atmos. Sci. 2013, 49, 279–286. [Google Scholar] [CrossRef]
- Alizadeh-Choobari, O.; Ghafarian, P.; Owlad, E. Temporal variations in the frequency and concentration of dust events over Iran based on surface observations. Int. J. Climatol. 2016, 36, 2050–2062. [Google Scholar] [CrossRef]
- Abdi Vishkaee, F.; Flamant, C.; Cuesta, J.; Oolman, L.; Flamant, P.; Khalesifard, H.R. Dust transport over Iraq and northwest Iran associated with winter Shamal: A case study. J. Geophys. Res. 2012, 117, D03201. [Google Scholar] [CrossRef] [Green Version]
- Francis, D.B.K.; Flamant, C.; Chaboureau, J.-P.; Banks, J.; Cuesta, J.; Brindley, H.; Oolman, L. Dust emission and transport over Iraq associated with the summer Shamal winds. Aeolian Res. 2017, 24, 15–31, ISSN 1875-9637. [Google Scholar] [CrossRef]
- Rajab, J.M.; Abdulfattah, I.S.; Mossa, H.A.; Sleeman, S.Y. Spatial and temporal distributions of outgoing longwave radiation over Iraq: 2007–2016. In IOP Conference Series: Materials Science and Engineering; IOP Publishing: Bristol, UK, 2018; p. 012030. Volume 454. [Google Scholar] [CrossRef]
- Köppen, W. Translated by Volken, E.; Brönnimann, S. “Die Wärmezonen der Erde, nach der Dauer der heissen, gemässigten und kalten Zeit und nach der Wirkung der Wärme auf die organische Welt betrachtet” [The thermal zones of the earth according to the duration of hot, moderate and cold periods and to the impact of heat on the organic world]. Meteorol. Z. 1884, (published 2011). 20, 351–360. [Google Scholar]
- Houssos, E.E.; Chronis, T.; Fotiadi, A.; Hossain, F. Atmospheric circulation characteristics favoring dust outbreaks over the Solar Village, Central Saudi Arabia. Mon. Weather Rev. 2015, 143, 3263–3275. [Google Scholar] [CrossRef]
- Kaskaoutis, D.; Houssos, E.; Solmon, F.; Legrand, M.; Rashki, A.; Dumka, U.; Francois, P.; Gautam, R.; Singh, R. Impact of atmospheric circulation types on southwest Asian dust and Indian summer monsoon rainfall. Atmos. Res. 2017, 201, 189–205. [Google Scholar] [CrossRef]
- Donnay, K.; Filimonov, V. Views to a war: Systematic differences in media and military reporting of the war in Iraq. EPJ Data Sci. 2014, 3, 25. [Google Scholar] [CrossRef] [Green Version]
- Sundberg, R.; Melander, E. Introducing the UCDP georeferenced event dataset. J. Peace Res. 2013, 50, 523–532. [Google Scholar] [CrossRef]
- Remer, L.A.; Kaufman, Y.J.; Tanre, D.; Mattoo, S.; Chu, D.A.; Martins, J.V.; Li, R.R.; Ichoku, C.; Levy, R.C.; Kleidman, R.G.; et al. The MODIS aerosol algorithm, products, and validation. J. Atmos. Sci. 2005, 62, 947–973. [Google Scholar] [CrossRef] [Green Version]
- Remer, L.A.; Kaufman, Y.J. Aerosol direct radiative effect at the top of the atmosphere over cloud free ocean derived from four years of MODIS data. Atmos. Chem. Phys. 2006, 6, 237–253. [Google Scholar] [CrossRef] [Green Version]
- Levy, R.C.; Munchak, L.A.; Mattoo, S.; Patadia, F.; Remer, L.A.; Holz, R.E. Towards a long-term global aerosol optical depth record: Applying a consistent aerosol retrieval algorithm to MODIS and VIIRS-observed reflectance. Atmos. Meas. Tech. 2015, 8, 4083–4110. [Google Scholar] [CrossRef] [Green Version]
- Chudnovsky, A.A.; Kostinski, A.; Lyapustin, A.; Koutrakis, P. Spatial scales of pollution from variable resolution satellite imaging. Environ. Pollut. 2013, 172, 131–138. [Google Scholar] [CrossRef]
- Kishcha, P.; Wang, S.H.; Lin, N.H.; da Silva, A.; Lin, T.H.; Lin, P.H.; Liu, G.R.; Starobinets, B.; Alpert, P. Differentiating between local and remote pollution over Taiwan. Aerosol Air Qual. Res. 2018, 18, 1788–1798. [Google Scholar] [CrossRef] [Green Version]
- Trigo, R.M.; Gouveia, C.M.; Barriopedro, D. The intense 2007–2009 drought in the Fertile Crescent: Impacts and associated atmospheric circulation. Agric. Meteorol. 2010, 150, 1245–1257. [Google Scholar] [CrossRef]
- Qian, N.; Wan, Z.-H. Sediment Dynamics; Science Press: Beijing, China, 1983. [Google Scholar]
- Zhang, J.-X.; Liu, H. A vertical 2-D numerical simulation of suspended sediment transport. J. Hydrodyn. Ser. B 2007, 19, 217–224. [Google Scholar] [CrossRef]
- Almazroui, M. Climatology and Monitoring of Dust and Sand Storms in the Arabian Peninsula; Center of Excellence for Climate Change Research (CECCR), King Abdulaziz University: Jadeh, Saudi Arabia, 2013; pp. 1–12. [Google Scholar]
- Chudnovsky, A.; Koutrakis, P.; Kostinski, A.; Proctor, S.; Garshick, E. Spatial and temporal variability in desert dust and anthropogenic pollution in Iraq, 1997–2010. J. Air Waste Manag. Assoc. 2017, 67, 17–26. [Google Scholar] [CrossRef] [PubMed]
- Attiya, A.A.; Jones, B.G.; Marx, S.K. Spatial–temporal analysis of Aerosol Index (AI) distribution and some climatic factors: Case study from Iraq, 1980–2015. Modeling Earth Syst. Environ. 2019, 5, 203–216. [Google Scholar] [CrossRef]
- Soleimani, Z.; Teymouri, P.; Darvishi Boloorani, A.; Mesdaghinia, A.; Middleton, N.; Griffin, D.W. An overview of bioaerosol load and health impacts associated with dust storms: A focus on the Middle East. Atmos. Environ. 2019, 117187. [Google Scholar] [CrossRef]
- Mehta, M.; Singh, N. Anshumali Global trends of columnar and vertically distributed properties of aerosols with emphasis on dust, polluted dust and smoke—Inferences from 10-year long CALIOP observations. Remote Sens. Environ. 2018, 208, 120–132. [Google Scholar] [CrossRef]
- Ramaswamy, V.; Muraleedharan, P.M.; Babu, C.P. Mid-troposphere transport of Middle-East dust over the Arabian Sea and its effect on rainwater composition and sensitive ecosystems over India. Sci. Rep. 2017, 7, 13676. [Google Scholar] [CrossRef] [Green Version]
- Jish Prakash, P.; Stenchikov, G.; Kalenderski, S.; Osipov, S.; Bangalath, H. The impact of dust storms on the Arabian Peninsula and the Red Sea. Atmos. Chem. Phys. 2015, 15, 199–222. [Google Scholar] [CrossRef] [Green Version]
- Jin, Q.; Wei, J.; Pu, B.; Yang, Z.-L.; Parajuli, S.P. High summertime aerosol loadings over the Arabian Sea and their transport pathways. J. Geophys. Res. Atmos. 2018, 123, 10568–10590. [Google Scholar] [CrossRef]
- Vinjamuri, K.S.; Mhawish, A.; Banerjee, T.; Sorek-Hamer, M.; Broday, D.M.; Mall, R.K.; Latif, M.T. Vertical distribution of smoke aerosols over upper Indo-Gangetic Plain. Environ. Pollut. 2020, 257, 113377. [Google Scholar] [CrossRef] [PubMed]
- Rinker, J.P. Retrospective Geospatial Modeling of Pm10 Exposures from Open Burning at Joint Base Balad, Iraq. Thesis AFIT/GIH/ENV/11-M03. Available online: www.dtic.mil/cgi-bin/GetTRDoc?AD=ADA (accessed on 31 March 2011).
- Misak, R.; Al-Ajmi, D.; Al-Enezi, A. War-induced soil degradation, depletion, and destruction (the case of ground fortifications in the terrestrial environment of Kuwait). In Environmental Consequences of War and Aftermath; Handbook of Environmental Chemistry book series; Springer: Berlin/Heidelberg, Germany; Volume 3U, pp. 125–139.
- Tanaka, T.Y.; Kurosaki, Y.; Chiba, M.; Matsumura, T.; Nagai, T.; Yamazaki, A.; Uchiyama, A.; Tsunematsu, N.; Kai, K. Possible transcontinental dust transport from North Africa and the Middle East to East Asia. Atmos. Environ. 2005, 39, 3901–3909. [Google Scholar] [CrossRef]
- Tazaki, K.; Wakimoto, R.; Minami, Y.; Yamamoto, M.; Miyata, K.; Sato, K.; Saji, I.; Chaerun, S.K.; Zhou, G.; Morishita, T.; et al. Transport of carbon-bearing dusts from Iraq to Japan during Iraq’s War. Atmos. Environ. 2004, 38, 2091–2109. [Google Scholar] [CrossRef] [Green Version]
- U.S. Institute of Medicine. Long-Term Health Consequences of Exposure to Burn Pits in Iraq and Afghanistan; National Academies Press: Washington, DC, USA, 2011. Available online: https://lccn.loc.gov/2012392162 (accessed on 31 March 2011).
- Hofer, J.; Althausen, D.; Abdullaev, S.F.; Makhmudov, A.N.; Nazarov, B.I.; Schettler, G.; Engelmann, R.; Baars, H.; Fomba, K.W.; Müller, K.; et al. Long-term profiling of mineral dust and pollution aerosol with multiwavelength polarization Raman lidar at the Central Asian site of Dushanbe, Tajikistan: Case studies. Atmos. Chem. Phys. 2017, 17, 14559–14577. [Google Scholar] [CrossRef] [Green Version]
- Judd, L.M.; Al-Saadi, J.A.; Valin, L.C.; Pierce, R.B.; Yang, K.; Janz, S.J.; Kowalewski, M.G.; Szykman, J.J.; Tiefengraber, M.; Mueller, M. The dawn of geostationary air quality monitoring: Case studies from Seoul and Los Angeles. Front. Environ. Sci. 2018, 6, 85. [Google Scholar] [CrossRef]
- Chudnovsky, A.; Ben-Dor, E.; Kostinski, A.B.; Koren, I. Mineral content analysis of atmospheric dust using hyperspectral information from space. Geophys. Res. Lett. 2009, 36, L15811. [Google Scholar] [CrossRef] [Green Version]
- Chudnovsky, A.; Kostinski, A.; Herrmann, L.; Koren, I.; Nutesku, G.; Ben-Dor, E. Hyperspectral spaceborne imaging of dust-laden flows: Anatomy of Saharan storm from the Bodele depression. Remote Sens. Environ. 2011, 115, 1013–1024. [Google Scholar] [CrossRef]
- El-Gamily, H. Utilization of multi-dates LANDSAT_TM data to detect and quantify the environmental damages in the southeastern region of Kuwait from 1990 to 1991. Int. J. Remote Sens. 2007, 28, 1773–1788. [Google Scholar] [CrossRef]
- Al-Dousari, A.M.; Al-Awadhi, J. Dust fallout in norther Kuwait: Major sources and characteristics. Kuwait J. Sci. 2012, 39, 171–187. [Google Scholar]
- Koch, M.; El-Baz, F. Identifying the effects of the Gulf War on the geomorphic features of Kuwait by remote sensing and GIS (Review). Photogramm. Eng. Remote Sens. 1998, 64, 739–747. [Google Scholar]
- Husain, T. Terrestrial and atmospheric environment during and after the Gulf War. Environ. Int. 1998, 24, 189–196. [Google Scholar] [CrossRef]
- Pearce, F. Devastation in the desert. New Sci. 1995, 146, 40–43. [Google Scholar]
Figure 1.
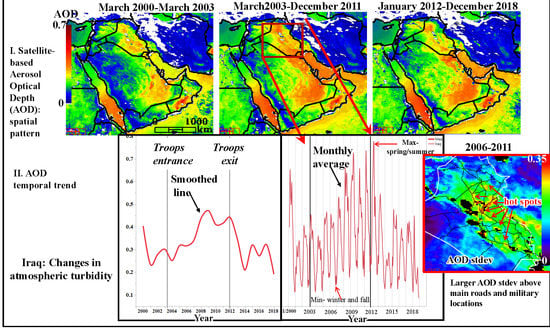
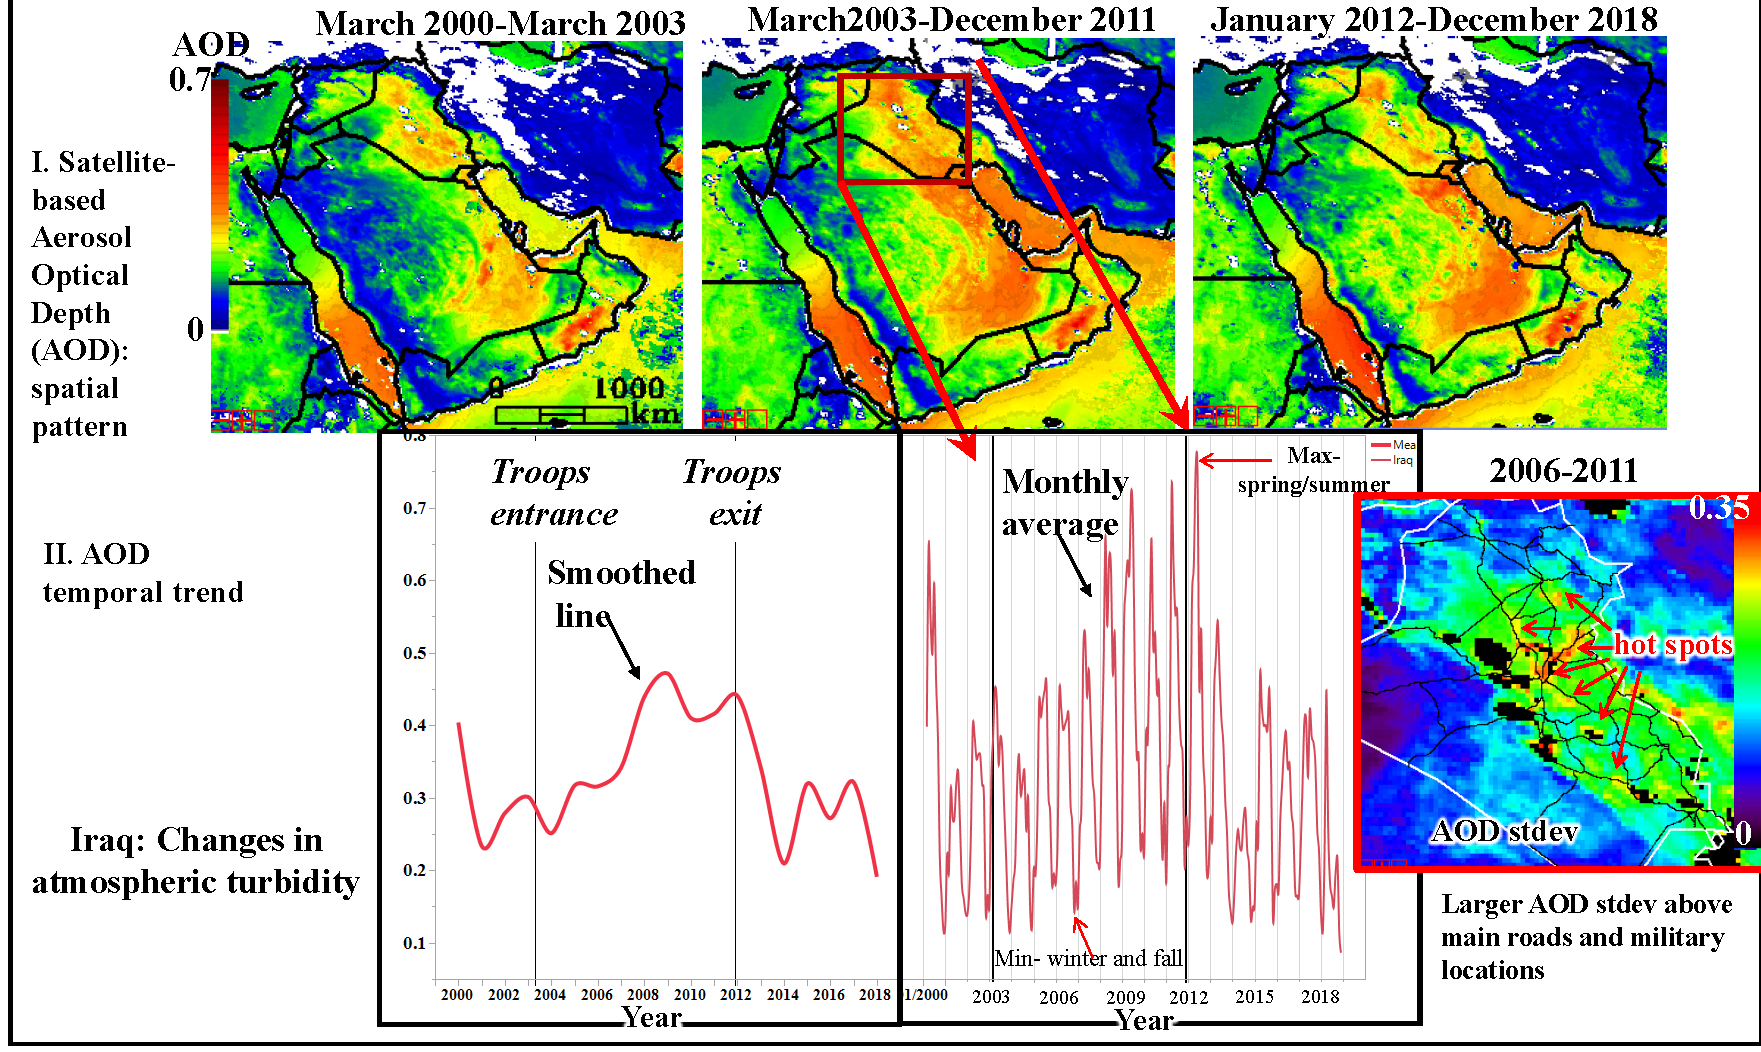
Aerosol optical depth (AOD) spatial and temporal variability over Iraq generated using an open source engine Giovanni (https://giovanni.gsfc.nasa.gov/giovanni/doc/UsersManualworkingdocument.docx.html). (A) Averaged AOD on a pixel basis over 1 March 2000–19 March 2003 (before US troop and coalition force entrance), 20 March 2003–31 December 2011 (presence of US and coalition forces), and 1 January 2012–31 December 2018 (post-war). (B) Monthly averaged AOD values over Iraq during 2000–US troop entrance was generally followed by an increase in AOD, whereas the converse is true upon troop withdrawal.
Figure 1.
Aerosol optical depth (AOD) spatial and temporal variability over Iraq generated using an open source engine Giovanni (https://giovanni.gsfc.nasa.gov/giovanni/doc/UsersManualworkingdocument.docx.html). (A) Averaged AOD on a pixel basis over 1 March 2000–19 March 2003 (before US troop and coalition force entrance), 20 March 2003–31 December 2011 (presence of US and coalition forces), and 1 January 2012–31 December 2018 (post-war). (B) Monthly averaged AOD values over Iraq during 2000–US troop entrance was generally followed by an increase in AOD, whereas the converse is true upon troop withdrawal.

Figure 2.
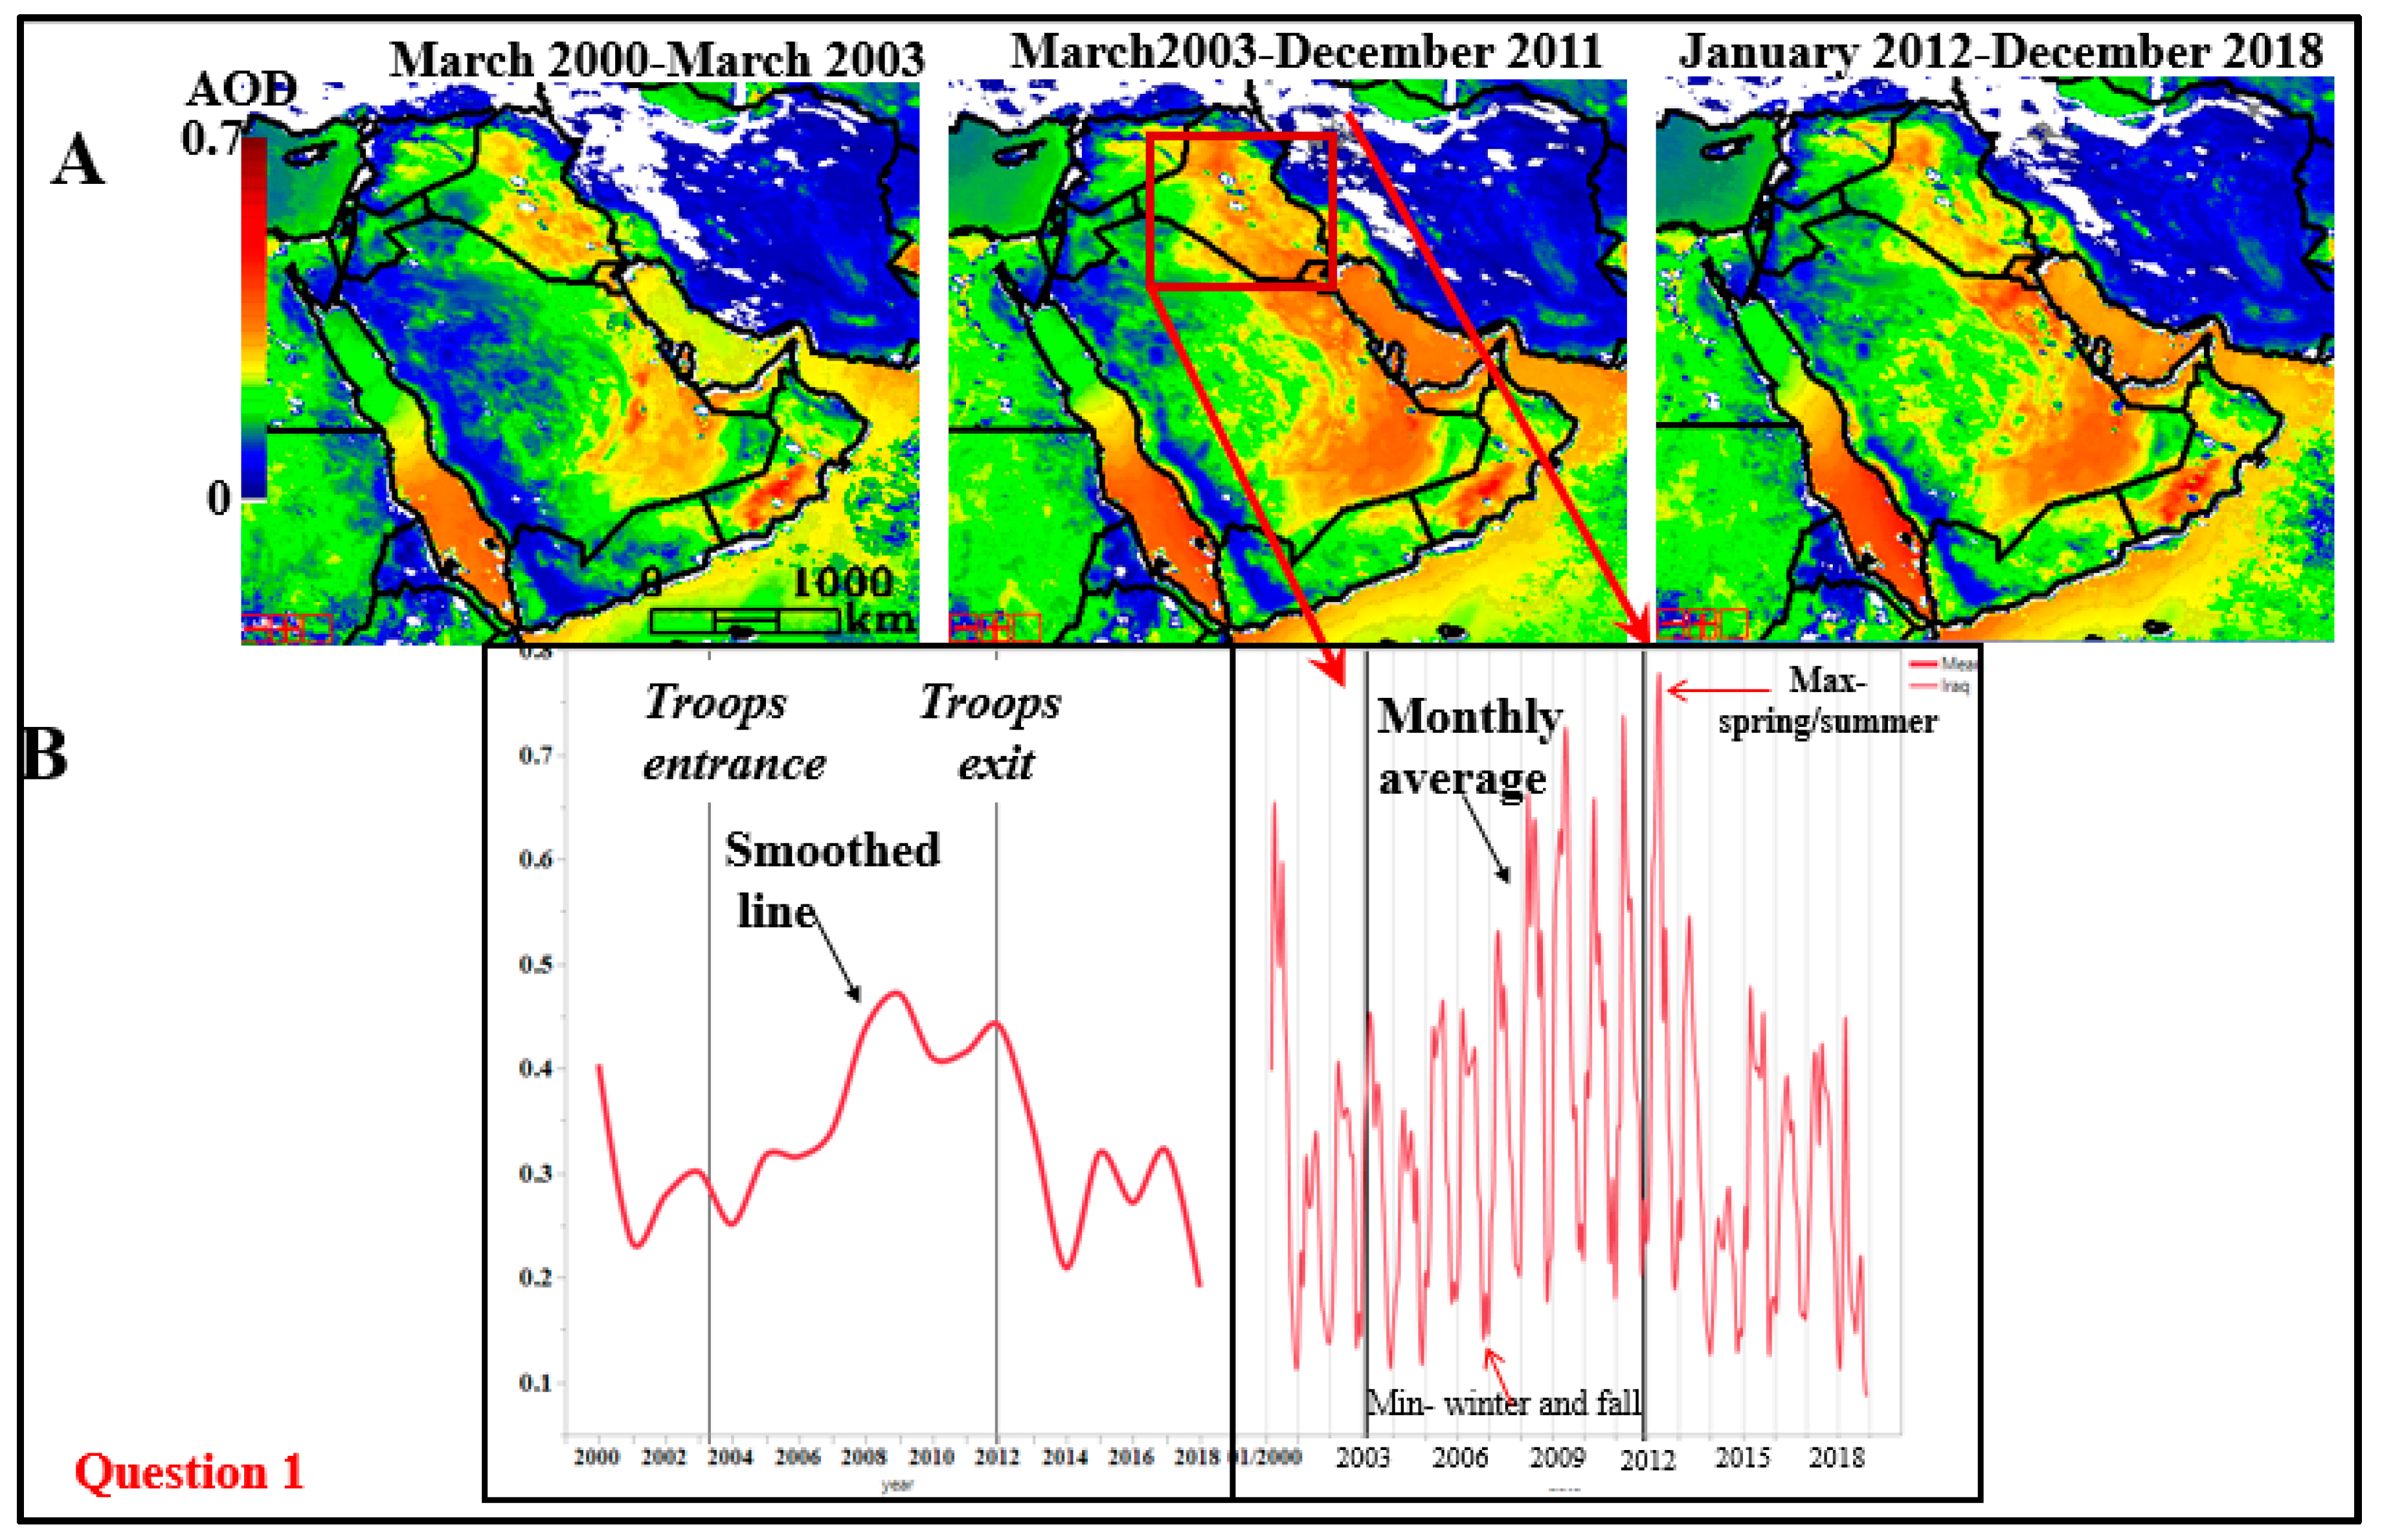
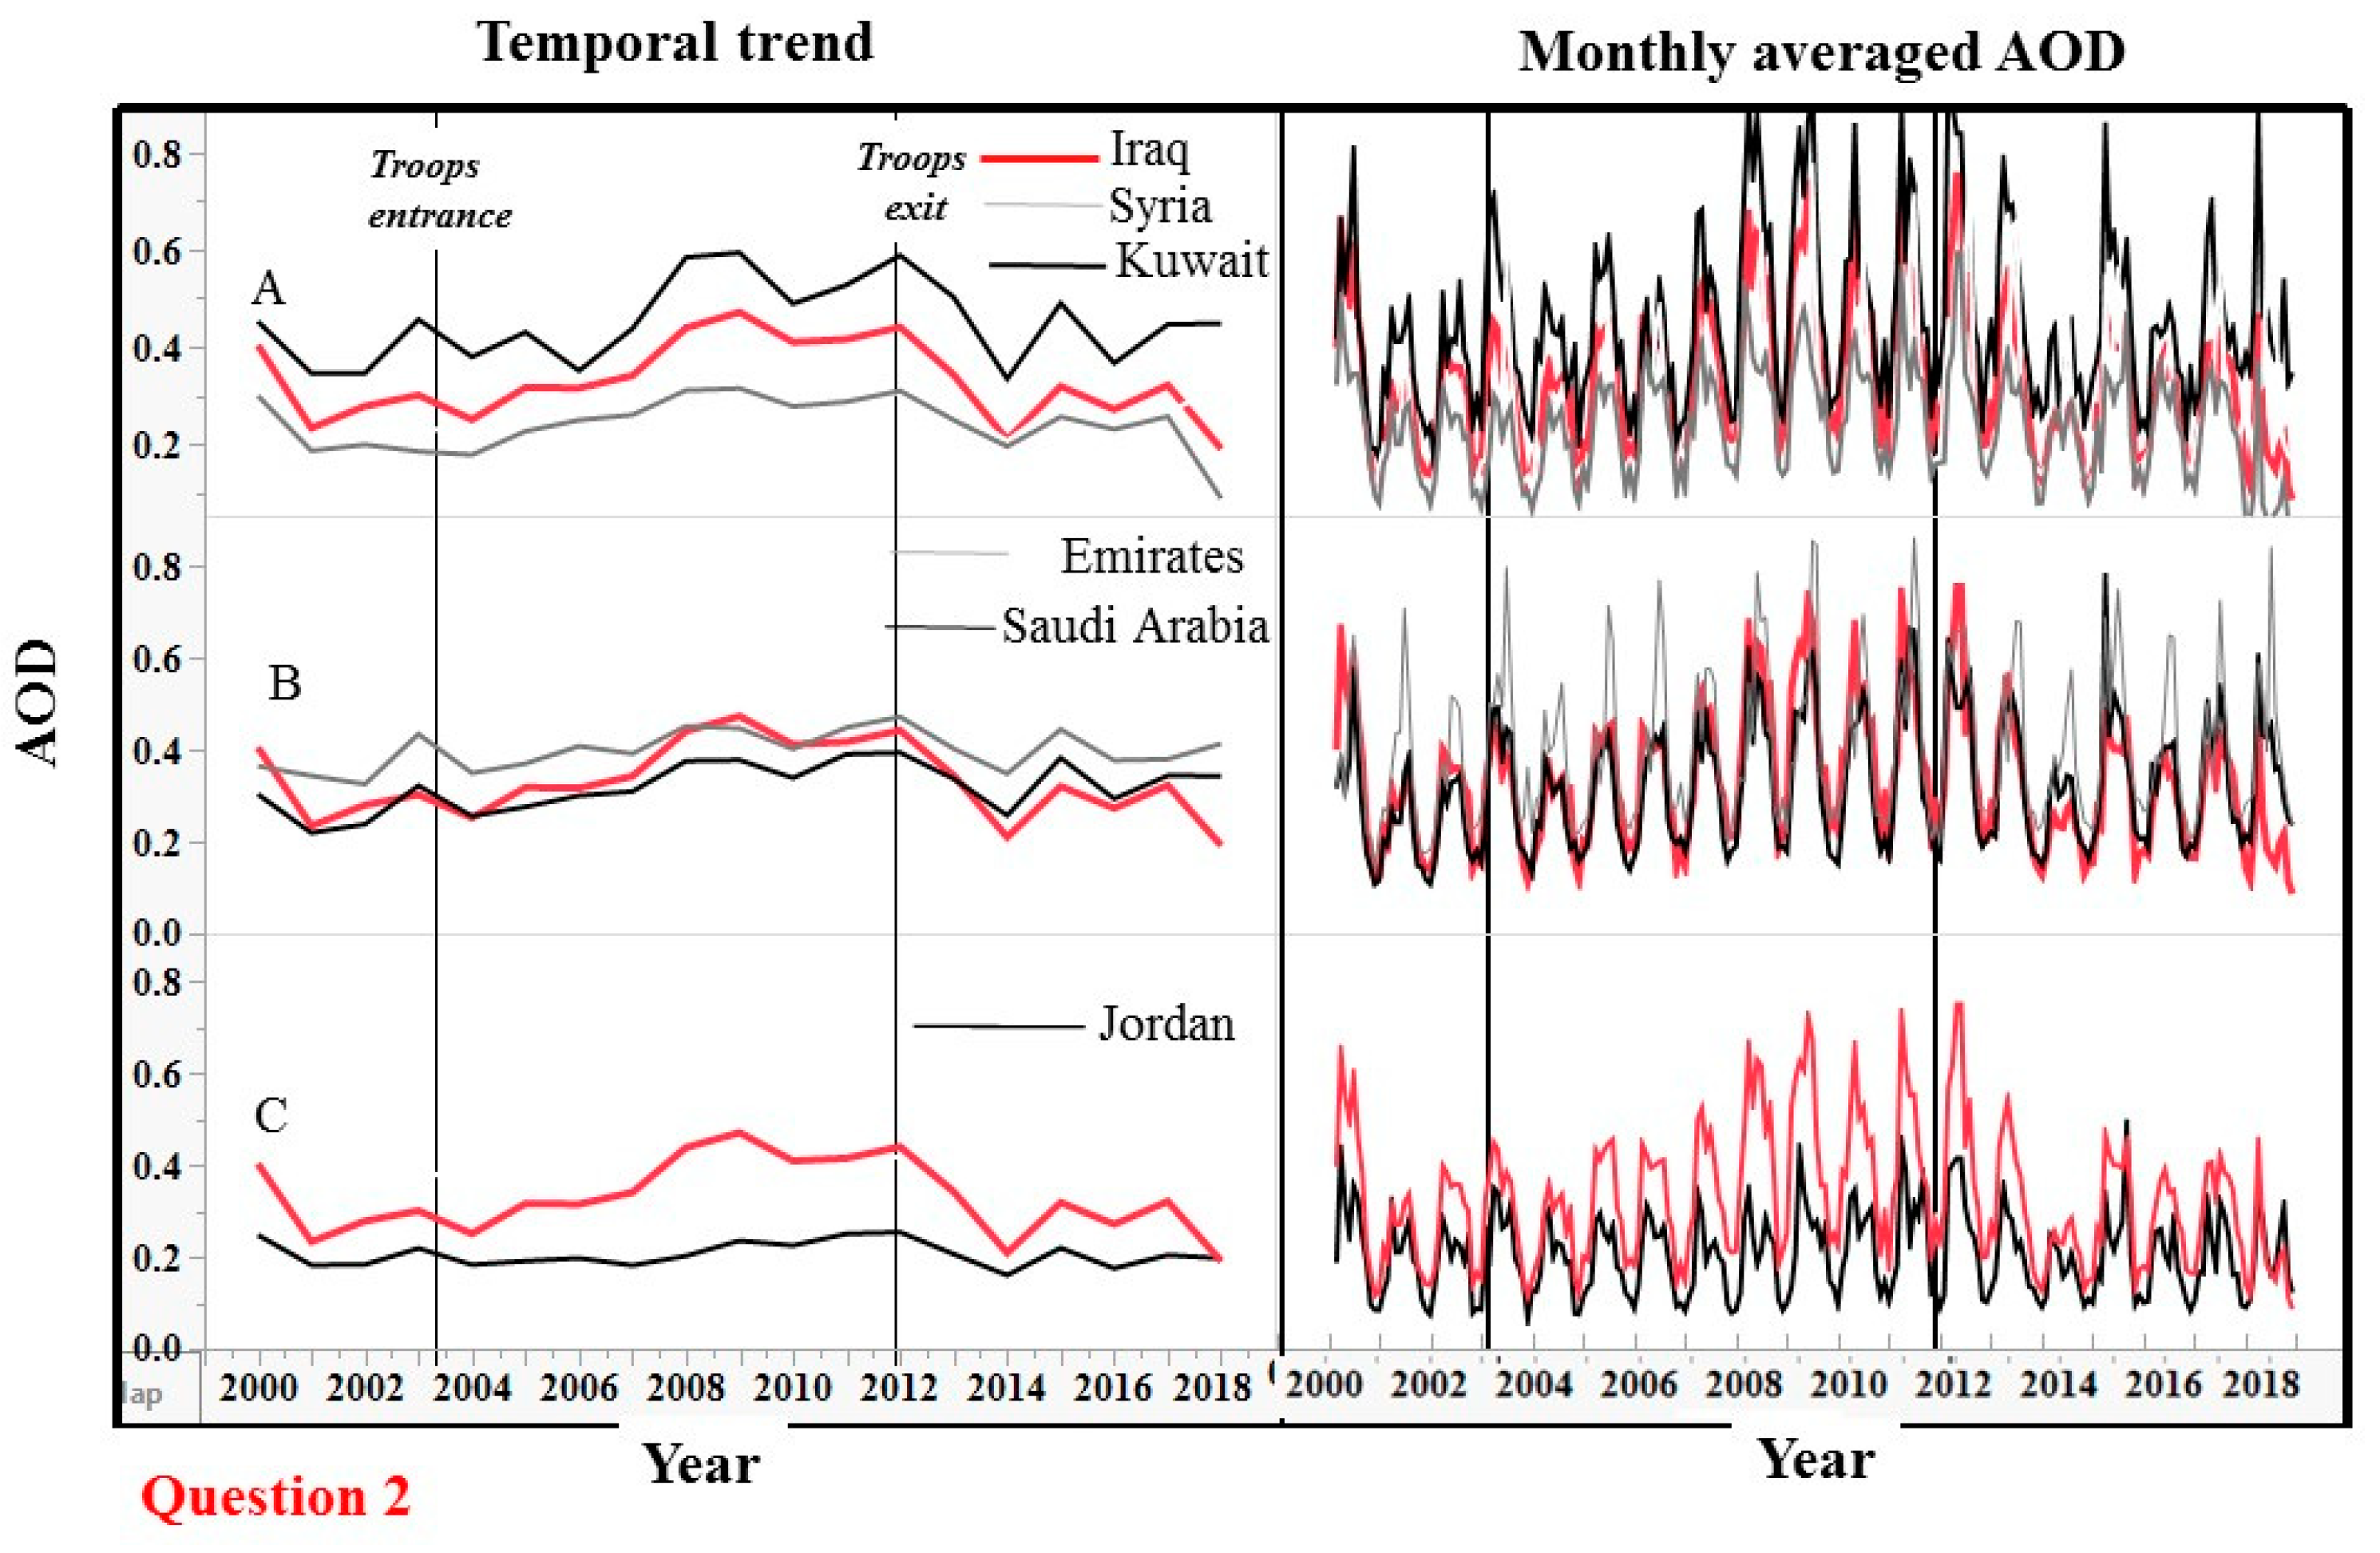
Comparison of monthly average AOD values between Iraq and adjacent countries. Left: smoothed average AOD, right: monthly average AOD. Iraq, Kuwait (A) and Saudi Arabia (B) show a similar increasing trend. Whereas the amplitude is larger for Kuwait, the amplitude for Iraq is larger than that for Saudi Arabia. However, the decrease in AOD between 2012 and 2018 is largest for Iraq. Iraq AOD pattern differs from those of Jordan and Syria (A,C). The data was generated using an open source engine Giovanni at 1 ° spatial resolution (https://giovanni.gsfc.nasa.gov/giovanni/doc/UsersManualworkingdocument.docx.html).
Figure 2.
Comparison of monthly average AOD values between Iraq and adjacent countries. Left: smoothed average AOD, right: monthly average AOD. Iraq, Kuwait (A) and Saudi Arabia (B) show a similar increasing trend. Whereas the amplitude is larger for Kuwait, the amplitude for Iraq is larger than that for Saudi Arabia. However, the decrease in AOD between 2012 and 2018 is largest for Iraq. Iraq AOD pattern differs from those of Jordan and Syria (A,C). The data was generated using an open source engine Giovanni at 1 ° spatial resolution (https://giovanni.gsfc.nasa.gov/giovanni/doc/UsersManualworkingdocument.docx.html).

Figure 3.
Map of military/anthropogenic sources in Iraq (based on Table 1). Black spots are also shown as resulting from oil refineries and a possible military activity signature as observed using the MODIS visible reflectance data source (MOD021 product). Locations of major military conflict areas are as reported by the media and air base locations were downloaded. Note that the spatial direction is along the main wind direction: west–northwest.

Figure 4.
Average percent change in AOD for different time frames. Here we assume that a positive change for all countries reflects the synoptic impact whereas an increase for only one country reflects local conditions. Calm periods are circled in red and indicated by red arrows; synoptic impact years are indicated by black arrows.

Figure 5.
Average percent change for selected time periods: “in war” and “post-war”. Case 1: large synoptic impact during military presence. Case 2: small synoptic impact during the same time period for comparison. Case 3: “post-war” reference showing a general decrease in AOD.
Figure 5.
Average percent change for selected time periods: “in war” and “post-war”. Case 1: large synoptic impact during military presence. Case 2: small synoptic impact during the same time period for comparison. Case 3: “post-war” reference showing a general decrease in AOD.


Figure 6.
Averaged seasonal AOD (Panel A) and AOD standard deviation (stdev) (Panel B) on a pixel basis over three time periods: 1 March 2000–19 March 2003 (before entrance of US troops and coalition forces), 20 March 2003–31 December 2011 (US and coalition forces present), and 1 January 2012–31 December 2018 (‘post-war” period).


Figure 7.
Standard deviation (stdev) of AOD during the three time periods (see legend in Figure 6). Highlighted in red are all pixels with stdev above 0.15. All pixels were counted and are shown.
Figure 7.
Standard deviation (stdev) of AOD during the three time periods (see legend in Figure 6). Highlighted in red are all pixels with stdev above 0.15. All pixels were counted and are shown.

Figure 8.
Percent change in AOD (top row) and AOD stdev (bottom row) in winter between Periods 1 and 2 (left) and 2 and 3 (right). Blue pixels are military sites. Reddish colors indicate increase whereas black and grey indicate decrease. Period 1: 1 March 2000–19 March 2003 (before OIF); Period 2: 20 March 2003–31 December 2011 (presence of US forces); Period 3: 1 January 2012–31 December 2018 (post-war).

Figure 9.
Average stdev of AOD in summer for different periods. We see an increase in AOD stdev in all areas indicated by red arrows (zoom-in on 2006–2011). These are areas with high anthropogenic activity. The stdev of AOD during 2006–2011 is also much larger than during the other reference periods.

Figure 10.
Balad military air base site and PM10 sampling locations during 2004–2009 based on publically available data [60]. (A) Box plot of mg PM10 per m3 confirms the increase in PM10 and distinct temporal pattern variability. (B) Spatial variability between different locations.
Figure 10.
Balad military air base site and PM10 sampling locations during 2004–2009 based on publically available data [60]. (A) Box plot of mg PM10 per m3 confirms the increase in PM10 and distinct temporal pattern variability. (B) Spatial variability between different locations.


Table 1.
List of datasets used in our study.
| Dataset | Parameters Used | Link to Data Source |
|---|---|---|
| MODIS AOD at 10 km MOD04_L2 | SDS AOD_550_Dark_Target_Deep_Blue_Combined | https://neo.sci.gsfc.nasa.gov/ https://ladsweb.modaps.eosdis.nasa.gov/missions-and-measurements/products/MOD04_L2/; https://ladsweb.modaps.eosdis.nasa.gov/archive/allData/61/MOD04_L2/ |
| MOD021KM | Level 1 calibrated radiances | https://ladsweb.modaps.eosdis.nasa.gov/search/order/1/MOD04_L2--61,MCD19A2N--6,MCD19A2--6,MOD021KM--61 |
| Anthropogenic sources | Locations, roads, military force movements, battle data layers were created or downloaded in a shape format and uploaded using ArcGIS environment |
|
| Airports in Iraq, Humanitarian data exchange | Airports (large, medium, and small), heliports and air bases (total 77 locations) | https://data.humdata.org/dataset/ourairports-irq |
| PM10 particle concentrations | Measured at Balad military air base during 2004–2009 | https://apps.dtic.mil/dtic/tr/fulltext/u2/a539684.pdf |
Table 2.
Percent changes in AOD and AOD stdev over military sites (N = 65–70) between Periods 1 and 2 and Periods 2 and 3.a
Table 2.
Percent changes in AOD and AOD stdev over military sites (N = 65–70) between Periods 1 and 2 and Periods 2 and 3.a
| AOD Change (%) | AOD Stdev Change (%) | |||||
|---|---|---|---|---|---|---|
| % Change between Period 1 and Period 2 | % Change between Period 2 and Period 3 | The Percent Difference between Both Periods | % Change between Period 1 and Period 2 | % Change between Period 2 and Period 3 | The Percent Difference between Both Periods | |
| Winter | 39 | −27 | 12 | 57 | −44 | 13 |
| Spring | 13.5 | −28 | −14.5 | 3 | −29 | −26 |
| Summer | 27 | −24 | 3 | 48 | −44 | 4 |
| Fall | 25 | −12.3 | 12.7 | 38.5 | −12 | 26.5 |
a Period 1: 1 March 2000–19 March 2003 (before Operation Iraqi Freedom (OIF)); Period 2: 20 March 2003–31 December 2011 (presence of US forces); Period 3: 1 January 2012–31 December 2018 (post-war).
Table 3.
Same as Table 2 but estimated for Iraq. Similarly, the largest change is during the winter and fall periods, which are characterized by a lower amount of dust storms compared to spring and summer.a.
Table 3.
Same as Table 2 but estimated for Iraq. Similarly, the largest change is during the winter and fall periods, which are characterized by a lower amount of dust storms compared to spring and summer.a.
| AOD Change (%) | AOD Stdev Change (%) | |||||
|---|---|---|---|---|---|---|
| % Change between Period 1 and Period 2 | % Change between Period 2 and Period 3 | The Percent Difference between Both Periods | % Change between Period 1 and Period 2 | % Change between Period 2 and Period 3 | The Percent Difference between Both Periods | |
| Winter | 37 | −22 | 15 | 35 | −38 | −3 |
| Spring | 17 | −22 | −5 | 6.4 | −14 | −7.6 |
| Summer | 19.5 | −22 | −2.5 | 32 | −26 | 6 |
| Fall | 26 | −11.5 | 14.5 | 11 | −3 | 8 |
a Period 1: 1 March 2000–19 March 2003 (before OIF); Period 2: 20 March 2003–31 December 2011 (presence of US forces); Period 3: 1 January 2012–31 December 2018 (post-war).
© 2020 by the authors. Licensee MDPI, Basel, Switzerland. This article is an open access article distributed under the terms and conditions of the Creative Commons Attribution (CC BY) license (http://creativecommons.org/licenses/by/4.0/).
Share and Cite
MDPI and ACS Style
Chudnovsky, A.; Kostinski, A. Secular Changes in Atmospheric Turbidity over Iraq and a Possible Link to Military Activity. Remote Sens. 2020, 12, 1526. https://0-doi-org.brum.beds.ac.uk/10.3390/rs12091526
AMA Style
Chudnovsky A, Kostinski A. Secular Changes in Atmospheric Turbidity over Iraq and a Possible Link to Military Activity. Remote Sensing. 2020; 12(9):1526. https://0-doi-org.brum.beds.ac.uk/10.3390/rs12091526
Chicago/Turabian StyleChudnovsky, Alexandra, and Alexander Kostinski. 2020. "Secular Changes in Atmospheric Turbidity over Iraq and a Possible Link to Military Activity" Remote Sensing 12, no. 9: 1526. https://0-doi-org.brum.beds.ac.uk/10.3390/rs12091526
Note that from the first issue of 2016, this journal uses article numbers instead of page numbers. See further details here.