Article

Monitoring 2011–2020 Traffic Patterns in Wuhan (China) with COSMO-SkyMed SAR, Amidst the 7th CISM Military World Games and COVID-19 Outbreak

1
LIESMARS, Wuhan University, Wuhan 430079, China
2
Italian Space Agency (ASI), Via del Politecnico snc, 00133 Rome, Italy
*
Author to whom correspondence should be addressed.
Remote Sens. 2020, 12(10), 1636; https://0-doi-org.brum.beds.ac.uk/10.3390/rs12101636
Submission received: 17 April 2020 / Revised: 15 May 2020 / Accepted: 18 May 2020 / Published: 20 May 2020
(This article belongs to the Section Urban Remote Sensing)

Abstract

:
Vehicle detection from satellite imagery can support different applications, such as security and situational awareness. In the civilian domain, it can provide quantitative evidence to investigate urban mobility and traffic patterns in cities. Satellite synthetic aperture radar (SAR) can help in detecting vehicles in (almost) all weather conditions and during the day and night. In this study, the capability of SAR StripMap imaging mode data to monitor traffic is analyzed using the case study of Wuhan, China. In ordinary times, the bridges crossing the Yangtze river are the key infrastructure allowing for urban mobility in Wuhan. More recently, the city has been the first in the world to be put in lockdown due to the outbreak of the Coronavirus Disease of 2019 (COVID-19). Using a very long time series of 294 COSMO-SkyMed StripMap HIMAGE mode scenes collected from 2011 to 2020, we detected vehicles on seven bridges, estimated their speed, and analyzed the traffic pattern over time. Vehicles are detected based on their azimuth shift caused by their across-track motion. Our goal is to monitor the variations in traffic instead of single-car detection. The results from 2011 to 2019 show a general increase in the number of vehicles crossing the bridges, as new infrastructure was built over the years. Variations in detected vehicle numbers were especially found during the two events of the 7th International Military Sports Council (CISM) Military World Games in October 2019, and the COVID-19 lockdown in early 2020. These events were therefore used for internal validation of our assessment of traffic patterns. On the other side, TomTom traffic index data were used for external validation. The results and their comparison with TomTom data prove the effectiveness of our method in detecting traffic patterns, but also demonstrate that mostly large vehicles (e.g., trucks or buses) are detected. Future work should be carried out to improve the detection rate of smaller vehicles.

Graphical Abstract

1. Introduction

Synthetic aperture radar (SAR) achieves high spatial resolution in the range direction by using a frequency modulated signal, and in the azimuth direction by analyzing the Doppler frequency shift caused by the motion of the radar sensor onboard the satellite platform [1]. The precise positioning in azimuth is distorted though, if the monitored object is moving, and causes Doppler frequency shifts. This effect can also be used to detect moving targets, for example by using along-track interferometry, that allows for a precise measurement of the motion of fast objects [1,2,3].
However, when no such data are available, the displacement of moving objects can also be detected through the analysis of the amplitude of SAR images [4]. In such cases, the technical challenges that need to be accounted for include situations when the displaced targets overlap with other objects, as well as the limited backscattering strength of vehicles, making them hard to distinguish against the speckle noise. To achieve a sufficient signal-to-clutter ratio (SCR), a background with very low backscattering is necessary to clearly identify the relatively weak signal coming from the displaced vehicles. In this regard, water can offer an ideal medium. In most cases, calm water surfaces reflect the incoming microwave signal away from the sensor and lead to very low backscattering. Therefore, vehicles crossing bridges that are displaced over the nearby calm water surface can be detected in amplitude SAR images. It is this condition that has been exploited in the present research to screen 294 X-band SAR images collected in StripMap HIMAGE mode by the Italian Space Agency (ASI)’s Constellation of Small Satellites for Mediterranean Basin Observation (COSMO-SkyMed) in the period 2011–2020, analyzing changes in traffic patterns for the bridges crossing the Yangtze river in Wuhan, the capital city of Hubei province in China.
For the detection of moving targets, typically dual- or multi-channel SAR acquisitions are used. By analyzing single-channel SAR data, moving targets can also be identified [5,6]. The common approach is the separation of the data into sub-looks and comparison of the sub-looks including the moving objects, which are taken with a small-time difference. However, such sub-channels and sub-look approaches do degrade the spatial resolution. As we demonstrate in our experiments, the native spatial resolution of SAR images acquired in StripMap mode (i.e., 3 m by 3 m in the case of COSMO-SkyMed HIMAGE data) already sets a technical limit for the identification of smaller moving vehicles (e.g., small family cars). Therefore, target detection approaches leading to degradation of spatial resolution are less suitable. For this reason, we have intentionally used a signal processing approach based on the geometrical properties of moving targets in SAR images to identify vehicles against a dark background.
In this paper, we focus on the changes in the traffic patterns in Wuhan both in ordinary times and in relation to recent external events, especially those that have implied travel and urban mobility restrictions. In particular, we analyze the influence on traffic caused by public holidays and weekends, as well as by the following two events:
  • the 7th International Military Sports Council (CISM) Military World Games 2019 held in Wuhan from 18 to 27 October 2019, during which there were traffic bans on heavy vehicle mobility through bridges;
  • the lockdown of Wuhan as of 10:00 a.m. on 23 January 2020, including the restrictive measures on the inner-city traffic, due to the outbreak of the Coronavirus Disease of 2019 (COVID-19) or SARS-CoV-2 [7].
We do not aim at detecting each vehicle, which will be explained in more detail in the methodology section, but the general traffic patterns. Due to the smearing and speckling effect, we estimate that only vehicles with a large radar cross section (RCS) are identified successfully and we assume that those are mostly trucks or buses.
In the next section, we introduce the SAR data and the methodology used. In Section 3, we show the results of our experiments, and discuss them in Section 4. Finally, conclusions are drawn.

2. Data and Methods

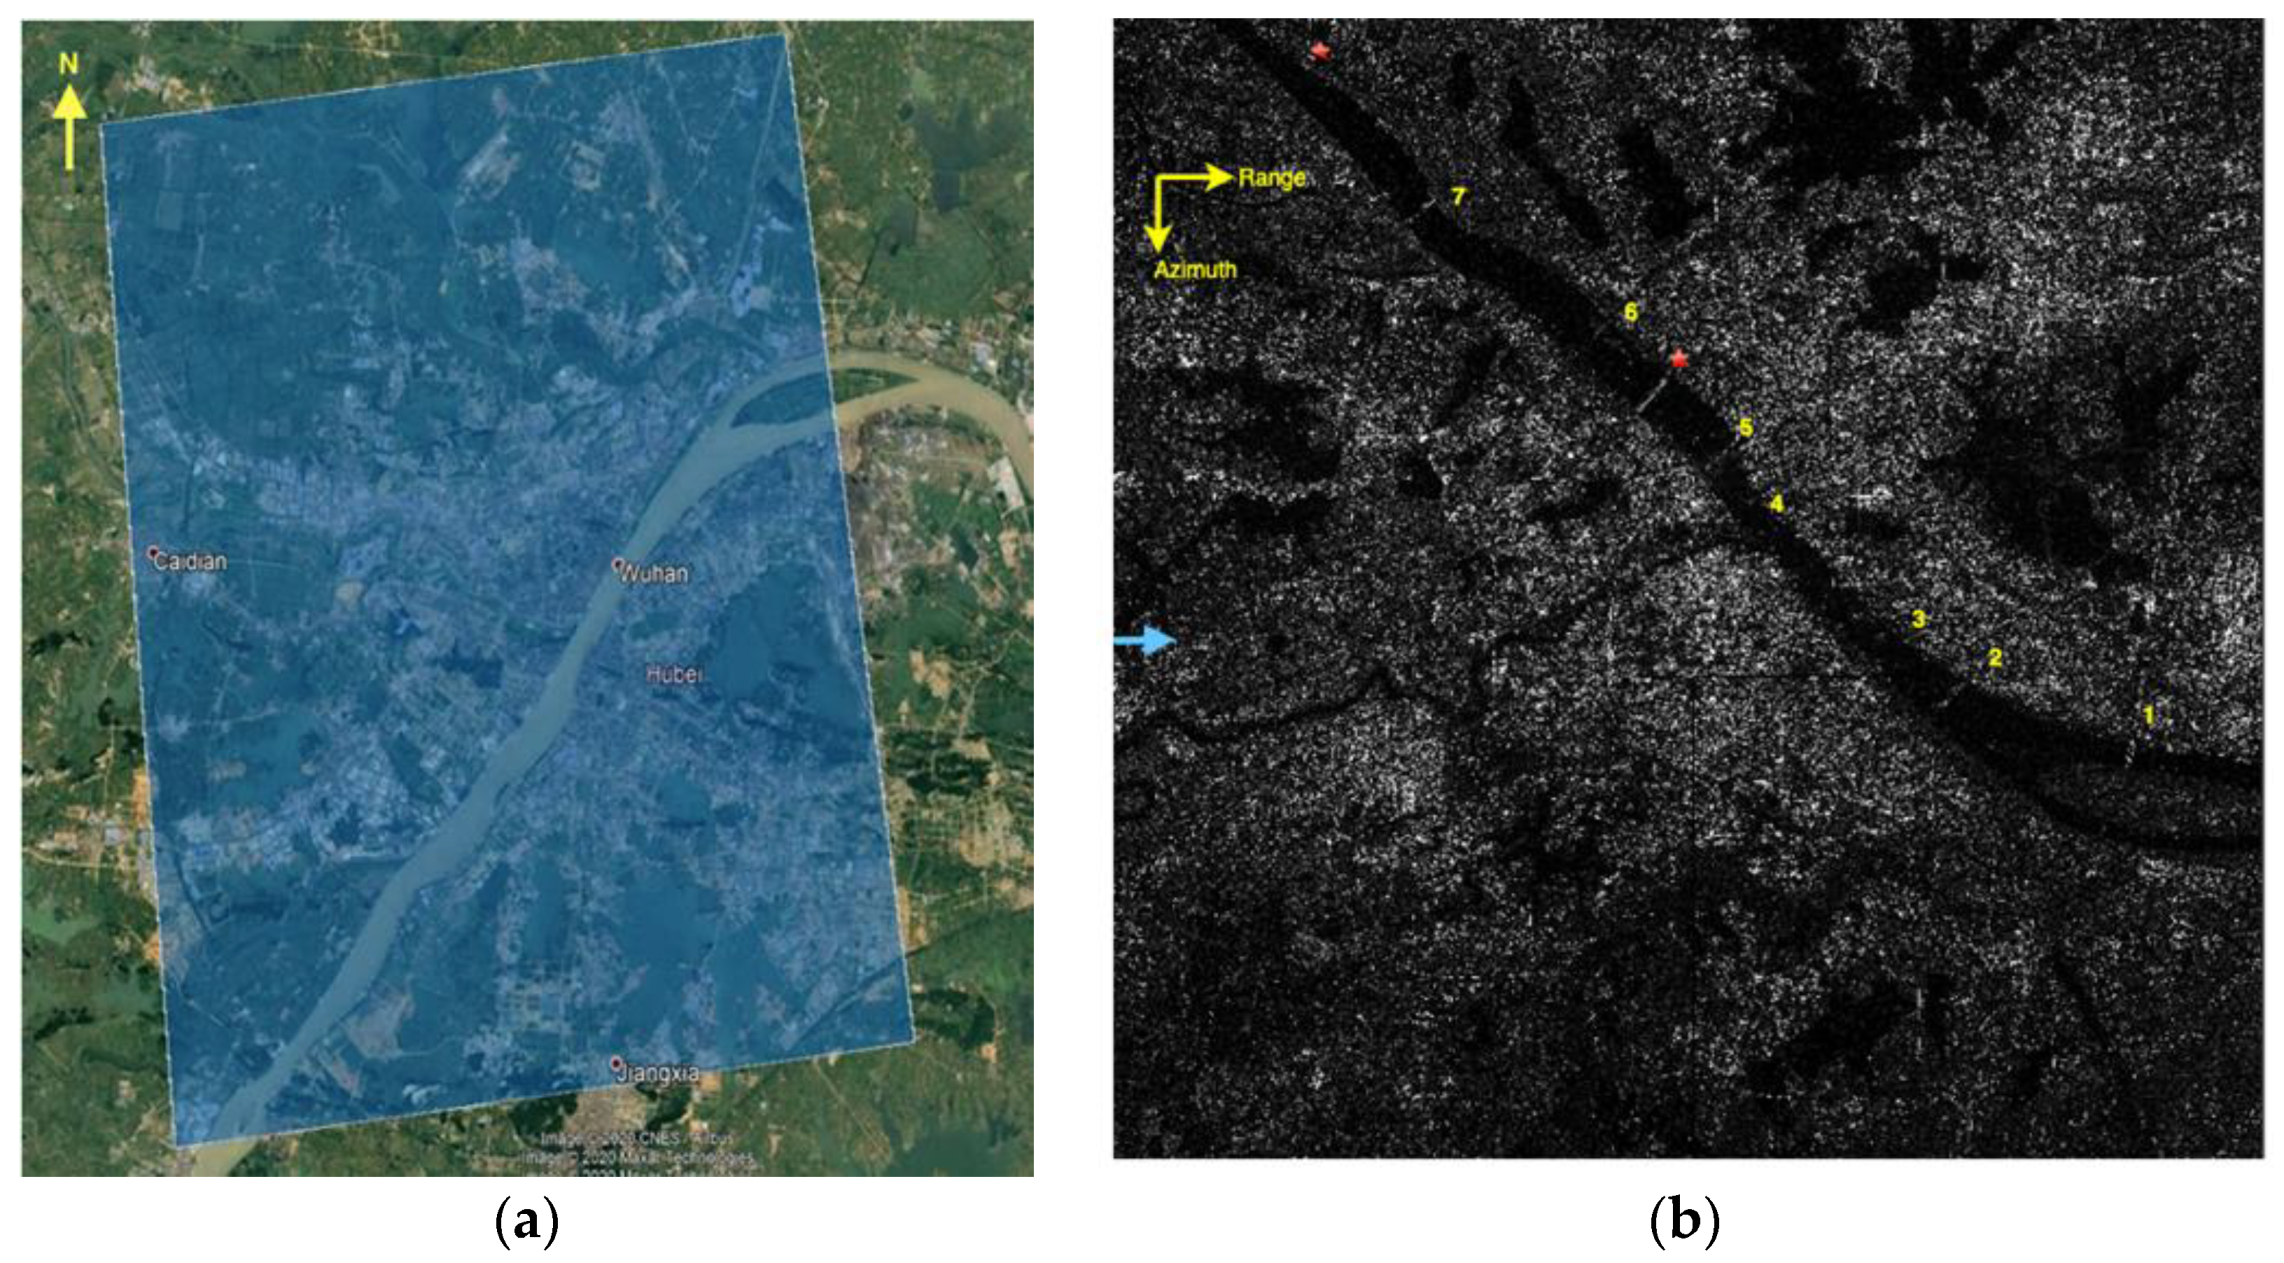
2.1. COSMO-SkyMed StripMap SAR Data Stack

We analyzed a total of 294 images acquired over the city of Wuhan by ASI’s COSMO-SkyMed constellation [8,9] in X-band (3.1 cm wavelength) along ascending orbits, using StripMap HIMAGE mode (beam H4-01), with HH polarization and an incidence angle at the scene center of about 26.6°, from 29 May 2011 to 23 February 2020. This data stack was acquired in the framework of the COSMO-SkyMed Background Mission [10], and was accessed as Level 1A, single-look complex slant products (SCS), i.e., raw data focused in slant range and zero Doppler projection (i.e., the sensor natural acquisition projection). SCS products contain in-phase and quadrature of the focused data, weighted and radiometrically equalized [11]. The swath extent of approximately 50 km × 40 km allowed us to cover the majority of the urban footprint of Wuhan and, most importantly, nine bridges crossing the Yangtze river (Figure 1a). Two (i.e., Yangsigang Changjiang Bridge and Wuhan Junshan Yangtze River Bridge) out of the nine bridges identified with red stars and shown in Figure 1b were excluded from the analysis because their construction was completed only recently.
The data stack provided very high temporal resolution across the whole observation interval, owing to a nominal site revisit of 16 days with each satellite. In particular, the dataset of Wuhan allowed a revisit time of 10 (average), 8 (median) and 4 (mode) days, since the full constellation of four COSMO-SkyMed satellites was exploited. The histogram of the temporal baselines is shown in Figure 2. Accounting that other X-band SAR missions at equal StripMap spatial resolution (e.g., TerraSAR-X) provide 11-day revisit time at best, and the C-band Sentinel-1 constellation up to 6 days, but with much coarser resolution (i.e., 5 m × 20 m, single look), the revisit time achieved with the COSMO-SkyMed data stack is the best currently available over Wuhan, and ideal to analyze traffic patterns.
In this regard, it is important to note that all the COSMO-SkyMed images were collected at the same hour of the day, i.e., at about 10:00 p.m. UTC time, equal to 06:00 a.m. local time, given the ascending orbit. During the 9-year long period of observation, some of the bridges were already built (i.e., Tianxingzhou Changjiang, Erqi Changjiang, Changjiang Bridge No. 2, Changjiang Bridge No. 1, Baishazhou Bridge), while others were under construction but were completed before 2020 (i.e., Xiongchu Street Elevated Bridge, and Zhuankou Changjiang Bridge) and therefore COSMO-SkyMed time series captured different phases of construction and use. The details of the investigated bridges are provided in Table 1.

2.2. TomTom Index Data

TomTom is a global online traffic index web platform that generates traffic congestion calculations by collecting and analyzing GPS data to monitor vehicles on roads since 2008 [12]. The traffic index data come from the community of hundreds of millions of drivers, who use TomTom technology in navigation devices, in-dash systems and smartphones. Using this database, TomTom published a traffic index ranking for more than 160 cities worldwide with regard to the year 2013, which has now been enhanced to 416 cities with regard to the year 2019. Using this traffic index, urban congestion of big cities around the globe can be monitored throughout the year. TomTom provides free hourly, daily, and weekly data; however, free data are only available for up to one week. With these extensive data and detailed insight into the road congestion level of the cities, traffic can be tackled and analyzed by drivers, automakers, urban-city planners, or policy makers. For example, TomTom historical traffic data were used to calculate travel time and reliability [13]. Road congestion affects the development of the economy and society one way or the other. In the United States, augmentation of traffic congestion was analyzed using TomTom index [14].
This index has the ability to highlight the impact of seasonality, special events, and incidents on traffic density. Therefore, in the absence of ground truth data collected in the field, we have used the 7th CISM Military World Games and COVID-19 lockdown as internal validation events, while using TomTom as an external validation index. The outcomes of the validation with TomTom traffic index are discussed in Section 3.5.

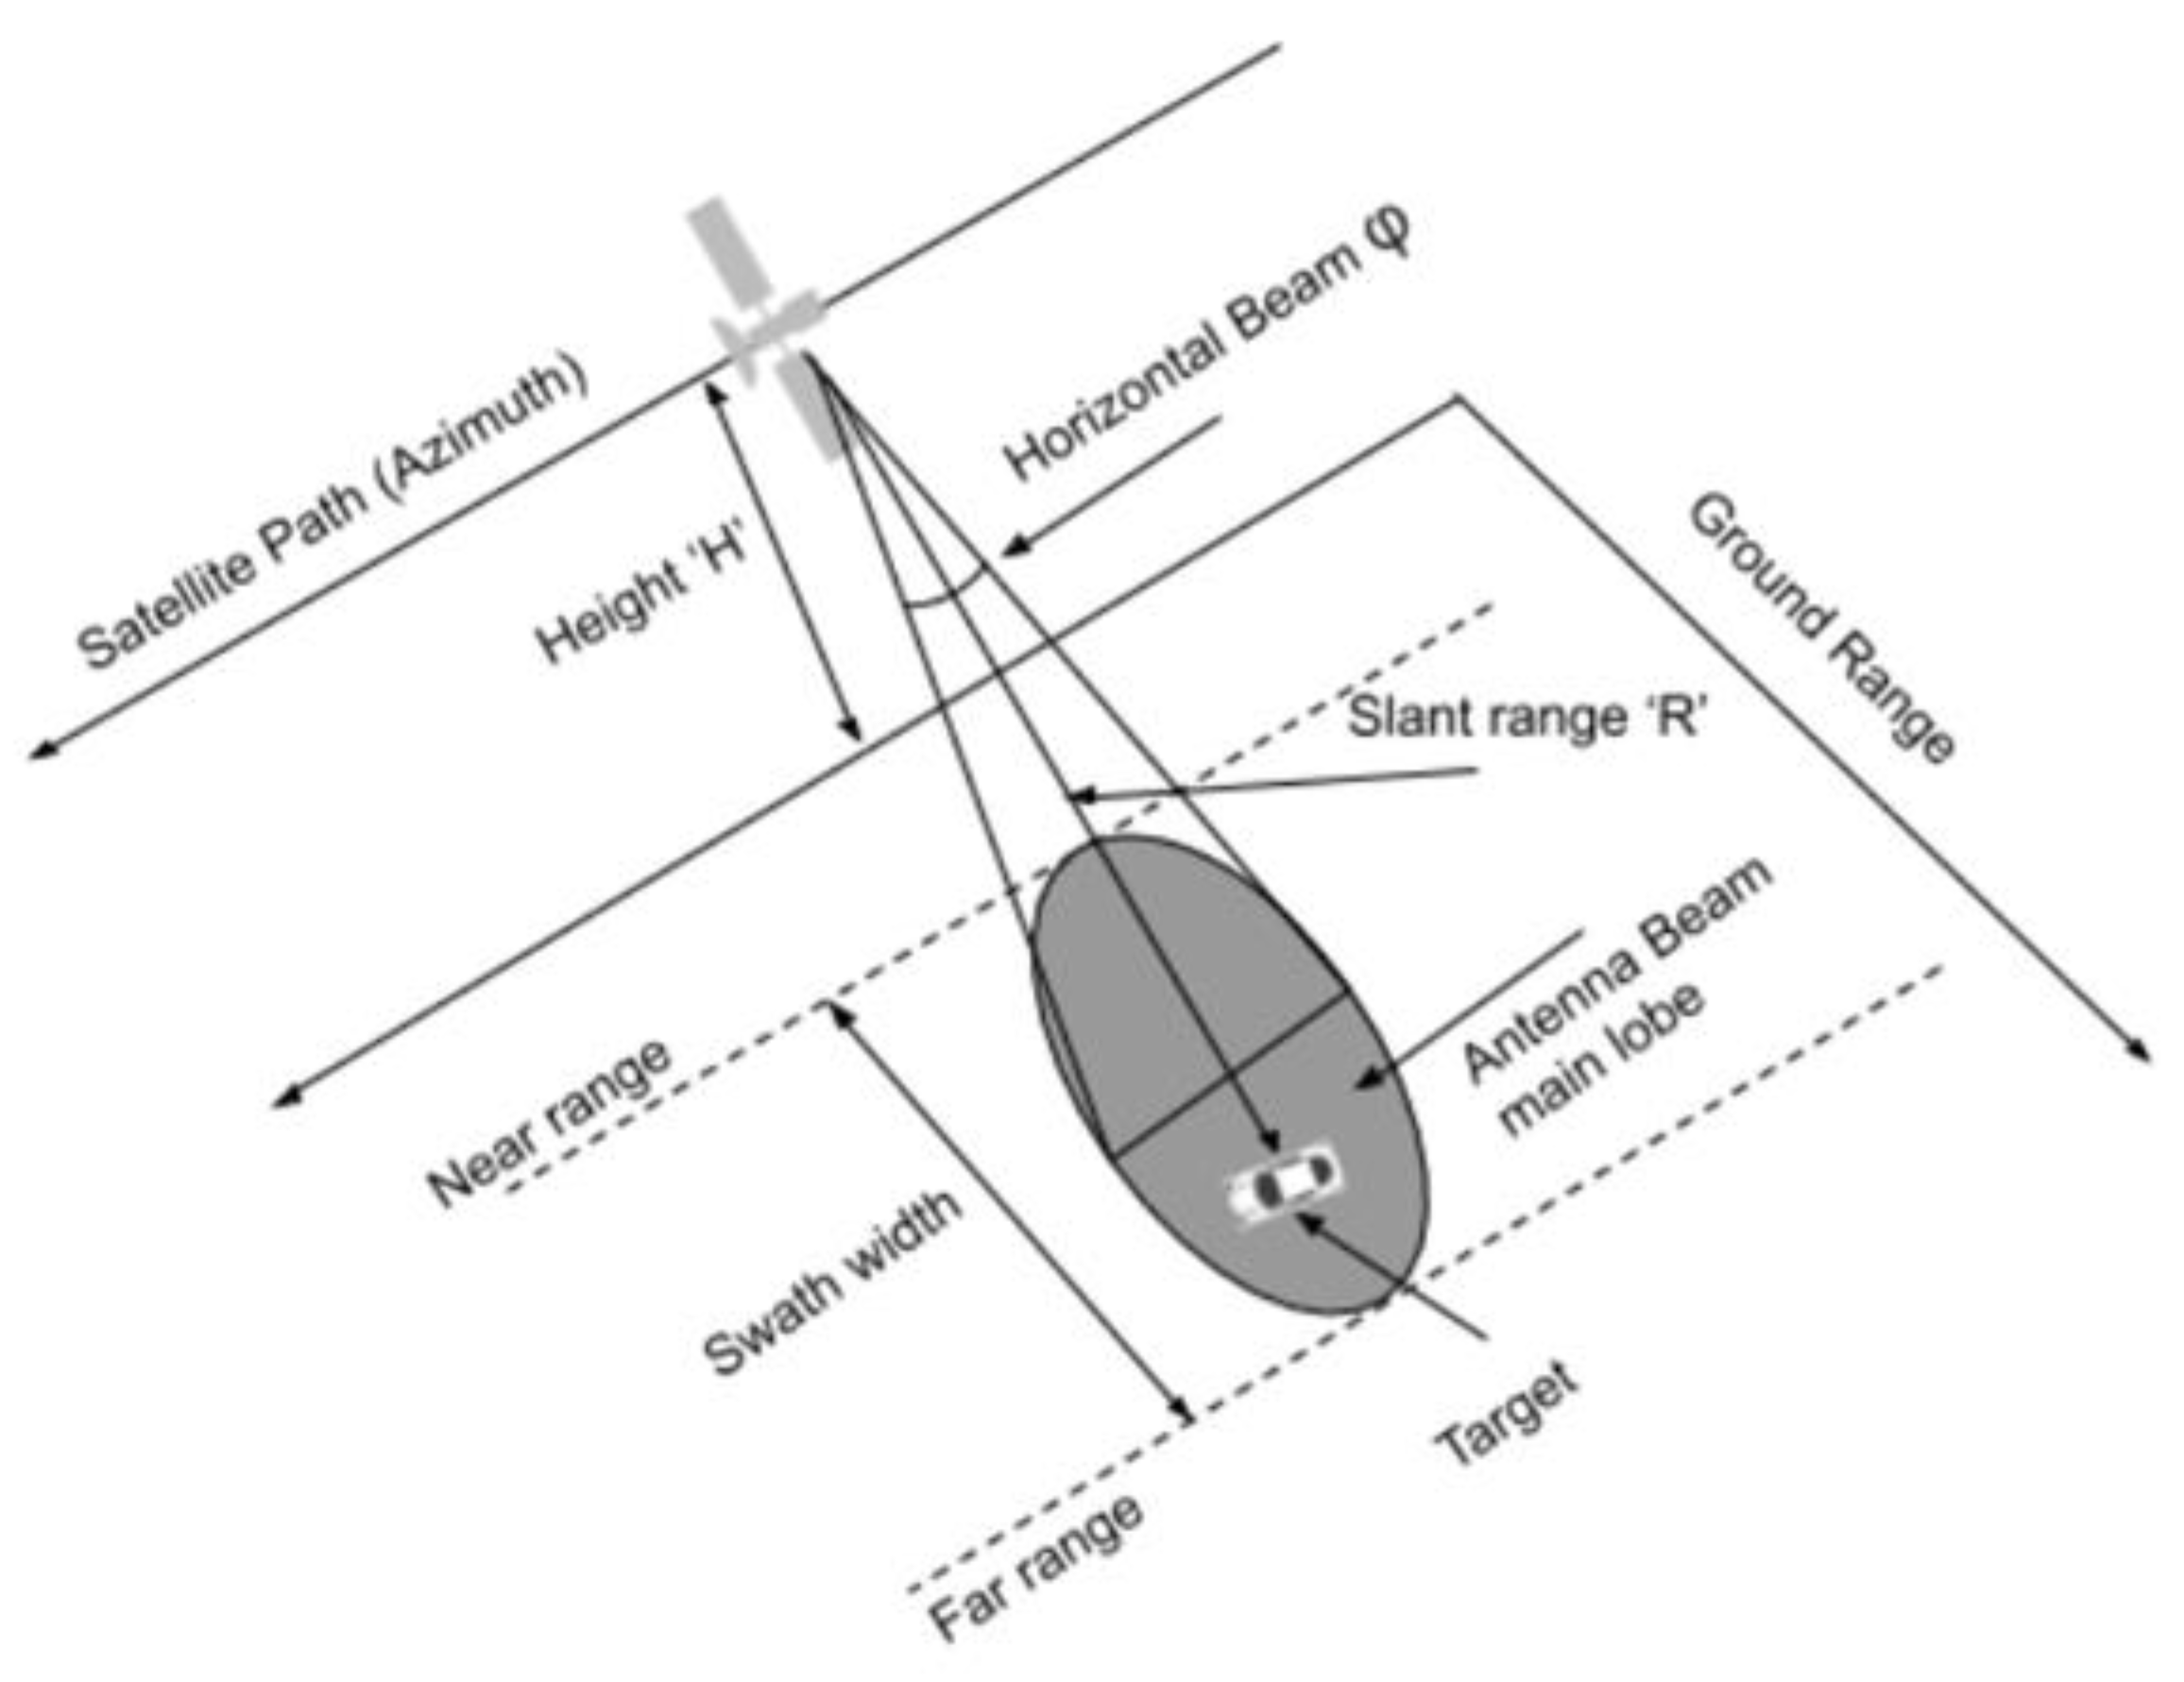
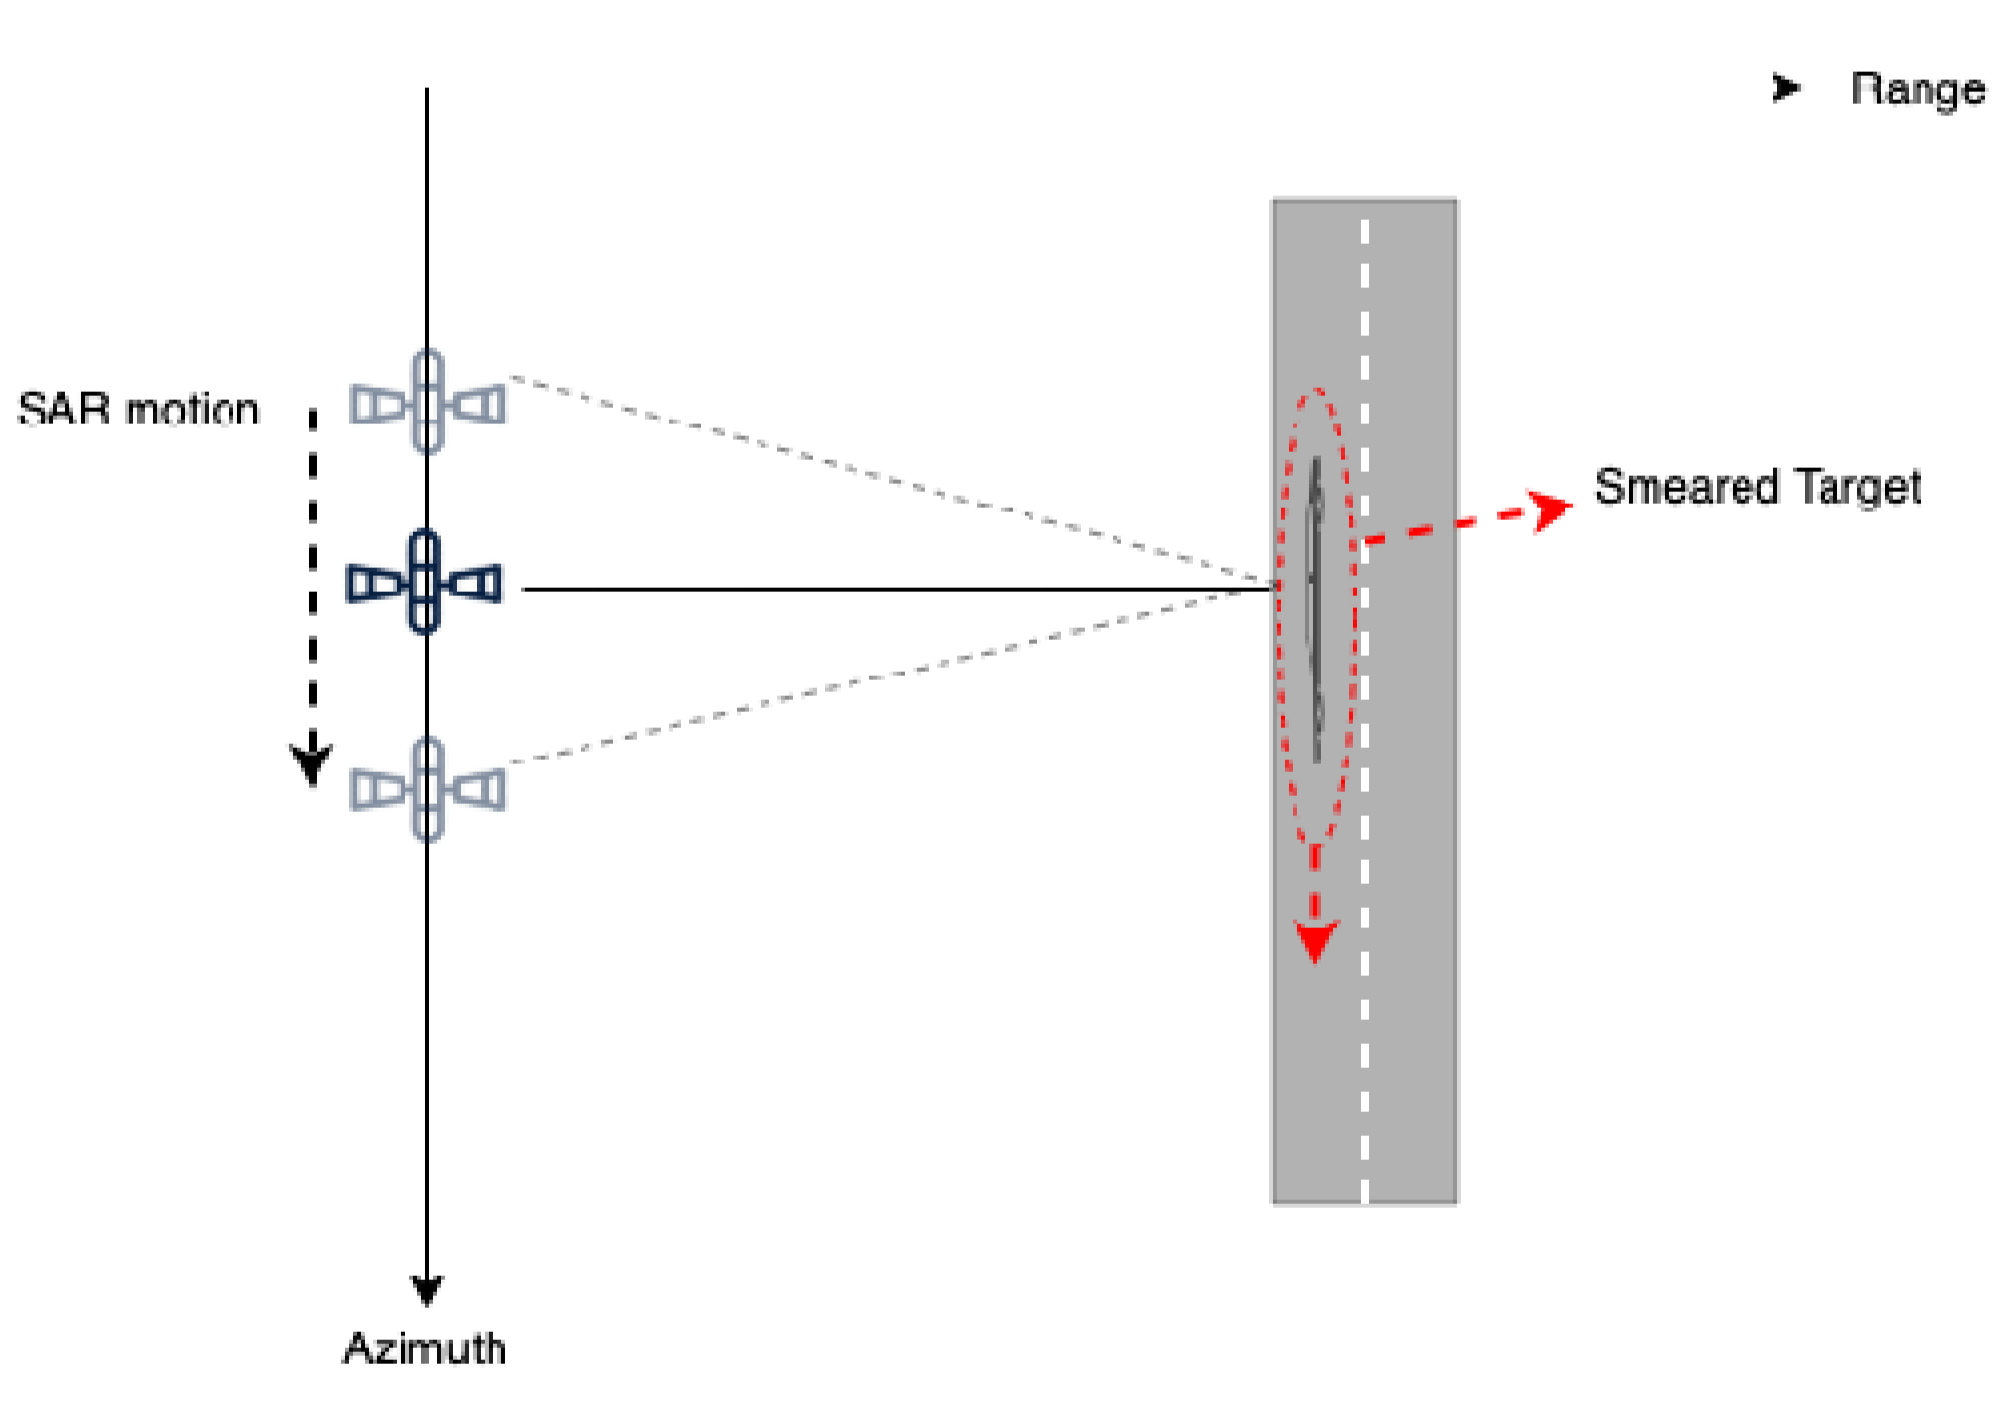
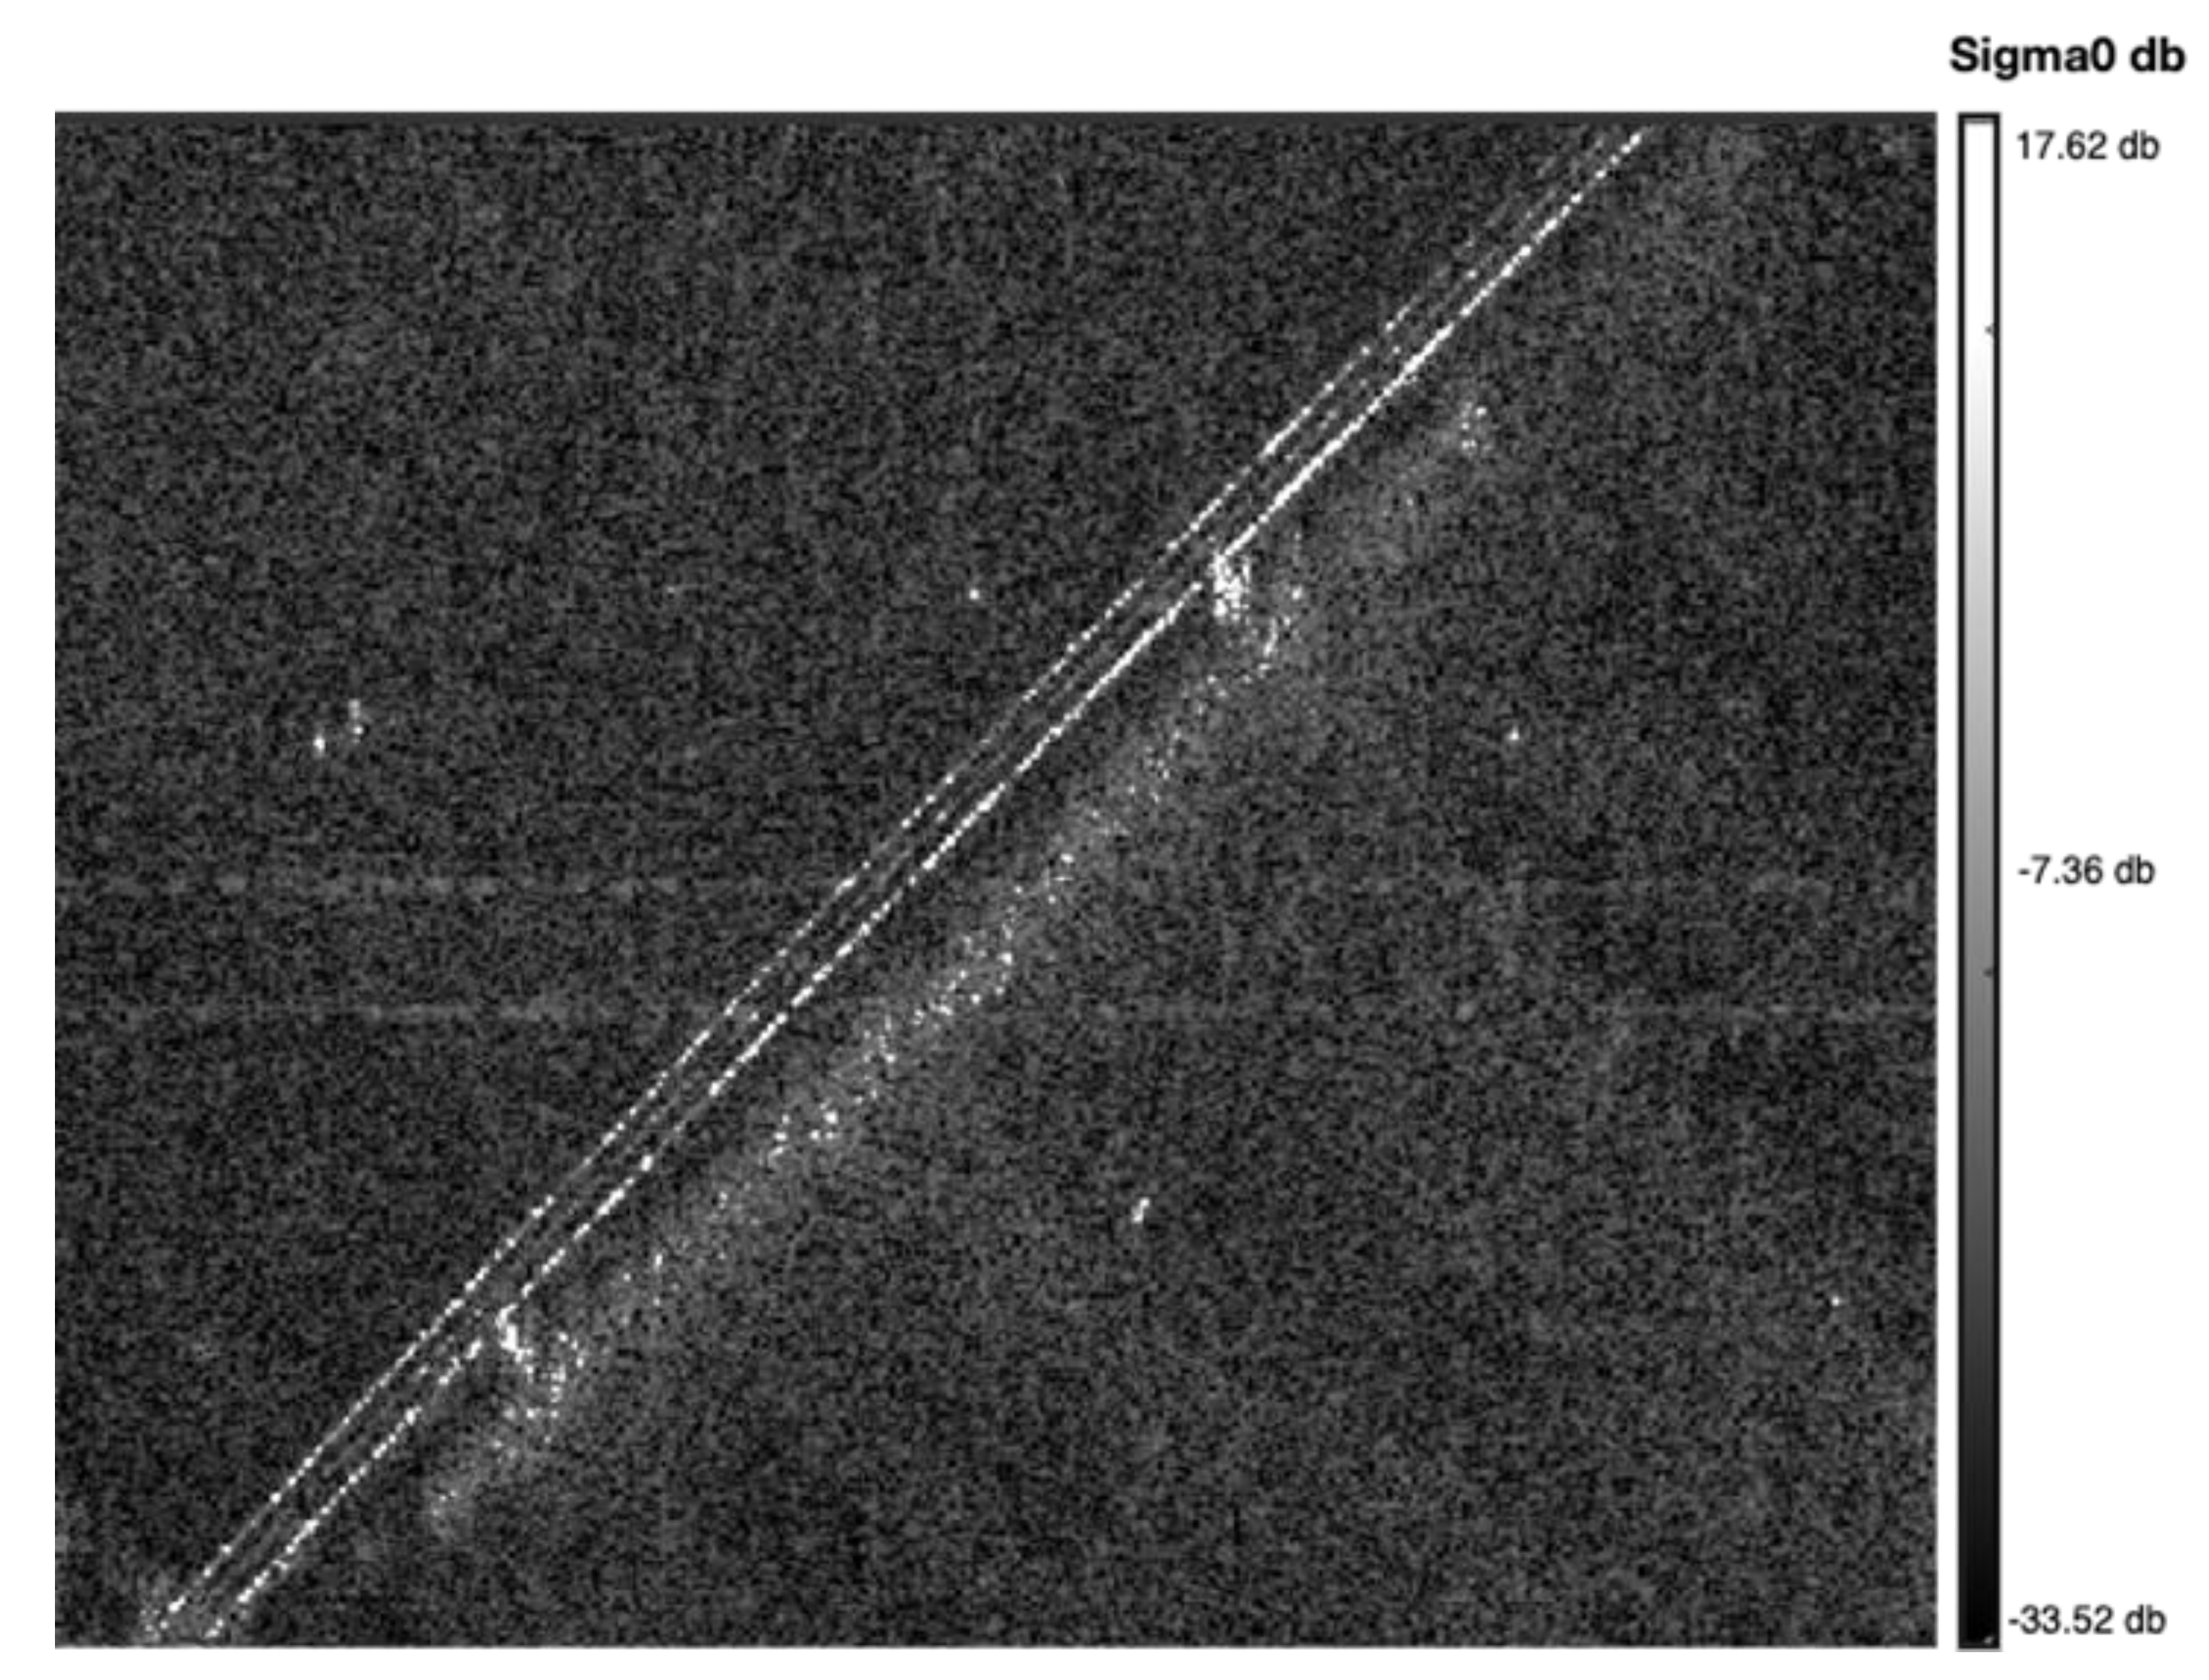
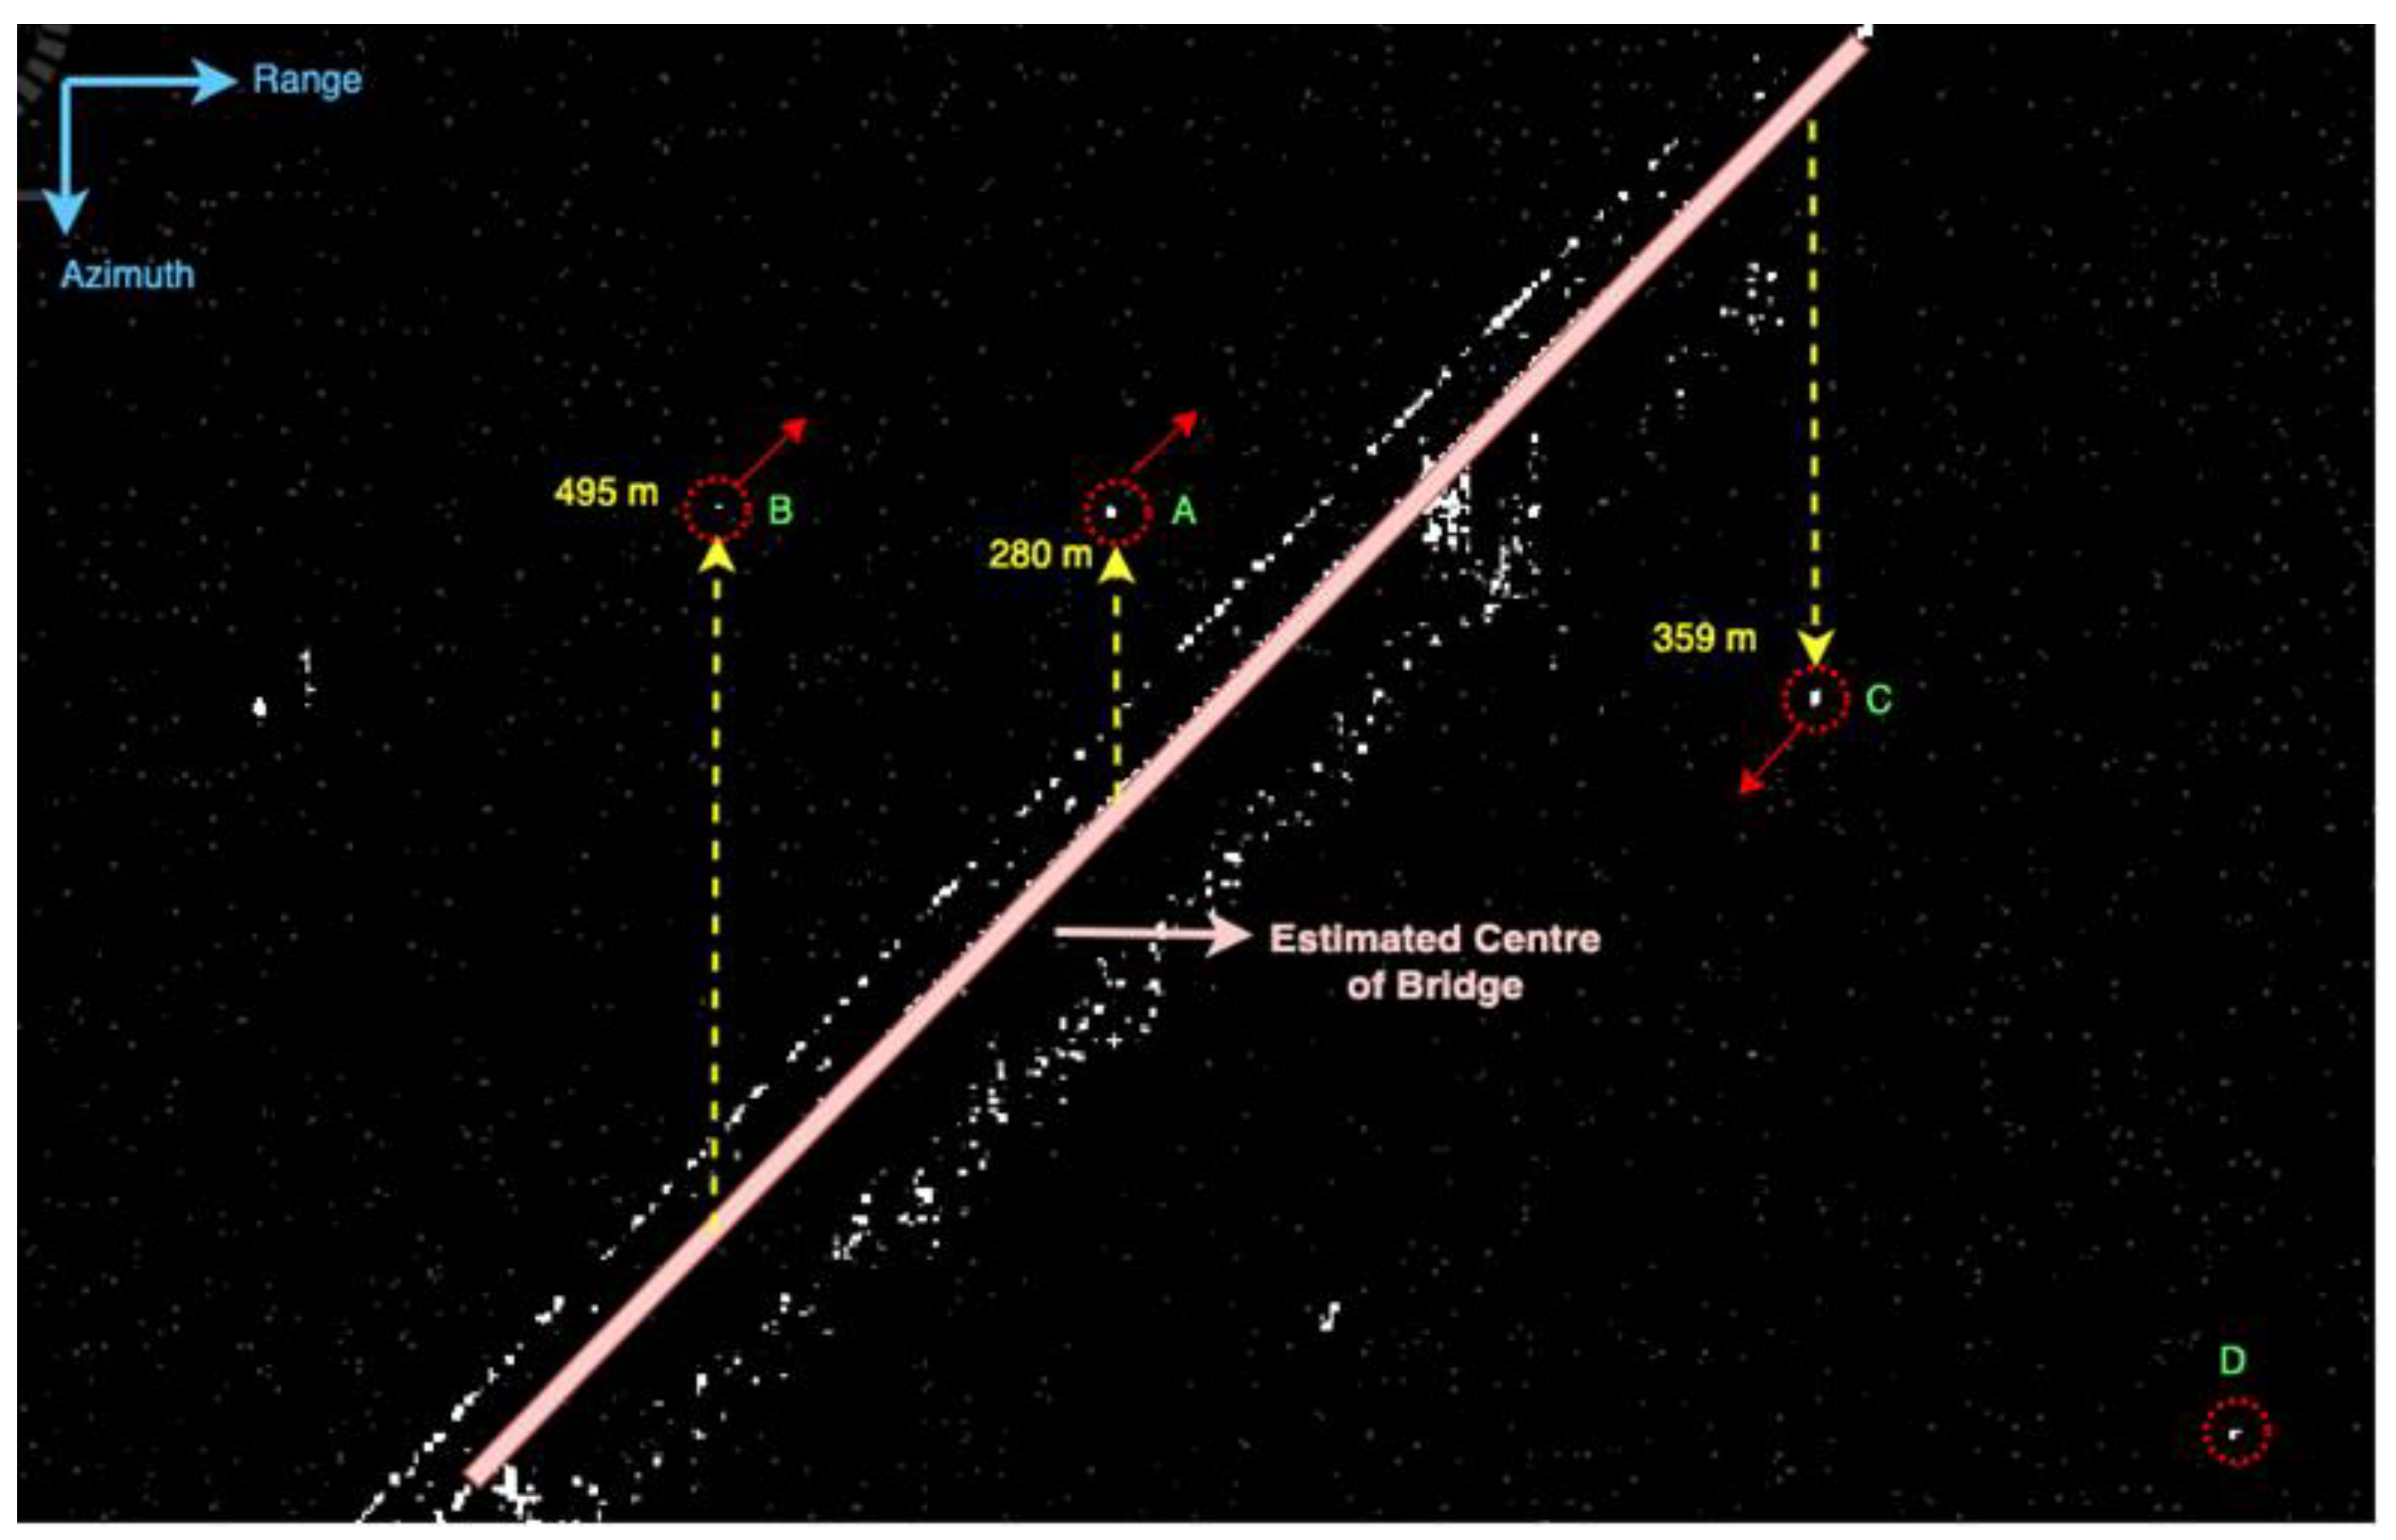
2.3. SAR Imaging Properties of Moving Objects

SAR image focusing assumes the ground scene to remain stationary while the data are collected. If a target moves during data collection, its phase history differs from that of the stationary landscape features around it [5], and the target appearance in the SAR image defocuses in proportion to the magnitude of its motion. Accounting that the SAR system operates in StripMap imaging mode (which we used in our experiment) on a platform moving along the satellite orbit, the footprint of the antenna also moves with the satellite along the azimuth with the same velocity. A sketch of the image acquisition geometry is shown in Figure 3.
In SAR, the specific way in which a moving target gets displaced or defocused in the image depends on how the target moves relative to the radar sensor [5]. Along-track motion (i.e., when the target moves parallel to the satellite path) smears the target, while cross-track motion (i.e., when the direction of target motion is orthogonal to the satellite path) shifts the target image in the azimuth direction, while generally preserving its focused appearance. The characteristics distinctive of ground-based moving objects in SAR images are normally described by three features: (i) target displacement in azimuth direction; (ii) azimuth target blurring in the image because of the velocity in the azimuth and the range acceleration; and (iii) residual Doppler centroid, that is the averaged Doppler frequency of static ground points and it is usually needed for SAR focusing.

2.3.1. Along-Track Target Movement

A target moving along the same path as the radar sensor (i.e., along-track) appears smeared in the SAR image, as schematically shown in Figure 4. The smearing effect depends on the size of the integration angle, which is the angle through which the radar sensor moves relative to the pixel, as the backscatter values of the pixel are coherently summed during the SAR image formation. If the integration angle is small, the smearing effect is linear, while if the angle is big, the effect is more like a curve.
Assuming that the target is moving along the azimuth direction with constant velocity v y , the along-track motion changes the relative velocity between the radar sensor and the scatterer, leading to a change in the quadratic part of the range history. Along-track motion also changes the frequency modulation (FM) rate of the received signal [15]. The change in the quadratic component induces, in turn, a change in the frequency modulation rate of moving targets Δ F M , as expressed in Equation (1):
Δ F M = F M ( 1 v y v B ) 2
where FM is the frequency modulation rate, Δ F M is the change of the frequency modulation rate of the moving target, and v B indicates the beam velocity on the ground.
In a SAR image, azimuth focusing is carried out using a matched filter concept with which an optically focused image is obtained. To correctly build a filter, the true range history of each target along with the position and motion of sensor and scatterer should be known. The time dependence of the scatterer position is usually ignored, and this concept is commonly referred to as stationary-world matched filter (SWMF). Due to the time dependency being ignored, SWMF does not represent the correct phase history of a significantly moving target. This, in the end, results in image degradation. If the reflective (echo) signal of an object is focused with SWMF, a phase component remains in the focused signal and causes a stretch in the signal energy in the time or space domain, depending on the change in the modulation rate. The width of the focused peak as a component of the object along-track velocity can be approximated by the pulse repetition frequency (PRF), as shown in Equation (2):
Δ w PRF δ FM = 2 T A v y v B
where T A is the aperture time (i.e., the time of illumination) and PRF is the pulse repetition frequency.
In this situation, a moving target is smeared (blurred) by twice the distance it travelled along azimuth during T A [15]. Nevertheless, such estimation only works if the velocity v y ≫ 0, which means the target should be in a state of motion. Due to the spread of the moving target backscatter energy over a large area, the peak value of the signal and blurring effect drops down. The strong blurring distributes the backscattered energy and results in a drop of 50% in the peak power or more if the velocity is vy ≥ 15 km/h [16].

2.3.2. Across-Track Target Movement
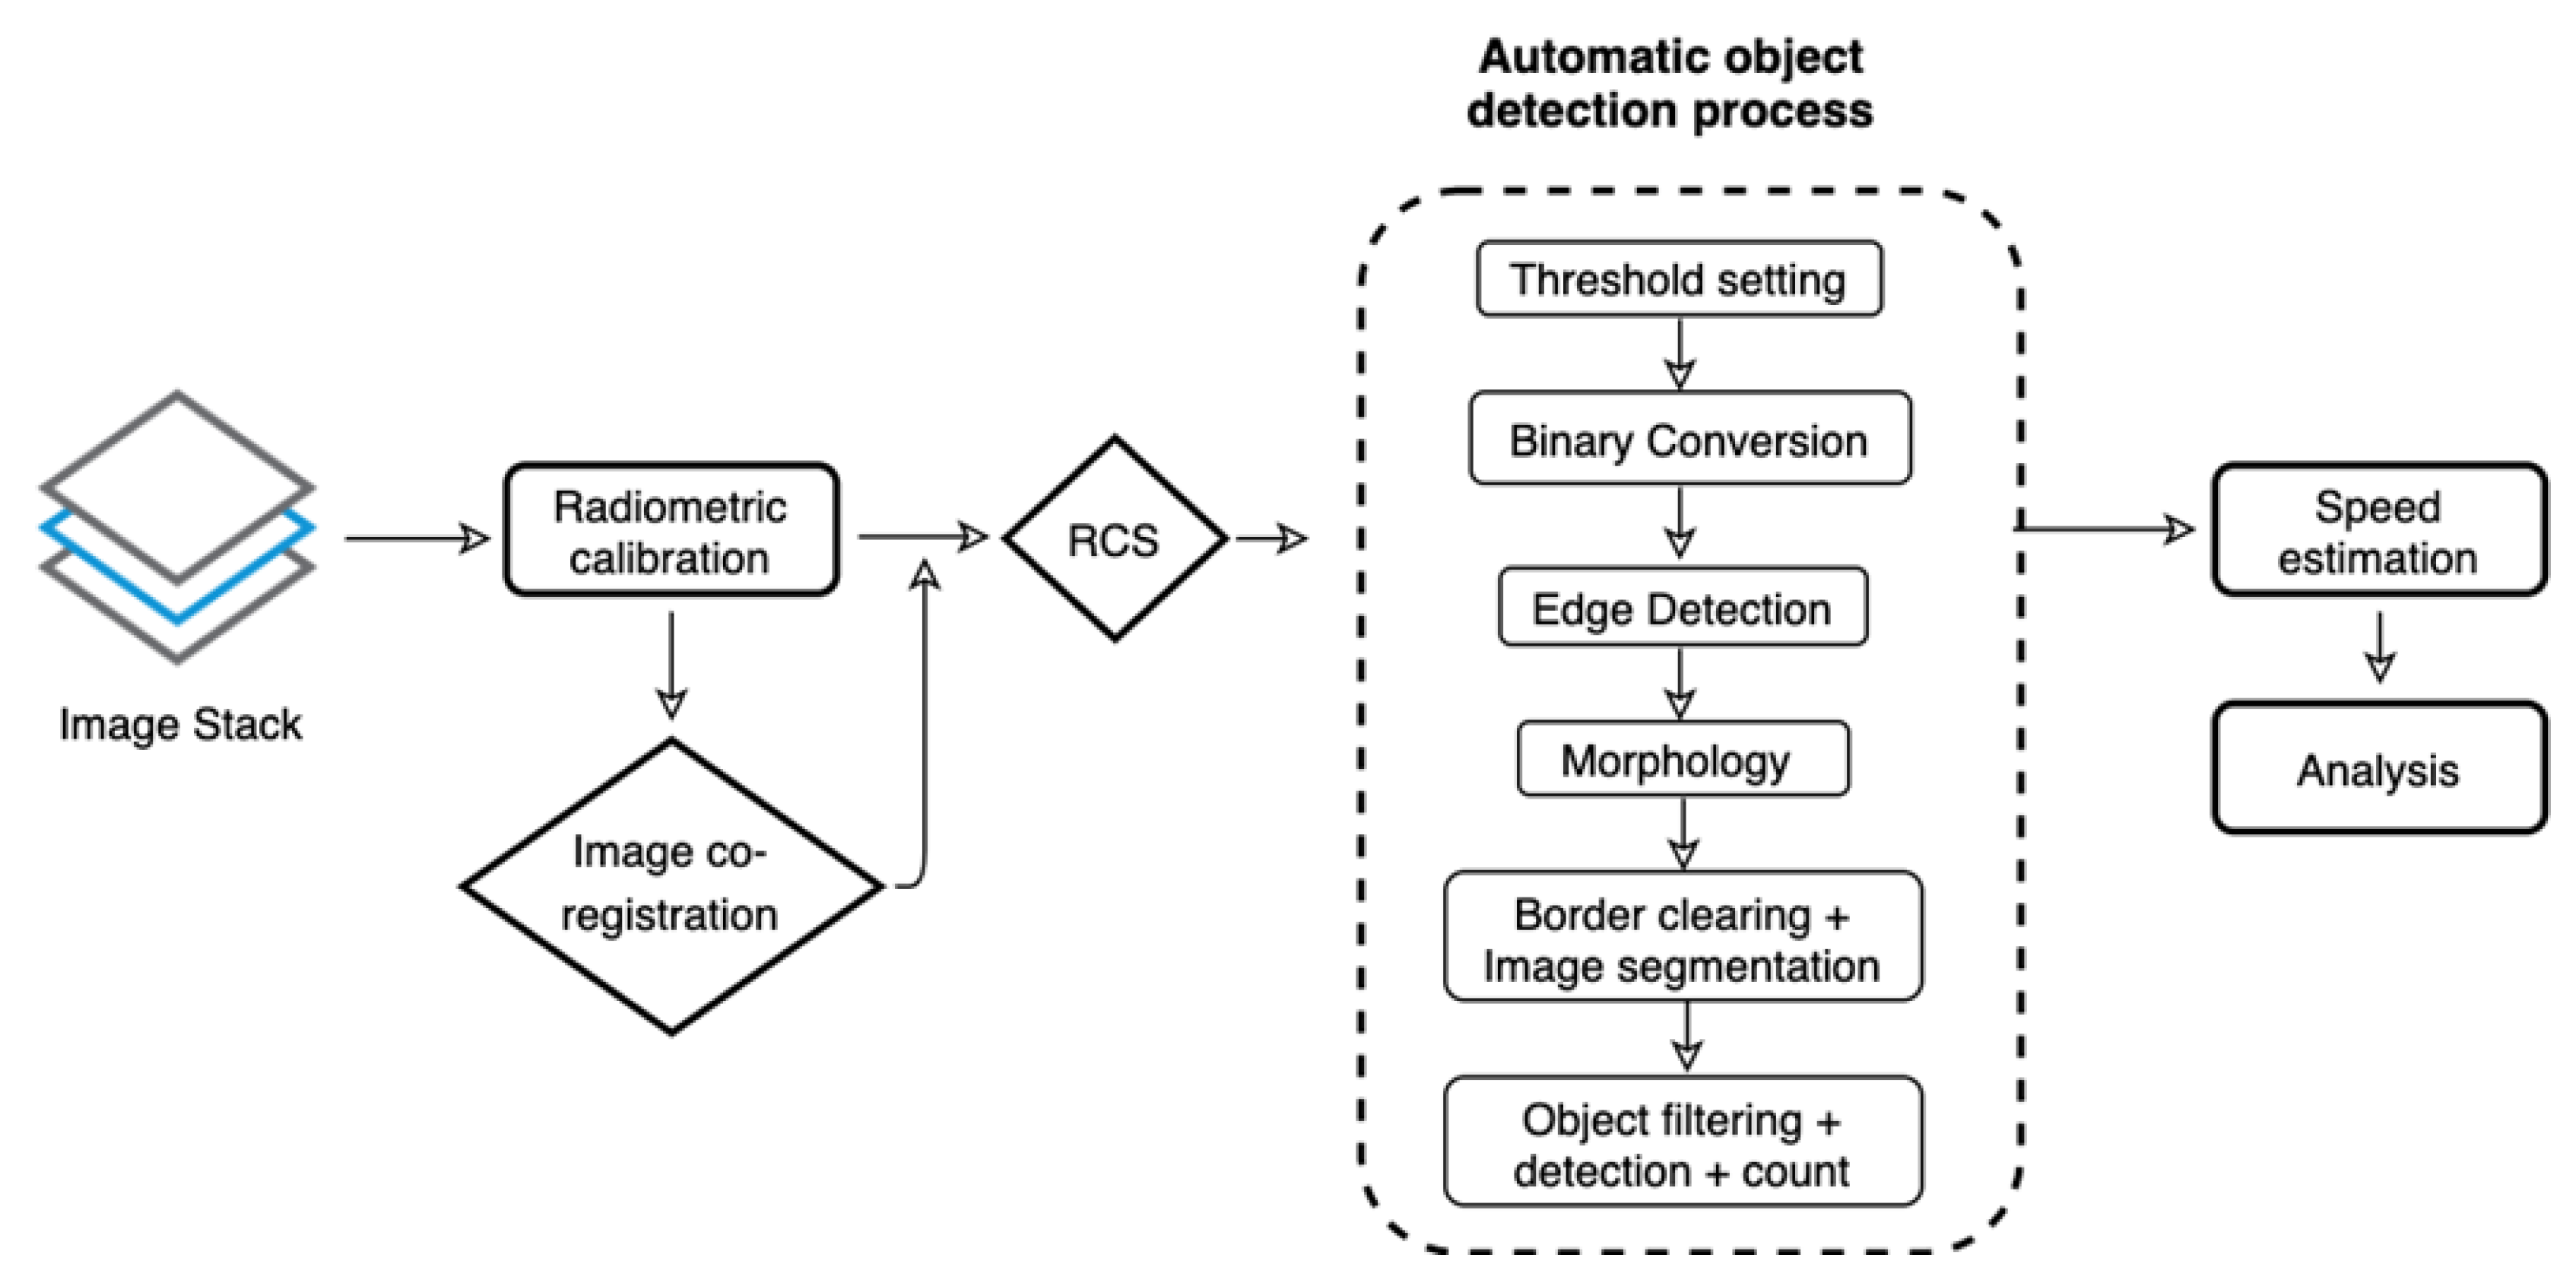
In case of across-track target movement, the target motion produces a shift in the target image position in the azimuth direction. This means that the moving target appears stationary in the SAR image, while it is displaced at a different azimuth position. A target that is moving away from the SAR sensor ground track appears displaced in azimuth in a direction opposite to the heading direction of the sensor, and vice versa (Figure 5).
Assuming that the object moves across-track with constant velocity v x with no interruption during illumination, the variation of the range history is linear and causes a secondary (additional) linear phase trend in the reflective (echo) signal. By following the Fourier transformation law, the linear phase element correlates to a time shift Δ t in the time domain in Equation (3):
Δ t = 2 v l o s λ F M
where λ is the SAR sensor wavelength, and v l o s is the velocity along the line-of-sight (LOS) direction of the satellite, which depends on the local elevation or incidence angle θ, and is calculated as follows:
v l o s = v x sin θ
The azimuth displacement Δ a z of a moving target in the space domain can be acquired by simple transformation of the time shift and expressed in meters, as follows [15].
Δ a z = R v l o s v s a t
where v s a t is the satellite velocity, and R is the slant-range distance between the sensor and target. An illustration of this case is shown in Figure 5.

2.4. Methodology

The 294 input SCS images were radiometrically calibrated and co-registered to a single master scene, achieving a sub-pixel co-registration precision. An average amplitude product was then generated based on all the co-registered scenes and was used as a reference for comparison. In particular, by analyzing the differences of each image to the average amplitude product, permanent objects were distinguished from dynamic objects. Threshold filtering on each SAR image then allowed the identification of the specific bright points, as explained below. The processing flow diagram is shown in Figure 6.
Due to the displacements of the across-track moving objects from their real position in the SAR image (Figure 5), we expected that bright points could be seen on calm water of the Yangtze river that appears black in the SAR images. After identifying permanently bright image parts in the river based on the combination of all available images into the average amplitude product, we assumed that these points were fixed and part of the backscattering from the bridges. We could separate stable objects, i.e., bridges, from dynamic objects, like e.g., vehicles and ships. In vehicle identification, we then calculated the radar cross section (RCS) of the points appearing near the bridges in the SAR image. The RCS is the measure of the target capacity to reflect the radar signal in the direction of the receiver and is expressed in square meters. Therefore, the RCS is the power scattered back to the radar receiver divided by the incident radar power density per unit of solid angle as if the radiation were isotropic (radiation of same intensity regardless of direction) [17]. The RCS of a target varies based on the reflected incident power considering its size and position. Moreover, [18] used X-band SAR to calculate the RCS of a car at different angles using frequency of 9.6 GHz, VV-polarization and incidence angles of 41.5° and 42.5°. The RCS showed variation from −18 to 16 dB m2 depending on the angle.
The X-band COSMO-SkyMed images available for this study were collected in HH-polarization and with incidence angles of 27.8°, 27.3°, 27.1°, 26.7°, 26.6°, 26.3°, and 25.7° at the seven bridges crossing the Yangtze river (according to our numbering as per the figures shown in Section 3.1). In our observations, the RCS values for the detected vehicles ranged from −2 to 39 dB m2. An example of overall backscatter values is shown in Figure 7. The variations in the RCS of vehicles were due to variation in size—bigger vehicles (e.g., cargo truck) have higher RCS—and orientation of the vehicles. Based on our analysis and [17,18], we defined the RCS (2 to 30 dB m2) as a threshold to identify moving vehicles. Based on this threshold, targets with high RCS also appear as bright points in a binary image. To filter out targets with high RCS in each binary image, we set the threshold value as (RCS values > 2 dBm2), which helped in filtering bright targets with high potential to be vehicles (“detected vehicles”) from other targets and the black background.
After binary conversion, the process of edge detection is applied on bright targets to automatically create a boundary. Random shapes of detected targets leave missing parts in the boundary, which were filled using morphology. The objects are then detected using their area. Large objects covering more than five very bright pixels are likely to be ships and are filtered out. Furthermore, we use the azimuth shift caused by the line-of-sight velocity v l o s of the vehicles to estimate the speed and, iteratively, further filter out objects which are too slow (<5 m/s) or too fast (>35 m/s), because they are either unlikely to be vehicles crossing the bridge in question (too fast) or not clearly separable from bridge elements (too slow).
As discussed in Section 2.3.2, the azimuth shift of the moving target ( Δ a z ) can be used to calculate the velocity of the vehicle along the range direction, i.e., v x . The latter is part of the total velocity vector v T of each vehicle, and it is related to it via trigonometry, namely as: v x = v T cos β , where β is the angle between the bridge direction and the ground range (e.g., β 46 o in the example shown in Figure 8)
v T = Δ a z v sat R sin θ cos β
where v s a t , R, θ and β are known variables at each bridge: v s a t is the COSMO-SkyMed satellite velocity along its low Earth orbit (i.e., ~7.55 km/s, ~27,170 km/h), R is the slant-range distance between sensor and target, θ is the local incidence angle at the bridge, and β is defined as above.
It is worth considering that, in general, the motion speed of vehicles could also be used to indirectly estimate the total number of vehicles crossing the bridges. Indeed, in the case of traffic jams, vehicles generally move slowly, while in the absence of traffic vehicles usually move at the allowed speed limit. However, heavy vehicles crossing the bridges in Wuhan can show very different velocities even in low traffic situations. The main reason for this is that for most of these bridges, the vehicles need to climb up to the generally much more elevated height of these huge bridges. Heavy vehicles climbing up will slow down significantly, and their speed reduction greatly depends on the carried load. Therefore, very heavy vehicles generally move far below the speed limit over such bridges, as they are only slowly climbing or slowly accelerating after the climb. Similarly, these heavy vehicles avoid high speeds while going down. For this reason, the use of a simple relationship between vehicle speed and number of vehicles would not be suitable in this and similar contexts, and therefore the numbers of vehicles detected are based on the image analysis and vehicle counting as described above.

2.5. Recent Events Impacting on Urban Mobility in Wuhan

In addition to monitoring traffic patterns in ordinary times during working days and weekends, as well as public holidays, we analyze them in coincidence of two events that have recently impacted urban mobility in Wuhan.
The first in chronological order was the 7th CISM Military World Games 2019 held in Wuhan from 18 to 27 October 2019. During that time, no trucks were allowed to cross most of the city bridges and the ring road. The left lane was generally blocked on the ring roads and only official cars (i.e., authorized vehicles connected to the games) were permitted.
The second event is the city lockdown due to the COVID-19 outbreak. The first cases of COVID-19 were detected in Wuhan in mid-December 2019 [19]. After human-to-human transmission became evident in mid-January 2020, the Hubei government declared a Grade 2 health emergency on 22 January 2020. One day after, at 10:00 a.m. on 23 January 2020, Wuhan was placed under quarantine [7], with all trains and air traffic in and out of the city, as well as public inner-city traffic, being stopped. The traffic lockdown was completed on 26 January, as private car traffic inside the city, as well as taxis or ride shares, were stopped to further limit the spread of the virus inside Wuhan. These strict traffic restrictions, in combination with other health care measures, were applied, with the traffic lockdown being lifted on 8 April 2020 [20].

3. Results

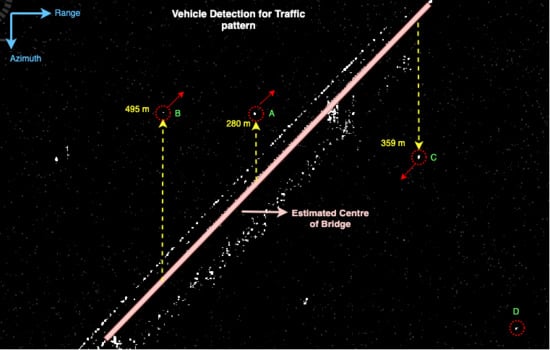
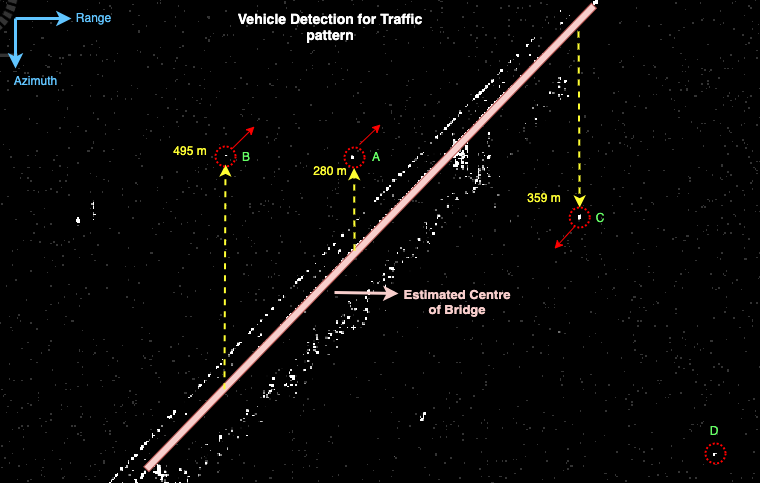
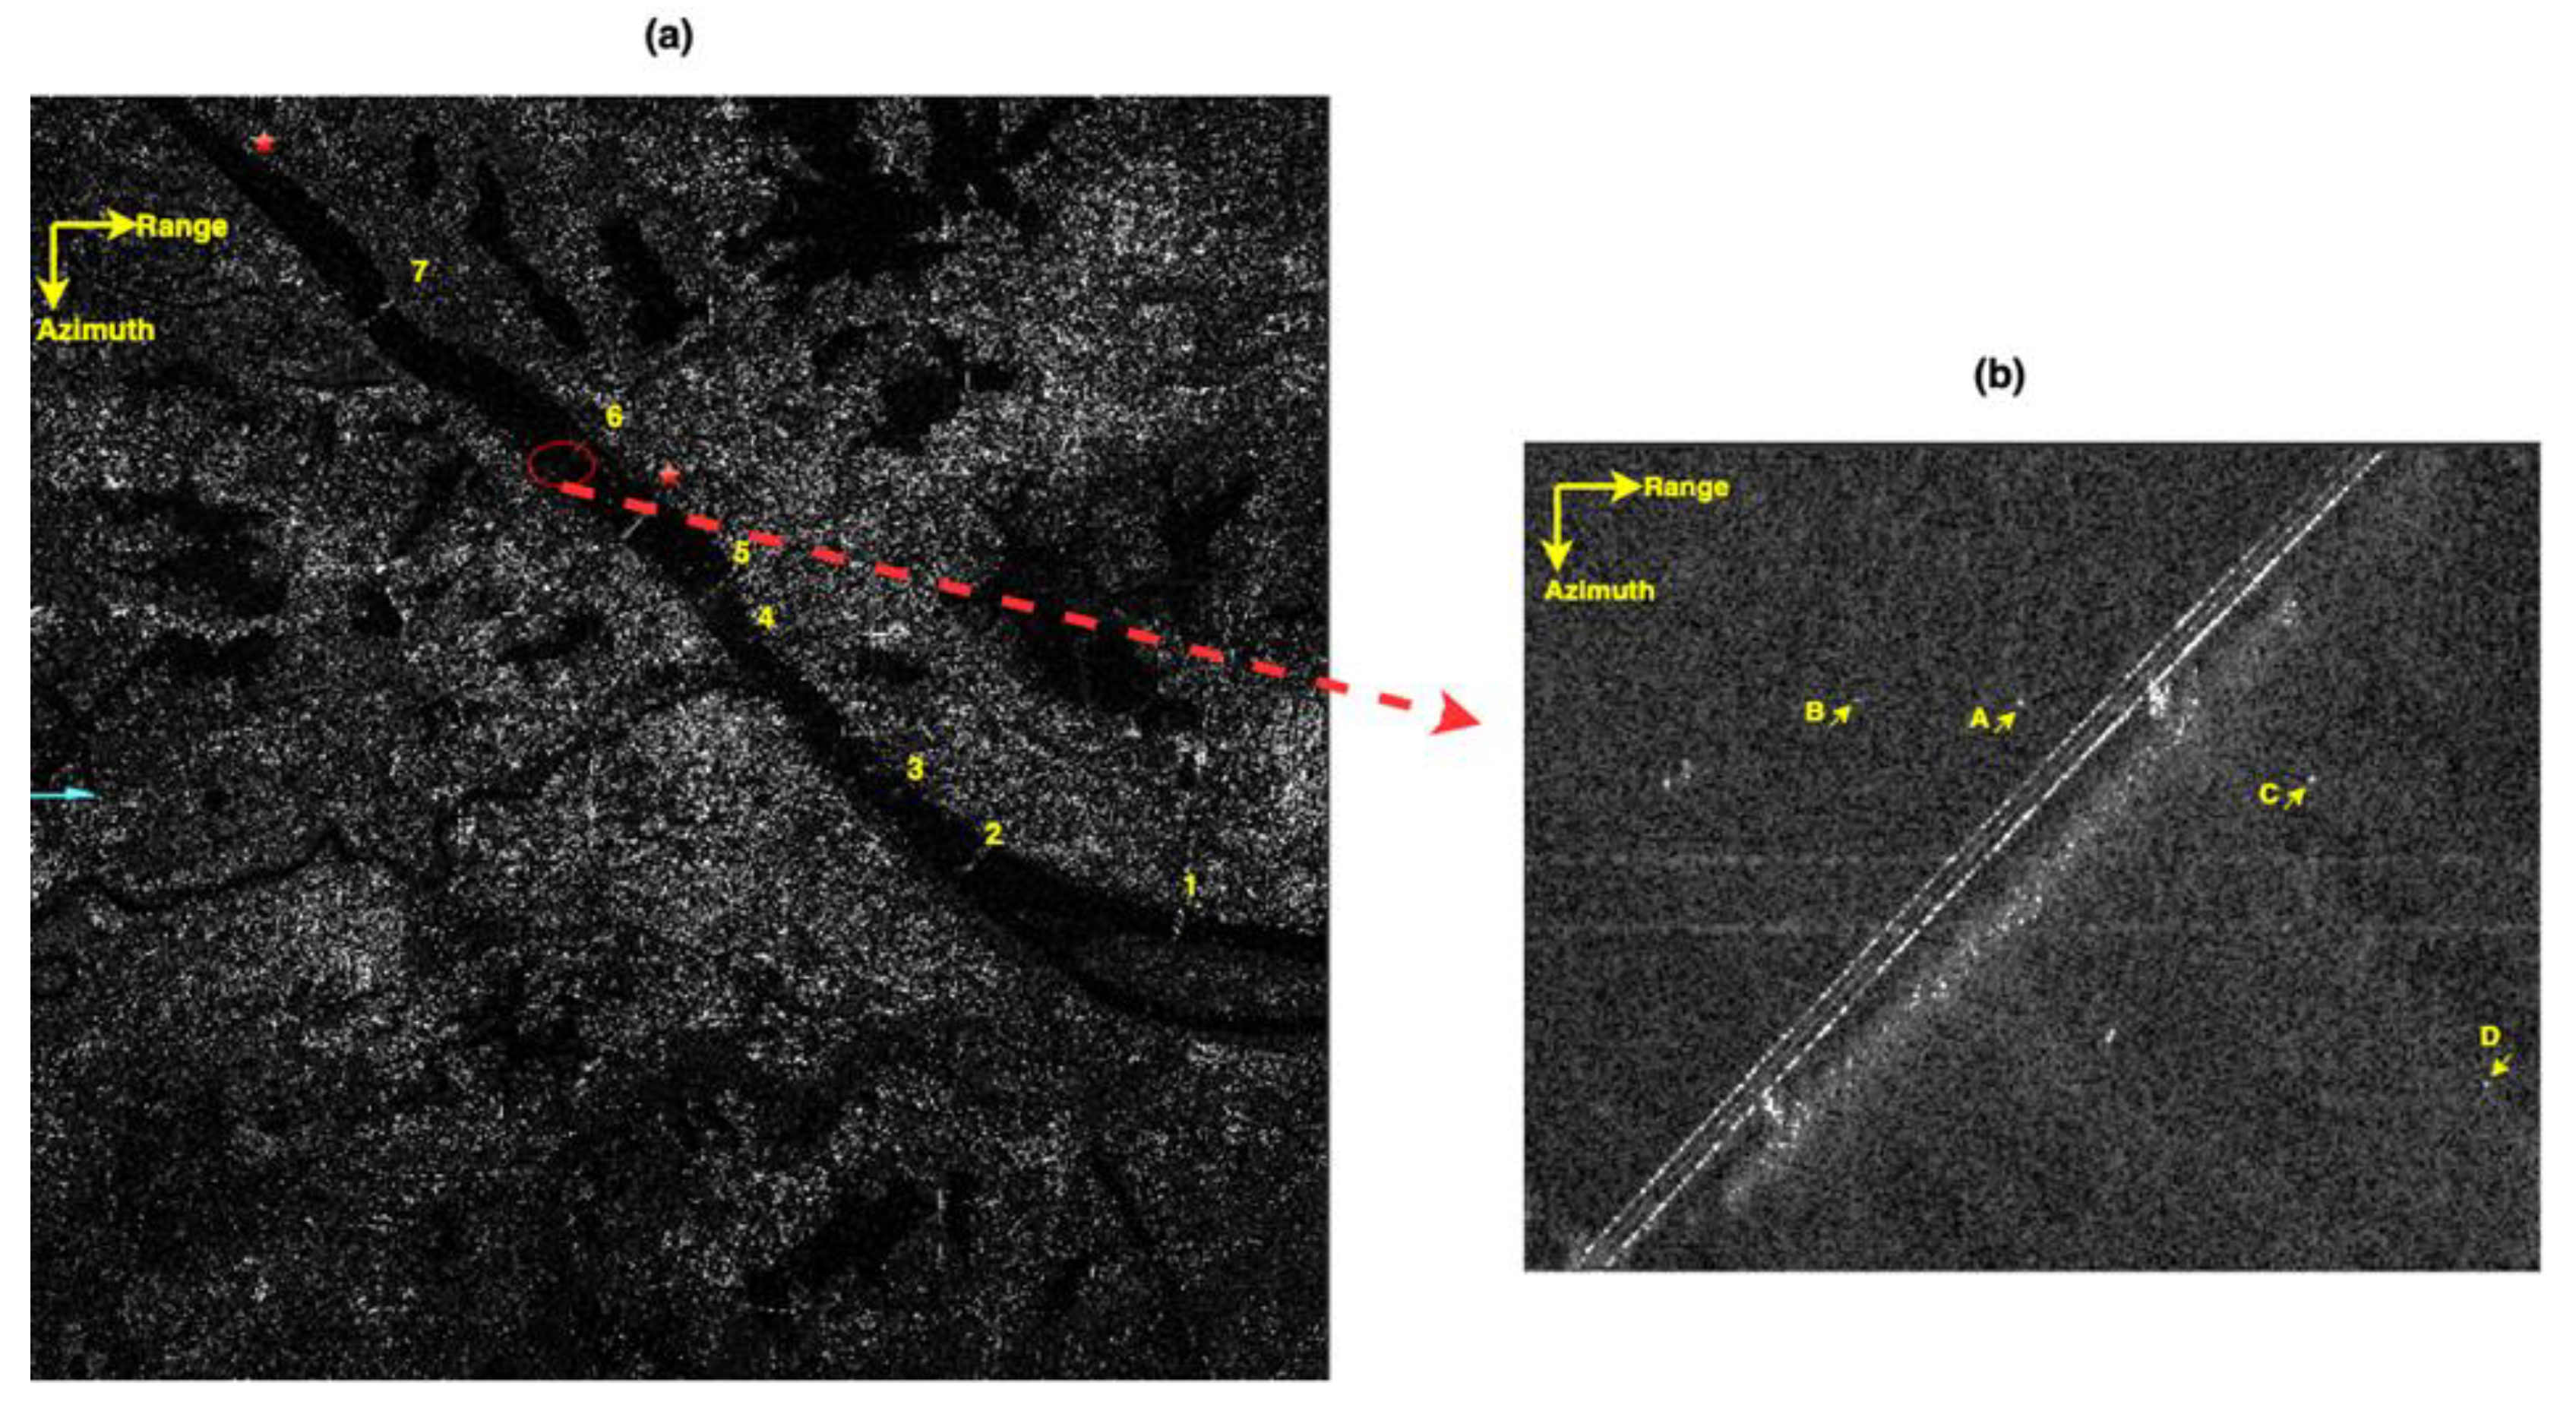
3.1. Vehicle Detection Results

Figure 8a shows the study area, while Figure 8b shows the Baishazhou Bridge with yellow arrows indicating the position of detected vehicle candidates.
Using the above described method, vehicles are detected and counted in all the 294 COSMO-SkyMed images from May 2011 to February 2020. Despite the total number of bridges analyzed, heavy vehicles such as trucks are only allowed on two bridges of the third ring road, i.e., bridge 1, and bridge 6 (see Table 1). Nevertheless, we also found vehicles on other bridges, but the number of detected vehicles over these other bridges was smaller compared to bridges 1 and 6. The velocity of detected targets is also a key factor in this case study, as shown in Figure 9.
Figure 9 shows four detected targets on both sides of the Baishazhou Bridge (A to D in red circles) with their motion. Arrows in red indicate the motion direction of the targets as inferred by their position with respect to the bridge (see Section 2.3). Yellow dashed lines show the azimuth distance from the bridge. The center of the bridge is approximated by the estimated double-bounce scattering at the bridge, identified as the brightest linear feature. This should be seen as an approximation of the bridge center and therefore the measured distances to the bridge center are to be understood as having an error in the dimension of the error of the bridge center estimation, which can be a couple of meters or even tens of meters, depending on the center line estimation and also the lane the vehicles are running on. The farther targets have higher speed, while the targets near the bridge have lower speed. Among the four targets, target D is very far, which in theory is estimated to be shifted 1300 m in azimuth and estimated speed would be 155 km/h. However, the vehicles on the bridge do not move with that high speed, so it is estimated to be not a vehicle and removed from the analysis. For this bridge, the higher threshold distance is 1056 m, which corresponds to 35 m/s v T while the lower threshold distance is 150 m, which corresponds to 5 m/s v T .

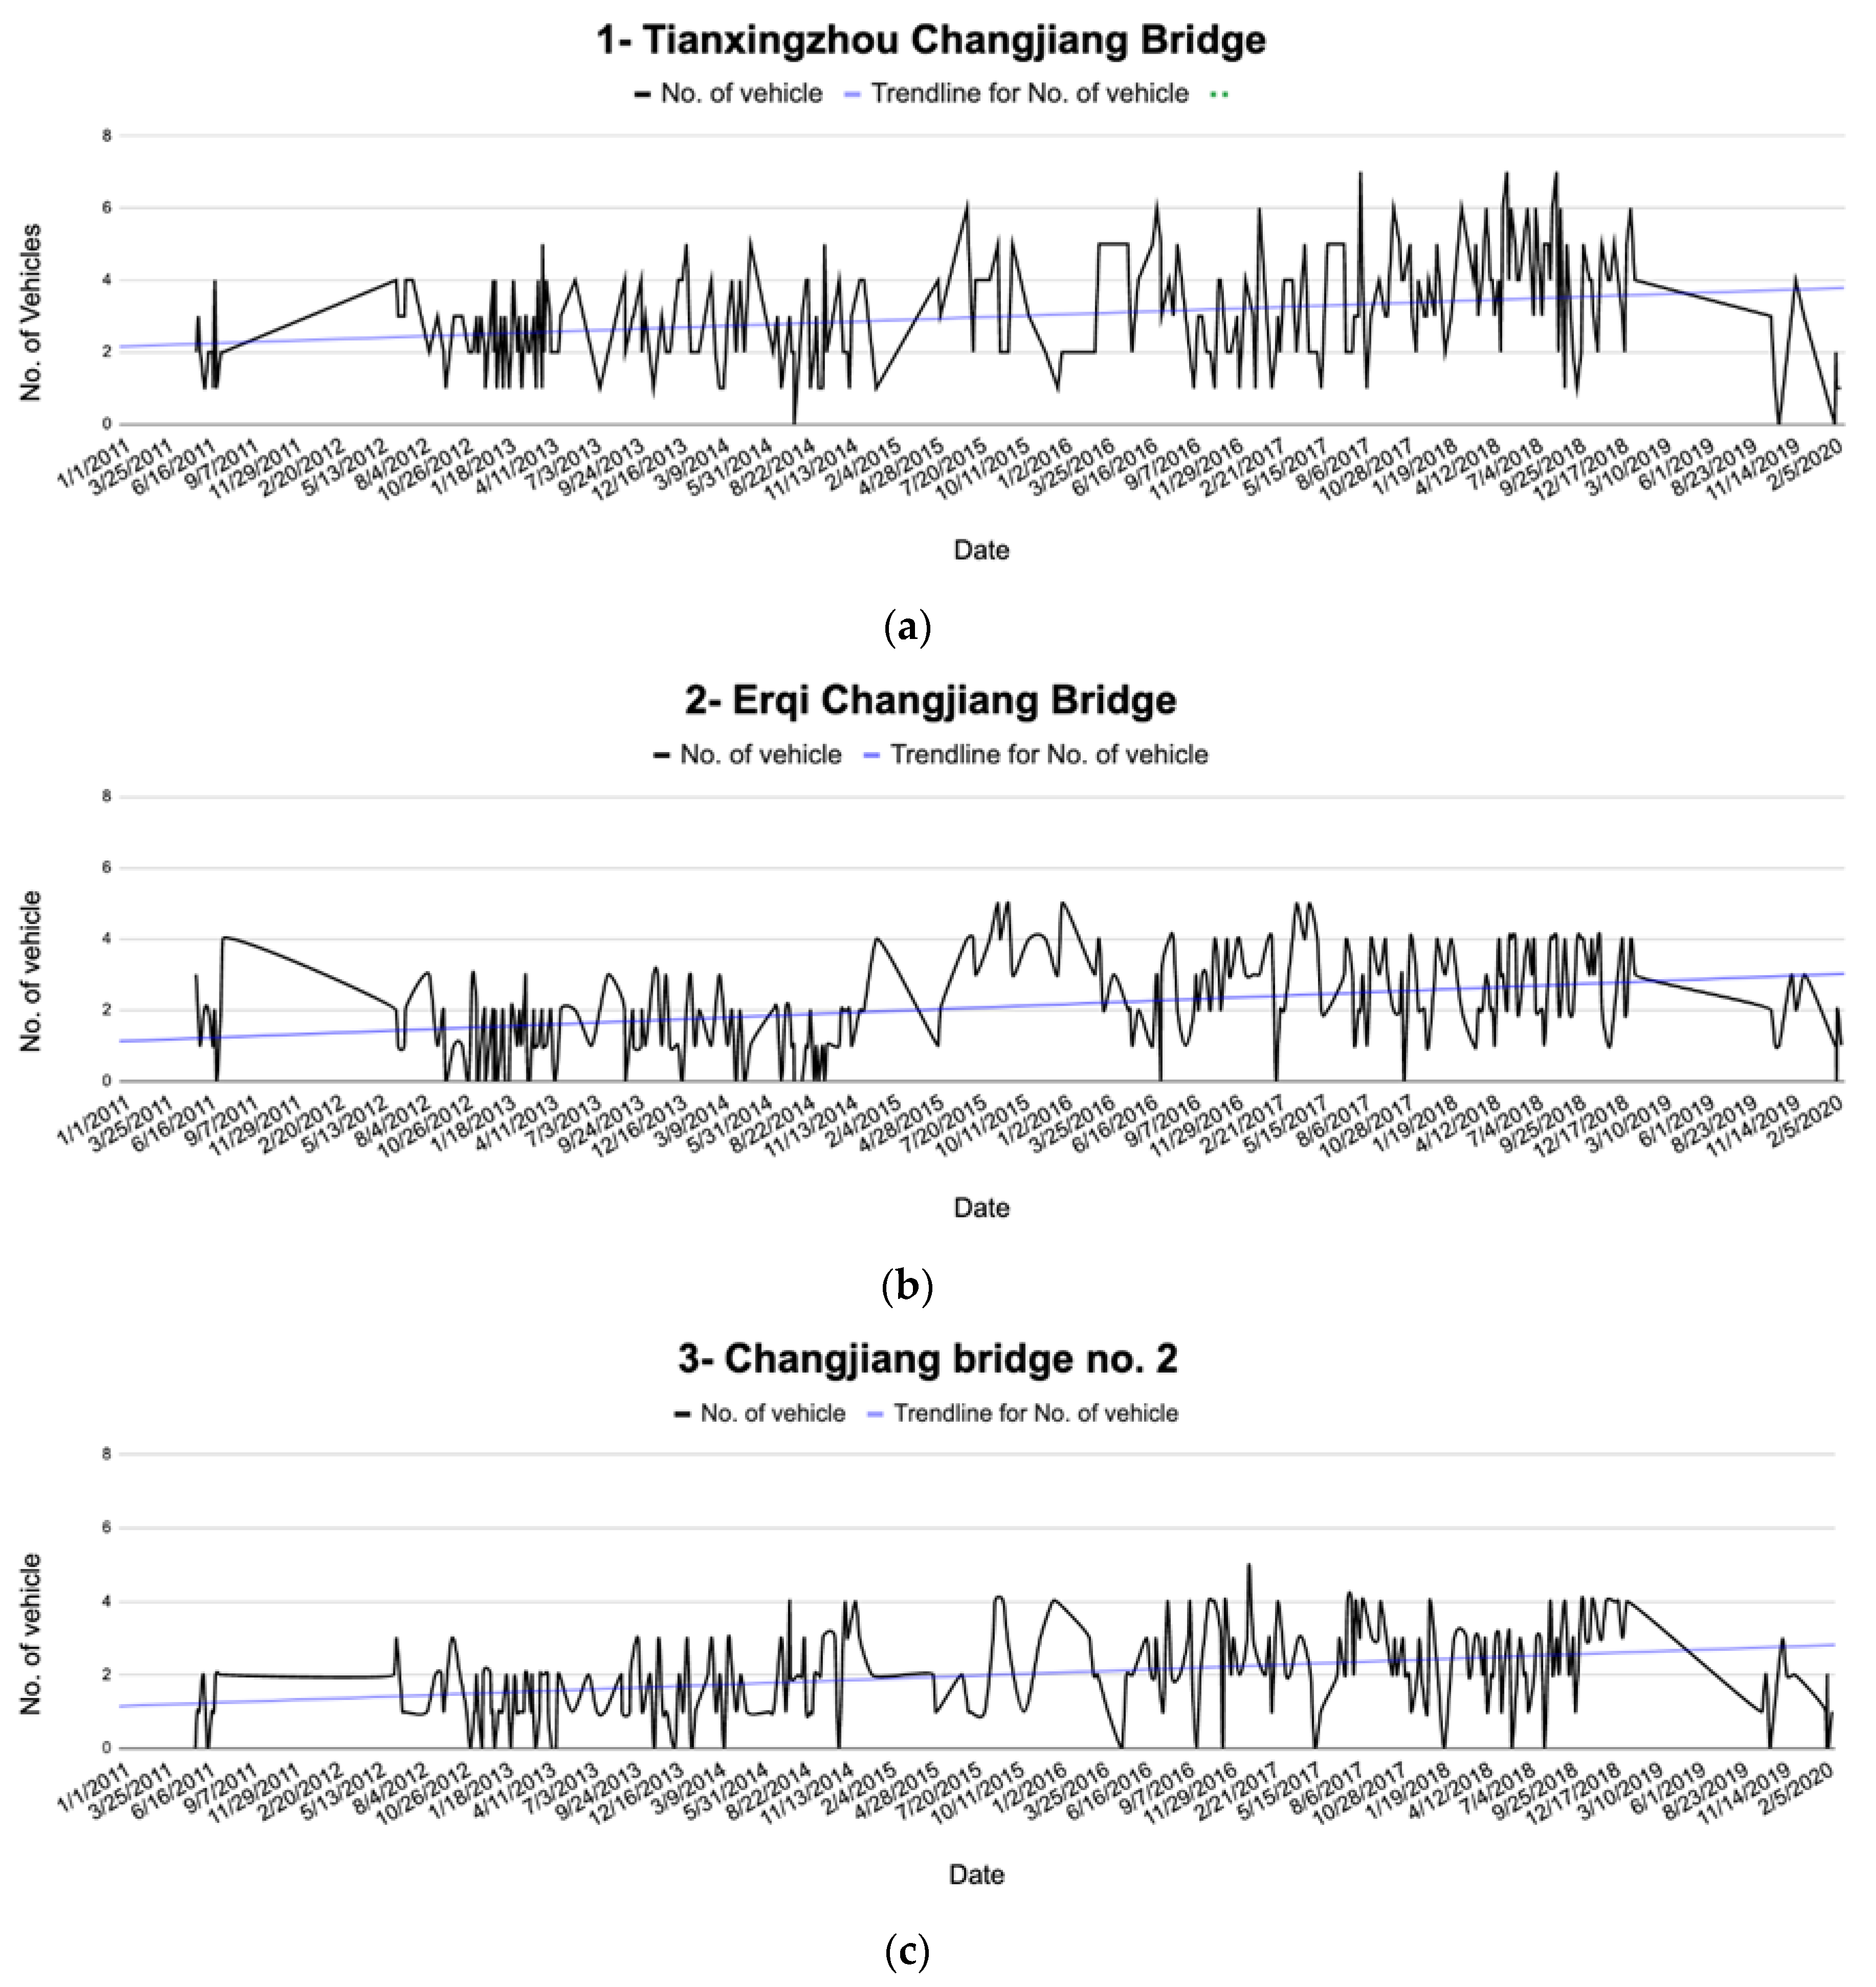
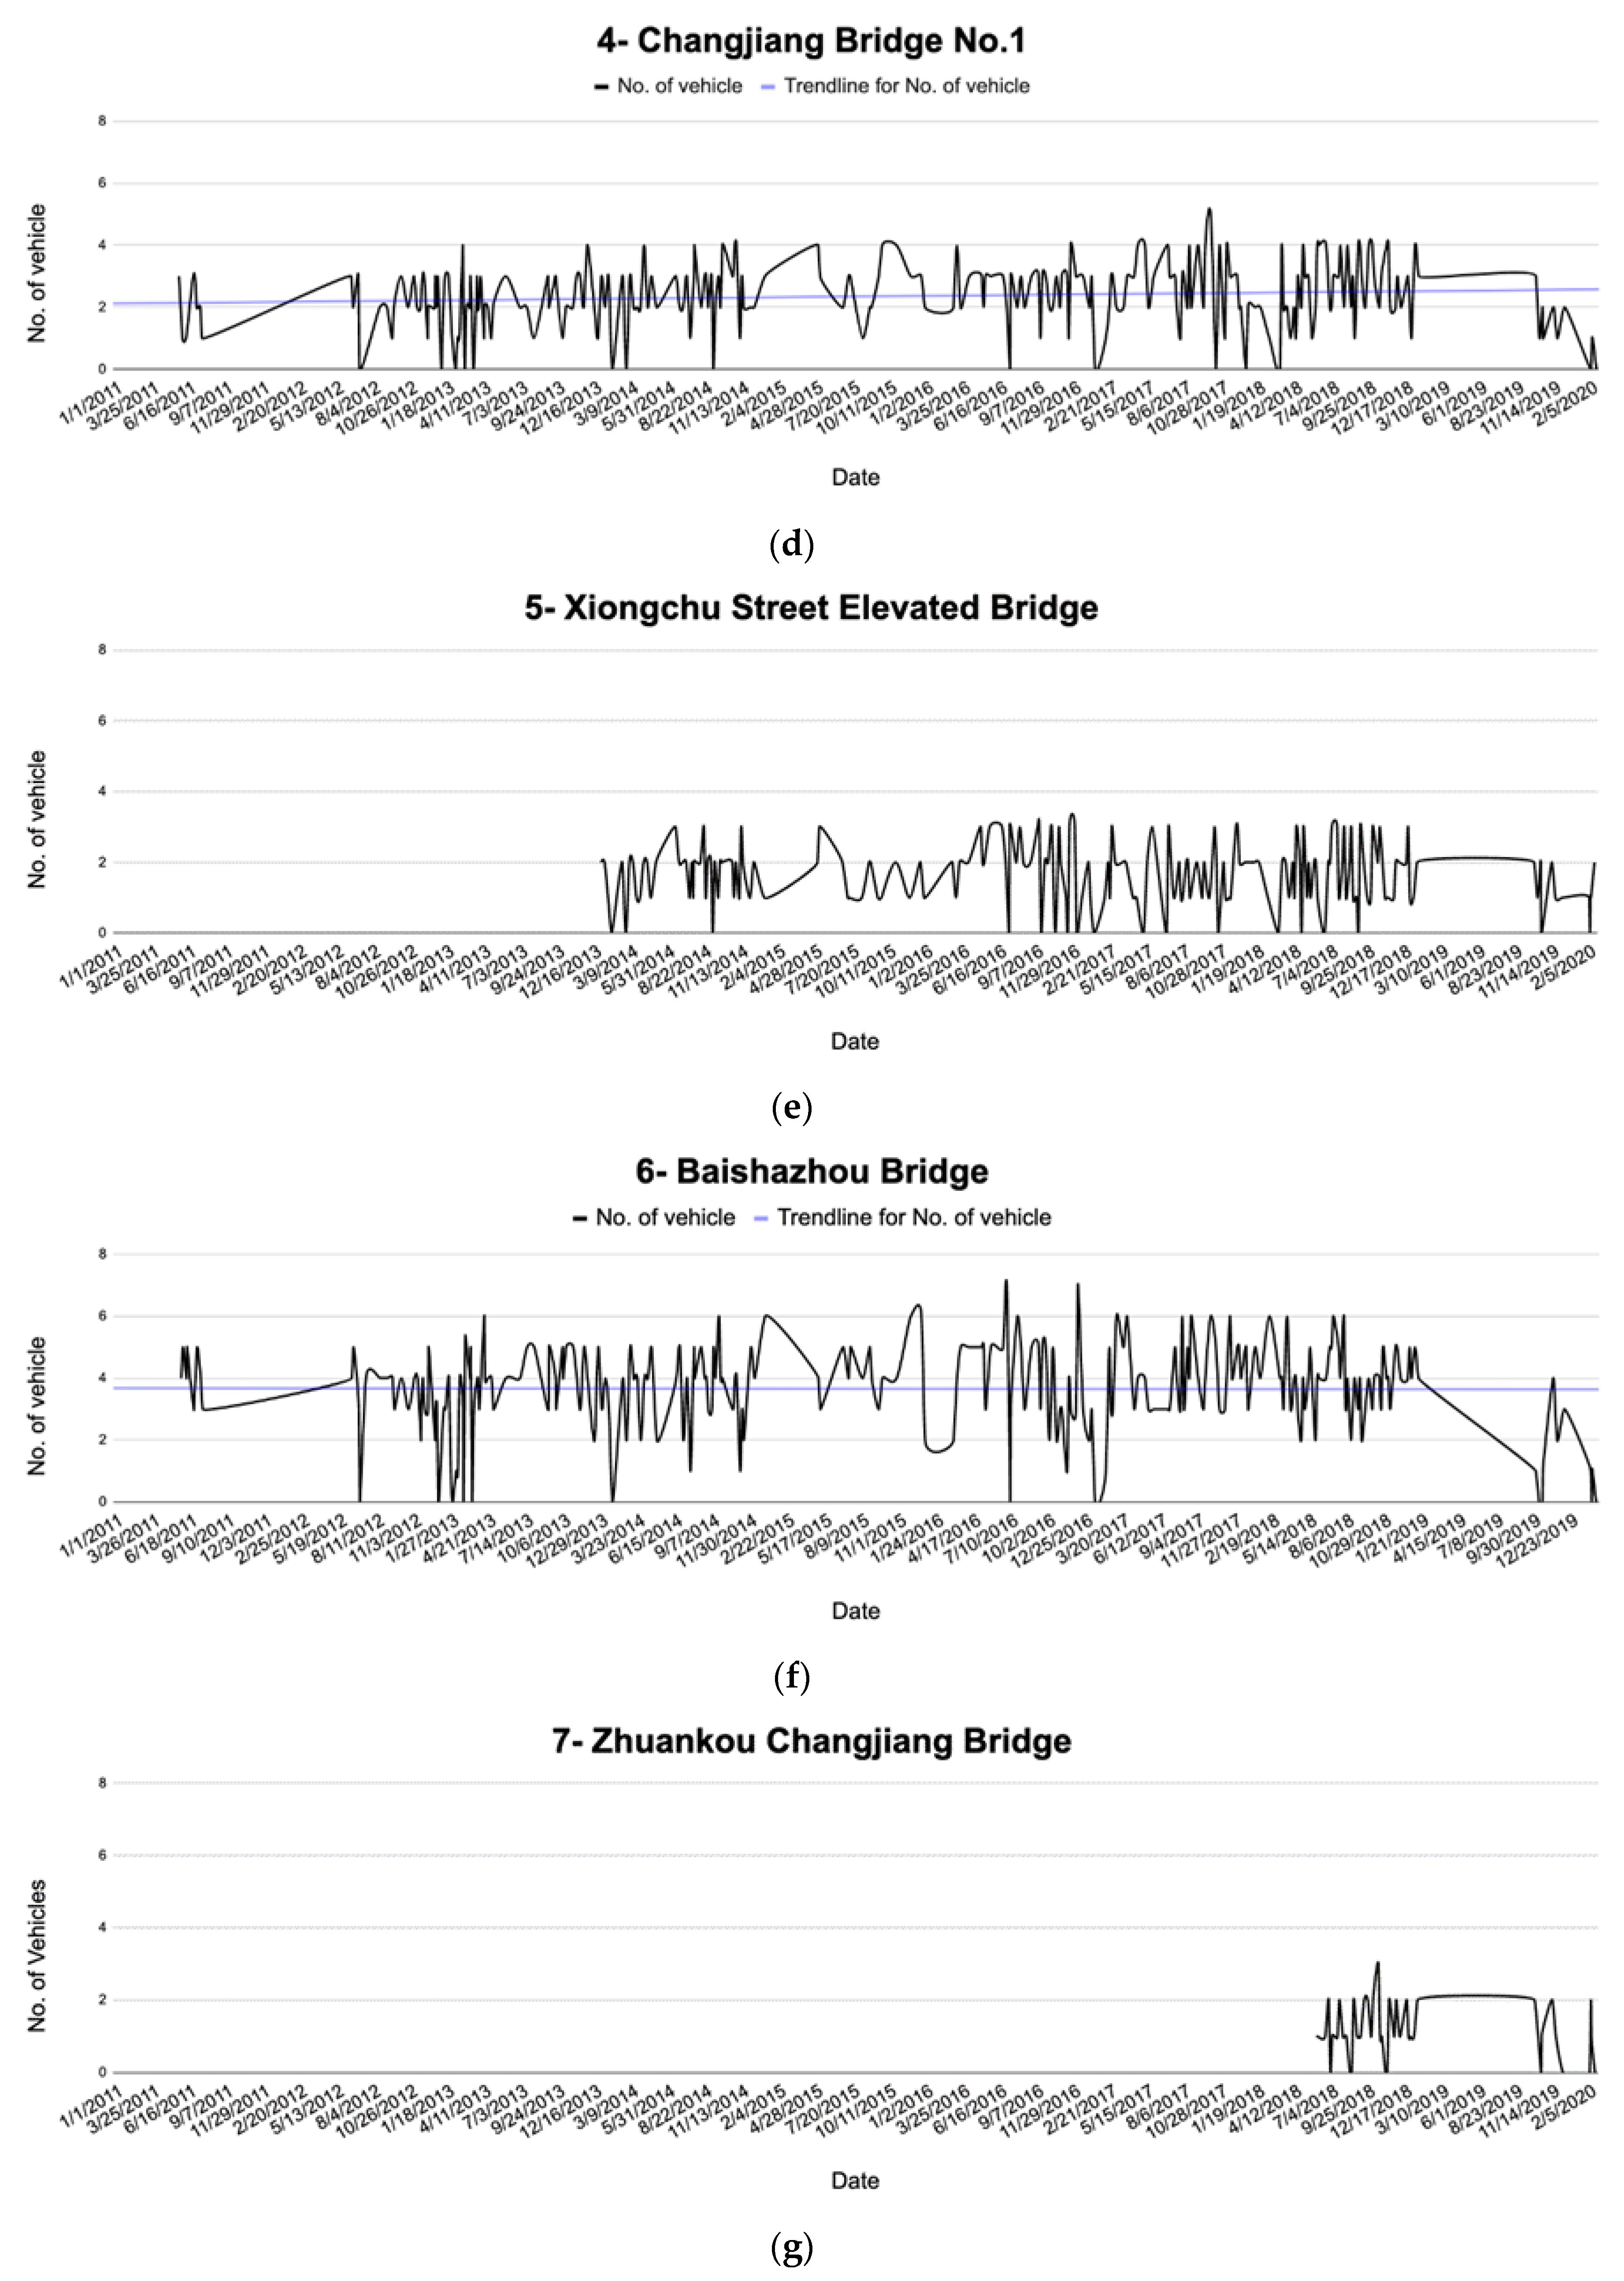
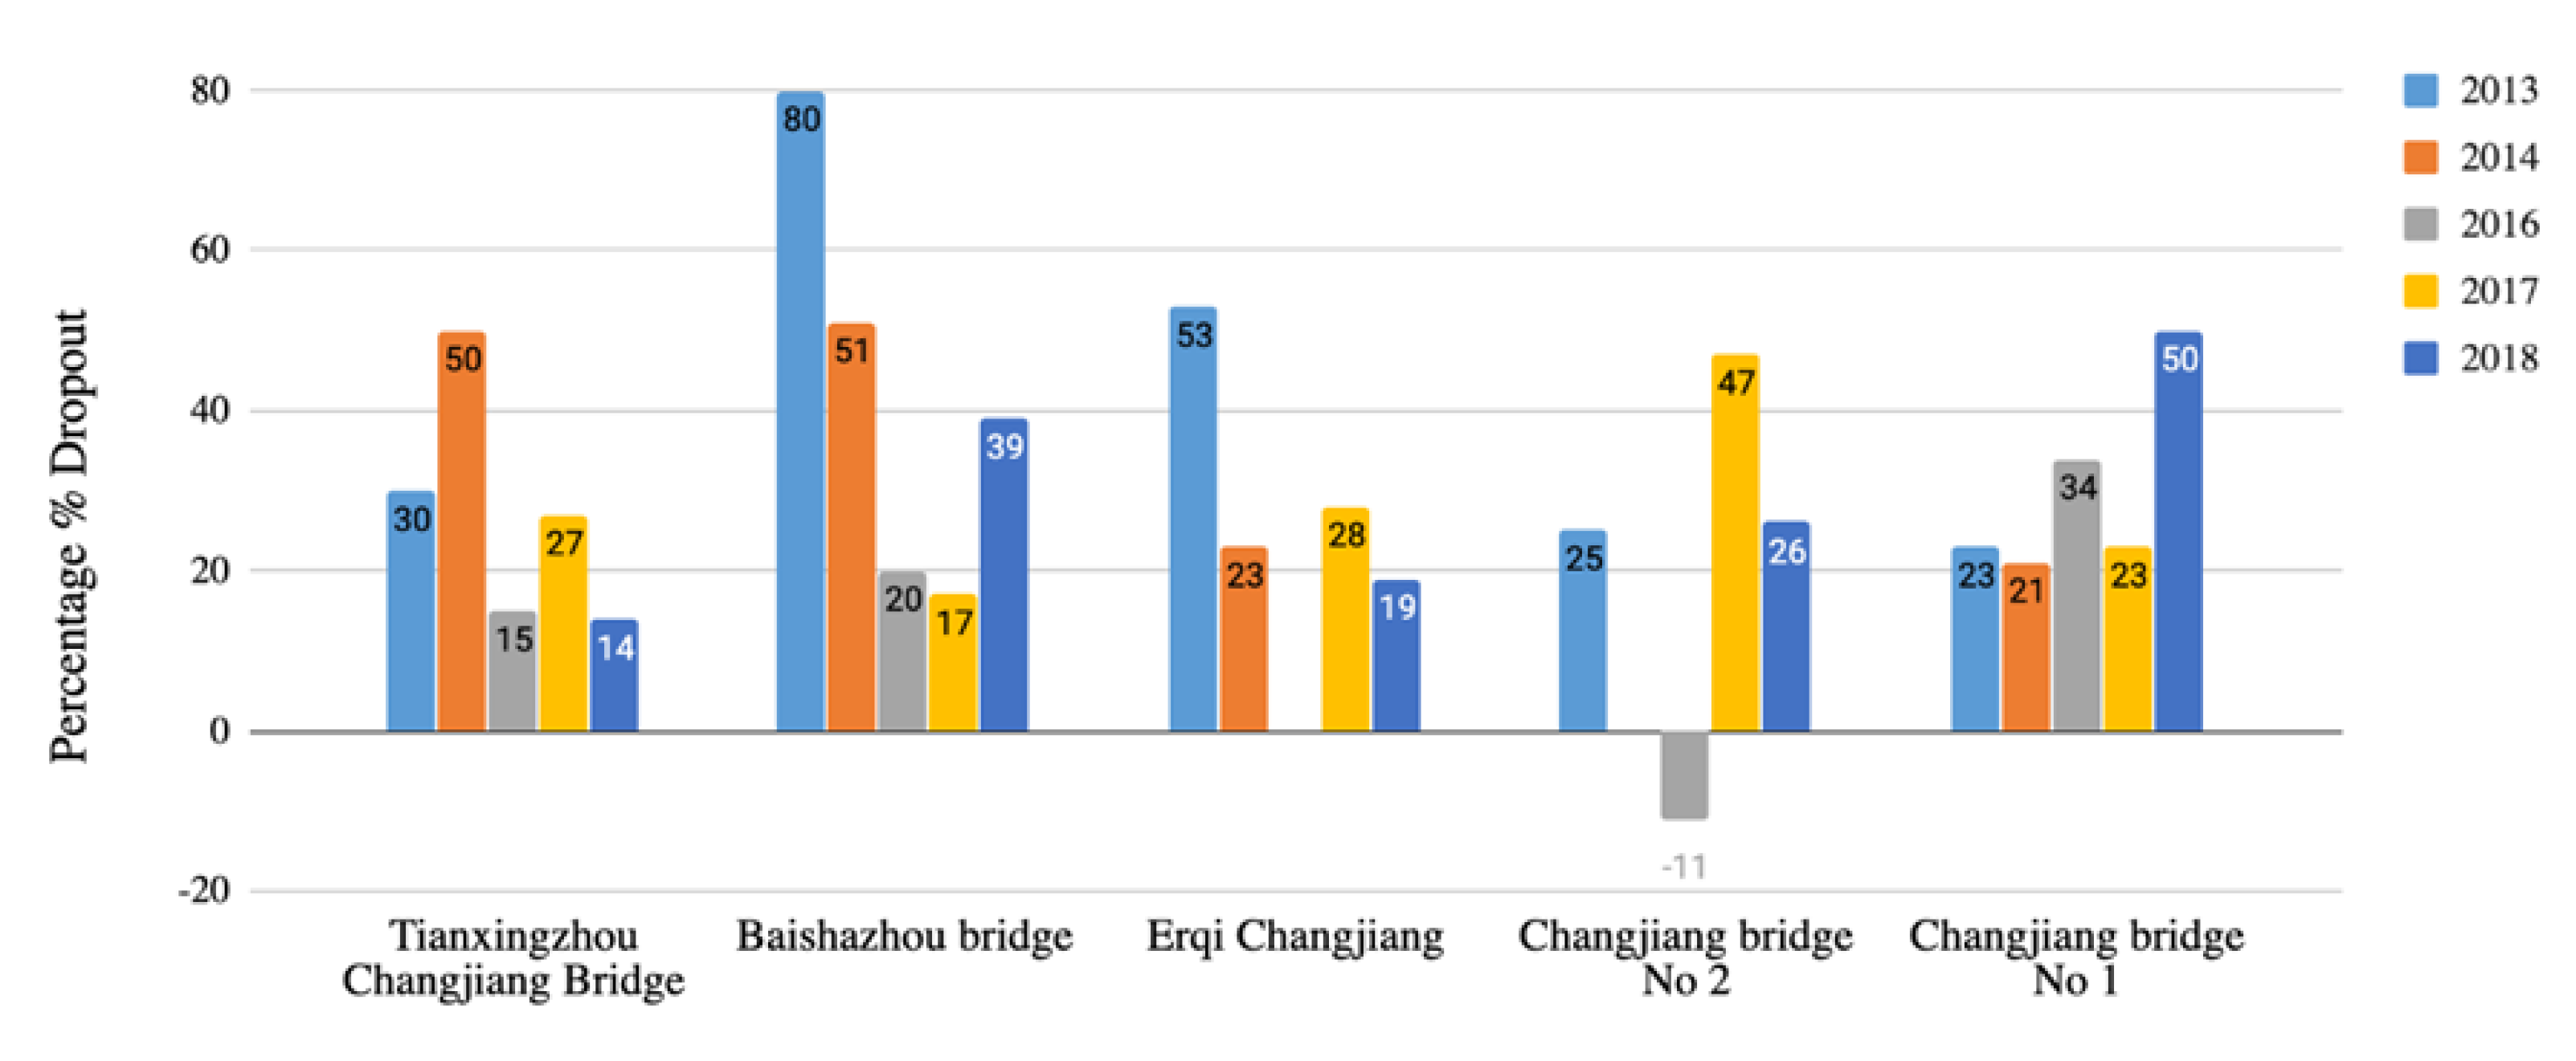
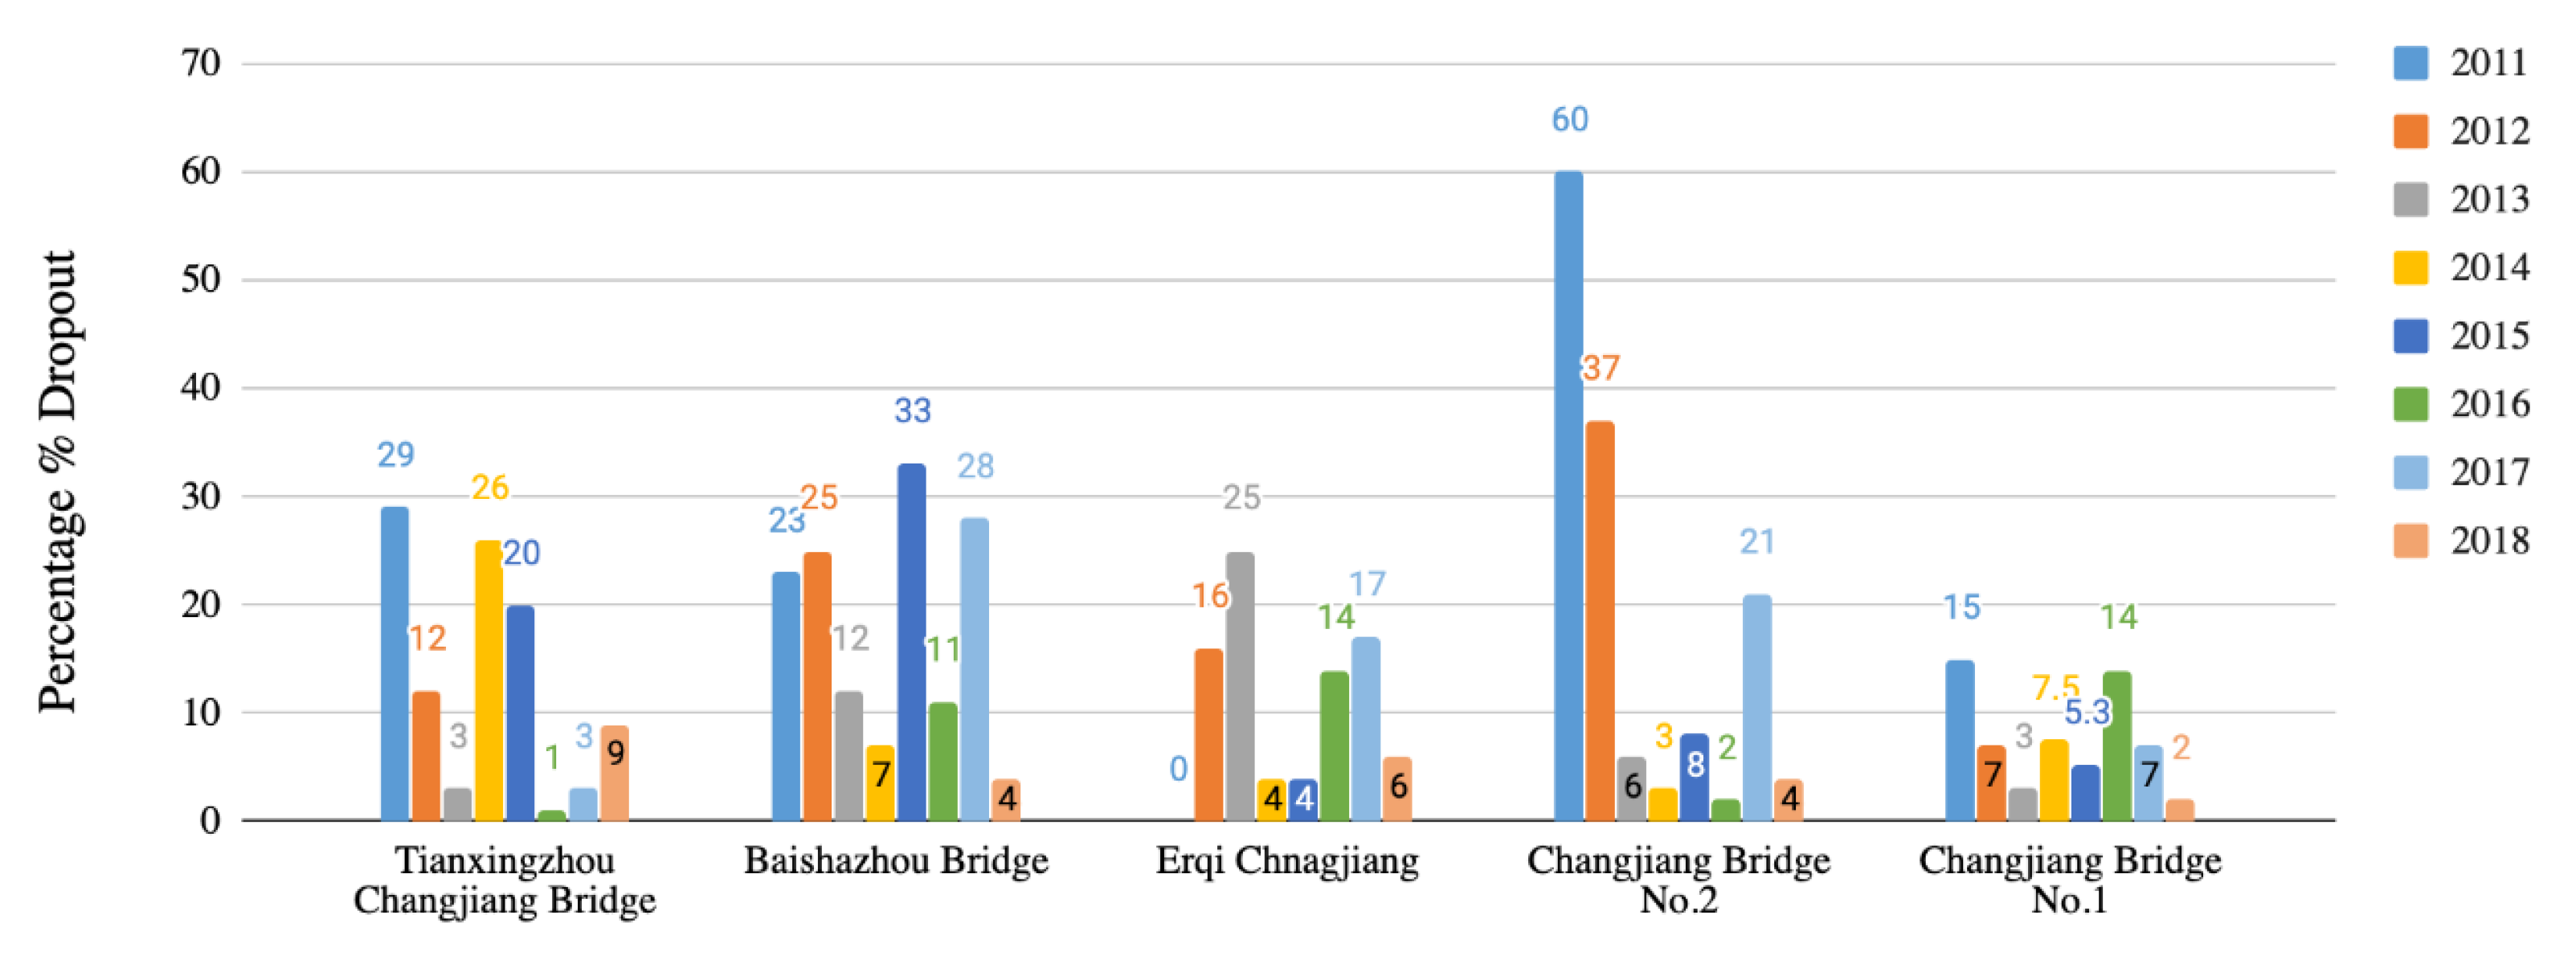
3.2. Variations in Vehicle Trend on Bridges

As mentioned in Section 2.1, the COSMO-SkyMed images were collected at the same hour of the day, i.e., at about 06:00 a.m. local time. Therefore, the traffic that has been captured by SAR data is mostly composed of early morning commuters, buses and trucks. As a consequence, accounting for the geometric and size considerations detailed in Section 2.3, we expect that the detected vehicles in the images are mostly trucks and buses (hereinafter indicated with the generic term “vehicle”). It is also worth noting that the number of vehicles detected represents a “snapshot” of each bridge at the time of the satellite scene acquisition, so it should not be interpreted as the total volume or the flux of vehicles transiting the bridge.
The results expressed as the number of detected vehicles starting from year 2011 to 2020 are shown in Figure 10 for each bridge separately.
The average number of detected vehicles was low on Tianxingzhou Changjiang Bridge in 2011, as it increased from an average of two vehicles to almost four vehicles at the end of 2019, while a linear average of four vehicles was found on the Baishazhou Bridge. Compared to this general trend over the last few years, a sudden decline can be seen after January 2020 in coincidence with the city of Wuhan being set to quarantine (Figure 10). The traffic has been reduced significantly on all bridges, where the number of detected vehicles generally dropped to around 1 or 2, as can be seen in the seven plots in Figure 10. Linear fits in each graph were obtained for all the available images of each bridge, from 2011 to 2020. In this regard, it can be noted that the trend on bridges 1, 2, 3, and 4 shows a small rise in the number of detected vehicles, while the average trend remains stable on bridge 6.
If we look at the overall vehicle trend, the level of vehicle traffic has increased on the Yangtze river over the years. This comes out very clearly in Figure 11, which shows the overall traffic pattern on the Yangtze river by summing up the patterns observed for the seven bridges from mid-2011 to the beginning of 2020. It is worth noting that the absence of vehicles on bridges 5 and 7 during the un-built time periods contributed to the proportionally lower density of traffic in the city in 2011–2014. To better contextualize the increasing trend shown by SAR data, it is reasonable to imagine that, with the finalized construction of these two bridges, the increase in the overall vehicle traffic along the bridges is also a consequence of more infrastructure being available to handle and regulate more traffic.

3.3. Vehicle Variation Trend on Holidays and Weekends

Normally, the traffic reduces during weekends. The traffic drops even more significantly during major holidays, especially on Chinese New Year and the national holidays in October. This trend can be seen in our results. In our analysis, we have also considered other holidays including: Tomb Sweeping Festival in April, Dragon Boat Festival in June, and Labor Day in May. Figure 12 and Figure 13 show the average dropout percentage (i.e., the percentage of vehicles detected on weekends and holidays, with respect to the average number of vehicles on working days) in the number of detected vehicles on bridges during major holidays and during weekends, respectively. The analysis is performed on the five bridges that were already built in 2011 (i.e., 1-4, 6), and were covered by SAR images acquired from 2011 to 2018.
Figure 12 shows traffic reduction on major holidays, with some of the missing numbers in the graph indicating missing values in 2011, 2012 and 2015, when we do not have any satellite images covering the holiday periods. Normally, traffic congestion is low on holidays, as seen in the figure. Nevertheless, Baishazhou Bridge has an unusual high dropout of 80% in 2013, which could be a result of traffic restrictions. However, no external information is available to validate this hypothesis. Moreover, we see a negative dropout rate at Changjiang Bridge No. 2 in 2016, which indicates traffic increase instead of dropout, as shown by the negative number.
Figure 13 shows the average vehicle dropout on weekends. Generally, traffic is less on roads in Wuhan than during weekdays, as can be seen in the figure. However, at Changjiang Bridge No. 2 we see huge spikes of 60% and 37% in 2011 and 2012, respectively. This is due to some major holidays overlapping with weekends, and/or some bridge maintenance, due to which very few or no vehicles were detected.

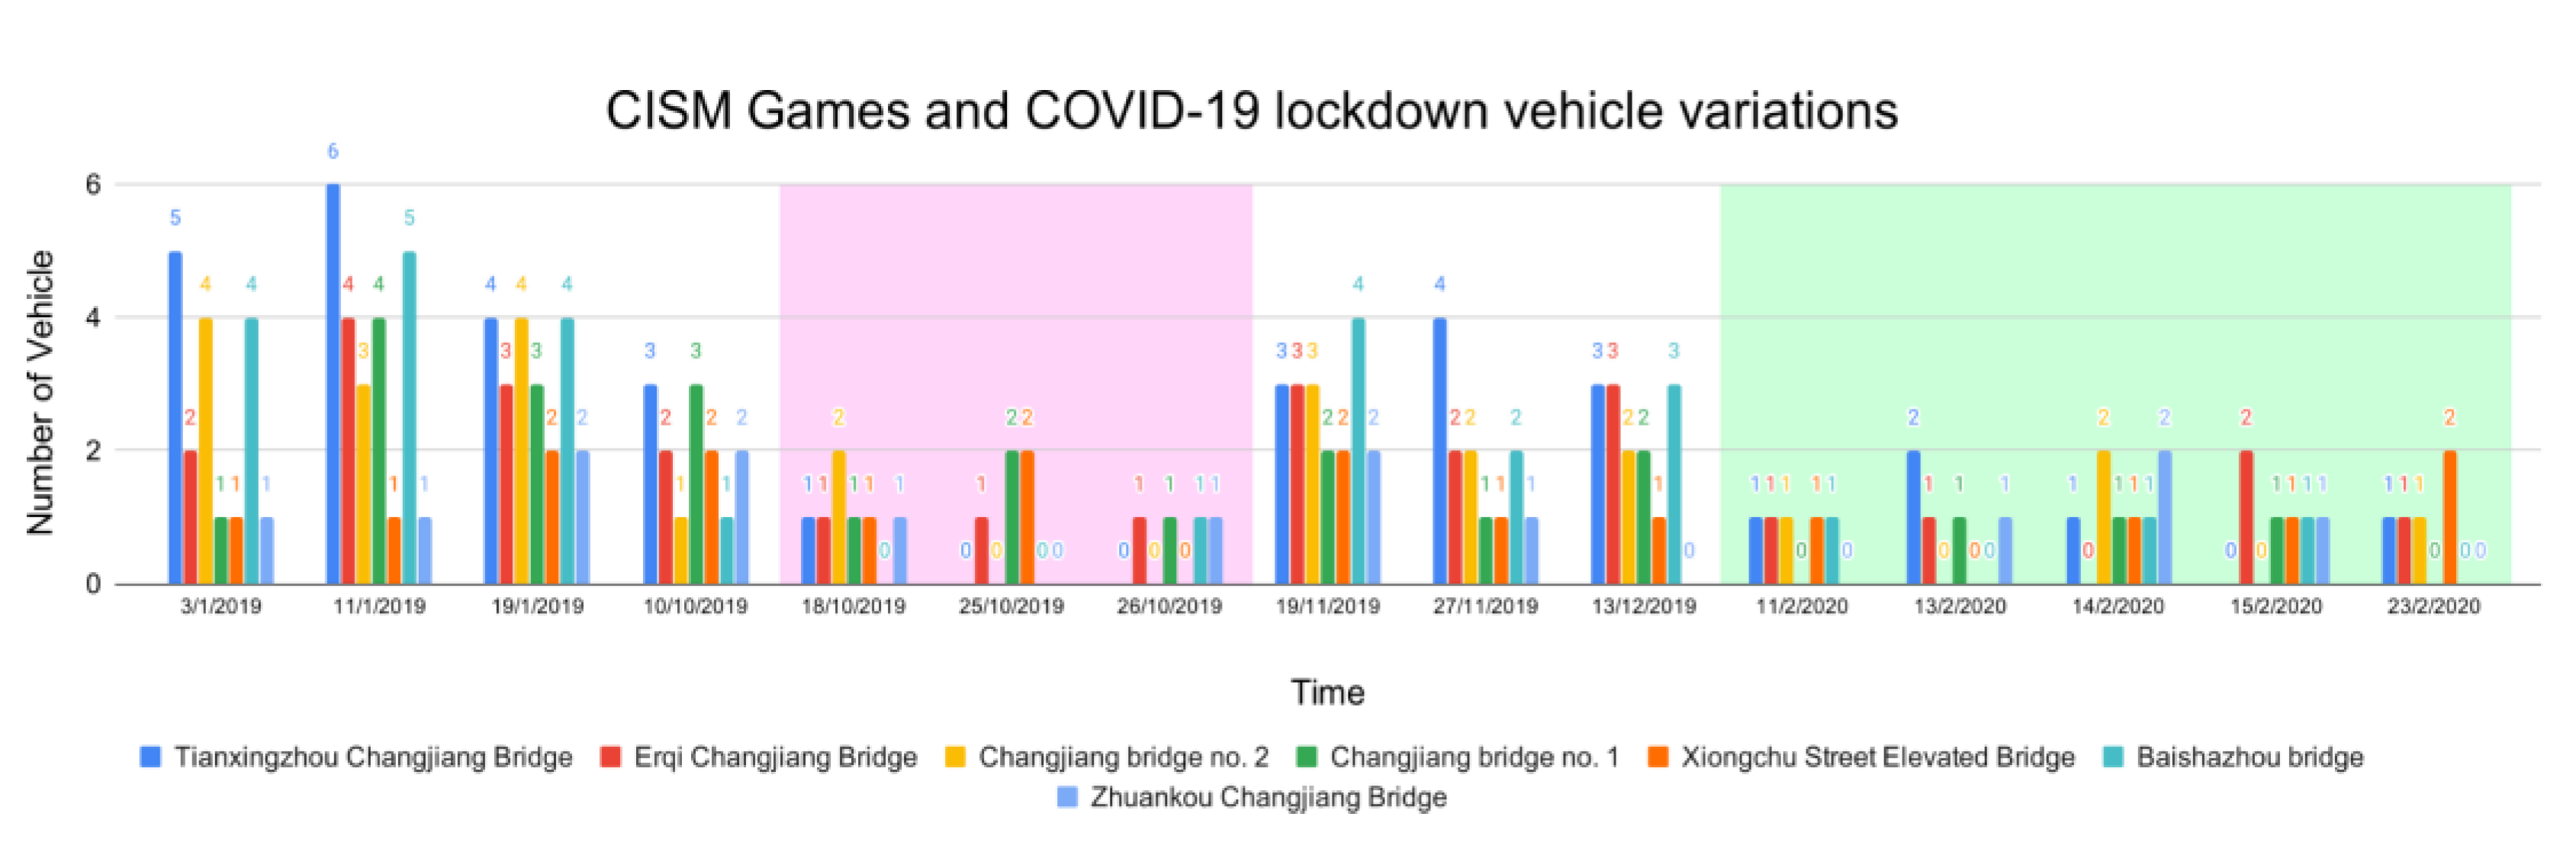
3.4. Vehicle Variation Trend during the 7th CISM Military World Games 2019

The 7th CISM Military World Games were held from 18 October to 27 October 2019. During these games, no trucks were allowed on the third ring road starting from 15 October at 00:00 until 28 October at 23:59. Figure 14 shows the graph of variation in detected vehicles during the event in purple color. At Tianxingzhou Changjiang Bridge at the northern part of the third ring road, we see one detected vehicle on 18 October and none on 25 and 26 October 2019. Moreover, at Baishazhou Bridge, at the southern part of the third ring road, we found no detected vehicles on 18 and 25 October, but detected one on 26 October 2019. The detected vehicles found on both third ring road bridges are probably buses or other cars with a high RCS, as no trucks were allowed at that time.

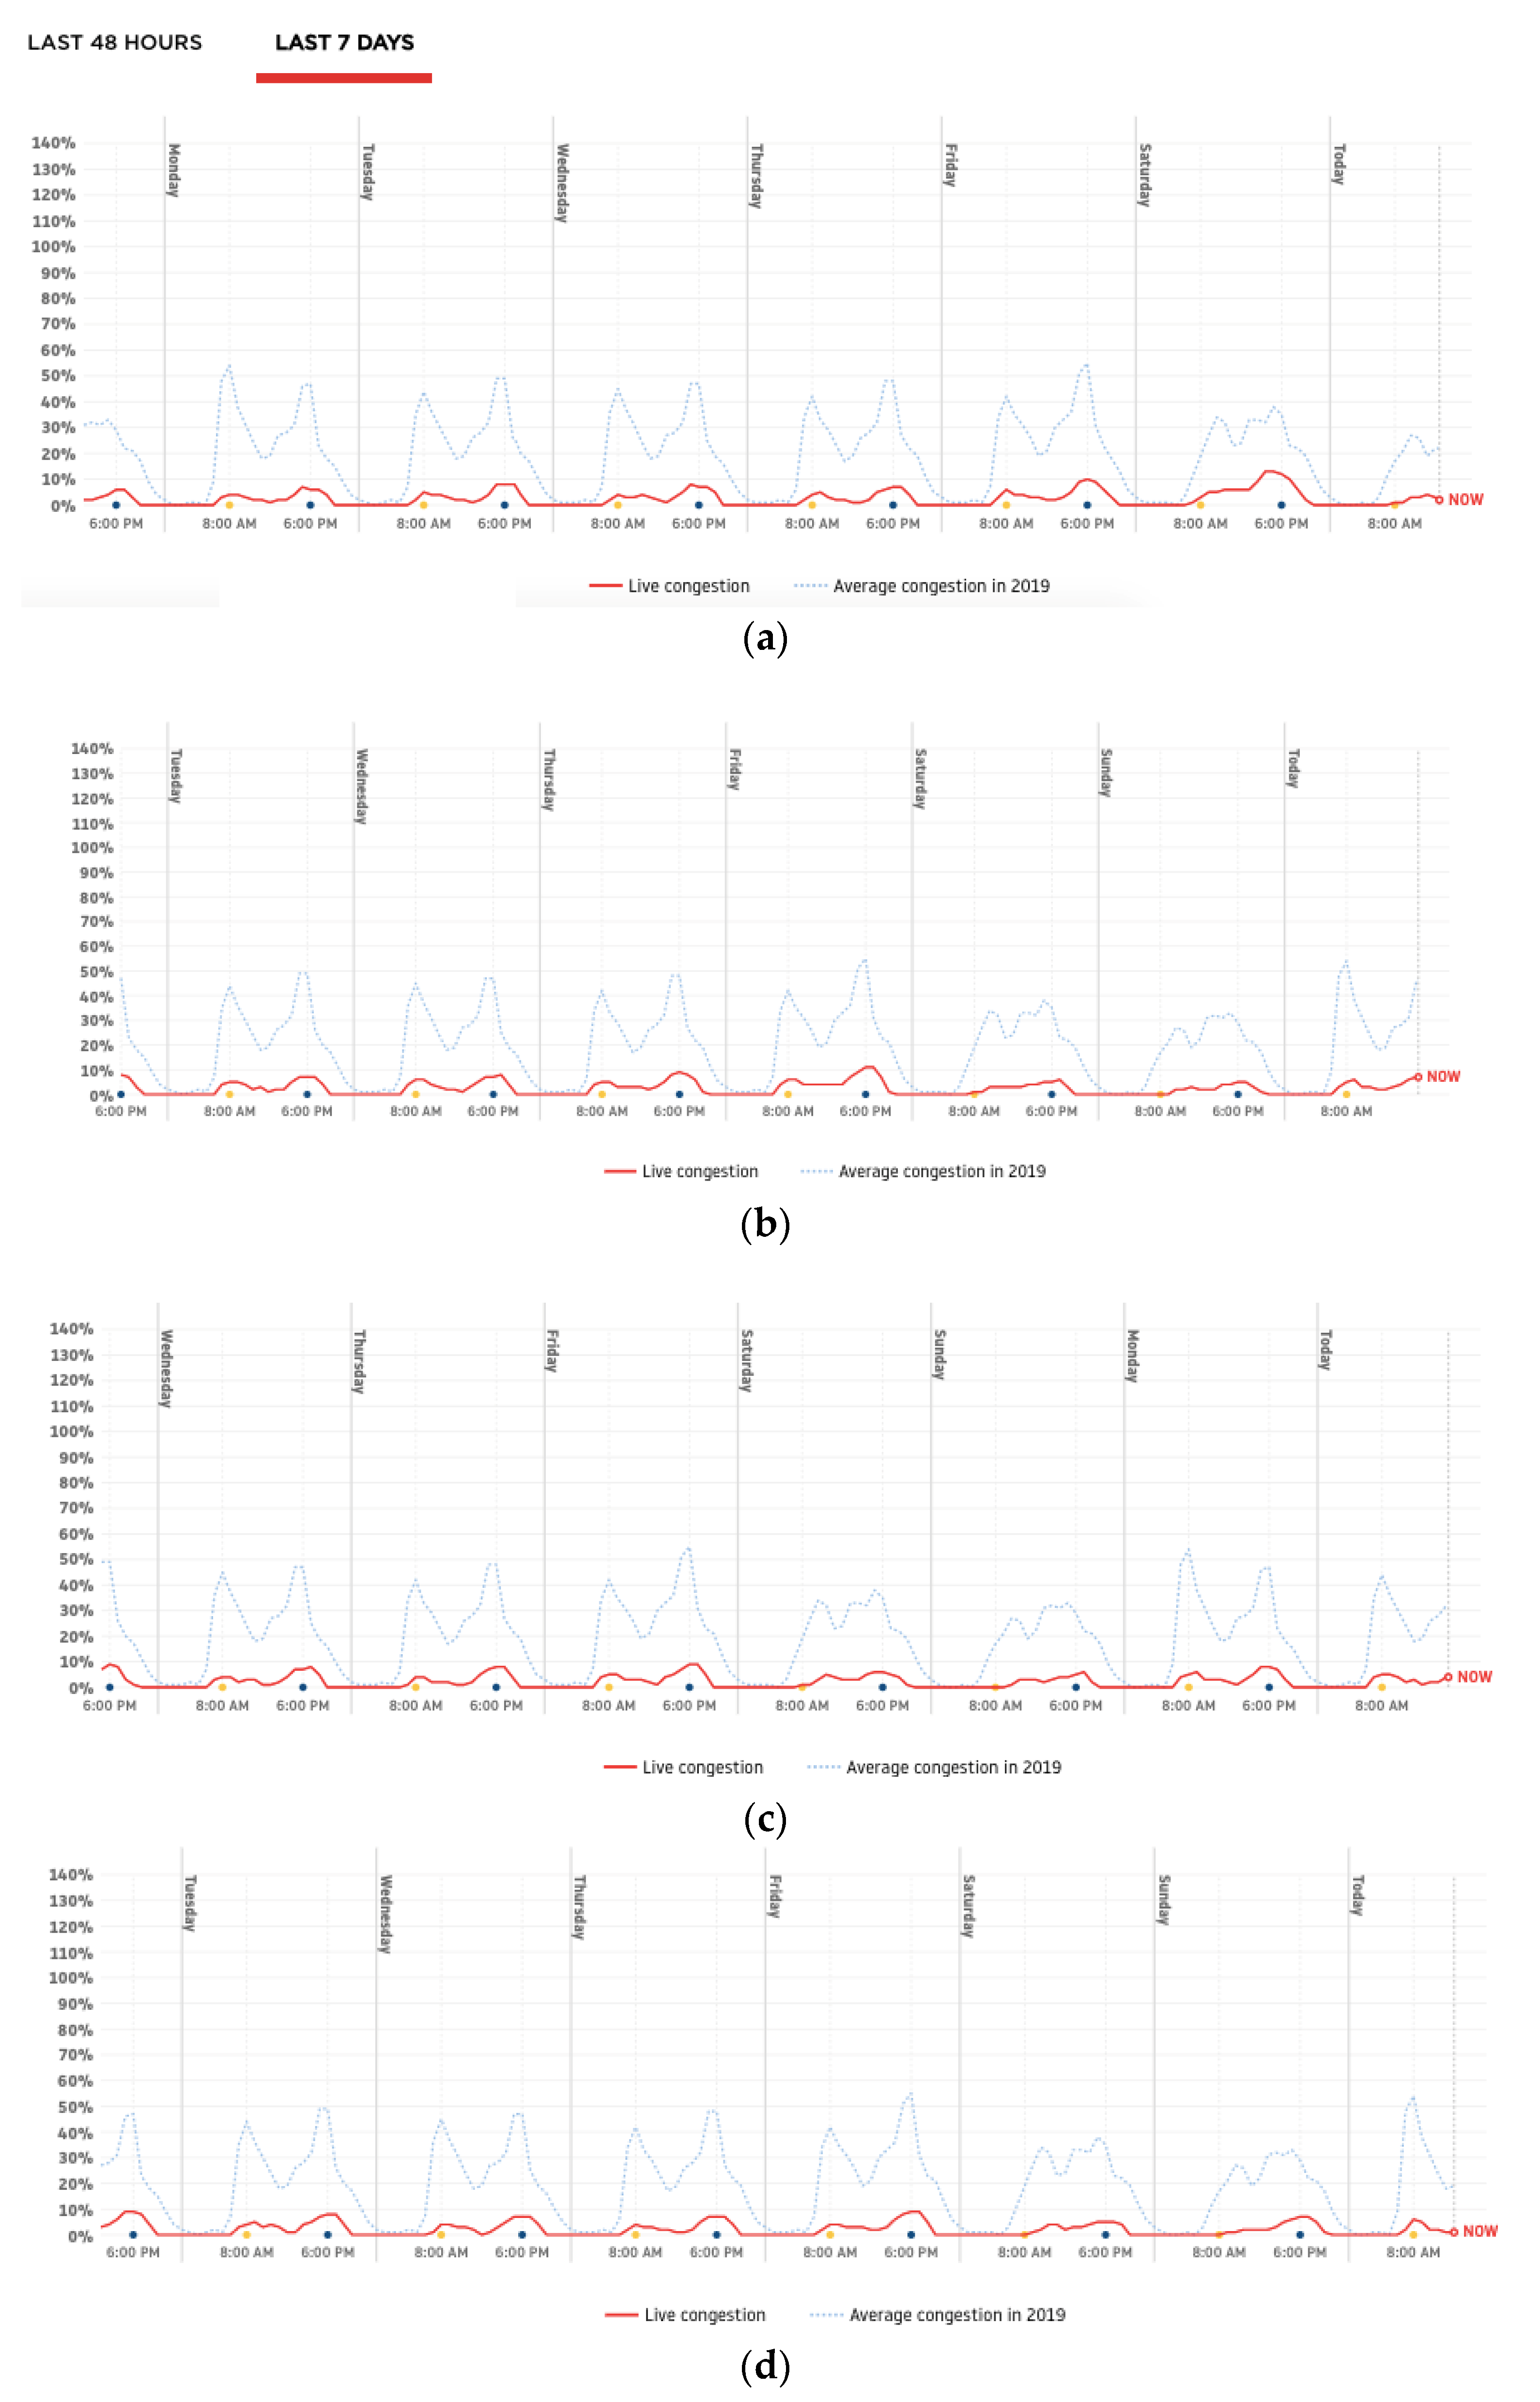
3.5. Vehicle Variation Trend during the COVID-19 Lockdown and Comparison with TomTom Data

Variations in the trend during COVID-19 are shown in a green color in Figure 14. Traffic restrictions were imposed on 23 January 2020 in Wuhan. Right before the implementation of the restrictions and at the very beginning of the lockdown, no COSMO-SkyMed images were acquired. Acquisitions over Wuhan restarted on 11 February 2020. At that time, public traffic was banned; however, trucks as well as private cars functioning as community cars were allowed, as was the other relevant traffic. We therefore did not expect a total drop in detections, but a very significant reduction. Accordingly, only very few detected vehicles on the bridges are found in the SAR data during the COVID-19 lockdown on all bridges. The magnitude of the decrease can be seen if compared with the period between 19 November and 13 December 2019.
As specified in Section 2.2, in the absence of ground truth data collected in the field, we have exploited the online traffic index retrieved from TomTom [12] as an external validation dataset. In particular, Figure 15 reports the traffic congestion before and during the COVID-19 lockdown. To better contextualize the comparison between SAR and TomTom data, it is worth recalling that the bridges on the Yangtze river are the infrastructure connecting the city quarters distributed along the two riverbanks. Therefore, a major volume of traffic passes through these bridges, so variations in the number of vehicles along the bridges are directly linked to the overall city traffic. The rise and fall in traffic congestion of the city is very likely to be reflected in the varying number of vehicles crossing the bridges, as we have seen through SAR data during the COVID-19 lockdown and the 7th CISM Military World Games. This means that the number of vehicles on bridges is a representative proxy that can be compared with the traffic congestion data of the city.
The images (a), (b), (c), and (d) in Figure 15 show the traffic pattern in February and March 2020, with a huge drop due to the COVID-19 lockdown of Wuhan. The blue curves show traffic in normal days and the red curves show the situation at the given dates reported in brackets below each graph. The key conclusion that we can outline is that the variations in the number of vehicles found on the bridges with SAR imagery follow the trend of Wuhan’s traffic monitoring retrieved from TomTom traffic index. Extending this comparative assessment to the whole monitored period (2011–2020), thus including normal days, we have found higher numbers of vehicles on normal days and significantly fewer vehicles during the COVID-19 lockdown.

4. Discussion

Our results show that the proposed method is able to detect vehicles on bridges crossing the Yangtze river. It also is evident that not all vehicles are detected. Small size vehicles can have an RCS that is below our threshold of 2 dB, especially considering the smearing effect, as there is (almost) always a part of the velocity effect in azimuth direction. With varying car shapes and illumination angles, the RCS can vary strongly, so that some smaller cars illuminated under a certain angle can have a very strong backscattering, e.g., pickup trucks. We believe that the detected vehicles are mostly trucks and buses, as mentioned above in the methodology section. This assumption is supported by the similar reduction in the traffic found during the 7th CISM Military World Games, when only trucks were banned, and during the COVID-19 lockdown, when mostly cars and buses were affected, but the number of trucks was also limited.
The proposed method may not be suitable in cases of very heavy traffic and traffic congestion. In such circumstances, it is reasonable to expect that vehicles slow down and traffic jams form, thus meaning that, during SAR acquisition, few to no vehicles are moving along the bridge. Slow moving and standing vehicles would not be displaced in azimuth and therefore would not be detected using the approach proposed in this paper. However, given the early time in the morning when COSMO-SkyMed data are acquired over Wuhan along the ascending orbit of the satellite, it is reasonable to imagine that this is not a common situation.
As commented in Section 3.5, the type of traffic characterizing Wuhan and the role played by the bridges crossing the Yangtze river on urban mobility, provide reasonable justification to compare the number of detected vehicles derived from SAR with TomTom traffic data. The reduction in the TomTom traffic index was very strong during the sanitary emergency and was mostly related to private traffic, thus confirming that this component of urban traffic was basically inhibited. By comparison, the reduction captured by our approach is less strong, as trucks were still passing over the bridges ensuring the supply of goods to Wuhan population. This again validates our assumption that mainly trucks and buses are detected with our method.

5. Conclusions

Monitoring traffic patterns using SAR can help to retrieve metrics and statistics to better understand and quantify urban mobility in dynamic and growing urban environments, where bridges are a key infrastructure for transportation and travel within and in/out of cities. The method tested in Wuhan can provide a means for continuous monitoring, because SAR sensors allow data acquisitions under almost all weather conditions and at high temporal revisit that cloudless optical data cannot always guarantee. The availability of a very long and consistent data stack of COSMO-SkyMed images acquired between mid-2011 and early-2020 enabled us to test the effectiveness of the method on the most commonly used imaging mode with which SAR data from satellite missions are collected worldwide, i.e., StripMap. It is envisaged that future implementation will happen on similar data stacks covering other cities, thus making the best out of the existing satellite archives and powering up urban science studies.
In the specific case of Wuhan, we have detected vehicles with a high RCS, which are likely trucks and buses, on the bridges crossing the Yangtze river, and analyzed the variation in the traffic trends over the last decade. The analysis has revealed that the average number of detected heavy vehicles changes slowly and linearly. However, the trend shows variations during major holidays and weekends. The occurrence of the 7th CISM Military World Games and the COVID-19 lockdown within the observation period offered the opportunity to validate the capability of the method to identify temporal variations in the traffic pattern, since these were events that could be precisely logged in the time domain. Strong variations are seen during these two events and match with the observations allowed by TomTom traffic index.

Author Contributions

Conceptualization, T.B. and H.T.; methodology, H.T. and T.B.; validation, H.T.; resources, D.T. and F.C.; writing—original draft preparation, H.T.; writing—review and editing, T.B., D.T., and F.C.; visualization, H.T. and T.B. All authors have read and agreed to the published version of the manuscript.

Funding

This research was supported by the Chinese Scholarship Council.

Acknowledgments

Research carried out using COSMO-SkyMed® Products, © of the Italian Space Agency (ASI), delivered under a license to use by ASI (i.e., “WUHAN-CSK” led by D. Tapete).

Conflicts of Interest

The authors declare no conflict of interest.

References

  1. Moreira, A.; Prats-Iraola, P.; Younis, M.; Krieger, G.; Hajnsek, I.; Papathanassiou, K.P. A tutorial on synthetic aperture radar. IEEE Geosci. Remote Sens. Mag. 2013, 1, 6–43. [Google Scholar] [CrossRef] [Green Version]
  2. Hinz, S.; Meyer, F.; Laika, A.; Bamler, R. Spaceborne traffic monitoring with dual channel synthetic aperture radar theory and experiments. In Proceedings of the 2005 IEEE Computer Society Conference on Computer Vision and Pattern Recognition (CVPR’05)—Workshops, San Diego, CA, USA, 21–23 September 2005; p. 7. [Google Scholar]
  3. Suchandt, S.; Runge, H.; Breit, H.; Steinbrecher, U.; Kotenkov, A.; Balss, U. Automatic extraction of traffic flows using TerraSAR-X along-track interferometry. IEEE Trans. Geosci. Remote Sens. 2010, 48, 807–819. [Google Scholar] [CrossRef]
  4. Werner, A. SAR Imaging of Moving Objects, Including Ships and Ocean Surface Waves; ESA-MONRE/RSC Training Course: Hanoi, Vietnam, 2008. [Google Scholar]
  5. Jao, J.K. Theory of synthetic aperture radar imaging of a moving target. IEEE Trans. Geosci. Remote Sens. 2001, 39, 1984–1992. [Google Scholar] [CrossRef] [Green Version]
  6. Kirscht, M. Detection and imaging of arbitrarily moving targets with single-channel SAR. IEE Proc. Radar Sonar Navig. 2003, 150, 7–11. [Google Scholar] [CrossRef]
  7. China National Health Commission. Announcement from the Headquarter for Novel Coronavirus Pneumonia Prevention and Control (No 1); China National Health Commission: Beijing/Wuhan, China, 2020.
  8. Caltagirone, F.; Capuzi, A.; Coletta, A.; De Luca, G.F.; Scorzafava, E.; Leonardi, R.; Rivola, S.; Fagioli, S.; Angino, G.; Labbate, M.; et al. The COSMO-SkyMed dual use earth observation program: Development, qualification, and results of the commissioning of the overall constellation. IEEE J. Sel. Top. Appl. Earth Obs. Remote Sens. 2014, 7, 2754–2762. [Google Scholar] [CrossRef]
  9. Covello, F.; Battazza, F.; Coletta, A.; Lopinto, E.; Fiorentino, C.; Pietranera, L.; Valentini, G.; Zoffoli, S. COSMO-SkyMed an existing opportunity for observing the Earth. J. Geodyn. 2010, 49, 171–180. [Google Scholar] [CrossRef] [Green Version]
  10. Battagliere, M.L.; Covello, F.; Coletta, A. COSMO-SkyMed background mission: Overview, objectives and results. In Proceedings of the 63rd International Astronautical Congress, Naples, Italy, 1–5 October 2012. [Google Scholar]
  11. Fiorentino, C.; Virelli, M.; Battagliere, M.L. COSMO-SkyMed Mission and Products Description. Italian Space Agency, Doc. N° ASI-CSM-PMG-NT-001, Issue 3. 2019. Available online: https://www.asi.it/wp-content/uploads/2019/08/COSMO-SkyMed-Mission-and-Products-Description_rev3-2.pdf (accessed on 1 January 2020).
  12. TomTom NV. TomTom Traffic Index 2013. TomTom NV, 2014. Available online: http://www.tomtom.com/en_gb/trafficindex/ (accessed on 1 November 2013).
  13. Tahmasseby, S. Traffic Data: Bluetooth Sensors vs. Crowdsourcing—A Comparative Study to Calculate Travel Time Reliability in Calgary, Alberta, Canada. J. Traffic Transp. Eng. 2015, 3, 63–79. [Google Scholar] [CrossRef] [Green Version]
  14. Nadeem, M.K.; Fowdur, P.T. Performance analysis of a real-time adaptive prediction algorithm for traffic congestion. J. Inf. Commun. Technol. 2018, 17, 493–511. [Google Scholar]
  15. Weihing, D.; Hinz, S.; Meyer, F. Detection of along-track ground moving targets in high resolution spaceborne SAR images. In Proceedings of the ISPRS Commission VII Symposium, Enschede, The Netherlands, 8–11 May 2006. [Google Scholar]
  16. Meyer, F.; Hinz, S.; Laika, A.; Bamler, R. A-Priori information driven detection of moving objects for traffic monitoring by space- borne SAR. In Proceedings of the CMRT05, International Archives of Photogram- Metry, Remote Sensing and Spatial Information Sciences, Vienna, Austria, 29–30 August 2005; Volume XXXVI, 3/W24. pp. 89–94. [Google Scholar]
  17. William, E.; Camps, A. Introduction to Satellite Remote Sensing; Elsevier: Amsterdam, The Netherlands, 2017. [Google Scholar]
  18. Palubinskas, G.; Runge, H. Radar signatures of a passenger car. IEEE Geosci. Remote Sens. Lett. 2007, 4, 644–648. [Google Scholar] [CrossRef] [Green Version]
  19. Cohen, J.; Normile, D. New SARS-like virus in China triggers alarm. Science 2020, 367, 234–235. [Google Scholar] [CrossRef] [PubMed]
  20. BBC 2020. Coronavirus: People of Wuhan Allowed to Leave after Lockdown. Available online: https://www.bbc.com/news/world-asia-china-52207776 (accessed on 8 April 2020).
Figure 1. (a) Study area of Wuhan (China) with the footprint of the COSMO-SkyMed StripMap HIMAGE scenes. (b) Synthetic aperture radar (SAR) amplitude image of the area (the blue arrow on left side indicates the looking direction) in radar geometry, with indication of the seven bridges investigated in this paper (names are reported in Table 1). Red stars indicate bridges whose construction was completed only recently and thus were not included in the present analysis. COSMO-SkyMed® Products ©ASI—Italian Space Agency—2019. All rights reserved.
Remotesensing 12 01636 g001
Figure 2. Histogram of the temporal baselines of the COSMO-SkyMed data stack acquired in StripMap HIMAGE mode over Wuhan between 2011 and 2020.
Remotesensing 12 01636 g002
Figure 3. Satellite SAR image acquisition geometry.
Remotesensing 12 01636 g003
Figure 4. Smearing effect in along-track motion of vehicles.
Remotesensing 12 01636 g004
Figure 5. Displacement effect in cross-track motion of vehicles.
Remotesensing 12 01636 g005
Figure 6. Workflow of the proposed method for the detection of moving vehicles based on SAR amplitude imagery.
Remotesensing 12 01636 g006
Figure 7. Backscatter intensity at Baishazhou Bridge, from COSMO-SkyMed StripMap HIMAGE SAR scene acquired on 13 July 2016. COSMO-SkyMed® Products ©ASI—Italian Space Agency—2016. All rights reserved.
Remotesensing 12 01636 g007
Figure 8. (a) Identification of the seven bridges in the COSMO-SkyMed StripMap HIMAGE imagery acquired on 13 July 2016 in radar intensity: 1—Tianxingzhou Changjiang Bridge, 2—Erqi Changjiang Bridge, 3—Changjiang Bridge No. 2, 4—Changjiang Bridge No. 1, 5—Xiongchu Street Elevated Bridge, 6—Baishazhou Bridge, and 7—Zhuankou Changjiang Bridge. (b) Identification of vehicle candidates with backscatter intensity. COSMO-SkyMed® Products ©ASI—Italian Space Agency—2016. All Rights Reserved.
Remotesensing 12 01636 g008
Figure 9. Detected vehicles with motion direction (red arrows) and azimuth distance (yellow arrows) from bridge 6 on 13 July 2016. Vehicle speeds are listed in Table 2. COSMO-SkyMed® Product ©ASI—Italian Space Agency—2016. All Rights Reserved.
Remotesensing 12 01636 g009
Figure 10. Variation in the number of vehicles on the seven bridges crossing the Yangtze river within the city of Wuhan, detected since May 2011 in each COSMO-SkyMed acquisition at 06:00 a.m. local time.
Remotesensing 12 01636 g010aRemotesensing 12 01636 g010b
Figure 11. Overall vehicle traffic on the seven bridges crossing the Yangtze river within the city of Wuhan, estimated based on the COSMO-SkyMed data analysis for the period 2011–2020.
Remotesensing 12 01636 g011
Figure 12. Average major holiday vehicle reduction rate (in %) in 2013–2018 for 5 bridges crossing the Yangtze river within the city of Wuhan, estimated based on the COSMO-SkyMed data analysis.
Remotesensing 12 01636 g012
Figure 13. Average weekend traffic reduction rate (in %) from 2011 to 2018 for 5 bridges crossing the Yangtze river within the city of Wuhan, estimated based on the COSMO-SkyMed data analysis.
Remotesensing 12 01636 g013
Figure 14. Vehicle trend before, during, and after the 7th International Military Sports Council (CISM) Military World Games and Coronavirus Disease of 2019 (COVID-19) lockdown along the 7 bridges, estimated based on the COSMO-SkyMed data analysis. Purple color shade shows the 7th CISM Military World Games period and green color shade shows the COVID-19 lockdown period.
Remotesensing 12 01636 g014
Figure 15. TomTom traffic congestion index during the COVID-19 lockdown of Wuhan: (a) 10/02/2020–16/02/2020, (b) 19/02/2020–25/02/2020, (c) 25/02/2020–02/03/2020, and (d) 02/03/2020–09/03/2020.
Remotesensing 12 01636 g015
Table 1. Name and number of the seven bridges investigated in this paper. See locations in Figure 1b.
Bridge No.Bridge Name
1Tianxingzhou Changjiang Bridge
2Erqi Changjiang Bridge
3Changjiang Bridge No. 2
4Changjiang Bridge No. 1
5Xiongchu Street Elevated Bridge
6Baishazhou Bridge
7Zhuankou Changjiang Bridge
Table 2. Velocity of three detected moving vehicles at Baishazhou Bridge on 13 July 2016. Refer to Figure 9 for locations.
Target ID v x [km/h] v T [km/h]
A22.833.4
B40.359.1
C32.147.1

