1. Introduction
Natural disasters are often highly destructive and unpredictable. People’s lives can be threatened by these disasters and their property can be looted in the aftermath. When a disaster strikes, people inside buildings may not be able to escape quickly enough and may become trapped inside. Therefore, it is crucial for rescuers to know the exact locations of disaster-damaged buildings before they take actions. Additionally, counting buildings that have suffered damage can assist in accurate post-disaster assessment to estimate property losses and guide post-disaster repairs. Therefore, the production of maps showing damaged buildings is essential in the response and recovery phase of the disaster management cycle. Since ground-based manual statistical methods are slow and unsafe (for example, there are often aftershocks after a major earthquake, so it could be very dangerous to conduct field statistics at this time), very high resolution (VHR) satellite imagery is an attractive data source for disaster damage assessment and quick decision support. Such imagery can capture spatially explicit details at a broad scale without the need for manual field research and is, therefore, feasible for the rapidly analyzing and mapping of damaged buildings over a large area [
1].
Various methods have been used to recognize damaged buildings based on various remote sensing imagery acquired before and/or after events. For example, Akbar et al. combined pre-event unmanned aerial vehicle (UAV) images and hand-crafted features to evaluate structural health [
2]. Gong et al. used synthetic-aperture radar (SAR) data to assess building damage after an earthquake [
3]. Lucks et al. analyzed post-event aerial images with a superpixel-wise method to assess building damage [
4]. Recently, the rapid development of deep learning and convolutional neural networks (CNNs) made disaster detections using remotely sensed imagery more effective and efficient. Fujita et al. developed an object detection model to detect whether buildings had been washed away by a hurricane [
5]. Duarte et al. combined airborne and satellite images to improve the accuracy of damaged building classification [
6]. Doshi et al. proposed a new index named the disaster impact index (DII) to evaluate affected areas based on the recognition of undamaged buildings and roads [
7]. Vetrivel et al. integrated deep learning and post-event 3D points cloud data to improve performance of disaster damage detection [
8]. Cao and Choe developed a method for post-hurricane damage assessment based on object detection [
9]. Nex et al. provided three CNNs pre-trained with satellite, airborne, and UAV image, respectively, to promote operational building damage assessment [
10].
The successful methods detailed above are a few examples among many deep learning-based approaches, which cannot all be listed here. These methods are useful for recognizing building damage caused by the specific type of disaster for which each was developed. However, a question remains, namely: can a general method be developed to recognize damaged buildings with full use of the pre-and post-event aerial images following different types of natural disasters? This question is the motivation of this paper.
2. Data Sources and Disaster Cases
In this study, image data were obtained from the Maxar/DigitalGloble Open Data Program (
https://www.digitalglobe.com/ecosystem/open-data), which is a publicly available platform aiming to provide satellite imagery when a large-scale natural disaster occurs. Using this data program, Gupta et al. collected pre- and post-event VHR satellite imagery of 10 large-scale natural disaster events from six disaster types occurred around the world and created a so-called xBD dataset (a dataset for assessing building damage) for performing building damage assessment [
11]. The six disaster types include volcanic eruption, hurricane, earthquake, flood, tsunami, and wildfire recorded between 2016 and 2019 (
Table 1). All these xBD datasets consist of RGB imagery with a ground sample distance (GSD) of 0.8 m after pansharpening.
The xBD datasets contain 2283 1024 pixels × 1024 pixels RGB image pairs, and each pair consists of pre- and post-disaster images of the same location. Regarding annotations, the pre-disaster images provide WKT-format labels, providing the coordinates of the building polygon vertices. The post-disaster WKT labels not only provide the coordinates of the building polygon vertices but also indicate one of four damage levels (i.e., no damage, minor damage, major damage, or destroyed) to all the buildings, as well as the disaster type.
3. Model Development
3.1. Preprocessing
To generate ground truth for our pixel-classification task with supervised learning, we did some processing on the xBD dataset. Firstly, the pixels of the building were assigned two kinds of positive samples according to whether buildings were damaged. Secondly, other pixels were assigned as negative samples (background).
For the training data, we concatenated pre- and post-event images as a new 6-channel 1024 × 1024 data. Before training the model, we performed augmentations for input data, including flip, rotation scale and color shifts. In this way, the diversity of training data was enhanced, and the deep neural network would become more robust. The final step of preprocessing was that we normalized the input data to have mean 0 and standard deviation 1, so as to make model training easier and speed up the convergence of the training.
3.2. Deep Pixel-Classification Network
In recent years, pixel-level classification based on deep learning has demonstrated outstanding performance in the field of remote sensing [
12]. With a sequence of convolutional layers, a deep learning model not only automatically extracts features of different levels without feature engineering but is also end-to-end. We employed the same principle for labeling damaged buildings from VHR remote sensing imagery and developed a building damage detection network (BDD-Net).
The BDD-Net is a modification of the U-Net architecture [
13] (
Figure 1), which has a typical symmetric encoder–decoder architecture. The encoder is a series of convolutional and contains downsampling layers. With increasing depth in the encoder, the feature maps become smaller while high-level features are extracted. It initially expects the smallest feature map that has high-level features, and, after continuous upsampling and convolutions, the feature map of the original size is restored. The most critical operation of U-Net is that it uses a skip connection at the same stage of the encoder and the decoder. The decoder concatenates the feature map from the corresponding stage of the encoder. In this way, the finally restored feature map is fused with more low-level features, and features at different scales are fused, so that multi-scale prediction can be performed.
In order to improve the feature-extraction capability of the encoder, the EfficientNet-B0 was adopted as the backbone to build BDD-Net. The EfficientNet is a state-of-the-art deep convolutional neural network (CNN) [
14]. By using the neural architecture search (NAS), EfficientNet can reduce the number of parameters but improve performance. The core structure of this CNN is a mobile inverted bottleneck convolution (MBConv) [
15]. EfficientNet performs 1 × 1 convolution and change output channel according to expand ratio [
16]. Additionally, adding squeeze-and-excitation optimization into the network, this block allows the model to pay more attention to the channel features with the most information, while suppressing those unimportant channel features [
17]. Furthermore, the weights of the pretrained model of ImageNet were utilized to initialize BDD-Net. The encoder of the proposed CNN firstly expects a batch of 6-channel 1024 × 1024 image-pairs and performs convolution before downsampling. After eight convolution and downsampling steps, the size of the feature maps will be 4 × 4. Then, these feature maps are upsampled to 8 × 8 and the decoder concatenates the feature maps of the encoder to perform the next convolution and upsampling. By continuously upsampling, the proposed network outputs a feature map of the original size (1024 × 1024). Each block contains a convolutional layer, a batch normalization layer, and an activation function. The activation function is the leaky rectified linear unit (Leaky ReLU), which keeps positive values unchanged and prevents negative values from being lost. The equation for the Leaky ReLU is defined as follows:
where,
x is the input and
is the negative slope that is typically set as 0.01.
It is possible to detect damaged buildings by directly analyzing post-disaster images. However, in some affected areas, buildings are razed to the ground or washed away following a disaster, meaning that the footprints of the buildings are no longer present. Therefore, not all the post-disaster images can provide information about the locations or boundaries of buildings. In this work, this problem was solved by including pre-disaster images as an auxiliary data source to enrich spectral and textural features. Pre- and post-disaster image pairs were concatenated to provide the input (
Figure 1). Image pairs with a temporal difference contain more semantic details than single-temporal images, enabling the model to focus on the variations of the foreground rather than the differences between the foreground and background.
3.3. Loss Function
One of the most import challenges in the pixel classification of remote sensing images is imbalanced data distribution, since it is necessary to accurately classify every pixel of the image and pixels of small objects influence less to the loss. According to the present analysis, the area of undamaged buildings accounts for approximately 5% of the total area in the data used in this study, while the area of damaged buildings accounts for approximately 1%. Therefore, only with a reasonable loss function can be optimized to achieve a highly accurate result.
The dice similarity coefficient (DSC) is a widely used metric in performing highly imbalanced image segmentation tasks, and measures the degree of agreement between the prediction and the ground truth [
18]. The DSC is defined as:
where,
P is the output of segmentation and
G is the ground truth.
However, Equation (2) is not differentiable and, therefore, cannot be directly used as a loss function for convolutional neural networks. A continuous version of the dice score that is differentiable can be used as a loss function to optimize the proposed model:
where,
is a continuous value from the output of the softmax function of the last layer of the network,
is the ground truth of each pixel, and
is the number of pixels.
Although the dice loss can solve the imbalanced-class problem to some extent, it still makes the training unstable in extremely unbalanced segmentation [
19]. Inspired by the medical image model AnatomyNet [
20], the dice loss and focal loss [
21] were combined to perform remote sensing image classification. This integrated total loss function was utilized to optimize the proposed model. The total loss is defined as:
where,
c is the specific class;
is the predicted probability of pixel
n being in class
;
is the ground truth for pixel
n belonging to class
;
is the total number of classes, including background;
λ, which is set to 0.5, is the trade-off between dice loss and focal loss; and
is the total number of pixels in the satellite image under analysis.
3.4. Model Learning
The optimization of the weights in this deep learning process was based on stochastic gradient descent (SGD) [
22]. During the training (or learning), the deep networks expected a batch of samples and perform forward propagation. When one iteration ends, the gradient of the loss function would be calculated to update the weights of the networks. This process was based on a chain rule and back-propagation. The speed of the network converge depended on the learning rate, which was an important hyperparameter to control the size of the gradient descent. The networks were optimized using ADAM, a variant of stochastic gradient descent [
23]. By normalizing the global learning rate with the running average of the gradient to adaptively adjust the learning rate for each parameter, ADAM could amplify the step size along low gradients and attenuate for high gradients. In this way, even if the base learning rate was not set accurately, the model was still able to converge efficiently. During the model training, the base learning rate was set to 0.0001.
Convolutional neural networks have demonstrated effectiveness for transferring learning in remote sensing imagery [
24]. If a CNN is trained with a sufficiently large dataset, it can generally adapt to the pattern of the image data. This means that it can be utilized for a new task without training from scratch. In this way, the deep convolutional neural network only needs to be fine-tuned for the task at hand and thus requires less training time and computational resources. A common practice is to start with an existing network that has been pre-trained on one of the most image dataset (e.g., ImageNet or PASCAL VOC) [
25,
26]. For the proposed BDD-Net, the baseline EfficientNet that has been pre-trained on ImageNet was utilized for fine-tuning.
The BDD-Net was trained on two NVIDIA RTX 2080 GPUs. Due to limitations of GPU memory, the batch size was set to 4.
3.5. Accuracy Assessment
In this study, the F1-score were used to assess the model performance. Although OA is the most commonly used model evaluation metric, it has limitations for imbalanced categories and may not reflect the true performance of a model [
27]. The F1-score is a harmonious average of recall and precision, and has values ranging from 0 to 1. The greater the F1 value, the better the performance of the model. The F1-score are defined as follows:
where, TP, FP, FN, and TN are the true positive, false positive, false negative, and true negative pixel classifications, respectively.
4. Results
As explained above, the input form and loss function are important for the performance of the BDD-Net. Therefore, quantitative experiments were conducted to measure the capability of the proposed model. In all of the xBD dataset, we randomly selected 10% of data from five scenarios for testing separately, including a flood in the Midwest USA, an earthquake in Mexico, a volcanic eruption in Guatemala, the Hurricane Matthew in the USA, and a wildfire in the USA (the Woolsey Fire). Other data was used to train and validate deep neural networks. The proportion of training and validating data was 80% and 10%.
There were obvious differences in F1 scores between post-event single images as input and pre- and post-event paired images as input (
Figure 2). The evaluated area with the highest F1 value was the Hurricane Matthew case. Of the five cases, the lowest F1 value was 82.9% when the input data contained pre- and post-disaster image pairs. However, when only the post-disaster images were used as input, the highest F1 score was only 47.9%.
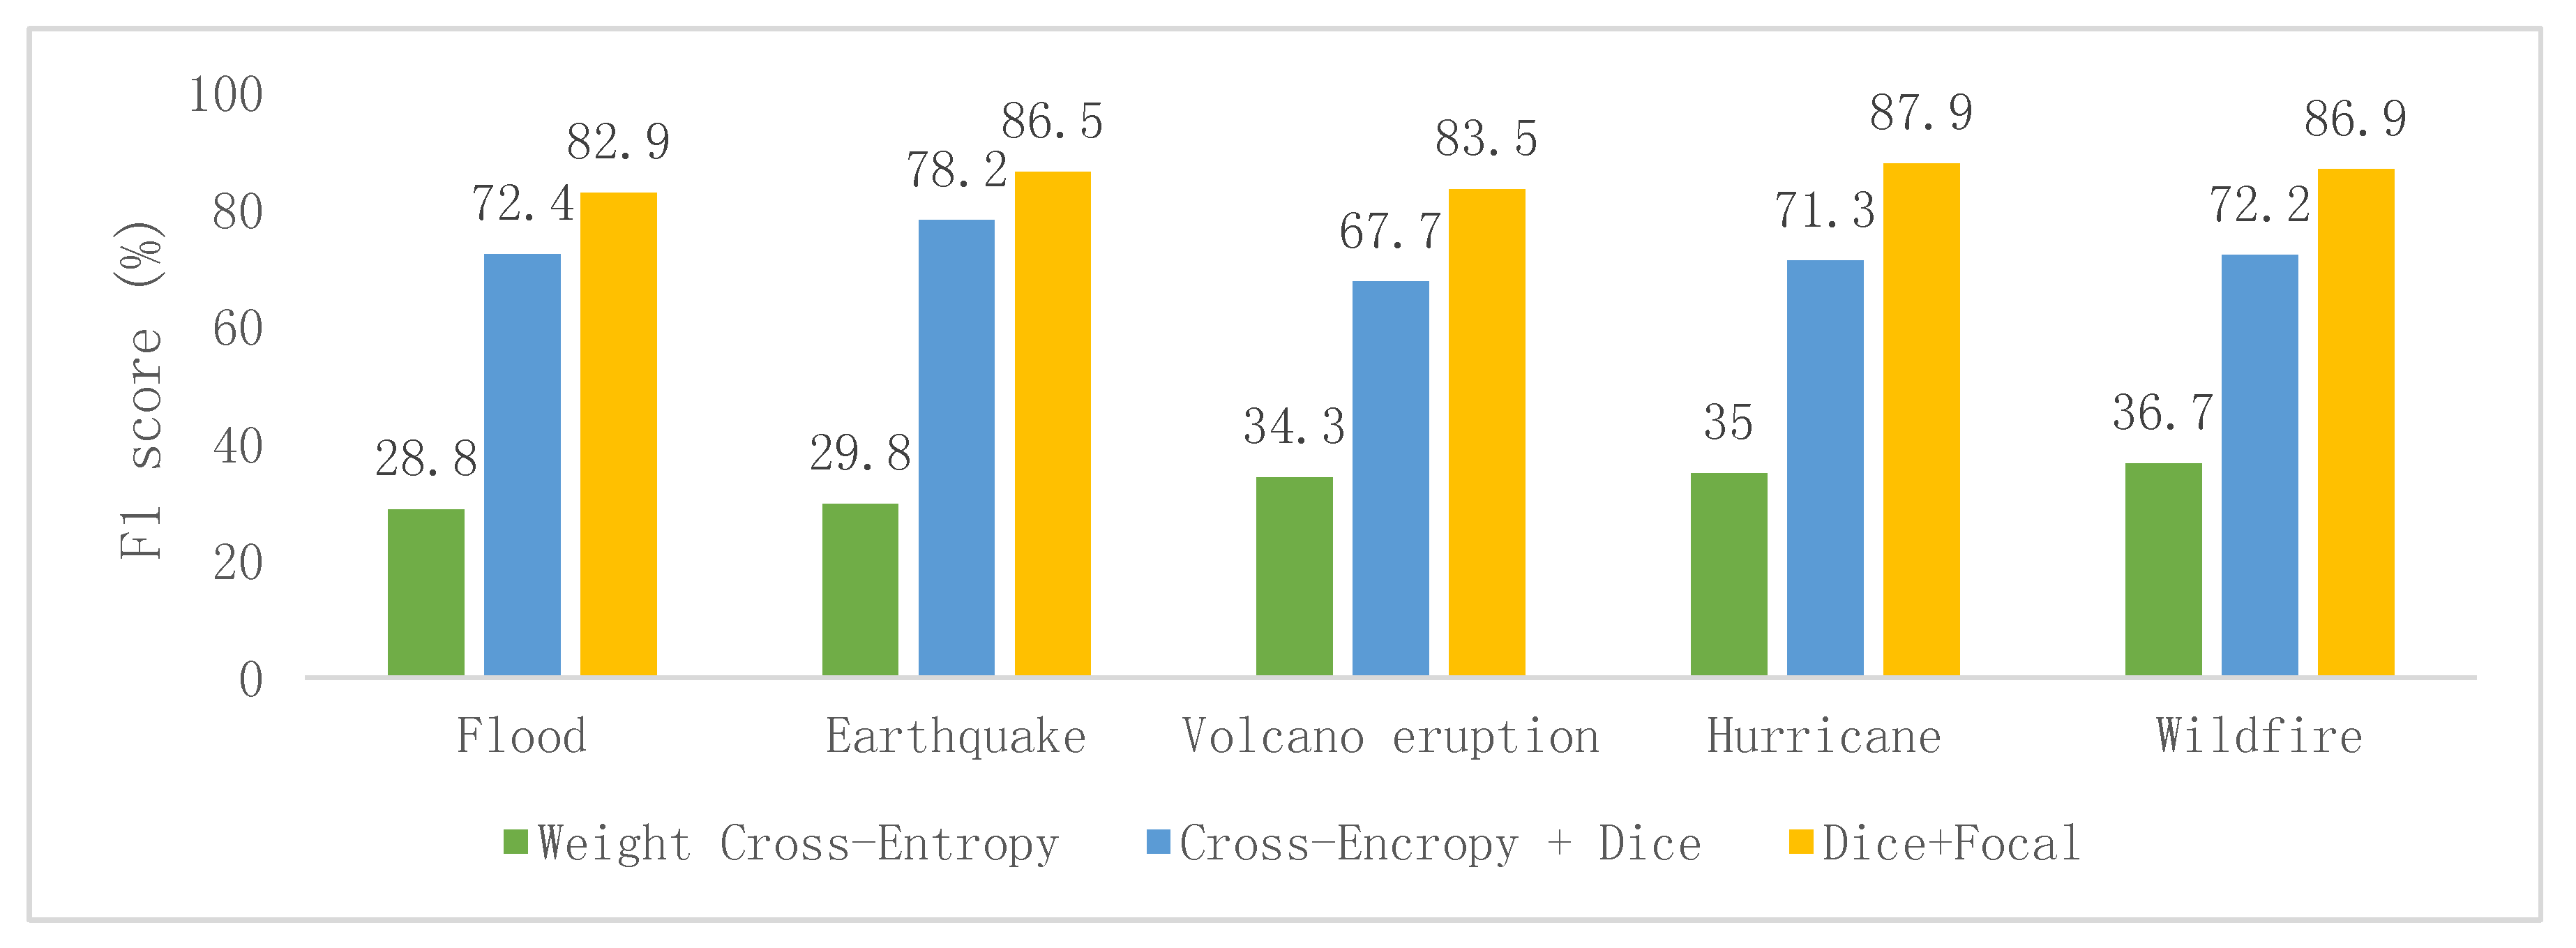
Furthermore, the hybrid loss function that combined dice loss and focal loss obtained higher F1 scores than the other commonly used loss functions, namely the weight cross-entropy [
13] and cross-entropy plus dice loss [
28] (
Figure 3).
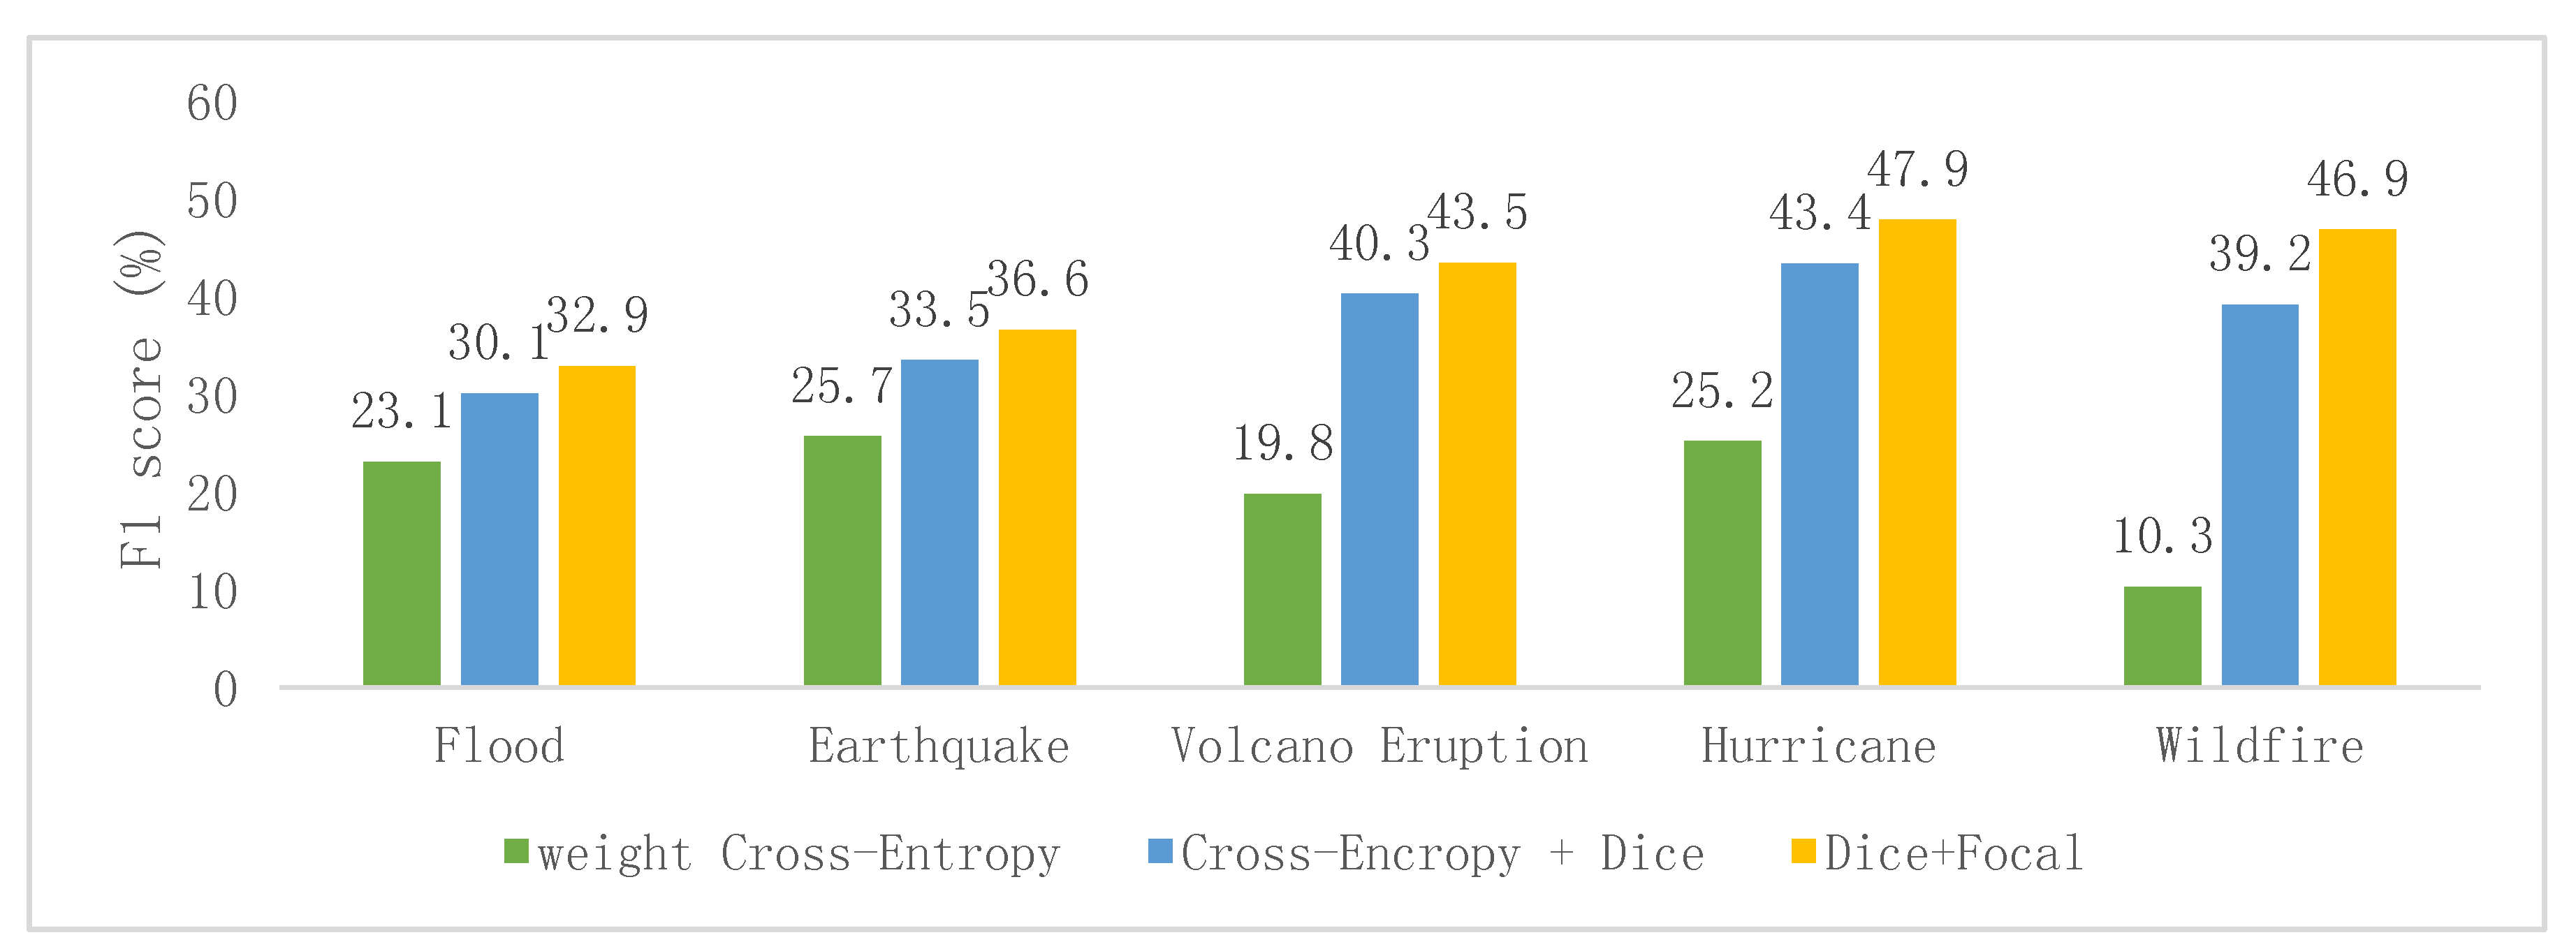
Moreover, when only the post-event images were used as input, the deep CNN obtained low F1 values for all of the five disaster scenarios regardless of what loss function was utilized (
Figure 4).
5. Discussion
5.1. The Special Capacity of Deep Convolutional Neural Networks
The novelty of the proposed method is its general capability to handle different disaster scenarios. The results of the classification experiments suggest that BDD-Net is able to consistently achieve satisfactory results for a variety of disaster scenarios and thus demonstrate that the performance of the CNN does not degrade for different disaster scenarios. Furthermore, the results indicate that BDD-Net is capable of recognizing buildings with different damage levels. To our knowledge, previous models for the assessment of building damage focused mainly on severely damaged buildings, such as those, which had been washed away or razed to the ground. The critical reason why BDD-Net is able to achieve relatively accurate results for various disaster types is that the deep CNN can learn multi-scale features from a large amount of data; as the training data contain various scenarios, the deep CNN can extract more types of spectral and contextual features, which facilitates the detection of building damage following various kinds of disasters.
5.2. Visual Comparison of Image Classification Using Image Pairs and Post-Event Images as Input
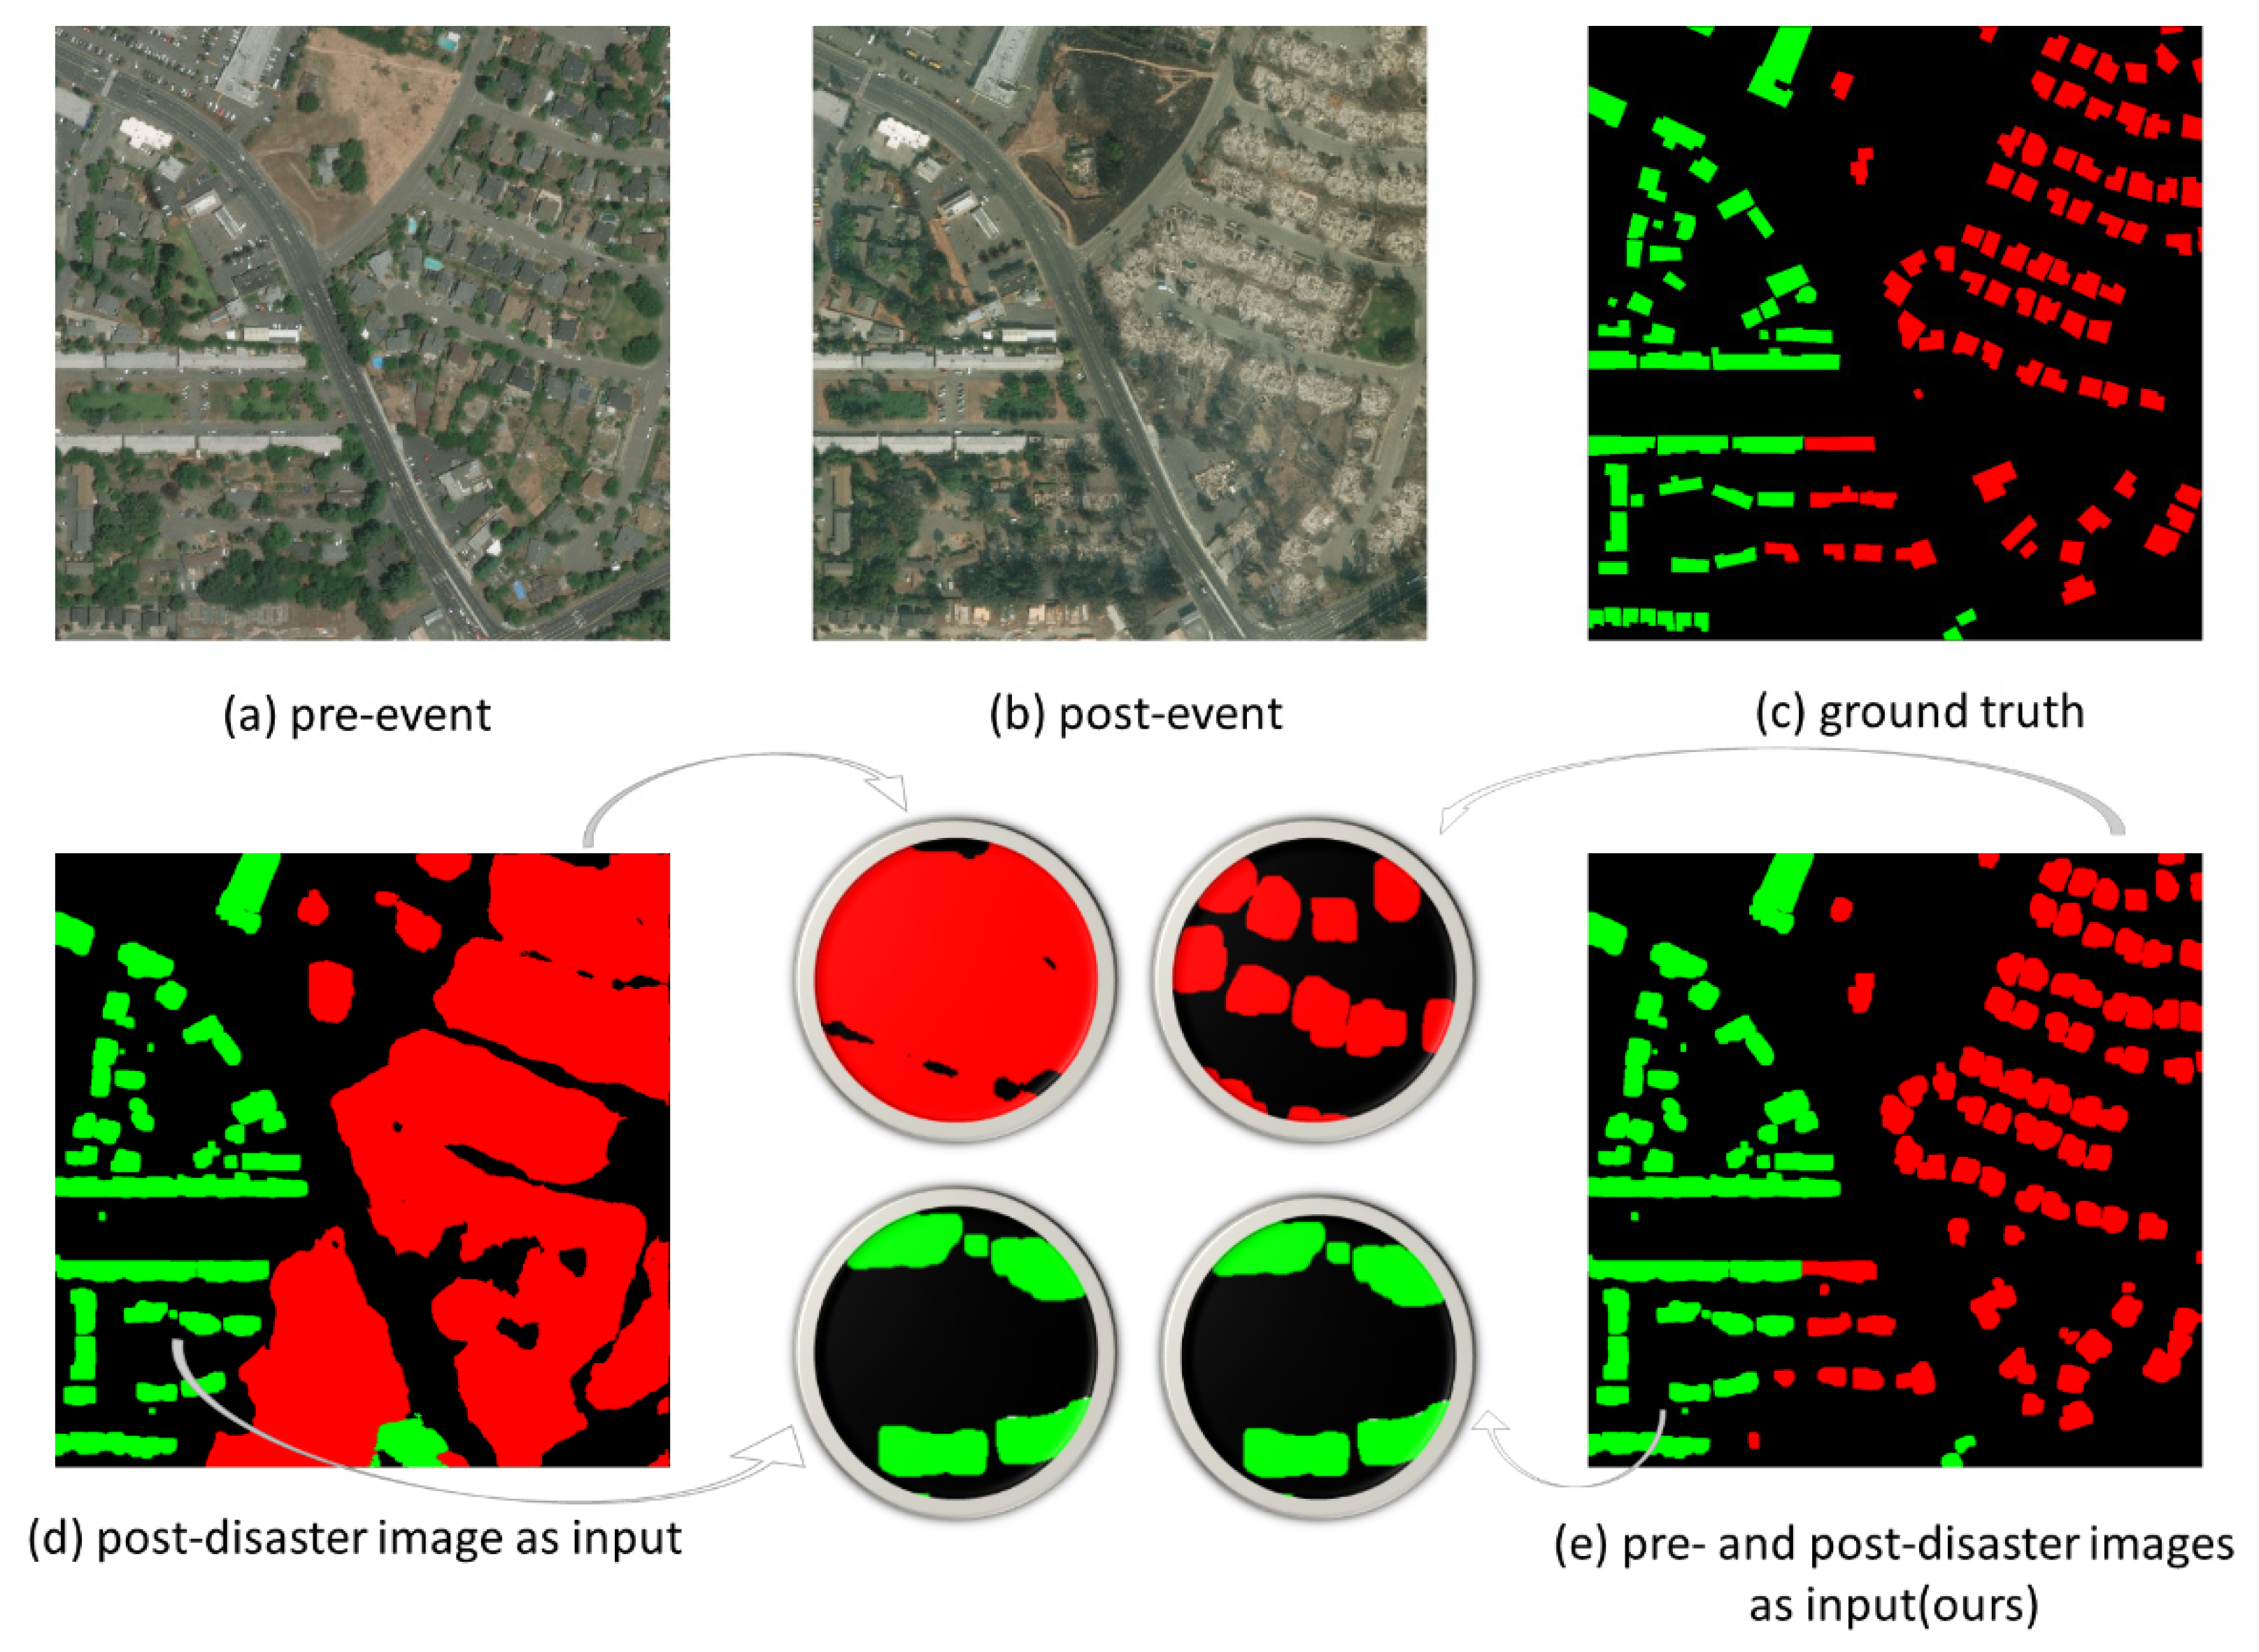
As shown in
Figure 2, the use of image pairs as the input greatly improved the performance of BDD-Net. This improvement can be visually appreciated in the sample images (
Figure 5). In this example, when only a post-disaster image was used as the input, an area that had been razed to the ground was recognized as a patch of damaged land instead of individual buildings as the model could not identify the boundary of the buildings (
Figure 5d). In this case, the model could not clearly recognize damaged building but recognize undamaged buildings well (
Figure 5d). However, this problem was resolved when a pre- and post-disaster image pair was used as the input (
Figure 5e). This is due to the fact that the pre-disaster image contains the locations and boundaries of buildings. Once there are damaged buildings in the post-disaster images, the pre-disaster image could supply the location and boundary information of damaged buildings. This shows that the deep CNN with an image-pair input can extract building-specific features of affected areas and produce building-explicit output.
5.3. Comparison of Different Loss Functions
In this study, we compared the results of using different loss functions, including weighted cross-entropy, a combination of cross-entropy and dice loss, and a combination of dice loss and focal loss (
Figure 3 and
Figure 4). When a post-event image was used as input, the performance of the model was not greatly affected by the use of different loss functions. This is due to the fact that a single post-event image supplies less semantic information and thus any loss function cannot optimize the network well. However, when pre- and post-disaster image pairs were used as input, an obvious improvement was achieved when a combination of dice loss and focal loss was used as the loss function. This suggests that for the severely imbalanced classes and hard sample in remote sensing pixel classification, this type of loss function was more effective than the other types considered previously.
6. Conclusions
Satellite images that cover natural disaster areas have unique spectral features. The automated accurate analysis of post-disaster satellite images has the potential to improve the speed and quality of the disaster response. The key challenge in using satellite images to assess the damage caused by natural disasters is the development of a general model, which can deal with different types of disaster [
10]. To solve this problem, in this study, we developed deep neural network referred to as BDD-Net with three critical technical modifications: (1) developing a U-Net like symmetric structure with baseline EfficientNet as an encoder to make the model deeper and thus enable to learn more levels of features; (2) utilizing pre- and post-disaster image pairs as input to better capture the information of the affected area, especially for areas where buildings have been razed to the ground, and their boundaries are lost; and (3) combining the dice loss and focal loss functions to optimize the model during the training process, which solves the problem of difficult model convergence due to severe class imbalance.
Compared to previous research on the assessment of building damage, this proposed model can handle multiple types of disasters and achieve F1 scores ≥82.9%. Although this experiment included only 10 cases of disasters including only five types of disaster (volcanic eruption, hurricane, earthquake, flood, and wildfire), the satisfactory results revealed the potential of the proposed methodology for developing an even more robust general model for detecting building damage caused by a broad range of natural disasters around the world. By using a publicly available data source, such as the Maxar/DigitalGloble Open Data Program, we can conduct more in-depth research on deep learning applications in remote sensing pixel classification for the recognition of damaged buildings in various post-disaster scenarios, and thus provide operational approaches for related disaster assessment applications under additional real-world scenarios.
Author Contributions
J.S. and G.S. conceived and designed the experiments; J.S. and L.S. preprocessed data; J.S. and Q.Q. performed the experiments; J.S. and M.L. analyzed the results; G.S. and L.T. reviewed and edited the manuscript. All authors have read and agreed to the published version of the manuscript.
Funding
This work was supported by the National Key R&D Program of China (2016YFC0502902 and 2017YFF0207303) and the Strategic Priority Research Program (A) of the Chinese Academy of Sciences (XDA23030105).
Acknowledgments
The authors would like to thank editors and the anonymous reviewers for their insightful suggestions and comments.
Conflicts of Interest
The authors declare no conflict of interest.
References
- Dong, L.; Shan, J. A comprehensive review of earthquake-induced building damage detection with remote sensing techniques. ISPRS J. Photogramm. Remote Sens. 2013, 84, 85–99. [Google Scholar] [CrossRef]
- Akbar, M.A.; Qidwai, U.; Jahanshahi, M.R. An evaluation of image-based structural health monitoring using integrated unmanned aerial vehicle platform. Struct. Control. Health Monit. 2019, 26, e2276. [Google Scholar] [CrossRef] [Green Version]
- Gong, L.; Li, Q.; Wu, F.; Zhang, J.; Tian, T.; Jiang, H. Earthquake-Induced Building Damage Assessment Based on SAR Correlation and Texture. In Proceedings of the IGARSS 2019—2019 IEEE International Geoscience and Remote Sensing Symposium, Yokohama, Japan, 28 July–2 August 2019; pp. 9600–9602. [Google Scholar]
- Lucks, L.; Bulatov, D.; Thönnessen, U.; Böge, M. Superpixel-Wise Assessment of Building Damage from Aerial Images. In Proceedings of the 14th International Joint Conference on Computer Vision, Imaging and Computer Graphics Theory and Applications, Prague, Czech Republic, 25–27 February 2019; pp. 211–220. [Google Scholar]
- Fujita, A.; Sakurada, K.; Imaizumi, T.; Ito, R.; Hikosaka, S.; Nakamura, R. Damage Detection from Aerial Images Via Convolutional Neural Networks. In Proceedings of the 2017 Fifteenth IAPR International Conference on Machine Vision Applications (MVA), Nagoya, Japan, 8–12 May 2017; pp. 5–8. [Google Scholar]
- Duarte, D.; Nex, F.; Kerle, N.; Vosselman, G. Satellite Image Classification of Building Damages Using Airborne and Satellite Image Samples in a Deep Learning Approach. ISPRS Ann. Photogramm. Remote Sens. Spat. Inf. Sci. 2018, 4, 89–96. [Google Scholar] [CrossRef] [Green Version]
- Doshi, J.; Basu, S.; Pang, G. From Satellite Imagery to Disaster Insights. arXiv 2018, arXiv:1812.07033. [Google Scholar]
- Vetrivel, A.; Gerke, M.; Kerle, N.; Nex, F.; Vosselman, G. Disaster damage detection through synergistic use of deep learning and 3D point cloud features derived from very high resolution oblique aerial images, and multiple-kernel-learning. ISPRS J. Photogramm. Remote Sens. 2018, 140, 45–59. [Google Scholar] [CrossRef]
- Cao, Q.D.; Choe, Y. Building Damage Annotation on Post-Hurricane Satellite Imagery Based on Convolutional Neural Networks. arXiv 2019, arXiv:1807.01688. [Google Scholar]
- Nex, F.; Duarte, D.; Tonolo, F.G.; Kerle, N. Structural Building Damage Detection with Deep Learning: Assessment of a State-of-the-Art CNN in Operational Conditions. Remote Sens. 2019, 11, 2765. [Google Scholar] [CrossRef] [Green Version]
- Gupta, R.; Hosfelt, R.; Sajeev, S.; Patel, N.; Goodman, B.; Doshi, J.; Heim, E.; Choset, H.; Gaston, M. xBD: A Dataset for Assessing Building Damage from Satellite Imagery. arXiv 2019, arXiv:1911.09296. [Google Scholar]
- Zhang, L.; Zhang, L.; Du, B. Deep Learning for Remote Sensing Data: A Technical Tutorial on the State of the Art. IEEE Geosci. Remote Sens. Mag. 2016, 4, 22–40. [Google Scholar] [CrossRef]
- Ronneberger, O.; Fischer, P.; Brox, T. U-Net: Convolutional Networks for Biomedical Image Segmentation. arXiv 2015, arXiv:1505.04597. [Google Scholar]
- Tan, M.; Le, Q.V. EfficientNet: Rethinking Model Scaling for Convolutional Neural Networks. arXiv 2019, arXiv:1905.11946. [Google Scholar]
- Tan, M.; Chen, B.; Pang, R.; Vasudevan, V.; Sandler, M.; Howard, A.; Le, Q.V. MnasNet: Platform-Aware Neural Architecture Search for Mobile. arXiv 2019, arXiv:1807.11626. [Google Scholar]
- Huang, G.; Sun, Y.; Liu, Z.; Sedra, D.; Weinberger, K. Deep Networks with Stochastic Depth. arXiv 2016, arXiv:1603.09382. [Google Scholar]
- Hu, J.; Shen, L.; Albanie, S.; Sun, G.; Wu, E. Squeeze-and-Excitation Networks. arXiv 2019, arXiv:1709.01507. [Google Scholar] [CrossRef] [Green Version]
- Milletari, F.; Navab, N.; Ahmadi, S.-A. V-Net: Fully Convolutional Neural Networks for Volumetric Medical Image Segmentation. arXiv 2016, arXiv:1606.04797. [Google Scholar]
- Sudre, C.H.; Li, W.; Vercauteren, T.; Ourselin, S.; Cardoso, M.J. Generalised Dice overlap as a deep learning loss function for highly unbalanced segmentations. arXiv 2017, arXiv:1707.03237. [Google Scholar]
- Zhu, W.; Huang, Y.; Zeng, L.; Chen, X.; Liu, Y.; Qian, Z.; Du, N.; Fan, W.; Xie, X. AnatomyNet: Deep Learning for Fast and Fully Automated Whole-volume Segmentation of Head and Neck Anatomy. Med. Phys. 2019, 46, 576–589. [Google Scholar] [CrossRef] [Green Version]
- Lin, T.-Y.; Goyal, P.; Girshick, R.; He, K.; Dollar, P. Focal Loss for Dense Object Detection. IEEE Trans. Pattern Anal. Mach. Intell. 2020, 42, 318–327. [Google Scholar] [CrossRef] [Green Version]
- Bottou, L.; Laboratories, T.B. Stochastic Gradient Learning in Neural Networks. Proc. Neuro-Nımes 1991, 91, 12. [Google Scholar]
- Kingma, D.P.; Ba, J. Adam: A Method for Stochastic Optimization. arXiv 2017, arXiv:1412.6980. [Google Scholar]
- Ma, L.; Liu, Y.; Zhang, X.; Ye, Y.; Yin, G.; Johnson, B.A. Deep learning in remote sensing applications: A meta-analysis and review. ISPRS J. Photogramm. Remote Sens. 2019, 152, 166–177. [Google Scholar] [CrossRef]
- Russakovsky, O.; Deng, J.; Su, H.; Krause, J.; Satheesh, S.; Ma, S.; Huang, Z.; Karpathy, A.; Khosla, A.; Bernstein, M.; et al. ImageNet Large Scale Visual Recognition Challenge. Int. J. Comput. Vis. 2015, 115, 211–252. [Google Scholar] [CrossRef] [Green Version]
- Everingham, M.; Van Gool, L.; Williams, C.K.I.; Winn, J.; Zisserman, A. The Pascal Visual Object Classes (VOC) Challenge. Int. J. Comput. Vis. 2010, 88, 303–338. [Google Scholar] [CrossRef] [Green Version]
- Shao, G.; Tang, L.; Liao, J. Overselling overall map accuracy misinforms about research reliability. Landsc. Ecol. 2019, 34, 2487–2492. [Google Scholar] [CrossRef] [Green Version]
- Isensee, F.; Petersen, J.; Klein, A.; Zimmerer, D.; Jaeger, P.F.; Kohl, S.; Wasserthal, J.; Koehler, G.; Norajitra, T.; Wirkert, S.; et al. nnU-Net: Self-adapting Framework for U-Net-Based Medical Image Segmentation. arXiv 2018, arXiv:1809.10486. [Google Scholar]
© 2020 by the authors. Licensee MDPI, Basel, Switzerland. This article is an open access article distributed under the terms and conditions of the Creative Commons Attribution (CC BY) license (http://creativecommons.org/licenses/by/4.0/).


