1. Introduction
Geophysical prospecting is widely applied in archaeology in order to detect and identify buried structures and lost settlements. The possibility of investigating large portions of subsoil non-invasively, while saving time and resources, allows the detection of archaeological features buried in the first meters with a resolution suitable for archaeological aims. In this regard, this work deals with a combined multi-sensor application based on two different geophysical methodologies such as magnetometry (MAG) and ground penetrating radar (GPR). The complemented use of these methodologies represents a well-assessed option for supporting the archaeological research [
1,
2,
3,
4,
5,
6]. Furthermore, their effectiveness can be improved by geophysical electrical resistivity methods able, despite the lower resolution, to reconstruct the paleogeological features of the investigated archaeological scenarios and identify archaeological buried structures placed at depths not reachable by MAG and GPR [
7,
8].
MAG detects archaeological remains by analyzing the variations of the earth’s magnetic field due to the different magnetic susceptibilities of construction materials and the magnetic characteristics of the shallow subsoil. By means of MAG, it is possible to investigate large areas in a relatively short time and identify the most significant archaeological anomalies. Further advantages are offered by the possibility of performing MAG gradiometric measurements. Indeed, by exploiting two magnetic sensors at different heights during the survey, it is possible to evaluate the gradiometric values that are less sensitive to the temporal variations of the magnetic fields, because the two measurements are acquired at the same time. The gradient field allows an increased sensitivity with respect to shallower sources because the spatial decay of the magnetic gradients is faster compared to that of the magnetic fields. For the same reason, magnetic gradients are insensitive (or less sensitive compared to the magnetic field measurements) to the regional magnetic fields. Finally, due to the faster decay of the magnetic gradient, the capability of discriminating signals produced by nearby sources (‘resolution’) is improved with respect to the magnetic field measurements. As a “physical” drawback, MAG is not able to estimate accurately the depth of buried objects without a-priori information about the size and orientation of the anomaly [
9,
10,
11].
In the present paper, the MAG method is complemented by GPR [
12,
13], which allows high-resolution imaging of shallow buried remains in terms of geometry and depth. As is well-known, GPR exploits the capability of electromagnetic waves to penetrate non-metallic media and interact with buried targets. GPR is suited to provide high resolution two- and three-dimensional images of the underground and allows detection, localization and geometry estimations of hidden/buried targets starting from the electromagnetic field backscattered by the target, when illuminated by an incident field [
14,
15,
16]. The GPR method exploits antennas working at different frequencies and work frequency band more suitable for archaeological purposes ranges from 100 MHz to 600 MHz. This frequency range provides detailed information about the presence of buried structures placed in the first meters of the subsoil [
14,
15,
16].
This paper presents the results obtained through a multi-sensor use of MAG and GPR for supporting the archaeological research at the site of Paestum.
This archaeological research developed from some amazing findings casually found near the ancient city wall. As a first step, archaeological analyses identified a wide area, currently devoted to agricultural purposes, as the region of interest for geophysical prospecting. As a second step, the MAG technology was used to identify buried anomalies in a two hectare wide area, previously identified by the archaeologists, and delineate the most promising areas where GPR surveys should have been performed. As a third step, by exploiting georeferenced data, GPR was performed to obtain a detailed investigation of a 30 m × 20 m area, where the buried temple was supposed to be. The GPR survey allowed us to define the depth, shape, and orientation of the discovered targets. The obtained results allowed the identification of an undiscovered buried temple, with an impressive resolution.
The paper is organized as follows.
Section 2 describes the archaeological and geological context of the Paestum site.
Section 3 presents the survey carried out with MAG and GPR technologies and the data processing. The results are provided in
Section 4. Discussion and Conclusions end the paper.
2. The Archaeological and Geological Contexts
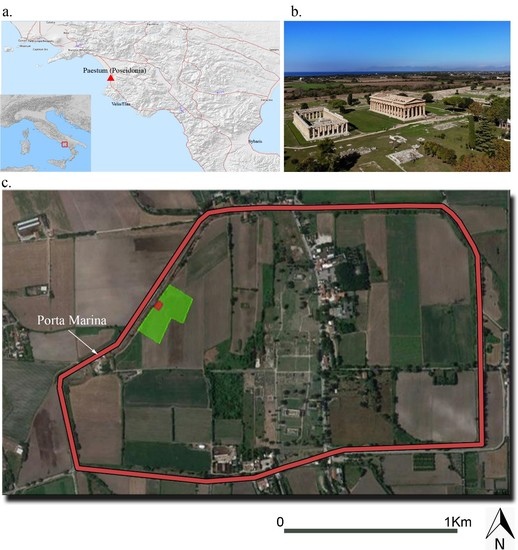
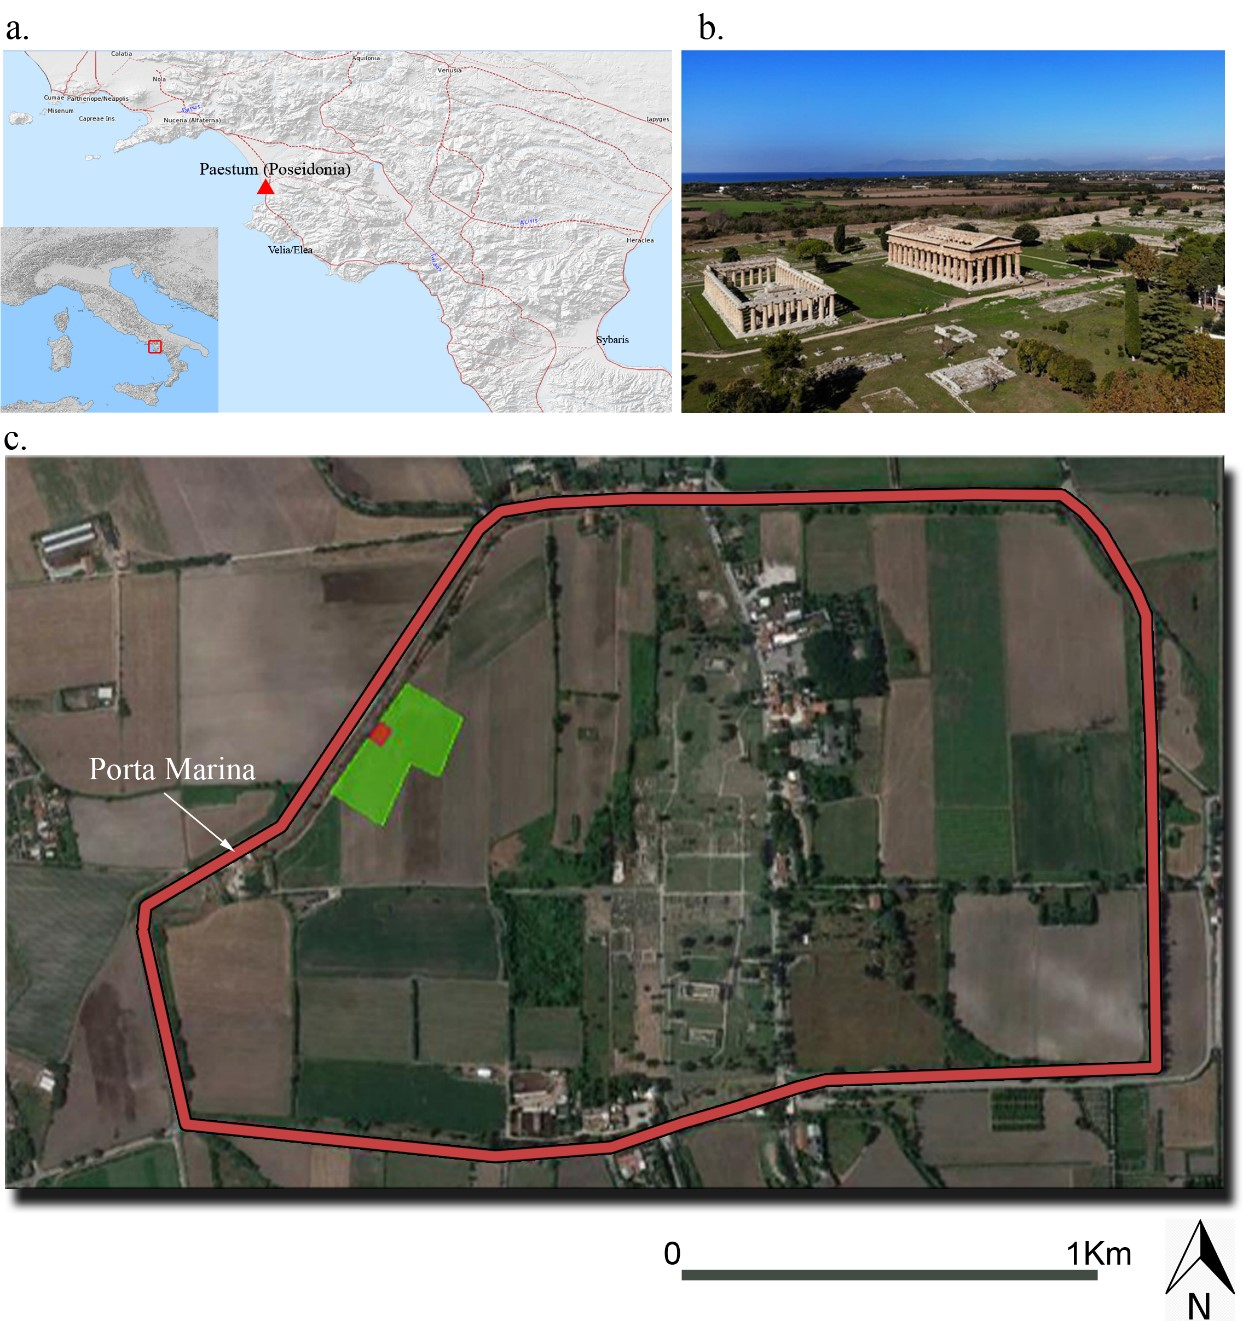
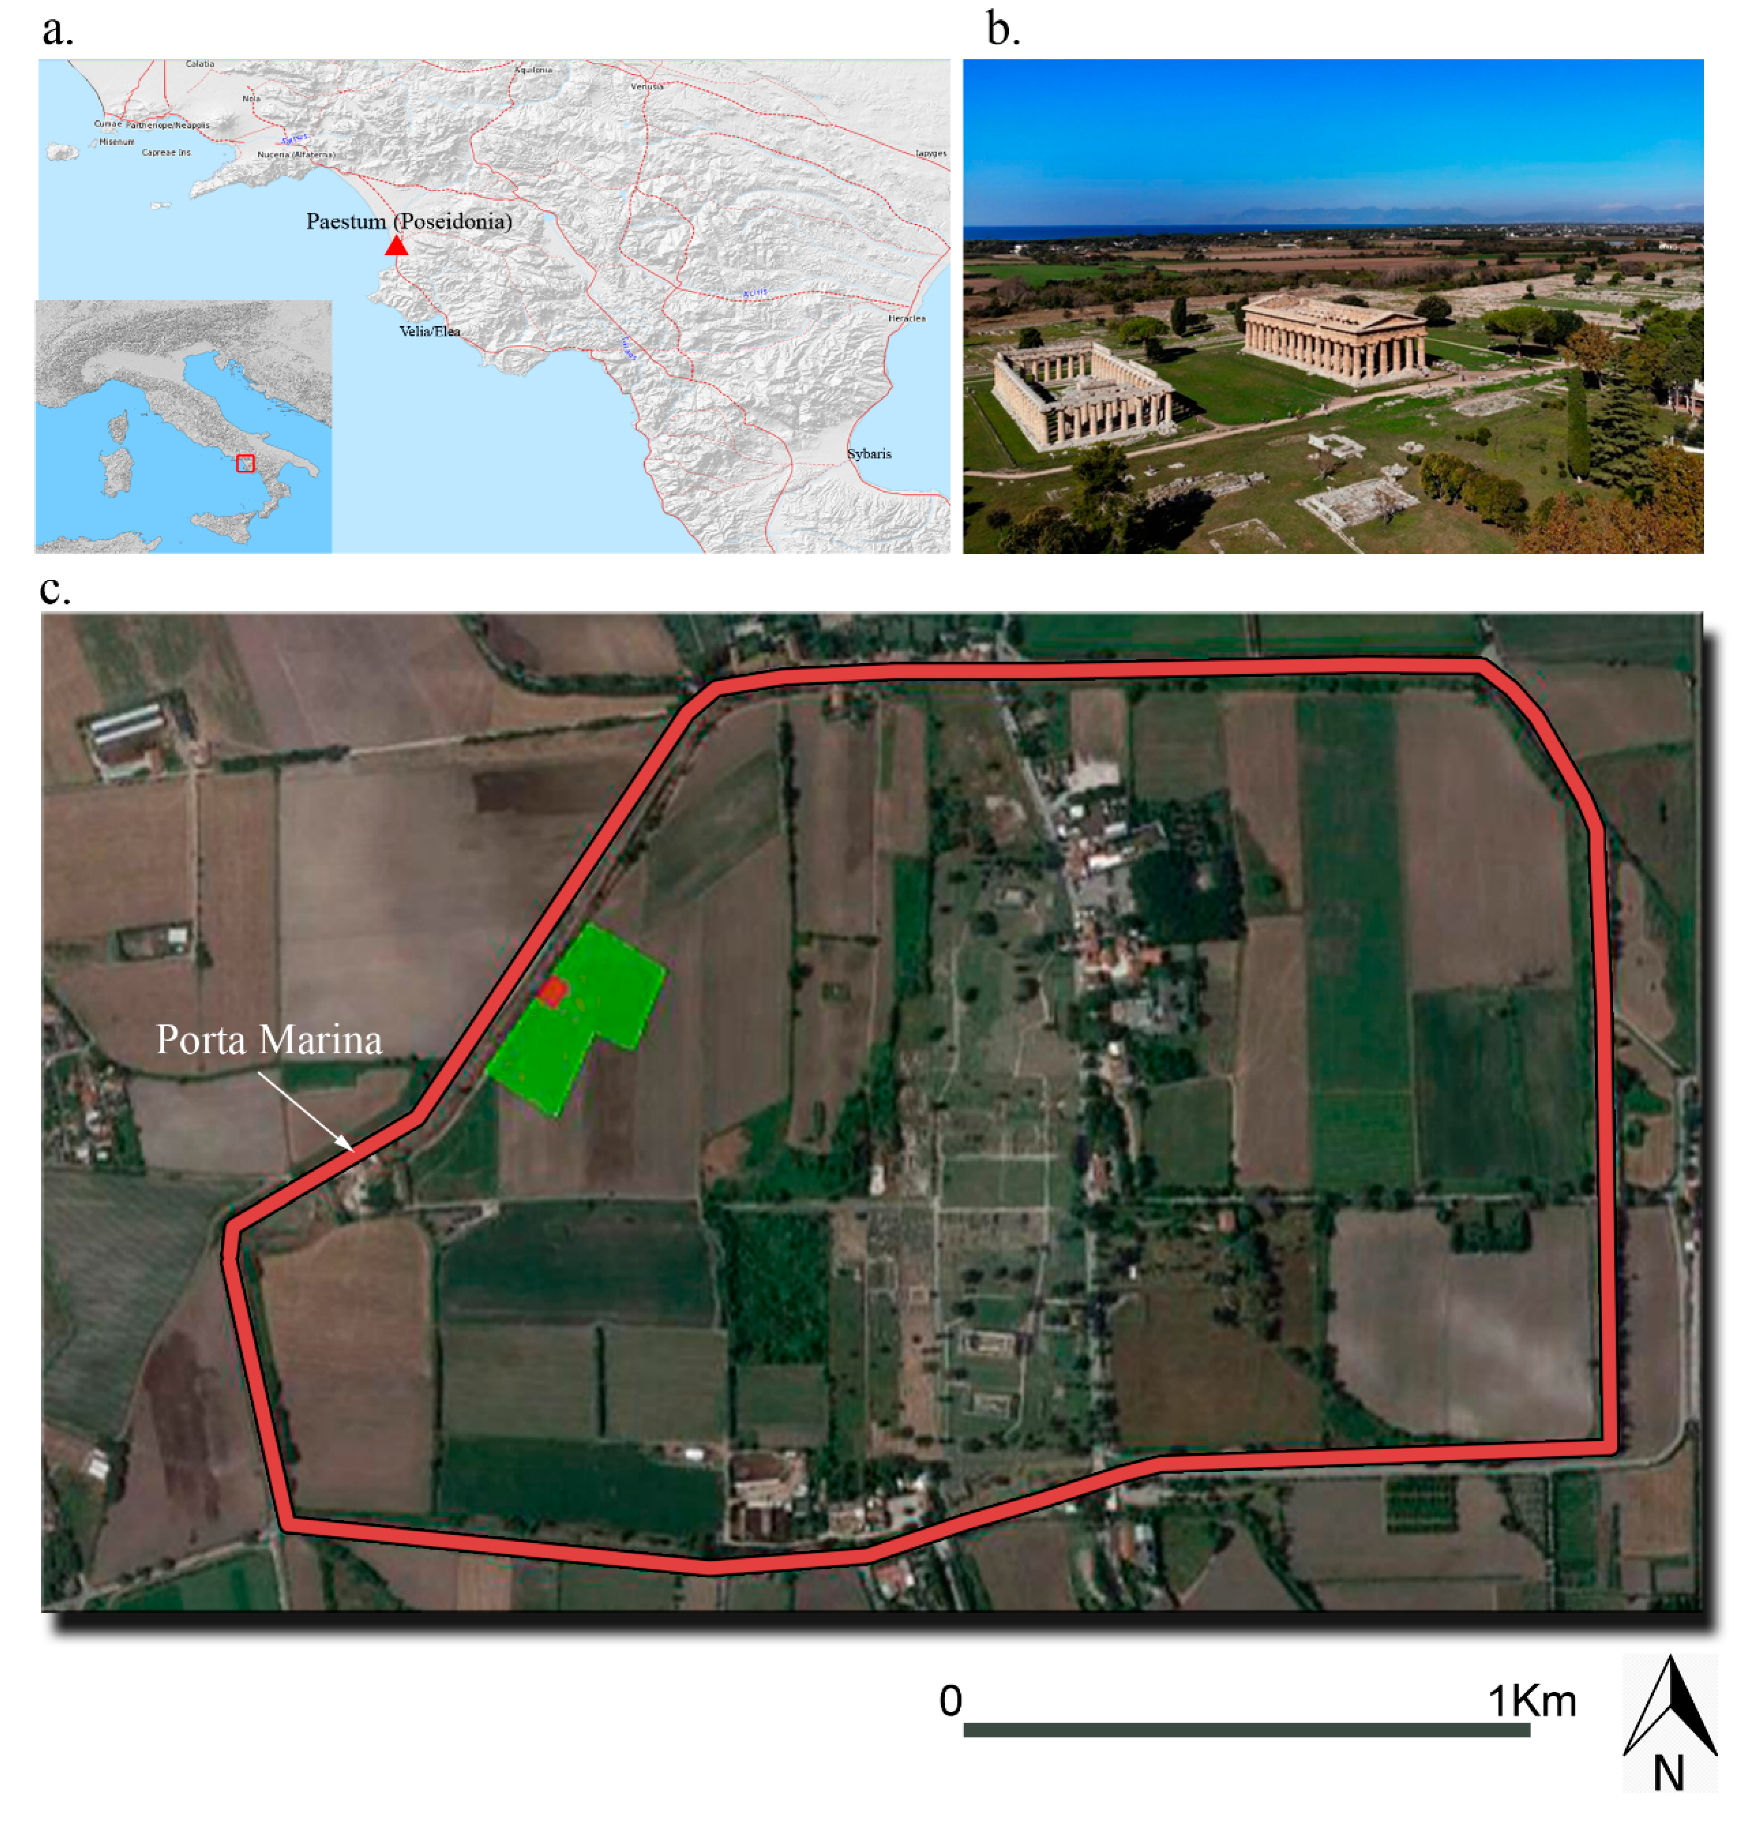
Paestum, originally called Poseidonia, represents one of the most important and major ancient Greek cities. The city is located on the Tyrrhenian Sea coast (
Figure 1a), in the Magna Graecia territory (Campania region, Southern Italy), and was founded in the VII century BC by Greek colonists coming from the near city of Sybaris. The favorable position along the Tyrrhenian coast and the presence of fertile soils bathed by rivers and streams allowed the rapid growth of the city, which became a fundamental crossroads for the Greek settlers, the Lucanian people and, finally, the Romans. The site is characterized by three monumental and well-preserved Greek temples dated between the V and VI century BC (
Figure 1b) and encircled by monumental city walls (
Figure 1c) [
17].
Since the eighteenth century, the attention of archaeologists and cultural visitors towards Paestum became significant but, only in the last century, there was a systematic planning of the excavations aimed at recovering the ancient architectural splendor of the city. In this context, most archaeological surveys were performed in the area placed in close proximity to the three monumental temples, where ancient structures were discovered [
18,
19].
Conversely, the outer parts, placed between the ceremonial area and the city walls have been scarcely investigated. These outer parts hold great potential for archaeological research but, at the same time, they are also devoted and affected by agricultural activities. Therefore, the archaeological remains buried in the shallower part of the subsoil may have been damaged. This motivates the strong necessity of geophysical non-invasive surveys aimed at detecting and locating the main buried structures for subsequent preservation.
It is also worth pointing out that the geological evolution of the area played and plays an important role in the conservation and preservation of the Paestum archaeological site. The site is located in the homonymous plain placed in the southern portion of the Sele river. The genesis of the plain was favored by the deposition of the travertine thanks to the near carbonate aquifer of the Monte Soprano. Three main travertine units are observable: two units, Gaudo and Paestum, near the recent shoreline and one, called Cafasso, at the East of the archaeological site. The ancient city was founded above the Paestum unit, which is composed of two depositional systems: the lower travertine units (LT-Upper Pleistocene—Early Holocene) and the upper one (UT—Late Holocene).
The presence of the travertine is a peculiar feature affecting the Paestum historical city’s evolution; on the one hand, it is possible that the travertine rock was used for building the city (LT travertines), on the other hand, it is possible that, thanks to the particular geological processes occurred in the area during the last two millennia, UT travertine has covered the ancient city by preserving the most important structures [
20].
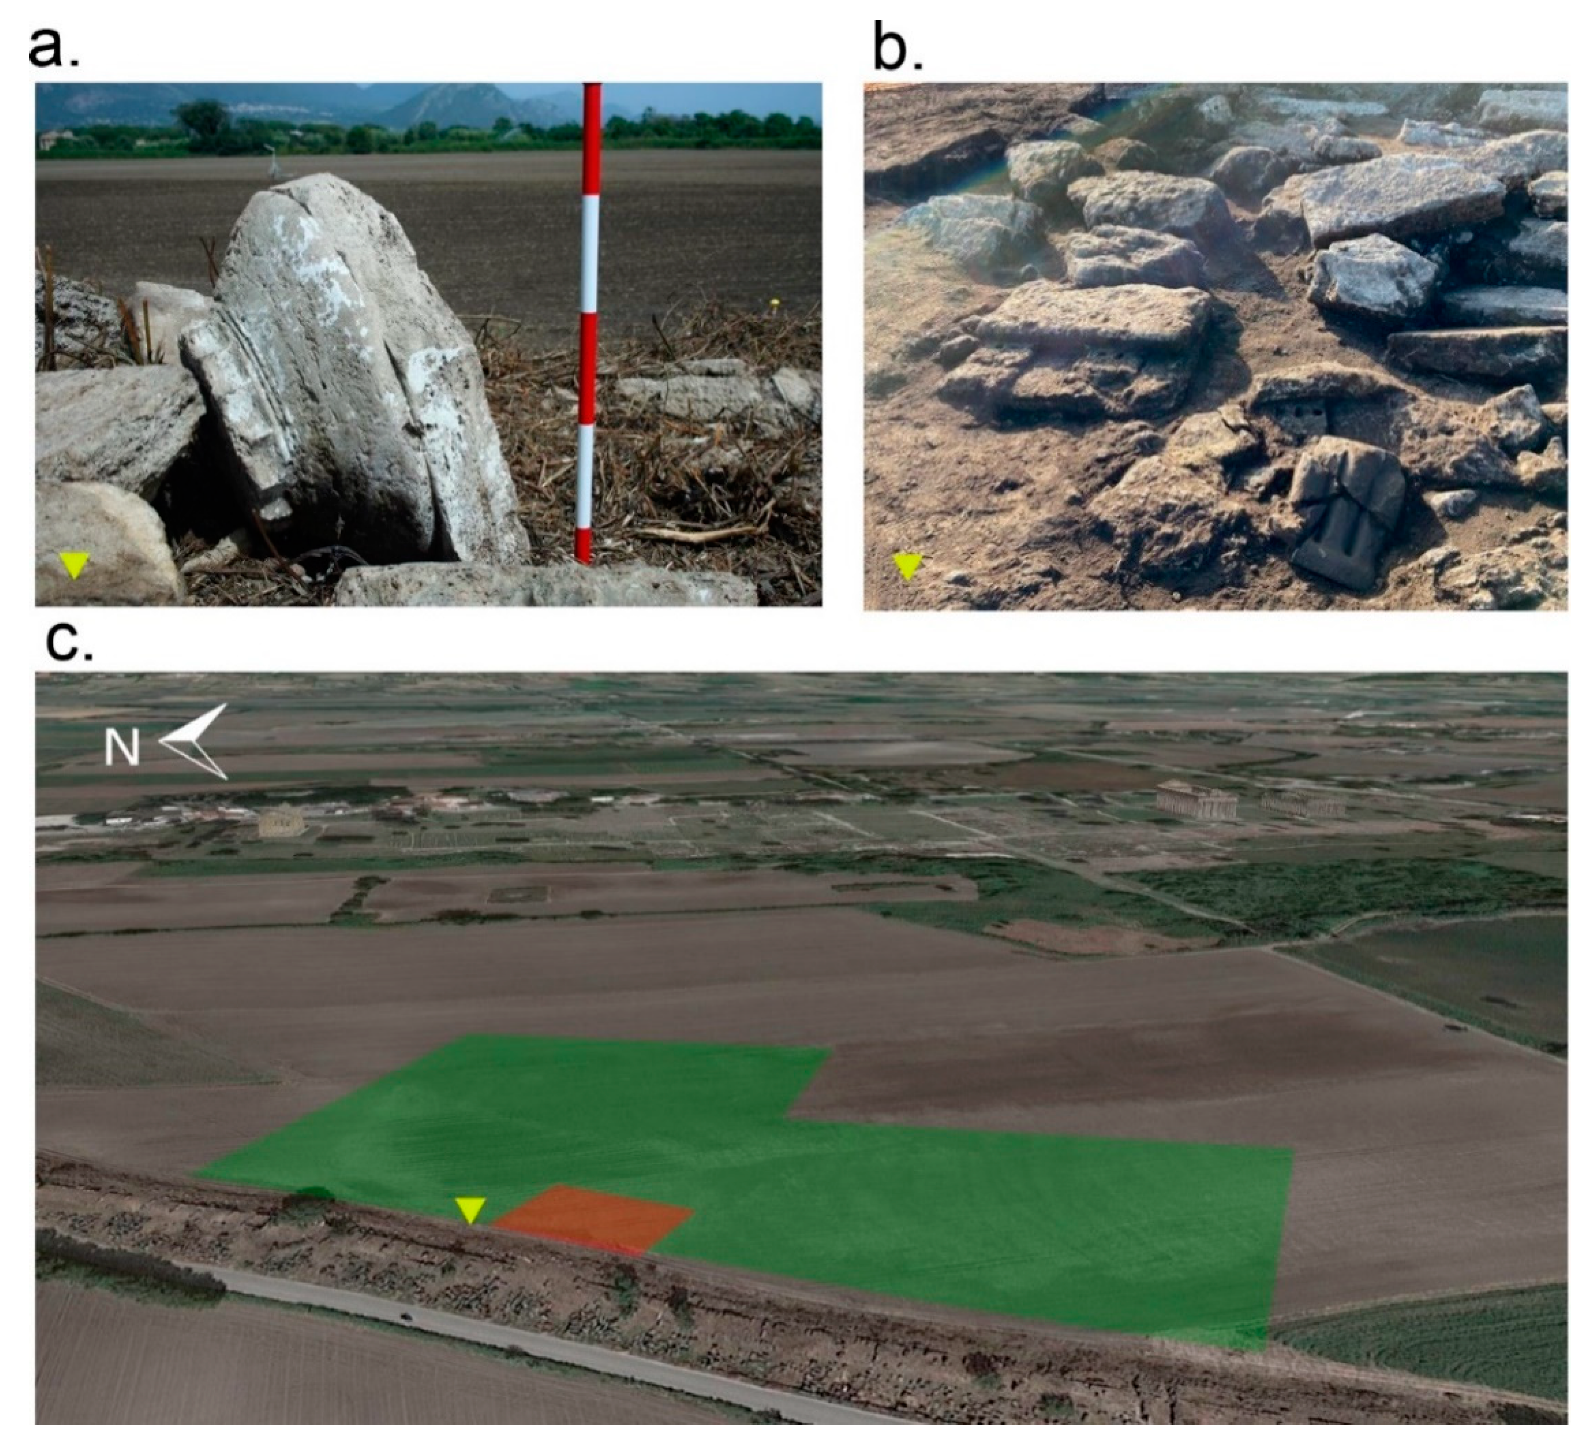
Last year, in June 2019, during restoration and redevelopment works performed at the Western City Walls, architectural elements were detected in an area usually devoted to agricultural activities. The visual surveys allowed the archaeologists to identify some exceptional findings highlighting the possible presence of a buried Doric temple of small size, which could represent an “unicum” in the archaeological history of the Magna Graecia [
21];
Figure 2a,b show two architectural elements of the supposed temple.
From this discovery, several crucial questions arose, such as: is there a temple and where is it? What are its shape and geometry? Due to the agricultural activities usually done in the area, what will the condition of the temple will be? Is the original shape of the buried temple preserved? These questions motivated the necessity of archaeogeophysical activities in the area where the archaeological findings were found (
Figure 2c).
3. Materials and Methods
In order to give an answer to the above questions, multi-sensor geophysical prospections were planned with the aims of confirming the presence of the buried temple, locating it and its remains in the surrounding area and providing a geometrical characterization of the detected objects.
The investigated site, characterized by a flat area with a gentle slope from East to West, is located close to the gate of Porta Marina, located to the West of the city (
Figure 1c). The presence of various fragments belonging to the ancient buried structures, irregularly accumulated near the walls, have not permitted the acquisitions on the north-west (NW) edge of the areas for both the geophysical methodologies. A multi-sensor archaeogeophysical approach based on the complementary use of the two methodologies of MAG and GPR was adopted. MAG acquisitions were performed immediately close to the city walls in an area approximately two hectares wide (see green area in
Figure 2c). More than 8000 gradiometric data were collected and geolocalized (with the support of a Global Position System (GPS)). MAG permitted the detection of several noticeable magnetic anomalies and for one of these “anomalies” a GPR investigation was carried out (red area in
Figure 2c). GPR allowed us to detect and characterize the shallow buried remains where the presence of the temple was expected. Herein, the results and the interpretation of the geophysical survey also benefited from enhanced GPR data processing, exploiting a microwave tomographic approach able to provide very detailed information about the extent and the geometry of buried structures [
22,
23,
24,
25].
3.1. Geomagnetic Data Acquisition and Processing
The G-858 MagMapper Magnetometer (Geometrics, San Jose, CA, USA), connected to an external Smart 1 Novatel GPS antenna, was used to investigate the area with a frequency of acquisition equal to 3 Hz and by collecting data on evenly spaced parallel lines with a spacing of about 1 m. The instrument was equipped with two separate magnetic sensors located at different heights from the surface, which permitted the execution of a gradiometric survey. The data processing aimed at enhancing the archaeo–magnetic signals, which are usually weak compared to the background, and was performed by means of procedures devoted to correct and filter the raw data in order to remove the magnetic noise caused by several factors (metal objects, operator procedure, intrinsic effects, etc.).
MAG data processing started with the removal of the outliers due to incorrect GPS positioning caused by natural radio signals or scattering of the GPS signals. Afterwards, the data were managed to improve the interpretability of the geomagnetic map. Terrasurveyor software [
26] was used for data processing and includes the following steps:
High/Low pass filter—It uses either a uniformly or Gaussian weighted filtering window to remove high or low frequency spatial components in a survey.
Despike—It consists of scannig the data by using a uniform weighted window and looking for datapoints that exceed the mean of the window by a specified threshold amount.
Dedrift—It compensates for data collection errors caused by drift or sudden changes in an instrument’s zero position.
Destripe—It determines the median of each grid or traverse and then subtracts that value from each datapoint in the current layer; this step is used to remove the striping effect caused by directional effects, operator clothes and instrument setup.
3.2. GPR Data Acquisition and Processing
GPR data were collected with the TH DUAL-F HI-Mod system (IDS-Ingegneria dei Sistemi S.p.A, Pisa, Italy), equipped with a multi-frequency antenna able to operate at 200 MHz and 600 MHz.
Data were gathered along two perpendicular directions (NW–SE and NE–SW) over a regular grid covering an area of 30 m × 20 m (area highlighted in red in
Figure 2c) by considering the radargrams spaced 0.50 m from each other. The measurement step along each trace was equal to 0.0352 m and 0.0176 m for the 200 MHz and 600 MHz antennas, respectively.
GPR data were processed by means of a dedicated data processing strategy (see
Figure 3) that exploits the advantages of microwave tomography [
16,
22,
23,
24]. Specifically, the strategy consists of two key phases: (i) pre-processing; (ii) data inversion. The pre-processing is a sequence of standard time-domain (TD) procedures, which aim at extracting the useful signals from raw data by removing direct antenna coupling, reducing noise and emphasizing the targets’ reflections. These procedures consist of the following operations:
Zero timing—performed to define properly the starting time of the radargram.
Time gating—selects the trace part over the time window ( to eliminate the direct antenna coupling and filter the noise.
DeWOW procedure—for each collected waveform, the mean value along the time axis is subtracted.
Linear Gain—is applied to compensate the signal attenuation due to the geometrical spreading and the electromagnetic losses into the probed medium.
GPR data inversion was performed by means of the microwave tomography approach that exploits an approximate model of the electromagnetic scattering and is able to achieve well-focused images of the area under investigation. The data inversion is performed in the frequency domain and formulates the imaging as a linear inverse scattering problem based on the Born approximation, which is used to define the mathematical model for describing the interactions between microwaves and electromagnetic anomalies of the investigated scenario [
16,
22,
23,
24].
Specifically, the inversion is carried on for the single profile (2D scan) by assuming a background scenario made of a homogeneous, non-dispersive and non-magnetic soil characterized by a constant relative dielectric permittivity
. The transmitting and receiving GPR antennas are located at the air–soil interface and are modelled as a filamentary electric currents directed along the invariance axis (orthogonal to the plane defined by the horizontal direction and the depth). The antennas collect scattered field data along the measurement line in the angular frequency band
under a multi-monostatic/multi-frequency configuration. Let D be the probed domain, i.e., the spatial region where the targets to be imaged are located,
the generic point in D, and
the contrast function accounting for the electromagnetic anomalies (associated to the searched for objects) with respect to the background scenario. Under these assumptions, the scattering phenomenon is described, at each angular frequency
, by the scalar linear integral equation [
22,
23,
24,
25]:
where
is the propagation constant in the soil,
is the incident field at the point
radiated by a source at
,
is the Green’s function in a homogeneous medium, which is the field radiated at the measurement point
by an elementary electric line source located at
. Moreover,
L denotes the (linear) scattering operator, whose kernel is the product of the Green’s function, G, and the incident field,
.
The linear inverse problem defined by Equation (1) is ill-posed and thus a regularization strategy has to be adopted to obtain a physically meaningful solution [
24]. To achieve this goal, the Truncated Singular Value Decomposition (TSVD) scheme is applied
In Equation (2), the symbol is the scalar product in the data space, is the singular spectrum of the operator , where the singular values are sorted in descending order, and are orthonormal basis functions for the data and unknown spaces, respectively. is the regularization parameter fixed in such a way to find a trade-off between the accuracy and stability of the solution. The modulus of the regularized contrast function is a spatial map referred as the tomographic image. The areas characterized by not negligible values of account for the location and geometry of buried objects.
Finally, in order to obtain a pseudo 3D representation of the investigated area, the 2D tomographic images, each one referring to a specific GPR profile, are merged and the results are presented as constant-depth slices.
4. Results
4.1. Magnetometric Results
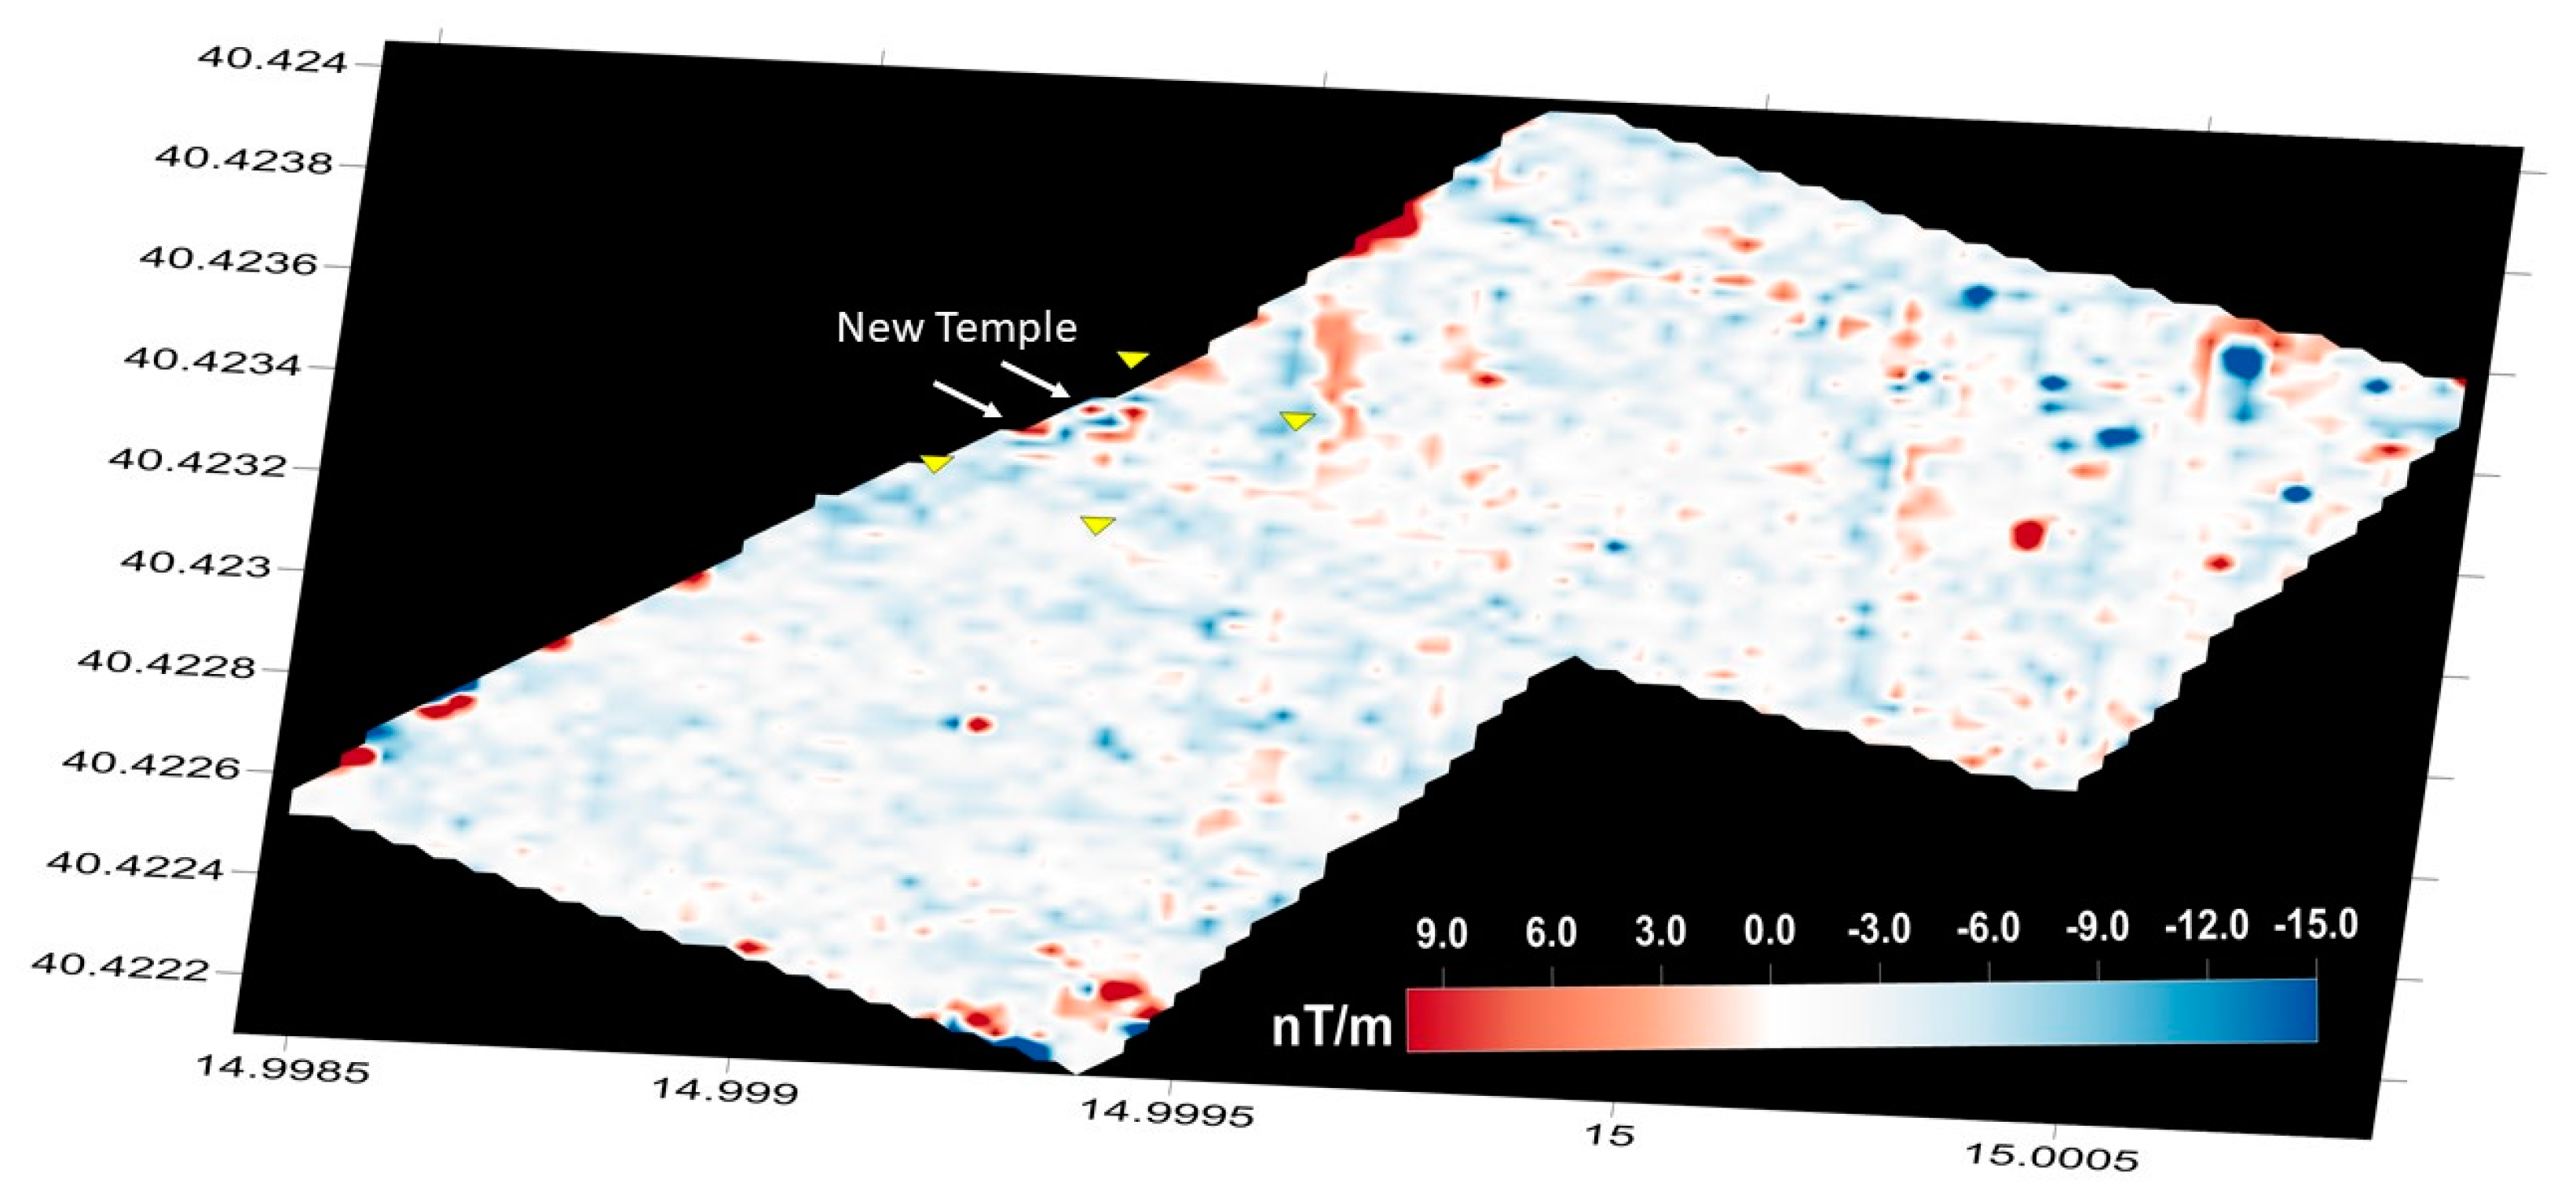
The measured geomagnetic anomalies ranged between 10 nT/m and −18 nT/m (
Figure 4). These low gradiometric values are justified by the low-magnetic values imputable to the induced magnetization phenomena of the travertine stones used to build the ancient structures. The travertine rock is a sedimentary deposit composed of inorganic carbonate deposition, which forms whenever the partial pressure of CO
2 is reduced in water draining hinterland including limestone and dolomites. The travertine is almost non-magnetic rock, but the presence of large blocks (i.e., columns) or aligned structures (i.e., walls), located into a homogeneous background soil, produces a variation of the local magnetic field permitting the detection of the observed anomalies.
Although a weak variation of the local magnetic field was measured, several interesting anomalies were detected and few of them could be associated with the presence of buried archaeological remains. In detail, two main kinds of anomalies were identified. The first ones were located on the North-West (NW) of the map, where two concentric rectangular shapes were well highlighted in an area of about 600 m
2. These anomalies could be associated with the presence of the temple. The second group of geomagnetic anomalies had a linear geometry with two main directions: East–West and North–South (NS). The linear anomalies have no spatial continuity, but the main patterns were well identified on the geomagnetic map (
Figure 4).
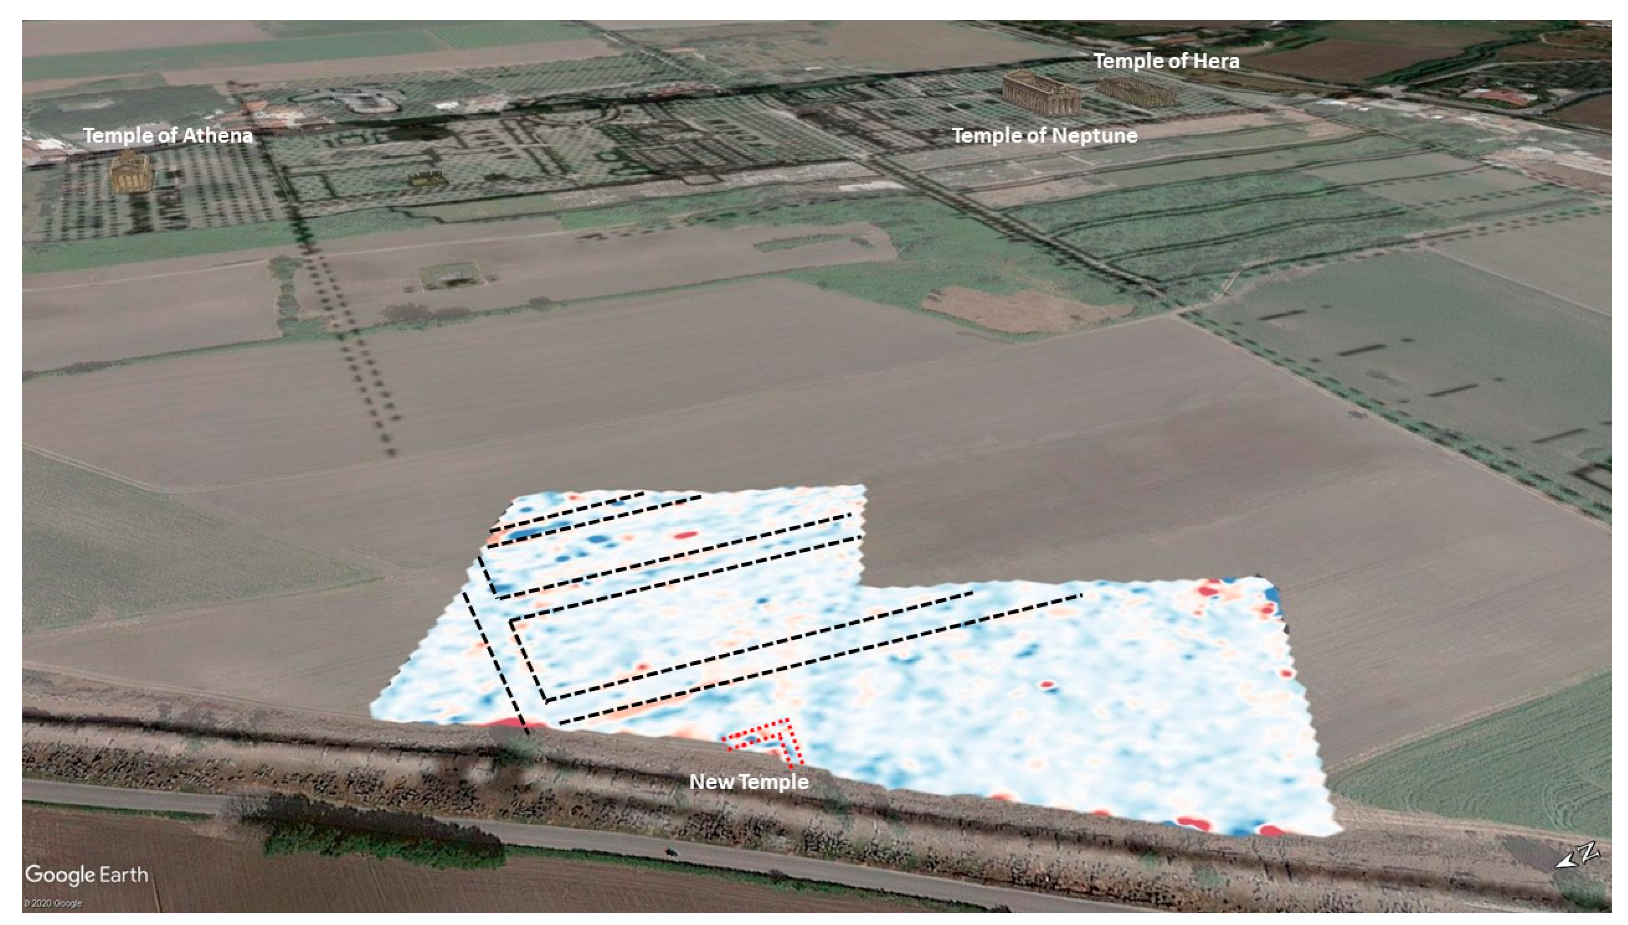
Figure 5 shows geomagnetic map geolocalized on the satellite image of Paestum. The resulting image points out the correspondence of the linear geomagnetic anomalies with the hypothesis about the streets of the ancient city, which were built according to the Greek regular urbanistic plan composed of streets oriented in the NS direction (
stenopoi) and streets oriented in the East–West (EW) direction (
plateiai) [
18]. Moreover, the discontinuity of the linear geomagnetic anomalies could be associated with the intense agricultural activities [
27] that have led to the removal/destruction of buried structures during the ploughing phases of the fields.
4.2. GPR Results
This subsection deals with the processing of the raw GPR data performed according to the procedure described in
Section 3.2. The parameters chosen for time domain pre-processing and data inversion are summarized in
Table 1. The average relative permittivity
(
) was estimated for the surveyed medium by using the hyperbola fitting method [
14]. This value agrees with the one used in [
28]. Moreover, the effective frequency band of the data has been estimated by means of spectral analysis [
16] and discretized into
frequency samples with step
. The regularization parameter
was fixed in such a way as to neglect singular values lower than 25 dB with respect to the maximum one.
Figure 6 displays representative radargrams recorded at 200 MHz and 600 MHz along three profiles oriented along the NW–SE direction. As expected, both frequencies reveal the presence of buried reflectors; in addition, the 600 MHz data are slightly better defined in terms of resolution due to the smaller probing wavelength. On the contrary, the investigation depth achieved by the 200 MHz antenna was approximately 2.30 m and higher than the 1.10 m depth achieved with 600 MHz antenna.
Radargrams shown in
Figure 6 highlight the presence of several reflective zones:
- -
the reflections marked by labels a1 and a2 were associated with the presence of the temple foundations; these reflections occupied the west portion of the area and their depth ranged between 0.45 m and about 2 m;
- -
at the North-East (NE) portion of the area, a second group of reflections was present at 1 m depth (label b in
Figure 6a); these reflections could be associated to an altar;
- -
at the South-East (SE) portion of the area, another group of reflections appeared at 1.5 m depth (label c in
Figure 6c) which could correspond to an ancient floor or path;
- -
a reflective sub-horizontal layer was placed at a depth ranging between 1.2 m and 1.50 m (label d in
Figure 6a–c) which could be associated to the bed-rock layer (local travertine) where the temple foundations are placed.
As discussed in [
29], it is possible to affirm that the integration of GPR and magnetometry is symbiotic, as the results of one technique can readily inform interpretations made with the other, and vice versa. The GPR radargrams define the 2D image of the reflections created by the buried structure (geological or human-produced materials), while the MAG method measures changes in the earth’s magnetic field due to the magnetic proprieties of buried objects [
29].
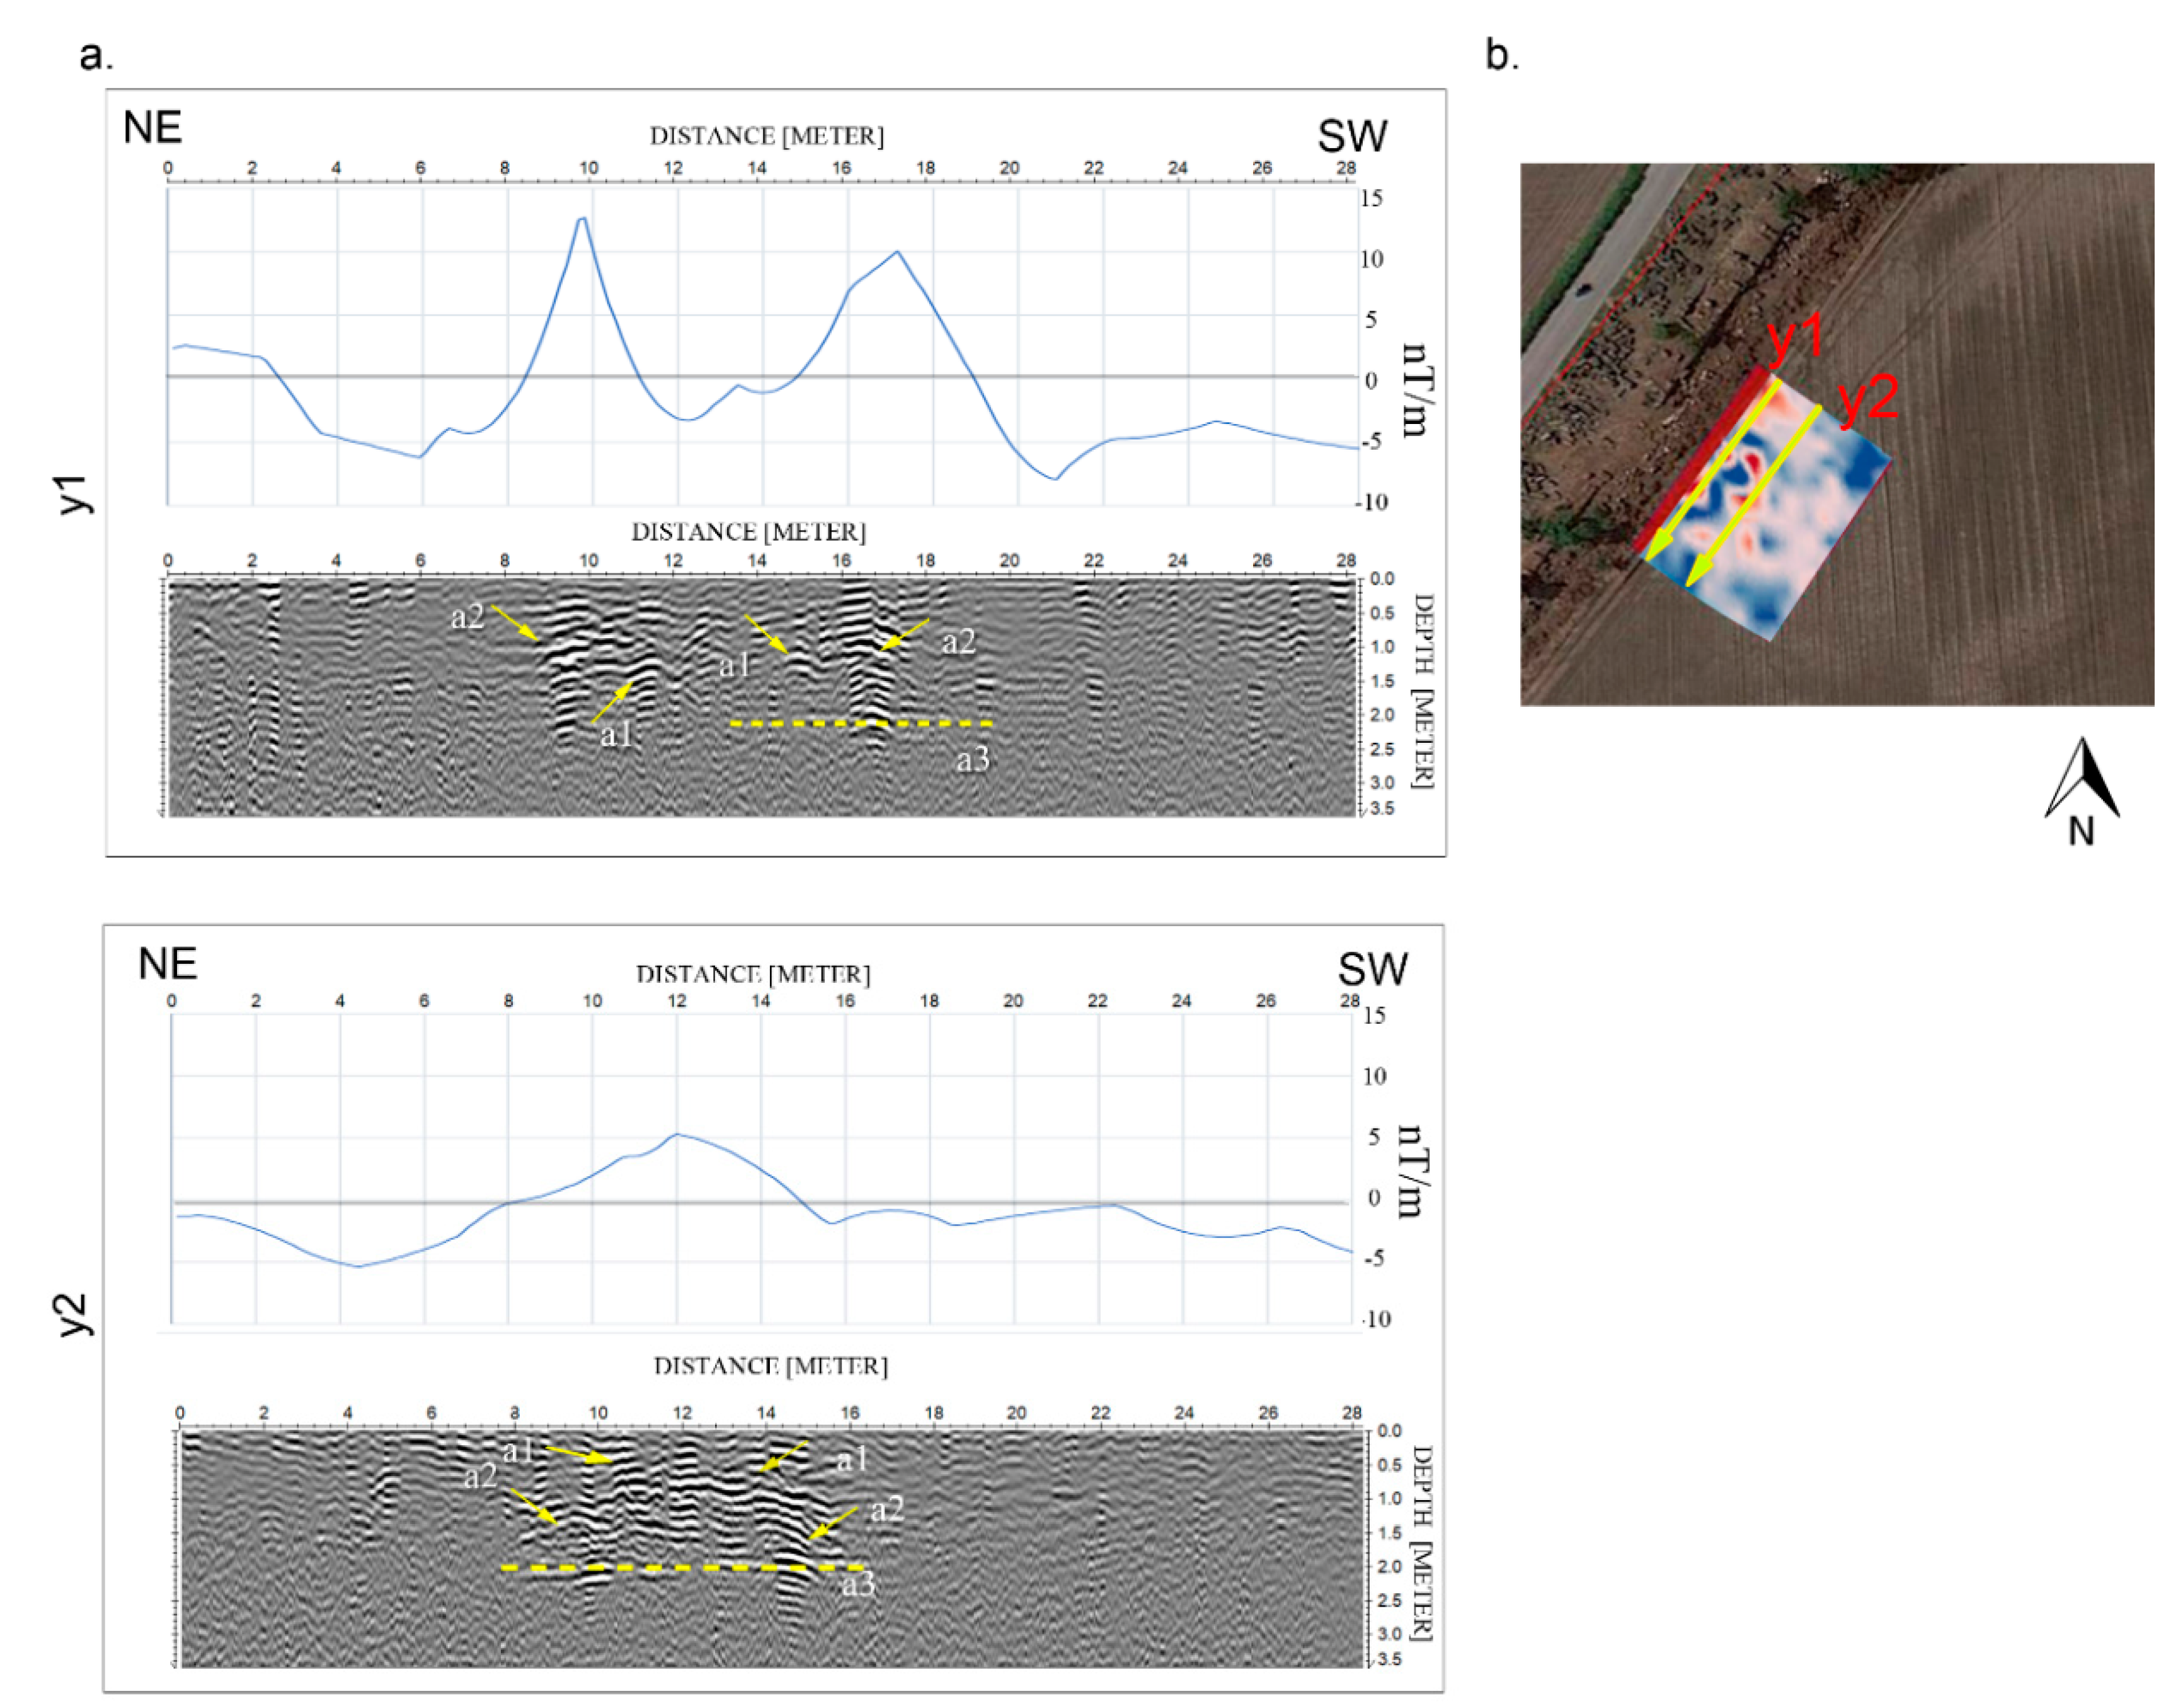
Figure 7 displays the GPR radargrams acquired along the NE–SW direction (perpendicular to previous ones shown in
Figure 6) and the gradiometric readings along the same profiles. The perpendicular GPR radargrams highlighted the main features defined in
Figure 6. In detail, the two examples detected the two main reflections a1 and a2, associated with temple foundations, and a new one (a3) correlated to their support plan. The latest reflection was not visible on the previous radargrams in
Figure 6. The two positive magnetic anomalies along the profile y1 (
Figure 7a, upper panel) had the same position of the high amplitude reflections (a1 and a2) detected by the GPR. Therefore, the two small magnetic anomalies are well associated with the temple foundations.
Moreover, the MAG profile y2 shows only one large positive magnetic anomaly, associated to foundations in the eastern corner of the temple, where the structures are very close and the GPR detected a large reflection zone (
Figure 7a bottom panel).
Figure 8 and
Figure 9 show the constant depth slices extracted by the 3D microwave tomographic reconstruction related to the 200 MHz and 600 MHz data gathered along NW–SE oriented profiles, respectively. As can be seen, it is possible to follow the spatial continuity of the buried structures thus obtaining a very effective geometrical characterization. The images point out the presence of two concentric rectangles corresponding to the group of reflections denoted by labels a1 and a2 in
Figure 6a. The outer rectangle has extent 6 m × 8 m, while the inner one has extent 4 m × 6 m. The observed reflections highlight the top of the structure, which is located at a depth of about 0.45–0.65 m (see
Figure 8a,b).
Two additional interesting areas were detected in
Figure 8. The first one is highlighted on the NE part of the investigated area (see label b in
Figure 8c,d) and could be associated to the presence of a votive altar, similar to those characterizing the other temples of the archaeological park. Furthermore, the reflections marked by label c in
Figure 8e located at a depth of 1.62 m could be associated to an ancient floor or path. Moreover, at depth 2.12 m (see
Figure 8f), it is possible to observe only the reflections of the outer rectangle (label a2), which could be associated to the foundations of the temple.
The depth slices reported in
Figure 9 refer to the tomographic reconstruction achieved by processing 600 MHz data. As can be observed, these images confirm the geometry of the temple as well as the depth of its upper part (0.45–0.65 m). Of course, due to the stronger signal attenuation, it is not possible to retrieve information at depths greater than 1.10 m. This outcome is easily understood by comparing the anomalies present in the images at the same depths in
Figure 8 and
Figure 9.
Finally, in order to show the benefits and improvements provided by the microwave tomography,
Figure 10 shows the qualitative comparison between the time-domain filtered radargram (left panels) and the tomographic image (right panels) at 200 MHz over the depths slices at 0.65 m and 1.5 m and 2.12 m. It is interesting to notice that the depth slices extracted from the filtered radargram provide evidence of the temple, but the structure appears discontinuous and its geometry is better represented by the tomographic images. Moreover, the anomaly previously attributed to the votive altar (label b) is much less detectable in
Figure 10c compared to
Figure 10d.
It is worth pointing out that similar results were achieved by processing GPR data collected along the NE–SW direction and these are not shown for brevity.
5. Discussion and Conclusions
Compared to the contextualization of the elements found along the western city walls, the geophysical multi-sensor prospection led to very important results. Indeed, it was possible to identify an anomaly that most likely corresponds to the foundations of the temple still in place. At this point, only a stratigraphic excavation, currently in preparation, will be able to complete the analysis and confirm the results of the geophysical survey.
However, a few hypotheses have been formulated just at this stage. Located near the walls—which at that time did not yet have the shape visible today—the temple can be thought to be part of a “crown” of sacred places that surrounded the urban space since the first phase of the colony [
17,
18]. By complementing the geophysical prospections with the planned excavations, a better picture will be achieved of not only this place of worship but also of the ritual and urban dynamics that determined the sacred topography of the city.
Furthermore, GPR images support the hypothesis of a peripteral temple, i.e., a temple surrounded by a portico with columns, with an inner chamber, called a naos (or cella). Moreover, the images can hardly be interpreted in a different way, since the central rectangle of 4 m × 6 m can be clearly distinguished from the external stylobate of 6 m × 8 m. This hypothesis is also consistent with the dimension of the structural elements already recovered close to the fortification walls. In addition, the estimated dimensions lead to the presence of a mini-peripteral temple, which would represent a unique “feature” in Greek sacred art. Indeed, as far as we know, in the whole Greek world of the fifth and sixth centuries BC, the only similar structure is an altar in Selinunte (an important site of the Magna Graecia placed in Sicily), datable around the middle of the fifth century B.C.
The great novelty of the detected structure is represented by the limited dimensions of the temple, hardly comparable with other structures of fifth and sixth centuries B.C. The small temple represents the first evidence of the entrance of a new “classic” Doric style at Paestum. Indeed, the detected structure, in addition to having a cultural function (perhaps it was a sanctuary), seems a “model” to show to the client this new architectural style, used after in the construction of the Temple of Neptune. The latter one is not only the largest and best-preserved temple in Paestum but also represents the classic variation of Greek temple architecture. It is worth noting also that the orientation of the buried temple agrees with the one of the three temples in the monumental area.
From the technological point of view, we can stress how the smart combined use of different methodologies allows a multiscale geophysical approach, which has permitted the attainment of the important discussed results by keeping limited the survey time. Therefore, the presented work is a good example of the importance of adopting an archaeogeophysical “step by step approach” based on the complementary use of geophysical methods and the subsequent steps regarding the archaeological implications of the geophysical surveys (
Figure 11). Specifically, by comparing the results of MAG (
Figure 11a) with the GPR results (the depth slices shown in
Figure 11b) the optimal agreement between the two methodologies for the detection of the temple is evident. Indeed, impressively, both sets of results confirm the presence of the two concentric structures of the temple placed on the western edge of the investigated area.
Finally, the discovery shows the opportunity to enable cohesion and synergy around the archaeological heritage, by demonstrating in this way that protection, research and enhancement are part of a single circle, a “circular” archaeology, focused to a holistic context that connects the issues of knowledge and accessible and inclusive use. This concept is consistent with the need to design systematic approaches, where cultural heritage management, protection and fruition aspects should be seen under a unified context.

 ,
, 


