Article

Mapping 10-m Resolution Rural Settlements Using Multi-Source Remote Sensing Datasets with the Google Earth Engine Platform

School of Geography, Geomatics and Planning, Jiangsu Normal University, Xuzhou 221116, China
*
Author to whom correspondence should be addressed.
Remote Sens. 2020, 12(17), 2832; https://0-doi-org.brum.beds.ac.uk/10.3390/rs12172832
Submission received: 25 July 2020 / Revised: 28 August 2020 / Accepted: 30 August 2020 / Published: 1 September 2020

Abstract

:
Timely and accurate information on rural settlements is essential for rural development planning. Remote sensing has become an important means for accurately mapping large scale rural settlements. Nevertheless, numerous difficulties remain in accurate and efficient rural settlement extraction. In this study, by combining multi-dimensional features derived from Sentinel-1/2 images, Visible Infrared Imaging Radiometer Suite supporting a Day-Night Band (VIIRS-DNB) dataset, and Digital Elevation Model (DEM) data using the Google Earth Engine (GEE) platform, we proposed an efficient framework with good transferability for mapping rural settlements in the Yangtze River Delta. To avoid the time-consuming selection of a large number of training samples in the whole study area, we employed four random forest models obtained from the training samples in respective training municipal districts in four different regions to classify other municipal districts in their corresponding region. We found that different features play diverse vital roles in the extraction of rural settlements in various regions. Compared to results only using optical data, accuracies obtained by the proposed method were significantly improved. The average user’s accuracy, producer’s accuracy, overall accuracy, and Kappa coefficient increased by 16.75%, 17.75%, 11.50%, and 14.50% in the four training municipal administrative areas, respectively. The overall accuracy and Kappa coefficient were 96% and 0.84, respectively. By contrast, our classification results are superior to other public datasets. The final mapping results provided a detailed spatial distribution of the rural settlements in the Yangtze River Delta and revealed that the total area of rural settlements is approximately 32,121.1 km2, accounting for 17.41% of the total area. The high-density rural settlements are mainly distributed in the Northern Plain and East Coast, while the low-density rural settlements are located in the Central Hills and Southern Mountain.

Graphical Abstract

1. Introduction

Rural settlements—that is, settlement areas for rural residents to produce and live in—are closely related to population distribution and economic growth in rural areas [1]. In China, the country with the largest population in the world, rural areas are home to about 600 million people, 40 percent of the country’s total population. The disorderly spread of rural settlements occupy a large amount of arable land in China [2,3].
Due to China’s rapid industrialization and continuous socioeconomic progress, the spatial distribution of rural settlements has undergone significant transformation, leading to negative effects [4,5]. Factors including rural residents entering cities for work, the construction of various types of rural infrastructure, and the evolution of rural industrial structure have collectively led to the large-scale expansion of rural settlements [6], resulting in problems such as “hollow villages” and “unbalanced development of the human-land relationship” in rural settlements in many areas of China [7]. Meanwhile, the current urban-centered development strategy in China has overlooked rural development, leaving rural settlements in a disorderly state of development for a long period [8]. Due to their large number and scattered distribution, rural settlements have substantially impacted cultivated land resources and the environment [5]. Therefore, a comprehensive understanding of the spatial distribution and structural scale of rural settlements is required for both scientific management and sustainable development to ensure reasonable development and utilization of rural land resources in China.
Remote sensing, with fast and large-scale information acquisition capabilities, has become an important means of exploring land resource information. It could be highly convenient for determining the spatial distribution of rural settlements. An increasing number of studies have been carried out to extract human settlements, including urban and rural settlements or artificial surfaces, from remote sensing data, particularly in urban built-up areas. However, less attention has been paid to rural settlements. To date, the methods of human settlement extraction from satellite images can be divided into two categories. The first uses spectral indices and traditional supervised classification methods based on medium spatial resolution remote sensing data. For example, Wu et al. [9] and Chen et al. [10] constructed a ratio resident-area index (RRI) and a new built-up index (NBI) to extract settlement information. Zhong et al. [11] extracted urban built-up areas with a multiple conditional random fields ensemble model based on remote sensing optical images. Tao et al. [12] extracted urban built-up areas using the support vector machine classifier. Hoffman-Hall et al. [13] extracted remote rural settlements by incorporating regionally specific characteristics with moderate resolution remotely sensed data using the random forest algorithm. Li et al. [14] extracted rural settlements with the maximum likelihood classifier based on Polarimetric SAR (POLSAR) polarization scattering characteristics and an optical normalized difference index. Li et al. [15] designed an “exclusion-inclusion” framework based on the different characteristics of human settlements from Landsat images, which is suitable for extracting large-scale human settlements. Gong et al. [16] mapped the changes in urban settlements and rural settlements in China over a period of 40 years based on Landsat imagery and nighttime light data. The second category of methods is unsupervised learning approaches, including object-oriented methods and associative rule learning based on medium-high spatial resolution remote sensing data. For example, Conrad et al. [17] extracted rural settlements in northwestern Uzbekistan based on SPOT-5 data using an object-oriented method. Wang et al. [18] extracted rural settlements from high spatial resolution remote sensing images with an edge-suppressed points voting method. Fu et al. [19] proposed a settlement extraction algorithm based on multi-level features, which has improved extraction accuracy and efficiency.
Although some of these methods have been proven to be suitable for large-area mapping of human settlements from satellite imagery, many numerous difficulties remain in the accurate and efficient extraction of rural settlements. First, most of the current settlement extraction algorithms aim at human settlements, and few are focused only on rural settlements. Second, the rural settlement is a peculiar type of land use that comprises diverse land cover, including not only houses but also vacant spaces, roads, water bodies, and vegetation between houses [20,21]. In remotely sensed data, especially in coarse spatial resolution images, spectral signatures of rural settlements are easily confused with those of bare land or land with low vegetation coverage [22]. Although high-resolution remote sensing images can effectively solve this problem, the acquisition of these images has a high cost and short coverage time, which is not suitable for large-scale, long-term remote sensing monitoring [23]. Third, the vast territory in China leads to differences in nature, climate, and economic development levels in various regions, resulting in rural settlements showing obvious regional characteristics in scale, shape, and spatial distribution [24,25]. Rural settlements with different spatial distributions will also show different characteristics in remote sensing images, making it difficult to develop a uniform model that performs well in different regions. Furthermore, the collection of a large number of training samples, which is required to train a uniform model, is a formidable task at a large spatial scale [26,27]. It thus remains a challenge to map human settlements over large areas. Therefore, it is necessary to explore a method to do so with acceptable efficiency and accuracy, in addition to greater applicability.
Recently, with the increasing amount of open access remote sensing data, the use of multi-source remote sensing data for information extraction has attracted more attention. The incorporation of multi-source remote sensing imagery has been demonstrated to improve the accuracy of impervious surface mapping [28]. Although the use of multi-dimensional remote sensing information can effectively improve the accuracy of extraction, the huge amount of data often exceeds the local processing power [29]. With the help of the Google Earth Engine (GEE) platform, planetary-scale analysis has become available [30]. Using the GEE cloud platform, Gong et al. [31] produced a global impervious surface map from 1985 to 2018 with an average overall accuracy higher than 90% based on multi-source and multi-temporal remote sensing data; Pesaresi et al. [32] extracted global human settlements based on multi-scale textures and morphological features; Li et al. [33] mapped the land cover of the African continent at 10 m resolution based on multi-source remote sensing data; Xiong et al. [34] produced a 30 m cultivated land map in Africa with an overall accuracy of 94% based on multi-source remote sensing data; and Duan et al. [35] constructed a decision tree model to extract Chinese coastal aquaculture ponds based on spectral features, spatial structure, and topographic information of image objects. Therefore, GEE is an efficient and useful computation platform for global/regional applications based on multi-source data.
Although the GEE platform provides pre-processed Landsat, Moderate Resolution Imaging Spectroradiometer (MODIS), and Sentinel series, and other commonly used remote sensing data products, in addition to thousands of environmental, geophysical, and socioeconomic datasets, an efficient method that can fully integrate these multi-source data to produce an accurate rural settlement map at a high spatial resolution for a large area is still lacking. Herein, we propose a framework for rural settlement mapping from multi-source data in the Yangtze River Delta, China, using GEE. The present study makes three main contributions: (1) The proposed framework was able to produce a 10 m rural settlement map from multi-source remote sensing datasets including Sentinel-1 Synthetic Aperture Radar (SAR), Sentinel-2 MultiSpectral Instrument (MSI), Visible Infrared Imaging Radiometer Suite supporting a Day-Night Band (VIIRS-DNB), and Shuttle Radar Topography Mission-Digital Elevation Model (SRTM-DEM) imagery using the GEE platform; (2) we investigated the importance of various features by gradually introducing different data based on the random forest classifier, showing that the best input configurations were determined when all features were input; (3) we made full use of the transferability of the trained models to obtain the distribution of rural settlements and tested the effectiveness of transferability, which could save substantial time and labor to create a large number of training samples.

2. Study Area and Datasets
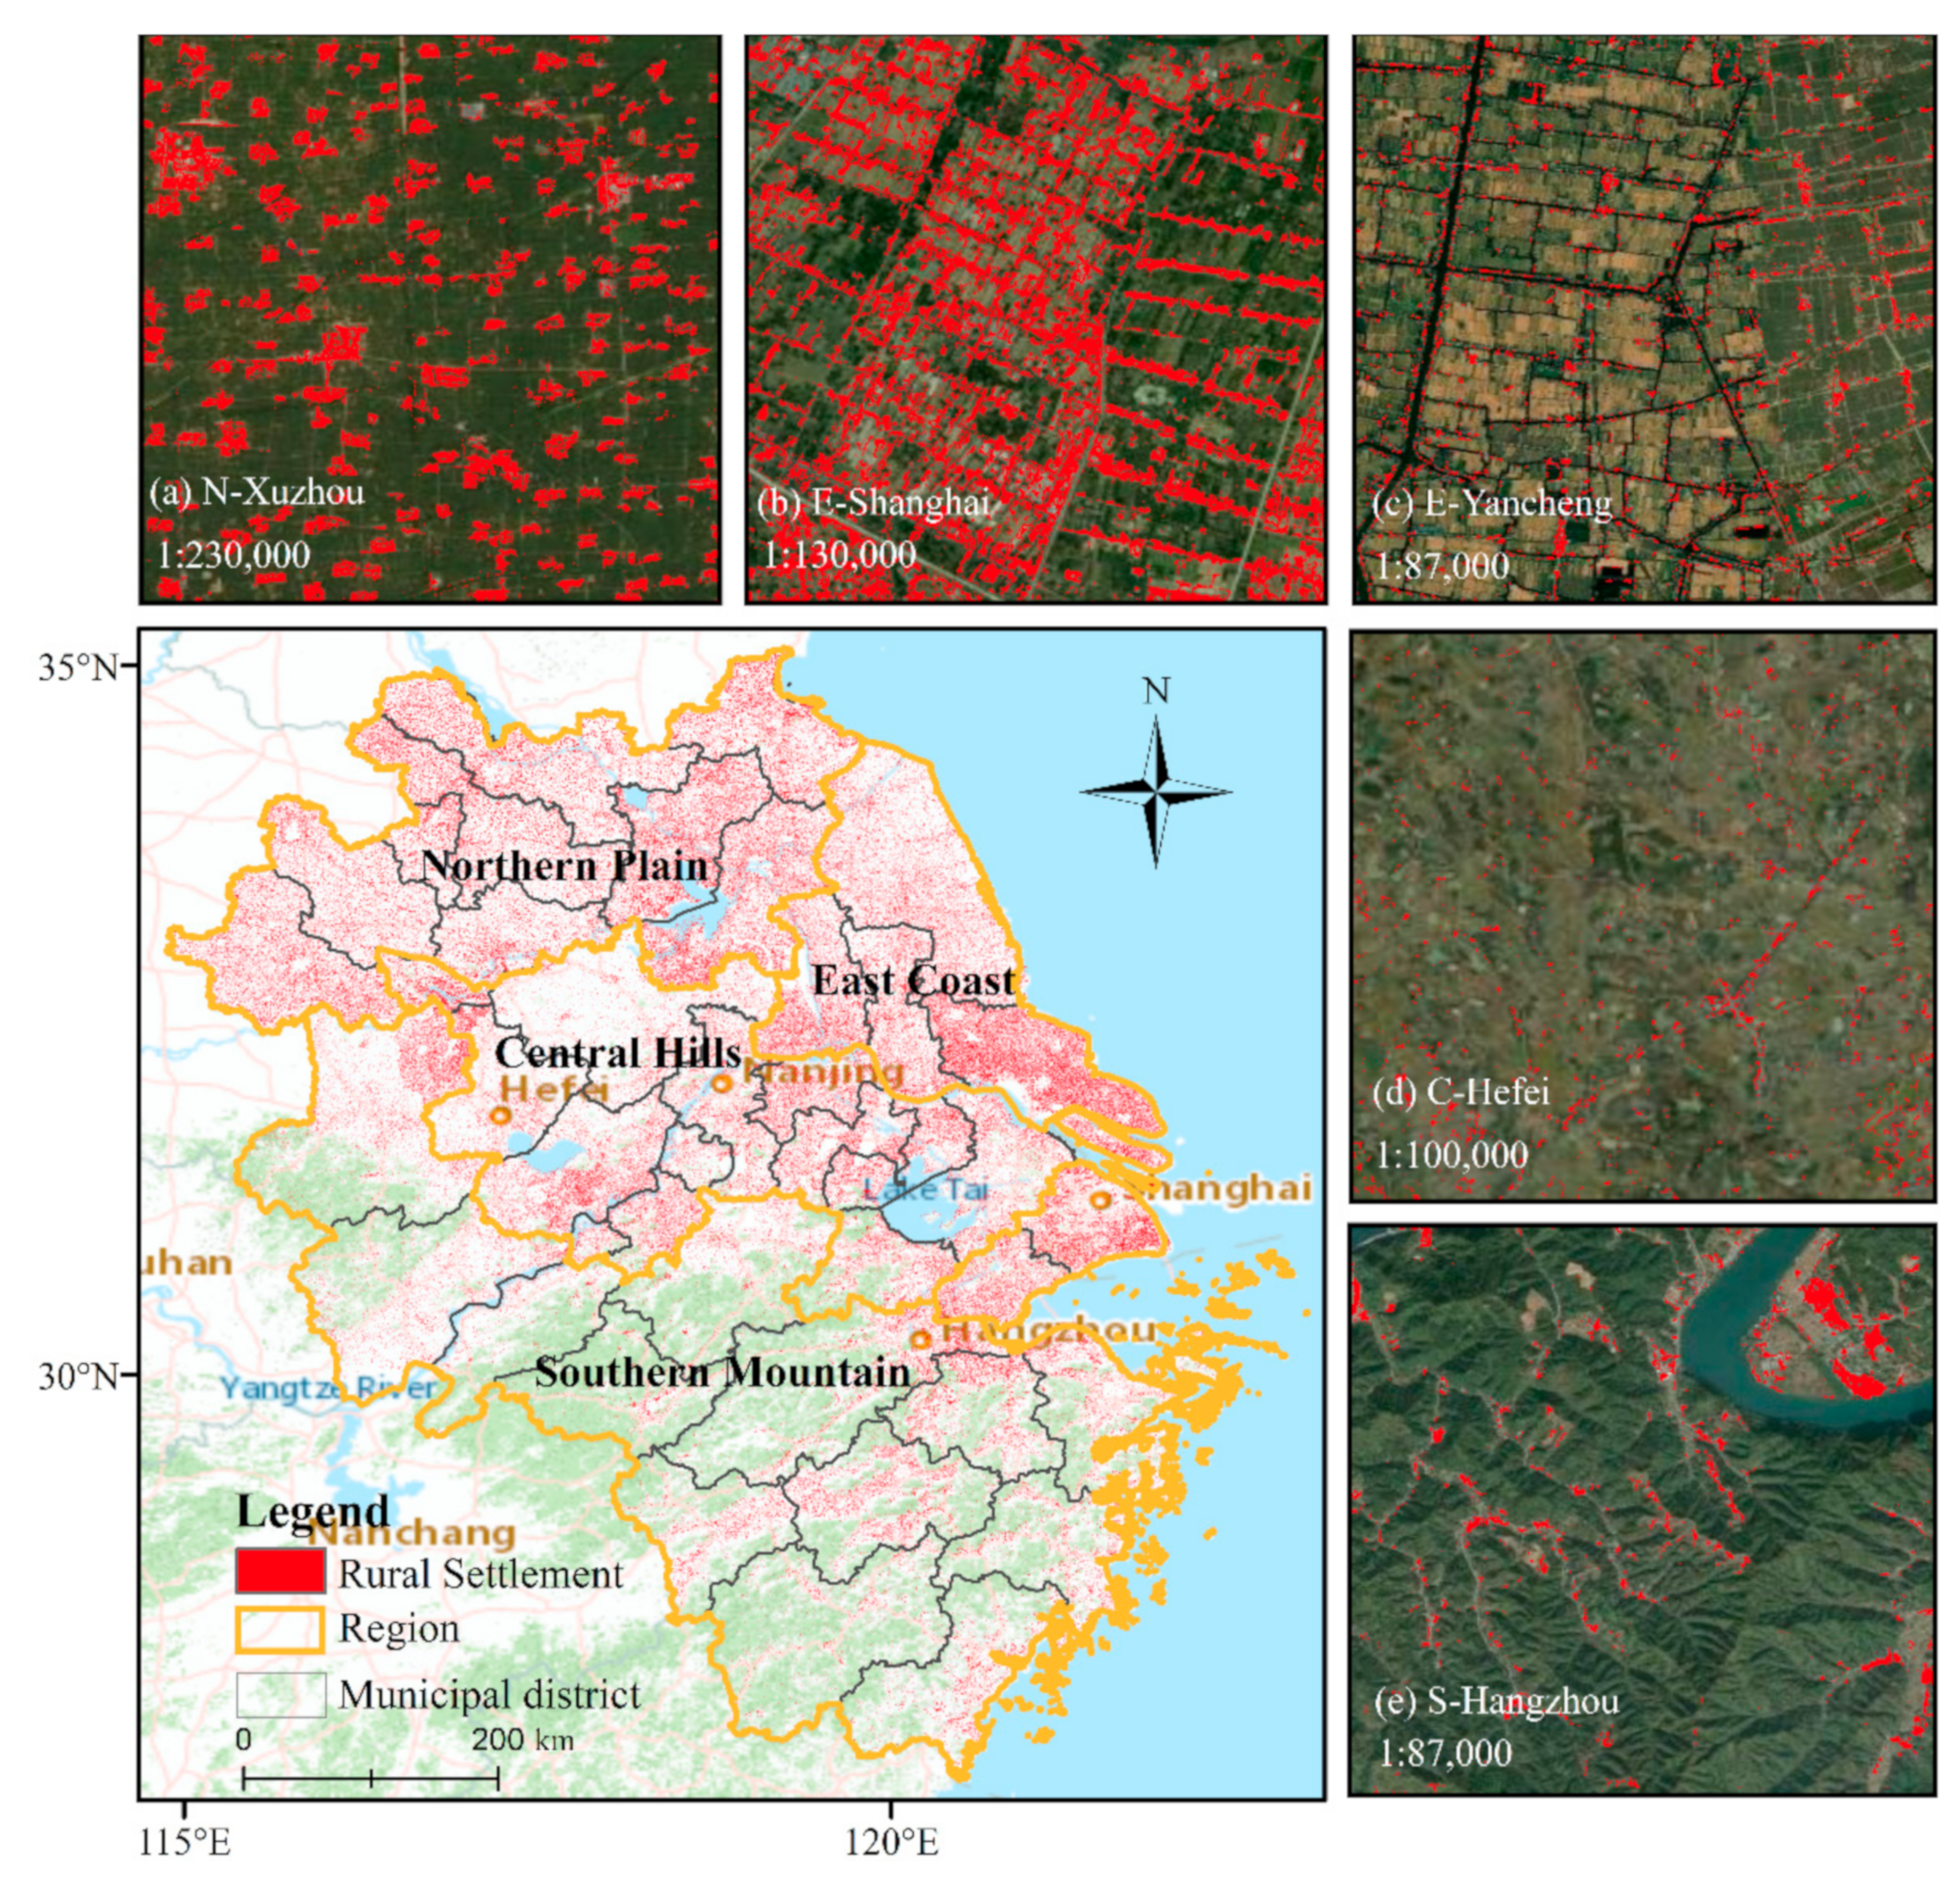
2.1. Study Area

The Yangtze River Delta, the largest economic region in China with an area of 350,000 km2 and a population of around 220 million, has the highest urban density in China [36]. It consists of Jiangsu Province, Zhejiang Province, Anhui Province, and Shanghai City, all of which are in the middle and lower reaches of the Yangtze River (Figure 1) [37]. The elevation of the southern part of this area is higher than that of the north because of the presence of mountains. The climate, culture, and economic development levels in the Yangtze River Delta are diverse, resulting in obvious regional differences in the size, shape, and spatial distribution of rural settlements [24,38].

2.2. Multi-Source Remote Sensing Datasets

In this study, four types of data sources (Table 1), namely Sentinel-1 SAR ground range detected (GRD) data, Sentinel-2 optical imagery, VIIRS-DNB nightlight data, and STRM-DEM imagery, were selected for the mapping of rural settlements across the study area using the GEE platform.
  • Sentinel-1 SAR GRD Data
The Sentinel-1 satellite provides C-band SAR imagery at a variety of polarizations and resolutions. The repeat cycle of the polar-orbiting two-satellite constellation is 6 days. The GRD scenes with a resolution of 10 m were chosen as the input data in the present study. Each Sentinel-1 image on the GEE was preprocessed with the Sentinel-1 Toolbox, including thermal noise removal, radiometric calibration and terrain correction. The composite within a year interval from 1 January 2019 to 31 December 2019 was produced by taking the median pixel value of each pixel from all collected Sentinel-1 SAR data, which can further reduce the speckle noise. Then, the Vertical transmission and Vertical reception (VV) and Vertical transmission and Horizontal reception (VH) polarization were selected, and the gray-level co-occurrence matrix (GLCM) [39,40] was computed from VV backscattering coefficients ( σ V V ) and VH backscattering coefficients ( σ V H ).
  • Sentinel-2 MSI
Sentinel-2 provides multi-spectral data, including four bands with 10 m spatial resolution, six bands with 20 m spatial resolution, three bands with 60 m spatial resolution, and three quality assessment (QA) bands, where QA60 is a bitmask frequency band with cloud mask information. We employed the Sentinel-2 MSI Level-1C data in this study. Zhang et al. [41] found that winter (dry season) is the best season for estimating impervious surfaces in subtropical monsoon regions and Gong et al. [16] explained that the green season is the best time for rural settlement mapping; thus, we selected images in the study area during 1 January 2019 to 31 May 2019 with a cloud cover of less than 10% based on the “CLOUDY_PIXEL_PERCENTAGE” attribute, and mosaicked these together to minimize cloud impact. Furthermore, cloud-free images were obtained by removing clouds and cloud shadows using the Sentinel-2 “QA60” band. Then, a composite image was obtained from all selected images using the median reducer in GEE. Finally, spectral features were computed based on the composite image.
  • VIIRS-DNB
The VIIRS-DNB nightlight data, collected by the Suomi National Polar-orbiting Partnership satellite of the National Aeronautics and Space Administration (NASA)/National Oceanic and Atmospheric Administration (NOAA), has the unique ability to record emitted visible and near-infrared (VNIR) radiation at night with a spatial resolution of 15 arc seconds (equivalent to 0.5 km at the equator). For this study, we used VIIRS-DNB Composites Version 1 data, which are the monthly average radiance composites. A composite VIIRS-DNB data was obtained from all collected VIIRS-DNB data using the median reducer in GEE to eliminate the maximum value of nighttime light and obtain more stable nighttime light data. Finally, the average DNB radiance values (avg_rad) were selected from the composite VIIRS-DNB data.
  • SRTM-DEM
SRTM data, measured and released by NASA and the National Surveying and Mapping Bureau of the Department of Defense, can cover 80% of the global land surface [42]. The SRTM Version 3 (V3) product, provided by NASA Jet Propulsion Laboratory (JPL) at a resolution of 1 arc second (approximately 30 m), was exploited in our research. We used the slope and elevation information in the study.
When different data sources were collected, inputs were resampled to the spatial resolution of 10 m, which corresponds to the fine resolution of Sentinel-1 SAR. Finally, all data were projected into the GCS WGS84 coordinate system. The mapping results were reprojected into Asia North Albers Equal Area Conic with WGS-84 ellipsoid using ArcGIS software to calculate area.

3. Methodology

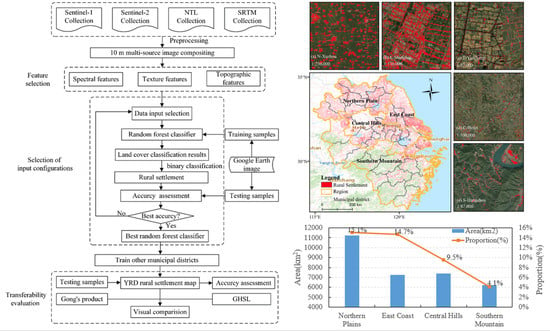
3.1. Overview of the Proposed Framework

A rural settlement is a comprehensive land use type, including vegetation, roads, rivers, buildings, and other features. As a result, it is difficult to extract settlements as a whole using a simple thresholding method or traditional classification methods. However, the spatial structure of rural settlements is unique, and their spatial distribution is greatly affected by the terrain. Therefore, this study attempted to combine multi-source remote sensing data with spectral, texture, and topographic features to extract rural settlements. The research process included five main steps: (1) classification system and training sample selection, (2) feature selection, (3) selection of input configurations, (4) random forest model construction, and (5) transferability evaluation. The overall framework for rural settlement extraction is shown in Figure 2.

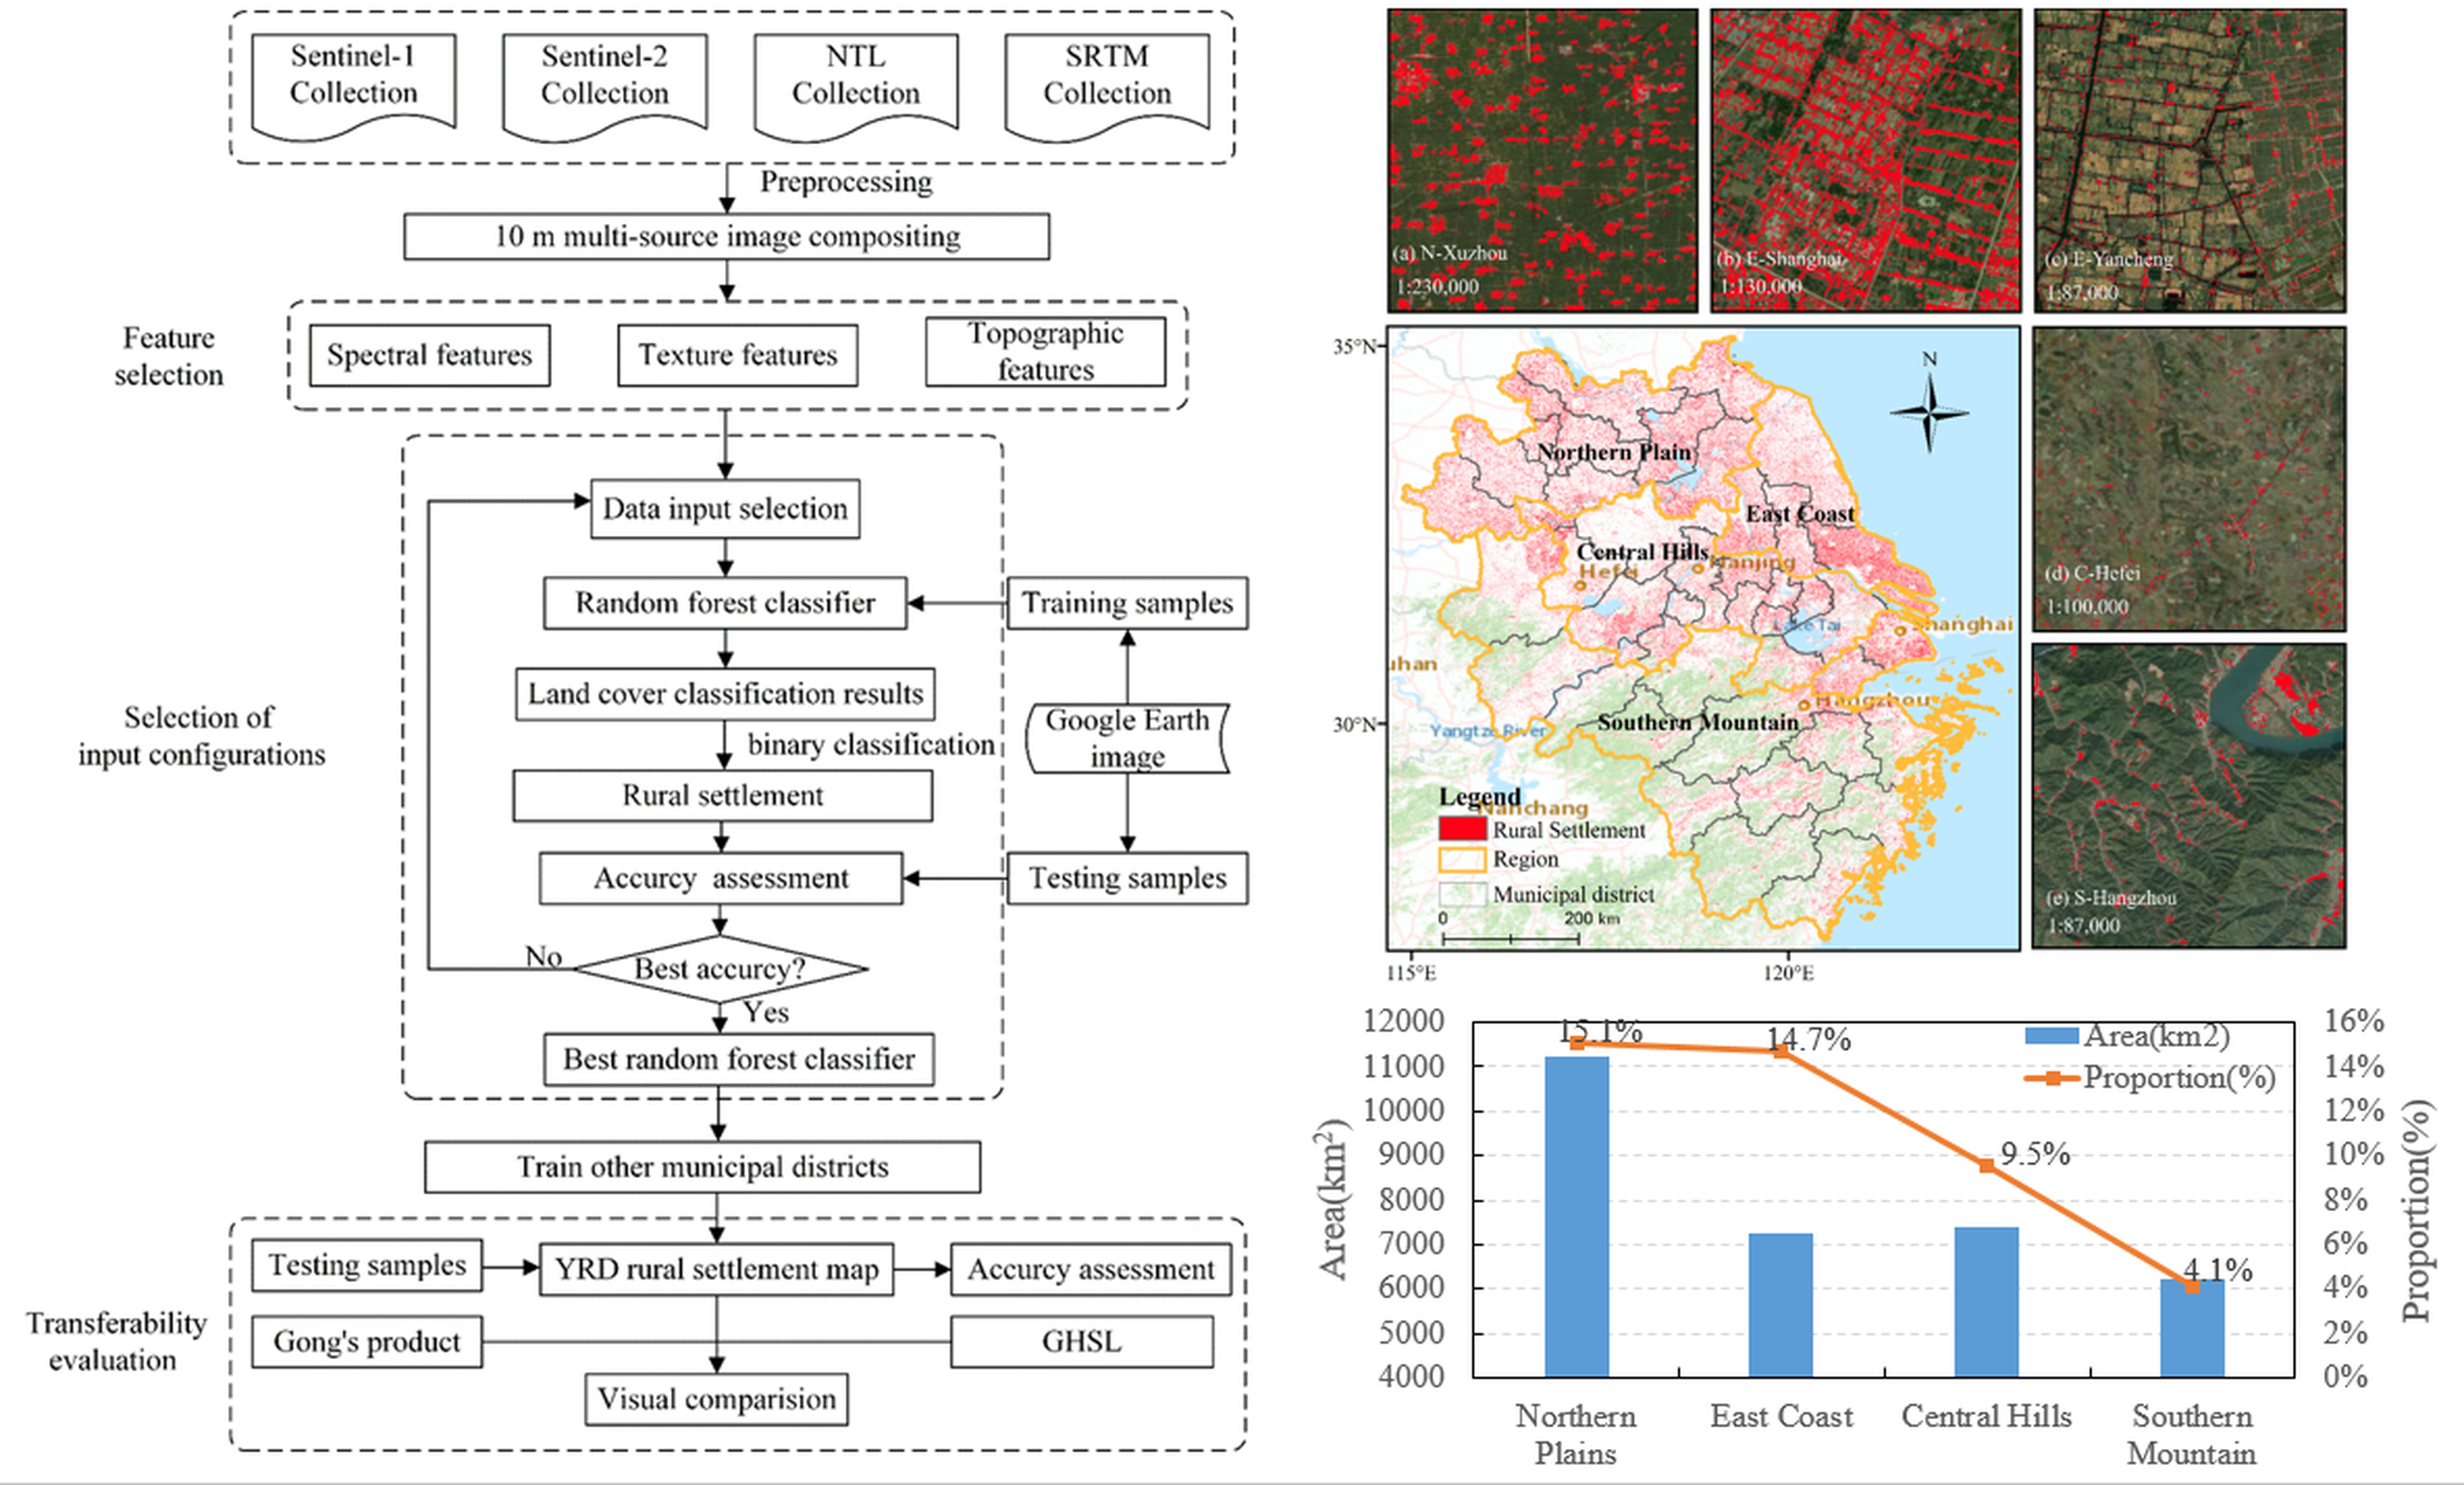
3.2. Classification System and Training Sample Selection

An appropriate classification system and training samples are the keys to obtaining high-precision classification results. In this study, we fully considered the surface coverage of the Yangtze River Delta and the characteristics of the remote sensing images. The output variables of the classifier were grouped into five categories: vegetation, water, rural settlement, urban land, and other lands. Among these, the vegetation class mainly covers vegetation areas such as cultivated land, woodland, and grassland. The water class includes open water bodies such as rivers, oceans, and lakes. The rural settlement class includes rural built-up areas and vacant spaces, roads, water bodies, public facilities, landscaping, and other living facilities and production facilities between houses. The urban land class includes cities at all levels and built-up areas in counties and towns. The other lands class consists of industrial and mining land, roads, bare land, unused land, etc.
To better extract rural settlements in the entire Yangtze River Delta region, we divided the study area into four regions based on the characteristics of the rural settlements: Northern Plain, East Coast, Central Hills, and Southern Mountain. The Northern Plain has a mainly plain terrain in the northern part of the Yangtze River Delta, a warm temperate semi-humid monsoon climate, and contains 9 municipal districts. The East Coast in the eastern part of the Yangtze River Delta, whose terrain mainly includes alluvial plains and delta plains, comprises 6 coastal municipal districts. The Central Hills, located in the middle of the Yangtze River Delta, contains 12 municipal districts. Its terrain is mainly composed of hills. The Southern Mountain has a large number of hillsides in the southern part of the Yangtze River Delta and covers 14 municipal districts. The climate in East Coast, Central Hills, and Southern Mountain regions is a subtropical monsoon climate. To validate the transferability of our model, we selected reference samples only in one municipal district from each region: Xuzhou in the Northern Plain, Shanghai in the East Coast, Hefei in the Central Hills, and Hangzhou in the Southern Mountain. We obtained all reference samples in the four selected municipal districts by visual interpretation from the high-resolution Google Earth Imagery. The reference samples were randomly distributed in each municipal district. We especially avoided the issue of spatial autocorrelation of reference samples mentioned in [43], so each sample was extracted within a 10 × 10 m area from every region of interest (ROI), which also ensured the homogeneity and geographic integrity of the samples. There should be abundant training data in all classes [44], so we selected 200 reference samples for each class in each municipal district. The division of the study area and distribution of each land cover class among training municipal districts are illustrated in Figure 3.

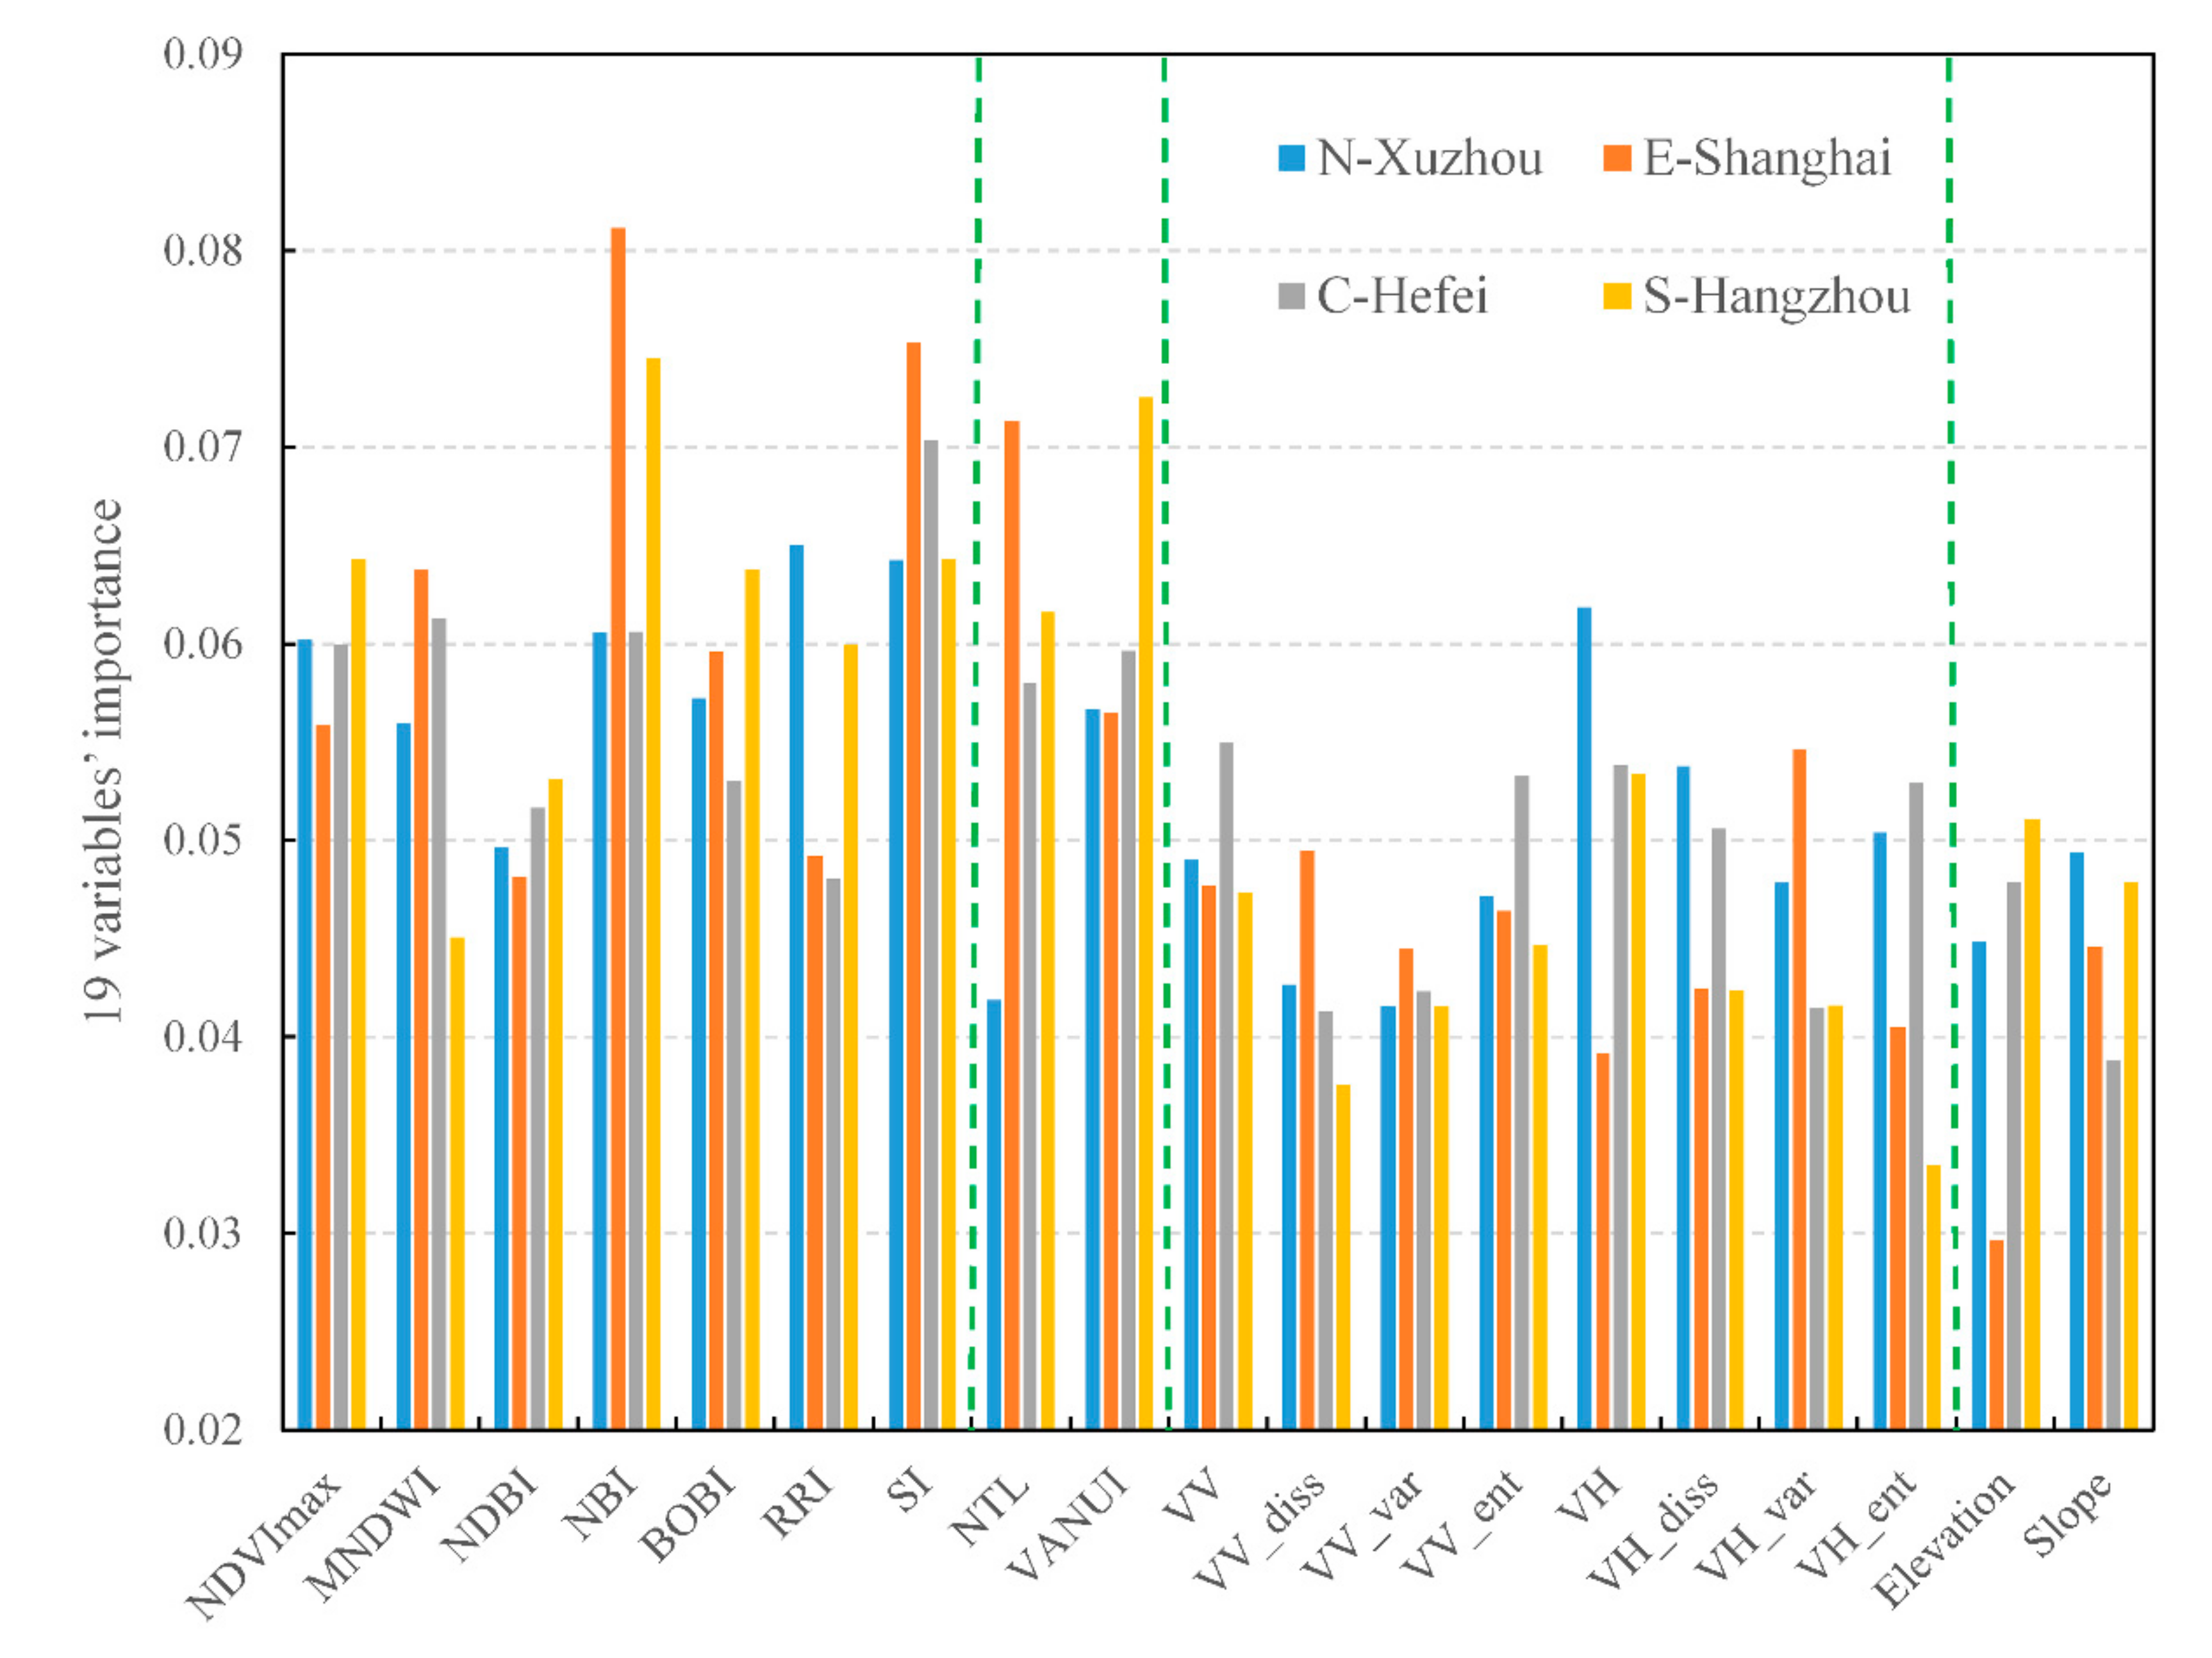
3.3. Feature Selection

The incorporation of multi-source data and multi-dimensional features improved the accuracy of impervious surface mapping [45]. In our study, spectral indices of Sentinel-2 MSI, backscattering and textural features of Sentinel-1 SAR, nightlight information from VIIRS-DNB, and terrain features of SRTM-DEM were generated for the extraction of rural settlements. A total of 19 features for each pixel location were selected. These features and their formulas are summarized in Table 2. Feature extraction from multi-source images is described in detail in the following four sections.

3.3.1. Spectral Indices

Spectral indices for this study were specifically chosen to distinguish rural settlements from other land cover categories. We adopted 7 spectral indices: Maximum Normalized Difference Vegetation Index (NDVImax) is the maximum NDVI composites from all available images during time span of Sentinel-2 acquisitions (1 January 2019–31 May 2019). It can solve the problem of mixing bare land and rural settlements caused by the difference in cultivation time of croplands; Modified Normalized Difference Water Index (MNDWI) can well extract the water body in the study area; Normalized Difference Built-up Index (NDBI), New Built-up Index (NBI), and Ratio Resident-area Index (RRI) can effectively extract the built-up areas; Built-up or Bareness Index (BOBI), Soil salinity index (SI), and topsoil Grain Size Index (GSI) can effectively separate rural settlements from bare land.

3.3.2. Textural Metrics

The internal structure of rural settlements is complex and has high heterogeneity. Therefore, the pixel value changes significantly in Sentinel-2 MSI imagery. In contrast, the changes in the pixel values of other land cover types such as vegetation and water are relatively smooth due to their better homogeneity in the Sentinel-2 images. The texture feature well reflects the gray-scale change in the image. Therefore, adding the texture feature can distinguish the features that are difficult to differentiate only using spectral features. In this study, we selected VV and VH imagery, which were directly derived from the time-series of Sentinel-1 SAR imagery. Zhang et al. [46] found that SAR texture features were also relevant to impervious surfaces and identified the dissimilarity, variance, and entropy features of the VV and VH imagery as effective indicators for the texture description of different land cover types. Therefore, we selected these as textural metrics. The window size was chosen as 9 × 9 pixels, and the stride size was 3.

3.3.3. Nightlight Information

The light intensity of urban land is much higher than that of rural settlements, which can be clearly seen in the nighttime light data, so nighttime light (NTL) and Vegetation Adjusted NTL Urban Index (VANUI) were introduced to distinguish rural settlements from urban settlements.

3.3.4. Terrain Features

The spatial distribution of rural settlements is greatly affected by topography and altitude. As a result, elevation and slope data calculated from SRTM-DEM were added to the feature vector.

3.4. Selection of Input Configurations

Since multi-source data were used in the present study, we were concerned about which input configurations would eventually provide the best accuracy for rural settlement extraction. To this end, we investigated the impact of different input configurations on the accuracy of the extraction results. We input the features in the order of: (1) spectral features; (2) spectral and texture features; (3) spectral, texture features, and nightlight information; and (4) all features. In each step, the newly introduced features would be accepted only when there was an improvement in the accuracy indices. Finally, the best input configurations were selected based on the best achievable accuracy.

3.5. Random Forest (RF) Classifier

The RF classifier was chosen as the supervised classification method for rural settlement mapping [53]. RF, a machine learning algorithm, includes multiple decision trees, each of which gives a class label to the pixel by classification. The pixel is finally assigned with the class label having the most votes [54]. Compared to other widely used classifiers, such as the support vector machine (SVM) and classification and regression tree (CART), the RF classifier has advantages in terms of flexibility and speed when dealing with high-dimensional data. In addition, it provides a more robust classification effect for multi-feature fusion data [55]. Furthermore, it can be used to derive the importance of multiple input features [56]. The number of classification trees was set to balance accuracy and timeliness as suggested in previous studies [26,57]. Here, we used the best input configuration as the input variable. Eighty percent of all class samples were used for training, while the remaining twenty percent were employed for testing in each administrative area of each region. Finally, four random forest models of training municipal districts in four regions were obtained. We then transferred them to classify other municipal districts in their respective region.

3.6. Accuracy Assessment

We followed the random sampling method to evaluate the accuracy of the extraction results. We used the commonly used sample size formula as in [58]:
n   =   z 2 p ( 1 p ) d 2
where z = 1.96 represents a 95% confidence interval, d denotes the half-width of the confidence interval that was set as 0.025 for the two-class classification in this study, and p is the estimated proportion of validation points that are likely to be allocated to the rural settlement class.
We generated random validation points in each region of the study area using the random sampling technique in ArcGIS. The attribute of each point was assigned by point-by-point comparison between the extraction results and the actual ground classes based on the high-resolution Google Earth image. Then, we obtained the confusion matrix. Accuracy measures of overall accuracy (OA), Kappa coefficient, user’s accuracy (UA), and producer’s accuracy (PA) were used for the accuracy assessment.
OA   =   1 N i = 1 n x i i
PA   =   x i i / i = 1 n x k i
UA   =   x i i / i = 1 n x i k
Kappa   =   ( N i = 1 n x i i i = 1 n x k i x i k ) / ( N 2 i = 1 n x k i x i k )
where n is the number of classification categories, N is the total number of samples, x i i is the number of correctly classified samples in the ith category, x i k is the total number of rows in the ith category, and x k i is the total number of columns in the ith column.
To further validate our results, the 38 m resolution Global Human Settlement (GHS) Built-Up Grid [59] and 30 m resolution human settlement map in China developed by Gong et al. (2019) [16] were selected as visual comparisons for our rural settlement map. Among these, GHS Built-Up Grid was developed using a symbolic machine learning model trained by the collected high-resolution samples, and multi-temporal Landsat imagery in the epochs 1975, 1990, 2000, and 2015. The GHS built-up grid at 38 m for 2015 was employed for comparison analysis. The 30 m resolution human settlement map in China was produced at an annual frequency during 1985 to 2017. It was developed by an “exclusion–inclusion” framework based on Landsat imagery and nighttime light data on GEE. The rural settlement in 2017 mapped by Gong et al. (2019) was employed for comparison analysis.

4. Results

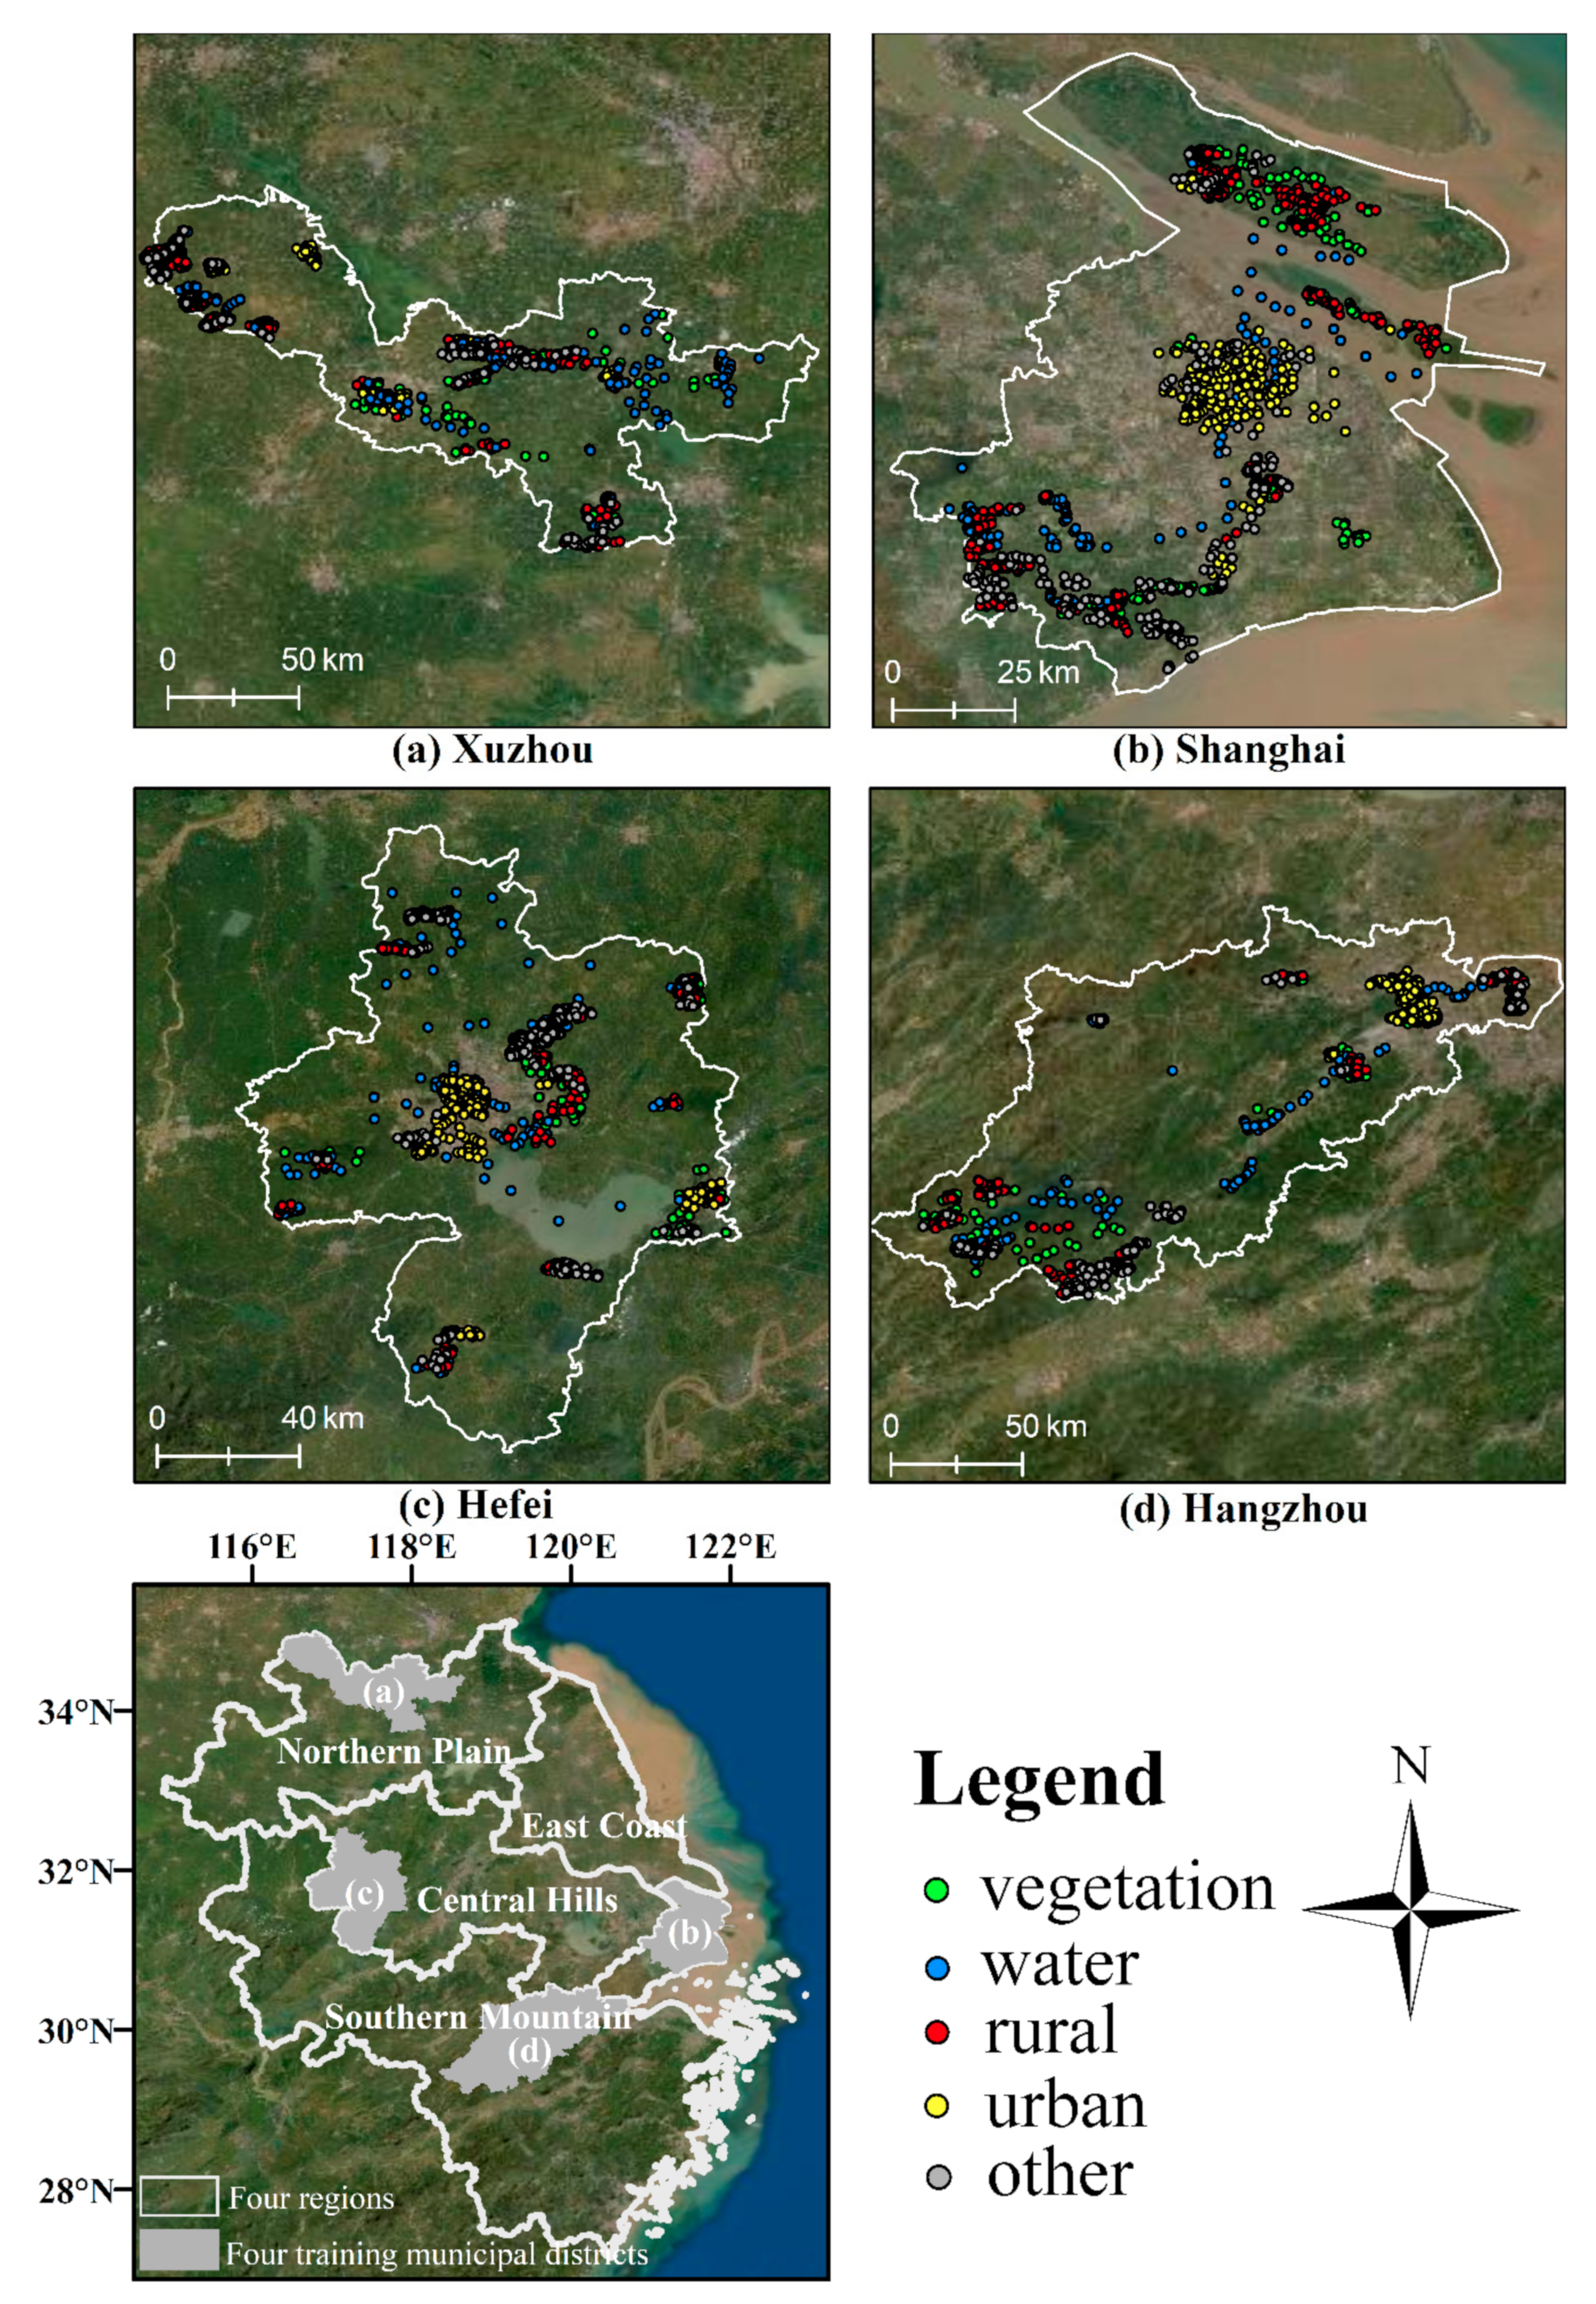
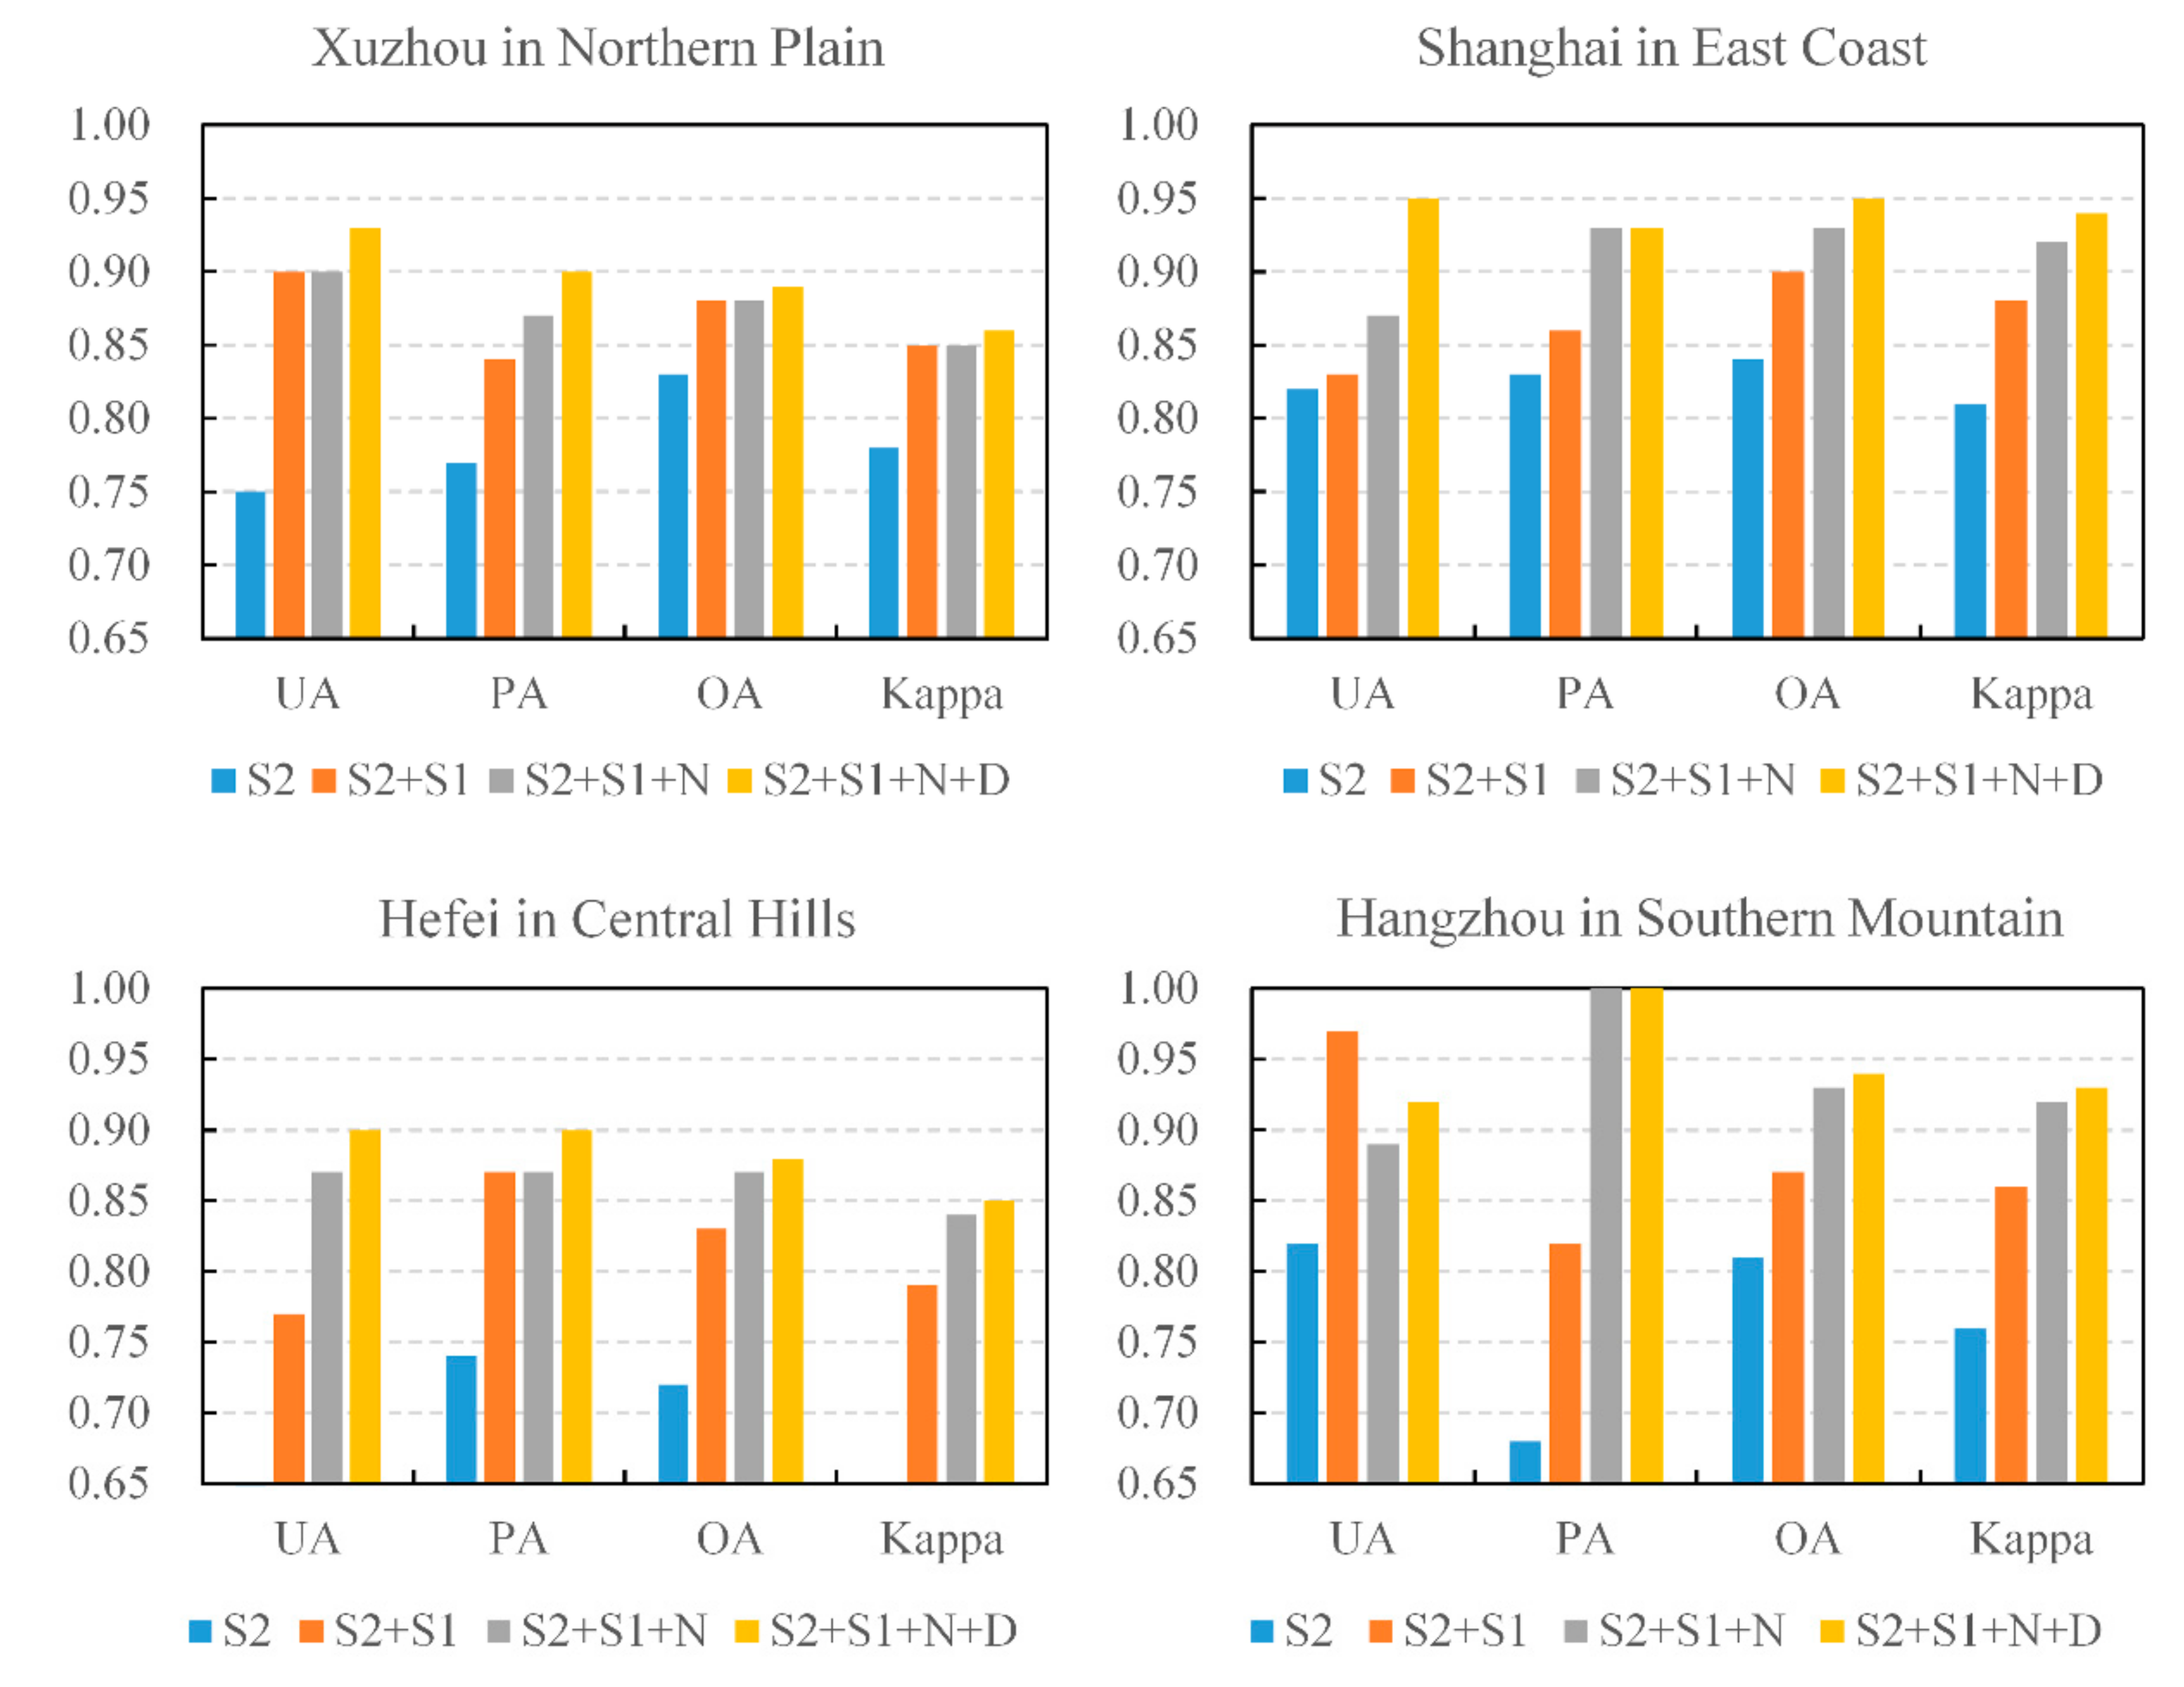
4.1. Comparison of Classification Accuracies with Different Input Configurations and Importance of Input Features

Lin et al. [57] and Behnamian et al. [60] illustrated that the number of trees (ntree) of the random forest has an influence on the classification accuracy and the stability of variable importance rankings, respectively. We first examined the relationship between the number of trees of the random forest models and the classification accuracy. We ran our classifications iteratively from 10 to 100 with a ntree interval of 10. Figure 4 illustrates the influences of the variation of the number of trees on the out of bag (OOB) error and the Kappa coefficient under the selected four different trained random forest classifiers. The OOB error firstly drops very quickly and then becomes steady after the number of decision trees reaches 50. The Kappa coefficient increases quickly as the number of decision trees increases and then remains relatively steady when the number of decision trees reaches 50. Then, we compared the importance of features. We found that the top ten most important variables tend to remain constant when the number of decision trees reaches 50, while the ranking of less important variables varied slightly. Furthermore, running one random forest model with a large ntree required more time. For example, one random forest model in E-Shanghai with 50 trees required 0.928 s, while one random forest model in E-Shanghai with 1000 trees required 2.764 s. We also found that our trained random forest models with a large ntree are non-transferable to other municipal districts without training samples. Therefore, the number of classification trees was set as 50 to balance accuracy, timeliness, and the transferability of the random forest model.
Then we compared the classification accuracies of four input configurations (Figure 5): Sentinel-2 MSI optical imagery (S2, features 1 to 7) only; Sentinel-2 MSI optical imagery and Sentinel-1 SAR (S2 + S1, features 1 to 15); Sentinel-2 MSI optical imagery, Sentinel-1 SAR, and VIIRS-DNB (S2 + S1 + N, features 1 to 17); and Sentinel-2 MSI, Sentinel-1 SAR, VIIRS-NTL, and SRTM-DEM (S2 + S1 + N + D, features 1 to 19). In general, the accuracy increased with the incorporation of multi-source features. The S2 + S1 + N + D configuration achieved the highest accuracy.
To quantitatively demonstrate the necessity of multi-source features, we used the training samples from the four training municipal districts to calculate the importance of the training features with the random forest model in GEE. Figure 6 shows the relative importance of different input features. These results indicate that different indices play diverse vital roles in the extraction of rural settlements in various regions.

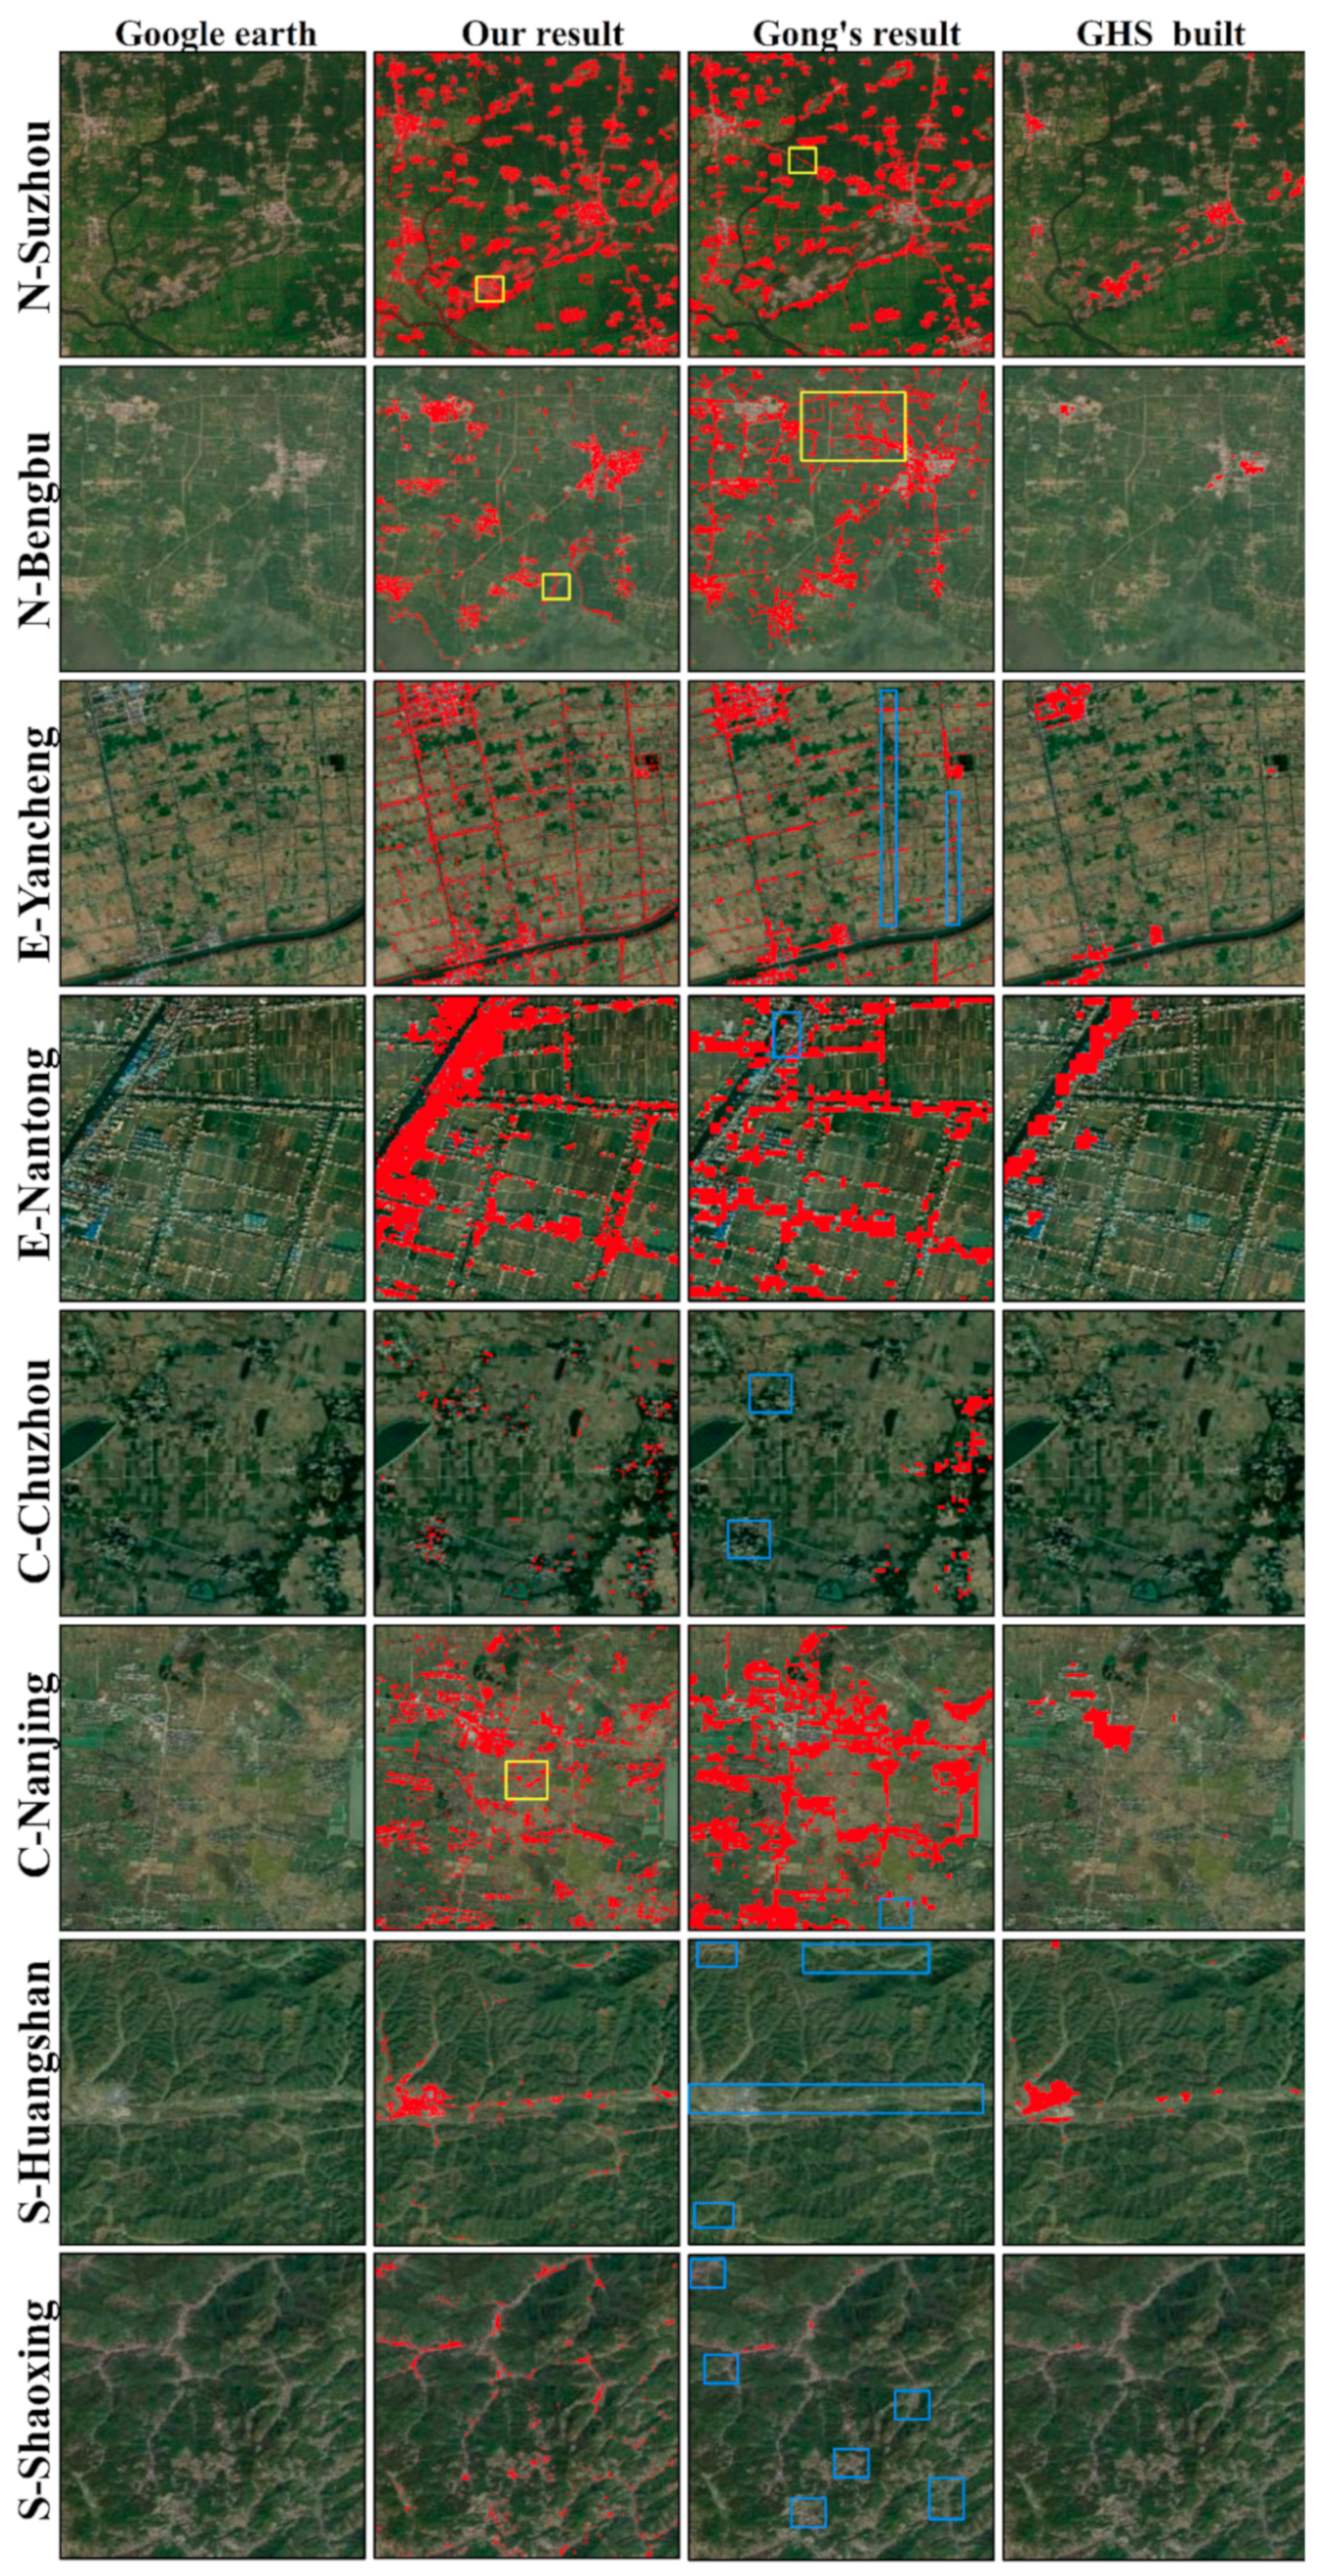
4.2. Distribution of Rural Settlements

The best input configurations were employed as the input variables for the random forest model. We trained the random forest model with the selected training samples in each municipal district and obtained a random forest model in each region. Then, we used these four random forest models to classify other municipal districts in the corresponding region in GEE. The distribution of mapped rural settlements across the Yangtze River Delta was obtained (Figure 7). The densities of rural settlements in the Northern Plain and Eastern Coast were higher than those in the Central Hills and Southern Mountain. To better show the distribution characteristics of rural settlements in different regions, five representative cities from four regions were selected for comparison: Xuzhou in Northern Plains, Shanghai and Yancheng in East Coast, Hefei in Central Hills, and Hangzhou in Southern Mountain. Rural settlements in the Northern Plains are distributed mostly in blocks with regular shapes and good integrity, and are spread irregularly in a moderate density (Figure 7a). In the East Coast, rural settlements are on both sides of rivers and roads with large and small scales in densely distributed strips (Figure 7b,c). Affected by the compact river networks and barren land in the Central Hill, rural settlements are sparsely scattered in the form of small clumps and points with a low density (Figure 7d). There are large numbers of mountains and valleys in the Southern Mountain. Therefore, most rural settlements in this area are distributed along roads and rivers in a small-scale and scattered layout with a low density and a high degree of fragmentation (Figure 7e).
To quantify the distribution of rural settlements in the Yangtze River Delta, the area and proportion of rural settlements at different scales were compared at different levels (Figure 8). In general, in 2019, rural settlements accounted for 17.41% of the total area of the Yangtze River Delta region. The rural settlement is one of the most important land use types in this region. The spatial distribution of rural settlements presents significant variances in different divisions in this area.
At the municipal district level, rural settlements account for more than 10% of the total land area in the Northern Plain and East Coast, while they make up a very low proportion in the Central Hills and Southern Mountain. This observation demonstrates that the terrain greatly affects the distribution characteristics of rural settlements. The density of rural settlements in Shanghai, East Coast is the highest, with the area and proportion of 1632.16 km2 and 20.2%, respectively. The density of rural settlements in Lishui, Central Hills is the lowest: the area and proportion of rural settlements are only 288.12 km2 and 1.7%, respectively (Figure 8a). At the regional level, rural settlements in the Northern Plain account for the highest proportion of 15.1%, followed by that in the East Coast (14.7%). The lowest proportion is in the Southern Mountain (4.1%) (Figure 8b).

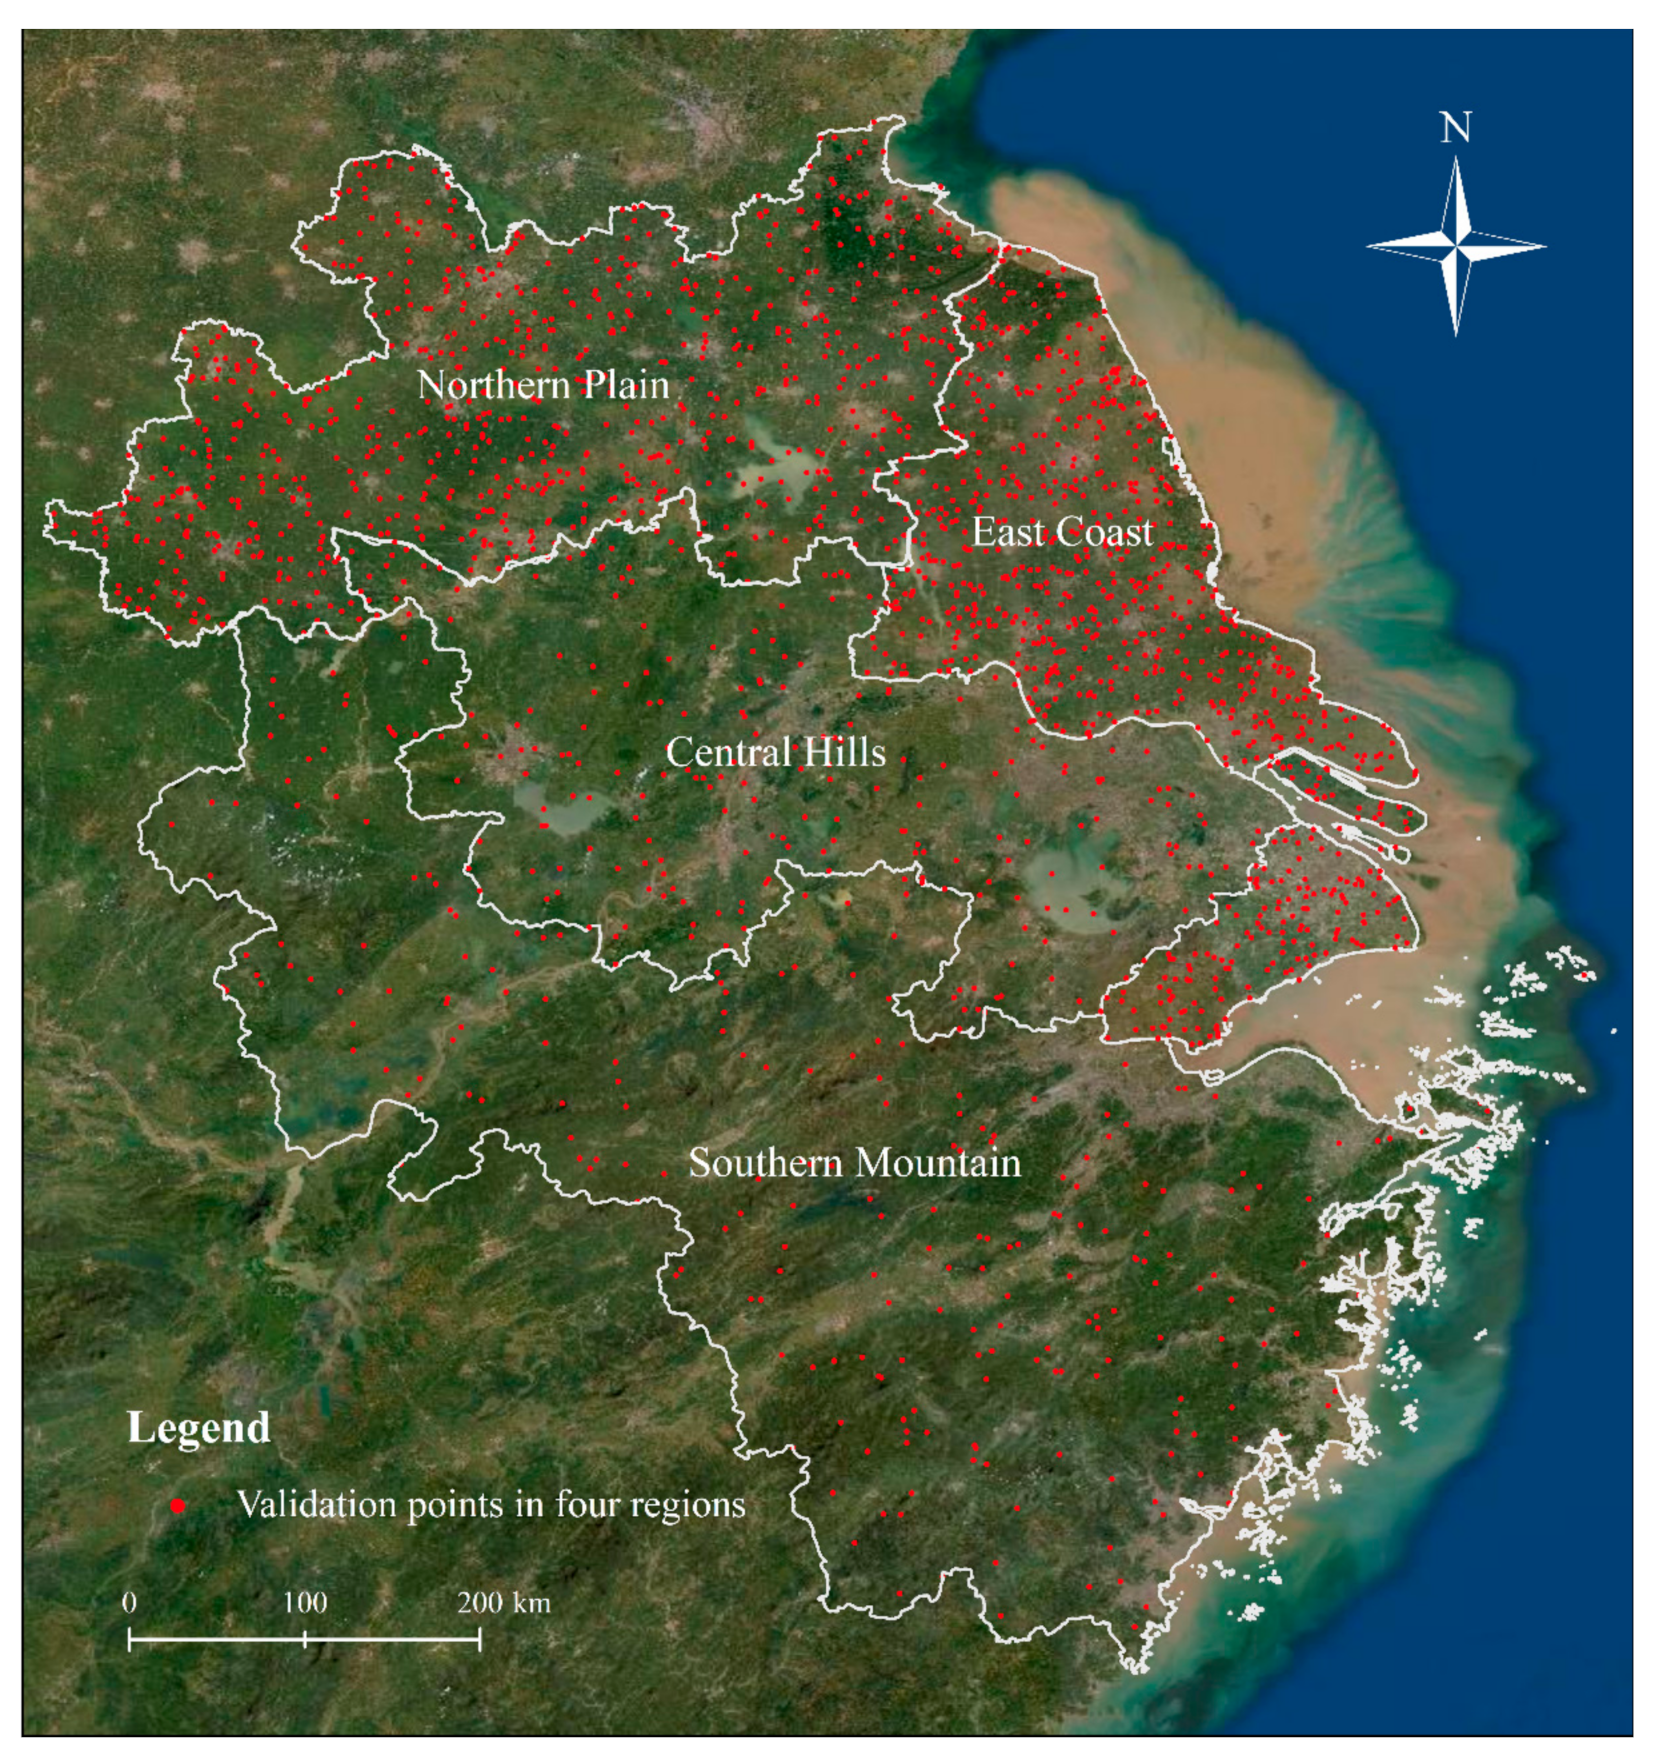
4.3. Accuracy Assessment using Validation Samples

We substituted the estimated proportions of rural settlements obtained in Section 4.2 into Equation (1). The required numbers n of the random validation samples were 784, 784, 528, and 236 for the Northern Plain, East Coast, Central Hills, and the Southern Mountain, respectively. The distribution of validation samples is illustrated in Figure 9. Then, the accuracies of the four rural settlement maps in the four regions with different rural settlement densities (Table 3) were evaluated to investigate the transferability of the trained models. The overall accuracies and Kappa coefficients in the four different regions exceeded 0.95 and 0.75, respectively, indicating that the transferability of the four trained models was relatively good. Specifically, the UA and Kappa coefficient of the rural settlements in the Eastern Coast were the highest, reaching 0.86 and 0.85, respectively. These were consistent with the highest accuracy obtained from the random forest model trained in Shanghai, showing that the transferability of this model was also the best. The UA values of the rural settlements in Central Hills and Southern Mountain were only 0.78, which is likely due to the complexity of rural settlement distributions in these areas. Moreover, we concluded that PA and Kappa coefficient varied with density. Specifically, higher accuracies were achieved in high rural settlement density regions such as the Northern Plain and East Coast, followed by medium and low rural settlement density regions such as the Central Hills and Southern Mountain.

5. Discussion

5.1. Multi-Source Data Contributions

In this study, single-source and multi-source results were quantitatively compared to demonstrate the improvement by multi-source data. As shown in Figure 4, compared to the method only using the optical data, the proposed method provided 16.75%, 17.75%, 11.50%, and 14.50% average increases in UA, PA, OA, and Kappa, respectively. Because SAR images can provide information about the structure and dielectric properties of the surface materials, the application of SAR data greatly improved accuracies, yielding 11.0%, 9.0%, 7.5%, and 9.5% increases in UA, PA, OA, and Kappa, respectively, compared to those only using the optical data. The strong sensitivity of backscattering characteristics to man-made structures can help discriminate rural settlements from bare land, which have similar spectral characteristics but different SAR backscattering features [57]. Furthermore, textural features from SAR imagery can capture spatial structures of rural settlements and the variability of land-cover categories. As a result, other land-cover categories that are difficult to differentiate using only spectral features can be distinguished from rural settlements, and edge information of rural settlements is able to be retained.
Moreover, this work shows that different features provide different types of information and highlight different issues by presenting the feature importance in Figure 5. The importance of features trained varies significantly in different regions. For instance, the importance of MNDWI in Hefei in the Central Hills, where many small rivers and lakes are distributed, is much greater than that in other cities; the importance of elevation and slope in Hangzhou in the Southern Mountain, where a large number of mountain areas are located, is significantly higher than that in other regions; NTL plays an important role in extracting rural settlements in Shanghai, an international metropolis in the East Coast where the nightlight value is significantly higher than those in other regions. In short, different datasets have different capabilities in recognizing land cover classes, facilitating the improvement of the overall classification accuracy [61]. Specifically, NDVImax can solve the problem of mixing bare land and rural settlements caused by the difference in the cultivation time of land crops. MNDWI is the most commonly used water index to separate the water and non-water classes. NDBI and NBI are two built-up indices helpful for mapping built-up areas. The present study found that SI, RRI, and BOBI, all of which have higher importance scores, are able to distinguish settlements from bare land effectively (Figure 5). The DN values in cities are significantly higher than in rural areas. Therefore, NTL from VIIRS-DNB is used to signify the urban areas. VANUI is employed to increase the difference between urban and rural DN values to better distinguish them. Since the distribution of rural settlements is related to the terrain, the elevation and slope from SRTM-DEM data are also beneficial to the classification. These features are therefore indispensable in the accurate mapping of rural settlements with different distribution patterns.
To quantify the multi-source data contribution, we further obtained the confusion matrix (Table 4). All classes were less likely to be confused when multi-source data were used. Taking the rural settlement class as an example, with only optical data, 14 and 16 rural settlement class samples were misclassified as the other four classes in Shanghai and Hangzhou, respectively, while the confusion was reduced to five and three misclassified rural settlement class samples when the multi-source data were applied. This demonstrates that the proposed multi-source method reduced the confusion between vegetation, water, urban land, and other land categories for large-scale rural settlement mapping.

5.2. Transferability of Trained Models

To better demonstrate the mapping result reliability of rural settlements extracted by the trained models, we selected two cities in each region and compared the results extracted with the current public datasets. The results are shown in Figure 10.
The result of rural settlement extraction was not very satisfactory in the Global Human Settlement Built-Up Grid (GHS_built). The extracted objects are mainly human settlements: it maintained a high performance in urban settlements, while it might underestimate some rural settlements. In addition, its research scope and designed algorithms are global-oriented, which may not be perfect in all regions, especially in regions with complex rural settlement distribution types, such as the Yangtze River Delta. Specifically, in the Northern Plain, the mixed phenomena of our results were slightly fewer than those reported by Gong et al. [16]. As illustrated in N-Bengbu, many cultivated land and roads were mistakenly extracted as rural settlements in their study. Although the extraction results in the present study were slightly better, there were still a few mixed phenomena. In the East Coast region, our results were slightly better than those obtained by Gong et al. [16]. Some rural settlements were missed in their study, mainly due to their use of the Landsat imagery at 30 m resolution. Because most of the rural settlements in this region are distributed in strips along roads and rivers, it is difficult to distinguish them in Landsat data. The images used in the present study were 10 m resolution. In addition, we combined a variety of features, which may help identify some small rural settlements. Therefore, our extraction results were greatly improved. In the Central Hills and Southern Mountain, compared to the results obtained by Gong et al. [16], our results were better. In the Central Hills, the omission phenomenon (Figure 7 C-Chuzhou) and mixed errors (Figure 7 C-Nanjing) existed, mainly due to the complex land cover types. Rural settlements in this region are relatively small, some of which even only contain several households, making it difficult to distinguish them from other features. In the Southern Mountain, Gong et al. [16] did not obtain very satisfactory results, which may be related to the use of the mask method [15]. This is likely to lead to the omission of low-density rural settlements. By contrast, our results showed a reliable effect, mainly attributed to the strong sensitivity of backscattering characteristics to man-made structures of SAR data and the nighttime data of VIIRS-DNB [57]. In summary, the transferability of the four trained models was satisfactory.

5.3. Future Directions

Our proposed method was demonstrated to be able to accurately extract rural settlements with different distribution characteristics in the Yangtze River Delta because of the contribution of multi-source features and the transferability of trained models. The distribution characteristics of rural settlements in the Yangtze River Delta cover almost all types of rural settlements in China. Therefore, with the data available globally and powerful computing power on GEE, we can transfer our trained model to accurately and efficiently extract rural settlements in other parts of China or even other regions of the world. Furthermore, inspired by the local climate zone classification scheme [62,63,64], our future work will also focus on extracting rural settlements in different climate zones with our framework. However, some challenges remain. First, some omissions and mixed classifications still exist in low-density rural settlement regions owing to the limited spatial resolution of medium-resolution imagery, especially in hilly areas. Therefore, our future work will pay more attention to scattered rural settlements. Second, some rural settlements in urban built-up areas, such as "Village in the City", a common phenomenon in China, may be ignored in our study. Recently, global urban boundaries from global artificial impervious area (GAIA) data, mapped by Li et al. [65], was applied to further separate rural settlements from urban areas. Higher-precision DEM data may also improve the results. Finally, rural settlement boundaries extracted in the present study are still vague. Recently, Qiu et al. [66] and Corbane et al. [67] introduced convolutional neural networks to map large-scale human settlements from Sentinel-2 images, both of which achieved satisfactory results. Based on these studies, our future research will consider introducing multi-source remote sensing information proposed in this study to a fully convolutional neural network model, making full use of both to further improve our results.

6. Conclusions

In this study, we proposed a framework for rural settlement mapping at 10 m spatial resolution using multi-source remote sensing datasets based on the GEE platform. We evaluated the importance of different input features by comparing their mapping results. The combination of all considered multi-source data, including Sentinel-1 SAR, Sentinel-2 MSI, VIIRS-DNB, and SRTM-DEM, achieved the best capability for rural settlement mapping. In addition, we selected training samples in one administrative area of each region to train the random forest model and transferred these to classify other areas in the respective region. Accuracy assessment and comparison of our results with published datasets showed that the proposed method was feasible and the transferability of the training model was satisfactory. Therefore, the framework developed herein can be potentially extended to map all of China or other regions of the world based on the GEE platform.
To the best of our knowledge, this is the first attempt to combine multi-source remote sensing data to extract rural settlements. Ten meter spatial resolution rural settlement mapping can play a key role in development planning and environmental assessment in rural areas in the Yangtze River Delta.

Author Contributions

Conceptualization, X.L. and H.J.; Methodology, H.J.; Software, H.J.; Validation, H.J. and X.W.; Data curation, W.L., and L.W.; Writing—original draft preparation, H.J. and X.L.; Writing—review and editing, X.L., L.Z. and L.W.; Visualization, H.J. and X.W.; Supervision, X.L. All authors have read and agreed to the published version of the manuscript.

Funding

This work was supported by National Natural Science Foundation of China under Grant (41701380), the Postgraduate Research and Practice Innovation Program of Jiangsu Province (KYCX20_2374, KYCX20_2369).

Acknowledgments

The authors show great thanks to the ESA for providing the Sentinel series data. We thank Google for the GEE platform, which provides an efficient and powerful computing platform. Special thanks are due to anonymous reviewers and editors for their valuable comments for the improvement of the manuscript.

Conflicts of Interest

The authors declare no conflict of interest.

References

  1. Meyer, W.B.; Turner, B. Human population growth and global land-use/cover change. Annu. Rev. Ecol. Evol. Syst. 1992, 23, 39–61. [Google Scholar] [CrossRef]
  2. Zhao, X.; Sun, H.; Chen, B.; Xia, X.; Li, P. China’s rural human settlements: Qualitative evaluation, quantitative analysis and policy implications. Ecol. Indic. 2018, 105, 398–405. [Google Scholar] [CrossRef]
  3. Liu, J.; Liu, Y.; Li, Y. Coupling analysis of rural residential land and rural population in China during 2007—2015. J. Nat. Resour. 2018, 33, 3–13, (In Chinese with English Abstract). [Google Scholar]
  4. Yang, R.; Xu, Q.; Long, H. Spatial distribution characteristics and optimized reconstruction analysis of China’s rural settlements during the process of rapid urbanization. J. Rural Stud. 2016, 47, 413–424. [Google Scholar] [CrossRef]
  5. Long, H.; Tu, S.; Ge, D.; Li, T.; Liu, Y. The allocation and management of critical resources in rural China under restructuring: Problems and prospects. J. Rural Stud. 2016, 47, 392–412. [Google Scholar] [CrossRef] [Green Version]
  6. Dong, G.; Xu, R.; Zhang, H. Comparative study on rural settlement of different rural development type in North China Plain. Chin. J. Agric. Resour. Reg. Plan. 2019, 40, 1–8, (In Chinese with English Abstract). [Google Scholar]
  7. Liu, Y.; Lu, S.; Chen, Y. Spatio-temporal change of urban–rural equalized development patterns in China and its driving factors. J. Rural Stud. 2013, 32, 320–330. [Google Scholar] [CrossRef]
  8. Tan, M.; Li, X. The changing settlements in rural areas under urban pressure in China: Patterns, driving forces and policy implications. Landsc. Urban Plan. 2013, 120, 170–177. [Google Scholar] [CrossRef]
  9. Wu, H.; Jiang, J.; Zhang, H.; Zhang, L.; Zhou, J. Application of ratio resident-area index to retrieve urban residential areas based on landsat TM Date. J. Nanjing Norm. Univ. 2006, 29, 118–121. (In Chinese) [Google Scholar]
  10. Chen, J.; Liu, Y.; Li, M.; Shen, C.; Cai, W. A new method of extracting residential areas based on remote sensing image. Geogr. Geo-Inf. Sci. 2010, 26, 72–75, (In Chinese with English Abstract). [Google Scholar]
  11. Zhong, P.; Wang, R. A multiple conditional random fields ensemble model for urban area detection in remote sensing optical images. IEEE Trans. Geosci. Remote Sens. 2007, 45, 3978–3988. [Google Scholar] [CrossRef]
  12. Tao, C.; Tan, Y.; Yu, J.; Tian, J. Urban area detection using multiple Kernel Learning and graph cut. In Proceedings of the International Geoscience and Remote Sensing Symposium, Valencia, Spain, 22–27 July 2018; pp. 83–86. [Google Scholar]
  13. Hoffmanhall, A.; Loboda, T.V.; Hall, J.V.; Carroll, M.L.; Chen, D. Mapping remote rural settlements at 30 m spatial resolution using geospatial data-fusion. Remote Sens. Environ. 2019, 233, 111386. [Google Scholar] [CrossRef]
  14. Li, T.; Zhu, X.; Pan, Y.; Liu, X.; Chen, S. A method for extracting rural residential land based on polarization scattering characteristics of POLSAR and normalized difference index of optical image. Remote Sens. Technol. Appl. 2016, 31, 157–164, (In Chinese with English Abstract). [Google Scholar]
  15. Li, X.; Gong, P. An “exclusion-inclusion” framework for extracting human settlements in rapidly developing regions of China from Landsat images. Remote Sens. Environ. 2016, 186, 286–296. [Google Scholar] [CrossRef]
  16. Gong, P.; Li, X.; Zhang, W. 40-Year (1978–2017) human settlement changes in China reflected by impervious surfaces from satellite remote sensing. Sci. Bull. 2019, 64, 756–763. [Google Scholar] [CrossRef] [Green Version]
  17. Conrad, C.; Rudloff, M.; Abdullaev, I.; Thiel, M.; Low, F.; Lamers, J.P.A. Measuring rural settlement expansion in Uzbekistan using remote sensing to support spatial planning. Appl. Geogr. 2015, 62, 29–43. [Google Scholar] [CrossRef]
  18. Wang, Z.; Yang, X. An edge-suppressed points voting method for extracting rural residential areas from high spatial resolution images. Remote Sens. Lett. 2017, 8, 380–388. [Google Scholar] [CrossRef]
  19. Fu, Z.; Liang, X. Residential land extraction from high spatial resolution optical images using multifeature hierarchical method. J. Appl. Remote Sens. 2019, 13, 026515. [Google Scholar] [CrossRef] [Green Version]
  20. Li, H.; Song, W.; Zhang, Y. Review of data preparation for rural settlement evolution research. Resour. Sci. 2019, 41, 689–700, (In Chinese with English Abstract). [Google Scholar]
  21. Li, X.; Gong, P.; Liang, L. A 30-year (1984–2013) record of annual urban dynamics of Beijing City derived from Landsat data. Remote Sens. Environ. 2015, 166, 78–90. [Google Scholar] [CrossRef]
  22. Mertes, C.M.; Schneider, A.; Sullamenashe, D.; Tatem, A.J.; Tan, B. Detecting change in urban areas at continental scales with MODIS data. Remote Sens. Environ. 2015, 158, 331–347. [Google Scholar] [CrossRef]
  23. Lu, D.; Tian, H.; Zhou, G.; Ge, H. Regional mapping of human settlements in southeastern China with multisensor remotely sensed data. Remote Sens. Environ. 2008, 112, 3668–3679. [Google Scholar] [CrossRef]
  24. Zhu, F.; Zhang, F.; Li, C.; Zhu, T. Functional transition of the rural settlement: Analysis of land-use differentiation in a transect of Beijing, China. Habitat Int. 2014, 41, 262–271. [Google Scholar] [CrossRef]
  25. Tian, G.; Qiao, Z.; Zhang, Y. The investigation of relationship between rural settlement density, size, spatial distribution and its geophysical parameters of China using Landsat TM images. Ecol. Model. 2012, 231, 25–36. [Google Scholar] [CrossRef]
  26. Gong, P.; Wang, J.; Yu, L.; Zhao, Y.; Zhao, Y.; Liang, L.; Niu, Z.; Huang, X.; Fu, H.; Liu, S.; et al. Finer resolution observation and monitoring of global land cover: First mapping results with Landsat TM and ETM+ data. Int. J. Remote Sens. 2013, 34, 2607–2654. [Google Scholar] [CrossRef] [Green Version]
  27. Zhao, Y.; Gong, P.; Yu, L.; Hu, L.; Li, X.; Li, C.; Zhang, H.; Zheng, Y.; Wang, J.; Zhao, Y. Towards a common validation sample set for global land-cover mapping. J. Remote Sens. 2014, 35, 4795–4814. [Google Scholar] [CrossRef]
  28. Zhu, Z.; Woodcock, C.E.; Rogan, J.; Kellndorfer, J. Assessment of spectral, polarimetric, temporal, and spatial dimensions for urban and peri-urban land cover classification using Landsat and SAR data. Remote Sens. Environ. 2012, 117, 72–82. [Google Scholar] [CrossRef]
  29. Xu, H.; Liu, C.; Wang, J.; Qi, S. Study on extraction of citrus orchard in Gannan region based on google earth engine platform. J. Geo-Inf. Sci. 2018, 20, 396–404, (In Chinese with English Abstract). [Google Scholar]
  30. Gorelick, N.; Hancher, M.; Dixon, M.; Ilyushchenko, S.; Thau, D.; Moore, R. Google Earth Engine: Planetary-scale geospatial analysis for everyone. Remote Sens. Environ. 2017, 202, 18–27. [Google Scholar] [CrossRef]
  31. Gong, P.; Li, X.; Wang, J.; Bai, Y.; Chen, B.; Hu, T.; Liu, X.; Xu, B.; Yang, J.; Zhang, W. Annual maps of global artificial impervious area (GAIA) between 1985 and 2018. Remote Sens. Environ. 2020, 236, 111510. [Google Scholar] [CrossRef]
  32. Pesaresi, M.; Huadong, G.; Blaes, X.; Ehrlich, D.; Ferri, S.; Gueguen, L.; Halkia, M.; Kauffmann, M.; Kemper, T.; Lu, L. A global human settlement layer from optical HR/VHR RS data: Concept and first results. IEEE J. Sel. Top. Appl. Earth Obs. Remote Sens. 2013, 6, 2102–2131. [Google Scholar] [CrossRef]
  33. Li, Q.; Qiu, C.; Ma, L.; Schmitt, M. Mapping the land cover of Africa at 10 m resolution from multi-source remote sensing data with Google Earth Engine. Remote Sens. 2020, 12, 602. [Google Scholar] [CrossRef] [Green Version]
  34. Xiong, J.; Thenkabail, P.S.; Gumma, M.K.; Teluguntla, P.; Poehnelt, J.; Congalton, R.G.; Yadav, K.; Thau, D. Automated cropland mapping of continental Africa using Google Earth Engine cloud computing. ISPRS J. Photogramm. Remote Sens. 2017, 126, 225–244. [Google Scholar] [CrossRef] [Green Version]
  35. Duan, Y.; Li, X.; Zhang, L.; Chen, D.; Liu, S.A.; Ji, H. Mapping national-scale aquaculture ponds based on the Google Earth Engine in the Chinese coastal zone. Aquaculture 2020, 520, 734666. [Google Scholar] [CrossRef]
  36. Cui, Y.; Liu, X.; Li, D.; Deng, Q.; Xu, J.; Shi, X.; Qin, Y. Urban spatial correlation characteristics and intrinsic mechanism in the Yangtze River Delta region. Acta Geogr. Sin. 2020, 75, 1301–1315, (In Chinese with English Abstract). [Google Scholar]
  37. Tan, H.; Chen, Y.; Wilson, J.P.; Zhang, J.; Cao, J.; Chu, T. An eigenvector spatial filtering based spatially varying coefficient model for PM2.5 concentration estimation: A case study in Yangtze River Delta region of China. Atmos. Environ. 2020, 223, 117205. [Google Scholar] [CrossRef]
  38. Ma, X.; Li, Q.; Shen, Y. Morphological difference and regional types of rural settlements in Jiangsu Province. Acta Geogr. Sin. 2012, 67, 516–525, (In Chinese with English Abstract). [Google Scholar]
  39. Conners, R.W.; Trivedi, M.M.; Harlow, C.A. Segmentation of a high resolution urban scene using texture operators. Graph. Models Graph. Models Image Process. Comput. Vis. Graph. Image Process. 1984, 25, 273–310. [Google Scholar] [CrossRef]
  40. Haralick, R.M.; Shanmugam, K.; Dinstein, I. Textural features for image classification. IEEE Trans. Syst. Man Cybern. 1973, 3, 610–621. [Google Scholar] [CrossRef] [Green Version]
  41. Zhang, H.; Zhang, Y.; Lin, H. Seasonal effects of impervious surface estimation in subtropical monsoon regions. Int. J. Digit. Earth 2014, 7, 746–760. [Google Scholar] [CrossRef]
  42. Farr, T.G.; Rosen, P.A.; Caro, E.; Crippen, R.; Duren, R.; Hensley, S.; Kobrick, M.; Paller, M.; Rodriguez, E.; Roth, L. The shuttle radar topography mission. Rev. Geophys. 2007, 45. [Google Scholar] [CrossRef] [Green Version]
  43. Millard, K.; Richardson, M. On the importance of training data sample selection in random forest image classification: A case study in peatland ecosystem mapping. Remote Sens. 2015, 7, 8489–8515. [Google Scholar] [CrossRef] [Green Version]
  44. Räsänen, A.; Kuitunen, M.; Tomppo, E.; Lensu, A. Coupling high-resolution satellite imagery with ALS-based canopy height model and digital elevation model in object-based boreal forest habitat type classification. ISPRS J. Photogramm. Remote Sens. 2014, 94, 169–182. [Google Scholar] [CrossRef] [Green Version]
  45. Weng, Q. Remote sensing of impervious surfaces in the urban areas: Requirements, methods, and trends. Remote Sens. Environ. 2012, 117, 34–49. [Google Scholar] [CrossRef]
  46. Zhang, Y.; Zhang, H.; Lin, H. Improving the impervious surface estimation with combined use of optical and SAR remote sensing images. Remote Sens. Environ. 2014, 141, 155–167. [Google Scholar] [CrossRef]
  47. Huete, A.; Didan, K.; Miura, T.; Rodriguez, E.P.; Gao, X.; Ferreira, L.G. Overview of the radiometric and biophysical performance of the MODIS vegetation indices. Remote Sens. Environ. 2002, 83, 195–213. [Google Scholar] [CrossRef]
  48. Xu, H. Modification of normalised difference water index (NDWI) to enhance open water features in remotely sensed imagery. Int. J. Remote Sens. 2006, 27, 3025–3033. [Google Scholar] [CrossRef]
  49. Zha, Y.; Gao, J.; Ni, S. Use of normalized difference built-up index in automatically mapping urban areas from TM imagery. Int. J. Remote Sens. 2003, 24, 583–594. [Google Scholar] [CrossRef]
  50. Liu, X. Using CART Algorithm Extract Residential from Landsat8 Images: Zhang Ye, Lin Ze Case Study; Lanzhou University: Lan Zhou, China, 2015; (In Chinese with English Abstract). [Google Scholar]
  51. Wang, F.; Ding, J.; Wu, M. Remote sensing monitoring models of soil salinization based on NDVI-SI feature space. Trans. Chin. Soc. Agric. Eng. 2010, 26, 168–173, (In Chinese with English Abstract). [Google Scholar]
  52. Zhang, Q.; Seto, K.C. Mapping urbanization dynamics at regional and global scales using multi-temporal DMSP/OLS nighttime light data. Remote Sens. Environ. 2011, 115, 2320–2329. [Google Scholar] [CrossRef]
  53. Breiman, L. Random Forests. Mach. Learn. 2001, 45, 5–32. [Google Scholar] [CrossRef] [Green Version]
  54. Gislason, P.O.; Benediktsson, J.A.; Sveinsson, J.R. Random Forests for land cover classification. Pattern Recognit. Lett. 2006, 27, 294–300. [Google Scholar] [CrossRef]
  55. Belgiu, M.; Drăguţ, L. Random forest in remote sensing: A review of applications and future directions. ISPRS J. Photogramm. Remote Sens. 2016, 114, 24–31. [Google Scholar] [CrossRef]
  56. Ma, L.; Fu, T.; Blaschke, T.; Li, M.; Tiede, D.; Zhou, Z.; Ma, X.; Chen, D. Evaluation of feature selection methods for object-based land cover mapping of unmanned aerial vehicle imagery using random forest and support vector machine classifiers. ISPRS Int. J. Geo-Inf. 2017, 6, 51. [Google Scholar] [CrossRef]
  57. Lin, Y.; Zhang, H.; Lin, H.; Gamba, P.; Liu, X. Incorporating synthetic aperture radar and optical images to investigate the annual dynamics of anthropogenic impervious surface at large scale. Remote Sens. Environ. 2020, 242, 111757. [Google Scholar] [CrossRef]
  58. Foody, G.M. Sample size determination for image classification accuracy assessment and comparison. Int. J. Remote Sens. 2009, 30, 5273–5291. [Google Scholar] [CrossRef]
  59. Melchiorri, M.; Florczyk, A.J.; Freire, S.; Schiavina, M.; Pesaresi, M.; Kemper, T. Unveiling 25 years of planetary urbanization with remote sensing: Perspectives from the global human settlement layer. Remote Sens. 2018, 10, 768. [Google Scholar] [CrossRef] [Green Version]
  60. Behnamian, A.; Millard, K.; Banks, S.N.; White, L.; Richardson, M.; Pasher, J. A Systematic approach for variable selection with random forests: achieving stable variable importance values. IEEE Geosci. Remote Sens. Lett. 2017, 14, 1988–1992. [Google Scholar] [CrossRef] [Green Version]
  61. Khatami, R.; Mountrakis, G.; Stehman, S.V. A meta-analysis of remote sensing research on supervised pixel-based land-cover image classification processes: General guidelines for practitioners and future research. Remote Sens. Environ. 2016, 177, 89–100. [Google Scholar] [CrossRef] [Green Version]
  62. Stewart, I.D.; Oke, T.R. Local Climate zones for urban temperature studies. Bull. Am. Meteorol. Soc. 2012, 93, 1879–1900. [Google Scholar] [CrossRef]
  63. Qiu, C.; Mou, L.; Schmitt, M.; Zhu, X.X. Local climate zone-based urban land cover classification from multi-seasonal Sentinel-2 images with a recurrent residual network. ISPRS J. Photogramm. Remote Sens. 2019, 154, 151–162. [Google Scholar] [CrossRef] [PubMed]
  64. Zhu, X.X.; Hu, J.; Qiu, C.; Shi, Y.; Kang, J.; Mou, L.; Bagheri, H.; Haberle, M.; Hua, Y.; Huang, R. So2Sat LCZ42: A Benchmark dataset for global local climate zones classification. IEEE Geosci. Remote Sens. Mag. 2020, arXiv:1912.12171. [Google Scholar] [CrossRef] [Green Version]
  65. Li, X.; Gong, P.; Zhou, Y.; Wang, J.; Bai, Y.; Chen, B.; Hu, T.; Xiao, Y.; Xu, B.; Yang, J.; et al. Mapping global urban boundaries from the global artificial impervious area (GAIA) data. Environ. Res. Lett. 2020. [Google Scholar] [CrossRef]
  66. Qiu, C.; Schmitt, M.; Geis, C.; Chen, T.K.; Zhu, X.X. A framework for large-scale mapping of human settlement extent from Sentinel-2 images via fully convolutional neural networks. ISPRS J. Photogramm. Remote Sens. 2020, 163, 152–170. [Google Scholar] [CrossRef]
  67. Corbane, C.; Syrris, V.; Sabo, F.; Politis, P.; Melchiorri, M.; Pesaresi, M.; Soille, P.; Kemper, T. Convolutional neural networks for global human settlements mapping from Sentinel-2 satellite imagery. arXiv 2020, arXiv:abs/2006.03267. [Google Scholar]
Figure 1. Location and topographic map of the study area.
Remotesensing 12 02832 g001
Figure 2. Flowchart of the proposed framework.
Remotesensing 12 02832 g002
Figure 3. Divisions of the study area and distribution of training samples. Training samples in (a) Xuzhou, Northern Plains; (b) Shanghai, East Coast; (c) Hefei, Central Hills; and (d) Hangzhou, Southern Mountain.
Remotesensing 12 02832 g003
Figure 4. Impacts of different numbers of trees on the out of bag (OOB) error and the Kappa coefficient in the four trained random forest classifiers in four training municipal districts. N-Xuzhou, E-Shanghai, C-Hefei, and S-Hangzhou represent Xuzhou in Northern Plain, Shanghai in East Coast, Hefei in Central Hills, and Hangzhou in Southern Mountain, respectively.
Remotesensing 12 02832 g004
Figure 5. User’s accuracy (UA), producer’s accuracy (PA), overall accuracy (OA), and Kappa coefficient of four input configurations in four training municipal districts. With more features added, higher accuracy was achieved.
Remotesensing 12 02832 g005
Figure 6. Importance of the input features derived from the random forest model using the training samples in four training municipal districts. N-Xuzhou, E-Shanghai, C-Hefei, and S-Hangzhou represent Xuzhou in Northern Plains, Shanghai in East Coast, Hefei in Central Hills, and Hangzhou in Southern Mountain, respectively.
Remotesensing 12 02832 g006
Figure 7. Spatial distribution of rural settlements in the Yangtze River Delta. N-Xuzhou, E-Shanghai, E-Yancheng, C-Hefei, and S-Hangzhou represent Xuzhou in Northern Plains, Shanghai in East Coast, Yancheng in East Coast, Hefei in Central Hills, and Hangzhou in Southern Mountain, respectively. The five subplots demonstrate the representative rural settlements of the municipal district.
Remotesensing 12 02832 g007
Figure 8. Area and proportion of rural settlement at different levels. (a) Municipal district level, (b) Region level.
Remotesensing 12 02832 g008
Figure 9. Distribution of validation points in four regions.
Remotesensing 12 02832 g009
Figure 10. Comparisons between our rural settlement product (the 2nd column), human settlements in China developed by Gong et al. (2019) [16] (the 3rd column), and the GHSL products developed by Melchiorri M et al. (2018) [59] (the 4th column) for eight cities. N, E, C, and S represent the Northern Plain, East Coast, Central Hills, and Southern Mountain, respectively. The yellow and blue boxes indicate the errors of commission and omission, respectively.
Remotesensing 12 02832 g010
Table 1. List of the Sentinel-1 Synthetic Aperture Radar (SAR), Sentinel-2 MultiSpectral Instrument (MSI), Visible Infrared Imaging Radiometer Suite supporting a Day-Night Band (VIIRS-DNB) and Shuttle Radar Topography Mission-Digital Elevation Model (SRTM-DEM) data used.
Data TypeProductResolutionDateScenes
Sentinel-1 SARSentinel-1 SAR GRD: C-band Synthetic Aperture Radar Ground Range Detected, log scaling10 m1 January 2019–31 December 20191025
Sentinel-2 MSISentinel-2 MSI: MultiSpectral Instrument, Level-1C10 m1 January 2019–31 May 2019526
VIIRS-DNBVIIRS Nighttime Day/Night Band Composites Version 115 arc seconds1 January 2019–31 December 201912
SRTM-DEMSRTM Digital Elevation Data 30m1 arc second11 February 2000–22 February 20001
Table 2. Features selected for the extraction of rural settlement. B1, B2, B3, B4, B8, B11, B12 refers to the numbering system used by the Sentinel 2 Science Mission (e.g., B4 is the Red Sentinel 2 band, B8 is the Near Infrared Red Sentinel 2 band). i is the earliest scene and j is the last image acquired in a given Sentinel 2 acquisition time. p(i,j) denotes the (i,j)th entry in a gray-tone spatial-dependence matrix, Ng represents the distinct gray levels of the images.
NumberFeaturesEquationReference
1NDVImax NDVI = B 8 , i B 4 , i B 8 , i + B 4 , i
NDVI max = max   ( NDVI i j )
[23,47]
2MNDWI MNDWI = B 3 B 11 B 3 + B 11 [48]
3NDBI NDBI = B 11 B 8 B 11 + B B [49]
4NBI NBI = B 4 * B 11 / B 8 [10]
5BOBI BOBI = B 1 + B 2 + B 8 B 11 + B 12 [50]
6RRI RRI = B 2 / B 8 [9]
7SI SI = B 2 * B 4 [51]
8VV [46]
9VH
10, 11Dissimilarity of
VV and VH
f D I S S = k = 0 N g 1 k p x y ( k )
12, 13Variance of
VV and VH
f V A R = i j ( i u ) 2 p i , j
14, 15Entropy of
VV and VH
f E N T = i j p i , j log ( p ( i , j ) )
16NTLVANUI = (1-NDVI)*NTL[52]
17VANUI
18Elevation [42]
19Slope
Table 3. Error matrix for the two classes of RSET (rural settlement) and Non-RSET (including vegetation, water, urban land, and other lands) in the four study regions.
Northern Plains Reference
RSETNon-RSETUA
ClassifiedRSET99200.83
Non-RSET116540.98
PA 0.900.97
OA 0.96
Kappa 0.84
East Coast Reference
RSETNon-RSETUA
ClassifiedRSET104170.86
Non-RSET136500.97
PA 0.890.98
OA 0.96
Kappa 0.85
Central Hills Reference
RSETNon-RSETUA
ClassifiedRSET47130.78
Non-RSET64620.99
PA 0.890.97
OA 0.96
Kappa 0.81
Southern Mountain Reference
RSETNon-RSETUA
ClassifiedRSET920.78
Non-RSET32220.99
PA 0.750.99
OA 0.98
Kappa 0.77
Note: UA, user’s accuracy; PA, producer’s accuracy; and OA, overall accuracy.
Table 4. Confusion matrix of optical (O) and multi-source (MS) results in Shanghai and Hangzhou.
ShanghaiReference
ClassifiedOpticalVegWatRSETUrbOtd
Veg290050
Wat038030
RS303540
Urb232300
Oth005436
ClassifiedMultisourceVegWatRSETUrbOth
Veg340000
Wat041000
RS103911
Urb100360
Oth012339
HangzhouReference
ClassifiedOpticalVegWatRSETUrbOth
Veg360031
Wat140030
RS002392
Urb511291
Oth104529
ClassifiedMultisourceVegWatRSETUrbOth
Veg380002
Wat142100
RS003400
Urb102340
Oth400035
Note: Veg, vegetation; Wat, water; RSET, rural settlement; Urb, urban; and Oth, other.

