Article

Rapid Determination of Nutrient Concentrations in Hass Avocado Fruit by Vis/NIR Hyperspectral Imaging of Flesh or Skin

by
Wiebke Kämper
1,2,*,
Stephen J. Trueman
1,2,
Iman Tahmasbian
3 and
Shahla Hosseini Bai
1
1
Environmental Futures Research Institute, School of Environment and Science, Griffith University, Nathan, QLD 4111, Australia
2
Genecology Research Centre, University of the Sunshine Coast, Maroochydore DC, QLD 4558, Australia
3
Department of Agriculture and Fisheries, Queensland Government, Toowoomba, QLD 4350, Australia
*
Author to whom correspondence should be addressed.
Remote Sens. 2020, 12(20), 3409; https://0-doi-org.brum.beds.ac.uk/10.3390/rs12203409
Submission received: 26 August 2020 / Revised: 2 October 2020 / Accepted: 14 October 2020 / Published: 17 October 2020

Abstract

:
Fatty acid composition and mineral nutrient concentrations can affect the nutritional and postharvest properties of fruit and so assessing the chemistry of fresh produce is important for guaranteeing consistent quality throughout the value chain. Current laboratory methods for assessing fruit quality are time-consuming and often destructive. Non-destructive technologies are emerging that predict fruit quality and can minimise postharvest losses, but it may be difficult to develop such technologies for fruit with thick skin. This study aimed to develop laboratory-based hyperspectral imaging methods (400–1000 nm) for predicting proportions of six fatty acids, ratios of saturated and unsaturated fatty acids, and the concentrations of 14 mineral nutrients in Hass avocado fruit from 219 flesh and 194 skin images. Partial least squares regression (PLSR) models predicted the ratio of unsaturated to saturated fatty acids in avocado fruit from both flesh images (R2 = 0.79, ratio of prediction to deviation (RPD) = 2.06) and skin images (R2 = 0.62, RPD = 1.48). The best-fit models predicted parameters that affect postharvest processing such as the ratio of oleic:linoleic acid from flesh images (R2 = 0.67, RPD = 1.63) and the concentrations of boron (B) and calcium (Ca) from flesh images (B: R2 = 0.61, RPD = 1.51; Ca: R2 = 0.53, RPD = 1.71) and skin images (B: R2 = 0.60, RPD = 1.55; Ca: R2 = 0.68, RPD = 1.57). Many quality parameters predicted from flesh images could also be predicted from skin images. Hyperspectral imaging represents a promising tool to reduce postharvest losses of avocado fruit by determining internal fruit quality of individual fruit quickly from flesh or skin images.

Graphical Abstract

1. Introduction

Techniques that evaluate the internal quality of fruit and vegetables can help to maintain product quality and minimise economic losses during postharvest storage and handling [1,2]. Current methods for measuring internal quality parameters such as fatty acid composition and nutrient levels are often destructive, expensive, time-consuming, and require precise sample preparation [3,4]. Hyperspectral imaging is a rapidly developing technology for fast and non-destructive measurements that possesses advantages over conventional spectroscopy [5,6,7,8]. Homogenisation of the sample is not necessary because, in contrast to other sensory methods such as visible near-infrared (VNIR) spectroscopy, hyperspectral imaging can scan the entire sample and, thus, account for sample heterogeneity [7]. Hyperspectral imaging also generates a set of images within narrow spectral-wavelength bands, providing both spectral and spatial information about an object [7,8]. Spectral information is then averaged across spatial dimensions, increasing the prediction accuracy and reproducibility compared with VNIR spectroscopy, which relies on single points [7,8,9].
Fruit internal quality, including fatty acid profile and mineral nutrient composition, plays an important role in the postharvest properties of avocado and so determining internal quality is important for processors and retailers [10,11]. However, nutritional parameters of avocado fruit may vary among cultivars, maturity levels, soil types, climates, altitudes, and locations in the tree canopy [12,13,14,15]. Developing a tool that assesses the quality of individual fruit is important because, for example, avocado fruit that are high in calcium (Ca) or low in nitrogen (N) and boron (B) ripen more slowly and have prolonged shelf life [12]. Both B and Ca are important for cell wall rigidity [16,17]. Fruit that are high in Ca also have reduced respiration and ethylene production rates [18]. Fruit with a high oleic to linoleic acid ratio also have prolonged shelf life [19,20] because polyunsaturated fatty acids such as linoleic acid have reduced oxidative stability [21,22,23]. Rapid and non-destructive tools for predicting the nutritional composition of individual fruit could help to predict avocado postharvest properties. These tools could assist processors or retailers to sort fruit into homogeneous classes, thereby minimising postharvest losses [24].
Nutrient levels also have important implications for human health if levels of key shortfall nutrients vary among individual fruit. Avocado fruit are rich in monounsaturated fatty acids such as oleic acid and palmitoleic acid (~70%), dietary fibre, vitamins K and E, and the mineral nutrients, potassium and magnesium [25,26,27]. Consumption of avocado fruit has been linked to improved blood lipid profiles, with lower LDL-cholesterol and triglycerides and increased HDL-cholesterol [28,29,30]. Rapid assessment of internal quality could allow wholesalers or retailers to grade avocado fruit into quality classes regardless of the external fruit appearance. Rapid assessment could also, in future, allow consumers to select high-quality fruit without frequently touching the fruit if the hyperspectral imaging technology can be adapted to handheld devices [31,32].
Fruit that possess a thick skin, such as avocado, present challenges for the development of non-destructive technologies [4,33]. Spectral radiation needs to penetrate through the skin to enable deep-penetration reading of internal fruit quality [4]. Studies on mango and apple found that skin images can be used to predict internal damage [34,35]. In avocado, non-destructive technologies have been used to predict oil content, dry matter percentage, and fruit quality changes throughout storage from skin images [4,33,36,37]. However, non-destructive technologies have not been used to predict fatty acid profile or mineral nutrient composition. In this study, we determined to what extent fatty acid composition and mineral nutrient concentrations of Hass avocado fruit can be predicted using hyperspectral imaging of the flesh. Furthermore, we determined how feasible it is to use non-destructive skin images instead of flesh images to make these predictions. We identified wavelengths that were associated with the predictive ability of the model for each fatty acid or nutrient. The results could have important economic and health implications for postharvest avocado processing and human dietary consumption.

2. Materials and Methods

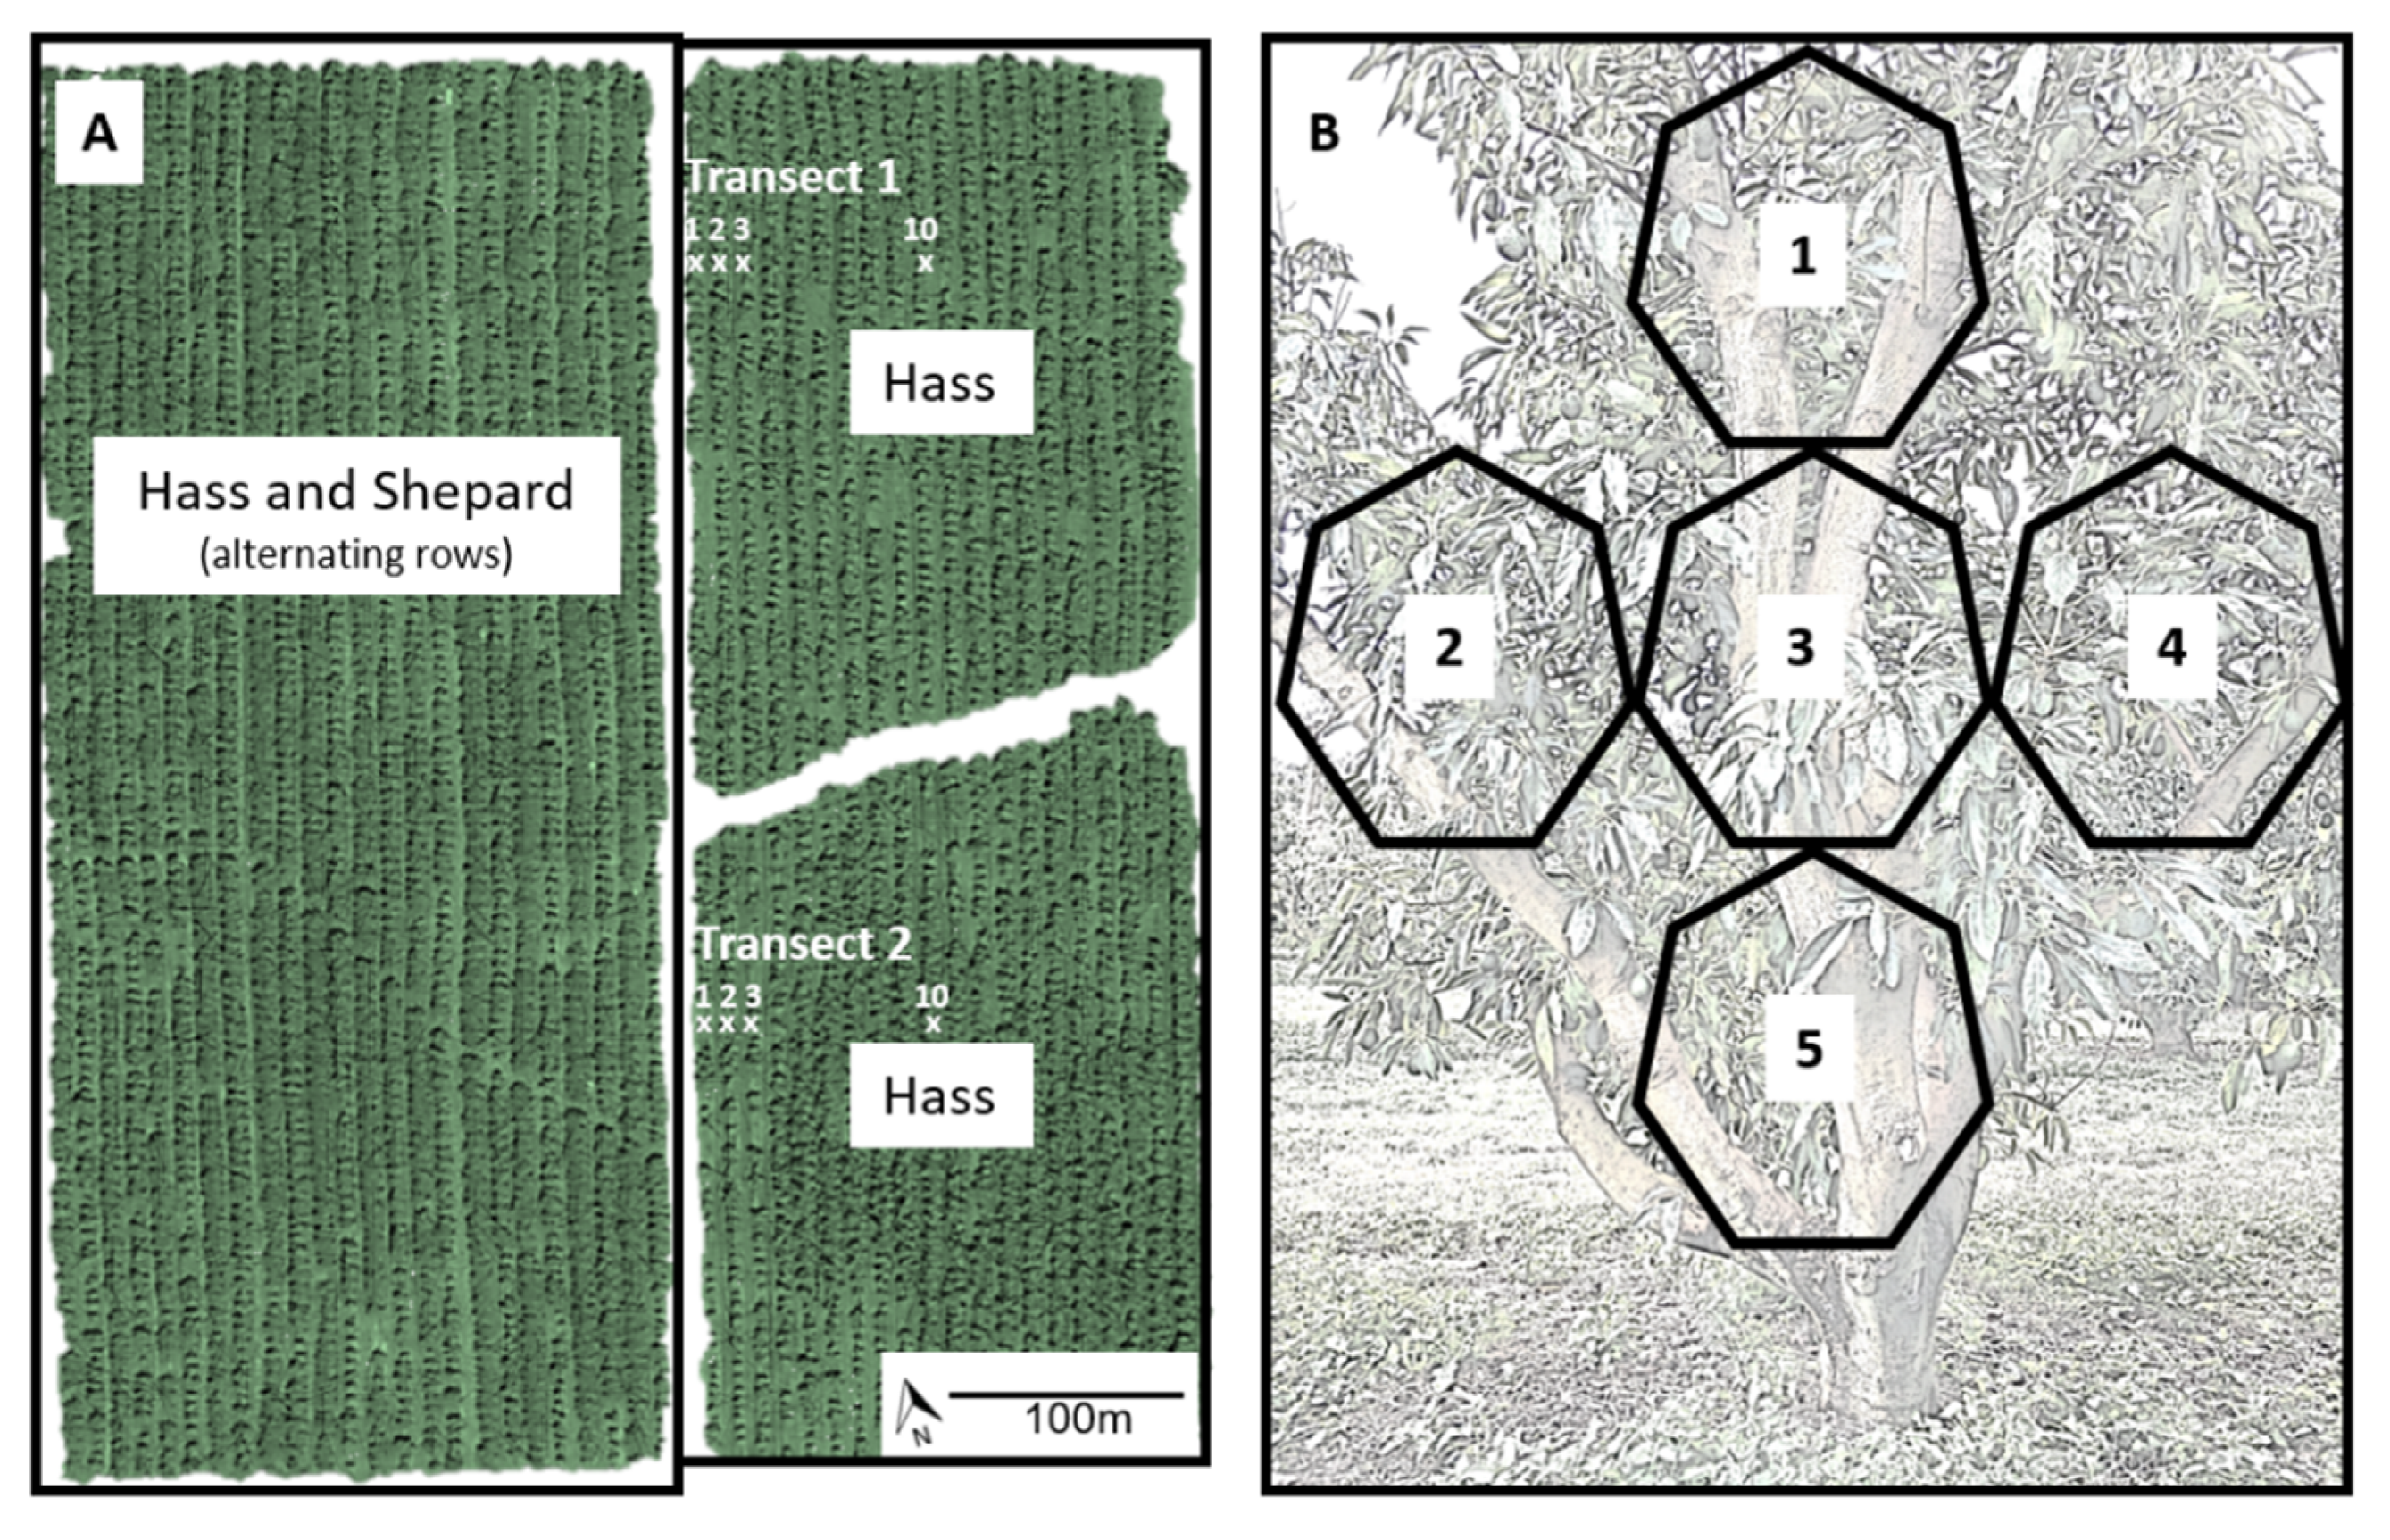
2.1. Site Description

Hass avocado fruit were harvested during dry weather in 2018 from the canopies of trees in two commercial orchards near Childers, Queensland, Australia (25°13′32″S 152°17′53″E and 25°08′17″S 152°22′40″E). The soil at both orchards (orchards 1 and 2) was red clay-loam. The closest weather station (Bundaberg) has recorded average daily temperatures of 22.3–30.4 °C (July–January) and average total rainfall of 1004.5 mm per year (Bureau of Meteorology 2020). The average maximum daily temperature recorded during the study (April and May 2018) was 27.2 °C, the average minimum daily temperature was 16.3 °C, and total rainfall for April and May 2018 was 36 mm (Bureau of Meteorology 2020).

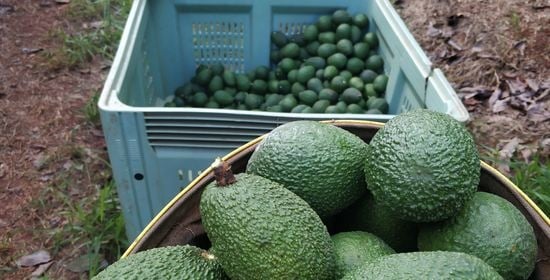
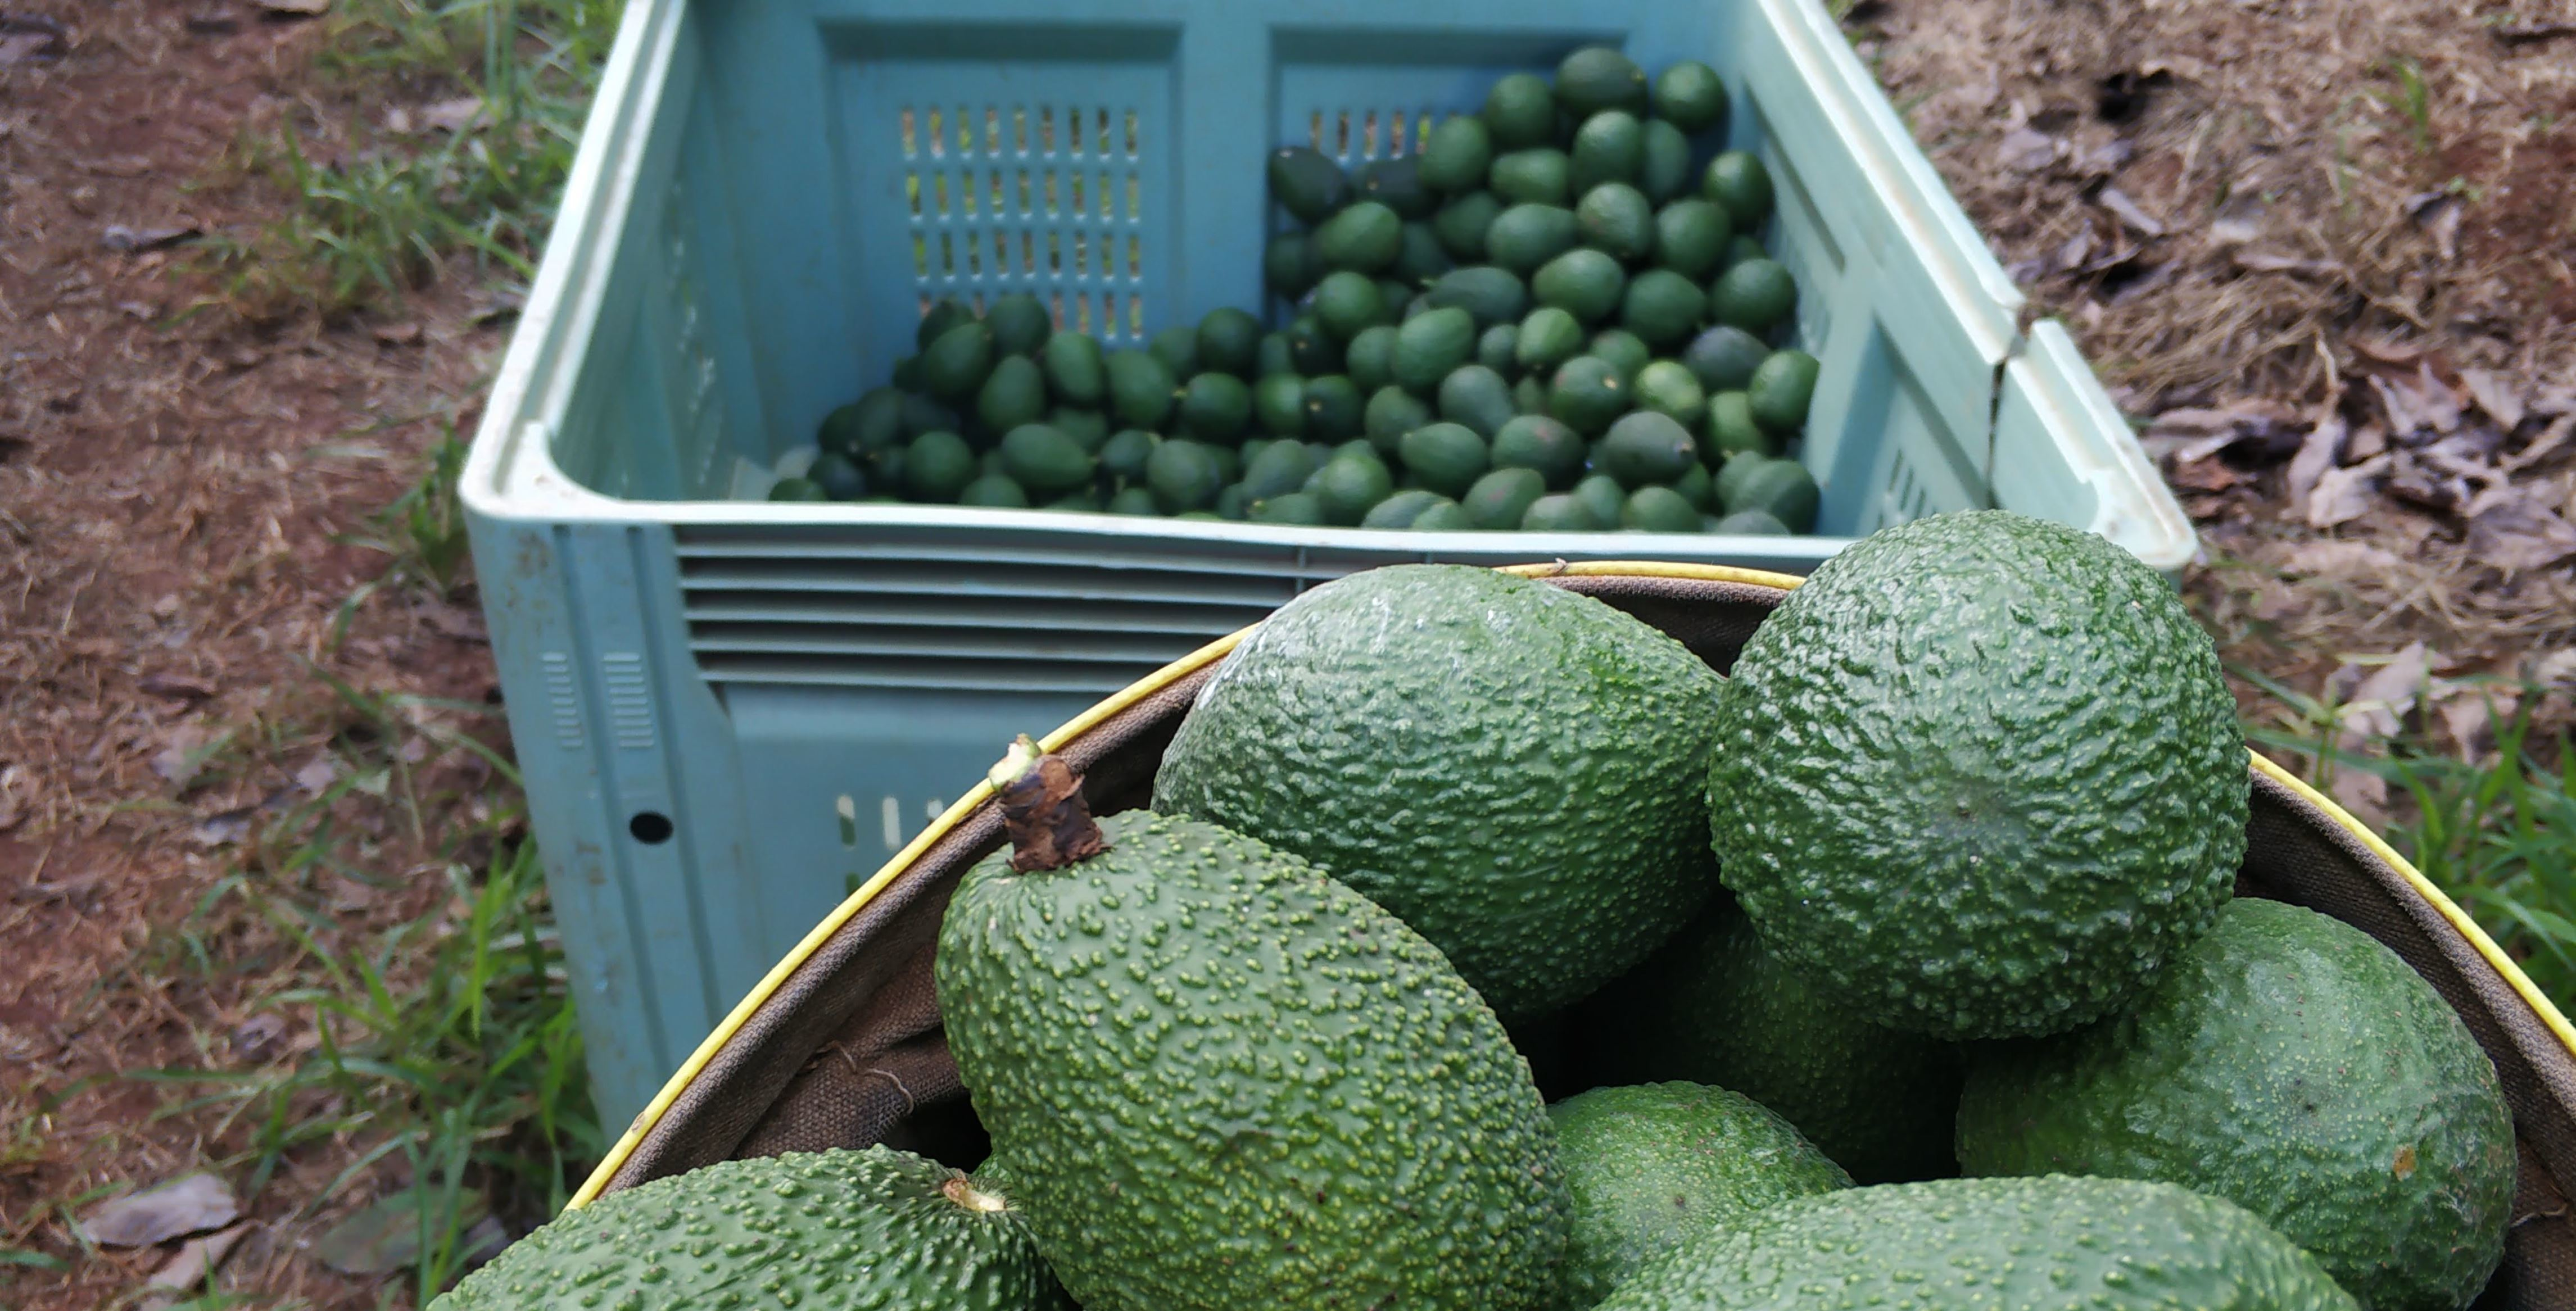
2.2. Sample Collection and Preparation

A total of 400 mature Hass fruit were collected from 40 trees. Orchard 1 contained blocks of avocado cultivars Hass and Shepard that were each 26 rows wide, with the trees being 13 years old. Orchard 2 contained blocks of avocado cultivars Hass, Shepard, Lamb Hass, and Wurtz that were 6–22 rows wide, with the trees being 18–21 years old. Hass fruit were collected from two transects in orchard 1 and eight transects in orchard 2. A transect consisted of four trees, starting at a tree bordering another cultivar (row 1) and then proceeding perpendicularly from the other cultivar to trees in rows 2, 3, and the middle row of the block (Figure 1A). Ten fruit were collected in a stratified design from each tree, with each tree divided into five sectors on the side of the tree that faced the neighbouring cultivar (Figure 1B). Two fruit were sampled per sector, one from the inside and one from the outside of the canopy, on either 18 April or 9/10 May 2018, depending on the orchard. Six fruit per tree were selected randomly for further analyses. General maturity of the fruit at either orchard was determined by measuring the percentage dry matter of some fruit within the same block used for sample collection. Fruit were kept in the shade until moved to a cold room (4 °C). Fruit collected in the morning arrived at the cold room on the afternoon of the collection day, and fruit collected in the afternoon arrived at the cold room by midday of the following day. The recommended storage temperature for Hass fruit is 4–6 °C [38,39]. Fruit were stored in the cold room for 10 or 20 d, before being moved to room temperature (21 °C) to allow the onset of ripening. Fruit were ripe after 10.6 ± 1.0 d (mean ± SE) at room temperature. Ripeness was confirmed by measuring skin and flesh firmness with a handheld sclerometer (8 mm head; Lutron Electronic Model: FR-5120, Coopersburg, PA). A fruit was considered ripe when the maximum force required to impress the sclerometer tip 1 mm deep was <15 N for the skin and <5 N for the flesh [11,40]. Flesh firmness was measured after removal of small patches of skin at two locations along the equator of the fruit, with the two measurements taken at 90° from each other. Each avocado was placed under the camera, and an image of the side of the ripe fruit with the skin intact was captured, before each fruit was cut vertically in half, and then an image of the flesh was captured. Subsamples of the flesh were collected immediately after imaging to measure the: (i) relative contribution of six fatty acids to the total fatty acid composition; (ii) ratios of saturated and unsaturated fatty acids; and (iii) concentrations of 14 mineral nutrients.

2.3. Imaging System and Spectral Profile Extraction

Images were captured with a laboratory-based 12-bit line scanner camera (Pika XC2, Bozeman, MT) with a lens with 23 mm focal length and four current-controlled wide-spectrum quartz-halogen lights. The camera had a spectral resolution of ~1.3 nm and captured 462 wavelengths between ~400 and 1000 nm. The samples were positioned on a black tray on a translation stage, the exposure time was adjusted to 19.4 ms, and the translation stage moved at 1.23 mm s−1. Image acquisition and data extraction were conducted using Spectronon Pro software (Version 2.112; Resonon, Bozeman, MT, USA). The mean raw reflectance of each image was extracted by marking a region of interest (ROI) for each skin and flesh image. The ROI for skin images contained the skin of one side of the fruit excluding the area in the centre of the fruit where reflection was very intense, whereas the ROI for flesh images contained all the flesh surrounding the seed. We then calculated the mean corrected relative reflectance (R) from the raw spectral reflectance, R0, within Spectronon as shown in Equation (1):
R = ( R 0 D ) ( W D )
where D is the reflectance of a dark image (camera lens covered) and W is the reflectance of a white Teflon sheet that reflects ~99% of incident light [5]. This corrects for the spectral curve of the fruit surface. The 100% reflectivity was scaled to 10,000 (integers) by default. The mean corrected relative reflectance was used for model development. The fruit half that contained the seed was stored at −18 °C until further processing.

2.4. Determination of Fatty Acid Composition

Approximately 40 g of flesh was taken from each fruit and the protocol described by Bai et al. [23] was used to extract oil. In brief, the flesh was mashed finely before 30 mL of pentane was added. The mixture was transferred into a round-bottom flask after 15 min of stirring, and pentane was evaporated from the oil using an air-tight vacuum rotator for 10 min. The extracted oil was stored in glass vials at 4 °C. One microlitre of the extracted oil was taken and 0.7 mL of anhydrous methanol dibutylhydroxytoluene solution and 25 µL of 32% HCl was added. The mixture was incubated for 20 h at 65 °C before 0.5 mL of deionised water and 0.5 mL of n-hexane was added. The mixture was shaken for 30 s before it was rinsed again with 0.5 mL deionised water. The top layer of the mixture was collected and Na2SO4 was added to remove water from the oil in hexane. Fatty acid composition was determined by gas chromatography–mass spectrometry. Peak areas were used to calculate the relative proportions of each fatty acid in the sample. Fatty acids that accounted consistently for less than 0.3% of the fatty acid composition were excluded.

2.5. Determination of Mineral Nutrient Concentrations

Mineral nutrient concentrations of each fruit were assessed using a subsample that contained conical pieces of flesh from two locations, near the apex and along the equator of each fruit. Total nitrogen (N) and total carbon (C) concentrations were determined by combustion analysis (TruSpec®, LECO Corporation, St. Joseph, MI) [41,42]. Aluminium (Al), boron (B), calcium (Ca), copper (Cu), iron (Fe), magnesium (Mg), manganese (Mn), sodium (Na), phosphorus (P), potassium (K), sulphur (S) and zinc (Zn) concentrations were determined by inductively coupled plasma–atomic emission spectroscopy (Vista Pro®, Varian Incorporation, Palo Alto, CA) [43,44,45]. Mineral nutrient concentrations of flesh and skin were measured from an additional 25 samples to explore whether individual nutrient concentrations were correlated between flesh and skin, and to understand how skin reflectance could potentially predict flesh nutrient concentrations. The skin samples comprised the skin that was removed above the two locations, near the apex and along the equator of each fruit, where the conical flesh samples were taken.

2.6. Model Development

Damaged, sunburnt or otherwise unfit fruit were removed from the data set, leaving 219 flesh images and 194 skin images. Reflectance data from these flesh and skin images were each divided into calibration sets and test sets (Table 1 and Table 2), with approximately 75% of samples being assigned to the calibration sets and the remaining 25% being assigned to the external test sets [46]. Spectral outliers in the samples, if any, were detected using a Hotelling’s T2 test (with 95% level of confidence) and removed from the data set [47]. Spectral pre-treatments such as Savitzky–Golay first-, second- and third-order derivatives, standard normal variate (SNV), orthogonal signal correction (OSC) and multiplicative scatter correction (MSC) were performed on calibration data to remove the influence of undesired effects including light scattering, baseline shifts, random noise, and uncontrolled external factors [48,49]. We then developed partial least squares regression (PLSR) models using both the raw and transformed data to correlate the proportions of six fatty acids, the ratios of unsaturated to saturated and oleic to linoleic fatty acids, and the mineral nutrient concentrations (C, N, Al, B, Ca, Cu, Fe, K, Mg, Mn, Na, P, S and Zn) to relative reflectances measured in the full spectral range of 400–1000 nm [50]. PLSR is the preferred method for datasets having highly correlated independent variables and when the number of samples is smaller than the number of variables. A leave-one-out (full) cross-validation method was used to evaluate the best performance of the model and avoid over-fitting [51,52]. We reduced the number of spectral wavelengths stepwise, after finding the best transformation for the data set, by removing wavelengths with the lowest β-coefficients [53]. We continued removing wavelengths with low β-coefficients until the model fit decreased. Removing wavelengths can increase the model accuracy by improving computation of the model [9,54]. The best fitted models were selected by choosing the models with the highest coefficient of determination (R2cal) and the lowest root mean squares error in the calibration sets (RMSEc) and in the cross-validation sets (R2val and RMSEv). The R2 and RMSE were defined as shown in Equations (2) and (3), respectively [55].
R 2 = 1 i = 1 n ( y i y ^ i ) 2 i = 1 n ( y i y ¯ ) 2
RMSE = i = 1 n ( y ^ i y i ) 2 / n
where yi and ŷi were the reference and predicted values in the ith sample, respectively, ȳ was the mean value of each reference value, and n was the number of samples.
The prediction ability of the final models was tested using the test set. We then calculated the ratio of prediction to deviation (RPD) to evaluate the prediction ability of the model as shown in Equation (4):
RPD = SD Test RMSE Test
where SDTest is the standard deviation of the observed values, and RMSETest is the root square error of the prediction from the test set (t). More details on the PLSR specifics and calculations are provided by Tahmasbian et al. [53,56]. Transformations, outlier detection and removal, and all parts of the model development were performed with Unscrambler software (Version: 10.5.1; CAMO, Oslo, Norway).

3. Results

3.1. Reflectance

Reflectance from flesh samples was higher than from skin samples, and the spectral patterns of flesh and skin images differed greatly at wavelengths between 400 and 650 nm (Figure 2). Reflectance from flesh samples dropped at wavelengths around 675 nm (Figure 2).

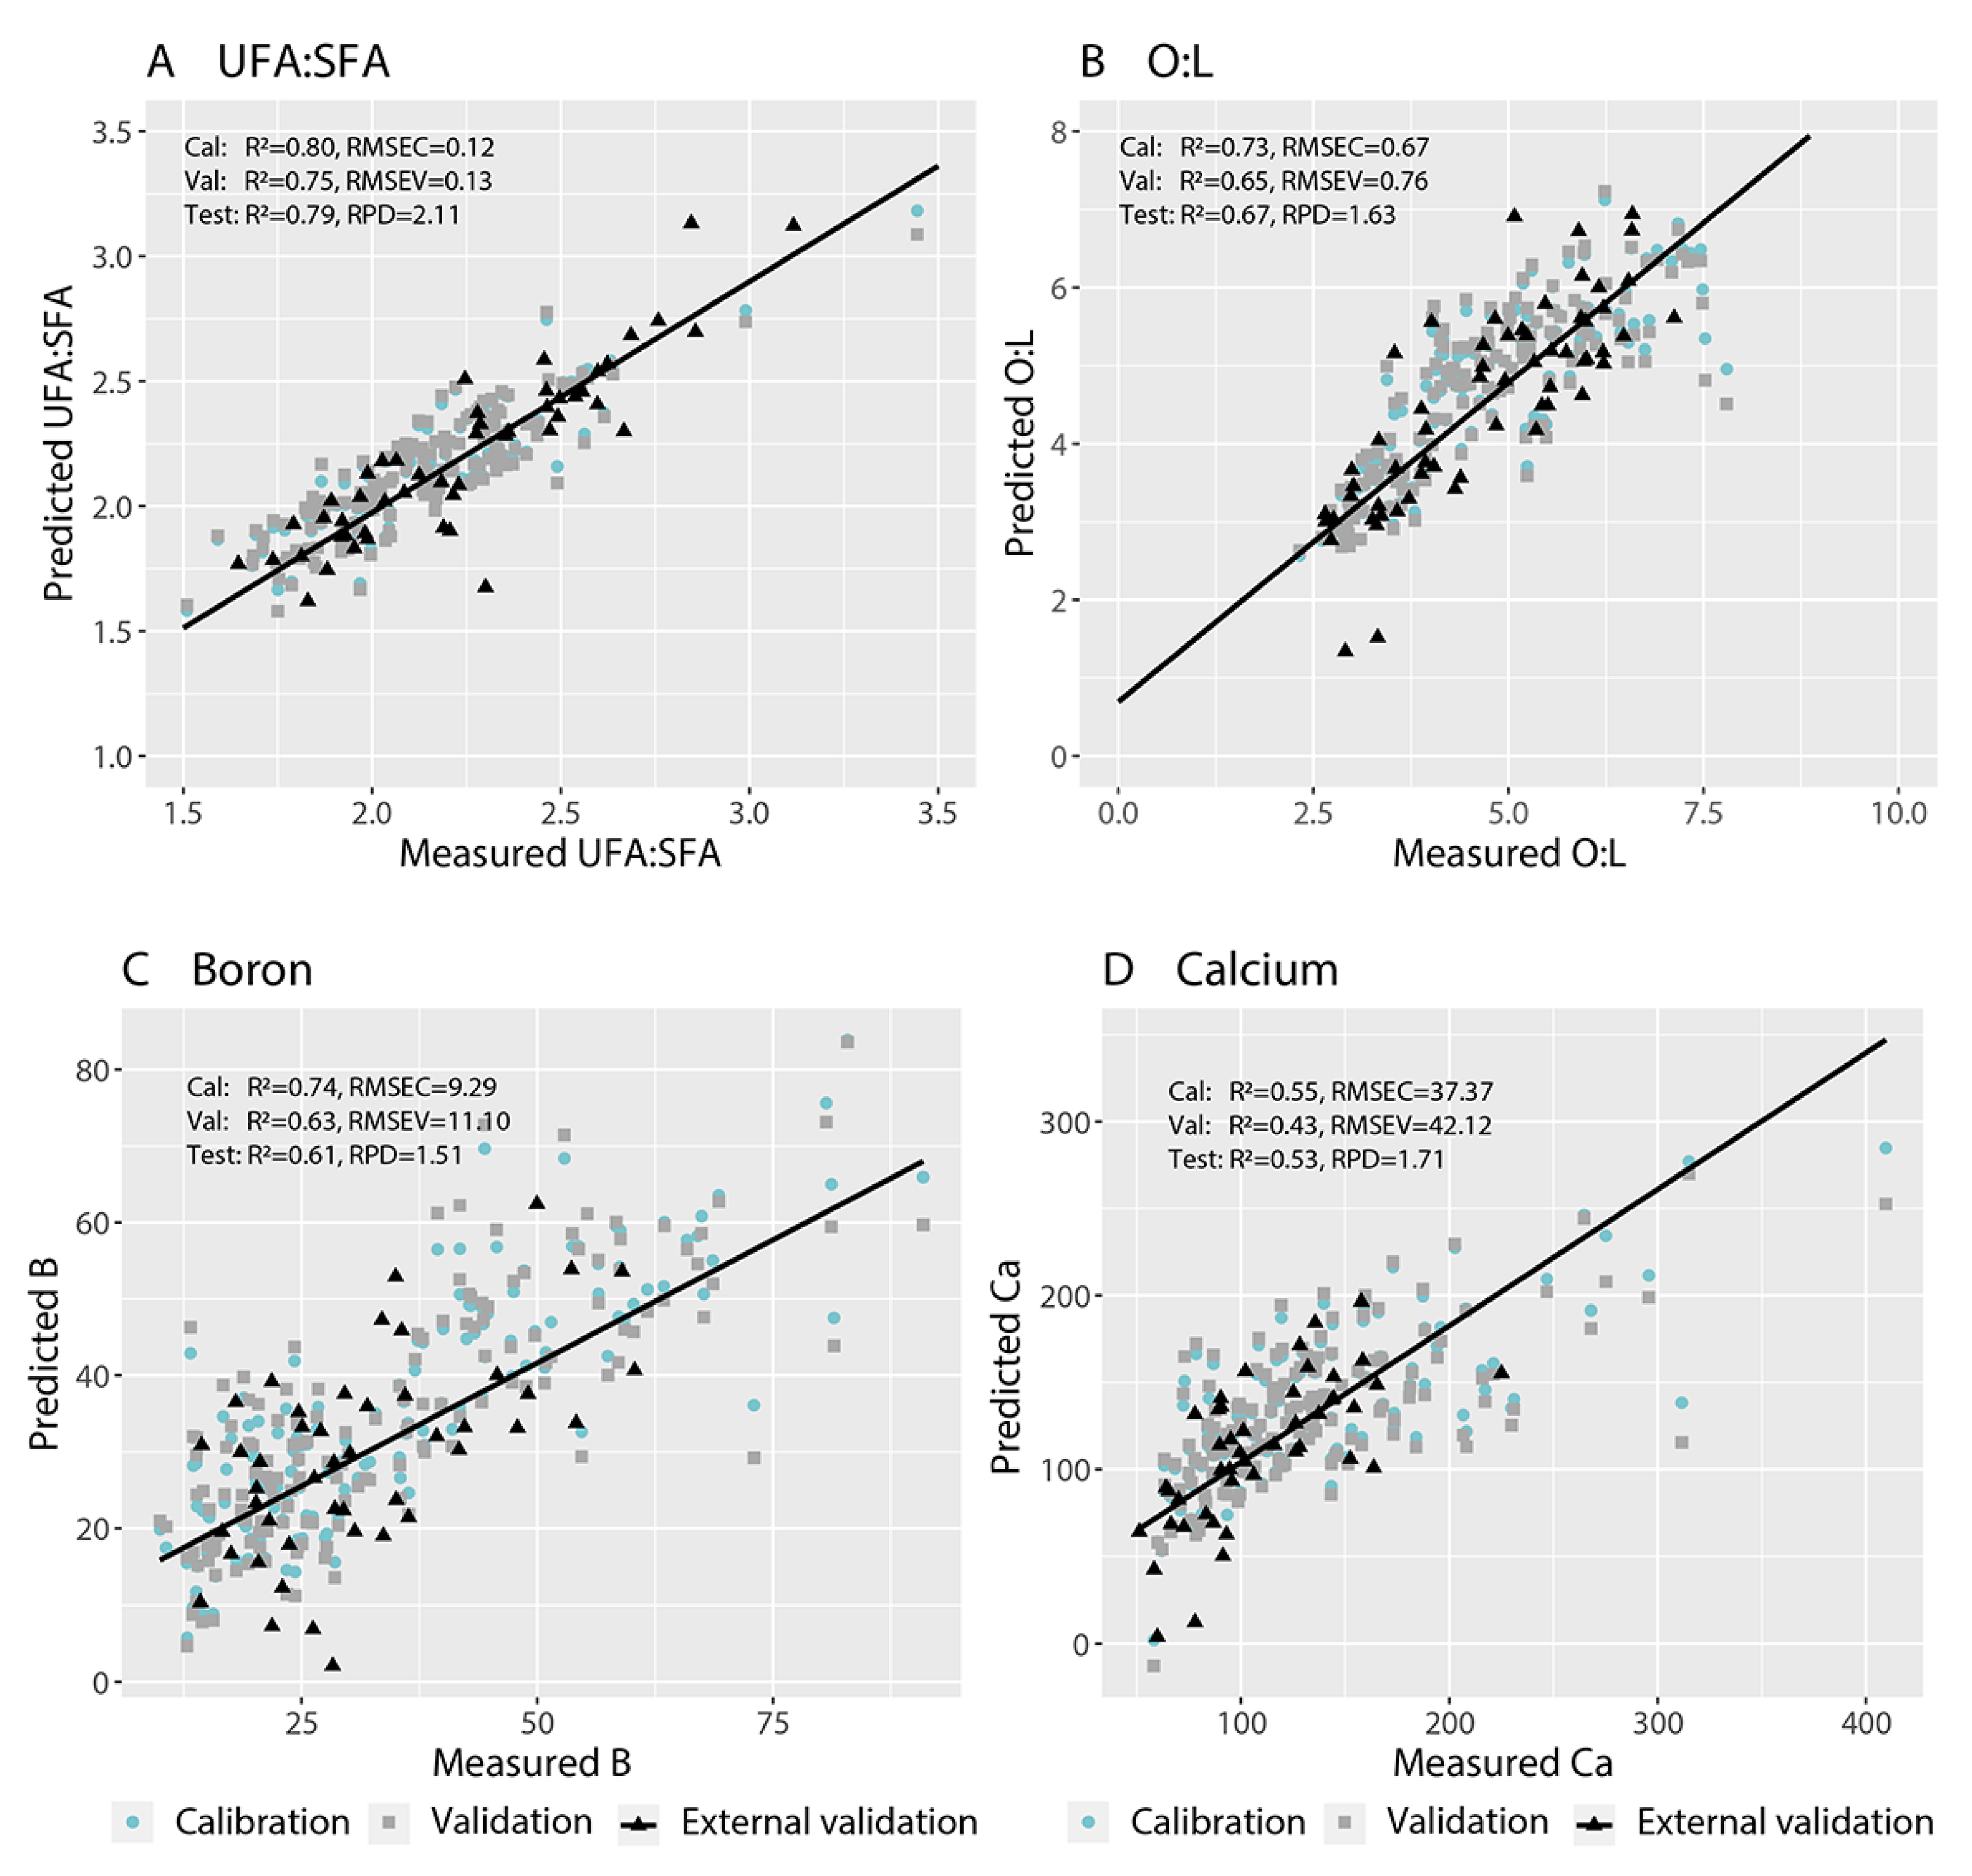
3.2. Predicting the Proportions of Fatty Acids and Concentrations of Nutrients from Flesh Images

We fit PLSR models that predicted with RPD ≥ 1.4 the proportions of palmitic acid (C16:0), palmitoleic acid (C16:1 cis) and linoleic acid (C18:2) in fruit flesh from images of the flesh (Table 3). Models with RPD values above 1.4 provide good predictions and models with RPD values above 2.0 provide excellent predictions [57]. We also fit PLSR models that predicted the ratios of unsaturated to saturated fatty acids (UFA:SFA) and oleic to linoleic acid (O:L) with RPD ≥ 1.4. The best-fit PLSR models for UFA:SFA provided R2cal = 0.80 and RMSEC = 0.12, and R2val = 0.75 and RMSEV = 0.13, in the cross-validation (Table 3; Figure 3A,B). The best-fit PLSR models for O:L provided R2cal = 0.73 and RMSEC = 0.67, and R2val = 0.65 and RMSEV = 0.76, in the cross-validation (Table 3; Figure 3B). These models for UFA:SFA and O:L provided prediction abilities for the test set of R2 = 0.79 and RPD = 2.11, and R2 = 0.67 and RPD = 1.63, respectively (Table 3; Figure 3A,B). Both final models incorporated wavelength reduction (Table 3). The most important wavelengths were between 750 and 840 nm and above 930 nm for the UFA:SFA ratio, and between 550 and 660 nm and above 930 nm for the O:L ratio (Figure 4A,B). We could not fit models to predict the proportions of stearic acid (C18:0), elaidic acid (C18:1 trans) and oleic acid (C18:1 cis) with RPD ≥ 1.4. Oleic acid accounted for approximately 40% of the fatty acids whereas elaidic acid and stearic acid together accounted for only 8% of the fatty acids (Table 1).
We fit PLSR models that predicted the concentrations of mineral nutrients including C, Al, B, Ca, Cu, Fe, K, Mg, P, S and Zn with RPD ≥ 1.4 (11 out of 14 elements) (Table 3). The best-fit PLSR models for B provided R2cal = 0.74 and RMSEC = 9.29, and R2val = 0.63 and RMSEV = 11.10, in the cross-validation (Table 3; Figure 3C). The best-fit PLSR models for Ca provided R2cal = 0.55 and RMSEC = 37.37, and R2val = 0.43 and RMSEV = 42.12, in the cross-validation (Table 3; Figure 3D). The models for B and Ca provided acceptable prediction abilities for the external test set of R2 = 0.61 and RPD = 1.51 and R2 = 0.53 and RPD = 1.71, respectively (Table 3). The R2 of the external test set for Ca was only 0.53 but, considering that the RMSETest was 35.58 and the data range was 42.48 to 409.51 mg kg−1, the prediction was acceptable with low accuracy, particularly when comparing samples with low vs. with high Ca concentrations. Both final models required no wavelength reduction (Table 3). The most important wavelengths were around 600 and 770 nm and above 960 nm for B concentration (Figure 4C) and around 550, 640, 660 and 930 nm for Ca concentration (Figure 4D). We could not develop models that predicted the concentrations of N, Mn or Na with RPD ≥ 1.4 (Table 3).

3.3. Predicting the Proportions of Fatty Acids and Concentrations of Nutrients from Skin Images

We fit PLSR models that predicted with RPD ≥ 1.4 the proportions of palmitic acid (C16:0) and linoleic acid (C18:2) in fruit flesh from images of the skin (Table 4). We also fit a PLSR model that predicted the ratio of UFA:SFA with RPD ≥ 1.4 (Table 4; Figure 5A). This model provided R2cal = 0.69 and RMSEC = 0.17, and R2val = 0.64 and RMSEV = 0.18, in the cross-validation (Table 4; Figure 5A). The model provided acceptable prediction abilities for the external test set, with R2 = 0.62 and RPD = 1.48. This model incorporated wavelength reduction. The most important wavelengths were around 400 nm, between 700 and 750 nm, and above 930 nm for the ratio of UFA:SFA (Figure 4A). We could not develop models that predicted the proportions of palmitoleic acid (C16:1 cis), stearic acid (C18:0), elaidic acid (C18:1 trans) or oleic acid (C18:1 cis), or the O:L ratio, with RPD ≥ 1.4 from images of the skin.
We fit PLSR models that predicted with RPD ≥ 1.4 the concentrations of B, Ca, Fe, K, Mg, S and Zn in the flesh from images of the skin (Table 4). The best-fit PLSR models for B provided R2cal = 0.70 and RMSEC = 9.96, and R2val = 0.48 and RMSEV = 13.11, in the cross-validation (Table 4; Figure 5C). The best-fit PLSR models for Ca provided R2cal = 0.61 and RMSEC = 39.78, and R2val = 0.61 and RMSEV = 40.44, in the cross-validation (Table 4; Figure 5D). The models provided acceptable prediction abilities for the external test set with R2 = 0.60 and RPD = 1.55 for B and R2 = 0.68 and RPD = 1.57 for Ca (Table 4). Both final models required no wavelength reduction (Table 4). The most important wavelengths were around 400, 700, 760 and above 940 nm for B concentration and around 750 nm for Ca concentration (Figure 4C,D). We could not develop models to predict with RPD ≥ 1.4 the concentrations of C, N, Al, Cu, Mn, Na or P of avocado flesh using images of the skin (Table 4).

3.4. Relationship between Mineral Nutrient Concentrations of the Flesh and the Skin

Flesh quality parameters predicted from flesh images could often be predicted from skin images (Table 3 and Table 4) but, for some parameters, the prediction abilities from skin images were too weak, with RPD < 1.4 (Table 4). The concentrations of six out of 14 mineral nutrients were correlated between flesh and skin samples (Table 5). Five of these nutrients (B, Ca, Mg, Mn, Na) had similar prediction abilities from flesh and skin images (Table 3 and Table 4). However, we were only able to fit a PLSR model with RPD ≥ 1.4 for P concentration from images of the flesh but not the skin.

4. Discussion

Hyperspectral imaging successfully predicted some fatty acid composition and mineral nutrient concentrations of Hass avocado fruit. Predictions were possible using both flesh and skin images, allowing for rapid and, in the case of skin images, non-destructive quality assessments. The predictive ability of the models was associated with specific wavelengths. Hyperspectral imaging represents a promising tool for estimating parameters that influence the postharvest and nutritional properties of avocado fruit.
Hyperspectral imaging was a useful tool for predicting fatty acid composition, including palmitic, palmitoleic and linoleic acid abundance and unsaturated to saturated fatty acid (UFA:SFA) and oleic to linoleic acid (O:L) ratios, from either flesh or skin images, or both. Hyperspectral imaging could also be used to estimate the concentrations of many mineral nutrients, including C, Al, B, Ca, Cu, Fe, K, Mg, P, S and Zn. Imaging has been used to predict maturity and percentage dry matter of avocado [4], but has not been used previously to predict fatty acid profile or mineral nutrient composition in avocado.
Most internal quality parameters of avocado fruit that could be predicted from flesh images could also be predicted from skin images. These included palmitic acid and linoleic acid abundance, the ratio of unsaturated to saturated fatty acids (UFA:SFA), and the concentrations of many mineral nutrients, including B, Ca, Fe, K, Mg, S and Zn. Hyperspectral imaging is, therefore, a promising tool for non-destructively predicting internal fruit quality. Mineral nutrients do not absorb light in the Vis/NIR region and so Vis/NIR spectroscopy cannot detect minerals directly [7]. Models must detect minerals and their concentrations indirectly, for example through organic complexes the minerals bind to [7,58]. Indirect predictions are commonly used, especially for minerals [7,59,60]. In contrast, oil content and fatty acid composition can be assessed directly because molecular bonds such as O–H and C–H cause reflectance [61,62]. The concentrations of six mineral nutrients (B, Ca, Mg, Mn, Na, P) were correlated between flesh and skin samples whereas the concentrations of four mineral nutrients (Fe, K, S, Zn) were not correlated between flesh and skin samples, despite developing acceptable models using both flesh and skin images. Internal quality prediction might have been possible from skin images if light penetrated deeply through the skin and into the flesh. We did not measure light penetration in our samples. However, some short wavelengths around 400 nm had high β-coefficients in the models that used avocado skin images to predict UFA:SFA or B concentration. Shorter wavelengths penetrate more deeply than longer wavelengths into biological samples [63].
We identified specific wavelengths important for predicting fatty acid composition and mineral nutrient concentration. The wavelengths with the highest β-coefficients, thus contributing most to the predictive ability of the models, were between 970 and 1000 nm for UFA:SFA and O:L from either flesh or skin images. Reflectance in the 950–1000 nm region in other crops has been associated with prominent molecular bonds such as O–H and C–H in fatty acids [61,64]. High β-coefficients at 580, 590, 780 and 960 nm were important in predicting Ca concentrations from flesh images and high β-coefficients around 650, 700 and 760 nm were important in predicting Ca concentrations from skin images. Spectral patterns and wavelengths associated with alkaline earth metals such as Ca and Mg have been identified from canarium nuts, okra leaves, and soil samples, with high β-coefficients at 570–650, 770–790 and 860–1000 nm [8,65,66]. We found high β-coefficients at 690 and 930 nm when predicting B concentrations from either flesh or skin images. Similar spectral regions are also important in predicting B levels in whole-plant legume samples [60]. Inorganic materials such as Ca or B may not be spectrally active, but prediction is possible when inorganic materials bind with molecules, often organic complexes, that have covalent bonds such as N–H, S–H, O–H, C–H, C–O or C=C [7,58]. Therefore, B and Ca concentrations can still be predicted indirectly using hyperspectral imaging.
Hyperspectral imaging successfully predicted parameters that affect avocado postharvest processing. A high ratio of oleic to linoleic acid or high Ca concentration slows ripening, and prolongs shelf-life, while a high B concentration accelerates ripening and, thus, shortens shelf-life [12,19]. Up to 25% of avocado fruit in developed countries and up to 50% of avocado fruit in developing countries are lost during postharvest processing [67,68]. Market flexibility could be increased and waste reduced if shelf life of individual fruit could be estimated rapidly and non-destructively, allowing fruit to be sorted into homogeneous postharvest classes. Hyperspectral imaging also successfully predicted the ratio of unsaturated to saturated acid from both flesh and skin images. This ratio has important implications for human health because a diet rich in unsaturated fatty acids decreases LDL-cholesterol levels and other cardiovascular risk factors [27,69,70].

5. Conclusions

Our study has shown that hyperspectral imaging of avocado flesh and skin is a useful tool for predicting internal fruit quality. Flesh images could be used to predict palmitic, palmitoleic and linoleic acid abundance, unsaturated to saturated fatty acid (UFA:SFA) and oleic to linoleic acid (O:L) ratios, and the concentrations of C, Al, B, Ca, Cu, Fe, K, Mg, P, S and Zn. Most of these internal fruit parameters can also be assessed by imaging the skin, which allows non-destructive assessment of internal quality. Non-destructive assessment of, for example, Ca through hyperspectral imaging thus represents a promising tool for predicting quality parameters that influence the postharvest and nutritional properties of avocado fruit. Predicting postharvest properties of individual fruit such as shelf life has the potential to help reduce food waste by allowing fruit to be sorted into homogenous classes. This study also provided a proof of concept for potential use of hyperspectral imaging in fruit and vegetables with thick skin (e.g., citrus). Nonetheless, new methods such as alternative machine learning algorithms should be investigated in future studies, as they may hold the potential to improve prediction accuracy of developed models.

Author Contributions

Conceptualization, W.K., S.H.B. and S.J.T.; methodology, W.K., I.T.; software, W.K., I.T.; validation, W.K., I.T., S.H.B.; formal analysis, W.K.; investigation, W.K.; resources, S.H.B.; data curation, W.K.; writing—original draft preparation, W.K.; writing—review and editing, W.K., S.H.B., S.J.T., I.T.; visualization, W.K.; supervision, S.H.B., S.J.T.; project administration, W.K., S.H.B.; funding acquisition, S.J.T. All authors have read and agreed to the published version of the manuscript.

Funding

This research was funded by Project PH16001 of the Hort Frontiers Pollination Fund, part of the Hort Frontiers strategic partnership initiative developed by Hort Innovation, with co-investment from Griffith University, University of the Sunshine Coast, Plant and Food Research Ltd. and contributions from the Australian Government.

Acknowledgments

We thank Simpson Farms and Costa Farms for assistance and access to their orchards. We thank Peter Brooks and Tsvakai Gama for laboratory advice and assistance.

Conflicts of Interest

The authors declare no conflict of interest. The funders approved publication of the results but had no role in the design of the study; in the collection, analyses, or interpretation of data; or in the writing of the manuscript.

References

  1. Le Lagadec, D.; Campbell, T.; Hofman, P. Development and Commercial Application of an Avocado Fruit Robustness Test; Horticulture Australia Limited: Sydney, Australia, 2010. [Google Scholar]
  2. Patel, K.K.; Kar, A.; Jha, S.N.; Khan, M.A. Machine vision system: A tool for quality inspection of food and agricultural products. J. Food Sci. Technol. 2012, 49, 123–141. [Google Scholar] [CrossRef] [Green Version]
  3. Arpaia, M.L.; Boreham, D.; Hofshi, R. Development of a new method for measuring minimum maturity of avocados. Calif. Avocado Soc. Yearb. 2001, 85, 153–178. [Google Scholar]
  4. Magwaza, L.S.; Tesfay, S.Z. A review of destructive and non-destructive methods for determining avocado fruit maturity. Food Bioprocess. Technol. 2015, 8, 1995–2011. [Google Scholar] [CrossRef]
  5. Ariana, D.P.; Lu, R.; Guyer, D.E. Near-infrared hyperspectral reflectance imaging for detection of bruises on pickling cucumbers. Comput. Electron. Agric. 2006, 53, 60–70. [Google Scholar] [CrossRef]
  6. ElMasry, G.; Wang, N.; ElSayed, A.; Ngadi, M. Hyperspectral imaging for nondestructive determination of some quality attributes for strawberry. J. Food Eng. 2007, 81, 98–107. [Google Scholar] [CrossRef]
  7. Manley, M. Near-infrared spectroscopy and hyperspectral imaging: Non-destructive analysis of biological materials. Chem. Soc. Rev. 2014, 43, 8200–8214. [Google Scholar] [CrossRef] [Green Version]
  8. Bai, S.H.; Tahmasbian, I.; Zhou, J.; Nevenimo, T.; Hannet, G.; Walton, D.; Randall, B.; Gama, T.; Wallace, H.M. A non-destructive determination of peroxide values, total nitrogen and mineral nutrients in an edible tree nut using hyperspectral imaging. Comput. Electron. Agric. 2018, 151, 492–500. [Google Scholar] [CrossRef]
  9. Tahmasbian, I.; Xu, Z.; Boyd, S.; Zhou, J.; Esmaeilani, R.; Che, R.; Bai, S.H. Laboratory-based hyperspectral image analysis for predicting soil carbon, nitrogen and their isotopic compositions. Geoderma 2018, 330, 254–263. [Google Scholar] [CrossRef]
  10. Cutting, J.G.M.; Wolstenholme, B.N. Maturity and water loss effects on avocado (Persea americana Mill.) postharvest physiology in cool environments. J. Hortic. Sci. 1992, 67, 569–575. [Google Scholar] [CrossRef]
  11. Hofman, P.J.; Bower, J.; Woolf, A. Harvesting, packing, postharvest technology, transport and processing. In The Avocado: Botany, Production and Uses; Schaffer, B., Wolstenholme, B.N., Whiley, A.W., Eds.; CABI: Oxfordshire, UK, 2013; pp. 489–540. [Google Scholar]
  12. Witney, G.W.; Hofman, P.J.; Wolstenholme, B.N. Effect of cultivar, tree vigour and fruit position on calcium accumulation in avocado fruits. Sci. Hortic. 1990, 44, 269–278. [Google Scholar] [CrossRef] [Green Version]
  13. Alcobendas, R.; Mirás-Avalos, J.M.; Alarcón, J.J.; Nicolás, E. Effects of irrigation and fruit position on size, colour, firmness and sugar contents of fruits in a mid-late maturing peach cultivar. Sci. Hortic. 2013, 164, 340–347. [Google Scholar] [CrossRef]
  14. Trad, M.; Gaaliche, B.; Renard, C.M.G.C.; Mars, M. Inter- and intra-tree variability in quality of figs. Influence of altitude, leaf area and fruit position in the canopy. Sci. Hortic. 2013, 162, 49–54. [Google Scholar] [CrossRef] [Green Version]
  15. Carvalho, C.P.; Bernal, E.; Velásquez, M.A.; Cartagena, V.; Régulo, J. Fatty acid content of avocados (Persea americana Mill. cv. Hass) in relation to orchard altitude and fruit maturity stage. Agron. Colomb. 2015, 33, 220–227. [Google Scholar] [CrossRef]
  16. Hu, H.; Brown, P.H.; Labavitch, J.M. Species variability in boron requirement is correlated with cell wall pectin. J. Exp. Bot. 1996, 47, 227–232. [Google Scholar] [CrossRef]
  17. Matoh, T.; Kobayashi, M. Boron and calcium, essential inorganic constituents of pectic polysaccharides in higher plant cell walls. J. Plant Res. 1998, 111, 179–190. [Google Scholar] [CrossRef]
  18. Eaks, I.L. Effect of calcium on ripening, respiratory rate, ethylene production, and quality of avocado fruit. J. Am. Soc. Hortic. Sci. 1985, 110, 145–148. [Google Scholar]
  19. Kochhar, S.P.; Henry, C.J.K. Oxidative stability and shelf-life evaluation of selected culinary oils. Int. J. Food Sci. Nutr. 2009, 60, 289–296. [Google Scholar] [CrossRef] [PubMed]
  20. Pedreschi, R.; Muñoz, P.; Robledo, P.; Becerra, C.; Defilippi, B.G.; van Eekelen, H.; Mumm, R.; Westra, E.; de Vos, R.C.H. Metabolomics analysis of postharvest ripening heterogeneity of ‘Hass’ avocadoes. Postharvest Biol. Technol. 2014, 92, 172–179. [Google Scholar] [CrossRef]
  21. Amaral, J.S.; Casal, S.; Pereira, J.A.; Seabra, R.M.; Oliveira, B.P.P. Determination of sterol and fatty acid compositions, oxidative stability, and nutritional value of six walnut (Juglans regia L.) cultivars grown in Portugal. J. Agric. Food Chem. 2003, 51, 7698–7702. [Google Scholar] [CrossRef] [PubMed] [Green Version]
  22. Buranasompob, A.; Tang, J.; Powers, J.R.; Reyes, J.; Clark, S.; Swanson, B.G. Lipoxygenase activity in walnuts and almonds. LWT Food Sci. Technol. 2007, 40, 893–899. [Google Scholar] [CrossRef]
  23. Bai, S.H.; Brooks, P.; Gama, R.; Nevenimo, T.; Hannet, G.; Hannet, D.; Randall, B.; Walton, D.; Grant, E.; Wallace, H.M. Nutritional quality of almond, canarium, cashew and pistachio and their oil photooxidative stability. J. Food Sci. Technol. 2019, 56, 792–798. [Google Scholar] [CrossRef]
  24. Kader, A.A. Fruit maturity, ripening, and quality relationships. Acta Hortic. 1999, 485, 203–208. [Google Scholar] [CrossRef]
  25. Fulgoni, V.L.; Dreher, M.; Davenport, A.J. Avocado consumption is associated with better diet quality and nutrient intake, and lower metabolic syndrome risk in US adults: Results from the National Health and Nutrition Examination Survey (NHANES) 2001–2008. Nutr. J. 2013, 12, 1. [Google Scholar] [CrossRef] [Green Version]
  26. Duarte, P.F.; Chaves, M.A.; Borges, C.D.; Mendonça, C.R.B. Avocado: Characteristics, health benefits and uses. Cienc. Rural 2016, 46, 747–754. [Google Scholar] [CrossRef] [Green Version]
  27. Araújo, R.G.; Rodriguez-Jasso, R.M.; Ruiz, H.A.; Pintado, M.M.E.; Aguilar, C.N. Avocado by-products: Nutritional and functional properties. Trends Food Sci. Technol. 2018, 80, 51–60. [Google Scholar] [CrossRef]
  28. Lerman-Garber, I.; Ichazo-Cerro, S.; Zamora-González, J.; Cardoso-Saldaña, G.; Posadas-Romero, C. Effect of a high-monounsaturated fat diet enriched with avocado in NIDDM patients. Diabetes Care 1994, 17, 311–315. [Google Scholar] [CrossRef] [PubMed]
  29. López, L.R.; Frati, M.A.C.; Hernández, D.B.C.; Cervantes, M.S.; Hernández, L.M.H.; Juárez, C.; Morán, L.S. Monounsaturated fatty acid (avocado) rich diet for mild hypercholesterolemia. Arch. Med. Res. 1996, 27, 519–523. [Google Scholar]
  30. Carranza-Madrigal, J.; Herrera-Abarca, J.E.; Alvizouri-Muñoz, M.; Alvarado-Jimenez, M.d.R.; Chavez-Carbajal, F. Effects of a vegetarian diet vs. a vegetarian diet enriched with avocado in hypercholesterolemic patients. Arch. Med. Res. 1997, 28, 537–541. [Google Scholar]
  31. Singh, H.; Sridhar, A.; Saini, S.S. Ultra-low-cost self-referencing multispectral detector for non-destructive measurement of fruit quality. Food Anal. Methods 2020, 13, 1879–1893. [Google Scholar] [CrossRef]
  32. Wang, Z.; Koirala, A.; Walsh, K.; Anderson, N.; Verma, B. In Field Fruit Sizing Using A Smart Phone Application. Sensors 2018, 18, 3331. [Google Scholar] [CrossRef] [Green Version]
  33. Arendse, E.; Fawole, O.A.; Magwaza, L.S.; Opara, U.L. Non-destructive prediction of internal and external quality attributes of fruit with thick rind: A review. J. Food Eng. 2018, 217, 11–23. [Google Scholar] [CrossRef]
  34. ElMasry, G.; Wang, N.; Vigneault, C. Detecting chilling injury in Red Delicious apple using hyperspectral imaging and neural networks. Postharvest Biol. Technol. 2009, 52, 1–8. [Google Scholar] [CrossRef]
  35. Vélez Rivera, N.; Gómez-Sanchis, J.; Chanona-Pérez, J.; Carrasco, J.J.; Millán-Giraldo, M.; Lorente, D.; Cubero, S.; Blasco, J. Early detection of mechanical damage in mango using NIR hyperspectral images and machine learning. Biosyst. Eng. 2014, 122, 91–98. [Google Scholar] [CrossRef]
  36. Maftoonazad, N.; Karimi, Y.; Ramaswamy, H.; Prasher, S. Artificial neural network modeling of hyperspectral radiometric data for quality changes associated with avocados during storage. J. Food Process. Preserv. 2011, 35, 432–446. [Google Scholar] [CrossRef]
  37. Subedi, P.P.; Walsh, K.B. Assessment of avocado fruit dry matter content using portable near infrared spectroscopy: Method and instrumentation optimisation. Postharvest Biol. Technol. 2020, 161, 111078. [Google Scholar] [CrossRef]
  38. Hopkirk, G.; White, A.; Beever, D.J.; Forbes, S.K. Influence of postharvest temperatures and the rate of fruit ripening on internal postharvest rots and disorders of New Zealand ‘Hass’ avocado fruit. N. Z. J. Crop. Hortic. Sci. 1994, 22, 305–311. [Google Scholar] [CrossRef]
  39. Meir, S.; Naiman, D.; Akerman, M.; Hyman, J.Y.; Zauberman, G.; Fuchs, Y. Prolonged storage of ‘Hass’ avocado fruit using modified atmosphere packaging. Postharvest Biol. Technol. 1997, 12, 51–60. [Google Scholar] [CrossRef]
  40. Flitsanov, U.; Mizrach, A.; Liberzon, A.; Akerman, M.; Zauberman, G. Measurement of avocado softening at various temperatures using ultrasound. Postharvest Biol. Technol. 2000, 20, 279–286. [Google Scholar] [CrossRef] [Green Version]
  41. McGeehan, S.L.; Naylor, D.V. Automated instrumental analysis of carbon and nitrogen in plant and soil samples. Commun. Soil Sci. Plant. Anal. 1988, 19, 493–505. [Google Scholar] [CrossRef]
  42. Rayment, G.E.; Higginson, F.R. Australian Laboratory Handbook of Soil and Water Chemical Methods; Inkata: Melbourne, Australia, 1992. [Google Scholar]
  43. Martinie, G.D.; Schilt, A.A. Wet oxidation efficiencies of perchloric acid mixtures for various organic substances and the identities of residual matter. Anal. Chem. 1976, 48, 70–74. [Google Scholar] [CrossRef]
  44. Munter, R.C.; Grande, R.A. Plant tissue and soil extract analysis by ICP-atomic emission spectrometry. In Developments in Atomic Plasma Spectrochemical Analysis; Byrnes, R., Ed.; Heyden: London, UK, 1981; pp. 653–672. [Google Scholar]
  45. Bai, S.H.; Xu, C.-Y.; Xu, Z.; Blumfield, T.J.; Zhao, H.; Wallace, H.; Reverchon, F.; Van Zwieten, L. Soil and foliar nutrient and nitrogen isotope composition (δ15N) at 5 years after poultry litter and green waste biochar amendment in a macadamia orchard. Environ. Sci. Pollut. Res. 2015, 22, 3803–3809. [Google Scholar] [CrossRef]
  46. Kohavi, R. A study of cross-validation and bootstrap for accuracy estimation and model selection. In Proceedings of the IJCAI—International Joint Conference on Artificial Intelligence, Montreal, QC, Canada, 20–25 August 1995; pp. 1137–1145. [Google Scholar]
  47. Morellos, A.; Pantazi, X.-E.; Moshou, D.; Alexandridis, T.; Whetton, R.; Tziotzios, G.; Wiebensohn, J.; Bill, R.; Mouazen, A.M. Machine learning based prediction of soil total nitrogen, organic carbon and moisture content by using VIS-NIR spectroscopy. Biosyst. Eng. 2016, 152, 104–116. [Google Scholar] [CrossRef] [Green Version]
  48. Kamruzzaman, M.; Makino, Y.; Oshita, S. Rapid and non-destructive detection of chicken adulteration in minced beef using visible near-infrared hyperspectral imaging and machine learning. J. Food Eng. 2016, 170, 8–15. [Google Scholar] [CrossRef]
  49. Rinnan, Å.; Van Den Berg, F.; Engelsen, S.B. Review of the most common pre-processing techniques for near-infrared spectra. Trends Anal. Chem. 2009, 28, 1201–1222. [Google Scholar] [CrossRef]
  50. Wold, S.; Sjöström, M.; Eriksson, L. PLS-regression: A basic tool of chemometrics. Chemom. Intell. Lab. Syst. 2001, 58, 109–130. [Google Scholar] [CrossRef]
  51. Berrueta, L.A.; Alonso-Salces, R.M.; Héberger, K. Supervised pattern recognition in food analysis. J. Chromatogr. A 2007, 1158, 196–214. [Google Scholar] [CrossRef] [PubMed]
  52. Cheng, J.-H.; Sun, D.-W. Partial Least Squares Regression (PLSR) Applied to NIR and HSI Spectral Data Modeling to Predict Chemical Properties of Fish Muscle. Food Eng. Rev. 2017, 9, 36–49. [Google Scholar] [CrossRef]
  53. Tahmasbian, I.; Xu, Z.; Abdullah, K.; Zhou, J.; Esmaeilani, R.; Nguyen, T.T.N.; Bai, S.H. The potential of hyperspectral images and partial least square regression for predicting total carbon, total nitrogen and their isotope composition in forest litterfall samples. J. Soils Sediments 2017, 17, 2091–2103. [Google Scholar] [CrossRef]
  54. Kamruzzaman, M.; ElMasry, G.; Sun, D.-W.; Allen, P. Prediction of some quality attributes of lamb meat using near-infrared hyperspectral imaging and multivariate analysis. Anal. Chim. Acta 2012, 714, 57–67. [Google Scholar] [CrossRef]
  55. Chai, T.; Draxler, R.R. Root mean square error (RMSE) or mean absolute error (MAE)? Geosci. Model. Dev. Discuss. 2014, 7, 1525. [Google Scholar] [CrossRef] [Green Version]
  56. Tahmasbian, I.; Bai, S.H.; Wang, Y.; Boyd, S.; Zhou, J.; Esmaeilani, R.; Xu, Z. Using laboratory-based hyperspectral imaging method to determine carbon functional group distributions in decomposing forest litterfall. Catena 2018, 167, 18–27. [Google Scholar] [CrossRef]
  57. Bellon-Maurel, V.; Fernandez-Ahumada, E.; Palagos, B.; Roger, J.-M.; McBratney, A. Critical review of chemometric indicators commonly used for assessing the quality of the prediction of soil attributes by NIR spectroscopy. Trends Anal. Chem. 2010, 29, 1073–1081. [Google Scholar] [CrossRef]
  58. Ruano-Ramos, A.; Garcı́a-Ciudad, A.; Garcı́a-Criado, B. Near infrared spectroscopy prediction of mineral content in botanical fractions from semi-arid grasslands. Anim. Feed Sci. Technol. 1999, 77, 331–343. [Google Scholar] [CrossRef]
  59. Malmir, M.; Tahmasbian, I.; Xu, Z.; Farrar, M.B.; Bai, S.H. Prediction of soil macro-and micro-elements in sieved and ground air-dried soils using laboratory-based hyperspectral imaging technique. Geoderma 2019, 340, 70–80. [Google Scholar] [CrossRef]
  60. Cozzolino, D.; Moron, A. Exploring the use of near infrared reflectance spectroscopy (NIRS) to predict trace minerals in legumes. Anim. Feed Sci. Technol. 2004, 111, 161–173. [Google Scholar] [CrossRef]
  61. Louw, E.D.; Theron, K.I. Robust prediction models for quality parameters in Japanese plums (Prunus salicina L.) using NIR spectroscopy. Postharvest Biol. Technol. 2010, 58, 176–184. [Google Scholar] [CrossRef]
  62. Olarewaju, O.O.; Bertling, I.; Magwaza, L.S. Non-destructive evaluation of avocado fruit maturity using near infrared spectroscopy and PLS regression models. Sci. Hortic. 2016, 199, 229–236. [Google Scholar] [CrossRef]
  63. Kawano, S. New application of nondestructive methods for quality evaluation of fruits and vegetables in Japan (quality and its evaluation of horticultural products, for further development of horticulture in East Asia). J. Jpn. Soc. Hortic. Sci. 1998, 67, 1176–1179. [Google Scholar] [CrossRef] [Green Version]
  64. Polesello, A.; Giangiacomo, R.; Dull, G.G. Application of near infrared spectrophotometry to the nondestructive analysis of foods: A review of experimental results. Crit. Rev. Food Sci. Nutr. 1983, 18, 203–230. [Google Scholar] [CrossRef]
  65. Vašát, R.; Kodešová, R.; Borůvka, L.; Klement, A.; Jakšík, O.; Gholizadeh, A. Consideration of peak parameters derived from continuum-removed spectra to predict extractable nutrients in soils with visible and near-infrared diffuse reflectance spectroscopy (VNIR-DRS). Geoderma 2014, 232–234, 208–218. [Google Scholar] [CrossRef]
  66. Dibi, W.G.; Bosson, J.; Zobi, I.C.; Tié, B.T.; Zoueu, J.T. Use of fluorescence and reflectance spectra for predicting okra (Abelmoschus esculentus) yield and macronutrient contents of leaves. Open J. Appl. Sci. 2017, 7, 537. [Google Scholar] [CrossRef] [Green Version]
  67. Kader, A.A. Increasing food availability by reducing postharvest losses of fresh produce. Acta Hortic. 2005, 682, 2169–2176. [Google Scholar] [CrossRef]
  68. Bustos, C.A.; Moors, E.H.M. Reducing post-harvest food losses through innovative collaboration: Insights from the Colombian and Mexican avocado supply chains. J. Clean. Prod. 2018, 199, 1020–1034. [Google Scholar] [CrossRef] [Green Version]
  69. Kris-Etherton, P.M.; Pearson, T.A.; Wan, Y.; Hargrove, R.L.; Moriarty, K.; Fishell, V.; Etherton, T.D. High-monounsaturated fatty acid diets lower both plasma cholesterol and triacylglycerol concentrations. Am. J. Clin. Nutr. 1999, 70, 1009–1015. [Google Scholar] [CrossRef] [PubMed]
  70. Dreher, M.L.; Davenport, A.J. Hass avocado composition and potential health effects. Crit. Rev. Food Sci. Nutr. 2013, 53, 738–750. [Google Scholar] [CrossRef] [PubMed] [Green Version]
Figure 1. Schematic diagram showing (A) examples of two transects in an avocado orchard consisting of single-cultivar blocks of Hass and a mixed block consisting of alternating rows of Hass and Shepard; Hass was planted in 20 contiguous rows, and fruit were sampled from individual trees at rows 1, 2, 3 and 10 from the mixed block; and (B) the stratified sampling design for each avocado tree: two fruit were sampled from each of the five sectors, one from the inside and one from the outside of the canopy in each sector.
Remotesensing 12 03409 g001
Figure 2. The mean corrected relative reflectance of the Vis/NIR spectrum (400–1000 nm) from avocado fruit flesh (n = 221) and skin (n = 194). The 100% reflectivity was scaled to 10,000 (integers) by default.
Remotesensing 12 03409 g002
Figure 3. Measured vs. predicted values for the (A) ratio of unsaturated:saturated fatty acids (UFA:SFA), (B) ratio of oleic:linoleic acid (O:L), (C) boron concentration, and (D) calcium concentration of Hass avocado flesh using hyperspectral images of fruit flesh.
Remotesensing 12 03409 g003
Figure 4. β-coefficients associated with the best fitted PLSR models for the (A) ratio of unsaturated:saturated (UFA:SFA) fatty acids, (B) ratio of oleic:linoleic acid, (C) boron concentration, and (D) calcium concentration of Hass avocado fruit flesh using flesh and skin images.
Remotesensing 12 03409 g004
Figure 5. Measured vs. predicted values for the (A) ratio of unsaturated:saturated fatty acids (UFA:SFA), (B) ratio of oleic:linoleic acid (O:L), (C) boron concentration, and (D) calcium concentration of Hass avocado flesh using hyperspectral images of fruit skin.
Remotesensing 12 03409 g005
Table 1. Fatty acid composition (%), carbon (%), nitrogen (%) and other mineral nutrient concentrations (mg kg−1) in avocado flesh samples used for models developed from flesh images.
Flesh Images
VariableSetAverageSDMinMaxCV
Palmitic acid—C16:0Calibration31.592.9522.0638.810.09
Test31.562.6826.0736.590.08
Palmitoleic acid—C16:1 cisCalibration11.721.717.5716.230.15
Test11.581.697.2015.570.15
Stearic acid—C18:0Calibration0.370.130.201.030.34
Test0.360.120.200.690.34
Elaidic acid—C18:1 transCalibration7.190.855.4510.060.12
Test7.070.685.709.080.10
Oleic acid—C18:1 cisCalibration40.162.9632.5049.830.07
Test39.943.0934.0346.430.08
Linoleic acid—C18:2Calibration8.912.185.4114.710.24
Test9.572.305.0613.320.24
UFA:SFACalibration2.140.271.513.440.13
Test2.220.341.653.120.16
Oleic:LinoleicCalibration4.681.322.328.620.36
Test4.701.262.657.120.27
CCalibration15.741.969.9922.480.12
Test16.311.9213.0122.450.12
NCalibration0.180.070.030.540.40
Test0.180.070.040.420.38
AlCalibration3.284.630.1222.151.41
Test3.565.070.4021.001.42
BCalibration34.1418.1310.0090.950.53
Test35.4216.2114.2985.020.46
CaCalibration132.4255.8158.19409.510.42
Test113.0246.8742.48334.470.41
CuCalibration3.251.390.679.500.43
Test3.221.420.946.530.44
FeCalibration10.205.732.9632.270.56
Test10.105.663.5427.960.56
KCalibration4993.741468.591215.169010.730.29
Test4818.521696.071367.1111,239.990.35
MgCalibration273.0160.23170.69523.990.22
Test264.2951.79169.46406.650.20
MnCalibration2.481.100.907.170.44
Test2.300.691.104.090.30
NaCalibration136.4254.2057.73308.930.40
Test150.9566.3577.22452.600.44
PCalibration500.35194.92125.791283.550.39
Test495.27163.57256.181002.460.33
SCalibration307.37124.7616.35700.310.41
Test342.90129.0230.08632.420.42
ZnCalibration9.545.190.9033.800.54
Test10.165.232.1024.190.51
SD Standard deviation, CV Coefficient of variation (ratio of standard deviation to mean). UFA:SFA refers to the ratio of unsaturated to saturated fatty acids. C (carbon), N (nitrogen), Al (aluminium), B (boron), Ca (calcium), Cu (copper), Fe (iron), K (potassium), Mg (magnesium), Mn (manganese), Na (sodium), P (phosphorus), S (sulphur), Zn (zinc).
Table 2. Fatty acid composition (%), carbon (%), nitrogen (%) and other mineral nutrient concentrations (mg kg−1) in avocado flesh samples used for models developed from skin images.
Skin Images
VariableSetAverageSDMinMaxCV
Palmitic acid—C16:0Calibration31.963.1922.0639.760.10
Test31.352.9226.1838.260.09
Palmitoleic acid—C16:1 cisCalibration11.561.707.2016.230.15
Test12.021.847.7815.410.15
Stearic acid—C18:0Calibration0.360.140.201.030.38
Test0.370.120.220.670.32
Elaidic acid—C18:1 transCalibration7.210.865.6710.060.12
Test7.040.775.459.460.11
Oleic acid—C18:1 cisCalibration39.843.0032.5049.830.08
Test40.032.9934.1446.870.07
Linoleic acid—C18:2Calibration8.992.285.0614.710.25
Test9.052.455.9313.210.27
UFA:SFACalibration2.170.301.653.440.14
Test2.010.331.502.620.16
Oleic:LinoleicCalibration4.761.332.327.800.28
Test4.761.332.658.620.28
CCalibration15.932.029.9922.480.13
Test15.621.5411.3217.950.10
NCalibration0.180.070.050.540.39
Test0.150.040.040.230.27
AlCalibration5.0610.390.0597.472.05
Test4.85.190.2320.821.08
BCalibration36.7218.1810.0090.950.49
Test33.1318.0310.6580.330.54
CaCalibration138.0064.2942.48409.510.47
Test112.1451.9551.23311.830.46
CuCalibration3.321.640.6712.440.49
Test2.950.991.444.810.34
FeCalibration11.147.492.9652.020.67
Test10.856.554.3627.890.60
KCalibration4950.611598.921215.1611,239.990.32
Test4928.921414.162097.538087.000.29
MgCalibration273.9260.73169.46523.990.22
Test276.6176.75170.69575.300.28
MnCalibration2.451.070.907.130.44
Test2.530.861.204.470.34
NaCalibration138.5458.9157.73452.600.43
Test135.2855.3765.46306.460.41
PCalibration500.10194.81186.151183.640.39
Test502.73189.14125.791283.550.38
SCalibration319.26137.9016.35781.230.43
Test330.25124.79107.65621.700.38
ZnCalibration10.155.650.9033.800.56
Test9.255.111.8423.250.55
SD Standard deviation, CV Coefficient of variation (ratio of standard deviation to mean). UFA:SFA refers to the ratio of unsaturated to saturated fatty acids. C (carbon), N (nitrogen), Al (aluminium), B (boron), Ca (calcium), Cu (copper), Fe (iron), K (potassium), Mg (magnesium), Mn (manganese), Na (sodium), P (phosphorus), S (sulphur), Zn (zinc).
Table 3. Performance of partial least squares regression (PLSR) models in predicting fatty acid composition (%), carbon (%), nitrogen (%) and other mineral nutrient concentrations (mg kg−1) in Hass avocado fruit flesh from hyperspectral images of the fruit flesh.
Flesh Images WavelengthOutlierCalibration SetValidation SetTest Set
VariableTransformationLVReductionRemovalRMSECR2RMSEVR2R2RPD
Palmitic acid—C16:01st Der6YY1.500.731.740.650.782.10
Palmitoleic acid—C16:1 cisOSC3YY0.720.780.810.730.571.42
Stearic acid—C18:0OSC1NN0.120.150.120.130.031.01
Elaidic acid—vC18:1 transMSC + OSC2NN0.610.470.660.400.361.25
Oleic acid—C18:1 cisSNV + 1st Der10NY1.770.642.370.370.601.26
Linoleic acid—C18:2OSC7NN0.740.890.940.810.872.62
UFA:SFAMSC + OSC5YN0.120.800.130.750.792.11
Oleic:Linoleic1st Der6YY0.670.730.760.650.671.63
C2nd Der5NN1.400.481.830.120.351.44
N1st Der7NN0.040.700.050.420.0040.77
AlSNV + OSC7YY1.980.792.460.680.721.89
BOSC6NN9.290.7411.100.630.611.51
Ca OSC 7NN37.370.5542.120.430.531.71
CuSNV16YY0.820.641.060.410.631.63
FeMSC + OSC9YY2.910.723.710.540.671.70
KOSC3YY687.510.77755.730.720.741.97
MgOSC12NY30.490.7438.880.590.581.40
Mn1st Der7YN0.840.410.900.330.290.83
NaOSC4NN0.670.520.770.370.150.77
POSC5NY118.090.63127.190.580.591.43
SOSC7YN76.910.6189.840.480.631.58
ZnOSC16NY3.200.624.180.350.621.58
LV Number of latent variables, RMSEC Root mean square error of the calibration set, RMSEV Root mean square error of the validation set, RPD Ratio of prediction to deviation; SNV standard normal variate, OSC orthogonal signal correction, MSC multiplicative scatter correction, 1st, 2nd Der: Savitzky–Golay first- or second-order derivatives. The reduction of wavelength and removal of outliers is indicated with Y for yes and or N for no. UFA:SFA refers to the ratio of unsaturated to saturated fatty acids.
Table 4. Performance of PLSR models in predicting fatty acid composition (%) and mineral nutrient concentrations (mg kg−1) in Hass avocado fruit flesh from hyperspectral images of the fruit skin.
Skin Images WavelengthOutlierCalibration SetValidation SetTest Set
VariableTransformationLVReductionRemovalRMSECR2RMSEVR2R2RPD
Palmitic acid—C16:0OSC2NN1.680.721.850.670.721.63
Palmitoleic acid—C16:1 cis2nd Der3YY1.260.401.470.200.421.30
Stearic acid—C18:0OSC1NN0.130.170.130.150.050.84
Elaidic acid—C18:1 trans1st Der6NN0.650.420.780.180.311.17
Oleic acid—C18:1 cisOSC3YY1.910.612.270.460.331.13
Linoleic acid—C18:2OSC5NY0.780.880.950.830.882.79
UFA:SFASNV + OSC3YN0.170.690.180.640.621.48
Oleic:Linoleic2nd Der5YY0.590.80.660.750.531.16
COSC1NN1.670.301.700.290.120.93
NSNV + OSC1NN0.060.100.070.070.050.02
Al1st Der7NN8.010.409.410.180.621.16
B3rd Der6NY9.960.7013.110.480.601.55
Ca OSC1NN39.780.6140.440.610.681.57
CuOSC1NN1.380.271.400.260.321.15
Fe1st Der5YN6.080.376.890.200.521.41
KOSC3YY1007.580.601124.570.510.551.42
MgOSC7NY37.220.5747.500.320.581.62
Mn4th Der2NN0.910.280.990.160.191.08
Na2nd Der4NN46.340.3756.180.090.231.14
POSC7NN131.630.55154.340.400.151.01
S2nd Der4NY88.910.58106.240.410.571.44
ZnOSC10NY3.240.674.290.420.591.49
LV Number of latent variables, RMSEC Root mean square error of the calibration set, RMSEV Root mean square error of the validation set, RPD Ratio of prediction to deviation; SNV standard normal variate, OSC orthogonal signal correction, MSC multiplicative scatter correction, 1st, 2nd, 3rd, 4th Der: Savitzky-Golay first-, second-, third-, or fourth-order derivatives. The reduction of wavelength and removal of outliers is indicated with Y for yes and or N for no. UFA:SFA refers to the ratio of unsaturated to saturated fatty acids.
Table 5. Correlations in mineral nutrient concentrations between Hass avocado flesh and skin samples.
NutrientRp
C0.260.22
N0.300.14
Al0.380.06
B0.480.02
Ca0.75<0.001
Cu−0.030.90
Fe−0.040.87
K0.270.20
Mg0.420.04
Mn0.64<0.001
Na0.71<0.001
P0.480.02
S−0.030.89
Zn0.190.35
Bold p values indicate significant correlations (Spearman’s rank correlation, p < 0.05, n = 25).
Publisher’s Note: MDPI stays neutral with regard to jurisdictional claims in published maps and institutional affiliations.

