Article

Intercomparison of Burned Area Products and Its Implication for Carbon Emission Estimations in the Amazon

by
Ana Carolina M. Pessôa
1,*,
Liana O. Anderson
2,
Nathália S. Carvalho
1,
Wesley A. Campanharo
1,
Celso H. L. Silva Junior
1,
Thais M. Rosan
3,
João B. C. Reis
2,
Francisca R. S. Pereira
1,
Mauro Assis
4,
Aline D. Jacon
5,
Jean P. Ometto
5,
Yosio E. Shimabukuro
1,
Camila V. J. Silva
6,
Aline Pontes-Lopes
1,
Thiago F. Morello
7 and
Luiz E. O. C. Aragão
1,3
1
National Institute for Space Research, Remote Sensing Division, Av. dos Astronautas, n1758, São José dos Campos SP 12227-010, Brazil
2
National Center for Monitoring and Early Warning of Natural Disasters—Cemaden, Technological Park of São José dos Campos, Dr. Altino Bondensan Road, n500, São José dos Campos SP 12247-016, Brazil
3
College of Life and Environmental Sciences Amory Building, University of Exeter, Rennes Drive, Exeter EX4 4RJ, UK
4
Atrium Forest Consulting, R. Tiradentes, n435, Piracicaba SP 13400-760, Brazil
5
National Institute for Space Research, Earth System Science Center, Av. dos Astronautas, n1758, São José dos Campos SP 12227-010, Brazil
6
Lancaster Environment Centre, Lancaster University, Lancaster LA1 4YQ, UK
7
Center for Engineering, Modeling and Applied Social Sciences (CECS), Federal University of ABC, Alameda da Universidade, S/N, São Bernardo do Campo SP 09606-045, Brazil
*
Author to whom correspondence should be addressed.
Remote Sens. 2020, 12(23), 3864; https://0-doi-org.brum.beds.ac.uk/10.3390/rs12233864
Submission received: 23 October 2020 / Revised: 18 November 2020 / Accepted: 20 November 2020 / Published: 25 November 2020
(This article belongs to the Special Issue Fires on Forest Environments)

Abstract

:
Carbon (C) emissions from forest fires in the Amazon during extreme droughts may correspond to more than half of the global emissions resulting from land cover changes. Despite their relevant contribution, forest fire-related C emissions are not directly accounted for within national-level inventories or carbon budgets. A fundamental condition for quantifying these emissions is to have a reliable estimation of the extent and location of land cover types affected by fires. Here, we evaluated the relative performance of four burned area products (TREES, MCD64A1 c6, GABAM, and Fire_cci v5.0), contrasting their estimates of total burned area, and their influence on the fire-related C emissions in the Amazon biome for the year 2015. In addition, we distinguished the burned areas occurring in forests from non-forest areas. The four products presented great divergence in the total burned area and, consequently, total related C emissions. Globally, the TREES product detected the largest amount of burned area (35,559 km2), and consequently it presented the largest estimate of committed carbon emission (45 Tg), followed by MCD64A1, with only 3% less burned area detected, GABAM (28,193 km2) and Fire_cci (14,924 km2). The use of Fire_cci may result in an underestimation of 29.54 ± 3.36 Tg of C emissions in relation to the TREES product. The same pattern was found for non-forest areas. Considering only forest burned areas, GABAM was the product that detected the largest area (8994 km2), followed by TREES (7985 km2), MCD64A1 (7181 km2) and Fire_cci (1745 km2). Regionally, Fire_cci detected 98% less burned area in Acre state in southwest Amazonia than TREES, and approximately 160 times less burned area in forests than GABAM. Thus, we show that global products used interchangeably on a regional scale could significantly underestimate the impacts caused by fire and, consequently, their related carbon emissions.

Graphical Abstract

1. Introduction

Naturally occurring fires are a rare event in the Amazon, with return intervals of hundreds if not thousands of years [1]. However, fires are often used as a tool to clear the land after deforestation or maintain existing farmland and pasture, which means their occurrence in the Amazon is primarily associated with human activity [2,3]. These two fire types, deforestation fires and management fires, impose risks on adjacent forests, and when these are impacted, the third main type of fire occurs, the forest fires. Forest fires contribute significantly to global climate change, consuming plant biomass and transferring part of the associated carbon (C) stock to the atmosphere [4]. The gross C emissions from forest fires across the Brazilian Amazon (270 ± 137 Tg C year−1) [5] corresponded to 80% of the Brazilian emissions resulting from land use change (338 ± 142 Tg C) [6] during drought years. Additionally, forest fires in the Legal Brazilian Amazon contributed 86% (68% to 103%) to the annual C emission reduction target [7] set by the Brazilian National Climate Change Plan [8].
Despite this remarkable contribution, forest fire-related C emissions are not yet accounted for national-level inventories. The quantification of deforestation-related fire emissions in these inventories takes into account the strong relationship between these two processes (r2 = 84%, p < 0.004) [9]. However, in the last decade a relative decoupling between deforestation and fire incidence has been observed, disaggregating these two processes in terms of emissions [5]. This pattern has been associated with an amplification of forest fragmentation [10] and an increase in extreme drought frequency [5], favoring the leakage of deforestation and management fires into surrounding forests. These anomalous climate events have happened more often during the last few decades [11,12], and global climate models predict a drier Amazon in the 21st century [13,14]. Recently, the area of burned forests relative to total burned area has increased during extreme droughts. For example, an increase of 51–99% in the forest burned area was observed in the 2015/2016 extreme drought years in relation to the average from 2006 to 2016 [15]. In addition, fires reduce forest storage of carbon by approximately 25% compared to pristine forests [16], highlighting the impact of forest fires on the carbon balance. Therefore, the prevalence of forest fires during extreme droughts makes it urgent to also account for non-deforestation fire-related carbon emissions [15].
In order to have fire-related C emissions adequately accounted for, it is essential to have an accurate estimation of extent, location, and land cover affected. In this sense, several methodological approaches have been developed using remote sensing applications for the detection and monitoring of fires [7,17,18,19,20]. Burned area can be detected by remote sensing in a variety of ways. The diversity of methodologies, combined with the availability of multiple sensors, and the fast development of new technologies, reflects the high number of burned area products. They can be developed for different purposes, reach different scales, and present different spatial resolutions, varying considerably in distribution, size, and frequency of mapped fires [21]. In this sense, intercomparison is an important and practical tool for characterizing burned area products according to their performance [22,23] when field validation points are not available. Nonetheless, intercomparison implicitly assumes that, as a whole, the products being compared provide a reasonable approximation of the conditions on the ground [22]. It should be recognized as a complementary evaluation to the product validation. Since no product is a ground portrait, and all have limitations, the choice of which product to use should consider the advantages and disadvantages in terms of the data use objective, taking into account the regional performance of each one of them. It must be recognized that the main challenge is trying to precisely balance the pros and cons, and identifying the implications of the choice.
Only a few studies have been carried out to compare different burned area products [22,24,25,26,27]. Currently, there is a dearth in the literature providing a regional intercomparison of burned area products for the Amazon [22]. Given the importance of this assessment to improve the fire products and consequently fire-related C emission estimates of this region, it is critical to evaluate the relative performances of the most-used global burned area products, both on forest and non-forest areas, to provide clear information regarding their limitations and implications. This work performed an intercomparison of three global burned area products and one regional, all developed independently and for different purposes and scales. The study considered total burned area detected, and its influence on fire-related C emission, in the Brazilian Amazon biome for the year 2015. The specific objectives were as follows: (i) evaluate the differences and similarities among the products regarding the total burned area detected, considering burned areas detected over forest and non-forest land covers; (ii) evaluate the differences and similarities in fire-related carbon emission estimates; and (iii) evaluate the spatial differences and similarities among the products. We hypothesize that the variation among the products increases in forest areas due to the difficult distinction of the burned areas in this land cover type [28,29,30].
The next sections are organized to provide a brief review of burned area detection techniques with remote sensing data, followed by the description of the study area and the burned area products considered in this study. We finally describe our intercomparison approaches and present their results in terms of burned area and commited C emissons.

2. Burned Area Detection by Remote Sensing
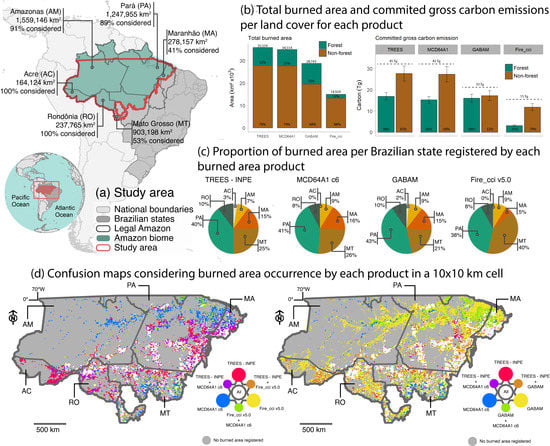
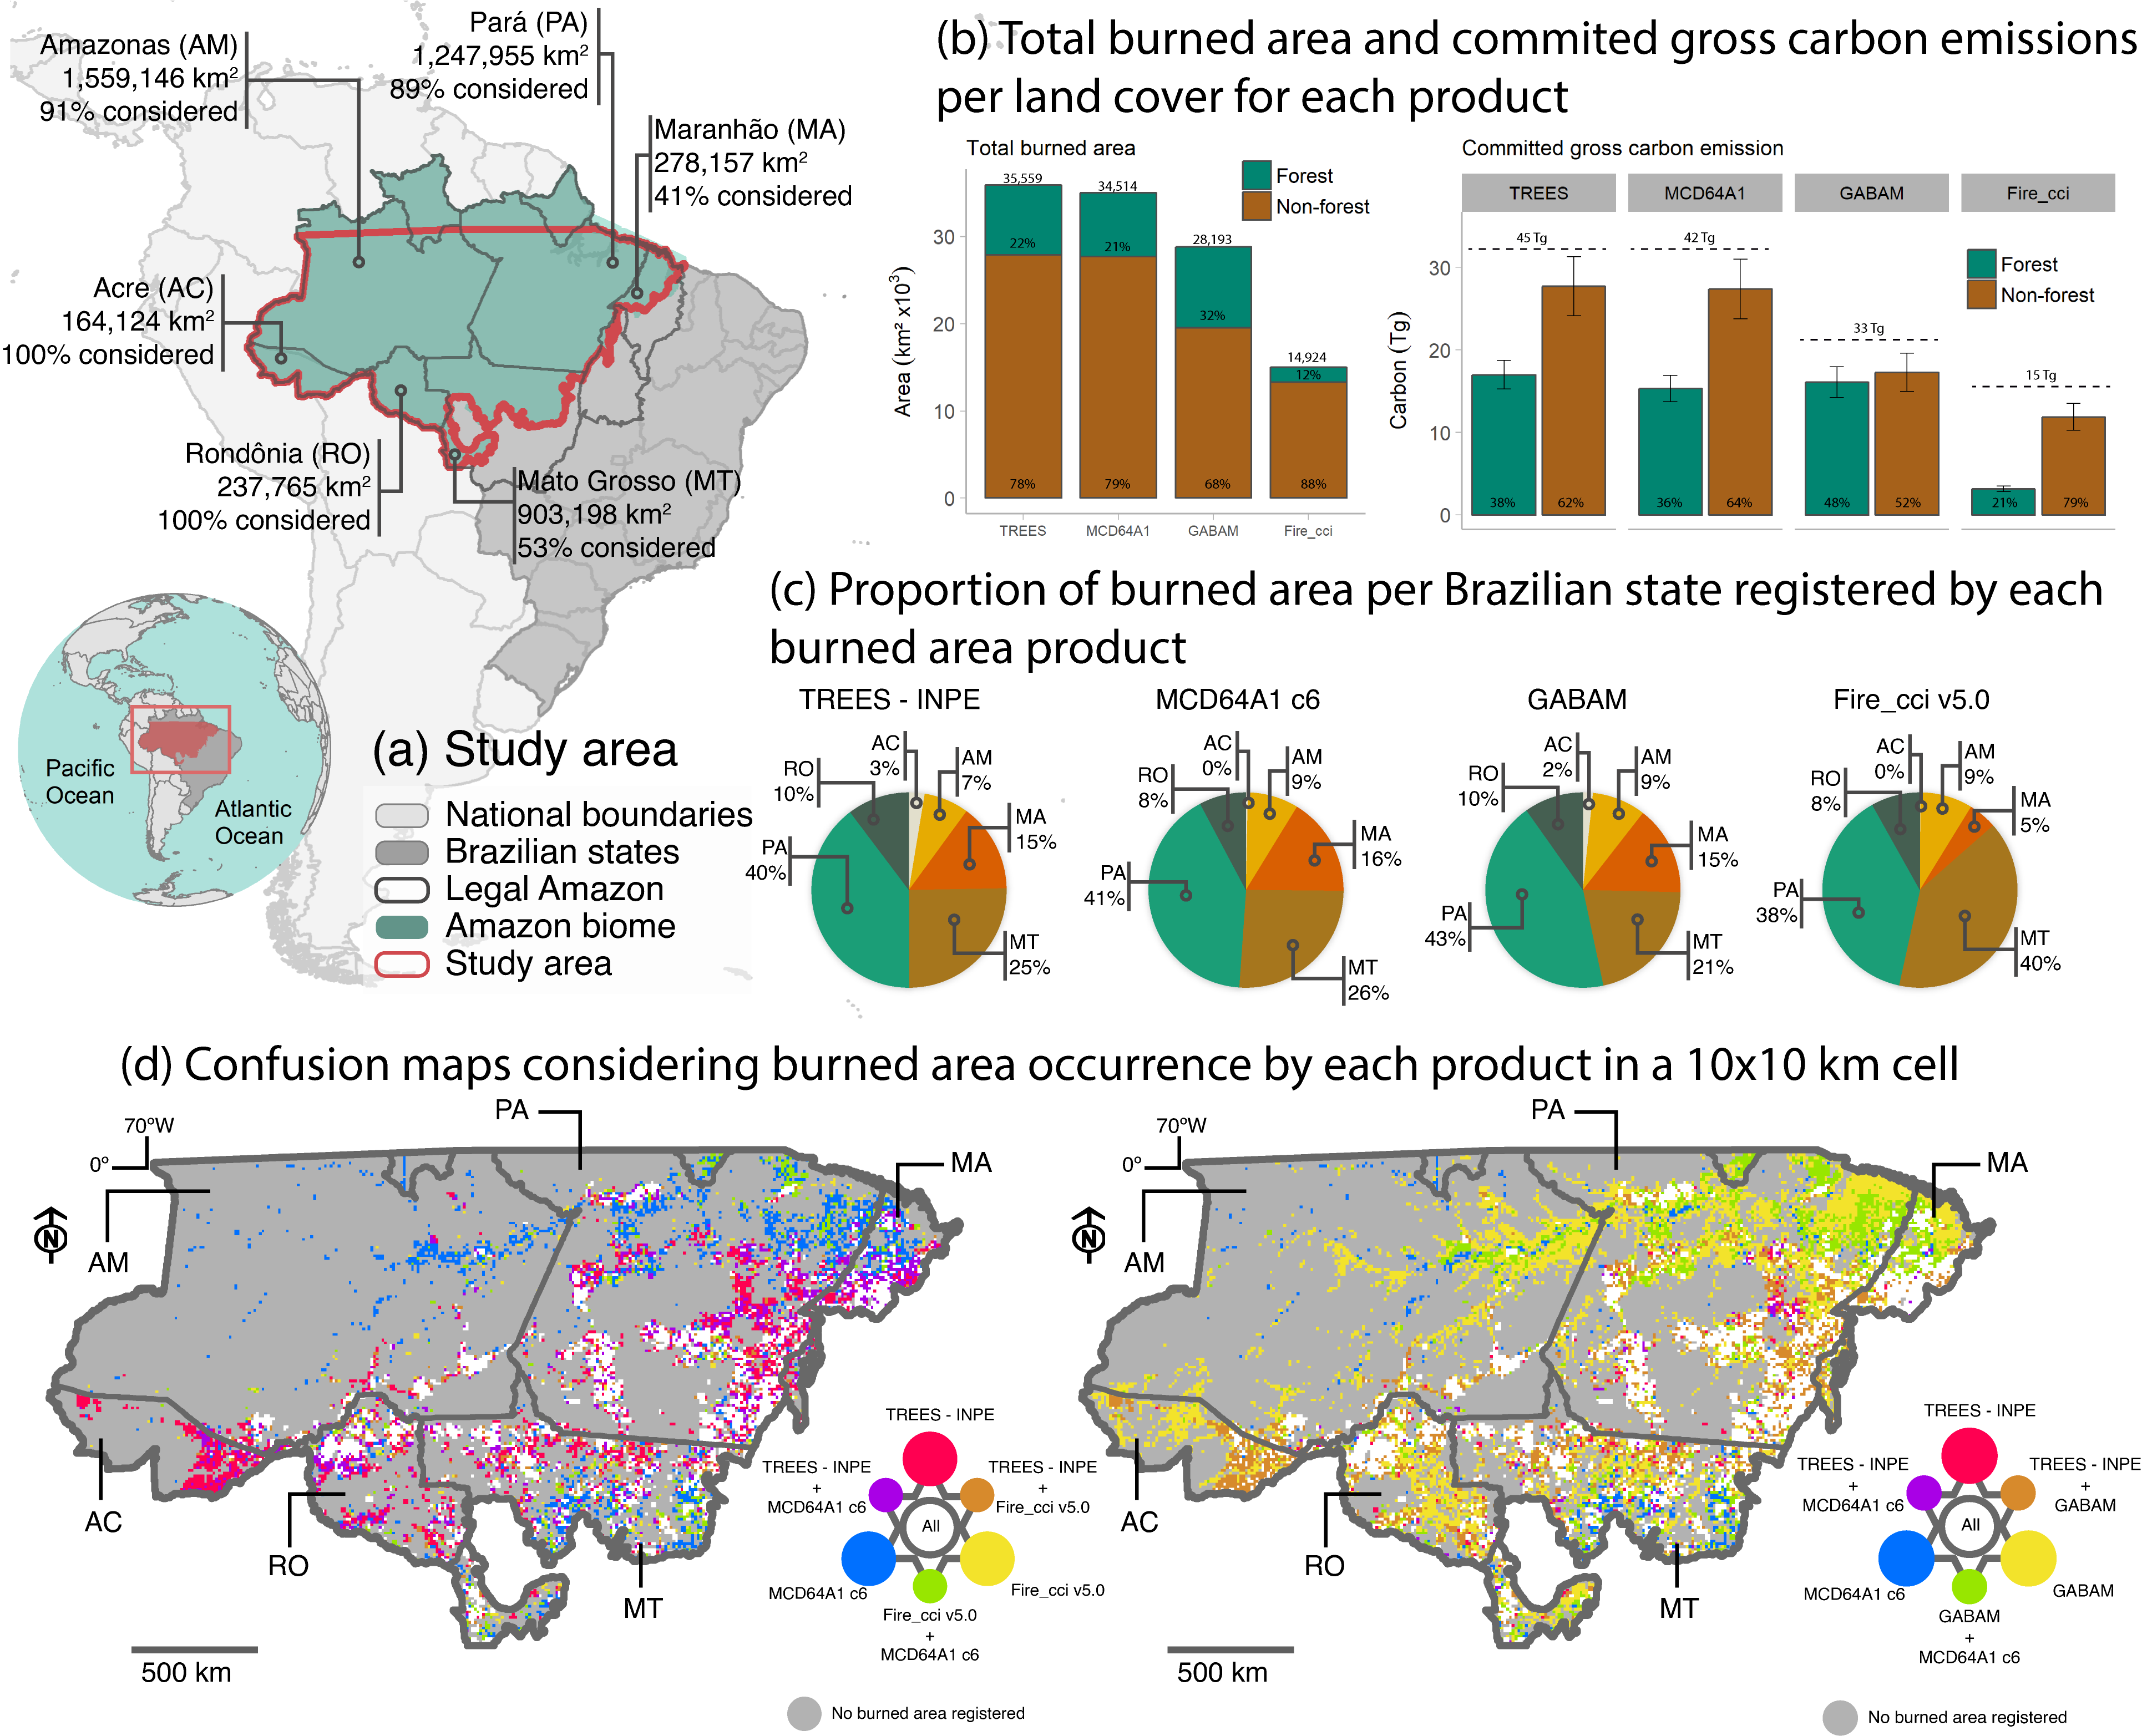
The detection and mapping of burned areas aims to produce spatially-explicit data on the extent of fire-affected areas, usually using data from optical sensors on the solar spectrum [31], which ranges from the visible light (0.4–0.7 µm) to the short wave infrared (SWIR) bands (1.4–2.2 µm). The radiation reflected by the Earth’s surface in these spectral regions (reflectance) is influenced by the target chemical and physical characteristics, as well as the sun–target–sensor geometry [31]. Data from the thermal infrared spectrum (0.7–2.2 µm) can also be used to map burned areas, but they are commonly integrated with other optical bands [32]. The near infrared (NIR, 0.7–1.0 µm) and SWIR (1.4–2.2 µm) spectral regions are especially sensitive to forest structure changes [33], and consequently are widely used to generate spectral indices or ratios for burned area detection [34,35,36,37,38,39]. However, due to a strong variability in the spectral characteristics of both pre- and post-fire conditions, and in the fire intensity and severity as well, the use of such indices may lead to the misclassification of burned areas, especially in forest environments [34]. As all of them are based on reflectance changes related to the immediate charcoal/ash deposition and lingering changes in the vegetation structure, they are also highly dependent on the temporal behavior of such conditions [35,40].
A burned area mapping algorithm based on spectral indices derived from moderate resolution imaging spectroradiometer (MODIS) imagery and daily active fire data is described by Giglio et al. (2018) [17]. Their final product, MODIS Direct Broadcast Monthly Burned Area Product Collection 6 (MCD64A1), presented a global omission error of 0.73 [41], showing the conservative aspect of their methodology, and the underestimation that unsupervised algorithms can generate. When considering tropical forest ecosystems, the omission and commission errors are still higher (0.9060 and 0.6350, respectively) [41]. Bastarrika et al. (2014) [42] developed a supervised burned area mapping software (BAMS), which analyzes the temporal behavior of a multispectral index derivered from Landsat images. Their algorithm has only been tested in temperate forests, and its application for burned area mapping in tropical regions is more complex. Some of the challenges regarding burned area mapping in tropical forests are the high and persistent cloud cover and canopy closure, which can preclude the detectability of understory fires.
Another way to highlight features of interest, such as burned areas, is through a linear spectral mixing model (LSMM) [43]. LSMM is based on a linear relation that represents the spectral mixture of different targets within a pixel. The data dimensionality (number of reflectance bands) is reduced by generating fraction images to represent the proportion of each target of interest within the resolution cell. Usually, the LSMM is processed to represent three targets (e.g., vegetation, soil, and shade). The use of shade fraction images has been shown to be more efficient than spectral indices in mapping burned area in the Amazon [43]. Many studies have used LSMM to detect burned areas in the Brazilian Amazon [43,44,45,46,47]. They use moderate and/or coarse-resolution images (e.g., MODIS and/or Landsat, respectively) to perform LSMM, followed by shade fraction image segmentation and unsupervised classification. This approach proved to be an efficient method to map burned areas. However, all these studies require a final manual image interpretation procedure for minimizing misclassifications.
A fundamental parameter that influences the detection of burned areas by satellites is the sensor resolution, both spatial and temporal. Most of the fire occurrence products are developed with satellite data with coarse spatial resolution (>250 m). Coarse spatial resolution images make the development of automatic mapping very challenging due to the variability in the spectral characteristics of the burned area. On the other hand, a medium spatial resolution (~30 m) gives more reliability to the evaluation of the burned area [19]. However, these sensors often have worse temporal resolutions, and their longer revisit time decreases the chances of obtaining cloud-free images. This can be critical for burned area mapping over tropical regions, where the recovery of the spectral signal of vegetation can be quick and cloud cover is persistent [36]. The spatial resolution can also induce the underestimation of small fires, leading to a considerable underestimation of the global burned area [17,48]. For example, this limitation can underestimate fires in croplands by as much as 10 times [17].

3. Study Area

The study area corresponds to the Brazilian Amazon biome below the equator line. The area comprises about 74% of the Legal Amazon, and 73% of its 3,583,565 km2 were covered by forest in 2016 (Figure 1). The study area includes the states of Acre (AC), Rondônia (RO), and portions of the states of Amazonas (AM), Pará (PA), Amapá (AP), Maranhão (MA), Mato Grosso (MT), Tocantins (TO) and Roraima (RR) (Figure 1). For the regional analysis, we considered only the percentage of area that falls within the study region of states with more than 40% of their area considered, and under similar rainfall regimes (dry season from July to October) (Figure 1, Table S2). Since the TREES product does not consider the north hemisphere region in its mapping due to the difficulty in obtaining cloud-free images, we excluded this region from our analyses to consider the common mapping area among all four products.

4. Materials and Methods

4.1. Burned Area Products

Currently, there are more than 13 open access burned area products available worldwide (Table S1), which are widely used. We considered three global burned area products, and one regional product for the intercomparison evaluation (TREES, MCD64A1, GABAM and Fire_cci) (Table 1). The products were chosen taking into account the spatial scale, since we would like to compare the global products with a regional one, and the spatial resolution, as we would like to analyze the effect of higher-resolution inputs in burned area detection. Therefore, we chose two global products that are widely used in the literature (MCD64A1 and Fire_cci), a recently published global product that has a spatial resolution of 30 m, this being the product with the best spatial resolution (GABAM), and a regional product developed particularly for the Amazon region (TREES).
The Tropical Ecosystems and Environmental Sciences lab (TREES), based on the National Institute of Space Research (INPE), developed their burned area product in a regional basis that covers 86% of the Amazon biome, developed as part of multiple projects [7,43,46] (Project Amazonica—NERC/grant: NE/F005806/1; Project Estimativa de emissões de CO2 por desmatamento e degradação florestal utilizada como subsidio para definição de municípios prioritários para monitoramento e controle—CAPES/grant; Project Mapping and monitoring forest degradation using remote sensing data with medium and moderate spatial resolution—FAPESP/grant: 16/19806-3). Their product, called here TREES, is available upon request for 2006 to 2016 in an annual composite dataset. The product was developed using a hybrid classification method to delineate burned areas. The images of bands 1, 2 and 6 (red, near infrared and medium infrared) of the product MOD09A1Q1 were used as input to the LSM model. Then, a water mask is applied to avoid the detection of water pixels and unsupervised classification of the shade fraction image is carried out. In this fraction image the burned areas are highlighted, facilitating the distinction of these targets on the terrestrial surface [46]. Subsequently, an expert inspection is carried out to improve the accuracy of the final map, especially in forested areas, where burned areas can be easily confused or undetected [7,43]. The map accuracy resulting from the methodology adopted by TREES was quantified using a point-based method, considering a study case in Mato Grosso state for 2010 [28]. This product presents an overall accuracy for forested (0.9920) burned areas slightly higher than for non-forested (0.9630) burned areas (Table 2).
MCD64A1 is a global dataset on burned areas developed by the National Aeronautics and Space Administration (NASA). The product is freely available for 2000 to present. Incorporating MODIS surface reflectance data coupled with 1 km MODIS active fire observations, its algorithm uses a burn sensitive vegetation index (VI) to create dynamic thresholds that are applied to produce the monthly composite data [17]. The current collection (c6) algorithm has already undergone improvements from older ones, and there is a continuous effort to minimize its limitations (more details on Table S1). The product is widely used; it has been applied as input for the development of other burned area products [49,50], as well as for the development of the Global Fire Atlas, which includes information on ignition locality, fire line, speed and direction of spread, essential to understanding the dynamics of individual fires and, therefore, better characterizing the changing role of fire in the Earth system [51]. It has also been used as input for biomass burning emissions models [48,52], to study the relation between fire and land cover change [53], and to track the response of fire occurrence to climate change [54].
Table 1. Specifications of the burned area products to be compared.
NameDeveloperScaleTime SpanSensors/InputsSpatial ResolutionReferences
TREESTREES—INPERegional (Brazilian Amazon)2006–2016MODIS250 m[7,43,46]
MCD64A1
c6
NASAGlobal2000–presentMODIS (surface reflectance and active fires)500 m[17]
GABAMInstitute of Remote Sensing and Digital Earth—Chinese Academy of SciencesGlobal2000, 2005, 2010, 2015 and 2018Landsat 8 OLI30 m[36]
Fire_cci v.5.0ESAGlobal2001–2016MOD09GQ (surface reflectance)
MOD09GA (quality flags)
MCD14ML (active fires)
250 m[55]
Table 2. Accuracy information of four burned area products.
Burned Area ProductOverall AccuracyOmission ErrorCommission ErrorValidation Method SummaryReferences
TREES
Forest areas0.992000.1600Point-based validation. Stratified random sample of 300 points’ distributed over burned and unburned forest on Landsat images for Mato Grosso state, 2010. The points are verified by experienced interpreters.[28]
Non-forest areas0.96300.48520.1067
MCD64A1 c6
Global0.99700.72600.4020Globally distributed reference dataset from 1 March 2014 to 19 March 2015, consisting of high-resolution reference maps derived from 1116 Landsat images visually interpreted. These independent reference data were selected using a stratified random sampling approach that allows for the probability sampling of Landsat data in both time and space.[41]
Tropical forests0.99400.90600.6350
GABAM0.93920.30130.1317It considered 80 validation sites globally, from where it acquired data from Landsat 8, CBERS-4 MUX and Gaofen-1 WFV. The reference burned areas were mapped with a semi-automatic classification method and refined with the manual edition.[36]
Fire_cci v5.00.99720.70900.5123Stratified random sample of 1200 pairs of Landsat images, covering the whole globe from 2003 to 2014.[55]
The Global Annual Burned Area Mapping (GABAM) is a recently released burned area product developed by Long et al. (2019) [36]. It is built from an automated algorithm implemented on Google Earth Engine (GEE), and it uses reflectance data from the Landsat 8 Operational Land Imager (OLI) and spectral indexes information as input for a Random Forest model. A final step consists of burned area shaping through a region growth approach [36]. GABAM is currently the global dataset with the highest spatial resolution (30 m), but it is only available for 2000, 2005, 2010, 2015 and 2018, and in a yearly composite, which does not allow seasonal analysis within a year. Its validation process showed lower omission (0.3013) and commission (0.1317) errors compared to Fire_cci and MCD64A1 (Table 2). The implementation of the algorithm in GEE constitutes a great advance in mapping approaches, since the tool is open source, provides an extensive catalog of medium-resolution images and allows for cloud processing, which considerably increases the data incorporation in the process.
The product Fire Disturbance (Fire_cci) is part of the Climate Change Initiative (CCI) program developed by the European Space Agency’s (ESA). To map the burned areas, a MODIS dataset is used, including reflectance images (MOD09GQ), quality masks (MOD09GA) and active fires (MOD14ML) [55] (Table 1). The images are aggregated into monthly composites and the classification algorithm is based on region growth, after the selection of seed pixels. Spatial and temporal parameters are, then, used in order to reduce commission and omission errors [55]. The final product is made available on a global scale. The version 5.0 was used in this work, since it was the most updated version when this work was developed. Among the products developed using coarse spatial resolution data, Fire_cci was the first to provide a global dataset with a 250 m resolution. Its validation process indicated an overall accuracy of 0.9972, with 0.7090 global omission error and 0.5123 commission error (Table 2). Recently, a new version of Fire_cci (version 5.1) was released [56]. The new version brings improvements of the burned area detection algorithm, which has allowed for detecting more burned area globally compared to the version 5.0, and expands the time span for 2001 to 2019 [56]. Even with the improvements, the product has omission and commission errors similar to those of the previous version. Evaluating the southern hemisphere of South America, the product detects less burned area than the product MCD64A1 for the period 2005–2011, and its improvement in performance seems to be much smaller compared to the results obtained for the African continent [56].
In the following sections these products will be called TREES, MCD64A1, GABAM and Fire_cci. We considered only burned area polygons detected between June and November of 2015, to guarantee temporal compatibility among the products analyzed. For GABAM, burned areas throughout the year were considered, as this is the only temporal resolution available. In order to extract the burned area over the forest, we applied the old-growth forest mask of 2016, produced by the Amazon Forest Deforestation Calculation Program (PRODES) [57] (Figure 1), since it covers the period of August 2015 to July 2016, and is thus a conservative mask for forest cover. The non-forest class corresponds to other land covers. It is important to highlight that, despite the TREES product presenting the best results in terms of errors of omission and commission, and because it is a product that was designed specifically for the study region involving a visual interpretation correction phase, we did not consider it as reference data. Our objective here was to compare the products with each other and to analyze the relative performance of each one in mapping burned areas in the Amazon, and not to validate them based on a reference. We emphasize that each product has its own development methodology, which incorporates advantages and limitations, and even assuming that, as a whole, the product provides a reasonable approximation of the conditions on the ground, none of which is the truth to be used as a reference.

4.2. Committed Gross Carbon Emission Estimation

To estimate the committed gross carbon emission, we used the above ground biomass (AGB) map developed by environmental monitoring via satellite in the Amazon biomeAmazon Fund-Subproject 7—Estimating Biomass in the Amazon (EBA). The EBA map covers the Amazon biome, and it provides AGB density information for 2016 at a 250 m spatial resolution and an associated uncertainty map (See Supplementary Material (S§1) for more information). Even though our analysis was done for 2015, we used the map for 2016 because just a minimum fraction (2%) of the burned area of 2015 overlapped the deforested area of PRODES 2016 (Table S3). The emissions associated with these areas were considered negligible compared to the total amount estimated for each burned area product.
The committed carbon gross emission was estimated based on the relationship between the biomass before and after the fire, measured within a maximum of one year gap (Equation (1)). This method is an improvement of Anderson et al.’s (2015) [7] since it incorporates new data from Silva et al. (2018) [16] (See Supplementary Material (S§2) for more information). This model shows the existence of a strong correlation between the incidence of fire and the initial biomass existing before burning. The hypothesis assumes that with the increase in biomass, microclimate conditions are more conducive to maintaining humidity within the canopy, reducing the intensity and susceptibility to fire spreading [58].
B f = 0.05 · B i 1.47
Bf is the above ground living biomass (Mg ha−1) after the fire, and Bi is the initial above ground living biomass, given by the AGB map. The difference betweem Bi and Bf gives us the committed biomass density. After we applied this model to obtain the committed biomass density per cell, we transformed this density map into absolute biomass value by calculating the correct biomass proportion given the cell area. Then, following the Intergovernmental Panel on Climate Change’s (IPCC) approach [59], we obtained the committed carbon map by multiplying the biomass per 0.5, that is, the amount of committed carbon per pixel. The committed carbon emission is then the sum of all cells that fall within the burning polygons, considering the different products. The same approach was used for the biomass uncertainty map, since it provides a biomass density value to be used as an uncertainty interval of the value presented in the AGB map, thus resulting in a committed carbon uncertainty map. In the same way, the uncertainty of the committed carbon emission is then the sum of all cells that fall within the burning polygons, considering the different products.

4.3. Total and Regional Analysis

We adopted two approaches for the analyses: the vector approach, which was applied to evaluate the agreement between the total burned area detected by each product, and to estimate its impact on carbon emission; and the matrix approach, which was applied to investigate the spatial variations in these results.
On the vector approach, the total burned area was computed for each of the four products, considering the forest and non-forest classes. This processing was carried out using the ‘rgeos’ package [60] in R statistical software [61]. Subsequently, the C emission maps (EBA and EBA uncertainty) were used separately to extract the sum of committed gross C emission within each burned area polygon, considering the different classes of land cover. This process was carried out on R, using the ‘raster’ package [62]. Of the total 113,190 km2 burned area detected, considering all four products, 0.3% was not considered, due to polygon size incompatibility with the resolution of the carbon data. The most affected product was GABAM, whose deleted polygons summed 133.3 km2. This area, however, represents only 0.5% of the total burned area of this product, and therefore can be considered insignificant. The estimates were also made separately for each Brazilian state included in the study area, in order to generate information for decision making since the states have autonomy in seeking investments under Reducing Emissions from Deforestation and Forest Degradation (REDD+) initiatives.
To assess whether the error embedded in the burned area data, translated into the committed gross C emission estimate, is greater than the estimated emission uncertainty, we compared the absolute value of the difference in C emission estimate between every burned area product pair with the maximum uncertainty value between them. Therefore, this strategy can be considered conservative, since the maximum uncertainty value was used for the comparison. The following conditions were tested (Equation (2)):
I F { | C p 1 C p 2 | max ( U C p 1 , U C p 2 ) > 0 ;   the   burned   area   product   choice significantly   alters   the   carbon   emission   estimation | C p 1 C p 2 | max ( U C p 1 , U C p 2 ) < 0 ;   the   burned   area   product   choice   does   not significantly   alters   the   carbon   emission   estimation
Cp1 is the committed gross C emission estimation using burned area product 1n and Cp2 is the same, using a second burned area product. UCp1 is the committed gross C emission uncertainty associated to the estimation using burned area product 1 and UCp2, which is the same using a second burned area product. Therefore, if the absolute value of the difference between the committed gross C emission estimation among the two products is smaller than the committed gross C emission estimation uncertainty, we can conclude that the difference among the products is within what is expected for the uncertainty of the AGB data, and therefore, the choice of one product or another does not cause significant over- or underestimation of committed gross C emission in the considered area.
For the matrix approach, the burned area products, considering the different land covers, were incorporated into a regular grid with an approximately 10 by 10 km spatial resolution. The incorporation took into account the proportion of the polygon falling inside each grid cell. This process was run on R using the ‘raster’ package [62]. The statistical comparison between the six possible combinations of product pairs was carried out using the non-parametric Kolmogorov–Smirnov two-sample test [63]. We used a bootstrap approach, implemented in R statistical software v.4.0.2 [61], with 10,000 iterations. For each iteration, the algorithm randomly raffled a sample of 10% of the total cells in each case with replacement. Finally, based on the bootstrap results, we calculated the mean and standard deviation of the 10,000 p-values. The comparison considered only cells that presented burning detection by at least one product.
Subsequently, for the spatial comparison, the regular grid was converted into raster files carrying the information of burned area for each combination of burned area product and land cover. Like the statistical comparison, we considered only cells that presented burning detection by at least one product. The burned area maps were then compared two by two, within each land cover class, using the fuzzy numerical method implemented in the Map Comparison Kit 3 (MCK) application [64]. The fuzzy numerical method takes into account grades of similarity between pairs of cells in two numerical maps. Although it is a cell-by-cell comparison method, it considers the neighborhood to express the similarity of each cell in a value between 0 (fully distinct) and 1 (fully identical) [65]. The fuzzy technique allows one to distinguish real differences from minor mapping artifacts, besides giving a spatial assessment, clarifying not only the location of disagreement but also the severity [66].
Considering that the burned area registered in a cell is partly defined by the cells found in its proximity, the fuzziness of location influence level is accounted for via a function. In this study, we adopted an exponential decay function with Halving distance equal to 2 and considered the neighborhood radius as equal to 4. This is the default setting for the algorithm implemented in MCK. In the fuzzy numerical model, the similarity of two values (a and b) is calculated following Equation (3). The resulting statistic for overall similarity is then the average similarity over the whole area considered.
S ( a , b ) = 1   | a b | max ( | a | , | b | )

5. Results

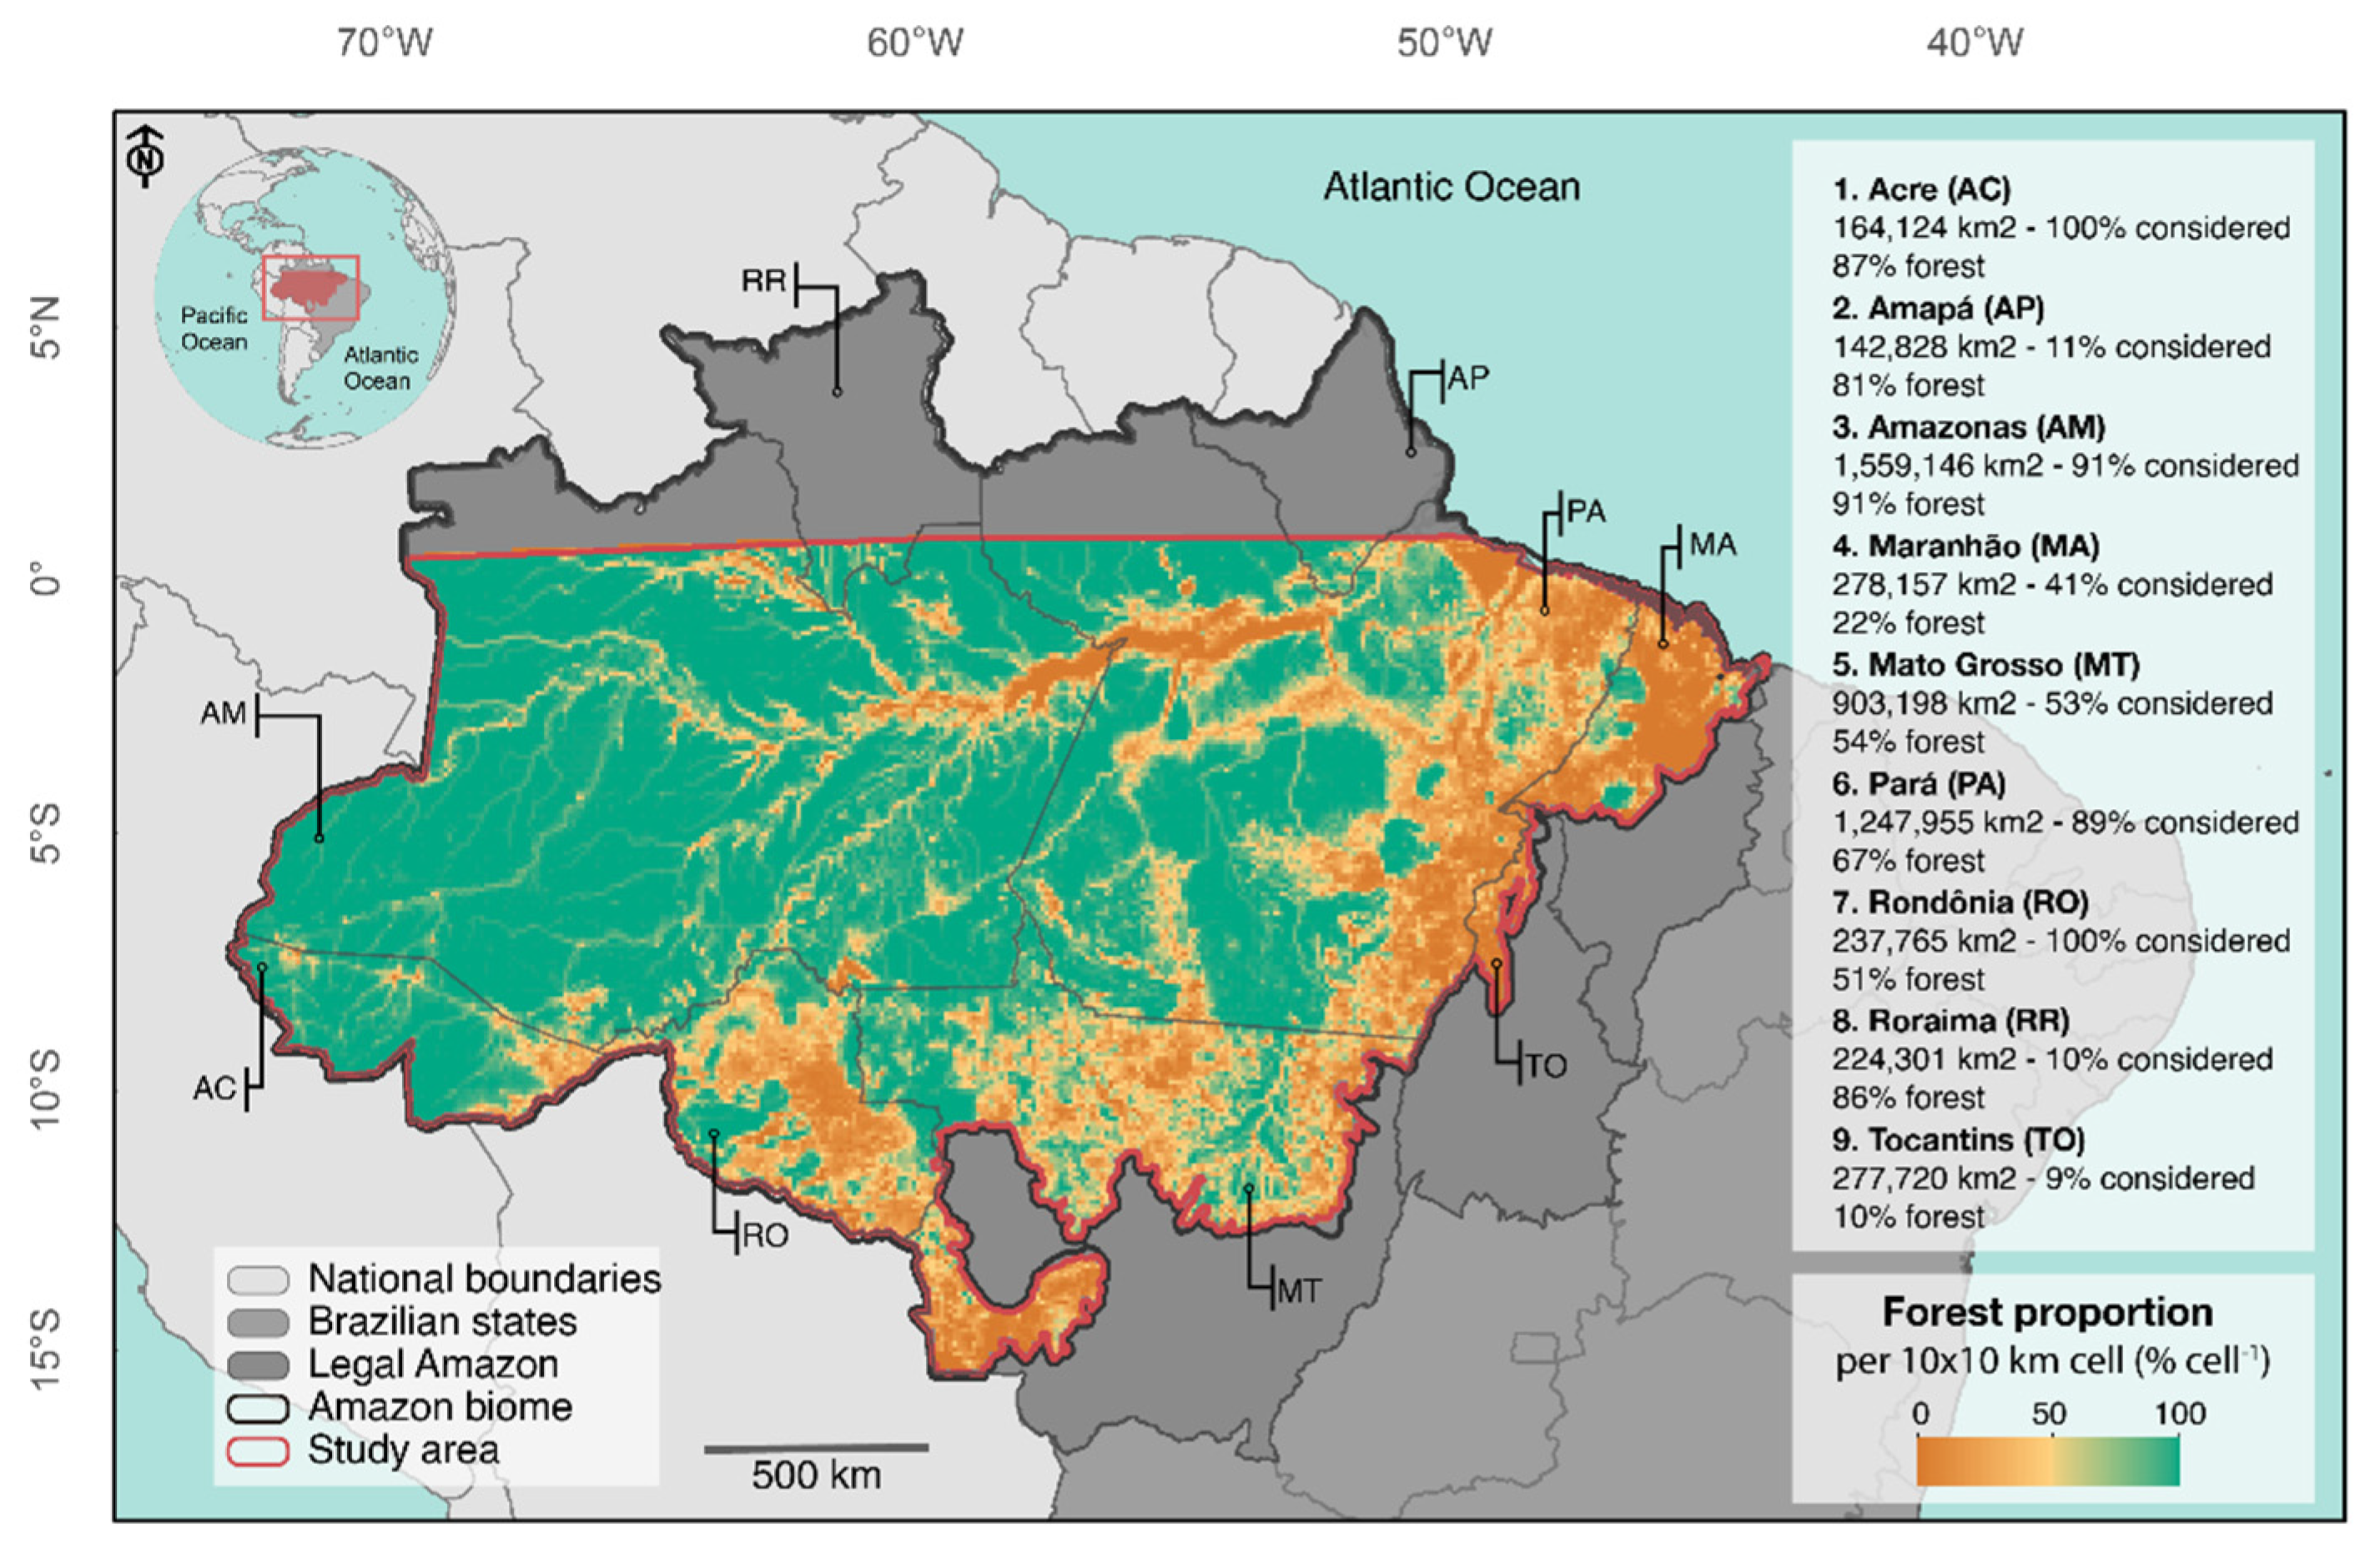
5.1. Vector Approach: Intercomparison of Total Burned Area

The four burned area products differ according to the total area mapped and, consequently, total C that is emission related (Figure 2). The most similar products, both in total mapped area and C emission, are TREES and MCD64A1. MCD64A1 presents only 2.9% less total burned area compared to TREES, 0.9% in non-forest and 10% in forest areas (Figure 3). The most significant difference occurs between TREES and Fire_cci, with the second mapping 58% less burned areas; 52% and 78% for non-forest and forest, respectively.
Regionally, TREES, MCD64A1 and GABAM present the same pattern of burned area both over non-forest and forest, whereby eastern Amazonian forests (Pará state) were the most affected area (Figure 3, Figure S2). Despite this, GABAM presents 41% more forest area mapped in this region than TREES and 22% more than MCD64A1. GABAM also presents more burned area over forest in central Amazonia (Amazonas state), mapping 120% more burned area than TREES and 85% more than MCD64A1. In the far east Amazonia (Maranhão state), on the other hand, GABAM has a poorer performance, mapping up to 53% less burned area than the TREES product.
In southwestern Amazonia, in Acre state, we also observed great divergence between the products. TREES presents more burned areas in non-forest than the other products, and the difference can be up to 40 times when compared with Fire_cci. Interestingly, GABAM presents the highest forest burned area mapped, close to the TREES product, and 160 times larger than the Fire_cci product. Fire_cci, in general, registered less burned area in all cases and sites.

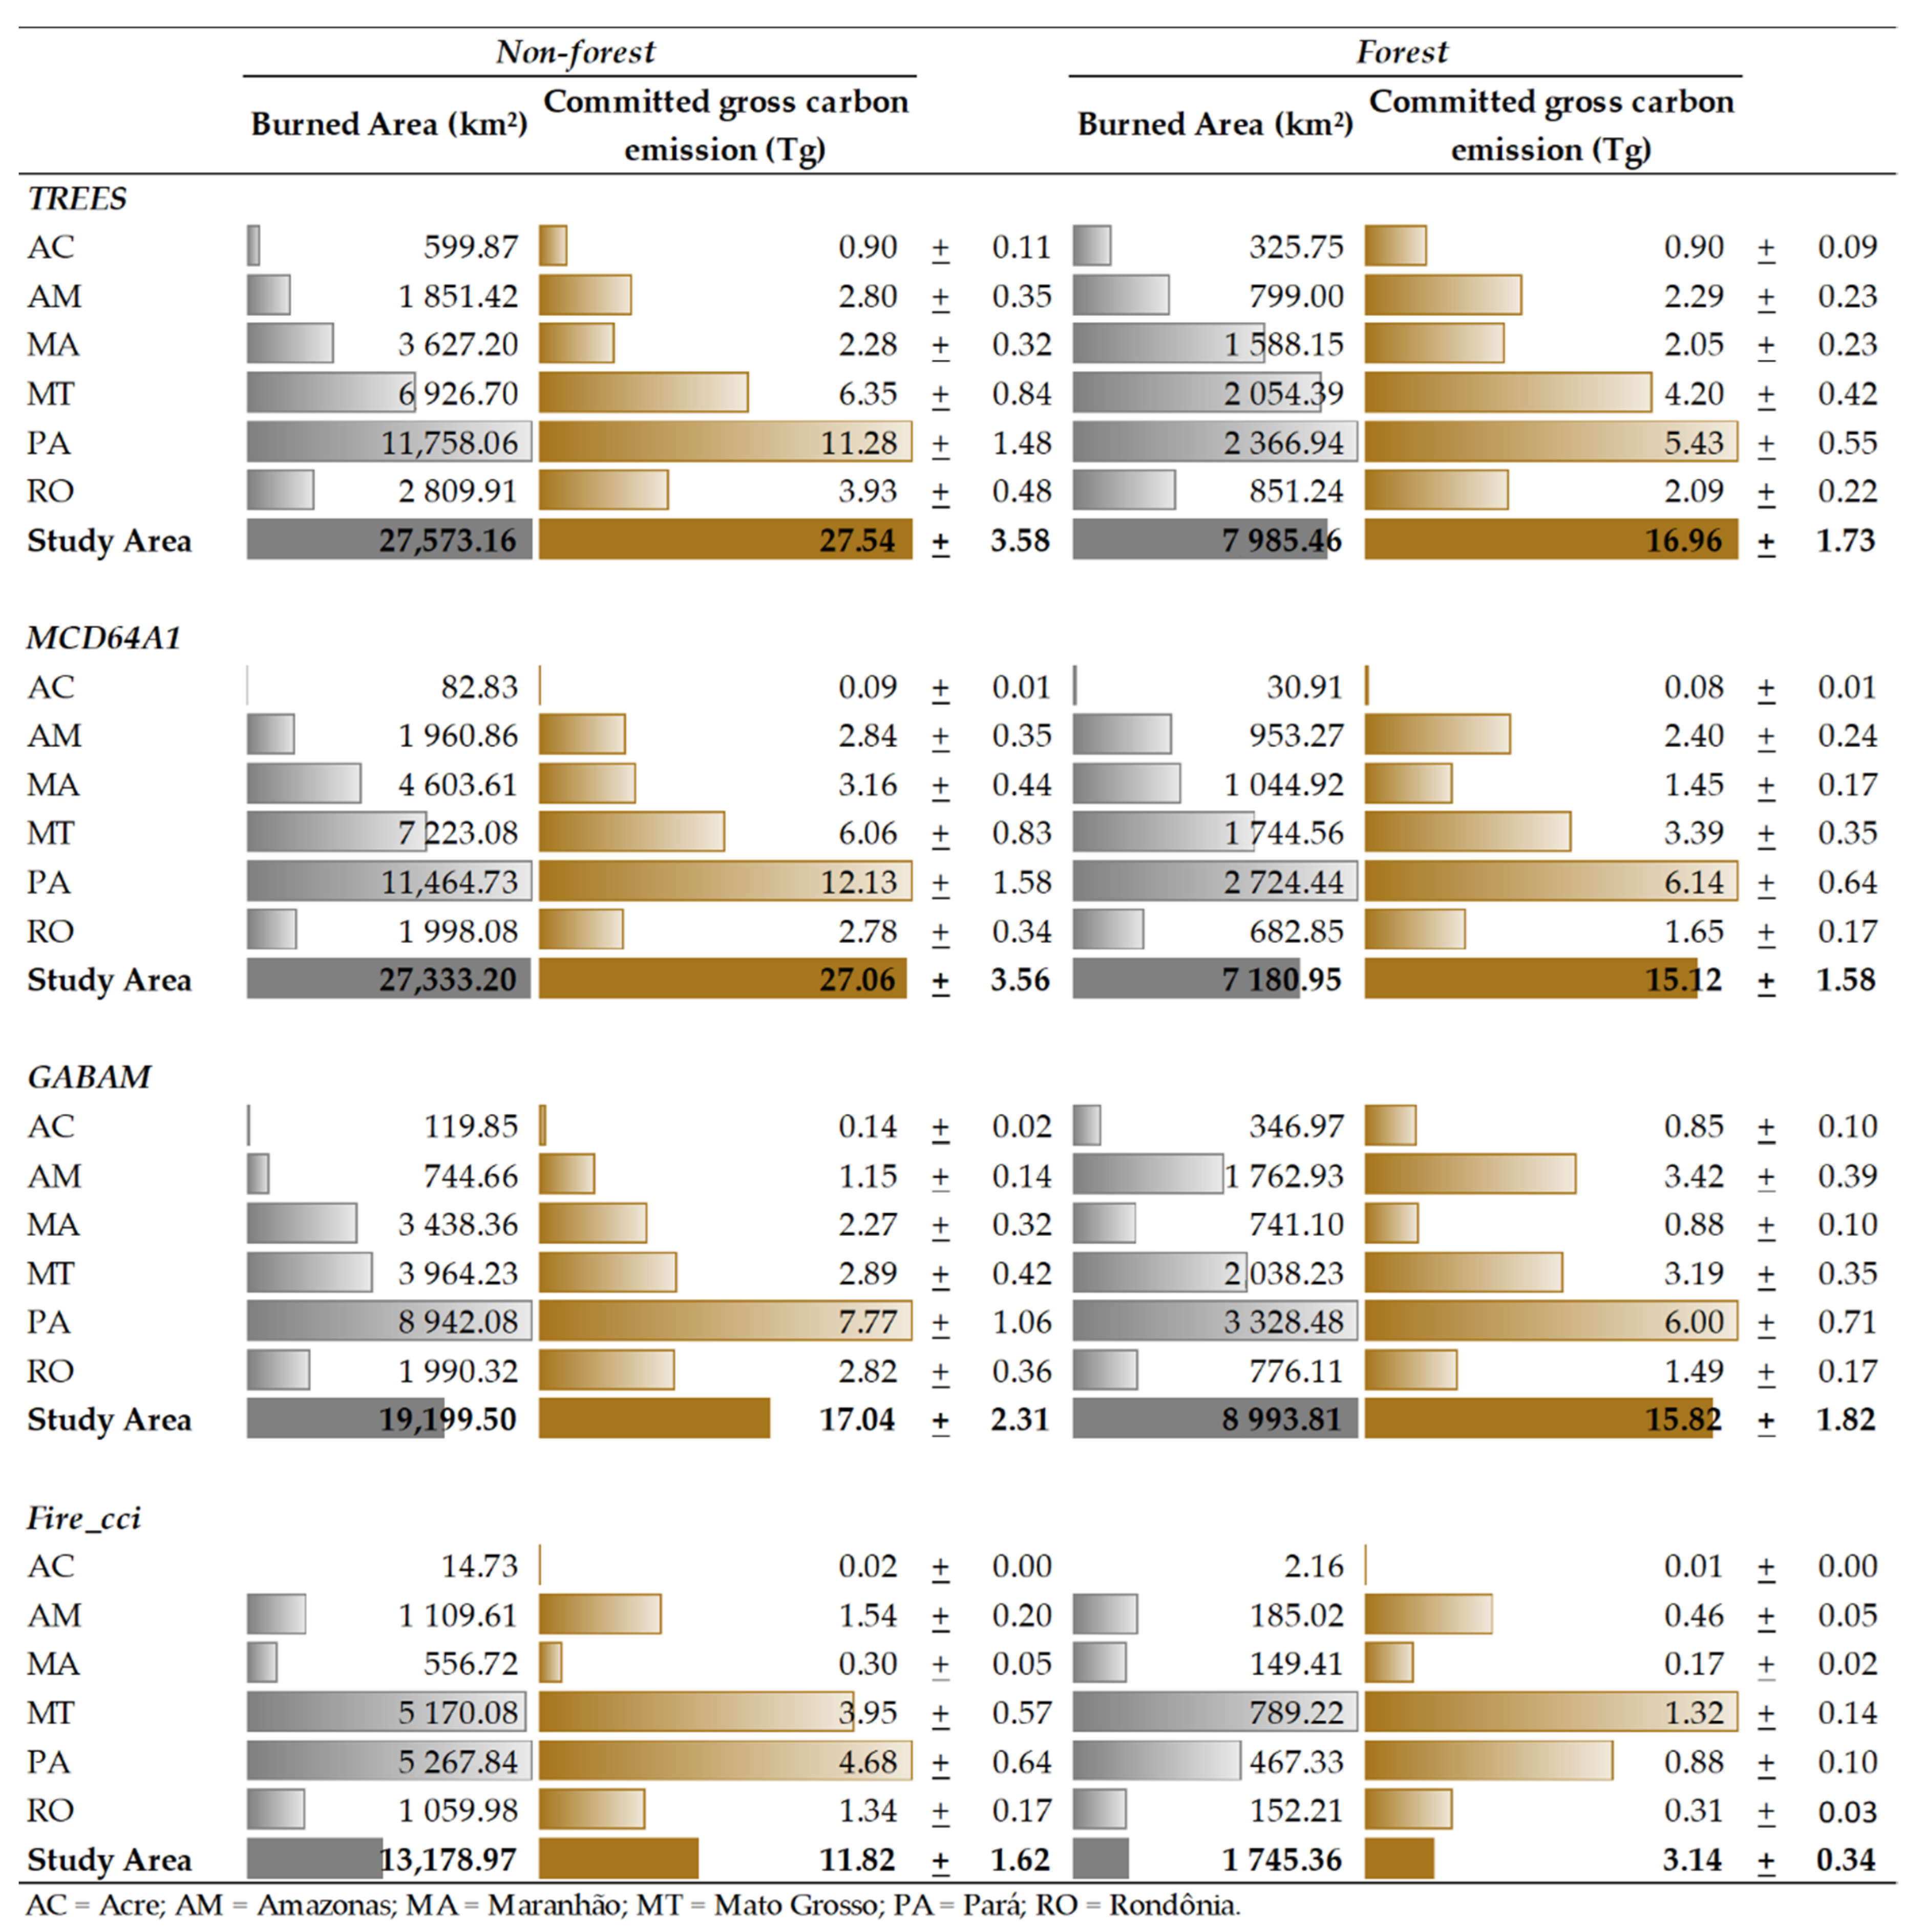
5.2. Vector Approach: Impact on Committed Gross Carbon Emissions Estimates

Such differences in burned area among the products are reflected in the variance observed in the committed gross C emission estimates (Figure 3). The use of the Fire_cci product resulted in 29.54 ± 3.36 Tg C less estimated carbon emitted, a difference of 66% compared to the regional map developed by TREES. In contrast, the use of MCD64A1 results in only 5% (2.32 ± 0.17 Tg C) less than the carbon emission estimated by TREES. If only the forest areas are analyzed, TREES is also the product that generates the highest carbon emission, at 16.96 ± 1.73 Tg C for 2015. The product that comes closest to this estimate is GABAM, with a difference of 11% (Figure 3). The same pattern can be observed with the Baccini dataset, considering the total emission on the study area (Table S5). Nonetheless, the Baccini dataset seems to overestimate the committed gross C emission compared to the EBA dataset, which makes the EBA estimates conservative (See Supplementary Material (S§3) for more information). Even though GABAM presented a greater area of burned forest than TREES, it had lower carbon emission estimate. This is due to the distinct spatial dispersion of the burned areas detected by each product. Since the emission is estimated as a function of initial biomass, it will depend on the spatial location of each burned area (Figure S3).
For the southern and western Amazonian states (Acre, Mato Grosso and Rondônia), the TREES product presented emission estimates superior to all other products for both forest and non-forest. For example, in Acre state, the emissions estimated using TREES were 57 (0.90 ± 0.11 Tg C) and 171 (0.90 ± 0.09 Tg C) times larger than those derived by using Fire_cci for non-forest and forest, respectively. On the other hand, in eastern Amazonia, Pará state, although the emission estimates using TREES and MCD64A1 were similar (16.72 ± 2.02 and 18.27 ± 2.23 Tg C, respectively), the differences between them still resulted in up to 9% more carbon emission than was estimated using the MCD64A1 product, mainly due to the larger forest area mapped by this product.
So far, we have already observed that there are differences between the burned area products that can generate under- or over estimates of carbon emissions. Using the reasoning presented in Equation (2), we show that for non-forest land cover, TREES and MCD64A1 are the only products that can be used with no significant difference (Figure 4). For forest areas, the choice between these two products may bring over- or underestimates. In this case, the comparison of GABAM with these two products showed results within the range of uncertainty. Analyzing each state separately, we observed the spatial difference of this pattern. For non-forest areas in Acre, for example, no product can be used in a similar way to another. Likewise, in the forest areas in Maranhão, all products showed differences in their estimates of carbon emissions that were greater than their uncertainty (Figure 4). In general, the choice of the Fire_cci product always results in carbon emission underestimations when compared with the others (Figure 3).

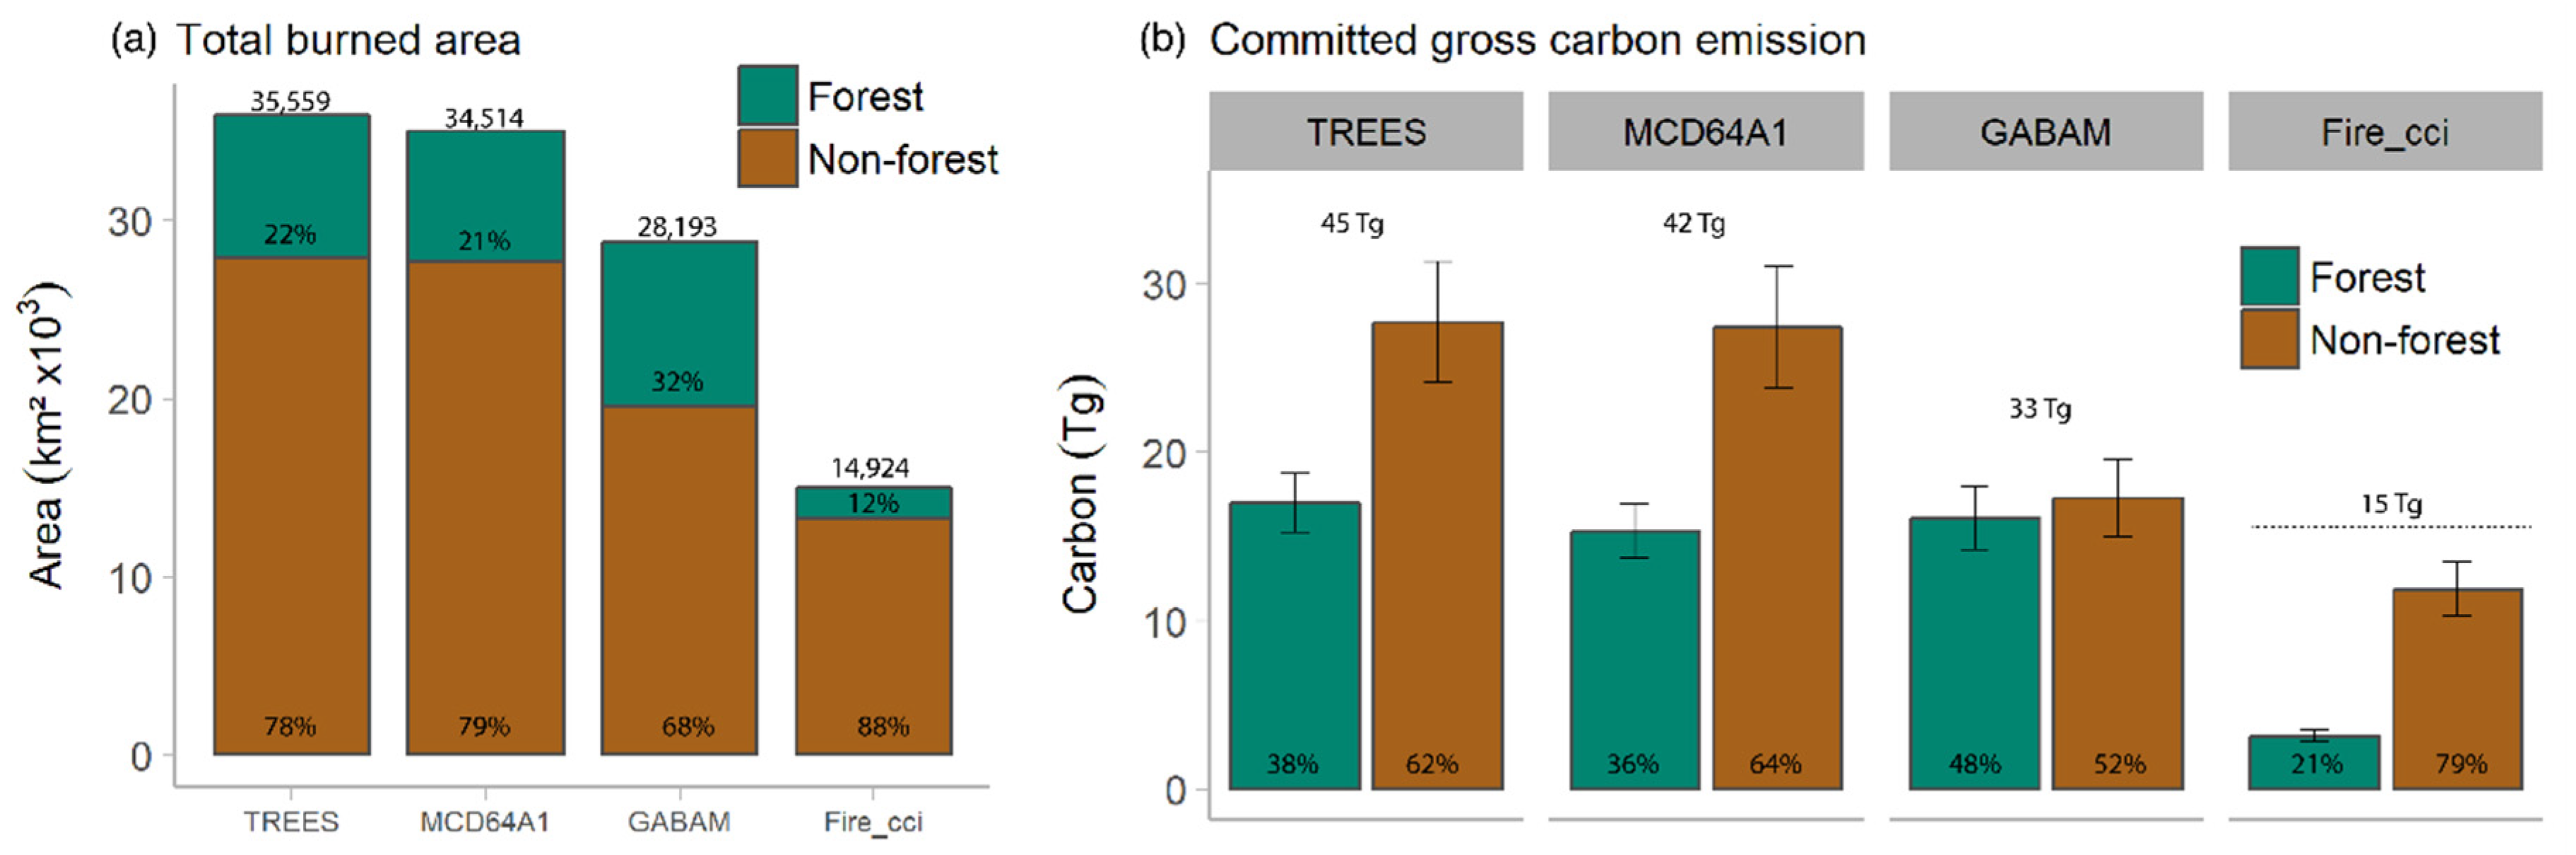
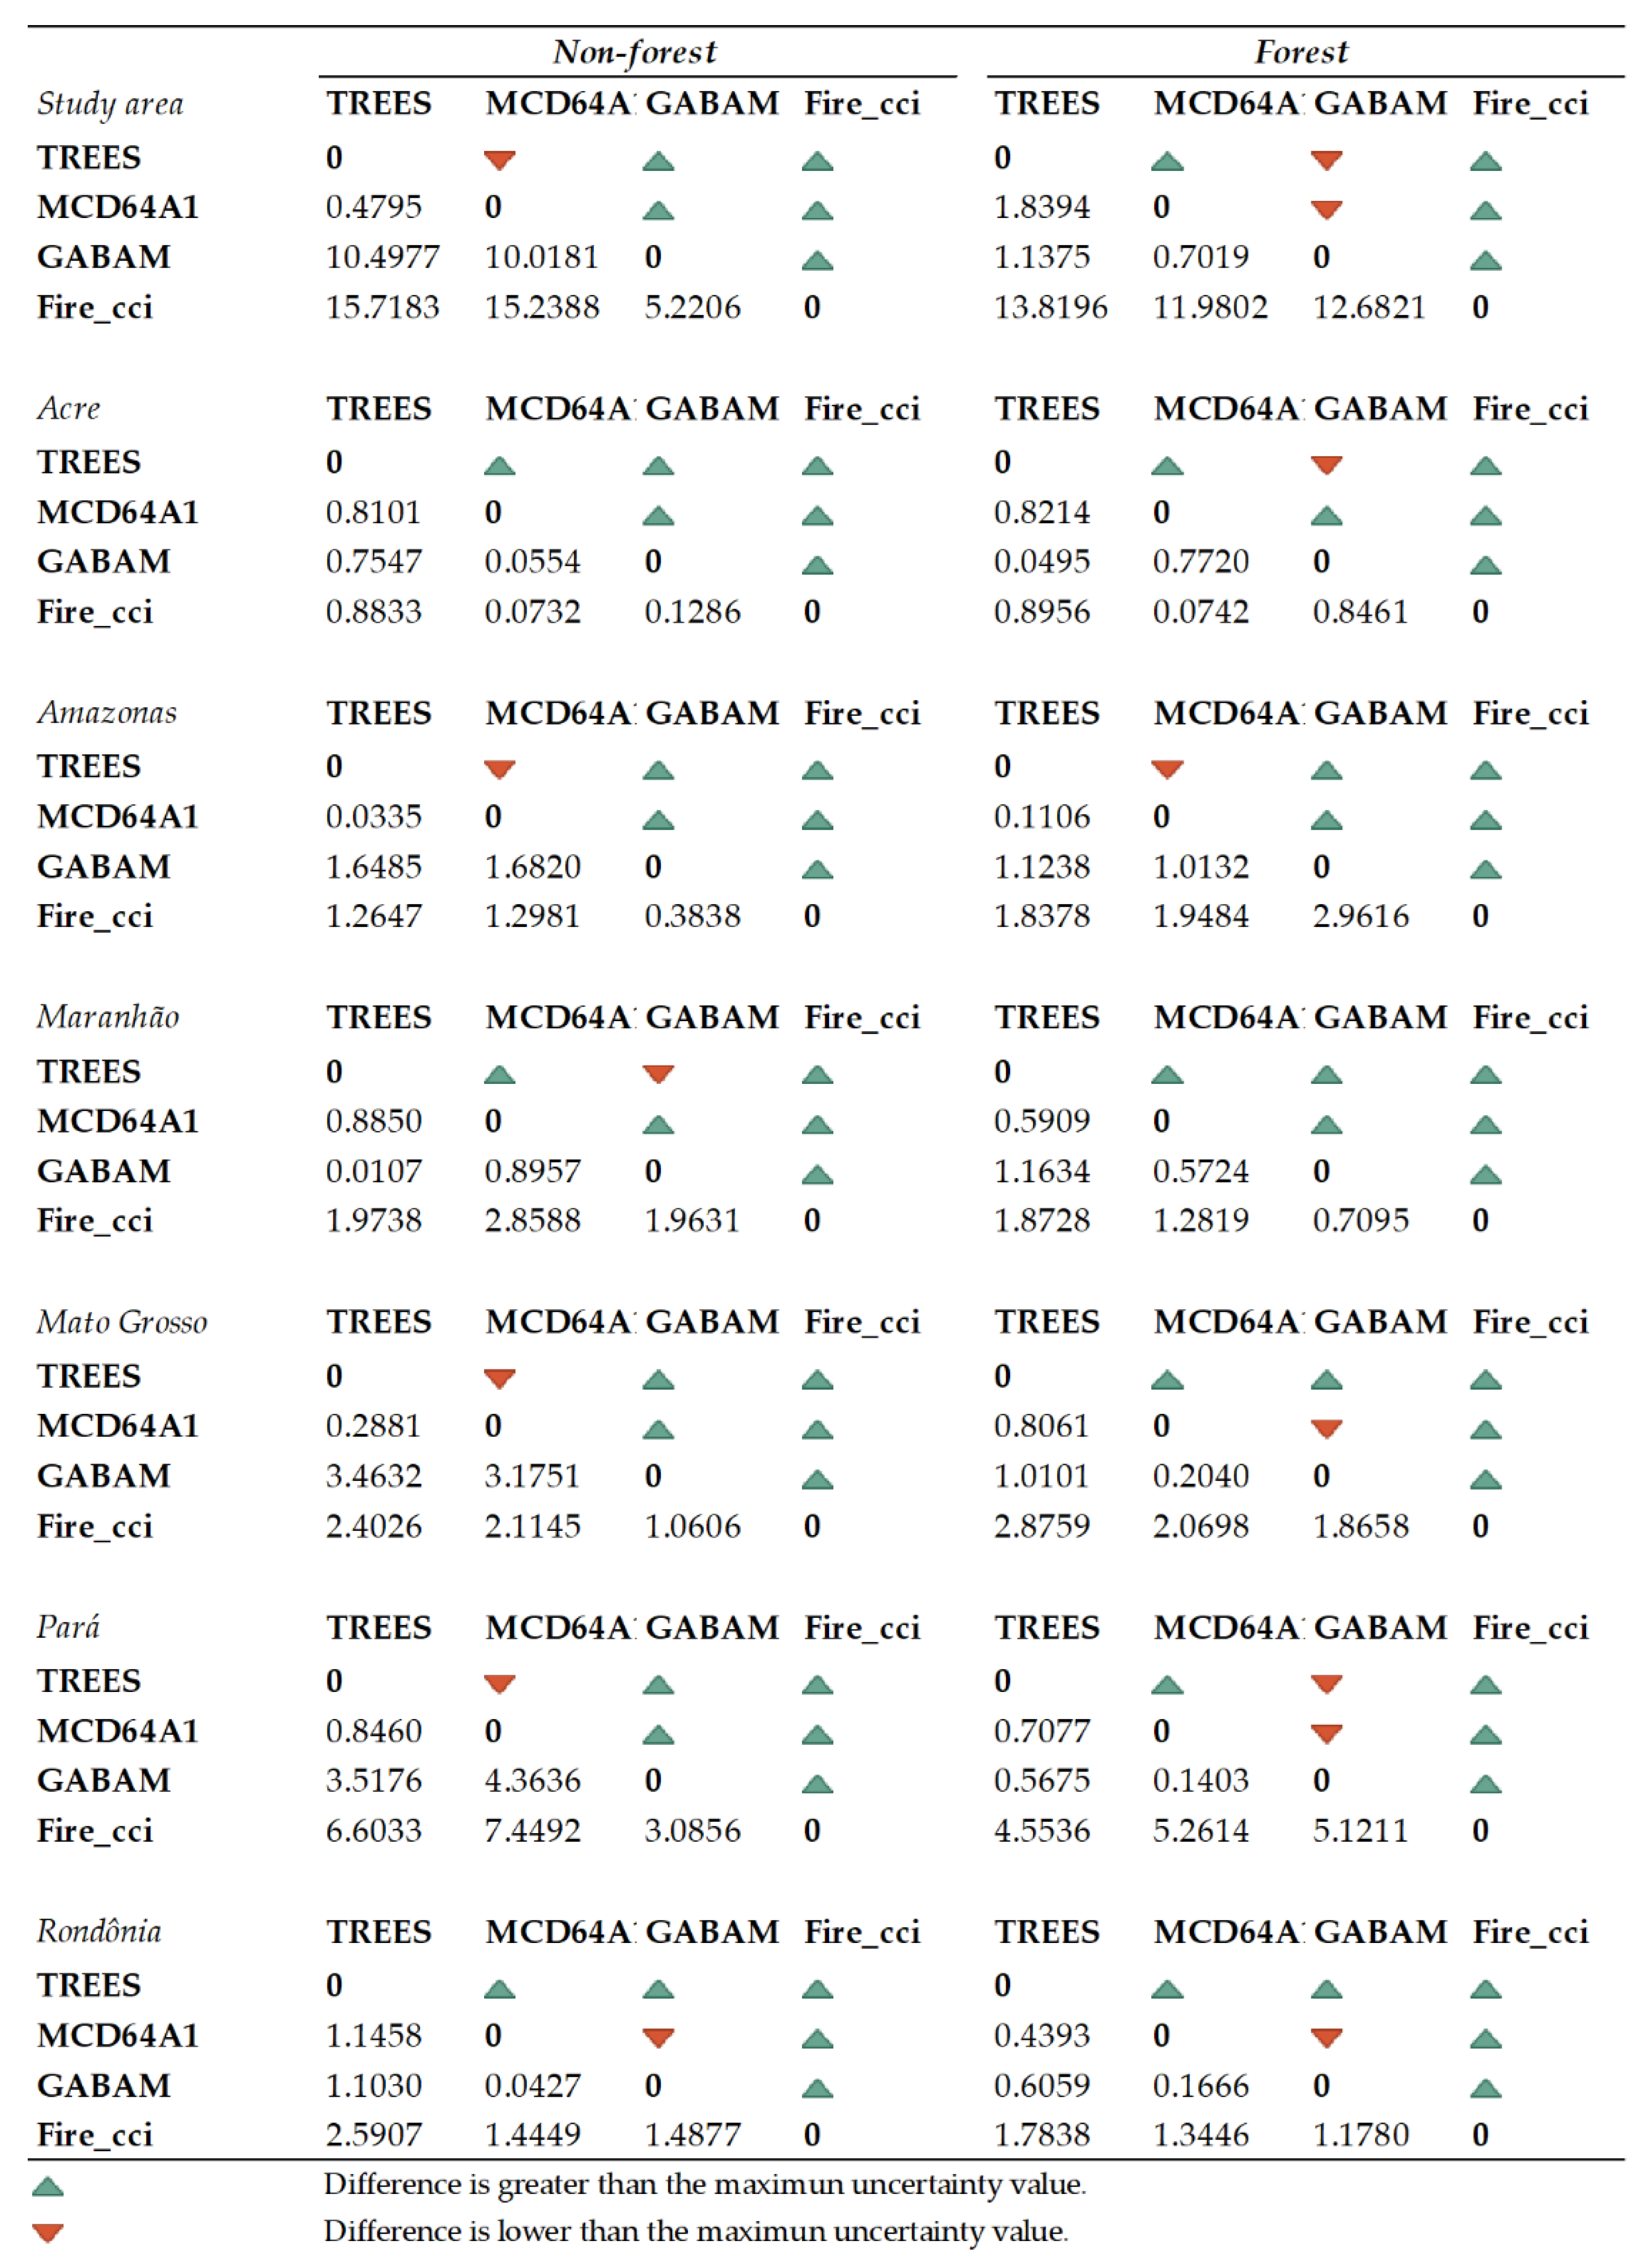
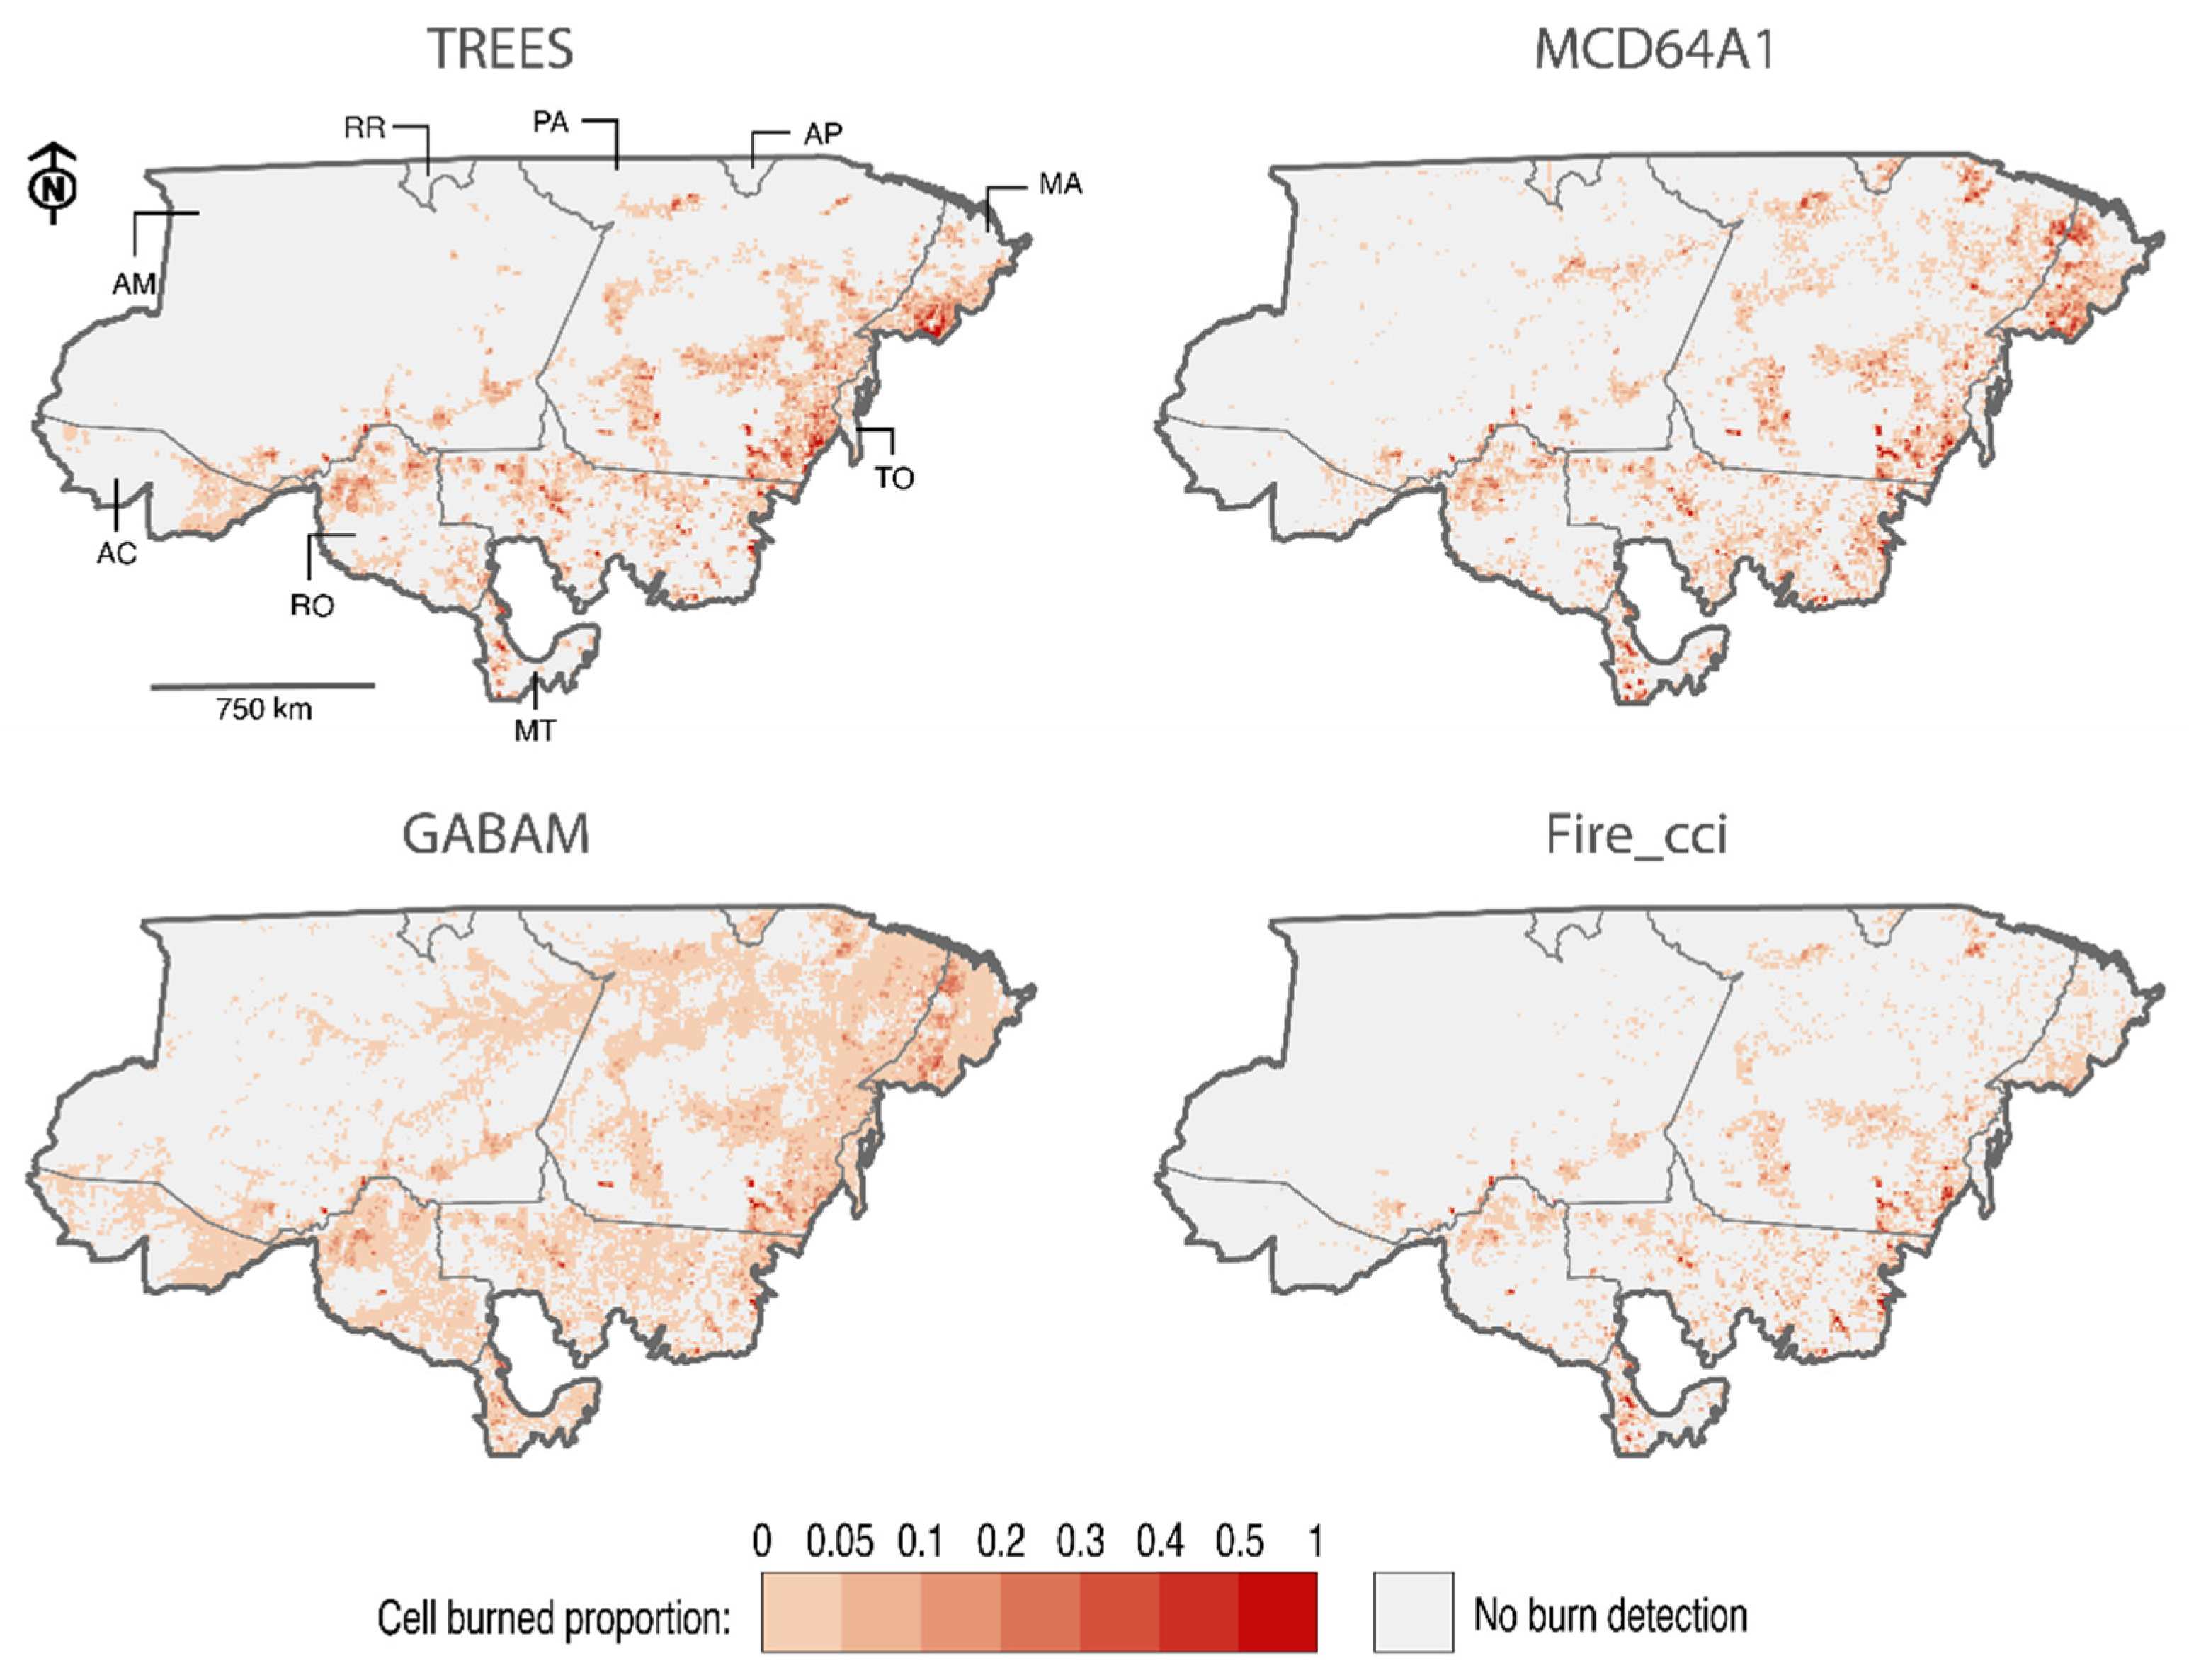
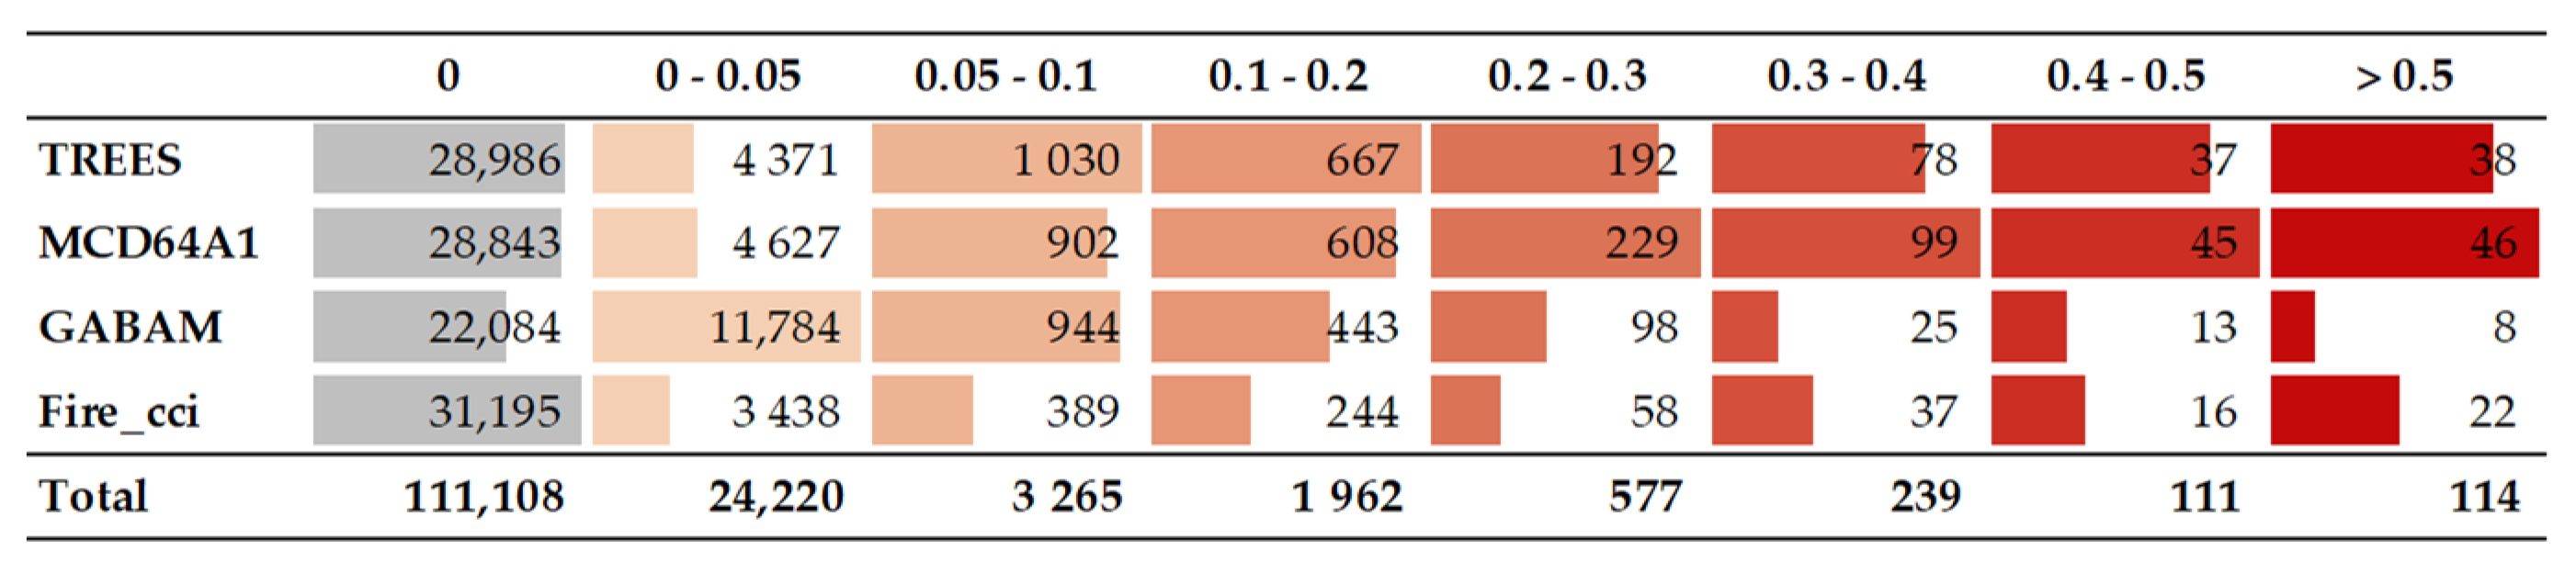
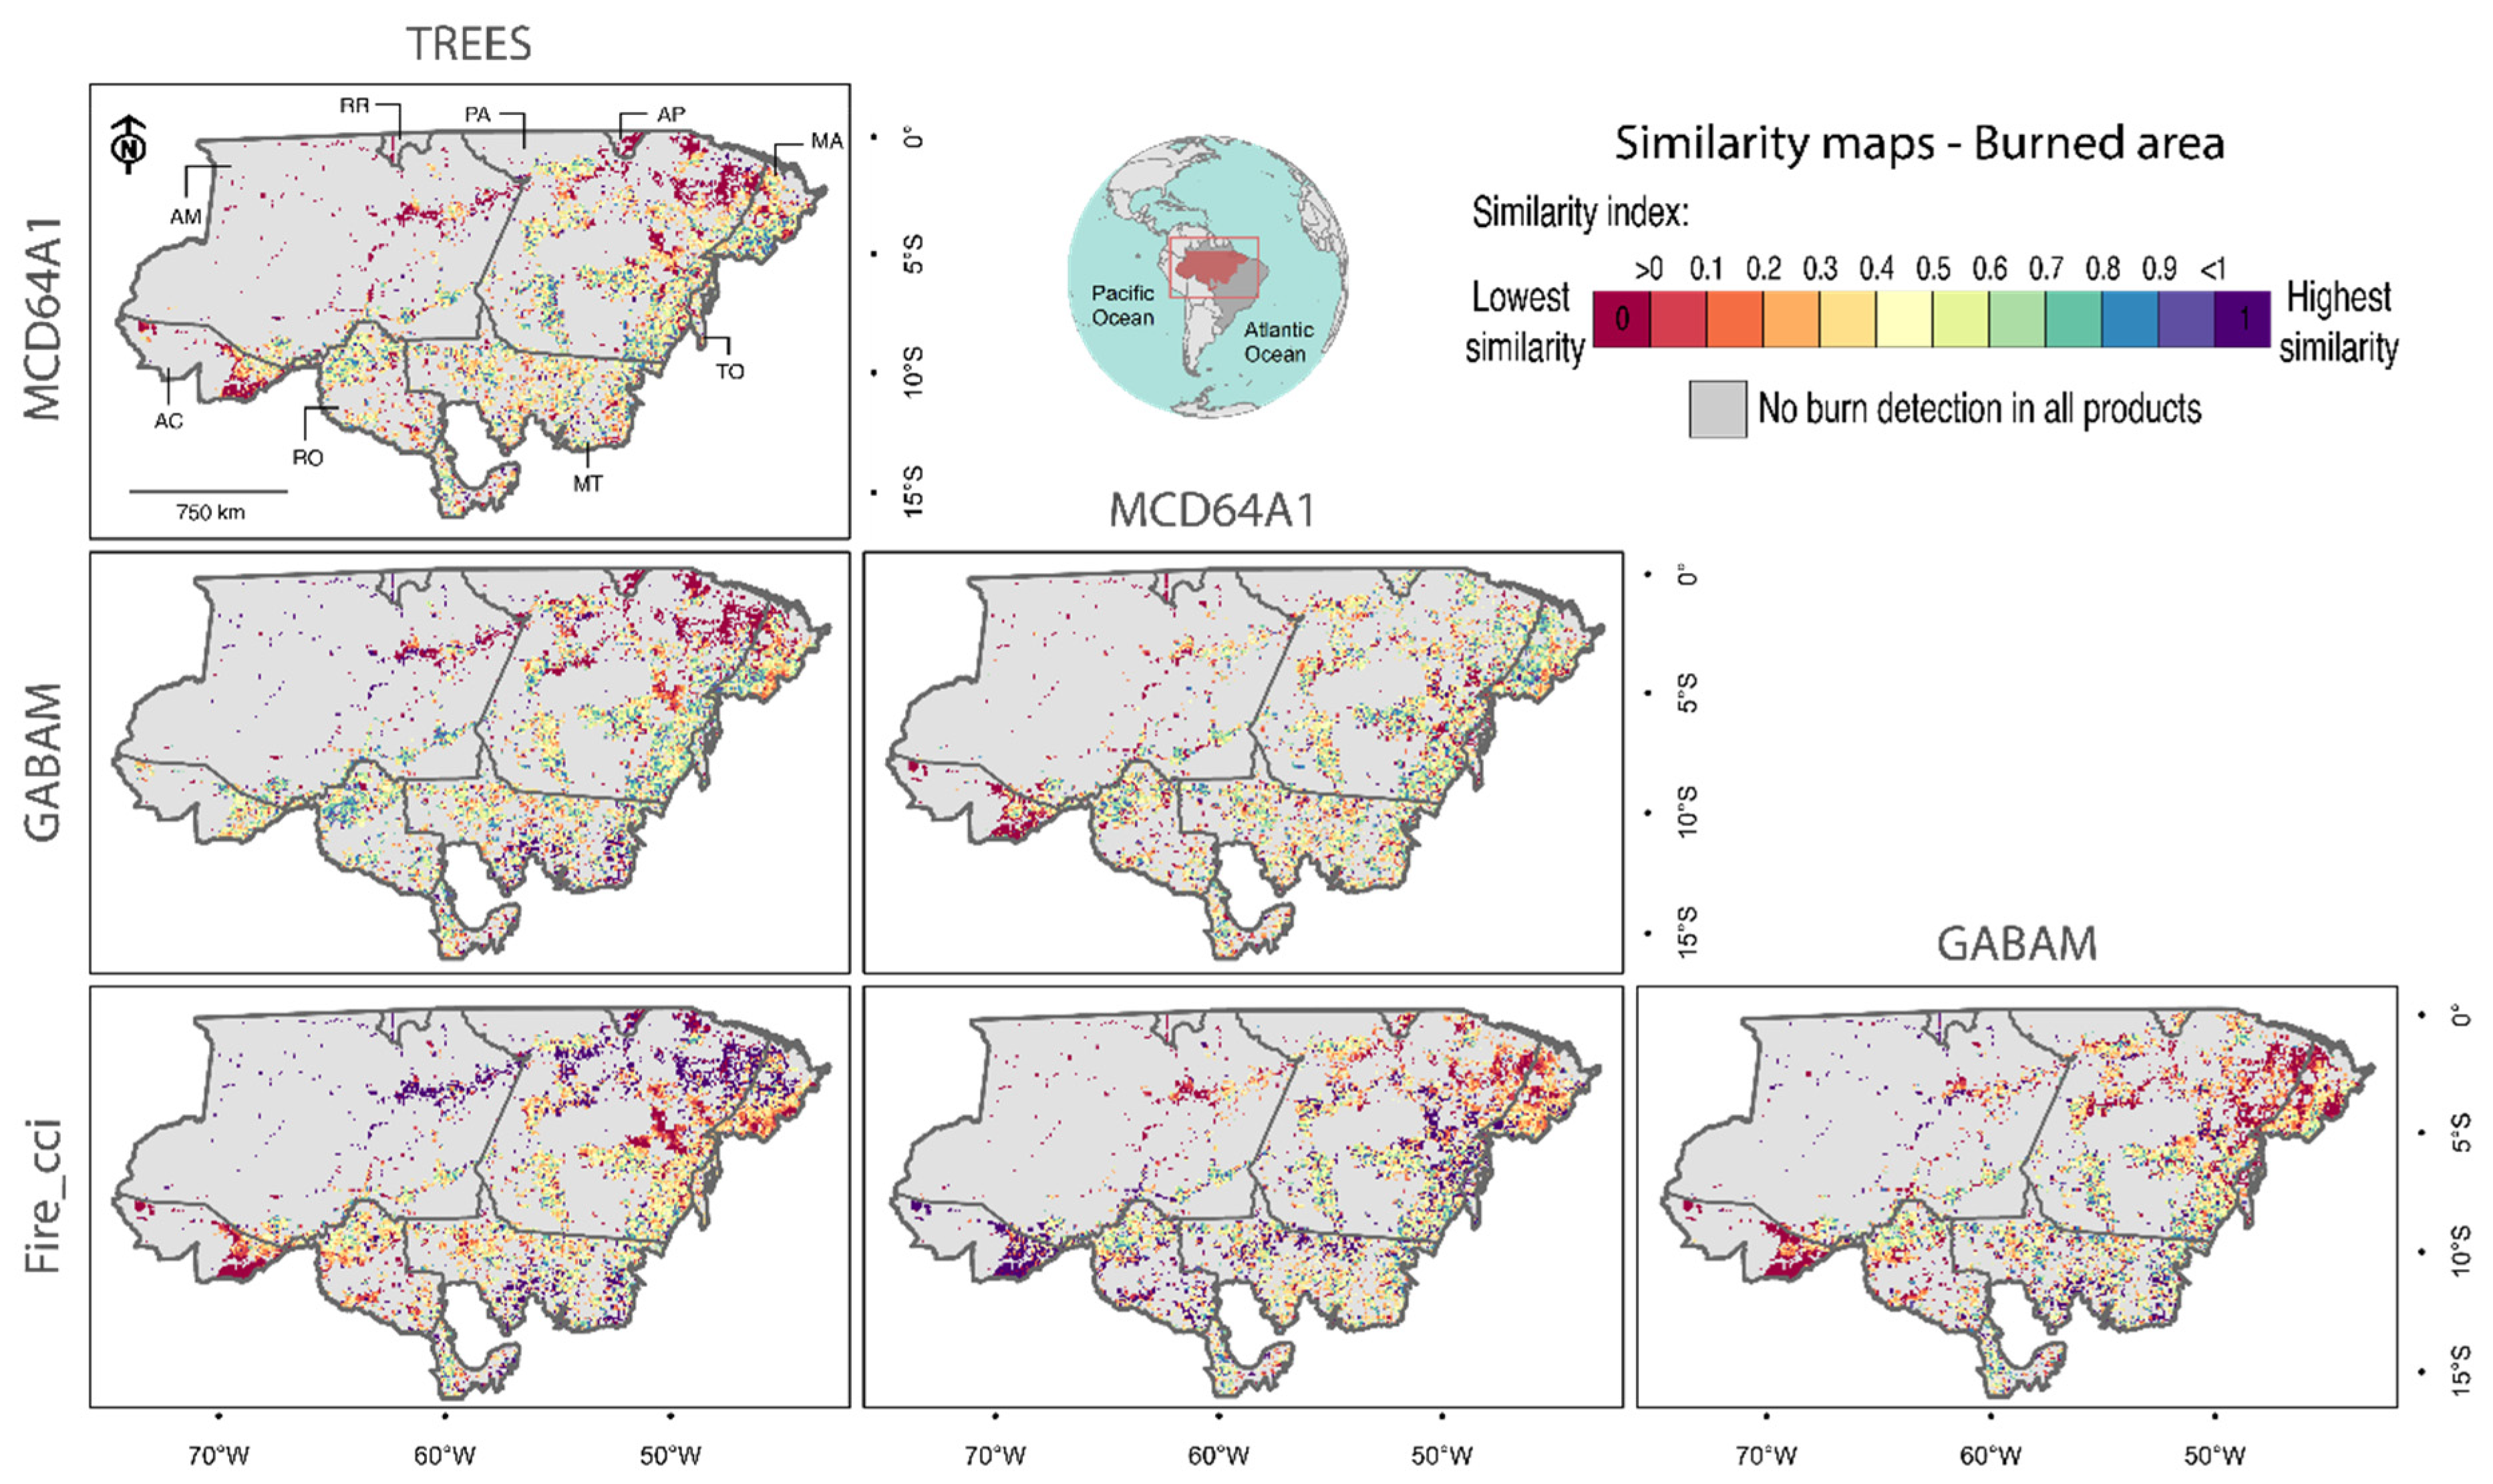
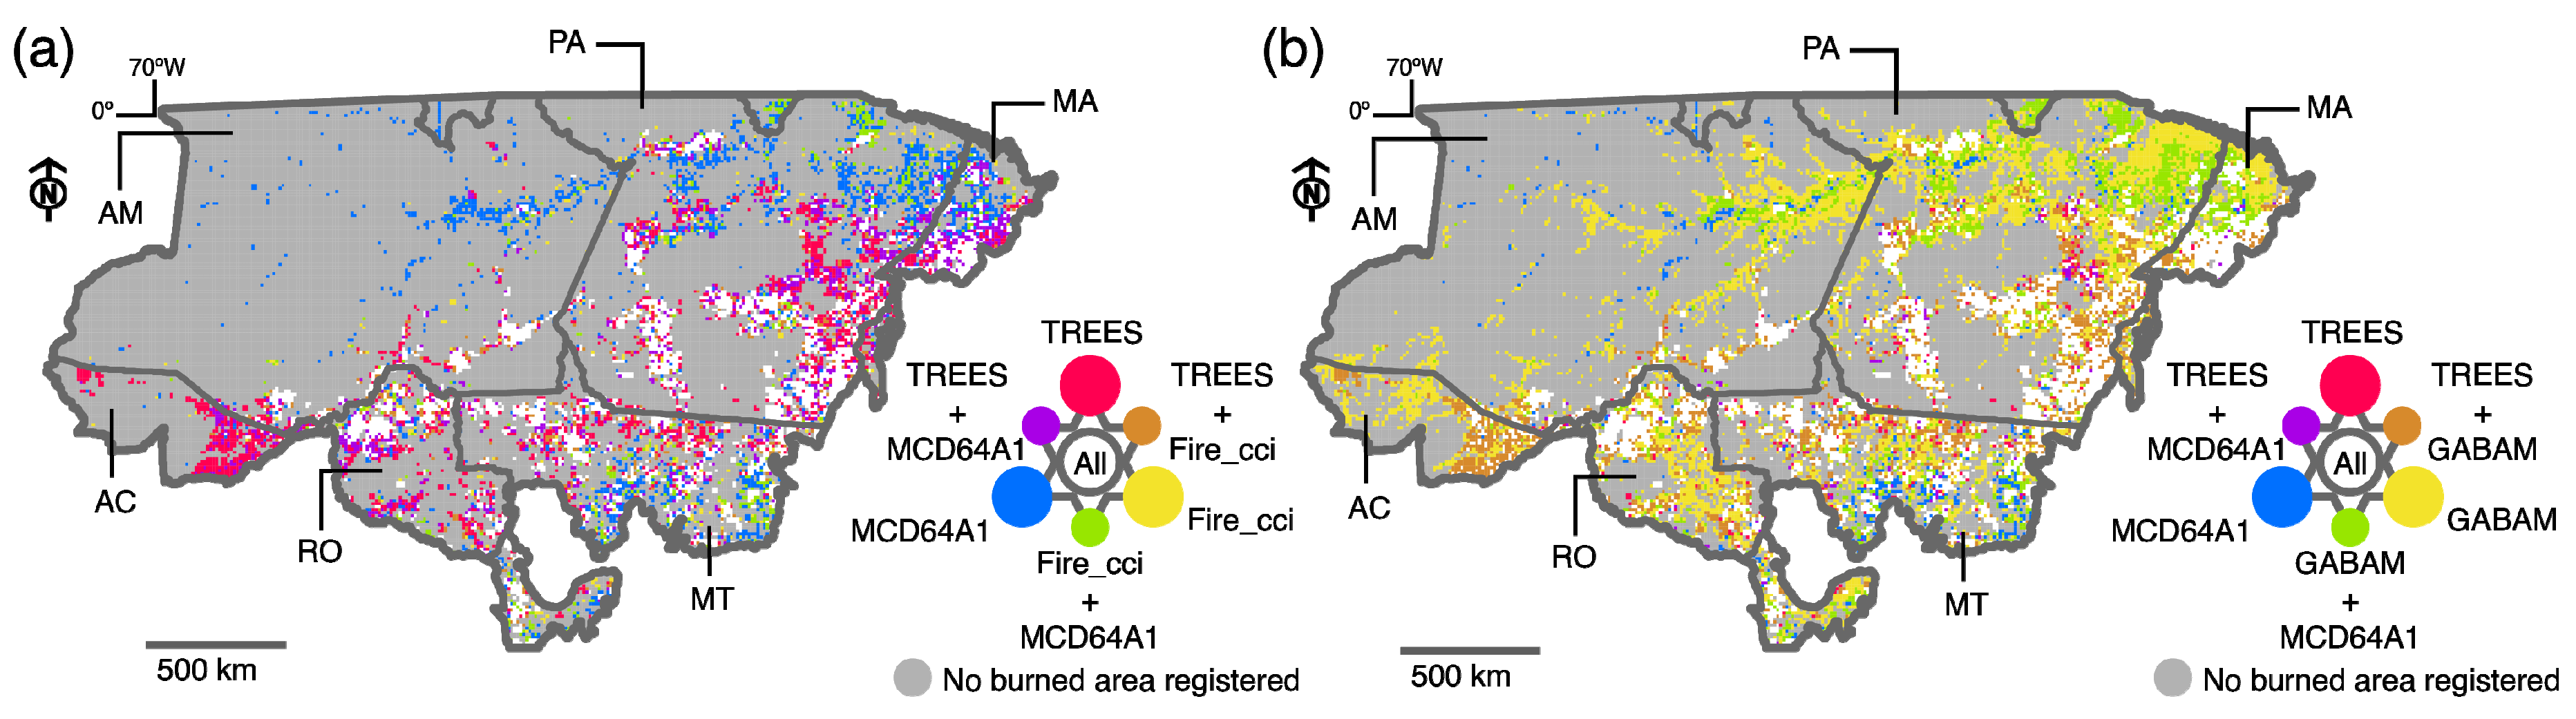
5.3. Matrix Approach: Statistical and Spatial Intercomparison

Corroborating the differences in magnitude found in the vector analysis, the TREES and MCD64A1 products were the only ones that did not present significant differences at a 95% confidence level (p > 0.05). The same pattern can be observed when forest and non-forest are analyzed separately (Table S6). Considering this comparison, the bootstrap approach resulted in 81% of the 10,000 iterations (84% for forest and 82% for non-forest) of non-significant p-values (p > 0.05). All the other combinations resulted in 100% significant p-values at a 95% confidence level.
The four products also present spatial divergence. Despite the small difference in total mapped area, TREES and MCD64A1 also presented spatial divergence, mainly on the extreme north of the study area and in Acre state (Figure 5). The GABAM product presents a lot of small patches of burned areas, which reflects the higher number of cells with low burn proportion (Figure 6). Although this product does not present the highest burned area, it includes the most spatially broad mapping among those considered. Analyzing the correlation, given by scatter plots of the percentage of burned area per cell, among the different pairs of products, we observed that all relations are statistically significant at a 95% confidence level (p < 0.05). The relation between TREES and MCD64A1 is the closest to 1. The determination coefficients are, however, intermediate for all comparisons, ranging from 0.47 (TREES vs. Fire_cci) to 0.66 (MCD64A1 vs. GABAM) (Figure S4).
The similarity analysis allows the identification of the pairs of products that are the most spatially coherent. In general, the similarity indexes are medium to low between all products (Table 3). Considering the study area, the similarity indexes are always between 0.4 and 0.5, regardless of the land cover. When we distinguish forest and non-forest areas, we can see two patterns: relative higher indexes when Fire_cci is considered for comparisons in non-forest areas, and relative lower indexes when GABAM is considered for comparisons in forest areas. The first pattern can be explained by the reduced extent mapped by the Fire_cci product; the more conservative the mapping, the greater the chance of being more similar to other products, and this is the case for Fire_cci. The second pattern, on the other hand, can be explained by the opposite reasoning. GABAM has the largest extent mapped in forest areas, and therefore a greater chance of mapping areas the other products did not.
Table 3. Overall similarity for each burned area product comparison pair, considering the whole area, and separating it into non-forest and forest areas. The result is provided for the entire study area, as well as for each Brazilian state considered separately. The similarity index ranges from 0 (fully distinct) to 1 (fully identical), and was calculated using the fuzzy numerical algorithm for map comparison.
Study AreaAC 1AM 2MA 3MT 4PA 5RO 6
Total
TREES × MCD64A10.4080.1940.3160.4580.4590.4060.451
TREES × Fire_cci0.4830.1140.6100.4370.5290.4910.395
TREES × GABAM0.4670.4700.4950.3950.5290.4160.544
MCD64A1 × Fire_cci0.5070.7840.3890.3690.5440.4930.583
MCD64A1 × GABAM 0.4500.1640.3760.4890.4680.4740.465
Fire_cci × GABAM0.4140.0730.4630.2540.5550.3870.408
Non-forest
TREES × MCD64A10.4280.2420.3900.4740.4640.4210.456
TREES × Fire_cci0.5050.1530.6530.4590.5430.5100.413
TREES × GABAM0.4490.2760.4200.4360.4840.4240.513
MCD64A1 × Fire_cci0.5330.7980.4540.3960.5530.5200.607
MCD64A1 × GABAM 0.4720.6510.4060.4890.4450.4840.480
Fire_cci × GABAM0.4800.6700.5130.3120.5630.4450.443
Forest
TREES × MCD64A10.5150.2910.4330.6740.5510.5070.507
TREES × Fire_cci0.5420.1510.5800.6990.5720.5430.425
TREES × GABAM0.5130.5190.5040.6080.5830.4510.514
MCD64A1 × Fire_cci0.5730.7900.4640.6140.6000.5480.578
MCD64A1 × GABAM 0.4930.2020.3820.6730.5270.4980.463
Fire_cci × GABAM0.4460.0900.4080.5460.5530.4180.386
Remotesensing 12 03864 i001
¹ AC = Acre; ² AM = Amazonas; ³ MA = Maranhão; 4 MT = Mato Grosso; 5 PA = Pará; 6 RO = Rondônia.
Regionally, both the extreme west and extreme east (Acre and Maranhão, respectively) are the regions where most differences in mapping occur, denoted by the broad range of similarity among the products. In Acre, the relative high similarity index found for MCD64A1 and Fire_cci (0.784) shows that both products presented less burned area detected in this state. These products did not present as much burned area as was captured by the TREES product (less 88% and 98%, respectively), in both land covers. When analyzing GABAM compared to MCD64A1 and Fire_cci, we observed that the lower similarity indexes are mainly due to forest affected areas for the study area, and for the Acre and Amazonas states. GABAM is the product with the highest detection of forest fires in Acre and Amazonas; its mapping areas were approximately 161 and 10 times greater than those of Fire_cci in the forest areas of these states, respectively. However, GABAM presents relatively poor performance for the eastern forests in Maranhão state. Although the overall similarity for Maranhão state is already relatively low compared to the other states, we see that the indexes for the non-forest areas are clearly lower than the ones for forest, indicating a greater divergence between the products for non-forest areas in this state (Table 3).
Despite the fact that most values of similarity indexes are intermediate, as they are averages for each region, similarity scale extremities can be observed spatially in Figure 7 (and Figures S5 and S6, for burned area over forest and non-forest, respectively). This visual spatial analysis allows the identification of regions that are the more cohesive, or not, among the burned area products. Between TREES and MCD64A1, most of the low similarity registries occur in the north region, where MCD64A1 presents better performance, and in southwestern Amazonia, where TREES registers more burned area (Figure 8a). Between TREES and GABAM, little similarity occurs on the north, mainly in the northeast of the Pará and Amazonas states, where GABAM presented more fire-affected areas. Even in Acre, where these products present approximately equal estimates in forest affected area, there is divergence, mainly in the western part of the state (Figure 8b). The same occurs between MCD64A1 and GABAM, with the addition of minor similarities in Rondônia state. The low performance presented by Fire_cci in mapping as much burned area as the other products is highlighted in Figure 8, which shows that most cells contain information exclusively from TREES or MCD64A1, or a combination of them.

6. Discussion

Every sensor considered to generate a burned area product has characteristics and specifications that incorporate limitations in the final product, affecting their performances regionally. The daily temporal resolution of MODIS data ensures a higher frequency of data acquisition and minimizes cloud cover, important factors for monitoring tropical areas. In these regions, depending on the time elapsed after the fire, the signs of burned areas can be removed quickly due to climatic conditions and the speed of vegetation regeneration [67]. Currently, with daily global products available, MODIS data have been widely used in burned area detection with 500 m spatial resolution [68,69]. Landsat data have a 16-day temporal resolution, but with the advantage of a 30 m spatial resolution in the optical spectrum. The spatial resolution allows a better definition of the boundaries of the burned area, avoiding a greater mixture of pixels from burned and unburned patches [36]. In addition, its long time series allows one to trace historical trends in fire dynamics [70]. Therefore, it is essential for the final user to understand such characteristics in order to consider them in the choice of which product is most appropriate for their application. In addition to the limitations of each data set, the spatial evaluations of the burned areas revealed that the similarities between the products varied regionally. Depending on the scale of the study to be developed, the choice of which product to use can have a significant impact on the final result.
Regarding the total burned area mapped, we can separate the products into two groups: two very similar products (MCD64A1 and TREES) and two other (GABAM and Fire_cci). Although the GABAM product presents 21% less total burned area compared to the TREES product, GABAM was the product that registered the most burned forest, reaching 11% more than the TREES product. This shows that the spatial resolution of GABAM (30 m) gives an advantage to the mapping of this land cover. In addition, GABAM presents the smallest commission error, considering the error related to forest areas for the TREES product. Although some studies indicate that the use of MODIS data at a 250 m spatial resolution can underestimate burned area by approximately 25% in relation to manually digitized burn scars based on Landsat images at a 30 m resolution [30,71], in a global comparison between the GABAM and Fire_cci products using the proportion of burned area in 0.25° × 0.25° grids, GABAM generally underestimated burned scars, and the inconsistency was attributed to the difference in spatial resolution of data sources [36]. GABAM’s higher resolution can allow better delineation of fire pixels, resulting in less pixels classified as burned globally. However, our study shows that in a regional analysis, this statement can change, since the GABAM product registered almost twice as much (1.9 times) total burned area as the product Fire_cci, for the study area considered. Nevertheless, GABAM’s developers warn that using Landsat images as the data source decreases the number of valid observations, considering Landsat’s temporal resolution and cloud contamination, which may explain its performance compared to TREES and MCD64A1 products. This limitation is especially critical over tropical regions, where vegetation recovery is quick, and cloud cover is persistent [36]. In this sense, the use of coarse-resolution images to detect fire can be justified, since they generally offer higher temporal frequency [17,18].
Among the products developed using coarse spatial resolution data, Fire_cci was the first to provide a global dataset with a 250 m resolution. Its validation process for version 5.0 indicated an overall accuracy of 0.9972, with 0.7090 global omission error and 0.5123 commission error (Table 2) [55]. Similarly, version 5.1 presented 0.6710 global omission error and 0.5440 commission error [56]. The errors reflect the conservative nature of this dataset, which may explain the great difference compared to other products. Its developer argues that, although globally higher than MCD64A1 c6, its errors for version 5.0 are better compensated, with a tendency towards underestimation, than most existing global products [55]. Fire_cci’s developers highlight its better detection accuracy for small patches (<100 ha) compared to MCD64A1 in a sample over Africa [55], although both had high errors for these small fires. Version 5.1 brings improvements in this direction. Despite the significant contribution of this product to fire modeling based on burned area global analysis, we show that regionally, the use of this product can be critical in underestimating the overall burned area, and thus consequently the fire-related impacts on carbon emissions.
In general, coarse-resolution products have been shown to be unable to adequately detect small fires (<100 ha) [72]. This limitation can lead to a considerable underestimation of global burned area [17,48], underestimating fires in croplands by as much as 10 times [17]. The newest collection (c6) in the MCD64A1 offers the significantly better detection of small burns (<100 ha) compared to older versions, but in general, it remains unable to map them adequately. It underestimated fire perimeter length in all vegetation classes, and care should be taken when using it for cropland regions [51]. Considering its higher spatial resolution, GABAM seems to detect small burned areas better. Although it was the product that presented the greatest range of mapping, it was not the one that detected the most extensive total area. Furthermore, when analyzing the regular grid of 10 km spatial resolution, most cells that had burned areas in GABAM recorded small burn proportions, suggesting small burnt patches.
The product MCD64A1 was the one presenting the biggest difference in omission and commission errors related to TREES, reaching commission errors 75% higher than the TREES product for forest areas and 83% higher for non-forest areas. The high omission error presented by this product, especially for tropical forests, also indicates the conservatism adopted in its methodology. Surprisingly, MCD64A1 was the product that came closest to the regional product TREES in total burned area detected. Shimabukuro et al. (2015) [19] estimated a difference of 21% between the MCD64A1 and a product built with Landsat TM images using the same methodology as TREES for Mato Grosso state. Here, we found a difference of only 0.15% between MCD64A1 compared to TREES for Mato Grosso state, considering the total burned area. However, this difference can reach 15%, considering burned areas over the forest. When analyzing the whole study area, these products registered significant spatial divergences. The product MCD64A1 recorded more fires in the north and northwest of the study area, mainly in the state of Amazonas, compared to TREES. The TREES product concentrates on more exclusive mapped areas in the southwest, mainly in Acre state. The burned areas in the north of the study area, presented by the product MCD64A1 and also by the product GABAM, seem to follow the hydrography (Figure S7). One hypothesis would be that these burned areas would partially correspond to flooded regions. Many detected areas occur along the margins of the Amazonas river and water presents low reflectance in all wavelengths, similar to burned areas. As a brief analysis, we assessed the burned areas of the four products in relation to the hydrography to calculate the proportion of intersection (Table S7). Even the percentages of burned area over the hydrography mask are small for all four products (maximum of 1.5%), and MCD64A1 and GABAM are the products with the largest overlap (1.5% and 0.9%, respectively). If we compare regionally, Amazonas is the state with the largest overlap presented by these two products (10.3% and 4%, respectively).
The detection of burned forest worldwide is made difficult when fire does not reach the forest canopy, since the spectral signal does not change sufficiently to be detectable by remote sensors. It has been shown that in areas with high leaf area index (LAI) and percent tree cover, there is a misdetection of burned areas [29,30]. Therefore, our initial hypothesis was that the variation between the products would increase in forest-affected areas. We expected that the regional product TREES, in which there is manual image interpretation, would present greater sensitivity for mapping burned forests [28]. This hypothesis was not sustained in most cases. Firstly, GABAM, which has a 30 m spatial resolution, was the product that most detected burned forests, leading us to consider that spatial resolution can be very important for burned forests detection. In an intercomparison analysis between FireCCISFD11 (20 m), a Sentinel-2 burned area product derived for 2016 in Sub-Saharan Africa, MCD64A1 c6 and Fire_cci v.5.0, the Sentinel product was found to be more accurate than any global product for detecting small fires, detecting 4.9 Mkm2, 80% more than MCD64A1 c6 (2.7 Mkm2) and 97% more than Fire_cci v.5.0 (2.5 Mkm2) [56]. Since all these three products used MODIS active fires to train their algorithms, the improved performance of FireCCISFD11 should be mostly attributed to the spatial resolution of the input reflectance [56]. However, the study did not distinguish land cover classes in its analyses. Additionally, in our analysis, even though the burned area difference was greater in burned forests between MCD64A1 and TREES, and between Fire_cci and GABAM, the difference in burned area was greater in non-forest areas in most cases. There is no rule to support this hypothesis, and it is possible to observe that there is variation both between products and spatially.
For a study that aims to quantify fire-related C emission, the choice of the burned area product must consider the scale of the process to be observed. For the study area, the difference between products can reach 29.54 ± 3.36 Tg C yr−1 when comparing the global product Fire_cci and the regional TREES. Taking the average value, it corresponds to 21% of the total gross CO2 emissions from forest fires in 2015 in the Brazilian Amazon biome [5]. In Acre state, even the most similar products, TREES and GABAM, differed by 0.8 ± 0.33 Tg C, and this is equivalent to 23% of the average biomass loss during an extreme drought year in this state [73]. The same comparison with Fire_cci can result in a difference of more than 50% of the average biomass loss in a drought year in Acre state. The differences in estimates can be significant, but it is necessary to consider that biomass data bring uncertainty into these estimates, an intrinsic factor in the development of the data. Thus, when calculating the carbon emission related to fire, the choice between burned area products can reflect significant differences in the estimates, or irrelevant differences, considering the level of uncertainty of the biomass data. For non-forest areas, in most cases, MCD64A1 and TREES presented irrelevant differences in fire-related carbon emissions, which means that the difference in emission estimates using these products is smaller than the biomass data uncertainty. For forest areas, there is more variability among the states. All comparisons with Fire_cci resulted in significant differences. It is recommended to undertake not only a spatial analysis but also an analysis of the phenomenon itself, as a way to support the choice of the product, conditioning it to the particular research objective aimed at.
The map scale can also influence the differences in the burned area products. It is more feasible to adapt the mapping method regionally over the wide range of pre- and post-burn conditions, considering specific dynamics for different ecosystems. Work on a regional scale also allows for a manual post edition of the automatic burn classification, minimizing the omission and commission errors [28,46,74]. The adoption of global burned area products in regional analyses, in general, can result in significant underestimation of the fire-affected area, and this underestimation varies spatially. The underestimation shown here, for 2015, between TREES and MCD64A1 for Acre state, which was 88% less burned area registered by MCD64A1 compared to TREES, was again found for 2019 by Silva et al. (2020) [75], with the same percentage of less burned area registered by MCD64A1 compared to their product, which also includes a manual edition in its mapping methodology. Although the final manual edition procedure has a high time and human resource cost, it can avoid as much as 20% of the underestimation of the burned area, compared to methods that do not consider this step [19]. Additionally, studies that consider a time series can assess whether the spatial variation is systematic, and in this case, this variation can be used as a guideline for improvements in mapping.
Finally, we also highlight that the most probable result of comparing different data is obtaining different patterns, which was indeed the case. However, it may also be relevant to point out that, notwithstanding the differences, some patterns are similar, which means that the four burned area products can cross-validate each other to some extent or, similarly, that the more the sources point to a given pattern, the more reliable the pattern is. Moreover, we consider the continuous process of improving global burned area products as fundamental to strengthening environmental conservation in the Amazon, as they are often used as inputs for technical reports and public policy formulation. In the absence of an official national product for the long-term monitoring of fire-degraded forests extent, global products provide the only reliable and operational option to expose the magnitude of the fire-related socioeconomic and environmental losses we are currently experiencing in the region [76].

7. Conclusions

This work performed an intercomparison of four burned area products, one being a regional burned area map, developed by TREES–INPE, and the other three being global products. We analyzed the difference in the total area mapped over forest and non-forest areas, as well as their influence on fire-related C emission estimates in the Amazon for the year 2015.
The four burned area products differ according to the total area mapped and, consequently, total related C emission. Only accounting for the magnitude of the difference, the most similar products are TREES and MCD64A1, both for non-forest and forest areas. The products that stand out the most are TREES and Fire_cci, and the difference between the two can reach 78% less burned area detected by Fire_cci in forest areas considering the Amazon, and 99% in Acre. The difference between products was not higher in forest areas in all comparisons, and regionally analyzing the initial hypothesis of more significant variation in these areas cannot be sustained in most cases.
Despite the broader coverage of the GABAM product, it does not have the magnitude of total burned area recorded by TREES and MCD64A1, and this is linked to the use of Landsat 30 m data. The more extended temporal resolution of Landsat images makes it difficult to obtain data without cloud interference, and besides, the better spatial resolution can either decrease the mapped area due to a better scar delineation or increase the contribution of small polygons. The better spatial resolution of the Fire_cci product (250 m) compared to MCD64A1 (500 m) does not appear to have conferred an advantage for the mapping of fire-affected areas in the Amazon.
Besides, when these products are used to estimate fire-related carbon emission, the choice between them can lead to significant changes in estimates. The use of Fire_cci may result in 29.54 ± 3.36 Tg C less estimated carbon emitted, a difference of 66% less compared to the regional product TREES. Considering non-forest areas in the Amazon, and for the analysis of carbon emission estimates specifically, the difference between the adoption of TREES and MCD64A1 is within the expected error for the biomass dataset. For forest areas, the comparisons that are within the expected error are GABAM and TREES, and GABAM and MCD64A1. This analysis varied across the Brazilian Amazon states, and there was no single rule for all of them.
Overall, for the Amazon, the global product MCD64A1 was the closest to the regional product TREES, but regionally there are still significant differences between them, especially in forest areas. It was shown here that global products used interchangeably on a regional scale could significantly underestimate the impacts of fire and, consequently, fire-related carbon emissions. As such, the end-user must choose the product based on the phenomenon and scale to be studied, considering the parameters of the data used in the mapping and the limitations conferred by such in the final result. The choice process can involve merging more than one product to optimize its advantages and produce more consistent data for the user’s needs, getting closer to the true total burned area and its regional distribution. Additionally, the information contained herein still serves as evidence for the improvement of burned area detection algorithms in the Amazon, subsidizing the development of new and more accurate products for the region.

Supplementary Materials

Supplementary Materials: The following are available online at https://0-www-mdpi-com.brum.beds.ac.uk/2072-4292/12/23/3864/s1, Table S1: Overview of fire occurrence available products, Table S2: List of Brazilian states that are included in the study area, Table S3: Total burned area and its intersection area with PRODES 2016, Table S4: Summary of the data used for developing Equation (1), Figure S1: Relationship between initial biomass and remaining biomass after fire events, Figure S2: Total burned area mapped by TREES, MCD64A1, GABAM and Fire_cci, Table S5: Difference between the committed gross carbon emission estimates calculated by EBA and Baccini AGB maps, Figure S3: Above ground biomass map from EBA and polygons of burned forest both from TREES and GABAM products, Figure S4: Scatter plots of the percentage of burned area per cell among the different pairs of products, Table S6. Mean and stardard deviation of p-values resulted from 10,000 iterations of Kolmogorov-Smirnov two-sample test, Figure S5: Similarity maps for each burned area product comparison pair, considering burned area over forest, Figure S6: Similarity maps for each burned area product comparison pair, considering burned area over non-forest, Table S7: Total burned area and its intersection area with the hydrography, Figure S7: Study area and the hydrography of the region, Figure S8: Graphical abstract (References [76,77,78,79,80,81,82,83,84,85,86,87,88,89,90,91,92,93,94] are cited in the supplementary materials).

Author Contributions

Conceptualization, A.C.M.P., L.O.A., N.S.C., W.A.C., C.H.L.S.J., Y.E.S., T.F.M. and L.E.O.C.A.; data curation, A.C.M.P., N.S.C., T.M.R., F.R.S.P., M.A., A.D.J., J.P.O., C.V.J.S. and A.P.-L.; formal analysis, A.C.M.P., N.S.C. and J.B.C.R.; funding acquisition, L.O.A. and T.F.M.; methodology, A.C.M.P., L.O.A., N.S.C., W.A.C., C.H.L.S.J. and L.E.O.C.A.; supervision, L.O.A., T.F.M. and L.E.O.C.A.; writing—original draft, A.C.M.P.; writing—review and editing, A.C.M.P., L.O.A., N.S.C., W.A.C., C.H.L.S.J., T.M.R., J.B.C.R., F.R.S.P., A.D.J., J.P.O., Y.E.S., C.V.J.S., A.P.-L., T.F.M. and L.E.O.C.A. All authors have read and agreed to the published version of the manuscript.

Funding

This research was funded by the Brazilian National Council for Scientific and Technological Development (CNPq) grant numbers 140877/2018-5 (A.C.M.P.), 140379/2018-5 (N.S.C.), 140261/2018-4 (W.A.C.), 301597/2020-0 (J.B.C.R.), 441949/2018-5 (SEM-FLAMA) and 442650/2018-3 (ACRE-QUEIMADAS), productivity grant 305054/2016-3 (L.E.O.C.A.), the São Paulo Research Foundation (FAPESP) grant numbers 19/05440-5 and 2016/02018-2, and the Inter-American Institute for Global Change Research (IAI) grant number SGP-HW 016 (MAP-FIRE). C.H.L.S.J. was funded by the Coordenação de Aperfeiçoamento de Pessoal de Nível Superior-Brasil (CAPES)-Finance Code 001. The funders had no role in study design, data collection and analysis, decision to publish, or preparation of the manuscript.

Acknowledgments

The authors thanks the editor and reviewers whose helpful comments and suggestions consistently helped to improve the clarity and robustness of the analyses presented in this manuscript. We also thank the burned area products developers for providing the freely available datasets and Juan Doblas Prieto for helping with the statistical analysis. Finally, the authors thanks MDPI for the discount voucher that allowed the publication of this article, helping Latin American science to gain space in open-access journals. In addition, we fully agree on the importance of equity in science, making it explicit that this study is resulted from a female mentorship.

Conflicts of Interest

The authors declare no conflict of interest.

References

  1. Bush, M.; Silman, M.; McMichael, C.; Saatchi, S. Fire, climate change and biodiversity in Amazonia: A Late-Holocene perspective. Philos. Trans. R. Soc. B Biol. Sci. 2008, 363, 1795–1802. [Google Scholar] [CrossRef] [PubMed] [Green Version]
  2. Cochrane, M. A Fire science for rainforests. Nature 2003, 421, 913–919. [Google Scholar] [CrossRef] [PubMed]
  3. Pausas, J.G.; Keeley, J.E. A Burning Story: The Role of Fire in the History of Life. Bioscience 2009, 59, 593–601. [Google Scholar] [CrossRef] [Green Version]
  4. Gatti, L.V.; Gloor, M.; Miller, J.B.; Doughty, C.E.; Malhi, Y.; Domingues, L.G.; Basso, L.S.; Martinewski, A.; Correia, C.S.C.; Borges, V.F.; et al. Drought sensitivity of Amazonian carbon balance revealed by atmospheric measurements. Nature 2014, 506, 76–80. [Google Scholar] [CrossRef]
  5. Aragão, L.E.O.C.; Anderson, L.O.; Fonseca, M.G.; Rosan, T.M.; Vedovato, L.B.; Wagner, F.H.; Silva, C.V.J.; Silva Junior, C.H.L.; Arai, E.; Aguiar, A.P.; et al. 21st Century drought-related fires counteract the decline of Amazon deforestation carbon emissions. Nat. Commun. 2018, 9, 1–12. [Google Scholar] [CrossRef]
  6. De Azevedo, T.R.; Costa Junior, C.; Brandão Junior, A.; Cremer, M.d.S.; Piatto, M.; Tsai, D.S.; Barreto, P.; Martins, H.; Sales, M.; Galuchi, T.; et al. SEEG initiative estimates of Brazilian greenhouse gas emissions from 1970 to 2015. Sci. Data 2018, 5, 180045. [Google Scholar] [CrossRef] [Green Version]
  7. Anderson, L.O.; Aragão, L.E.O.C.; Gloor, M.; Arai, E.; Adami, M.; Saatchi, S.S.; Malhi, Y.; Shimabukuro, Y.E.; Barlow, J.; Berenguer, E.; et al. Disentangling the contribution of multiple land covers to fire-mediated carbon emissions in Amazonia during the 2010 drought. Glob. Biogeochem. Cycles 2015, 29, 1739–1753. [Google Scholar] [CrossRef] [Green Version]
  8. Brasil Decreto No 9.578, de 22 de Novembro de 2018. Consolida atos Normativos Editados pelo Poder Executivo Federal que Dispõem Sobre o Fundo Nacional sobre Mudança do Clima, de que Trata a Lei no 12.114, de 9 de Dezembro de 2009, e a Política Nacional sobre Mudança do Clima, de que trata a Lei nº 12.187, de 29 de Dezembro de 2009; Diário Oficial da União: Brasília, Brasil, 2018.
  9. Aragão, L.E.O.; Malhi, Y.; Barbier, N.; Lima, A.; Shimabukuro, Y.; Anderson, L.; Saatchi, S. Interactions between rainfall, deforestation and fires during recent years in the Brazilian Amazonia. Philos. Trans. R. Soc. B Biol. Sci. 2008, 363, 1779–1785. [Google Scholar] [CrossRef]
  10. Silva Junior, C.; Aragão, L.; Fonseca, M.; Almeida, C.; Vedovato, L.; Anderson, L. Deforestation-Induced Fragmentation Increases Forest Fire Occurrence in Central Brazilian Amazonia. Forests 2018, 9, 305. [Google Scholar] [CrossRef] [Green Version]
  11. Marengo, J.A.; Tomasella, J.; Alves, L.M.; Soares, W.R.; Rodriguez, D.A. The drought of 2010 in the context of historical droughts in the Amazon region. Geophys. Res. Lett. 2011, 38. [Google Scholar] [CrossRef] [Green Version]
  12. Jiménez-Muñoz, J.C.; Mattar, C.; Barichivich, J.; Santamaría-Artigas, A.; Takahashi, K.; Malhi, Y.; Sobrino, J.A.; Schrier, G. van der Record-breaking warming and extreme drought in the Amazon rainforest during the course of El Niño 2015–2016. Sci. Rep. 2016, 6, 33130. [Google Scholar] [CrossRef] [PubMed] [Green Version]
  13. Li, W.; Fu, R.; Dickinson, R.E. Rainfall and its seasonality over the Amazon in the 21st century as assessed by the coupled models for the IPCC AR4. J. Geophys. Res. 2006, 111, D02111. [Google Scholar] [CrossRef] [Green Version]
  14. Cox, P.M.; Harris, P.P.; Huntingford, C.; Betts, R.A.; Collins, M.; Jones, C.D.; Jupp, T.E.; Marengo, J.A.; Nobre, C.A. Increasing risk of Amazonian drought due to decreasing aerosol pollution. Nature 2008, 453, 212–215. [Google Scholar] [CrossRef] [PubMed] [Green Version]
  15. Silva Junior, C.H.L.; Anderson, L.O.; Silva, A.L.; Almeida, C.T.; Dalagnol, R.; Pletsch, M.A.J.S.; Penha, T.V.; Paloschi, R.A.; Aragão, L.E.O.C. Fire Responses to the 2010 and 2015/2016 Amazonian Droughts. Front. Earth Sci. 2019, 7, 1–16. [Google Scholar] [CrossRef]
  16. Silva, C.V.J.; Aragão, L.E.O.C.; Barlow, J.; Espirito-Santo, F.; Young, P.J.; Anderson, L.O.; Berenguer, E.; Brasil, I.; Foster Brown, I.; Castro, B.; et al. Drought-induced Amazonian wildfires instigate a decadal-scale disruption of forest carbon dynamics. Philos. Trans. R. Soc. B Biol. Sci. 2018, 373, 20180043. [Google Scholar] [CrossRef] [Green Version]
  17. Giglio, L.; Boschetti, L.; Roy, D.P.; Humber, M.L.; Justice, C.O. The Collection 6 MODIS burned area mapping algorithm and product. Remote Sens. Environ. 2018, 217, 72–85. [Google Scholar] [CrossRef]
  18. Pettinari, M.L.; Chuvieco, E. ESA CCI ECV Fire Disturbance: D3.3.3 Product User Guide—MODIS, Version 1.0. 2018. Available online: https://www.esa-fire-cci.org/documents (accessed on 25 October 2020).
  19. Shimabukuro, Y.E.; Miettinen, J.; Beuchle, R.; Grecchi, R.C.; Simonetti, D.; Achard, F. Estimating Burned Area in Mato Grosso, Brazil, Using an Object-Based Classification Method on a Systematic Sample of Medium Resolution Satellite Images. IEEE J. Sel. Top. Appl. Earth Obs. Remote Sens. 2015, 8, 4502–4508. [Google Scholar] [CrossRef]
  20. Penha, T.V.; Körting, T.S.; Fonseca, L.M.G.; Silva Júnior, C.H.L.; Pletsch, M.A.J.S.; Anderson, L.O.; Morelli, F. Burned Area Detection in the Brazilian Amazon using Spectral Indices and GEOBIA. Rev. Bras. Cartogr. 2020, 72, 253–269. [Google Scholar] [CrossRef]
  21. Mouillot, F.; Schultz, M.G.; Yue, C.; Cadule, P.; Tansey, K.; Ciais, P.; Chuvieco, E. Ten years of global burned area products from spaceborne remote sensing—A review: Analysis of user needs and recommendations for future developments. Int. J. Appl. Earth Obs. Geoinf. 2014, 26, 64–79. [Google Scholar] [CrossRef] [Green Version]
  22. Humber, M.L.; Boschetti, L.; Giglio, L.; Justice, C.O. Spatial and temporal intercomparison of four global burned area products. Int. J. Digit. Earth 2019, 12, 460–484. [Google Scholar] [CrossRef]
  23. Padilla, M.; Stehman, S.V.; Ramo, R.; Corti, D.; Hantson, S.; Oliva, P.; Alonso-Canas, I.; Bradley, A.V.; Tansey, K.; Mota, B.; et al. Comparing the accuracies of remote sensing global burned area products using stratified random sampling and estimation. Remote Sens. Environ. 2015, 160, 114–121. [Google Scholar] [CrossRef] [Green Version]
  24. Ruiz, J.; Lázaro, J.; Cano, I.; Leal, P. Burned Area Mapping in the North American Boreal Forest Using Terra-MODIS LTDR (2001–2011): A Comparison with the MCD45A1, MCD64A1 and BA GEOLAND-2 Products. Remote Sens. 2014, 6, 815–840. [Google Scholar] [CrossRef] [Green Version]
  25. Tsela, P.; Wessels, K.; Botai, J.; Archibald, S.; Swanepoel, D.; Steenkamp, K.; Frost, P. Validation of the Two Standard MODIS Satellite Burned-Area Products and an Empirically-Derived Merged Product in South Africa. Remote Sens. 2014, 6, 1275–1293. [Google Scholar] [CrossRef] [Green Version]
  26. Padilla, M.; Stehman, S.; Litago, J.; Chuvieco, E. Assessing the Temporal Stability of the Accuracy of a Time Series of Burned Area Products. Remote Sens. 2014, 6, 2050–2068. [Google Scholar] [CrossRef] [Green Version]
  27. Fornacca, D.; Ren, G.; Xiao, W. Performance of Three MODIS Fire Products (MCD45A1, MCD64A1, MCD14ML), and ESA Fire_CCI in a Mountainous Area of Northwest Yunnan, China, Characterized by Frequent Small Fires. Remote Sens. 2017, 9, 1131. [Google Scholar] [CrossRef] [Green Version]
  28. Anderson, L.O.; Cheek, D.; Aragao, L.E.; Andere, L.; Duarte, B.; Salazar, N.; Lima, A.; Duarte, V.; Arai, E. Development of a Point-based Method for Map Validation and Confidence Interval Estimation: A Case Study of Burned Areas in Amazonia. J. Remote Sens. GIS 2017, 6. [Google Scholar] [CrossRef]
  29. Pereira, J.M.C.; Mota, B.; Privette, J.L.; Caylor, K.K.; Silva, J.M.N.; Sá, A.C.L.; Ni-Meister, W. A simulation analysis of the detectability of understory burns in miombo woodlands. Remote Sens. Environ. 2004, 93, 296–310. [Google Scholar] [CrossRef]
  30. Roy, D.P.; Boschetti, L. Southern Africa validation of the MODIS, L3JRC, and GlobCarbon burned-area products. IEEE Trans. Geosci. Remote Sens. 2009, 47, 1032–1044. [Google Scholar] [CrossRef]
  31. Chuvieco, E.; Mouillot, F.; van der Werf, G.R.; San Miguel, J.; Tanase, M.; Koutsias, N.; García, M.; Yebra, M.; Padilla, M.; Gitas, I.; et al. Historical background and current developments for mapping burned area from satellite Earth observation. Remote Sens. Environ. 2019, 225, 45–64. [Google Scholar] [CrossRef]
  32. Pereira, J.M.C.; Sá, A.C.L.; Sousa, A.M.O.; Silva, J.M.N.; Santos, T.N.; Carreiras, J.M.B. Spectral characterisation and discrimination of burnt areas. In Remote Sensing of Large Wildfires; Springer: Berlin/Heidelberg, Germany, 1999; pp. 123–138. [Google Scholar]
  33. Pleniou, M.; Koutsias, N. Relationships between vegetation indices and different burn and vegetation ratios: A multi-scale approach applied in a fire affected area. In Proceedings of the SPIE; Hadjimitsis, D.G., Themistocleous, K., Michaelides, S., Papadavid, G., Eds.; SPIE: Paphos, Cyprus, 2013; Volume 8795, p. 87951I. [Google Scholar] [CrossRef]
  34. Boschetti, M.; Stroppiana, D.; Brivio, P.A. Mapping Burned Areas in a Mediterranean Environment Using Soft Integration of Spectral Indices from High-Resolution Satellite Images. Earth Interact. 2010, 14, 1–20. [Google Scholar] [CrossRef]
  35. Chuvieco, E.; Martín, M.P.; Palacios, A. Assessment of different spectral indices in the red-near-infrared spectral domain for burned land discrimination. Int. J. Remote Sens. 2002, 23, 5103–5110. [Google Scholar] [CrossRef]
  36. Long, T.; Zhang, Z.; He, G.; Jiao, W.; Tang, C.; Wu, B.; Zhang, X.; Wang, G.; Yin, R. 30 m Resolution Global Annual Burned Area Mapping Based on Landsat Images and Google Earth Engine. Remote Sens. 2019, 11, 489. [Google Scholar] [CrossRef] [Green Version]
  37. Mithal, V.; Nayak, G.; Khandelwal, A.; Kumar, V.; Nemani, R.; Oza, N. Mapping Burned Areas in Tropical Forests Using a Novel Machine Learning Framework. Remote Sens. 2018, 10, 69. [Google Scholar] [CrossRef] [Green Version]
  38. Pleniou, M.; Koutsias, N. Sensitivity of spectral reflectance values to different burn and vegetation ratios: A multi-scale approach applied in a fire affected area. ISPRS J. Photogramm. Remote Sens. 2013, 79, 199–210. [Google Scholar] [CrossRef]
  39. Silva, J.M.N.; Cadima, J.F.C.L.; Pereira, J.M.C.; Grégoire, J.-M. Assessing the feasibility of a global model for multi-temporal burned area mapping using SPOT-VEGETATION data. Int. J. Remote Sens. 2004, 25, 4889–4913. [Google Scholar] [CrossRef]
  40. Melchiorre, A.; Boschetti, L. Global Analysis of Burned Area Persistence Time with MODIS Data. Remote Sens. 2018, 10, 750. [Google Scholar] [CrossRef] [Green Version]
  41. Boschetti, L.; Roy, D.P.; Giglio, L.; Huang, H.; Zubkova, M.; Humber, M.L. Global validation of the collection 6 MODIS burned area product. Remote Sens. Environ. 2019, 235, 111490. [Google Scholar] [CrossRef]
  42. Bastarrika, A.; Alvarado, M.; Artano, K.; Martinez, M.; Mesanza, A.; Torre, L.; Ramo, R.; Chuvieco, E. BAMS: A Tool for Supervised Burned Area Mapping Using Landsat Data. Remote Sens. 2014, 6, 12360–12380. [Google Scholar] [CrossRef] [Green Version]
  43. Anderson, L.O.; Eduardo, L.; De Aragão, C.; De Lima, A. Detecção de cicatrizes de áreas queimadas baseada no modelo linear de mistura espectral e imagens índice de vegetação utilizando dados multitemporais do sensor MODIS/TERRA no estado do Mato Grosso, Amazônia brasileira. Acta Amaz. 2005, 35, 445–456. [Google Scholar] [CrossRef] [Green Version]
  44. Lima, A.; Silva, T.S.F.; de Aragão, L.E.O.e.C.; de Feitas, R.M.; Adami, M.; Formaggio, A.R.; Shimabukuro, Y.E. Land use and land cover changes determine the spatial relationship between fire and deforestation in the Brazilian Amazon. Appl. Geogr. 2012, 34, 239–246. [Google Scholar] [CrossRef]
  45. Cardozo, F.; Pereira, G.; Shimabukuro, Y.; Moraes, E. Analysis and Assessment of the Spatial and Temporal Distribution of Burned Areas in the Amazon Forest. Remote Sens. 2014, 6, 8002–8025. [Google Scholar] [CrossRef] [Green Version]
  46. Shimabukuro, Y.E.; Duarte, V.; Arai, E.; Freitas, R.M.; Lima, A.; Valeriano, D.M.; Brown, I.F.; Maldonado, M.L.R. Fraction images derived from Terra Modis data for mapping burnt areas in Brazilian Amazonia. Int. J. Remote Sens. 2009, 30, 1537–1546. [Google Scholar] [CrossRef]
  47. Shimabukuro, Y.E.; Beuchle, R.; Grecchi, R.C.; Achard, F. Assessment of forest degradation in Brazilian Amazon due to selective logging and fires using time series of fraction images derived from Landsat ETM+ images. Remote Sens. Lett. 2014, 5, 773–782. [Google Scholar] [CrossRef]
  48. Randerson, J.T.; Chen, Y.; van der Werf, G.R.; Rogers, B.M.; Morton, D.C. Global burned area and biomass burning emissions from small fires. J. Geophys. Res. Biogeosci. 2012, 117. [Google Scholar] [CrossRef]
  49. Artés, T.; Oom, D.; de Rigo, D.; Durrant, T.H.; Maianti, P.; Libertà, G.; San-Miguel-Ayanz, J. A global wildfire dataset for the analysis of fire regimes and fire behaviour. Sci. Data 2019, 6, 296. [Google Scholar] [CrossRef]
  50. Giglio, L.; Randerson, J.T.; van der Werf, G.R. Analysis of daily, monthly, and annual burned area using the fourth-generation global fire emissions database (GFED4). J. Geophys. Res. Biogeosci. 2013, 118, 317–328. [Google Scholar] [CrossRef] [Green Version]
  51. Andela, N.; Morton, D.C.; Giglio, L.; Paugam, R.; Chen, Y.; Hantson, S.; van der Werf, G.R.; Randerson, J.T. The Global Fire Atlas of individual fire size, duration, speed, and direction. Earth Syst. Sci. Data Discuss. 2019, 1–28. [Google Scholar] [CrossRef] [Green Version]
  52. Shi, Y.; Matsunaga, T.; Yamaguchi, Y. High-Resolution Mapping of Biomass Burning Emissions in Three Tropical Regions. Environ. Sci. Technol. 2015, 49, 10806–10814. [Google Scholar] [CrossRef]
  53. Fanin, T.; van der Werf, G.R. Relationships between burned area, forest cover loss, and land cover change in the Brazilian Amazon based on satellite data. Biogeosciences 2015, 12, 6033–6043. [Google Scholar] [CrossRef] [Green Version]
  54. Chen, Y.; Morton, D.C.; Andela, N.; van der Werf, G.R.; Giglio, L.; Randerson, J.T. A pan-tropical cascade of fire driven by El Niño/Southern Oscillation. Nat. Clim. Chang. 2017, 7, 906–911. [Google Scholar] [CrossRef]
  55. Chuvieco, E.; Lizundia-Loiola, J.; Pettinari, M.L.; Ramo, R.; Padilla, M.; Tansey, K.; Mouillot, F.; Laurent, P.; Storm, T.; Heil, A.; et al. Generation and analysis of a new global burned area product based on MODIS 250m reflectance bands and thermal anomalies. Earth Syst. Sci. Data 2018, 10, 2015–2031. [Google Scholar] [CrossRef] [Green Version]
  56. Lizundia-Loiola, J.; Otón, G.; Ramo, R.; Chuvieco, E. A spatio-temporal active-fire clustering approach for global burned area mapping at 250 m from MODIS data. Remote Sens. Environ. 2020, 236, 111493. [Google Scholar] [CrossRef]
  57. INPE. Projeto de Monitoramento do Desmatamento na Amazônia Brasileira por Satélite (PRODES); INPE: São José dos Campos, Brazil, 2017. [Google Scholar]
  58. Brando, P.M.; Nepstad, D.C.; Balch, J.K.; Bolker, B.; Christman, M.C.; Coe, M.; Putz, F.E. Fire-induced tree mortality in a neotropical forest: The roles of bark traits, tree size, wood density and fire behavior. Glob. Chang. Biol. 2012, 18, 630–641. [Google Scholar] [CrossRef]
  59. IPCC. Fifth Assessment Report of the Intergovernmental Panel on Climate Change; IPCC: New York, NY, USA, 2013. [Google Scholar]
  60. Bivand, R.; Rundel, C. Rgeos: Interface to Geometry Engine—Open Source (‘GEOS’) 2018. Available online: https://rdrr.io/cran/rgeos/ (accessed on 24 November 2020).
  61. R Core Team. R: A Language and Environment for Statistical Computing 2020; R Core Team: Vienna, Austria, 2020; Available online: https://www.R-project.org/ (accessed on 30 October 2020).
  62. Hijmans, R.J. Raster: Geographic Data Analysis and Modeling. 2017. Available online: https://rdrr.io/cran/raster/ (accessed on 24 November 2020).
  63. Smirnov, N.V. Estimate of deviation between empirical distribution functions in two independent samples. Bull. Math. Univ. Moscou 1939, 2, 3–14. [Google Scholar]
  64. Visser, H.; de Nijs, T. The Map Comparison Kit. Environ. Model. Softw. 2006, 21, 346–358. [Google Scholar] [CrossRef]
  65. RIKS BV. Map Comparison Kit 3: User Manual; RIKS BV: Maastricht, The Netherlands, 2013. [Google Scholar]
  66. RIKS BV. MCK Reader: Methods of the Map Comparison Kit; RIKS BV: Maastricht, The Netherlands, 2011. [Google Scholar]
  67. Alonso-Canas, I.; Chuvieco, E. Global burned area mapping from ENVISAT-MERIS and MODIS active fire data. Remote Sens. Environ. 2015, 163, 140–152. [Google Scholar] [CrossRef]
  68. Giglio, L.; Schroeder, W.; Justice, C.O. The collection 6 MODIS active fire detection algorithm and fire products. Remote Sens. Environ. 2016, 178, 31–41. [Google Scholar] [CrossRef] [Green Version]
  69. Justice, C.; Giglio, L.; Korontzi, S.; Owens, J.; Morisette, J.; Roy, D.; Descloitres, J.; Alleaume, S.; Petitcolin, F.; Kaufman, Y. The MODIS fire products. Remote Sens. Environ. 2002, 83, 244–262. [Google Scholar] [CrossRef]
  70. Meddens, A.J.H.; Kolden, C.A.; Lutz, J.A.; Abatzoglou, J.T.; Hudak, A.T. Spatiotemporal patterns of unburned areas within fire perimeters in the northwestern United States from 1984 to 2014. Ecosphere 2018, 9, e02029. [Google Scholar] [CrossRef]
  71. Morton, D.C.; DeFries, R.S.; Nagol, J.; Souza, C.M.; Kasischke, E.S.; Hurtt, G.C.; Dubayah, R. Mapping canopy damage from understory fires in Amazon forests using annual time series of Landsat and MODIS data. Remote Sens. Environ. 2011, 115, 1706–1720. [Google Scholar] [CrossRef] [Green Version]
  72. Rodrigues, J.A.; Libonati, R.; Pereira, A.A.; Nogueira, J.M.P.; Santos, F.L.M.; Peres, L.F.; Santa Rosa, A.; Schroeder, W.; Pereira, J.M.C.; Giglio, L.; et al. How well do global burned area products represent fire patterns in the Brazilian Savannas biome? An accuracy assessment of the MCD64 collections. Int. J. Appl. Earth Obs. Geoinf. 2019, 78, 318–331. [Google Scholar] [CrossRef]
  73. Campanharo, W.; Lopes, A.; Anderson, L.; da Silva, T.; Aragão, L. Translating Fire Impacts in Southwestern Amazonia into Economic Costs. Remote Sens. 2019, 11, 764. [Google Scholar] [CrossRef] [Green Version]
  74. Da Silva, S.S.; Fearnside, P.M.; de Alencastro Graça, P.M.L.; Brown, I.F.; Alencar, A.; de Melo, A.W.F. Dynamics of forest fires in the southwestern Amazon. For. Ecol. Manag. 2018, 424, 312–322. [Google Scholar] [CrossRef]
  75. Silva, S.S.; Anderson, L.O.; Costa, J.G.; Souza, F.S.C.; Nascimento, E.S.; Silva, I.S.; Pereira, M.P.; Silva, F.V.; Almeida, M.R.N.; Xaud, H.A.M.; et al. Relatório Executivo: Queimadas 2019—Acre; UFAC: Cruzeiro do Sul, Acre, Brasil, 2020; 31p. [Google Scholar] [CrossRef]
  76. Barlow, J.; Berenguer, E.; Carmenta, R.; França, F. Clarifying Amazonia’s burning crisis. Glob. Chang. Biol. 2020, 26, 319–321. [Google Scholar] [CrossRef] [Green Version]
  77. Giglio, L.; Descloitres, J.; Justice, C.O.; Kaufman, Y.J. An Enhanced Contextual Fire Detection Algorithm for MODIS. Remote Sens. Environ. 2003, 87, 273–282. [Google Scholar] [CrossRef]
  78. Schroeder, W.; Oliva, P.; Giglio, L.; Csiszar, I.A. The New VIIRS 375m active fire detection data product: Algorithm description and initial assessment. Remote Sens. Environ. 2014, 143, 85–96. [Google Scholar] [CrossRef]
  79. Otón, G.; Pettinari, M.L. ESA CCI ECV Fire Disturbance: D3.3.4 Product User Guide—LTDR, Version 1.0. 2019. Available online: https://www.esa-fire-cci.org/documents (accessed on 1 November 2020).
  80. Hawbaker, T.J.; Vanderhoof, M.K.; Beal, Y.; Takacs, J.D.; Schmidt, G.L.; Falgout, J.T.; Williams, B.; Fairaux, N.M.; Caldwell, M.K.; Picotte, J.J.; et al. Mapping burned areas using dense time-series of Landsat data. Remote Sens. Environ. 2017, 198, 504–522. [Google Scholar] [CrossRef]
  81. Diniz, C.G.; Souza, A.A.d.A.; Santos, D.C.; Dias, M.C.; da Luz, N.C.; de Moraes, D.R.V.; Maia, J.S.A.; Gomes, A.R.; Narvaes, I.d.S.; Valeriano, D.M.; et al. DETER-B: The New Amazon Near Real-Time Deforestation Detection System. IEEE J. Sel. Top. Appl. Earth Obs. Remote Sens. 2015, 8, 3619–3628. [Google Scholar] [CrossRef]
  82. Longo, M.; Keller, M.; Dos-Santos, M.N.; Leitold, V.; Pinagé, E.R.; Baccini, A.; Saatchi, S.; Nogueira, E.M.; Batistella, M.; Morton, D.C. Aboveground biomass variability across intact and degraded forests in the Brazilian Amazon. Glob. Biogeochem. Cycles 2016, 30, 1639–1660. [Google Scholar] [CrossRef] [Green Version]
  83. Chave, J.; Réjou-Méchain, M.; Búrquez, A.; Chidumayo, E.; Colgan, M.S.; Delitti, W.B.C.; Duque, A.; Eid, T.; Fearnside, P.M.; Goodman, R.C.; et al. Improved allometric models to estimate the aboveground biomass of tropical trees. Glob. Chang. Biol. 2014, 20, 3177–3190. [Google Scholar] [CrossRef]
  84. Kauffman, J.B.; Cummings, D.L.; Ward, D.E. Relationships of Fire, Biomass and Nutrient Dynamics along a Vegetation Gradient in the Brazilian Cerrado. J. Ecol. 1994, 82, 519. [Google Scholar] [CrossRef]
  85. Cochrane, M.A.; Schulze, M.D. Fire as a Recurrent Event in Tropical Forests of the Eastern Amazon: Effects on Forest Structure, Biomass, and Species Composition1. Biotropica 1999, 31, 2–16. [Google Scholar] [CrossRef]
  86. Haugaasen, T.; Barlow, J.; Peres, C.A. Surface wildfires in central Amazonia: Short-term impact on forest structure and carbon loss. For. Ecol. Manag. 2003, 179, 321–331. [Google Scholar] [CrossRef]
  87. Barlow, J.; Peres, C.A.; Lagan, B.O.; Haugaasen, T. Large tree mortality and the decline of forest biomass following Amazonian wildfires. Ecol. Lett. 2002, 6, 6–8. [Google Scholar] [CrossRef]
  88. Alencar, A.; Nepstad, D.; Diaz, M.C.V. Forest understory fire in the Brazilian Amazon in ENSO and non-ENSO years: Area burned and comitted carbon missions. Earth Interact. 2006, 10, 1–17. [Google Scholar] [CrossRef]
  89. Alencar, A.A.; Nepstad, D.; Moutinho, P. Carbon emissions associated with forest fires in Brazil. In Tropical Deforestation and Climate Change; IPAM: Belém, Portugal, 2005; p. 132. [Google Scholar]
  90. Barbosa, R.I.; Fearnside, P.M. Incêndios na Amazônia Brasileira: Estimativa da emissão de gases do efeito estufa pela queima de diferentes ecossistemas de Roraima na passagem do evento “El Nino” (1997/98). Acta Amaz. 1999, 29, 513–534. [Google Scholar] [CrossRef] [Green Version]
  91. Brinck, K.; Fischer, R.; Groeneveld, J.; Lehmann, S.; Dantas De Paula, M.; Pütz, S.; Sexton, J.O.; Song, D.; Huth, A. High resolution analysis of tropical forest fragmentation and its impact on the global carbon cycle. Nat. Commun. 2017, 8, 14855. [Google Scholar] [CrossRef] [Green Version]
  92. Baccini, A.; Goetz, S.J.; Walker, W.S.; Laporte, N.T.; Sun, M.; Sulla-Menashe, D.; Hackler, J.; Beck, P.S.A.; Dubayah, R.; Friedl, M.A.; et al. Estimated carbon dioxide emissions from tropical deforestation improved by carbon-density maps. Nat. Clim. Chang. 2012, 2, 182–185. [Google Scholar] [CrossRef]
  93. Coutinho, A.C.; Almeida, C.; Venturieri, A.; Esquerdo, J.C.D.M.; Silva, M. Uso e cobertura da terra nas áreas desflorestadas da Amazônia Legal, TerraClass; Embrapa: Brasília, Brazil; INPE: Belém, Portugal, 2013; ISBN 9788570351807. [Google Scholar]
  94. Rosan, T.M. Estimativa de Emissões de CO2 por Desmatamento e Degradação Florestal Utilizada como Subsidio para Definição de Municípios Prioritários para Monitoramento e Controle; Instituto Nacional de Pesquisas Espaciais—INPE: São José dos Campos SP, Brasil, 2017. [Google Scholar]
Figure 1. Study area located in the Legal Amazon. Forest proportion in a 10 × 10 km grid cell, extracted by the Amazon Forest Deforestation Calculation Program (PRODES) forest mask of 2016 used to select burned areas over the forest. It presented the total area of each Brazilian state that intersects the study area, and their respective percentage area and forest area within the considered boundaries.
Remotesensing 12 03864 g001
Figure 2. (a) Total burned area mapped by TREES, MCD64A1, GABAM, and Fire_cci over forested areas and non-forested areas, considering the whole study area. (b) Committed gross carbon emission related to fires according to the four burned area products.
Remotesensing 12 03864 g002
Figure 3. Burned area and committed gross carbon emission registered by TREES, MCD64A1, GABAM and Fire_cci products.
Remotesensing 12 03864 g003
Figure 4. Carbon emissions difference analysis. The lower diagonal contains the absolute value of the difference of carbon emissions (Tg) between the products. The upper diagonal indicates if the difference is greater (green upside triangle) or lower (red downside triangle) than the maximum uncertainty value between them.
Remotesensing 12 03864 g004
Figure 5. Burned area spatialization in a 10 km × 10 km regular grid. Each grid cell contains the burned proportion indicated by the color gradient.
Remotesensing 12 03864 g005
Figure 6. Number of cells in different burned proportion classes.
Remotesensing 12 03864 g006
Figure 7. Similarity maps for each burned area product comparison pair. The similarity index was calculated considering only cells that presented burned area detection by at least one product. The similarity index goes from 0 (lowest similarity) highlighted by dark red to 1 (highest similarity) highlighted by dark purple.
Remotesensing 12 03864 g007
Figure 8. Confusion maps considering (a) TREES, MCD64A1 and Fire_cci burned area products, and (b) TREES, MCD64A1 and GABAM burned area products. The 10km cells are colored according to the occurrence of information from each product or a combination of them, disregarding the burned area proportion in each cell.
Remotesensing 12 03864 g008
Publisher’s Note: MDPI stays neutral with regard to jurisdictional claims in published maps and institutional affiliations.

