Sand Dune Dynamics Exploiting a Fully Automatic Method Using Satellite SAR Data


1
Department of Geosciences and Remote Sensing, Delft University of Technology, 2628 CN Delft, The Netherlands
2
Department of Earth and Environmental Sciences, Division of Geography and Tourism, KU Leuven, B-3001 Leuven, Belgium
3
Environmental Research and Innovation Department (ERIN), Luxembourg Institute of Science and Technology (LIST), L-4422 Belvaux, Luxembourg
*
Author to whom correspondence should be addressed.
Remote Sens. 2020, 12(23), 3993; https://0-doi-org.brum.beds.ac.uk/10.3390/rs12233993
Submission received: 5 November 2020
/
Revised: 29 November 2020
/
Accepted: 4 December 2020
/
Published: 6 December 2020
(This article belongs to the Special Issue SAR Remote Sensing of Arid Regions)
Abstract
:This work presents an automatic procedure to quantify dune dynamics on isolated barchan dunes exploiting Synthetic Aperture RADAR satellite data. We use C-band datasets, allowing the multi-temporal analysis of dune dynamics in two study areas, one located between the Western Sahara and Mauritania and the second one located in the South Rayan dune field in Egypt. Our method uses an adaptive parametric thresholding algorithm and common geospatial operations. A quantitative dune dynamics analysis is also performed. We have measured dune migration rates of 2–6 m/year in the NNW-SSE direction and 11–20 m/year NNE-SSW for the South Rayan and West-Sahara dune fields, respectively. To validate our results, we have manually tracked several dunes per study area using Google Earth imagery. Results from both automatic and manual approaches are consistent. Finally, we discuss the advantages and limitations of the approach presented.
Keywords:
dune dynamics; barchan dunes; dune-field; South Rayan; West Sahara; SAR; adaptive thresholding; automatic method; GIS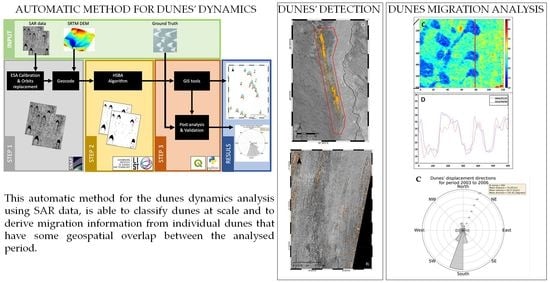
1. Introduction
An understanding of dune dynamics becomes critical in cases where dunes represent a real hazard due to their proximity to villages or agricultural fields and when dunes move towards them, as is the case for [1] and [2,3,4] respectively.
In order to increase our understanding of this, the accumulation of windblown sand into sand dunes has been the subject of numerous studies using both traditional field surveys and remote sensing techniques. Field surveys may include the use of measuring tape roads [5,6], optical and electronic levelling [7], DGPS [8,9,10], RTK-GPS [11,12], total station [13], terrestrial laser scanning [14] and ground penetrating radars [8,15]. However, field surveys are expensive and have limited spatial coverage and revisits compared to satellite remote sensing techniques, which can cover very wide areas systematically, repetitively, and at a very low cost. Nowadays, satellite data is systematically acquired globally with a repetition frequency that can range from 1 to 16 days with spatial resolutions from below a meter up to tens of meters, such as PlanetScope, Sentinel-1/2 or Landsat 8 [16]. Furthermore, satellite RS has the advantage of being able to analyze less accessible dune regions and/or regions with extreme climatic conditions that may restrict field surveys. This even includes extraterrestrial dune systems, such as those on Mars [17] or in the equatorial regions of Titan [18,19,20,21,22,23].
Monitoring sand dunes on Earth is mostly performed by optical RS data, applying multi-spectral datasets [24], using multi-temporal false RGB color techniques [4], the manual delineation of dunes, GIS models [25] or even more advanced techniques, such as the sub-pixel correlation of multi-temporal acquisitions, e.g., COSI-CORR [26]. The potential of microwave (SAR) sensors for monitoring dune dynamics has not been fully exploited, despite being able to acquire data independently from daylight, cloud coverage and weather conditions. Early works focused on deriving linear dune attributes [27], such as dune height using JERS-1 and ERS-1 data, studies on detecting dunes using SAR or SRTM data [28,29], the correlation of SAR images for the automatic detection of dune areas [30] and more recently, the use of interferometric SAR techniques [31,32]. In this work we proceed further by automatizing the full dune dynamics’ analysis.
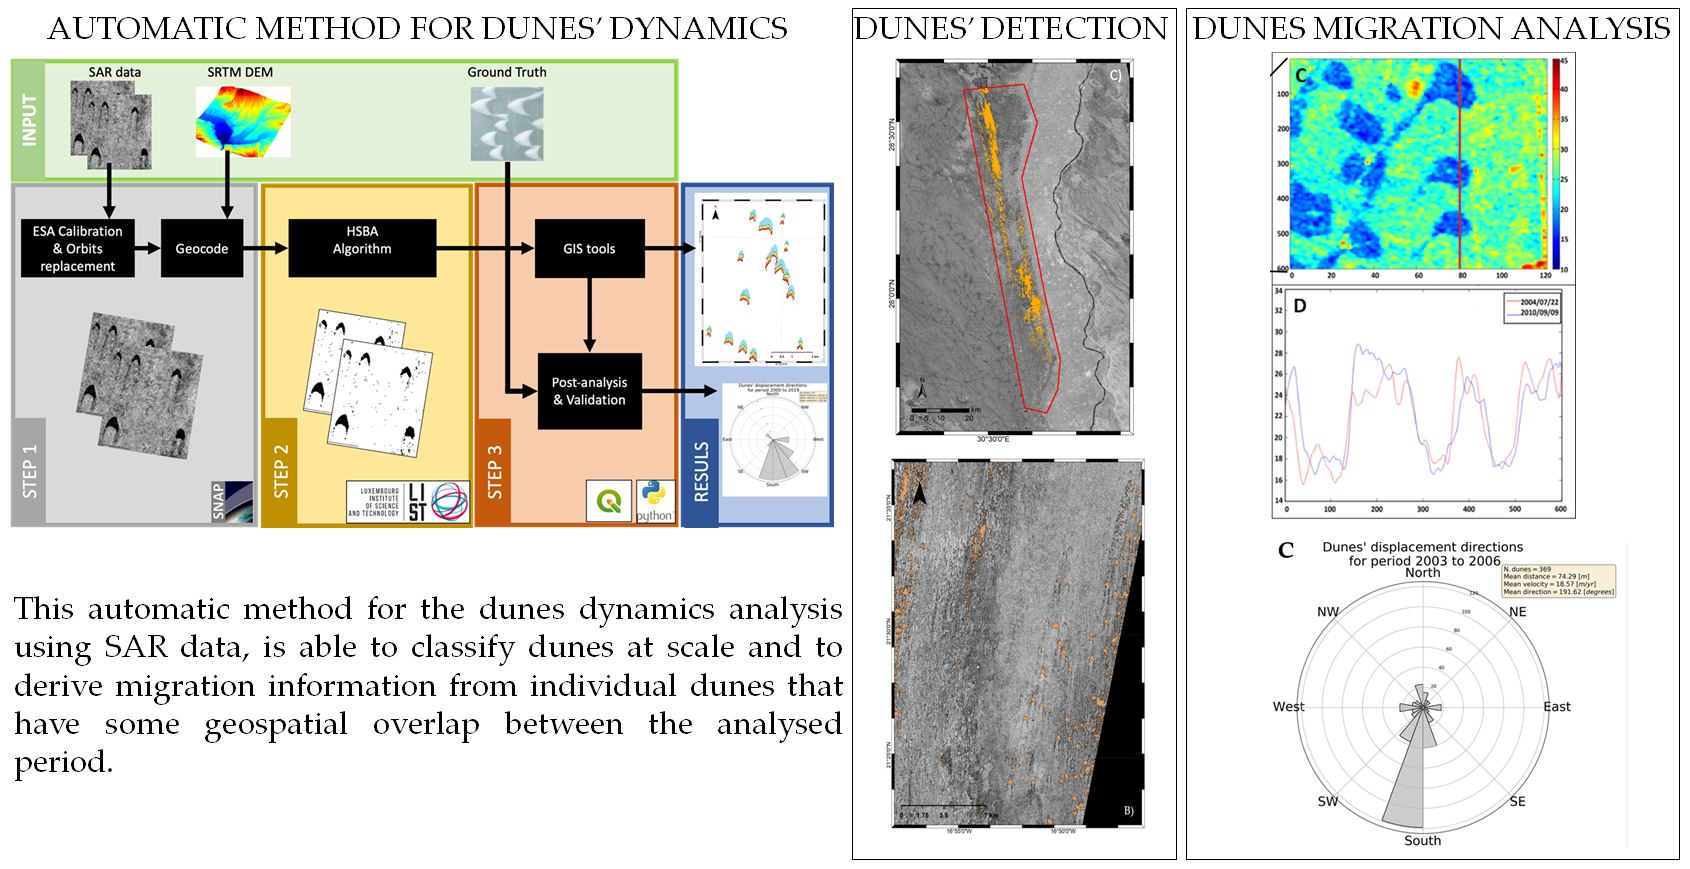
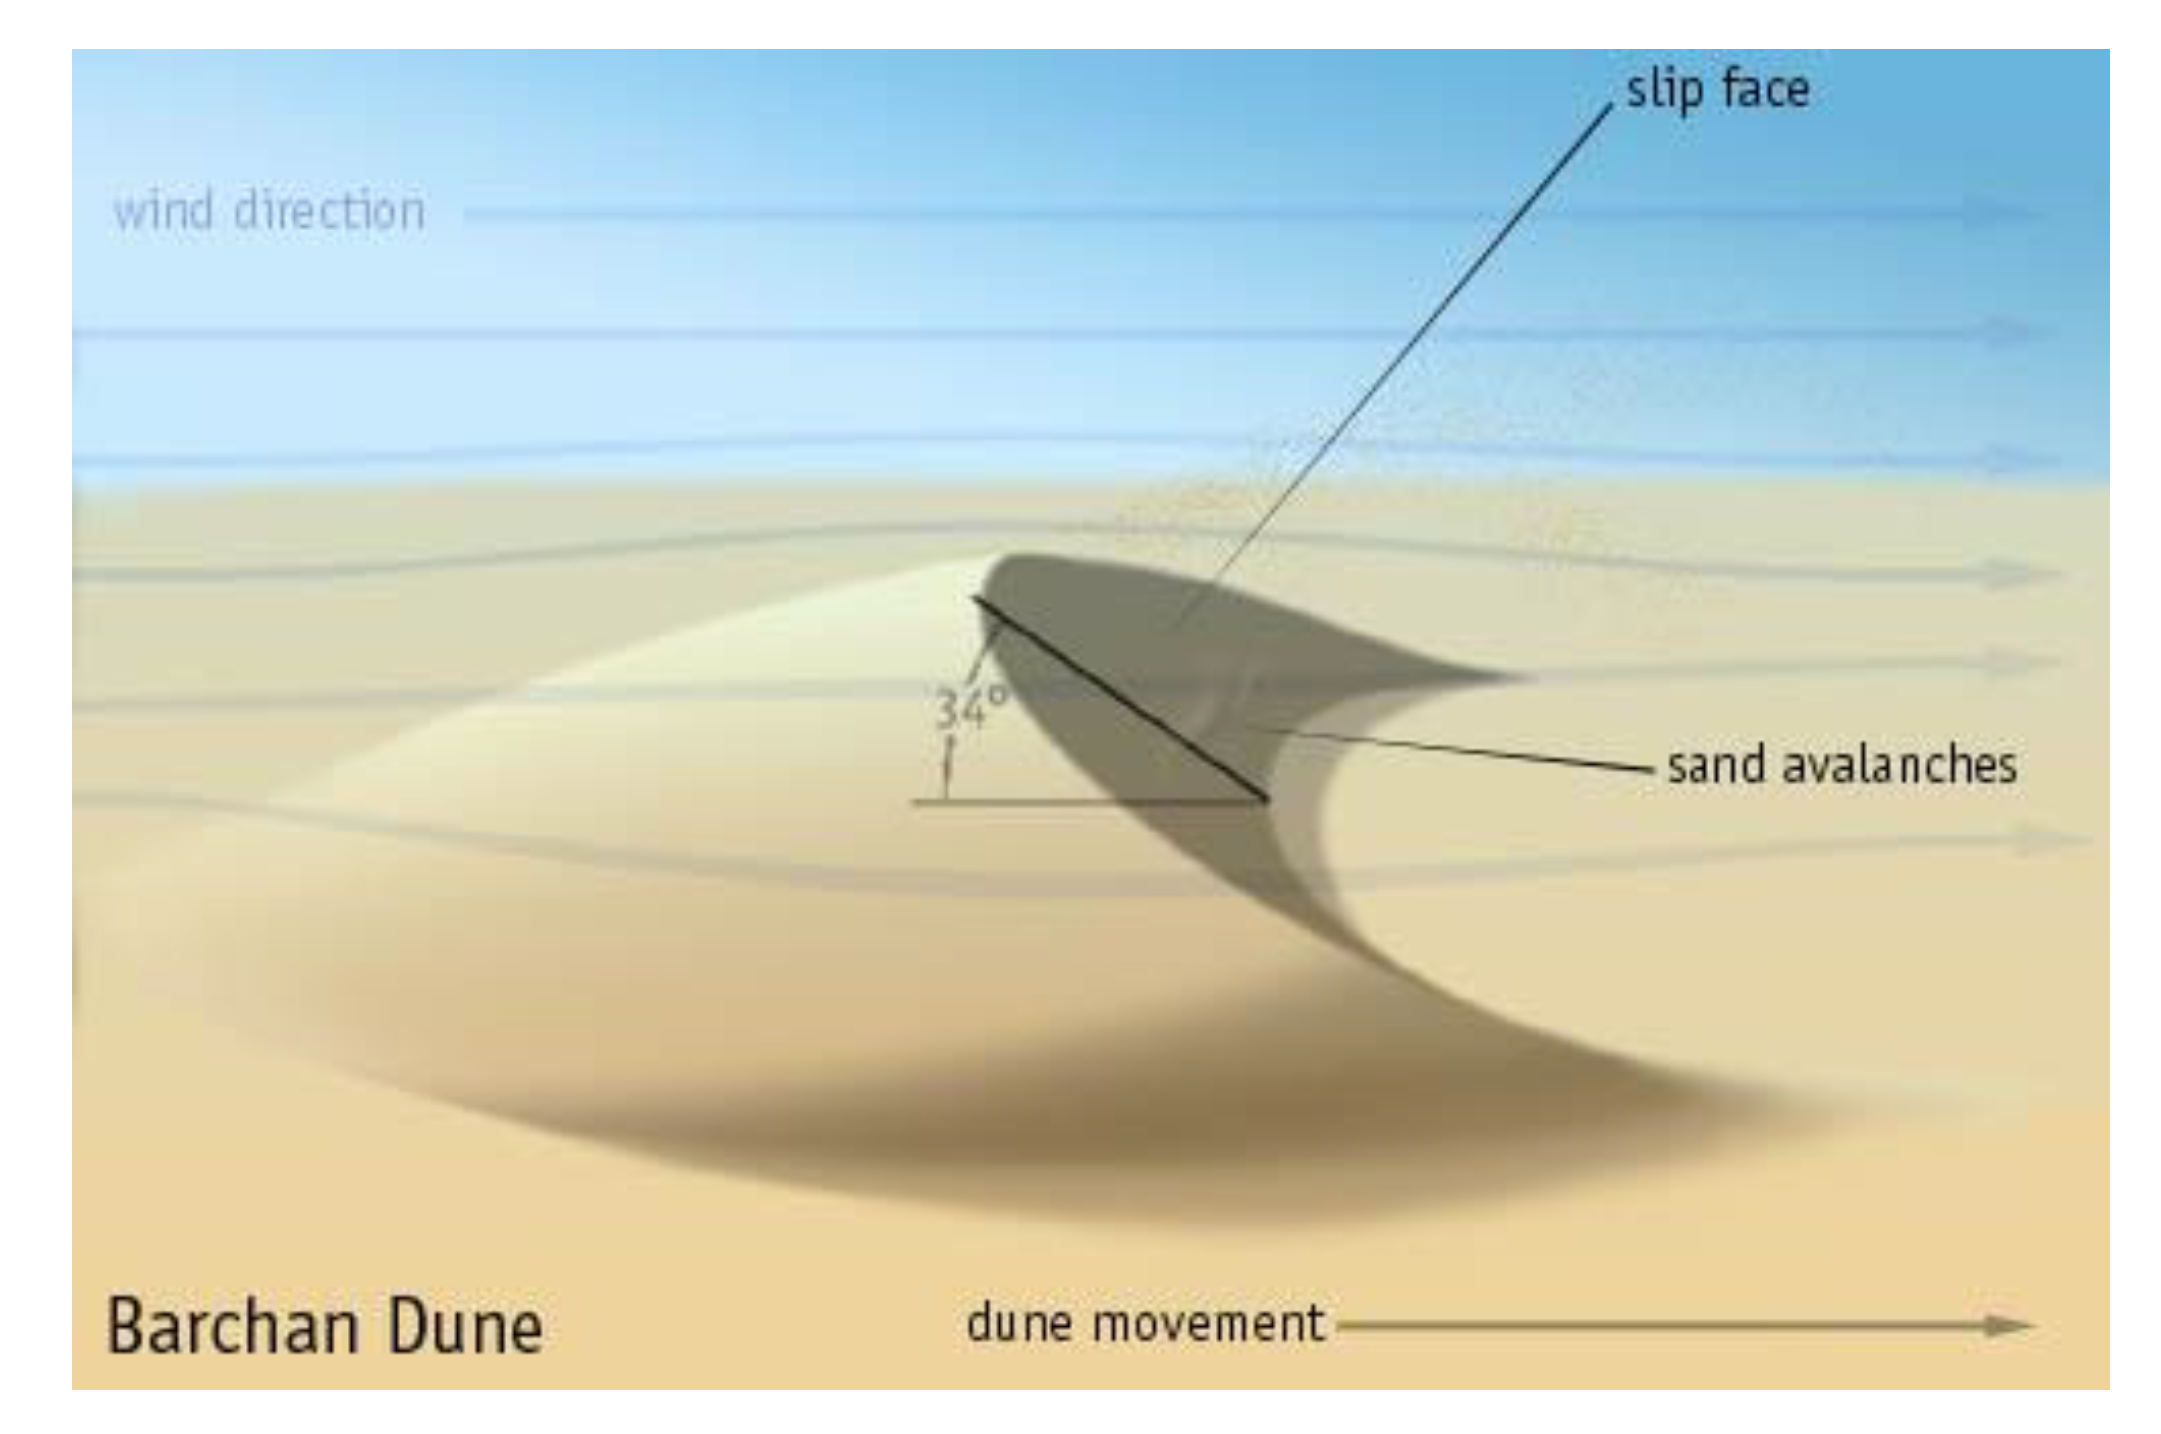
As demonstrated in [29], dunes can be identified easily in radar images, appearing darker than their surroundings when they are located in either rougher or vegetated environments. In optical images, sand dunes are more difficult to delineate as their composition can be the same as their surroundings (see Figure 1). How dark they appear within an SAR image can vary depending on the incidence angle, signal wavelength, dune type and orientation, and their being able to return a higher signal that becomes a white pixel (like a corner reflector) on the dunes’ crests and edges (see Figure 1). However, the predominant dune characteristic is that they appear darker than their environment. Furthermore, even when interdune areas are also characterized by sand, with the same optical properties as the dune itself, the dune can still be detected on SAR images when the SAR signal attenuation produced in the dune returns a backscatter signal much lower than its surroundings. A recent study [33] modelled the radar backscatter response of sand-covered objects to radar signals, measuring the backscatter response of a surface covered with very dry sand, showing a predominant volume scatter mechanism with values lower than −15 dB for sigma0 VV channel.
The potential and advantages of SAR imagery over in situ and optical methods is related to the geomorphology of dunes and the difficulties of monitoring their dynamics. Sand dunes may be classified by their (i) size and shape, (ii) location (coastal, desert, polar), (iii) growth stages and degree of complexity and (iv) the wind direction responsible for their formation [34]. Additionally, a geomorphological classification groups dunes by shape, number of slip faces and the wind directions that form them, resulting in six categories: barchan, transverse, barchanoid, longitudinal, parabolic and star [35].
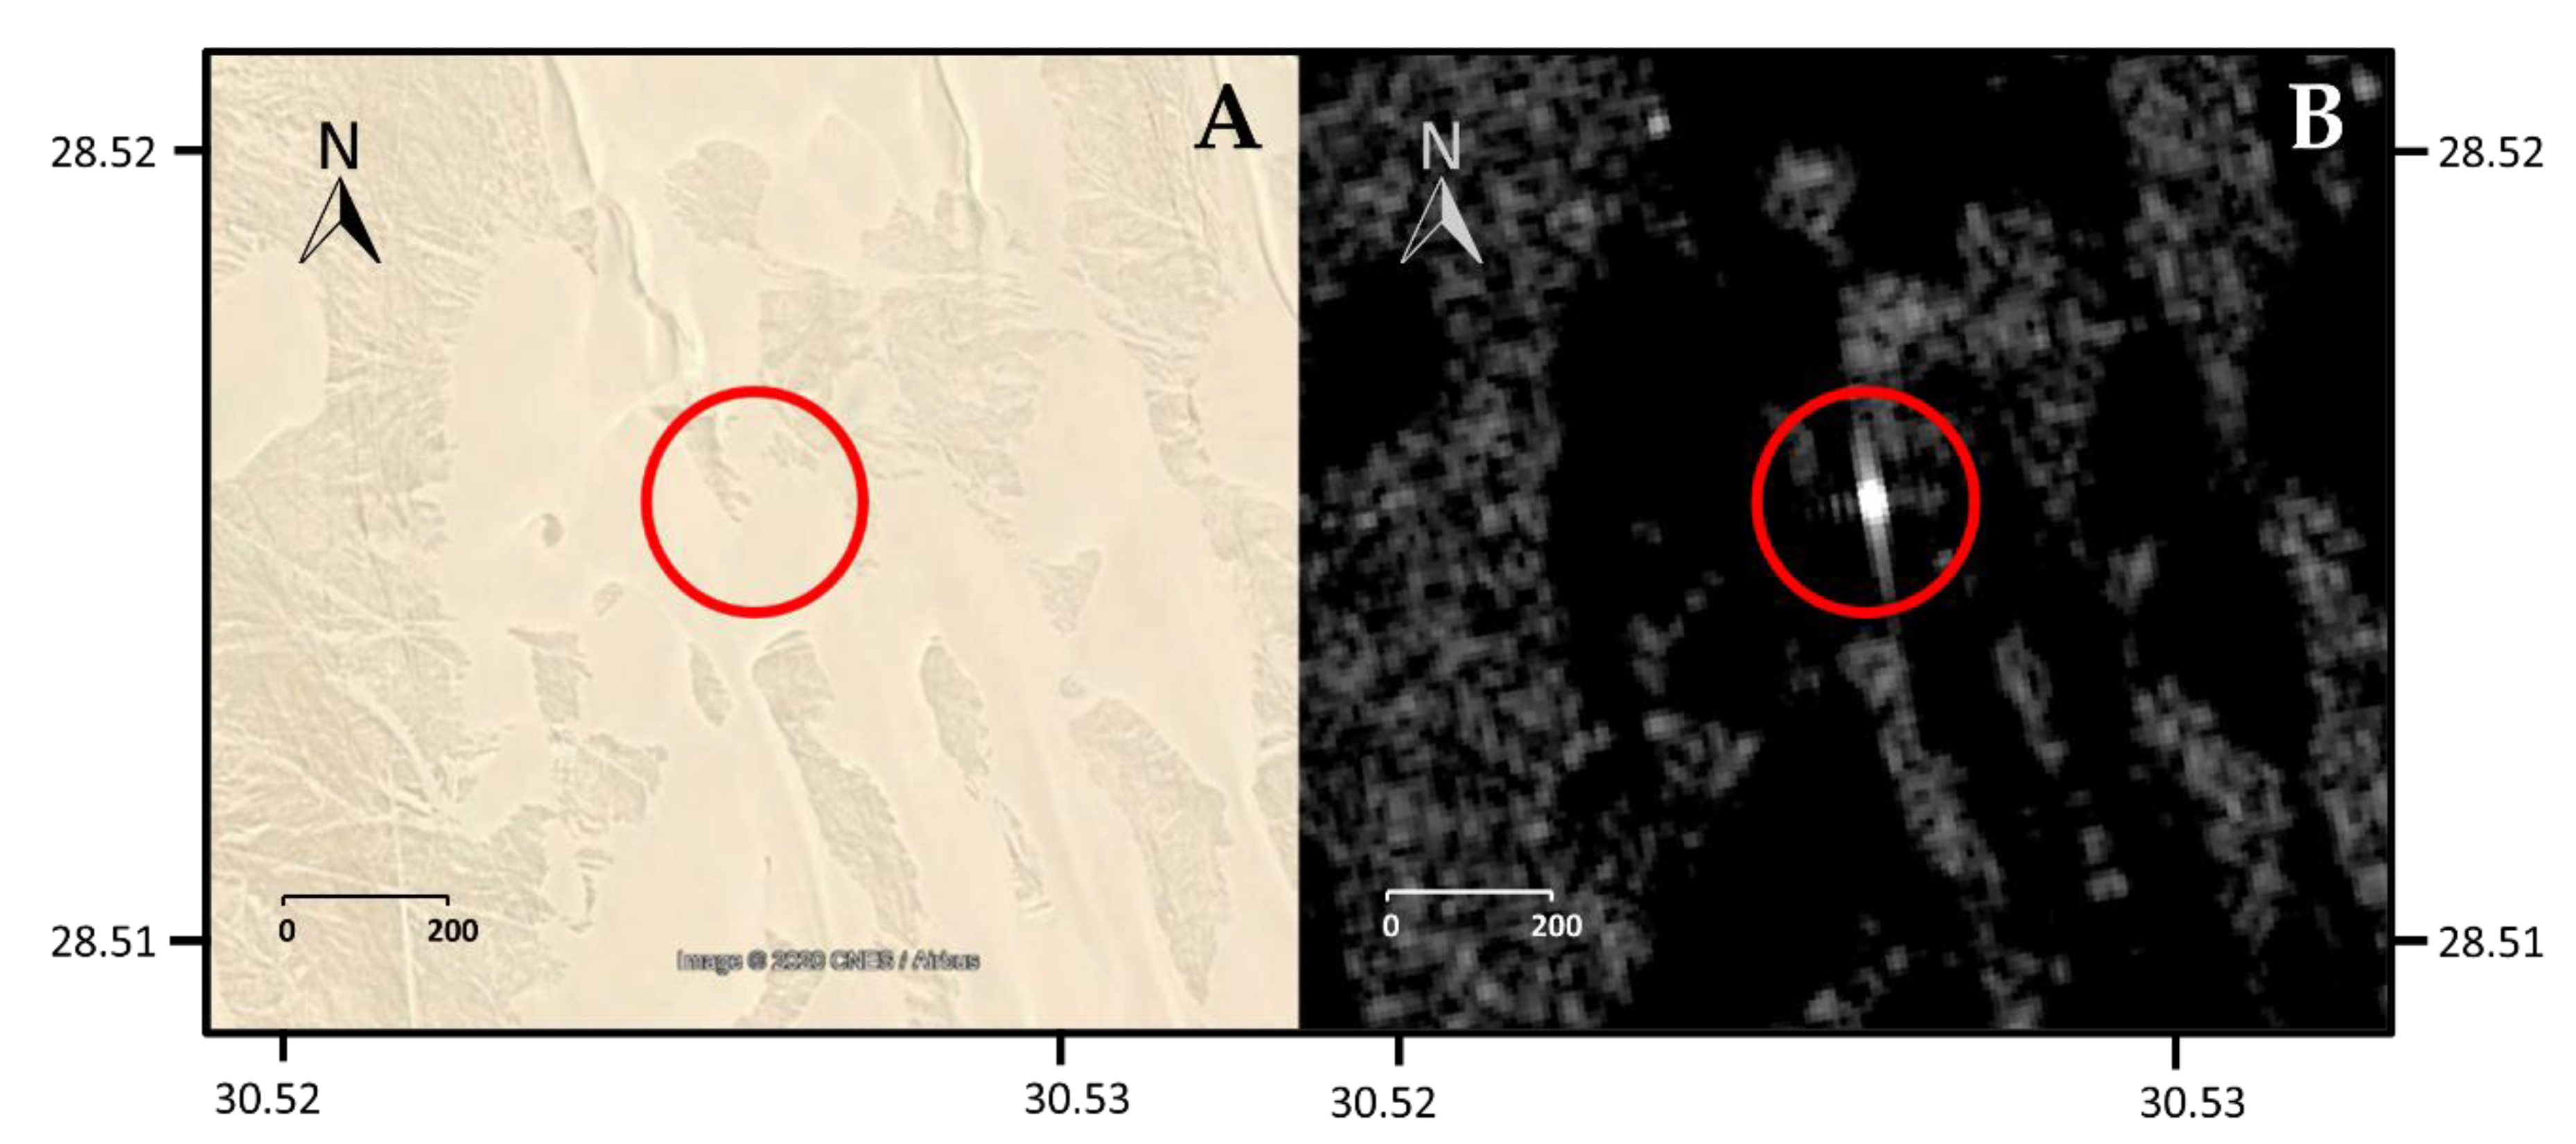
In this work, we focus on the dune dynamics of barchan dunes (see Figure 2), which are characterized by a crescent shape with a concave slip face and “horns” or arms extending downwind [34]. Barchan dunes can form when the terrain is flat while winds blow from one dominant direction (15 degrees difference or less), vegetation cannot grow and sand is available but limited [34]. If the sand supply increases, barchan dunes begin to connect with others, forming barchanoid ridges and eventually transforming into transverse dunes. Barchan dunes have the ability to migrate long distances with only a minor change in form when the above conditions are in place [36].
In this study, we propose a fully automatic method to analyze the dynamics of isolated barchan dunes using SAR data. We have applied this method over two dune fields with multi-temporal C-band SAR satellites, allowing us to identify a consistent, efficient and reliable way to derive dune shapes, dunes migration rates, and directions, that is applicable globally. We focus our analysis only on this type of dune for the sake of simplicity and to test the proposed approach.
2. Study Area
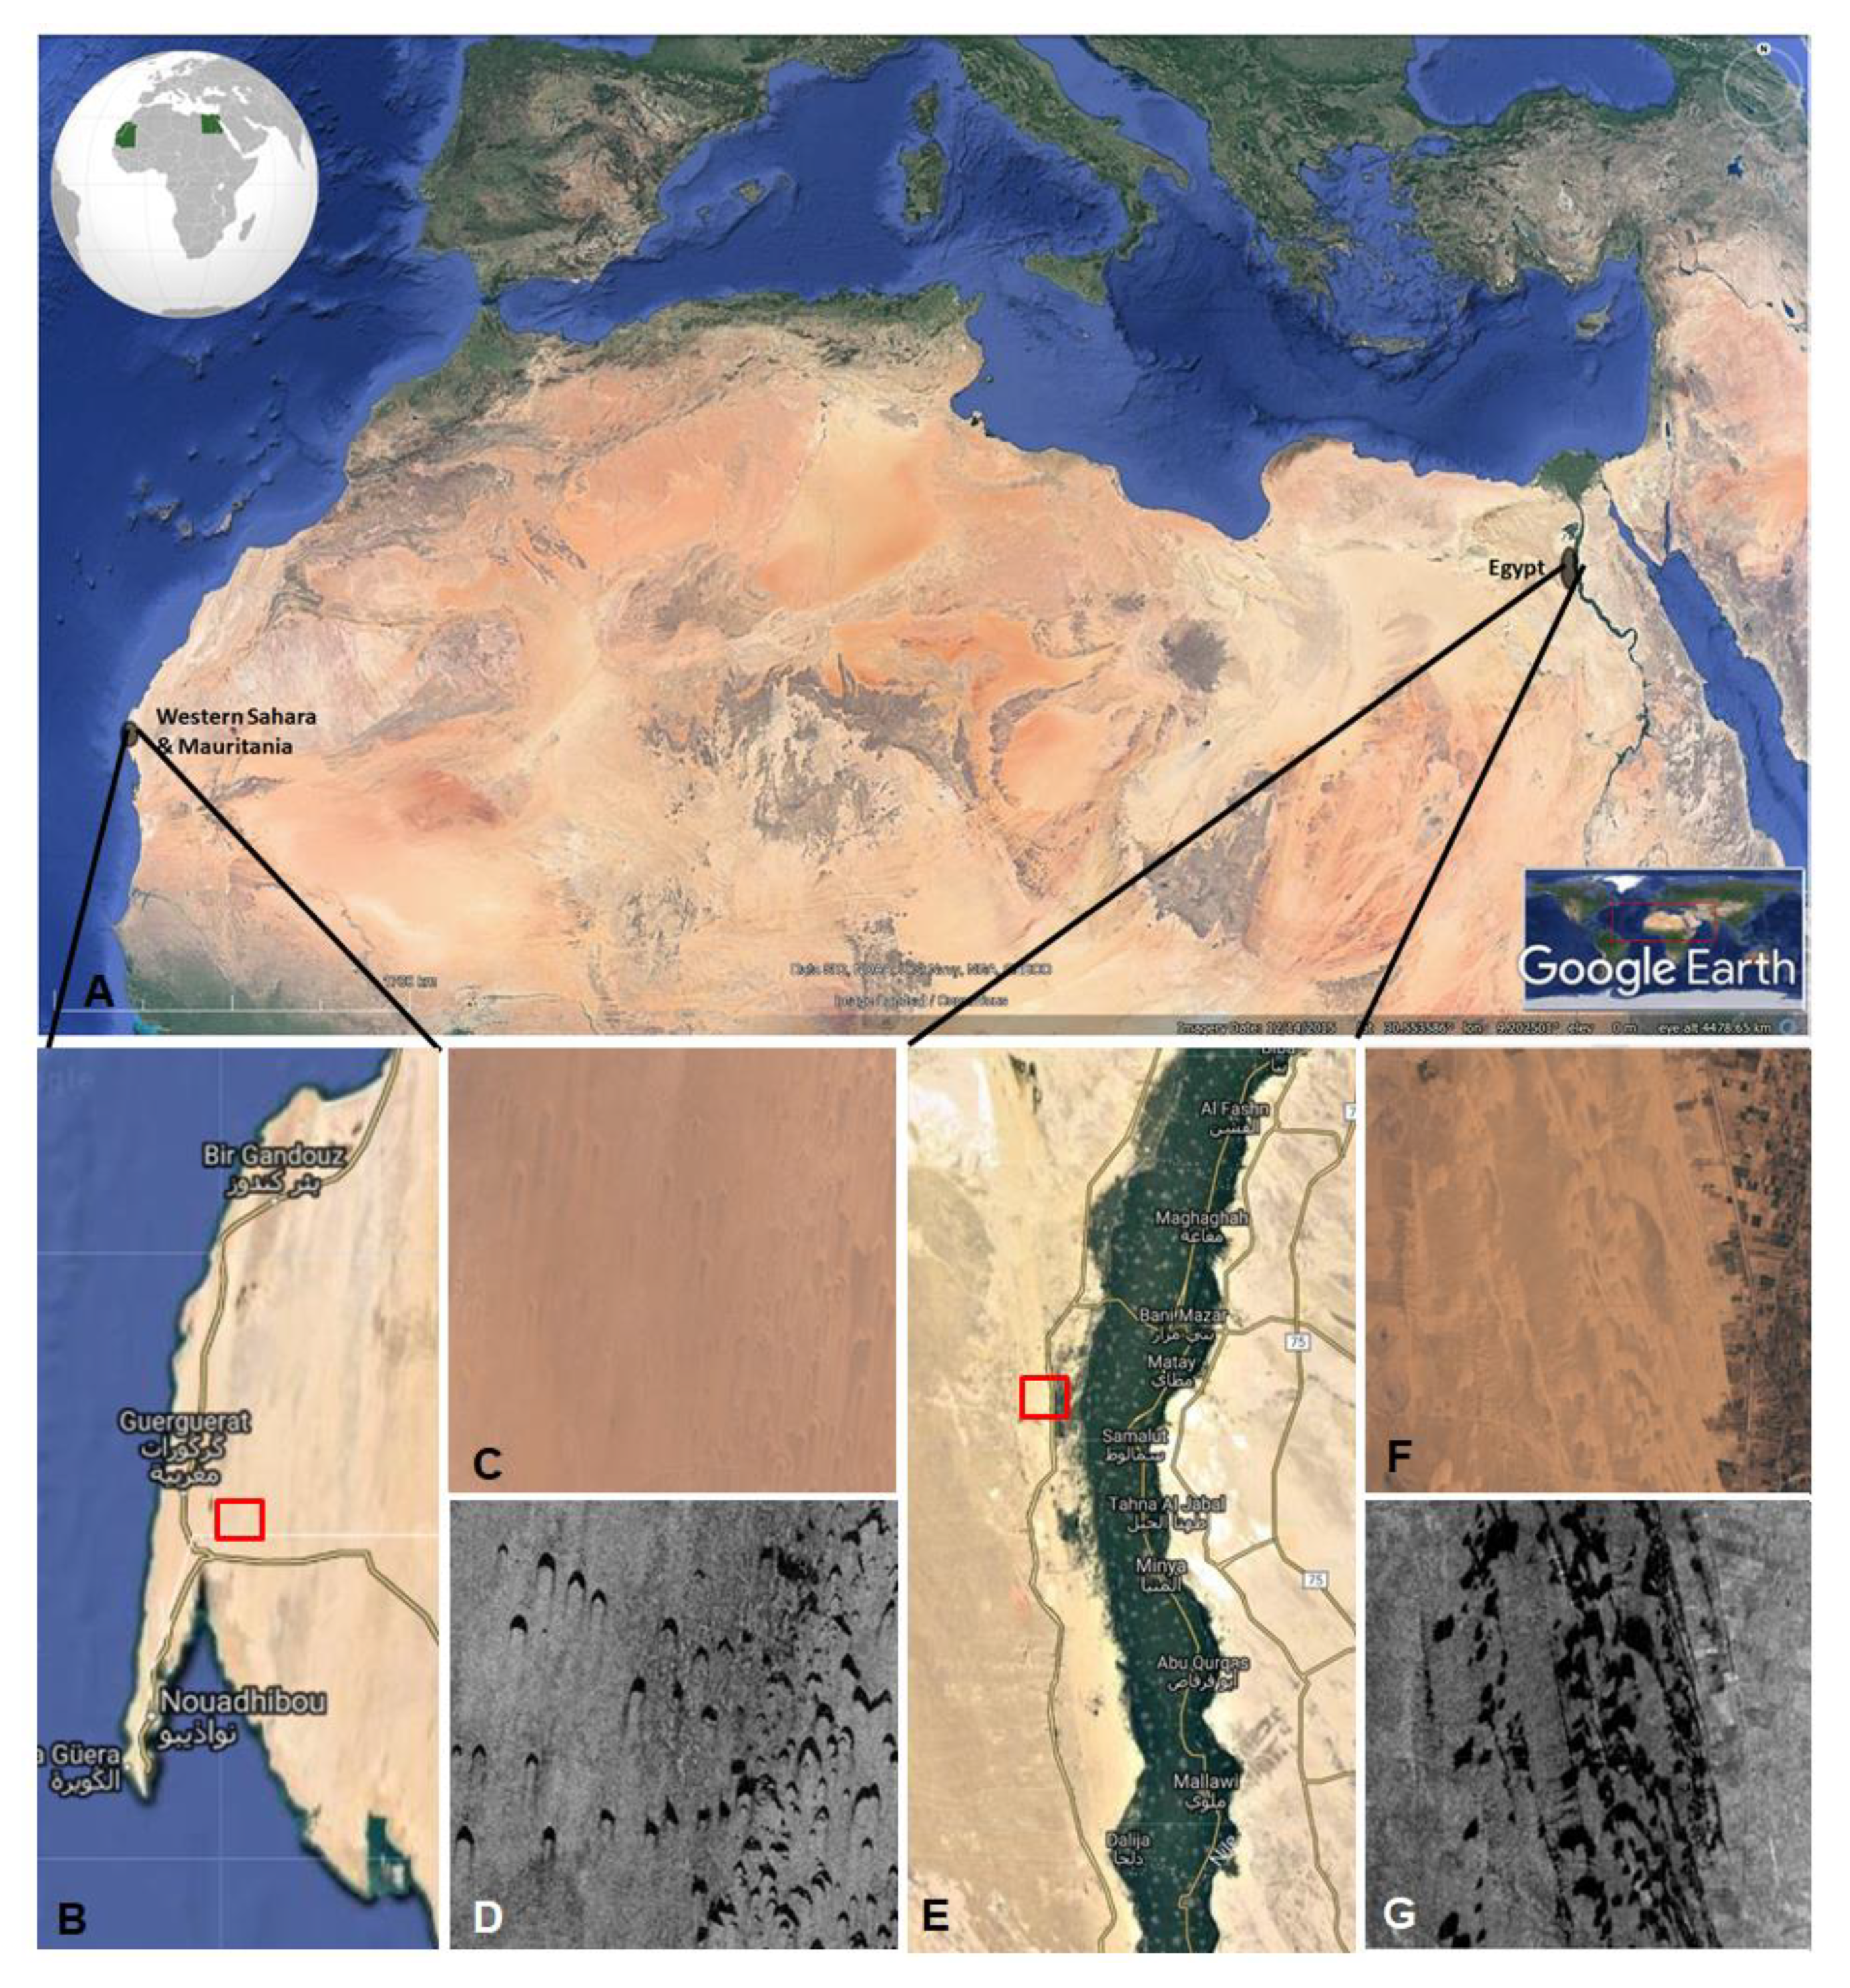
To test the proposed methodology, we selected two sandy deserts in Western Sahara-Mauritania (WSM) and Egypt (see Figure 3). We will focus our work on the dynamics of isolated barchan dunes found at the two sites. These frequently propagate as a group, sometimes interacting with one another through collisions and indirect sand exchange [38], making an automatic analysis more difficult. Isolated barchans in equilibrium move without changing their shape [36], enabling the usage or the proposed automatic analysis approach.
Both sites have different topography and wind conditions. The yearly average wind in the WSM area is much higher than in Egypt, being, N-NE 4–6 and NW 1–2, corresponding to 20–50 km/h and 1–10 km/h, respectively [39]. The WSM site comprises a sand dune field with barchan dunes over an almost flat topography with an average slope of 7 m/km in a westerly direction [40] and its substrate layer is a desert pavement formed by gravel and coarse sand [41]. The South Rayan dune field (SRDF) in Egypt lays over a substrate similar to WSM desert pavement, also formed by gravel and coarse sand [42,43] and starts with linear dunes that develop into isolated barchan dunes, which encroach on the western part of the Nile valley. Due to the tilted topography with an average slope of 50 m/km in an easterly direction, the barchan dunes are not as symmetric as those from WSM, but have an elongated eastern horn, as illustrated in Figure 3G [44].
3. Materials and Methods
3.1. Materials
The selected datasets are from previous and current European SAR satellites, i.e., the European Remote Sensing satellite (ERS), the Environmental Satellite (Envisat) and the Copernicus Sentinel-1 (S-1). Due to the spatial resolutions (about 20 m for all three sensors) and the expected dune migration rate on the study area, we selected time intervals that were distant enough to measure the dune movement. Detailed information on the dataset employed is provided in Table 1.
3.2. Method
The key element of our automatic method consists of identifying the dunes using SAR images, assuming that in an SAR image, dunes look like dark areas surrounded by brighter pixels (Figure 4).
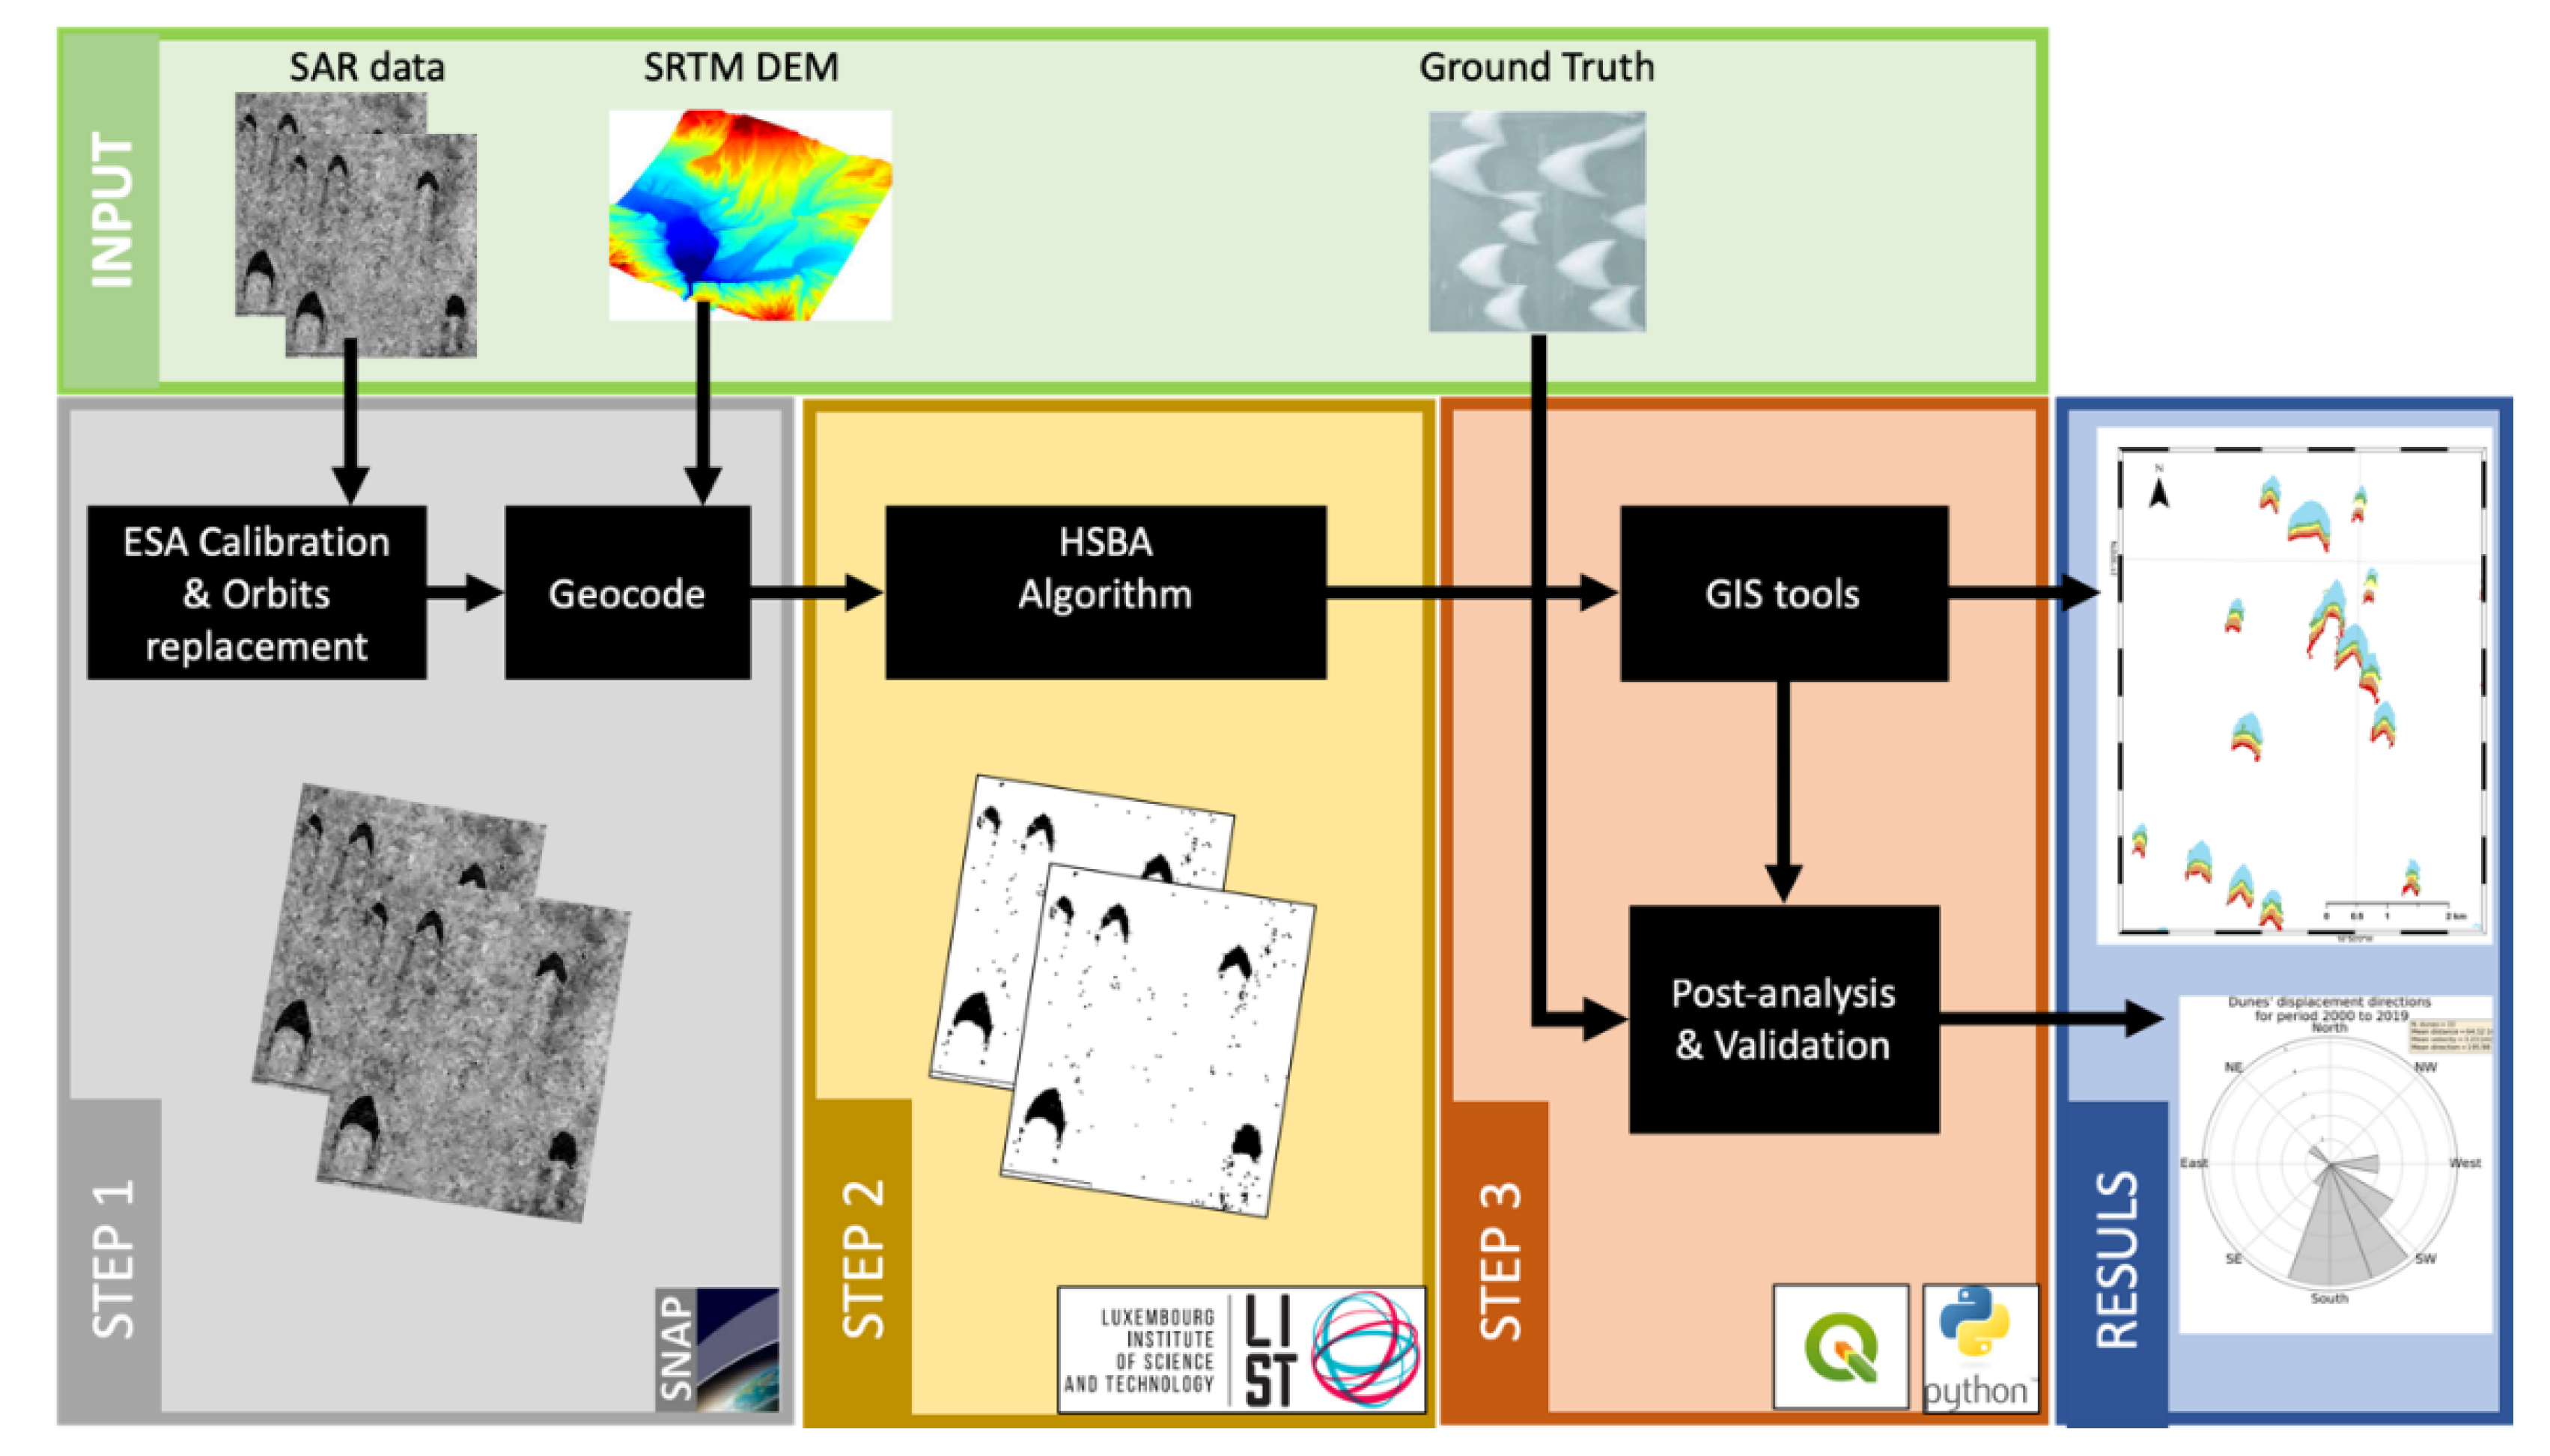
The method is divided into three steps (see Figure 5): (i) SAR data preprocessing; (ii) dune identification using the Hierarchical Split Based Approach (HSBA) algorithm [28] and; (iii) dune movement computation using Geographic Information System command line tools and validation. The validation is performed using existing data and Google Earth and validated data over the South Rayan dune made available from [43].
3.2.1. SAR Data Preprocessing
SAR data has been calibrated and geocoded using the ESA calibration method incorporated in the Sentinel-1 Toolbox [45] integrated into the SeNtinel Application Platform (SNAP), using the Precise Orbits and the SRTM DEM for accurate geocoding determination. Output SAR data has been converted to a decibel scale, enhancing the contrast of the image, and making the backscattering distributions more symmetrical and Gaussian, suitable for the subsequent identification step.
3.2.2. Dune Identification Using the HSBA Algorithm
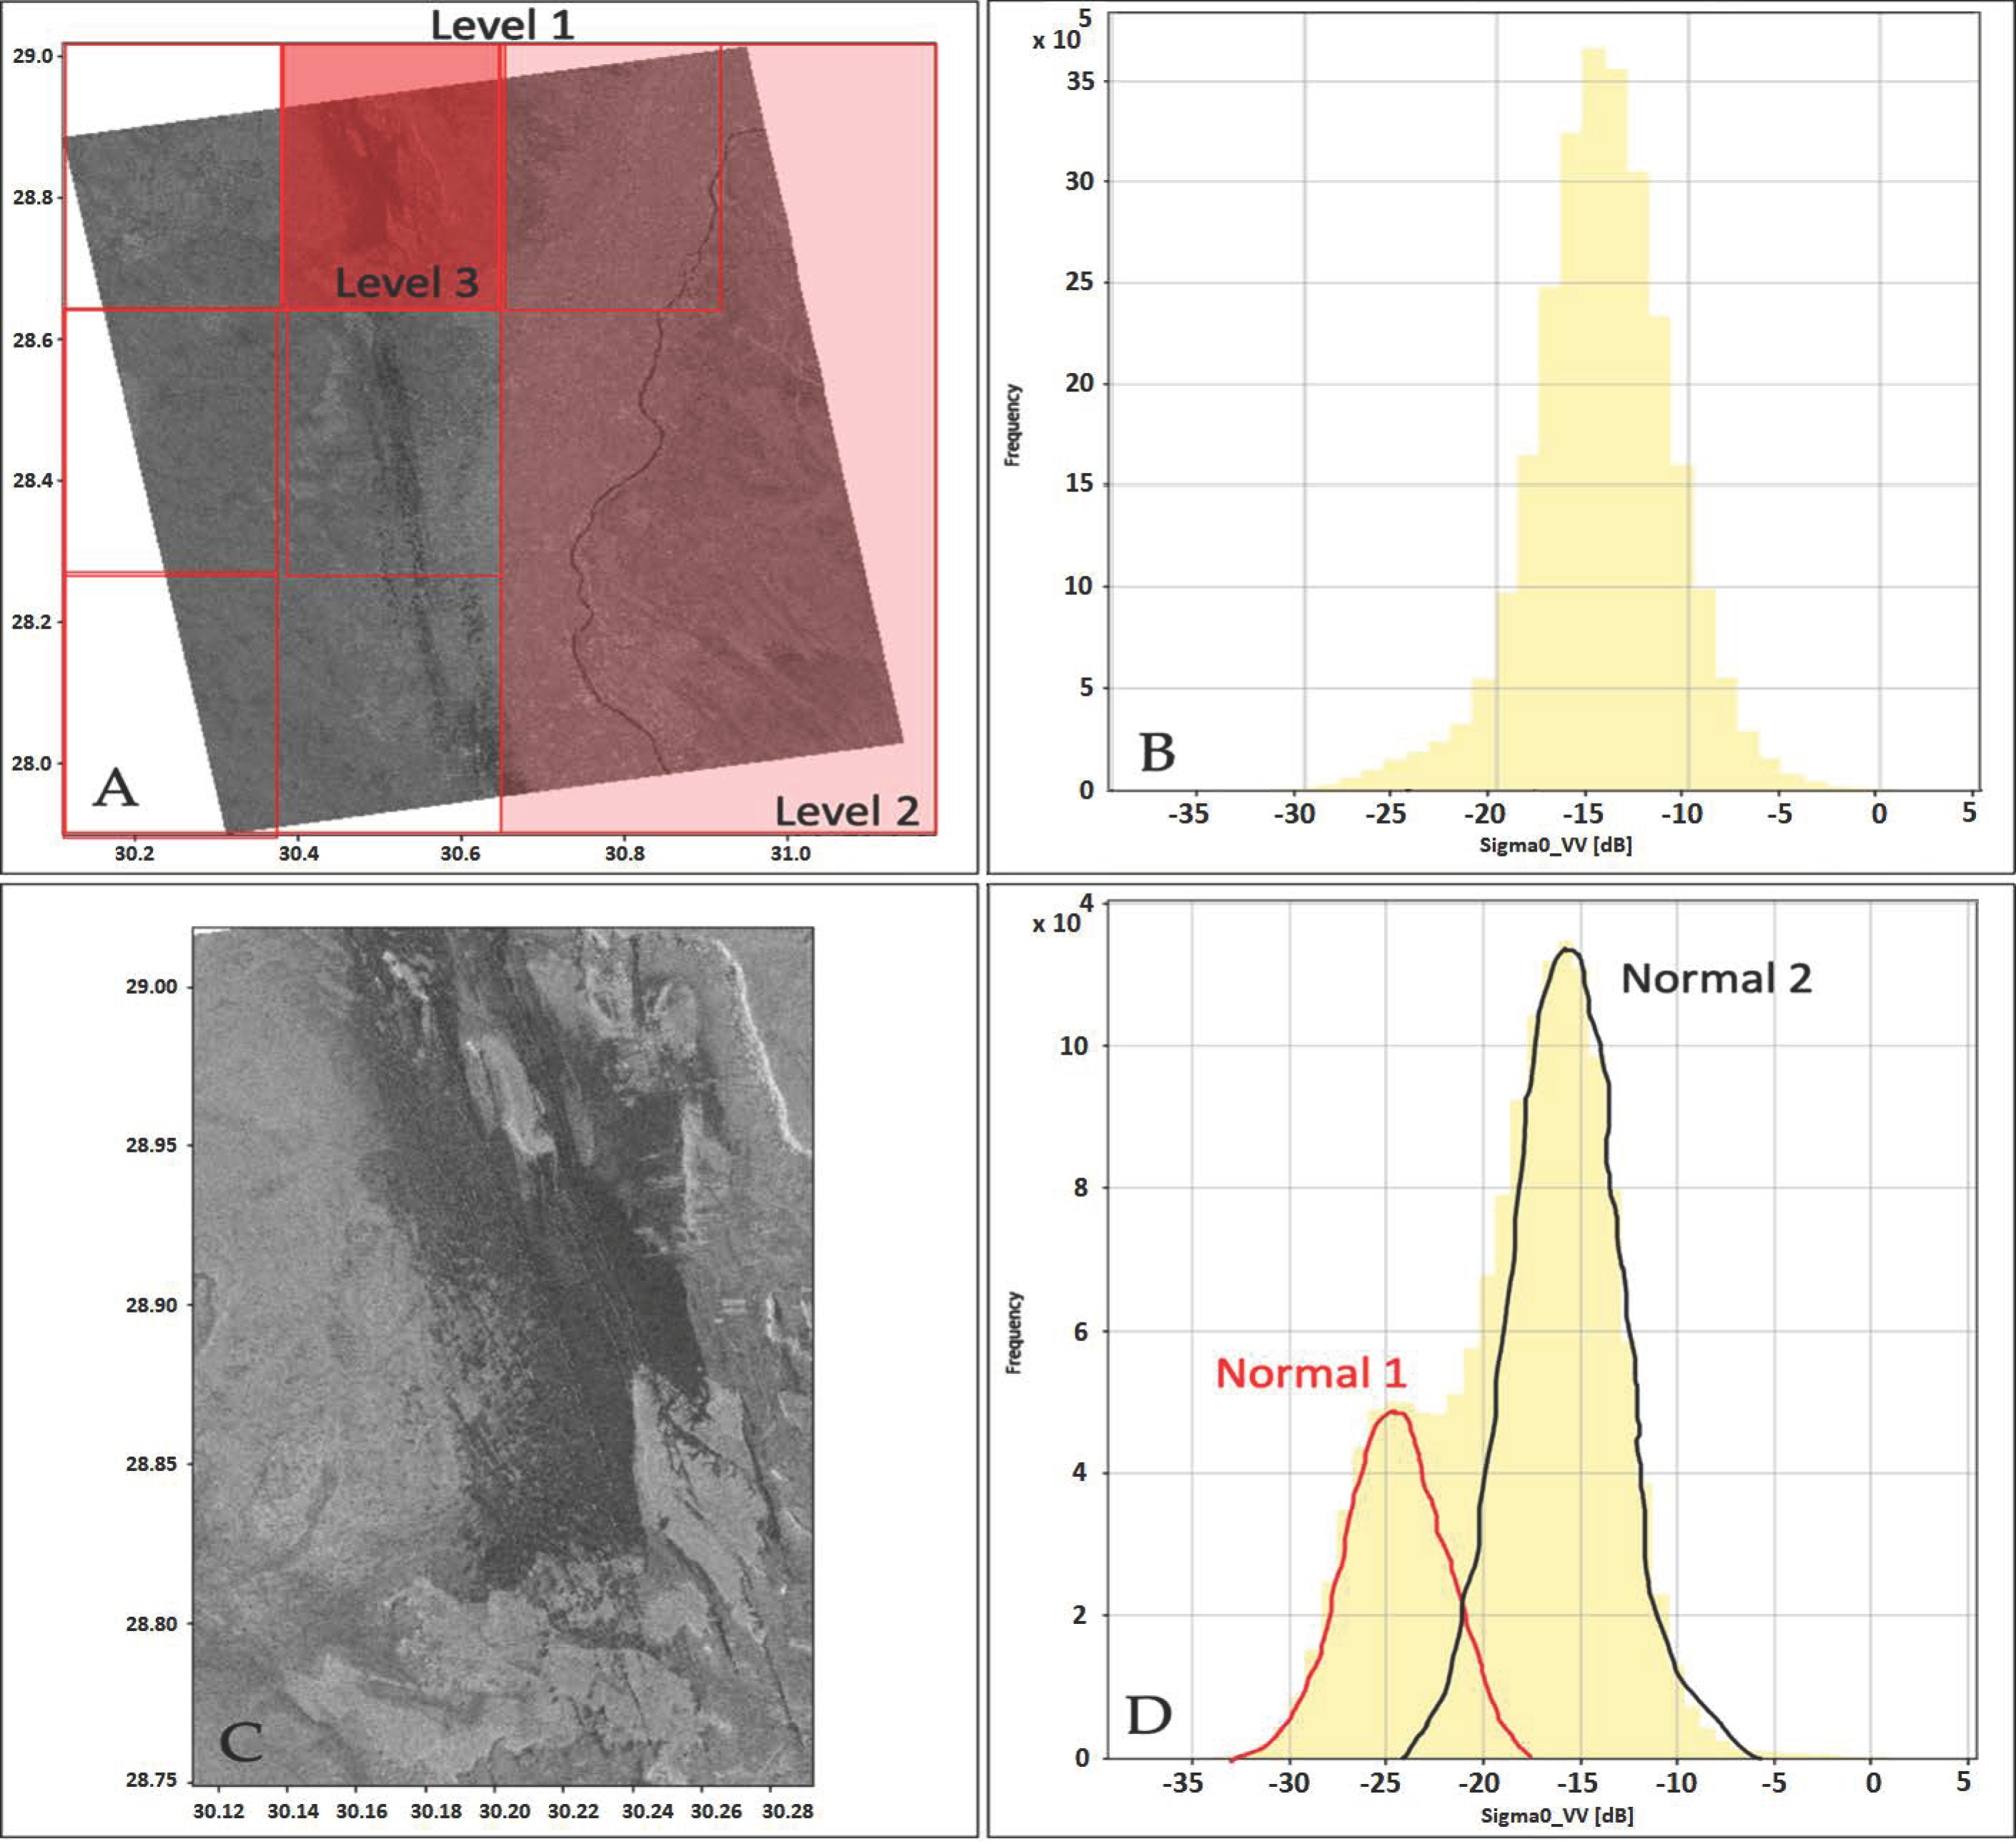
This step uses the calibrated and geocoded SAR data in the decibel scale as input and, using the HSBA algorithm, produces a raster binary image where dunes and groups of dunes, from now on called “sand bodies”, are identified. The HSBA algorithm assumes that dune backscattering is very low, positioning its probability density function (PDF) in the lowest part of the image histogram (see Figure 6B,D).
To separate the target class from the background, a thresholding approach is frequently used [46]. The drawback of this method is that the classification relies heavily on the adequacy of the selected threshold. To this end, parametric thresholding algorithms are preferable because they estimate PDFs of the target class and its background, and based on these, the threshold is selected [47]. In this context, one of the main difficulties in parameterizing these functions originates from the fact that the target class often represents only a small fraction of the image. Under such circumstances, the histogram of the image values is often not obviously bimodal, and it becomes difficult to parameterize PDFs. In the case of water detection, HSBA searches for tiles of variable sizes allowing the parameterization of PDFs of two classes [48]. This is applied here for dune detection (see Figure 6). The approach has also been successfully applied to detect buildings on a global scale [48,49] and volcanic lava flow-induced changes [50] from SAR intensity images.
To fit the PDF of the dunes class (PDFD), we use HSBA, a statistically based algorithm which makes use of a hierarchical tiling of the image. Based on PDFD, we combine histogram thresholding and region-growing processes to identify the dunes. The parameters of the region-growing and thresholding processes are automatically derived from PDFD. The definition of PDFD starting from the entire SAR acquisition is possible if the class is sufficiently represented, i.e., identifiable, and this generally depends on the shape of the histogram. The PDFD may not be easily fit from the histogram when dunes represent only a small percentage of the entire image. Therefore, it is necessary to focus on those areas of the image that are composed of a similar number of pixels belonging to dunes and background (PDFB) classes, respectively. To this end, HSBA has been used to automatically identify regions in any given SAR image where the two PDFs of dunes and background are well-separated and give rise to a bimodal histogram of the region. The main scope of this is to obtain a robust parameterization of the PDFD and PDFB, making the classification of the dune class more reliable. Here, the PDFD and PDFB are assumed to be Gaussian, motivated by the fact that the input data are multi-looked and log-transformed SAR intensity images to increase the equivalent number of looks (ENL) and to have more Gaussian distributions [51].
The proposed approach is described in detail in Chini et al. [48] In HSBA, a hierarchical tiling of the scene is initiated starting with 40 tiles (i.e., the entire image) on the first level and then continuing by iteratively subdividing the image into 4L sub images, with L being the hierarchical level of splitting. At L = 1, the image is split into quarters; with L = 2, the image is subdivided into sixteenths; and so on. Depending on L, the tiles will thus be characterized by their different sizes. At each level, descending from the upper level to the lower one, only tiles fulfilling fixed criteria are selected, while the others will be further split.
The criteria to select a tile are: (1) The histogram of the tile has to be bimodal and composed of two Gaussian PDFs (Figure 6D); (2) The number of pixels belonging to a dunes class must be composed at least of 20% of the considered tile; (3) The mode of PDFD has to be lower than a predefined value, which is set to −17 dB, because the backscattering of the dune class is expected to be low.
To fit PDFD and PDFB from the histogram of a given tile, we use the Levenberg–Marquardt algorithm, a technique to solve nonlinear least square problems [52]. To check the bimodality of the histogram, we use the Ashman D coefficient [53], which quantifies how well two Gaussian distributions are separated, e.g., PDFD and PDFB, by considering the distance between their main modes and their dispersions, i.e., standard deviations. To consider the PDFs as well-separated, the Ashman D coefficient has to be higher than 2.
All tiles selected based on the three previously defined criteria are merged together and the resulting histogram is used to fit the final PDFD and PDFB to be used in the next steps for thresholding the image. Although the resulting PDFs are well-separated, some overlap is still present, consequently setting the threshold where PDFD is equal, PDFB can produce some over- and under-detection. To reduce these latter drawbacks, contextual information is also used via a region-growing approach ([48,54]). The region-growing algorithm starts from seed pixels and adds connected pixels to them that lie within a predefined tolerance value. The choice of the threshold values for the seeds and for stopping the growth is a crucial point. The strategy we follow to select these two parameters is based on PDFD. We select seed pixels with a high likelihood of belonging to the dunes class, e.g., pixels with backscattering values lower than the PDFD mode, while many different thresholds to stop the growth are tested, and we select the one that minimizes the RMSE between the theoretical PDFD and the empirical histogram resulting from the region-growing.
3.2.3. Dune Movement Using GIS Functions
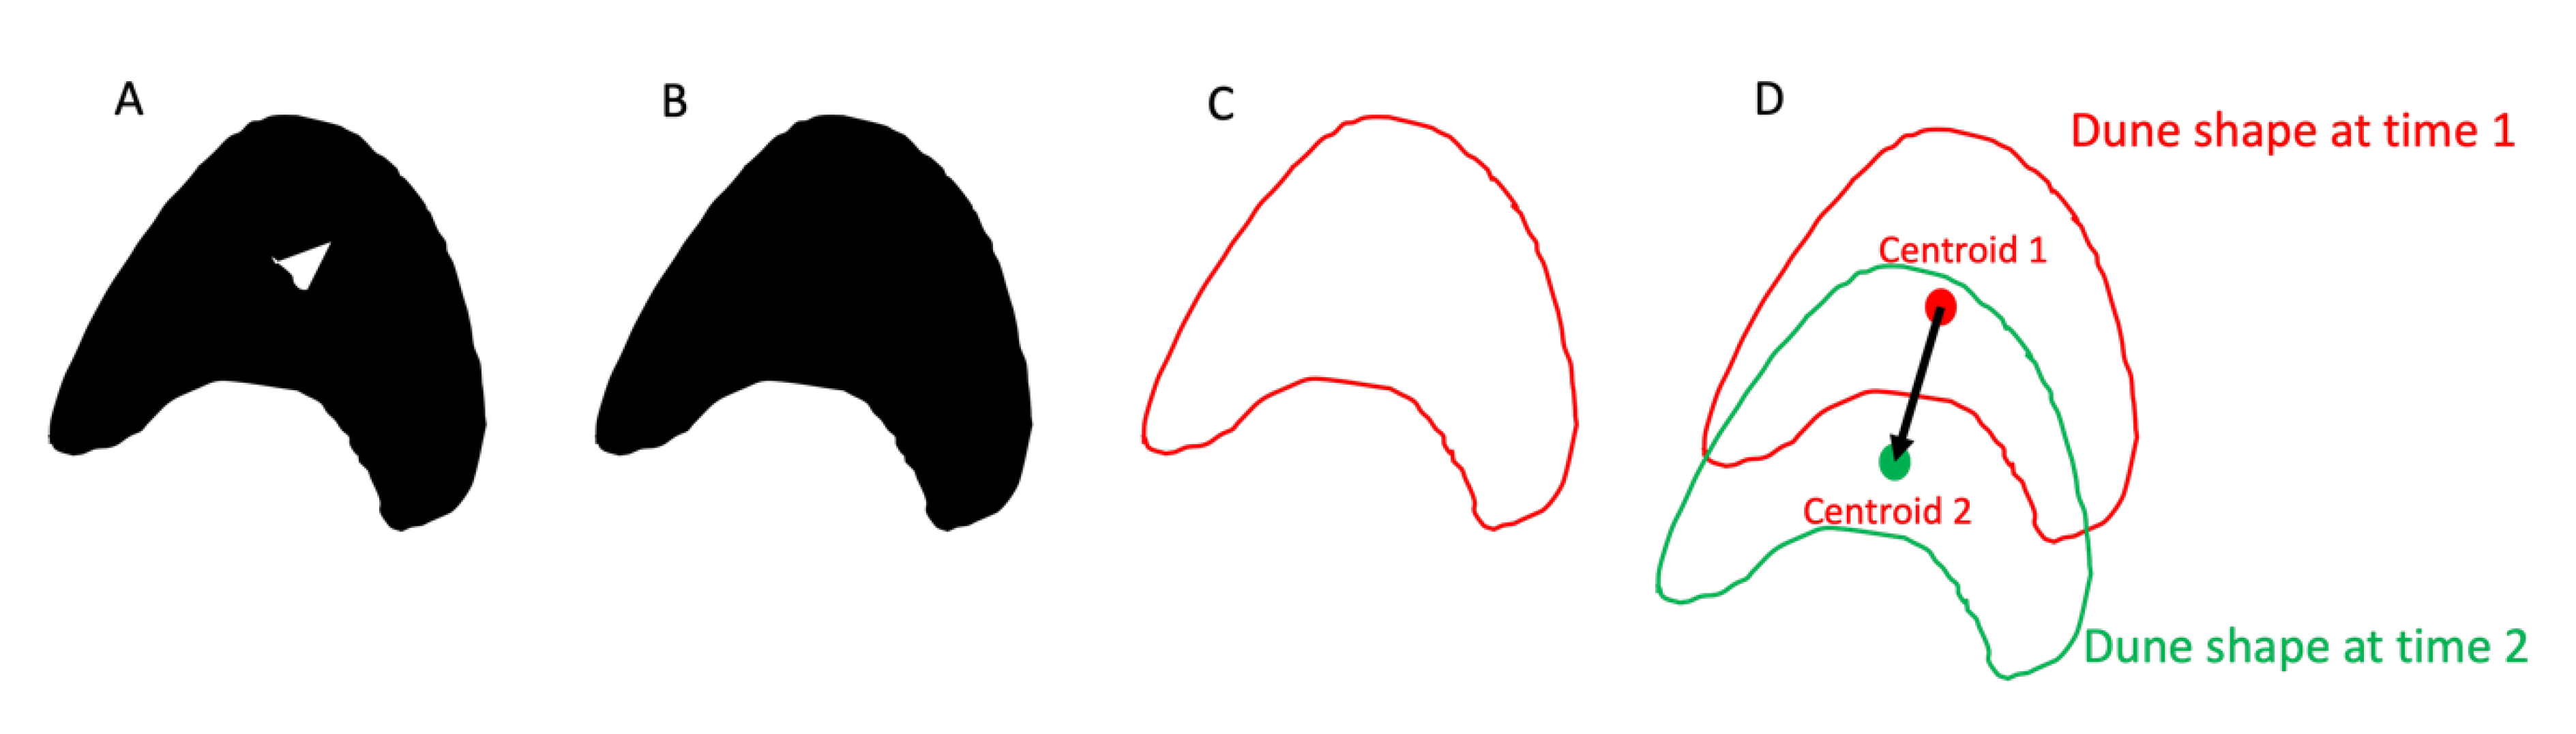
This last step uses a pair of binary images obtained after the dune identification step as input and computes the movement of individual dunes based on centroid differences of the intersecting dunes (see Figure 7) as done in [43]. The algorithm assumes that a dune shifts by less than its width in the direction of movement, making an adequate SAR time sampling necessary. This latter will be guaranteed by new satellite constellations, which are able to systematically image the surface with a very small repeat cycle, e.g., the six days of Sentinel-1.
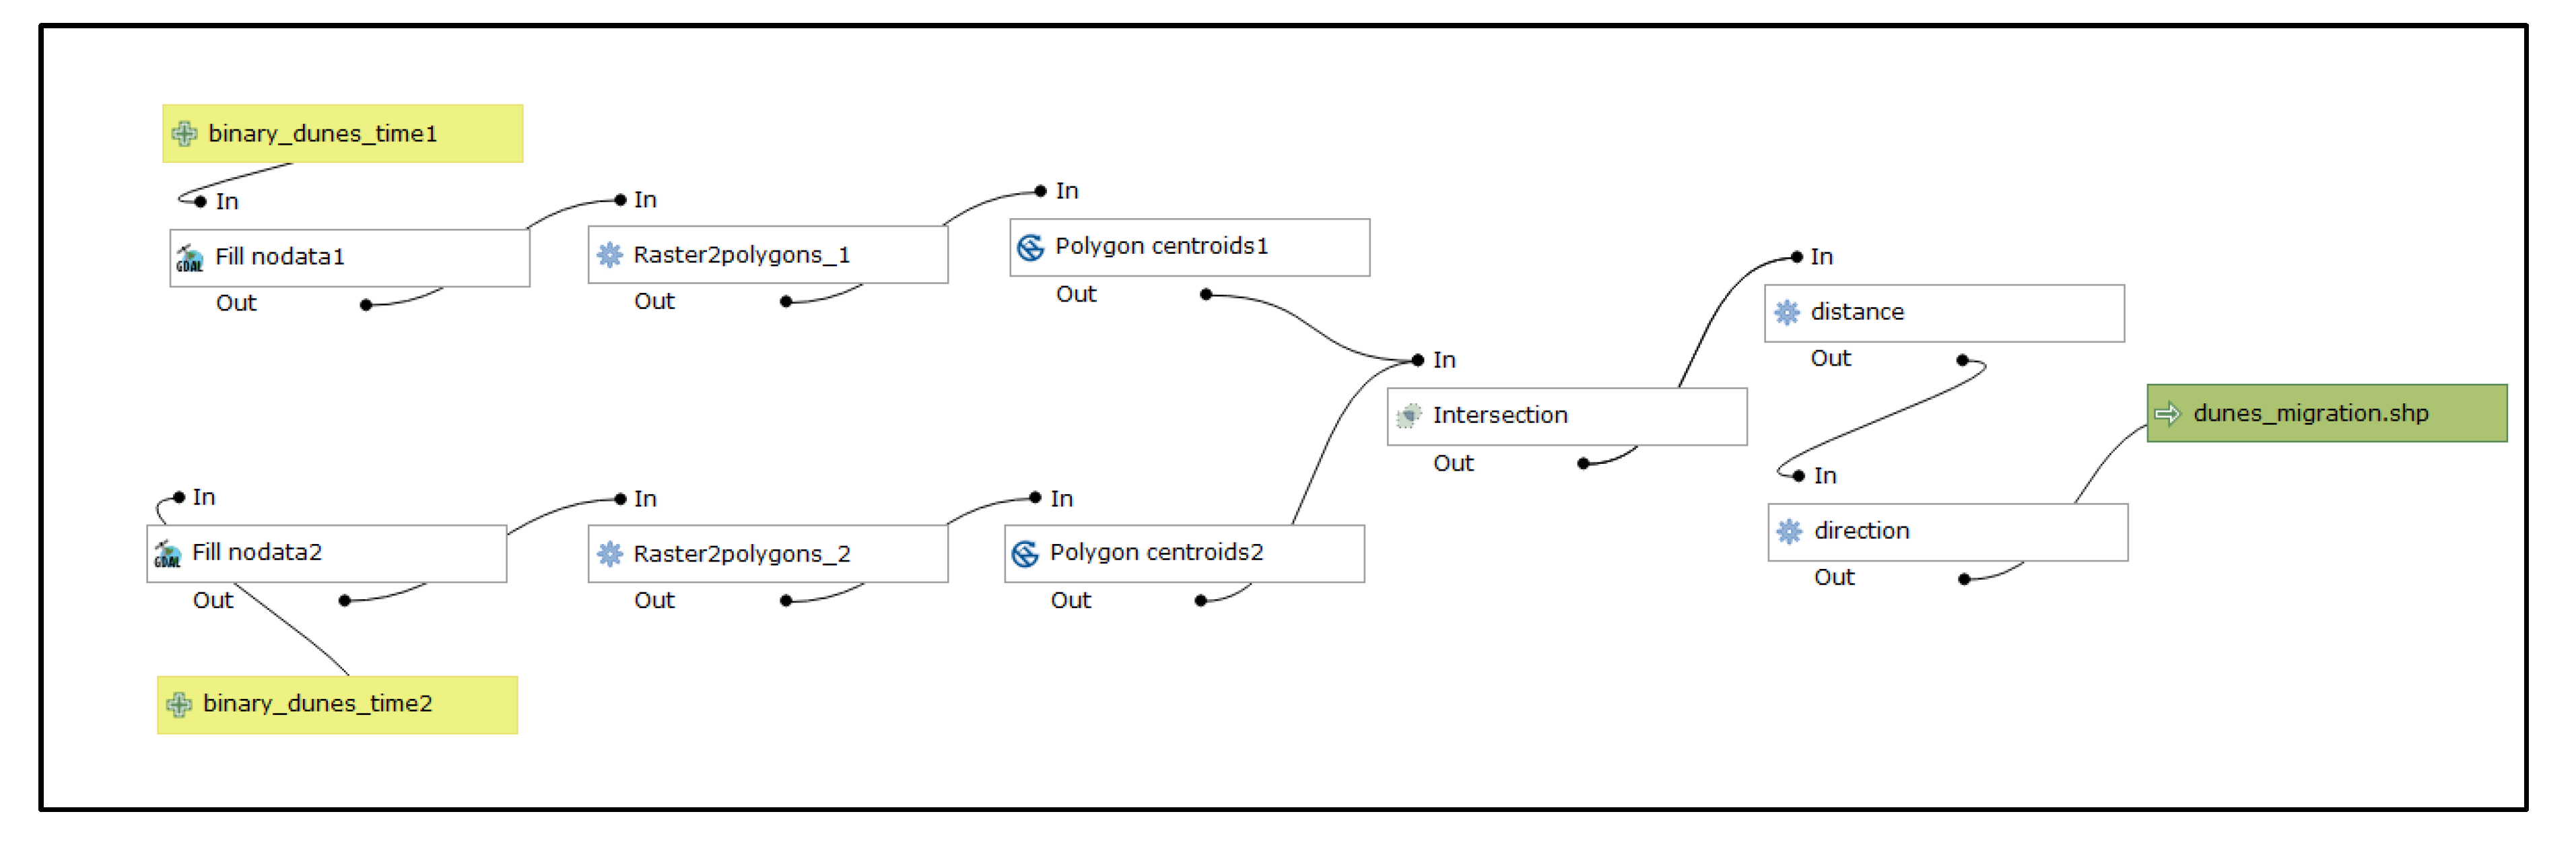
The functions employed in this step are: (i) fill the holes- of the binary images; (ii) polygonize them; (iii) compute x and y centroid coordinates for the different polygons; (iv) find the intersecting polygons at two dates; and (v) estimate movement and direction. Directions of dune movement range, clockwise, from 0 to 360 degrees, where 0 degree corresponds to the north direction. The QGIS processing modeler [55] was employed to define and create the automatic processing employed in this step (see Figure 8).
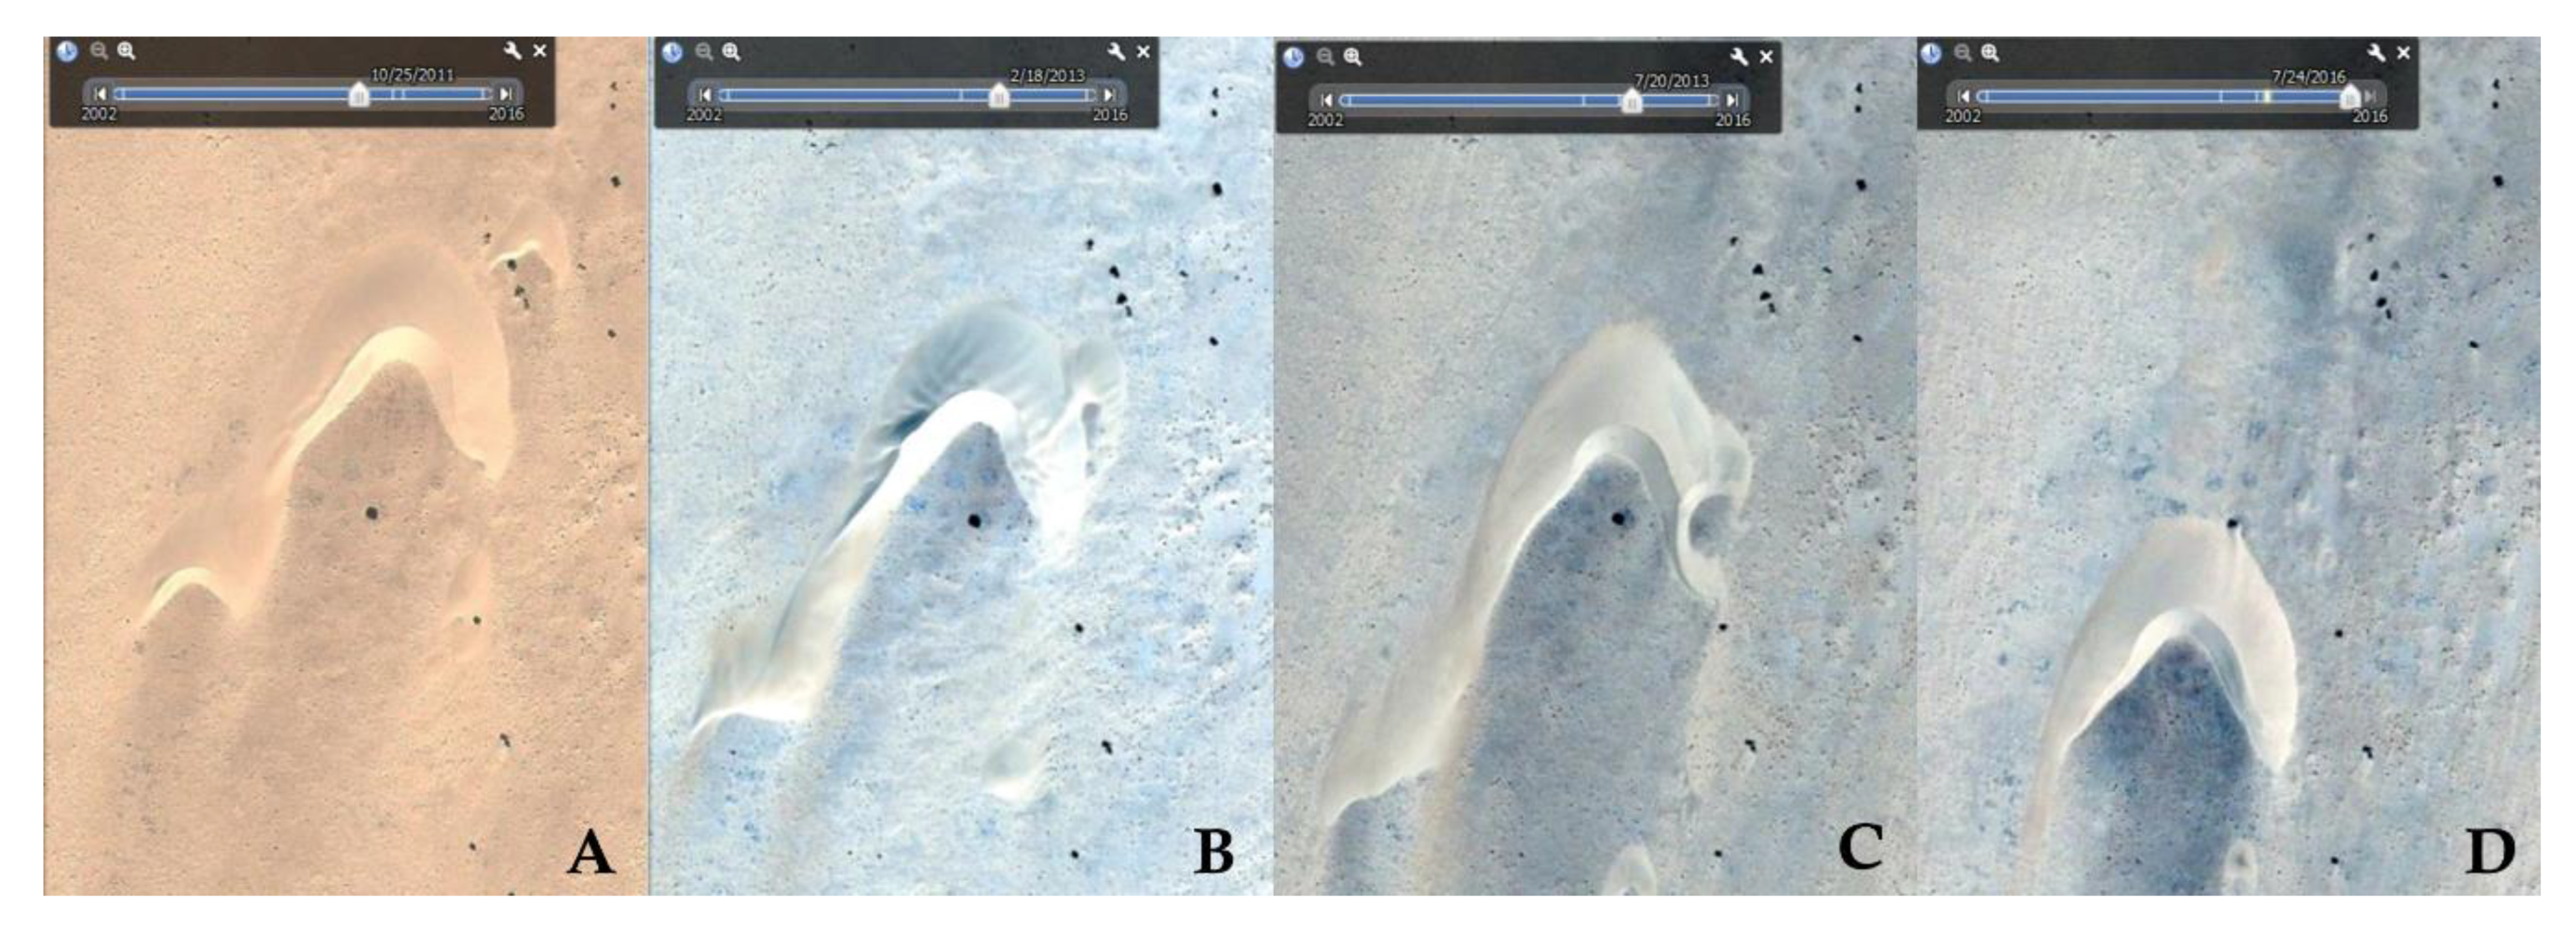
The results obtained are finally filtered based on an area consistency criterion that we defined in line with the area consistency principle of the isolated barchan, which moves conserving its shape and hence also its area. This area consistency criterion can be translated as the dune area loss between the observed dates, as illustrated in Equation (1). Based on that criterion, variations in the area measured using our method can be values ranging in the interval [0, 1], which can help us discriminate individual dunes from other cases such as dune merging and dune splitting (see Figure 9), which could produce high variability of the observed dune area. The area consistency criterion measures the area loss, given by the following equation:
where the area is the dune area for each time observed t1 and t2 and measures the area loss between two observations compared to the maximum area observed.
3.2.4. Validation
We have manually delineated dunes from both the WSM and SRDF areas for two different time periods using very high resolution optical data available in Google Earth, enabling the comparison of the results obtained from our automatic approach with the manual delineation and analysis, in terms of dune locations, and movement characteristics such as distance, average velocity, direction and area loss for both delineated and satellite-derived data.
Additionally, and for the specific case of the South Rayan dune field, we also used the existing dataset obtained from [43].
4. Results
4.1. West Sahara-Mauritania
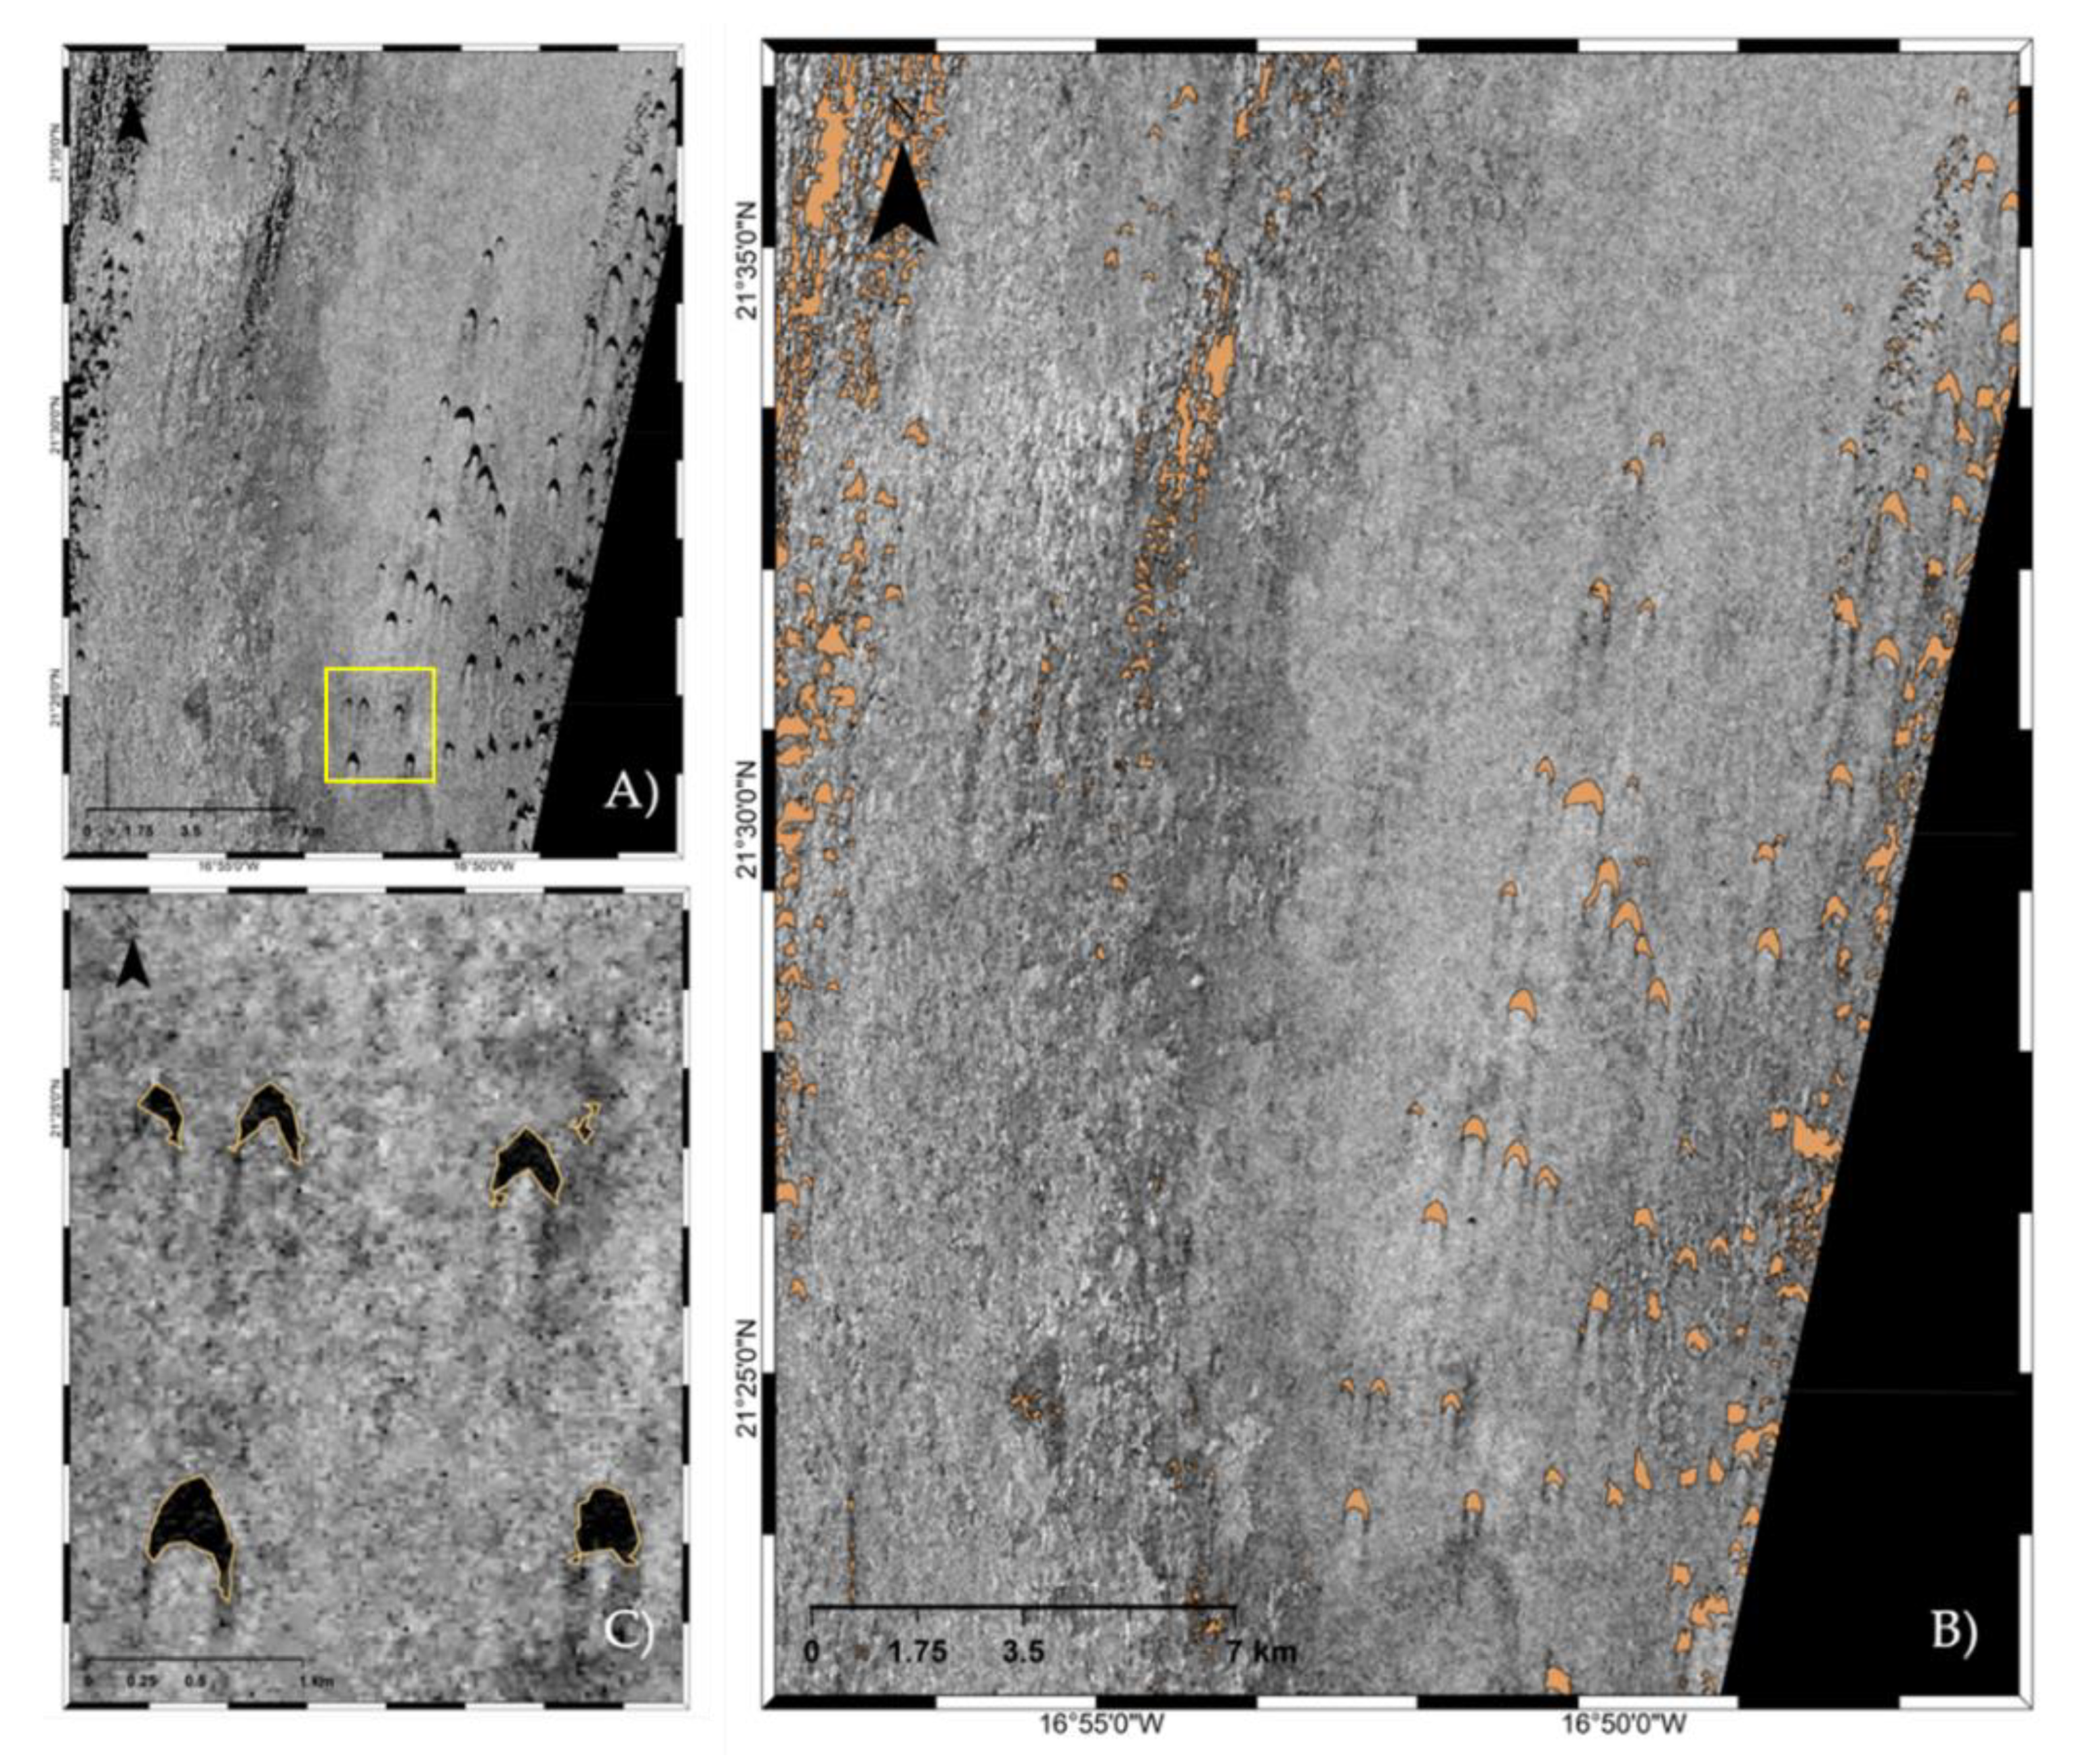
We applied the aforementioned methodology to the West Sahara dataset, obtaining after our dune identification step the detected sand bodies for the different satellite acquisitions. Figure 10 shows one example of the sand body identification obtained using Envisat data acquired in 2003. Figure 10B illustrates an Envisat ASAR image overlaid with the detected sand bodies in brown. Figure 10C shows a small subset of the SAR image overlaying it with the contour of such detections.
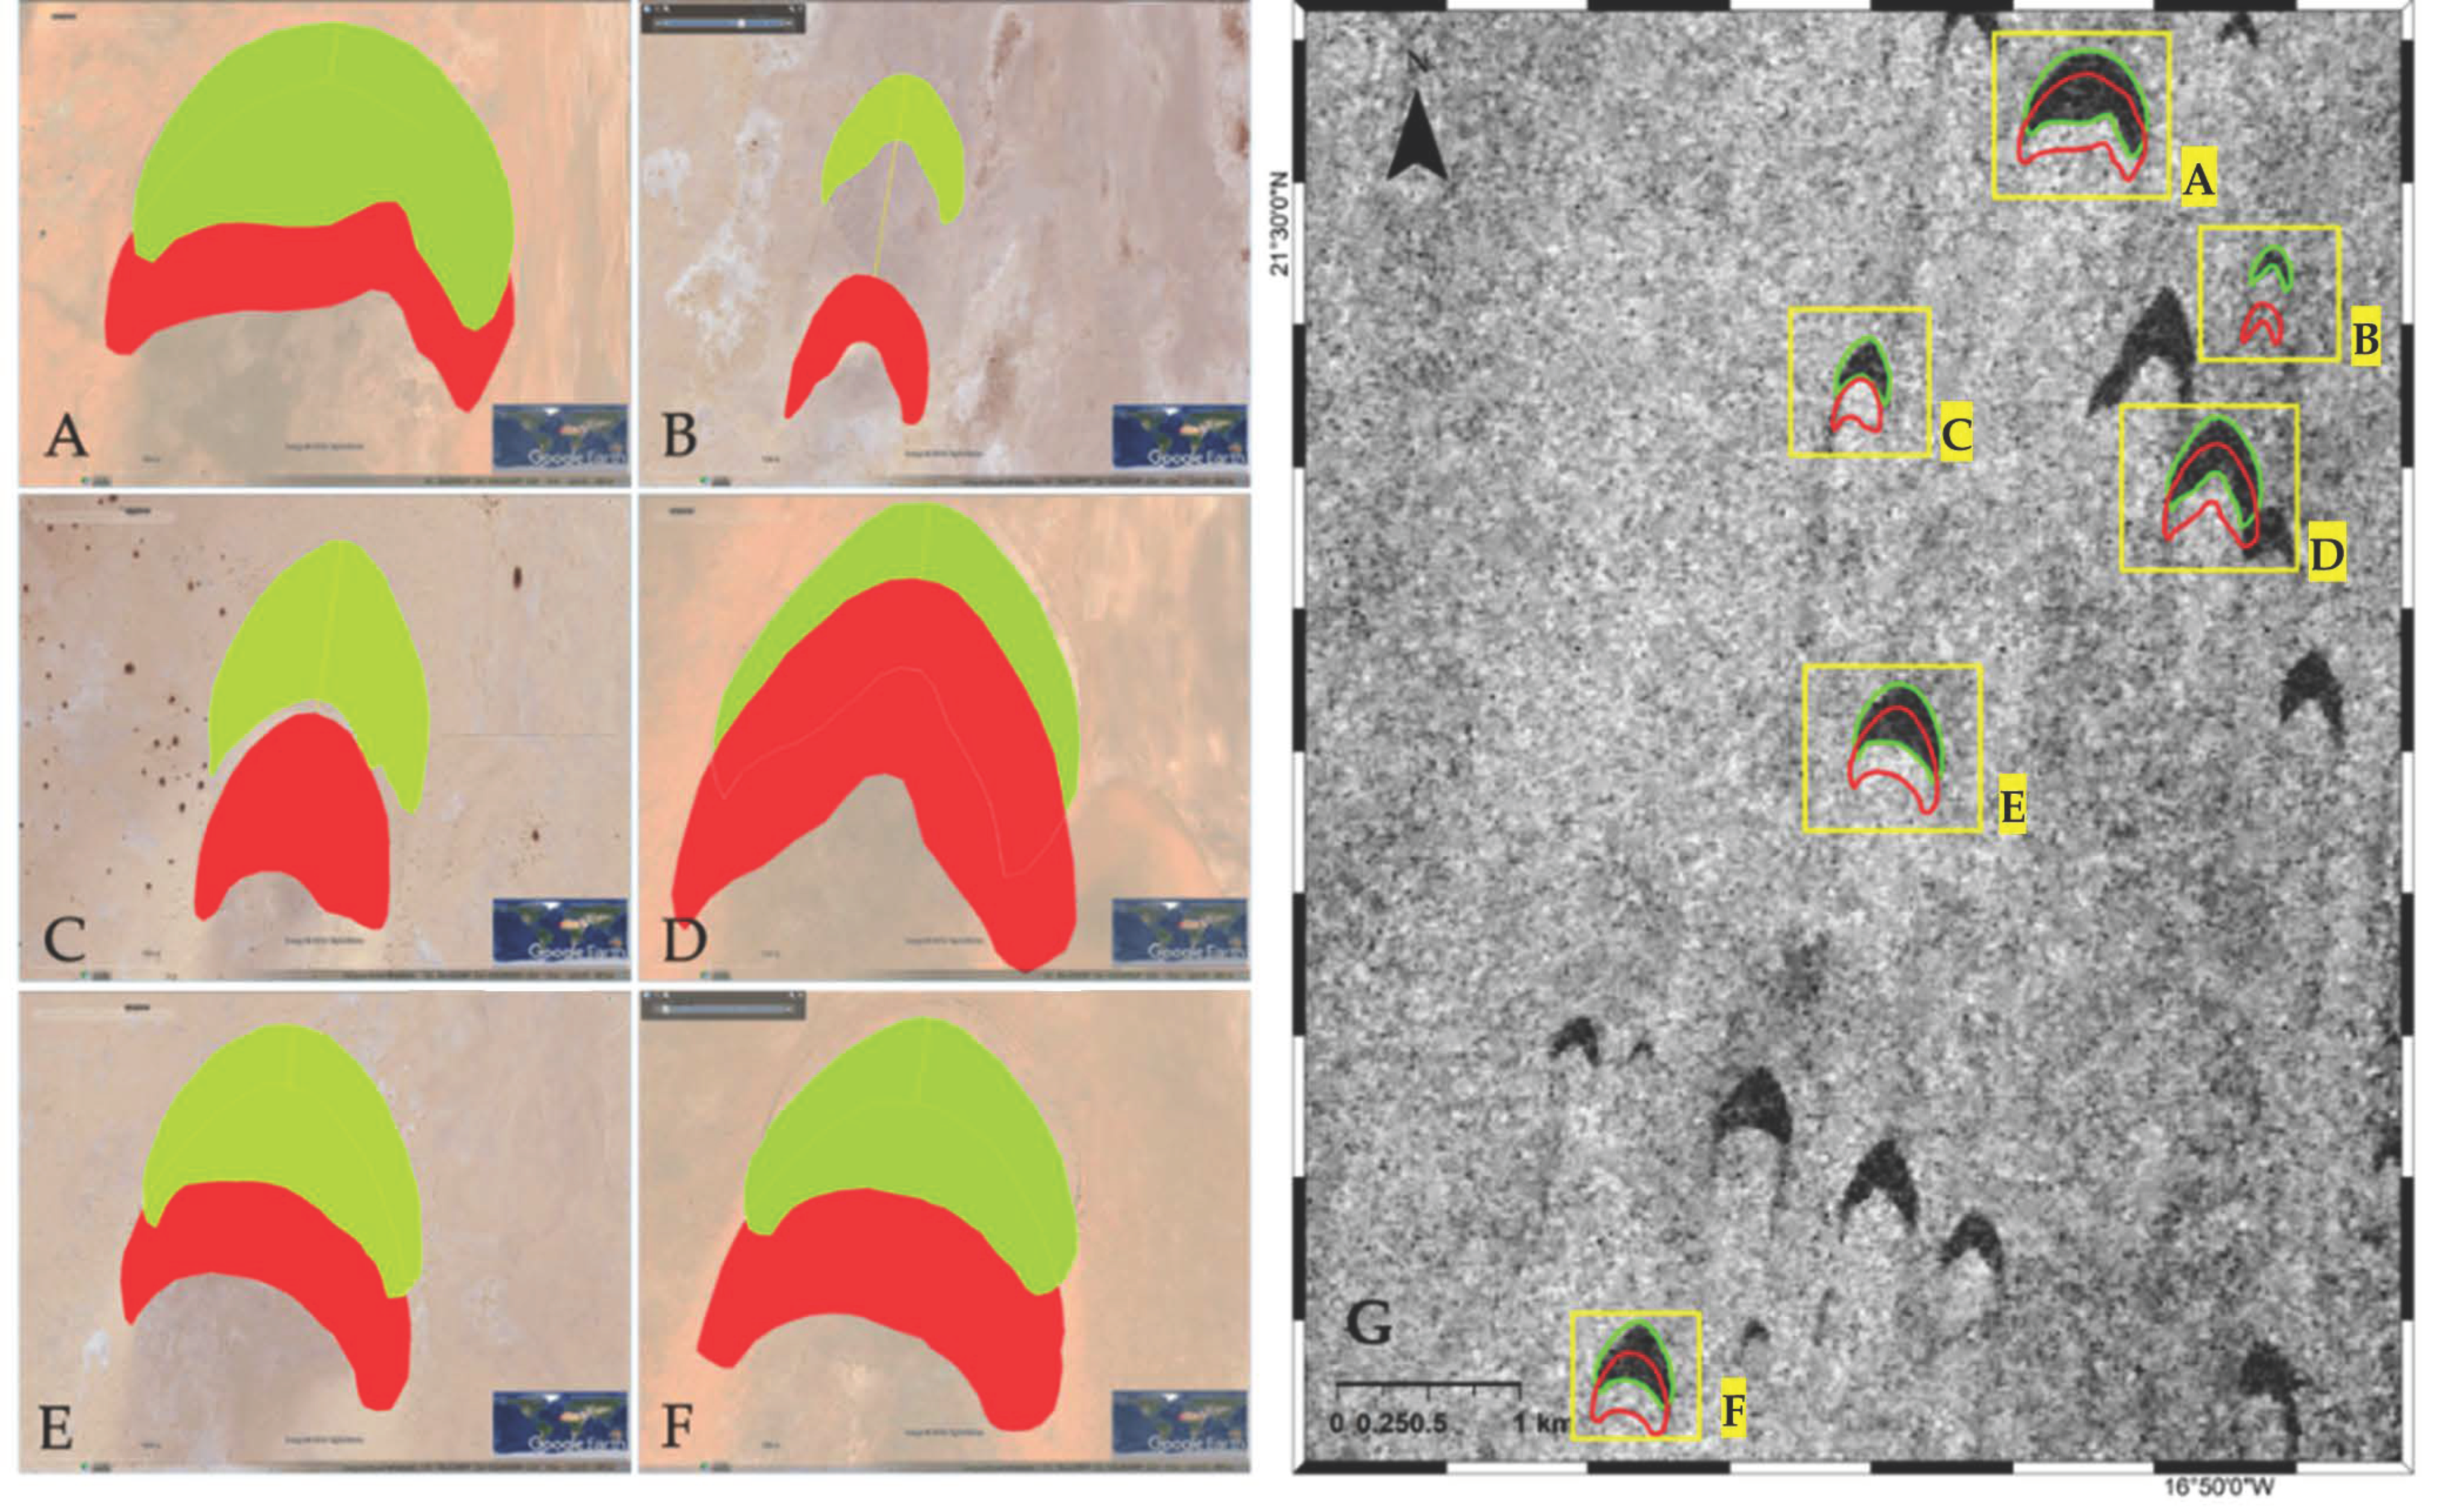
In addition, we manually delineated six dunes over VHR optical data on 2 dates, one in 2003, matching one of our datasets, and the other in 2013, as this was the latest data available in Google Earth for that area (see Figure 11). By doing this, we obtained a realistic and true threshold for the area loss computation (Equation (1)) to use in our study. Moreover, we were able to compute their long-term movement characteristics. Furthermore, Figure 11G shows a small area of the WSM site where the six dunes employed as ground truth are located, showing the crescent shape of the barchan dunes, which is symmetric in most cases.
Besides this, we computed the distance, velocity, area loss and direction of the delineated dunes, which are found in Table 2, confirming the area consistency principle of isolated barchan dunes (with area loss < 0.2), and also confirming the average direction obtained using the automatic method (direction SSE, from 180 to 190 degrees). This threshold (area loss < 0.2) was used to identify the isolated barchan dunes in equilibrium among all detected sand bodies with overlap in Table 3.
Using our automatic method, we have detected a total amount of sand bodies (not only isolated dunes) which varies from one image to another (Table 3). The biggest differences among the detected sand bodies correspond to images acquired with different sensors and without the exact same geographic coverage (Table 3).
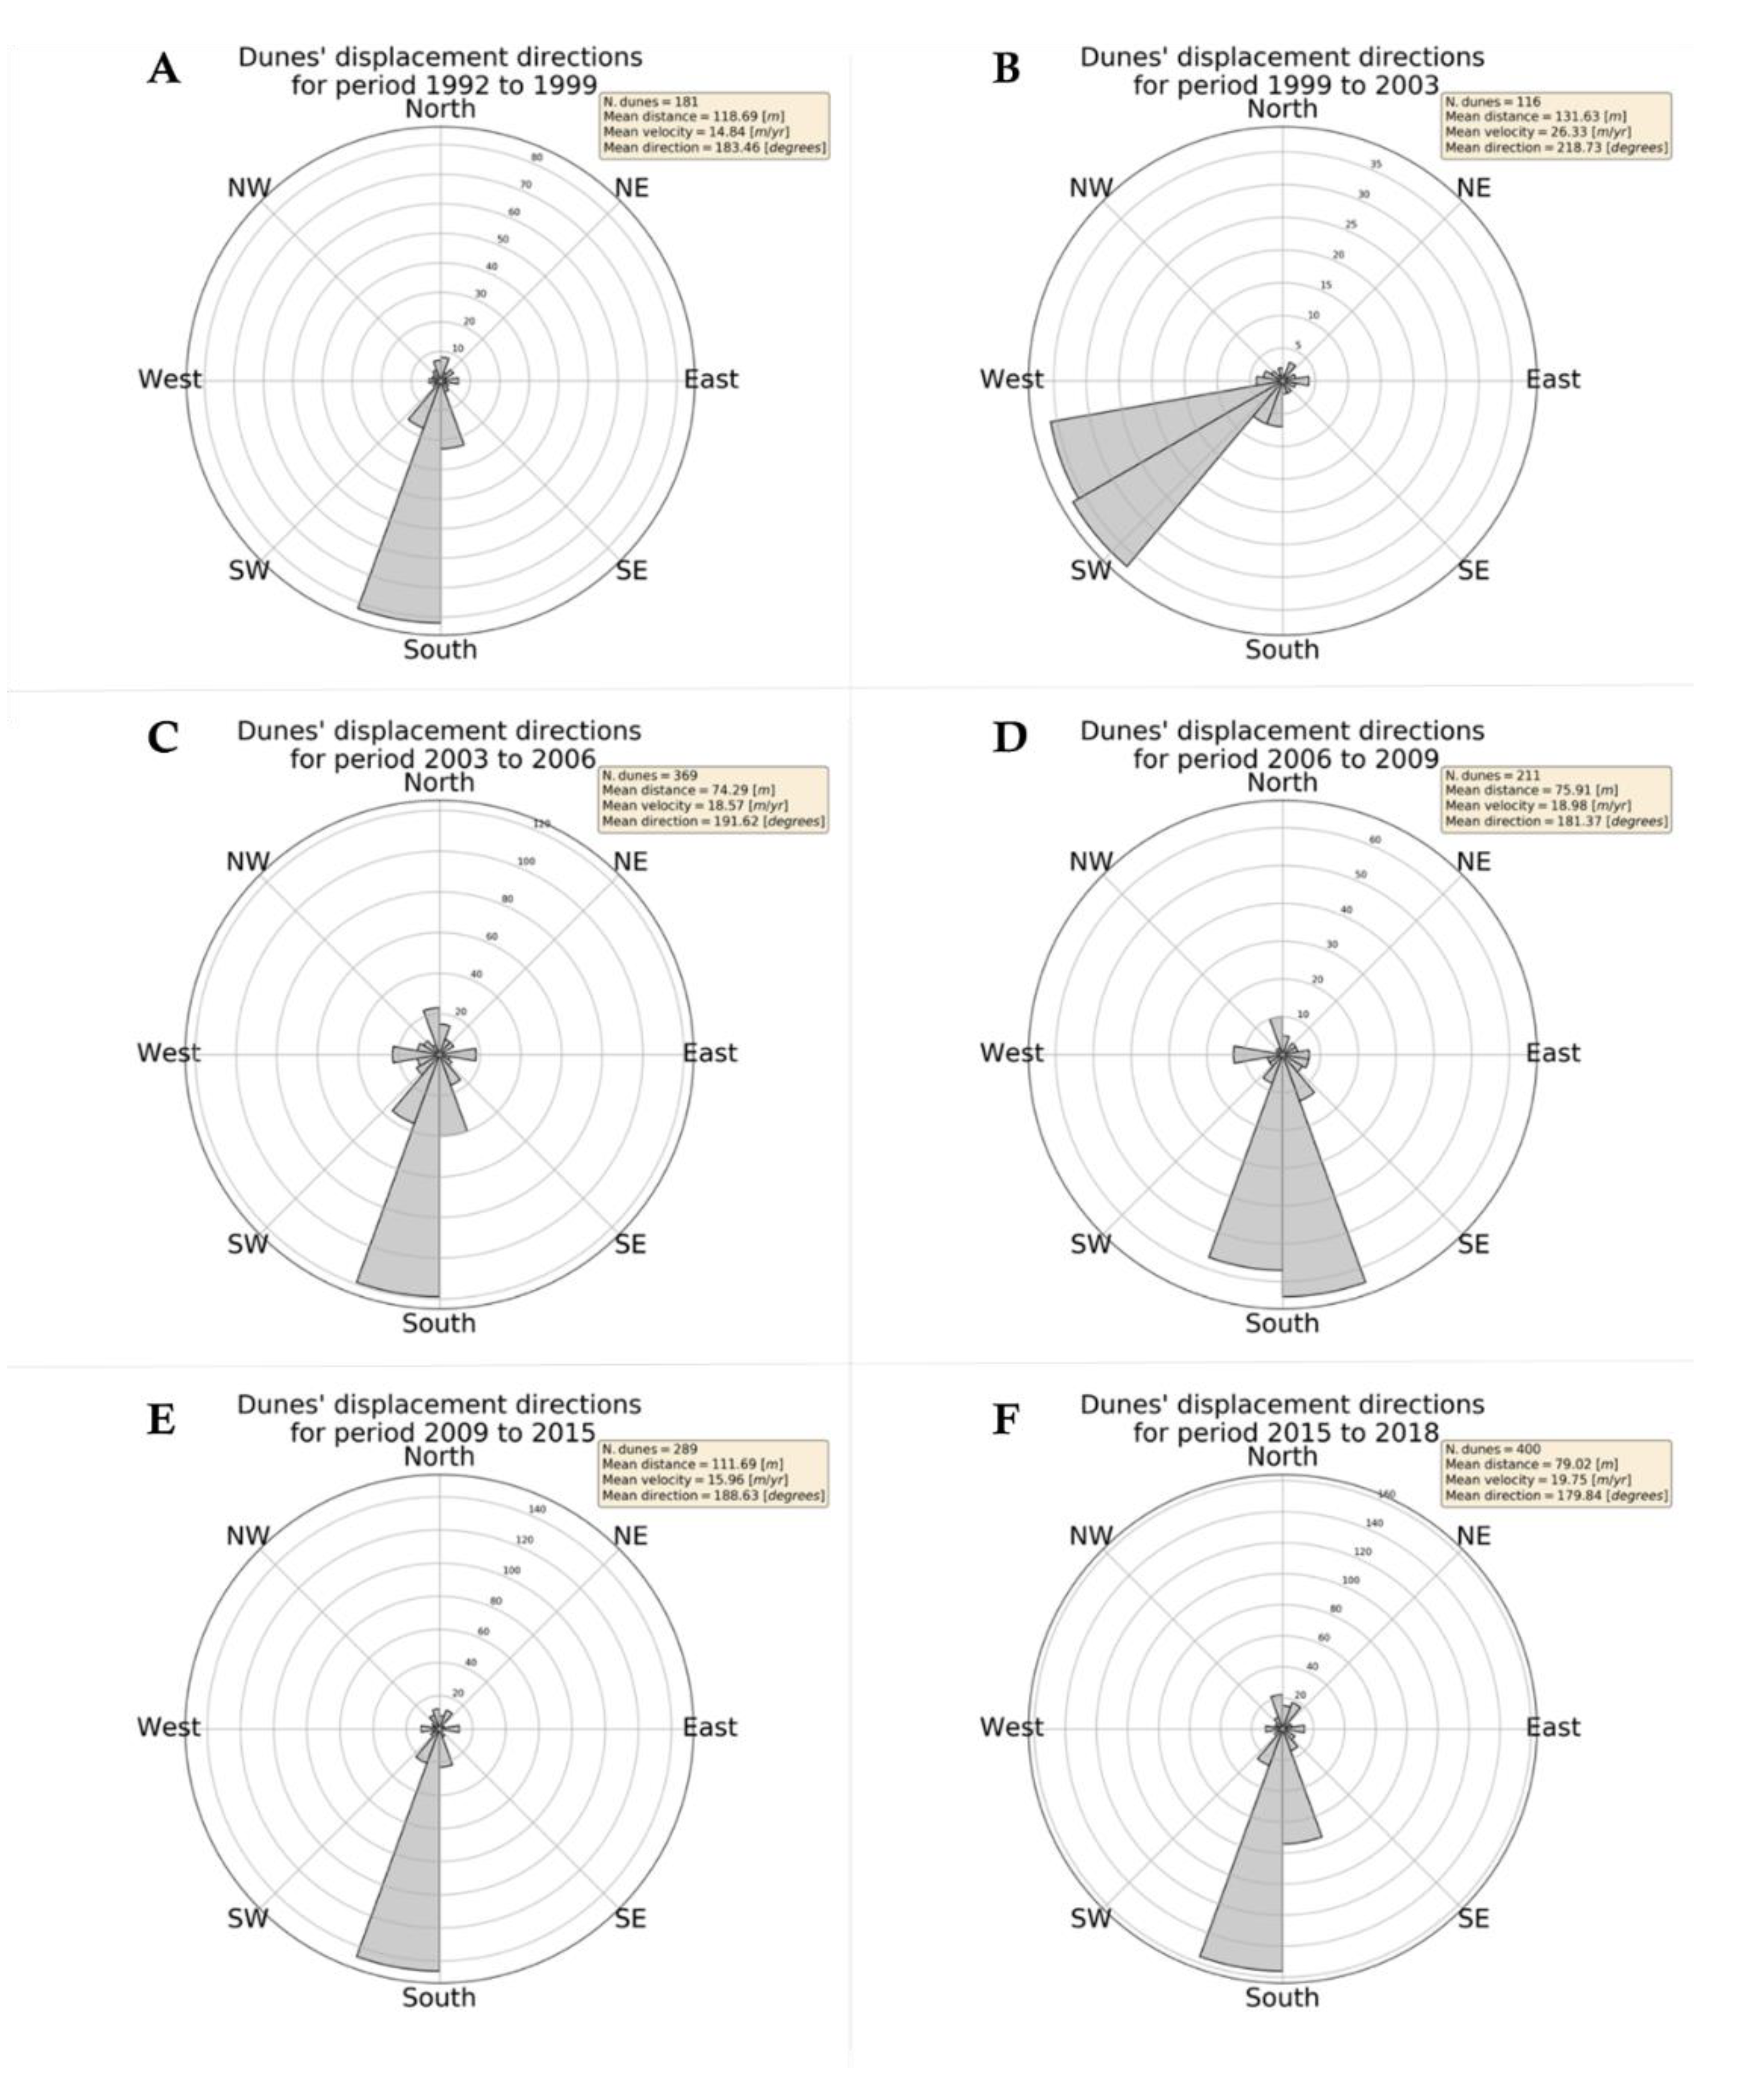
We applied the area consistency criterion to Equation (1), ensuring that the dune measurements reported are obtained from isolated barchan dunes, whose characteristic is its invariant shape in an ideal situation, the results of which are reported in Table 3. We obtained average dune velocities ranging from 15–26 m/yr for the analyzed area. Note that the resulting number of isolated dunes with an overlap between the dates is much lower than the total amount of detected sand bodies. Figure 12 illustrates the histogram of the heading direction of movement of these isolated barchans in WSM.
Looking at the values reported in Table 3 and Figure 12, it seems that there could be an error in the average heading obtained, which could also interfere with the velocity calculated. We will analyze this in the discussion section.
The values obtained using the proposed method for the delineated dunes are shown in Table 4. There is a high level of consistency between the velocities obtained with the automatic method and the ground truth, as well as the heading (max difference of 7 degrees) and distance. Despite this consistency, there are differences in the mean area detected, and these are higher for the smallest dunes (C) detecting almost 36% less compared to 12–20% for the others. These differences in the detected area are linked to: (i) the spatial resolution of the sensor (20 m × 20 m); and (ii) the non-detected areas being located in the borders of the dunes, as a certain volume of sand accumulated is needed in order to appear dark in the SAR data. The proposed method could not provide information for dune B in an automatic manner due to its lack of overlap in the analyzed period. However, with the scope of the comparison, its dune migration information (normally performed in step 3) was measured manually and is also presented in Table 4.
4.2. South Rayan Dune Field in Egypt
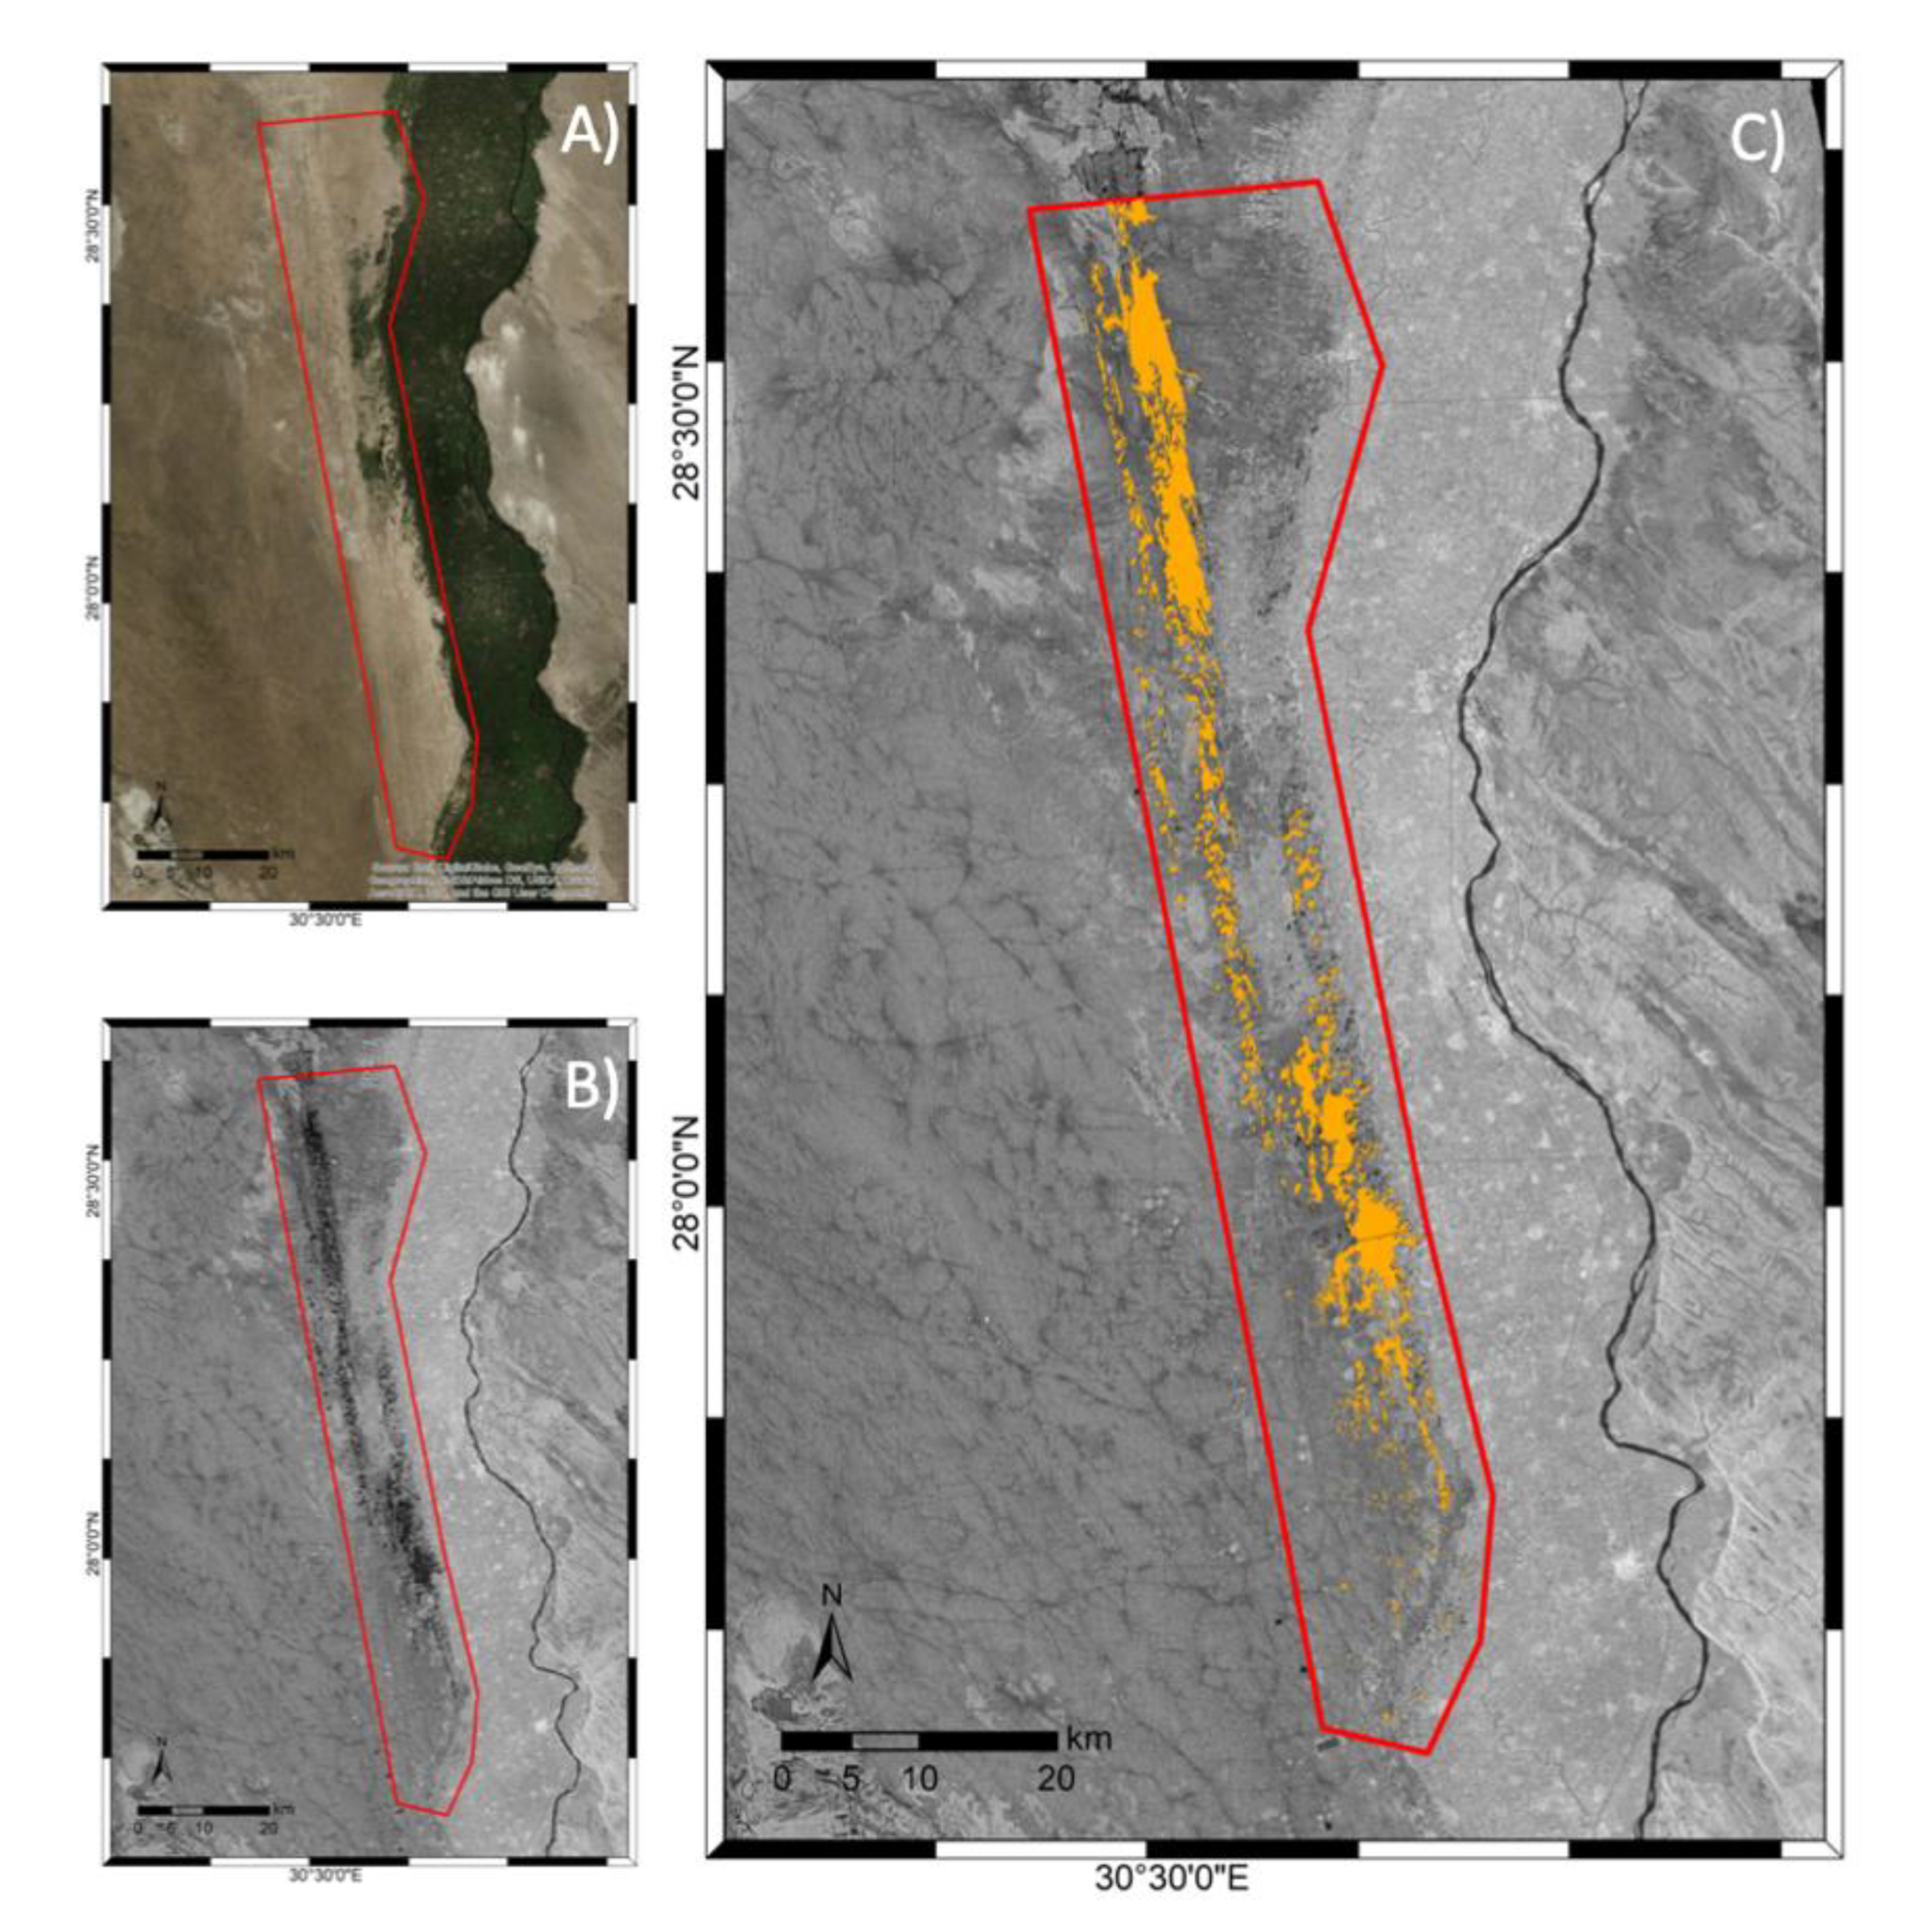
We also applied our methodology to the SRDF dataset. A general overview of the results obtained in the dune detection step is illustrated in Figure 13C, and Figure 13A shows the Google Earth overview of the SRDF (within the red polygon). Figure 13B illustrates how dunes can be easily identified using SAR data, compared to optical data (Figure 13A), as they appear darker than their surroundings, as explained in the introduction section.
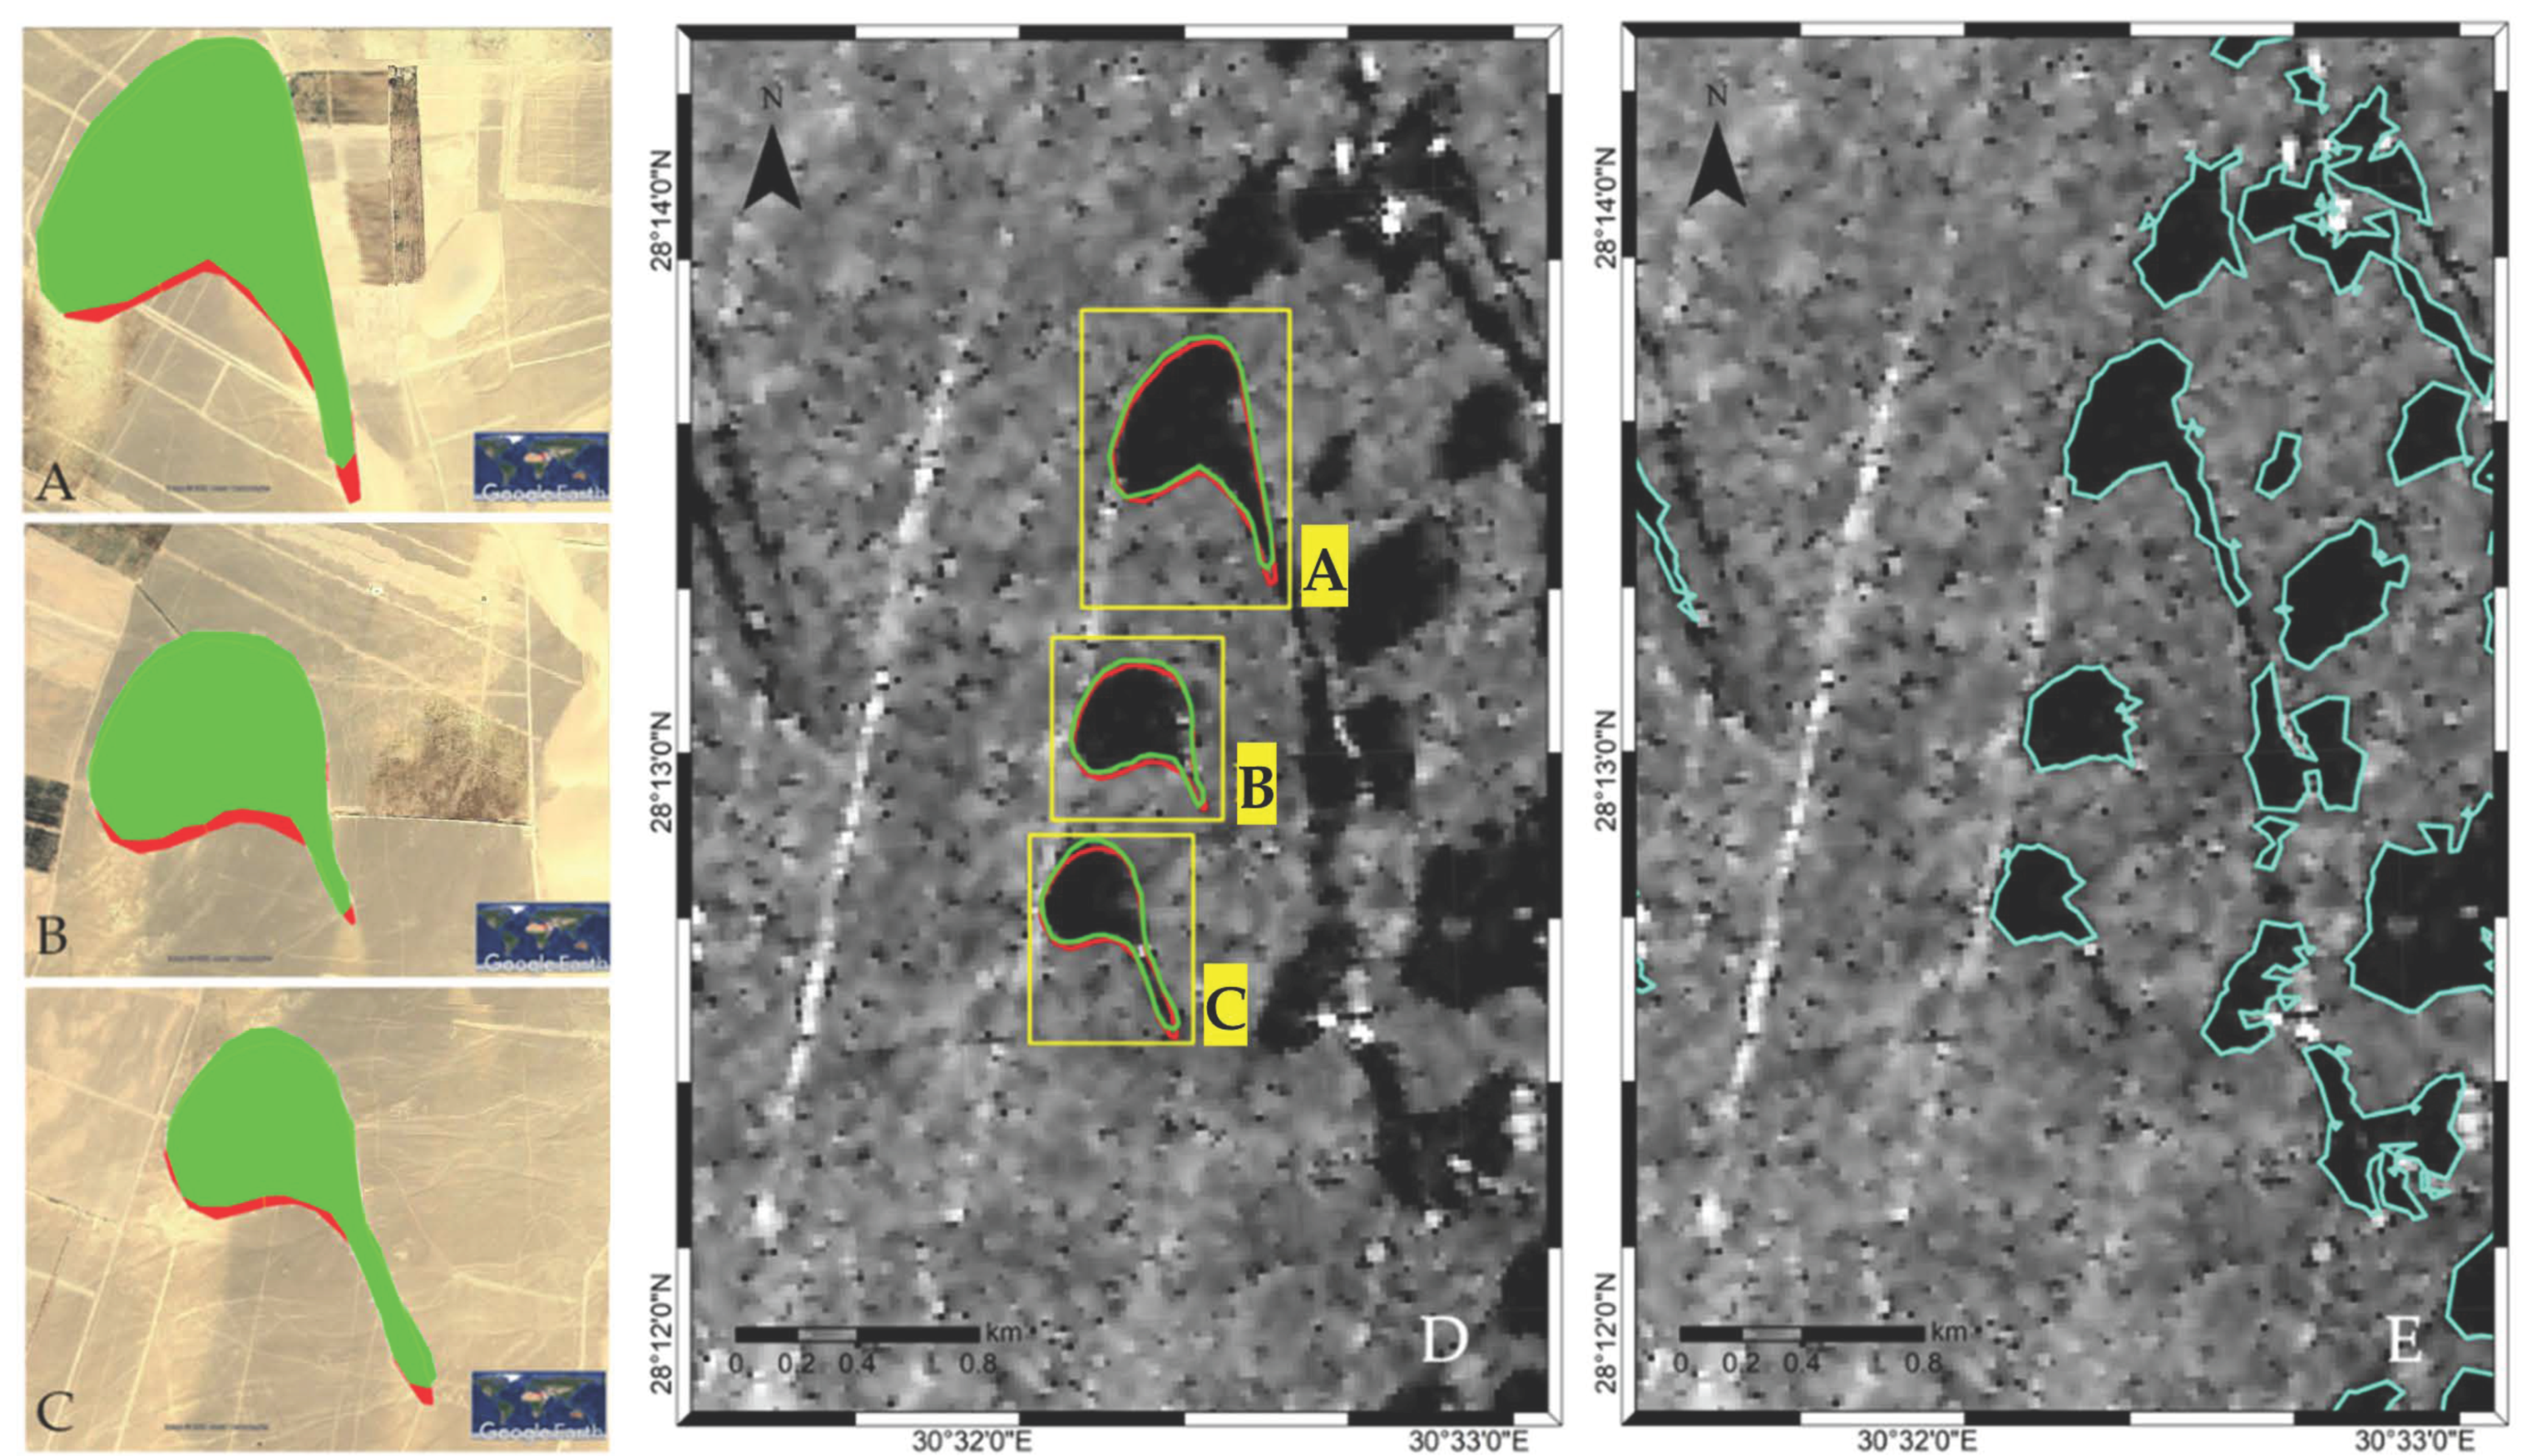
Furthermore, we delineated three dunes using Google Earth, selecting the ones which were specially monitored and validated with GPS and VHR optical data in [43]. These three manually delineated dunes in the South Rayan dune field are illustrated in Figure 14 and their values obtained are shown in Table 5. Table 6 reports the information over the same three dunes observed in [43].
Applying our automatic method, we have detected a total amount of sand bodies reported in Table 7. Again, the biggest differences among the detected sand bodies with overlap corresponded to images acquired with different sensors, and not always to the same exact geographical extent.
According to [43], the average velocity of the dune movement for the SRDF is expected to be around 2–6 m/yr. Similar values were found for some of the analyzed periods reported in Table 7. These values can be affected by the merging or splitting of several dunes [56]. This was observed when smaller dunes moving faster reached larger dunes moving at a slower pace [56]. Additionally, dunes in the SRDF could have been affected by new fields that had appeared in the proximities of the dune field, even surrounding dunes, in the Western Desert.
In Table 6, information extracted from [43] on the dunes A, B and C are reported and it is possible to appreciate that both velocity and area are consistent with the dunes extracted from Google Earth.
Figure 14 shows the dunes manually delineated using Google Earth from 2007 and 2010, in green and red, respectively. In the middle image (D), we show the delineated dunes over the Envisat ASAR data acquired on 2010/08/24, highlighting the high consistency between the outline polygons of the dunes on the left (A, B and C) and the black dunes in the SAR image. In the right-hand diagram (E), the Envisat image is overlapped with the outline of the dunes detected using our automatic method. We can observe some differences in the detected shapes in D and E, and this will be discussed in Section 5.
From Figure 14E, we can see that detected dunes do not exactly match the delineated ones; some dunes do not appear totally black in the SAR images, as they have white pixels due to a high backscatter produced over the sharp edges created with the help of the topography (average slope of 50 m/km). These bright spots on the dunes were not encountered in the uniform and regular barchan shapes on the WSM dune field (see Figure 11).
In Table 7, the average values for distance, velocity and direction obtained for isolated dunes are reported after applying the area consistency criterion. For the periods from 2000 to 2004 and from 2014 to 2019, values are higher than in the other periods observed. In the South Rayan dune field, dunes move slower, and in some cases, the movement observed is near the limit of the technique sensitivity. A good area detection becomes critical when the expected movement is only 1 or 2 pixels (with 20m pixel spacing). In this case, the topography influences the dune morphology, creating sharp edges on dunes. These sharp edges appear as white pixels in the SAR image, and since they are not detected as dunes, they affect the dune area measured and finally its movement. However, long-term migration is well detected, both in speed and direction.
Additionally, in Table 7, we analyzed the dune migration within consecutive observations, as well as the observations with more time difference for both sensor changes, i.e., ERS2-Envisat (2000–2010) and ERS2-S1 (2000–2019). It is also important to highlight that different sensor data had different extents, for which the maximum spatial overlap is obtained within the same sensor, i.e., Envisat-Envisat (2004–2010) and S1-S1 (2014–2019) where we detected a higher number of individual smaller dunes.
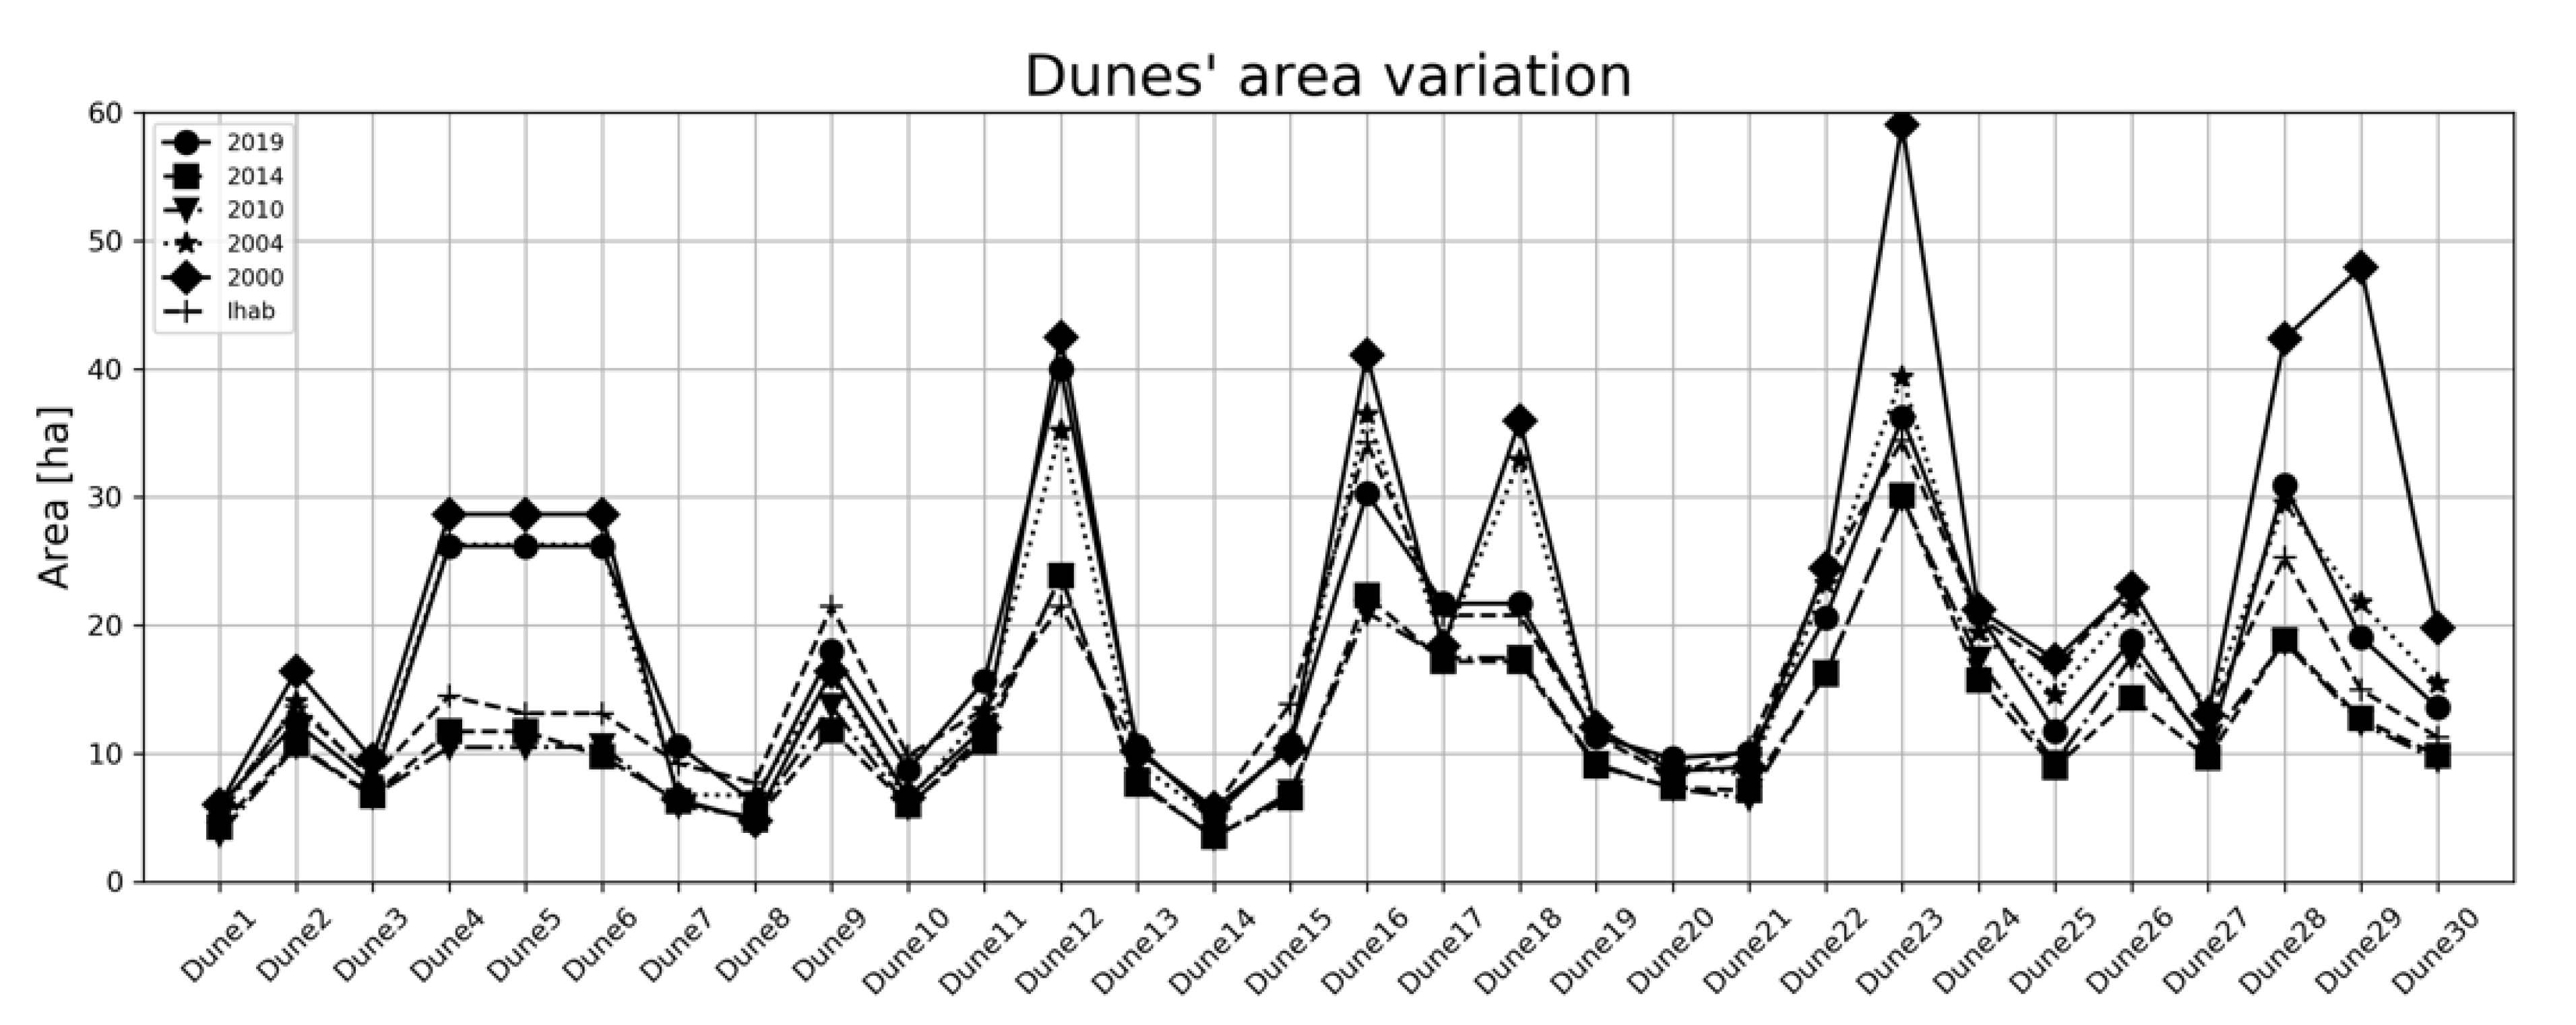
For the dunes remaining after applying the area consistency criterion, in order to further validate our results, we compared our dune map with the data from [43], obtaining 30 overlapping dunes. From these 30 dunes, we analyzed the variation in their area detection for the different dates, obtaining the results illustrated in Figure 15. From this figure, we can identify 8 dunes for which there are area differences at least in 2000 and 2019 compared to the other years observed. This means that on 22 of the 30 total intersected dunes, our method is in total agreement with the results from [43] regarding the dune areas, while in 8 dunes, something could have happened for those specific time periods.
Finally, our method provided dune migration information also for the dunes A, B and C, whose values are reported in Table 8. These values are not totally consistent with those found in the literature, probably due to the detected dune area being 85%, 80% and 65% of the area detected in the SAR images for dunes A, B and C, respectively. This underestimation of the dune area directly affects their centroid coordinates and hence the distance and velocity. Despite this, the values obtained are still in the range of the expected dune migration and close to the ground-truth values.
5. Discussion
The total number of detected sand bodies reported in Table 3 and Table 7 showed high variability among the different periods. One of the possible causes for this could be explained by the differences in area detected which are minimized after applying the proposed criterion.
An intrinsic characteristic of free dunes belonging to the same dune field is that the distance that the dunes rove has an inverse relationship with their size, i.e., small dunes move for longer and are faster than bigger ones (see Figure 16), with the characteristic of keeping their shape invariant in the event of barchans in equilibrium [36]. Dunes can fuse when smaller and faster dunes reach bigger and slower ones, and this fusion can be temporary or permanent [56].
Figure 16 illustrates the curve fitting of the aforementioned characteristic (the distance that the dunes rove has an inverse relationship with their size) of our manually delineated dunes on the WSM site (in blue) and the dunes from SRDF delineated in [43] (in orange), and clearly shows the differences in area and migration rate of the dunes of both analyzed sites.
Small dunes rove faster than larger dunes, as illustrated in Figure 16. This may produce their non-intersection between two time periods, which excluded them from our analysis due to the non-intersection condition. In order to provide dune migration information, our method needs each dune shape to intersect in space for the analyzed time periods. Nowadays, and due to the revisit times of the new satellite constellations such as Sentinel-1, we could also analyze faster dunes, just by decreasing the time interval between images. Barchan dunes located in the almost flat WSM area have a more regular shape, helping the proper detection of the dune area. Additionally, the average velocity measured on the intersected dunes is over 18 m/yr, and almost as fast as the barchan dunes in Chad, considered some of the fastest dunes on Earth, moving at an average velocity of about 20 m/yr [57]. Additionally, we measured an average ratio of the dune migration rates (automatically computed versus ground truth) of 0.96, being very consistent with the estimated migration rates. Moreover, we also computed the differences in the dune area measured, which varied from 11% to 36% of area difference compared to the ground truth, being more critical for smaller dunes. This is directly linked to the spatial resolution of the data employed. However, this misdetection of the dune area seems systematic and is located on the dune edges, where thinner sand layers are located, allowing us to compute reliable migration rates despite the dune area difference.
We also computed the dune migration information for the different periods analyzed for the intersecting dunes in the SRDF dune field, obtaining an average movement of 4–5 m/yr in the SSE direction in agreement with [43], which reported an average migration rate of 4.4 m/yr also in the SSE direction. Additionally, we observed that the dune area on the SRDF site is slightly underestimated, probably due to the bright pixels that appear, preventing better detection (see Figure 1). However, long-term migration information is properly detected.
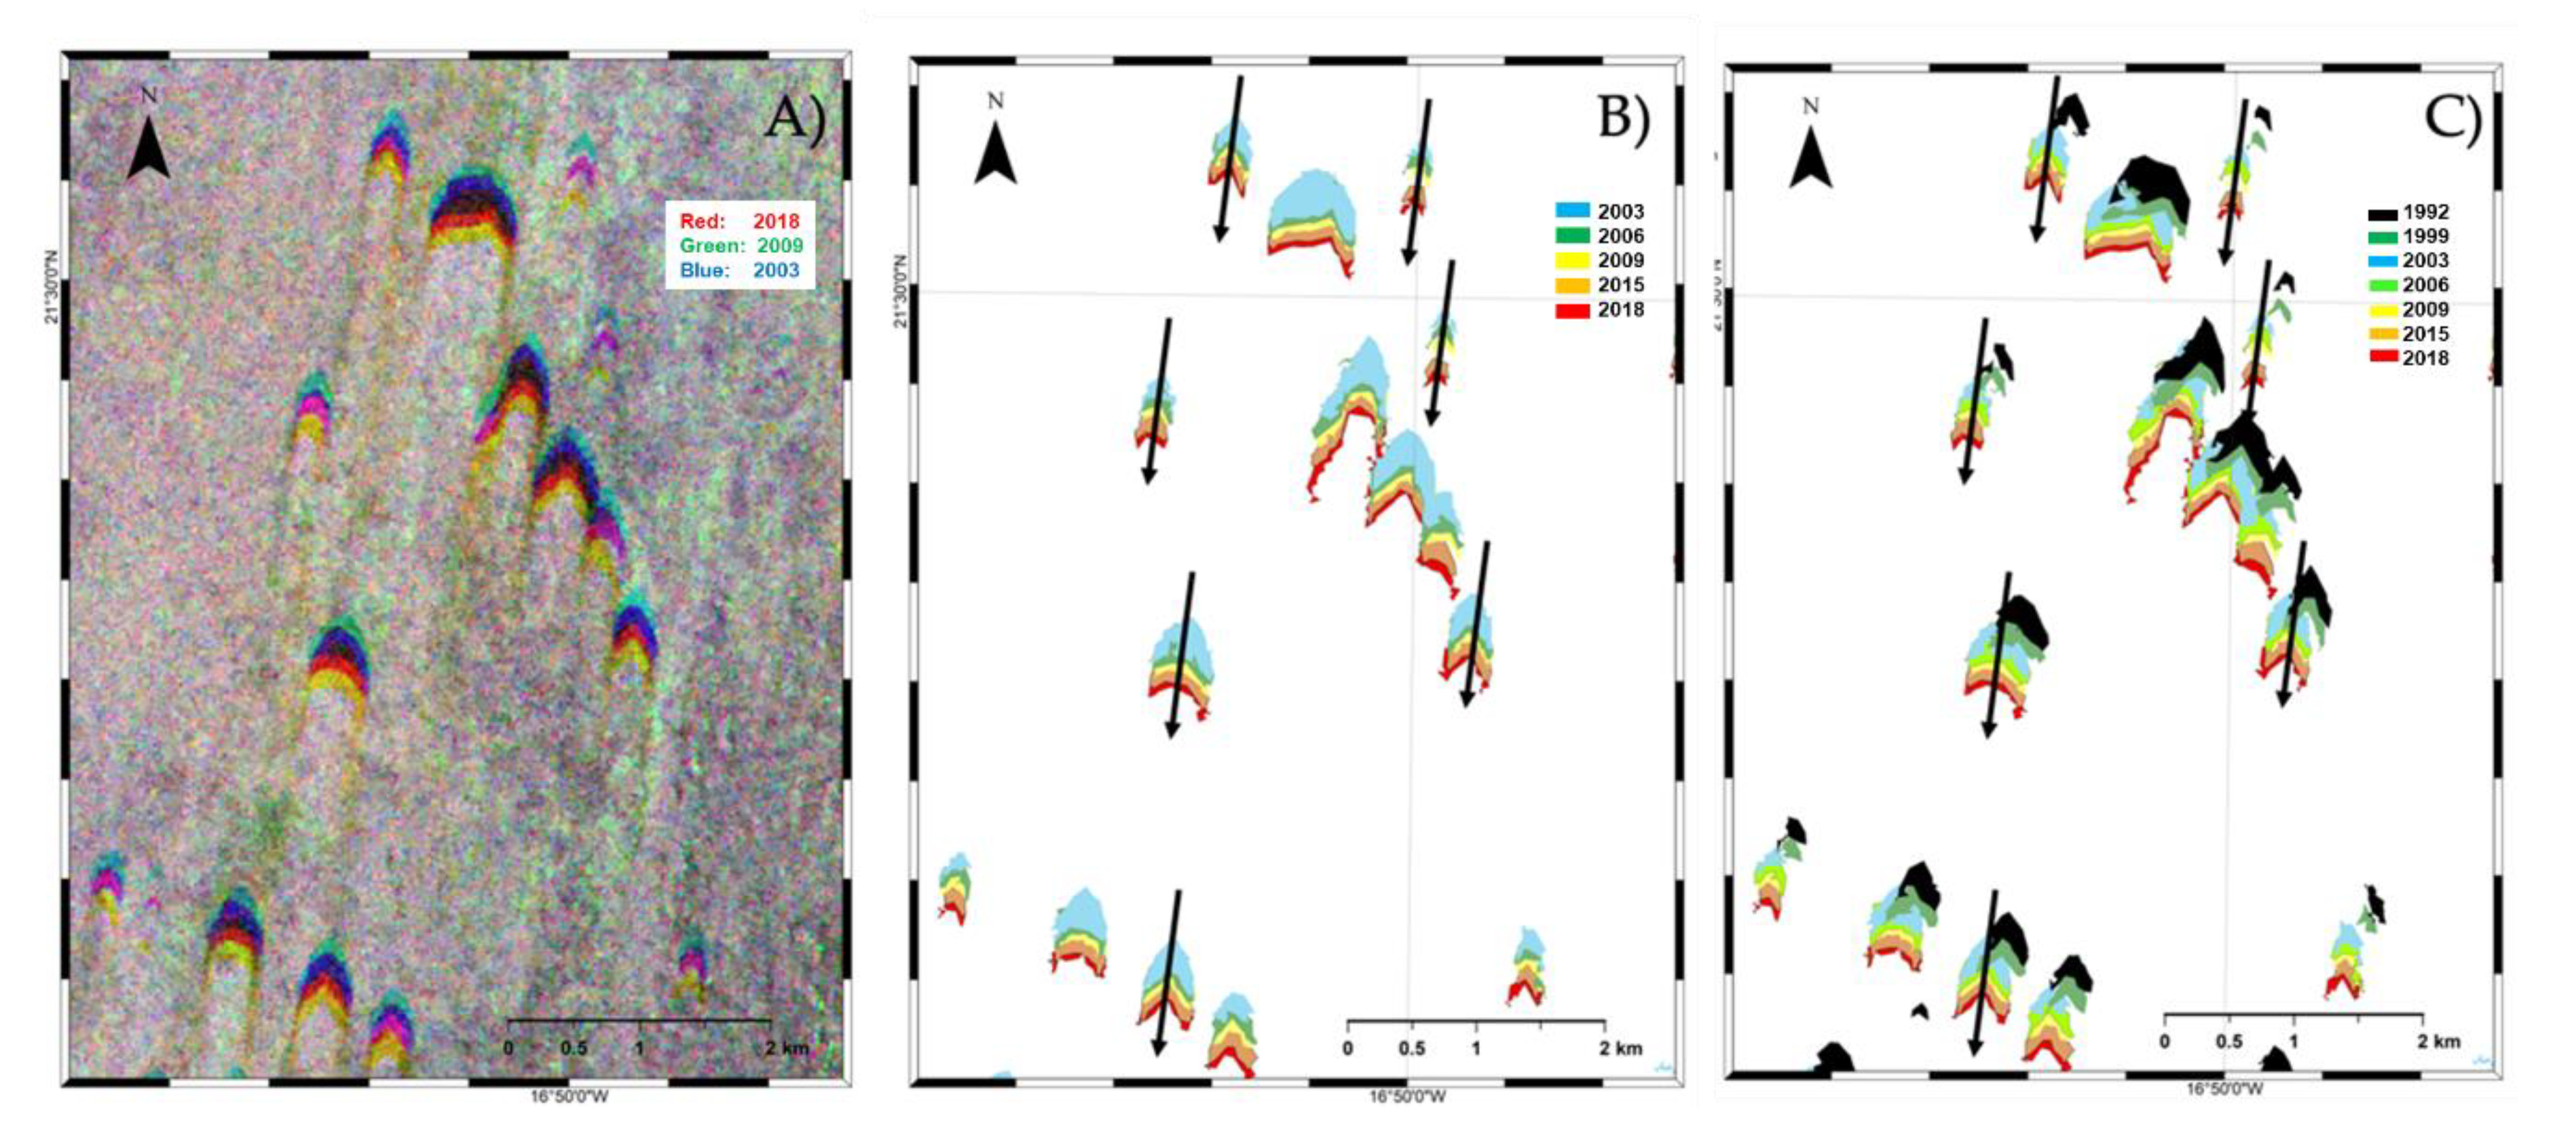
We also noticed a misalignment of the ERS-2 SAR data compared to the Envisat ASAR and Sentinel-1 dataset. This is visible when computing the dunes’ displacement direction for the period 1999 to 2003 in Figure 12B and Figure 17C. This shift, we found, could not be avoided and could be attributed to the precision of the orbital information available and employed during the pre-processing of the ERS-2 data. We can observe this shift when comparing multi-sensor data, but it does not appear when considering the analysis of the results obtained from each sensor independently. Moreover, this was only found for the historical ERS-2 data, and not for the other datasets employed.
Hence, despite the fact that dunes may appear slightly smaller in SAR images compared to optical images, we have demonstrated that SAR data can be used to analyze dune dynamics at the dune field scale, as shown in the consistency of the dune migration rates between our results and the ground-truth data.
5.1. Overall Comments for the Proper Exploitation of the Proposed Approach
For all the sandy areas detected, we discarded larger volumes of sand corresponding to dune groups in our analysis, analyzing only individual dunes for which the detected area has varied less than 20%. By doing this, additional dunes are discarded, for example, when such dunes join and separate from other dunes through the analyzed period.
Considerations identified for a proper usage of our approach can be grouped into two categories: (i) dune detection; and (ii) dune migration analysis. For the former, obtaining an accurate detection is linked directly to the spatial resolution of the employed sensor and to bright pixels that sometimes appear on dunes, while for the latter, dune migration information can only be provided for isolated dunes that have spatial overlap on the analyzed images.
To maximize the number of dunes with overlap, it is suggested that the number of images to be processed is increased, thus reducing the time interval between two consecutive ones, in order to ensure a geographical overlap of the moving dunes. This can be foreseen by knowing the wind speed of the area of interest and by selecting the proper dataset with spatial-temporal resolution to ensure the success of the method presented here.
As seen in the case of the South Rayan dune field, dunes located there are more likely to show SAR bright pixels on their large tail, which our approach sometimes cuts off from the dune, affecting their detected area, and hence their movement. However, this has not been found in dunes located in the West Sahara-Mauritania dune field.
It is important to note that on the SRDF site, for some cases we have tried to measure movements near the limit of the detection error, as one pixel counts for 20 m, and this is, on average, the distance an average dune in that field will move in four4 years, at the speed of 5 m/yr. Hence, we obtained better results for longer periods (i.e., 2000 to 2019 or 2004 to 2014).
Moreover, special attention must be paid to the proper geolocation of the satellite data, to avoid misalignments among data coming from different sensors, as is the case for the older dataset employed, i.e., ERS-2 SAR, and as we have shown happens on the WSM test site, but not on the SRDF. Note that this misalignment does not happen with the newer satellite data, as seen with Envisat and Sentinel-1.
Despite our both dune fields moving mainly in the N-S direction, we consider that our method should work as well in dune fields where the main direction is E-W as there is no constraint in our method that limits the migration direction.
Anywhere where no criterion is applied based on dune area consistency (area loss < 0.2), individual dune migration information might be perturbed.
Future research directions will lead to an enhancement of the method we propose to enable dune matching even for dunes that do not overlap using computer vision algorithms and analyzing dunes in both ascending and descending orbits when possible.
5.2. Implications for Other Domains
Climate change studies point towards the increase in wind speed on Earth, which will directly affect the dune dynamics of entire dune fields. Our automatic approach could be used to measure such wind variations of dune fields from all the world, providing results more rapidly and in a systematic manner. This systematic and global monitoring is not possible using other non-automatic techniques, such as traditional field campaigns or using optical data, the limitations of which were already mentioned in the introduction section.
Deriving the dune migration information from multiple dates, and obtaining the dune speed and movement direction could help to derive wind parameters, such as average direction, speed or the possible variations of them over time. This could help us to understand whether these conditions have changed over time during the analyzed periods.
Moreover, extra-planetary research, as already mentioned in the introduction section, has observed dunes on Mars and Titan. Hence, applying the proposed approach when sufficient data is available could help measure wind speeds on their surface. These wind speeds could become crucial pieces of information for the planning of space exploration missions, especially for those planning to land on them.
6. Conclusions
We have developed a totally automatic approach to measure dune dynamics, and have applied it to different test sites where barchan dunes move freely, but at different speeds and in different directions, showing the robustness of our method.
We have demonstrated the possibility of extending the applicability of techniques that were originally developed for other purposes, such as flood mapping, to dune dynamic analysis, due to the similar behavior of dunes and water to the SAR co-polarized signal, and hence we have also demonstrated the usability of SAR data for dune migration analysis at scale.
The proposed methodology has been demonstrated to work on isolated barchan dunes and provides dune migration information about dunes with an overlap between images. This methodology can be exported to other barchan dune fields. Additionally, as a future work, the applicability of this method to other dune types could be explored.
We have measured, for our analyzed time period, dune migration rates of 11–20 m/yr moving in a south–south westerly direction for the West Sahara/Mauritania study area and 2–6 m/yr moving in a south-easterly direction for the South Rayan dune field, being very consistent with the available ground truth being 13–28 m/yr and 3–5 m/yr respectively.
Author Contributions
Conceptualization, G.V.; J.M.D.B; and R.F.H.; methodology, J.M.D.B.; M.C. and G.V.; software, J.M.D.B. and M.C.; formal analysis and investigation, J.M.D.B., G.V.; writing—original draft J.M.D.B.; writing—review and editing, all authors; visualization J.M.D.B. All authors have read and agreed to the published version of the manuscript.
Funding
This research falls within the framework of the APLADYN project funded by the STEREO II-program of the Belgian Science Policy-project SR/00/132. The authors acknowledge the use of ERS SAR and Envisat ASAR imagery provided by ESA under the CAT-1 C1P.8230. This study contains modified Copernicus Sentinel data [2014, 2018]. Marco Chini’s work was funded by the National Research Fund of Luxembourg (FNR) through the MOSQUITO project, grant number C15/SR/10380137.
Acknowledgments
The authors want to acknowledge all the comments received that helped to improve the paper, especially from Antonio M. Ruiz-Armenteros, Lorenzo Ianinni and all the reviewers. Special thanks to Ihab L. Mohamed for providing us with his full research data employed in the validation of the South Rayan dune site.
Conflicts of Interest
The authors declare no conflict of interest.
References
- Lorenz, R.D.; Gasmi, N.; Radebaugh, J.; Barnes, J.W.; Ori, G.G. Dunes on planet Tatooine: Observation of barchan migration at the Star Wars film set in Tunisia. Geomorphology 2013, 201, 264–271. [Google Scholar] [CrossRef] [Green Version]
- Verstraeten, G.; Mohamed, I.; Willems, H.; De Laet, V.; Delgado Blasco, J.M. Analysis of Aeolian-Fluvial-Human Interactions in the Nile Valley (Central Egypt) by Combining Field-Based Geomorphology with Remote Sensing. In Proceedings of the 34th EARSeL Symposium: European Remote Sensing--New Opportunities for Science and Practice, Warsaw, Poland, 16–20 June 2014; Abstract and Programme Book. Volume 34, p. 55. [Google Scholar]
- Verstraeten, G.; Mohamed, I.; Notebaert, B.; Willems, H. The dynamic nature of the transition from the Nile floodplain to the desert in central Egypt since the Mid-Holocene. Mainz Hist. Cult. Sci. 2017, 36, 239. [Google Scholar]
- Mohamed, I.N.L.; Verstraeten, G. Analyzing dune dynamics at the dune-field scale based on multi-temporal analysis of Landsat-TM images. Remote Sens. Environ. 2012, 119, 105–117. [Google Scholar] [CrossRef]
- Barnes, J. Barchan dunes on the Kuiseb River delta, Namibia. South Afr. Geogr. J. 2001, 83, 283–292. [Google Scholar] [CrossRef]
- Al-Harthi, A. Geohazard assessment of sand dunes between Jeddah and Al-Lith, western Saudi Arabia. Environ. Geol. 2002, 42, 360–369. [Google Scholar] [CrossRef]
- Käyhkö, J. Aeolian blowout dynamics in subarctic Lapland based on decadal levelling investigations. Geogr. Ann. Ser. A Phys. Geogr. 2007, 89, 65–81. [Google Scholar] [CrossRef]
- Santalla, I.R.; Garcia, M.J.S.; Montes, I.M.; Ortiz, D.G.; Crespo, T.M.; Raventos, J.S. Internal structure of the aeolian sand dunes of El Fangar spit, Ebro Delta (Tarragona, Spain). Geomorphology 2009, 104, 238–252. [Google Scholar] [CrossRef]
- Kostaschuk, R.; Best, J. Response of sand dunes to variations in tidal flow: Fraser Estuary, Canada. J. Geophys. Res. Earth Surf. 2005, 110. [Google Scholar] [CrossRef] [Green Version]
- Baptista, P.; Bastos, L.; Bernardes, C.; Cunha, T.; Dias, J. Monitoring sandy shores morphologies by DGPS-a practical tool to generate digital elevation models. J. Coast. Res. 2008, 1516–1528. [Google Scholar] [CrossRef]
- Pardo-Pascual, J.E.; García-Asenjo, L.; Palomar-Vázquez, J.; Garrigues-Talens, P. New methods and tools to analyze beach-dune system evolution using a Real-Time Kinematic Global Positioning System and Geographic Information Systems. J. Coast. Res. 2005, 34–39. [Google Scholar]
- Mitasova, H.; Overton, M.; Harmon, R.S. Geospatial analysis of a coastal sand dune field evolution: Jockey’s Ridge, North Carolina. Geomorphology 2005, 72, 204–221. [Google Scholar] [CrossRef]
- Arteaga, C.; de Sanjose, J.; Serrano, E. Terrestrial photogrammetric techniques applied to the control of a parabolic dune in the Liencres dune system, Cantabria (Spain). Earth Surf. Process. Landf. 2008, 33, 2201–2210. [Google Scholar] [CrossRef]
- Łabuz, T.A. A review of field methods to survey coastal dunes—Experience based on research from South Baltic coast. J. Coast. Conserv. 2016, 20, 175–190. [Google Scholar] [CrossRef] [Green Version]
- Buynevich, I.V.; Bitinas, A.; Souza-Filho, P.W.M.; Pupienis, D.; Asp, N.E.; Goble, R.J.; Kerber, L.E. Rapid coastal dune migration into temperate and equatorial forests: Optical chronology of imaged upper slipface strata. J. Coast. Res. 2011, 726–730. [Google Scholar]
- European Space Agency. Some Commonly Used EO Satellite Systems. Available online: https://business.esa.int/newcomers-earth-observation-guide#ref_3.3 (accessed on 12 January 2020).
- Luke, J.; King, D.T. Automated Object-Based Identification of Dunes at Hargraves Crater, Mars. In Proceedings of the 50th Lunar and Planetary Science Conference, The Woodlands, TX, USA, 18–22 March 2019; pp. 2–3. [Google Scholar] [CrossRef]
- Radebaugh, J.; Lorenz, R.; Farr, T.; Paillou, P.; Savage, C.; Spencer, C. Linear dunes on Titan and earth: Initial remote sensing comparisons. Geomorphology 2010, 121, 122–132. [Google Scholar] [CrossRef]
- Paillou, P.; Bernard, D.; Radebaugh, J.; Lorenz, R.; Le Gall, A.; Farr, T. Modeling the SAR backscatter of linear dunes on Earth and Titan. Icarus 2014, 230, 208–214. [Google Scholar] [CrossRef]
- Le Gall, A.; Hayes, A.G.; Ewing, R.; Janssen, M.A.; Radebaugh, J.; Savage, C.; Encrenaz, P. Latitudinal and altitudinal controls of Titan’s dune field morphometry. Icarus 2012, 217, 231–242. [Google Scholar] [CrossRef]
- Lopes, R.M.C.; Stofan, E.R.; Peckyno, R.; Radebaugh, J.; Mitchell, K.L.; Mitri, G.; Wood, C.A.; Kirk, R.L.; Wall, S.D.; Lunine, J.I.; et al. Distribution and interplay of geologic processes on Titan from Cassini radar data. Icarus 2010, 205, 540–558. [Google Scholar] [CrossRef]
- Radebaugh, J.; Lorenz, R.D.; Lunine, J.I.; Wall, S.D.; Boubin, G.; Reffet, E.; Kirk, R.L.; Lopes, R.M.; Stofan, E.R.; Soderblom, L.; et al. Dunes on Titan observed by Cassini Radar. Icarus 2008, 194, 690–703. [Google Scholar] [CrossRef]
- Paillou, P.; Seignovert, B.; Radebaugh, J.; Wall, S. Radar scattering of linear dunes and mega-yardangs: Application to Titan. Icarus 2016. [Google Scholar] [CrossRef] [Green Version]
- Hugenholtz, C.H.; Levin, N.; Barchyn, T.E.; Baddock, M.C. Remote sensing and spatial analysis of aeolian sand dunes: A review and outlook. Earth Sci. Rev. 2012, 111, 319–334. [Google Scholar] [CrossRef]
- Ghadiry, M.; Koch, B. Developing a Monitoring System for Sand Dunes Migration in Dakhla Oasis, Western Desert, Egypt. In Proceedings of the 30th EARSeL Symposium on Remote Sensing for Science, Education and Culture, Paris, France, 31 May–4 June 2010. [Google Scholar]
- Hermas, E.; Leprince, S.; Abou El-Magd, I. Retrieving sand dune movements using sub-pixel correlation of multi-temporal optical remote sensing imagery, northwest Sinai Peninsula, Egypt. Remote Sens. Environ. 2012, 121, 51–60. [Google Scholar] [CrossRef]
- Qong, M. Sand Dune Attributes Estimated from SAR Images. Remote Sens. Environ. 2000, 74, 217–228. [Google Scholar] [CrossRef]
- Blumberg, D. Analysis of large aeolian (wind-blown) bedforms using the Shuttle Radar Topography Mission (SRTM) digital elevation data. Remote Sens. Environ. 2006, 100, 179–189. [Google Scholar] [CrossRef]
- Blumberg, D.G. Remote sensing of desert dune forms by polarimetric synthetic aperture radar (SAR). Remote Sens. Environ. 1998, 65, 204–216. [Google Scholar] [CrossRef]
- Gouinaud, C.; Doutoum, A.I.; Gouinaud, P.; Traore, M.K. SAR image automated detection of dune area. In Proceedings of the IEEE International Geoscience and Remote Sensing Symposium (IGARSS 2013), Melbourne, VIC, Australia, 21–26 July 2013; pp. 1489–1492. [Google Scholar]
- Havivi, S.; Amir, D.; Schvartzman, I.; August, Y.; Maman, S.; Rotman, S.R.; Blumberg, D.G. Mapping dune dynamics by InSAR coherence. Earth Surf. Process. Landf. 2018, 43, 1229–1240. [Google Scholar] [CrossRef]
- Song, Y.; Chen, C.; Xu, W.; Zheng, H.; Bao, A.; Lei, J.; Luo, G.; Chen, X.; Zhang, R.; Tan, Z. Mapping the temporal and spatial changes in crescent dunes using an interferometric synthetic aperture radar temporal decorrelation model. Aeolian Res. 2020, 46, 100616. [Google Scholar] [CrossRef]
- Nashashibi, A.Y.; Sarabandi, K.; Al-zaid, F.A.; Alhumaidi, S. Characterization of Radar Backscatter Response of Sand-Covered Surfaces at Millimeter-Wave Frequencies. IEEE Trans. Geosci. Remote Sens. 2012, 50, 2345–2354. [Google Scholar] [CrossRef]
- Lancaster, N. Dune morphology and dynamics. In Geomorphology of Desert Environments; Springer: Dordrecht, The Netherlands, 1994; pp. 474–505. [Google Scholar]
- Tsoar, H. Types of aeolian sand dunes and their formation. Geomorphol. Fluid Mech. 2007, 403–429. [Google Scholar] [CrossRef]
- Wippermann, F.K.; Gross, G. The wind-induced shaping and migration of an isolated dune: A numerical experiment. Bound. Layer Meteorol. 1986, 36, 319–334. [Google Scholar] [CrossRef]
- Wikipedia Illustration of Barchan Dune. Available online: https://en.wikipedia.org/wiki/Barchan (accessed on 10 January 2019).
- Livingstone, I.; Wiggs, G.F.S.; Weaver, C.M. Geomorphology of desert sand dunes: A review of recent progress. Earth Sci. Rev. 2007, 80, 239–257. [Google Scholar] [CrossRef]
- Weather Online Wind Speed Forecasts. Available online: Weattheronline.co.uk (accessed on 1 May 2019).
- USGS, U.S. Geological Survey (2019l): USGS EROS Archive—Digital Elevation—Shuttle Radar Topography Mission (SRTM) 1 Arc-Second Global. Available online: https://www.usgs.gov/centers/eros/science/usgs-eros-archive-digital-elevation-shuttle-radar-topography-mission-srtm-1-arc?qt-science_center_objects=0#qt-science_center_objects (accessed on 6 December 2020). [CrossRef]
- Ould Ahmedou, D.; Ould Mahfoudh, A.; Dupont, P.; Ould El Moctar, A.; Valance, A.; Rasmussen, K.R. Barchan dune mobility in Mauritania related to dune and interdune sand fluxes. J. Geophys. Res. Earth Surf. 2007, 112, 1–18. [Google Scholar] [CrossRef]
- Said, R. The Geological Evolution of the River Nile; Springer Science & Business Media: New York, NY, USA; Berlin, Germany, 2012. [Google Scholar]
- Mohamed, I.N.L. Evolution of South-Rayan Dune-Field (Central Egypt) and Its Interaction with the Nile Fluvial System. Ph.D. Thesis, KU Leuven, Leuven, Belgium, 2012. Unpublished. [Google Scholar]
- Parteli, E.J.R.; Durán, O.; Bourke, M.C.; Tsoar, H.; Pöschel, T.; Herrmann, H. Origins of barchan dune asymmetry: Insights from numerical simulations. Aeolian Res. 2014, 12, 121–133. [Google Scholar] [CrossRef] [Green Version]
- Veci, L.; Lu, J.; Prats-Iraola, P.; Scheiber, R.; Collard, F.; Fomferra, N.; Engdahl, M. The Sentinel-1 Toolbox. In Proceedings of the IEEE International Geoscience and Remote Sensing Symposium (IGARSS), Quebec City, QC, Canada, 13–18 July 2014; pp. 1–3. [Google Scholar]
- Rosin, P. Thresholding for change detection. In Proceedings of the Sixth International Conference on Computer Vision (IEEE Cat. No. 98CH36271), Bombay, India, 7 January 1998; pp. 274–279. [Google Scholar]
- Bruzzone, L.; Prieto, D.F. An adaptive semiparametric and context-based approach to unsupervised change detection in multitemporal remote-sensing images. IEEE Trans. Image Process. 2002, 11, 452–466. [Google Scholar] [CrossRef]
- Chini, M.; Hostache, R.; Giustarini, L.; Matgen, P. A hierarchical split-based approach for parametric thresholding of SAR images: Flood inundation as a test case. IEEE Trans. Geosci. Remote Sens. 2017, 55, 6975–6988. [Google Scholar] [CrossRef]
- Chini, M.; Pelich, R.; Hostache, R.; Matgen, P.; Lopez-Martinez, C. Towards a 20 m global building map from sentinel-1 sar data. Remote Sens. 2018, 10, 1833. [Google Scholar] [CrossRef] [Green Version]
- Bignami, C.; Chini, M.; Amici, S.; Trasatti, E. Synergic Use of Multi-Sensor Satellite Data for Volcanic Hazards Monitoring: The Fogo (Cape Verde) 2014–2015 Effusive Eruption. Front. Earth Sci. 2020. [Google Scholar] [CrossRef] [Green Version]
- Xie, H.; Pierce, L.E.; Ulaby, F.T. Statistical properties of logarithmically transformed speckle. IEEE Trans. Geosci. Remote Sens. 2002, 40, 721–727. [Google Scholar] [CrossRef]
- Marquardt, D.W. An algorithm for least-squares estimation of nonlinear parameters. J. Soc. Ind. Appl. Math. 1963, 11, 431–441. [Google Scholar] [CrossRef]
- Ashman, K.M.; Bird, C.M.; Zepf, S.E. Detecting bimodality in astronomical datasets. arXiv 1994, arXiv:astro-ph/9408030. [Google Scholar] [CrossRef] [Green Version]
- Giustarini, L.; Hostache, R.; Matgen, P.; Schumann, G.J.-P.; Bates, P.D.; Mason, D.C. A change detection approach to flood mapping in urban areas using TerraSAR-X. IEEE Trans. Geosci. Remote Sens. 2012, 51, 2417–2430. [Google Scholar] [CrossRef] [Green Version]
- Graser, A. Learning QGIS 2.0; Packt Publishing Ltd.: Birmingham, UK; Mumbai, India, 2013; Available online: https://31.204.128.218/download/1079/Learning%20QGIS%202.0%20-%20Anita%20Graser.pdf (accessed on 6 December 2020).
- Horvat, B. Barchan Dunes Seminar 2. Available online: http//www--f1.ijs.si/~rudi/sola/Sem4.pdf (accessed on 6 December 2020).
- Vermeesch, P.; Drake, N. Remotely sensed dune celerity and sand flux measurements of the world’s fastest barchans (Bodele, Chad). Geophys. Res. Lett. 2008, 35. [Google Scholar] [CrossRef] [Green Version]
Figure 1.
(A) Google Earth image over South Rayan dune field centered on latitude 28.51465, longitude 30.52506 in WGS84. (B) Sentinel-1 image over the same area showing a high backscatter, corner reflector-alike over a sand dune.
Figure 1.
(A) Google Earth image over South Rayan dune field centered on latitude 28.51465, longitude 30.52506 in WGS84. (B) Sentinel-1 image over the same area showing a high backscatter, corner reflector-alike over a sand dune.

Figure 2.
Barchan dune diagram, illustrating wind, dune movement, and slip face [37] (licensed CC BY-SA 3.0).
Figure 2.
Barchan dune diagram, illustrating wind, dune movement, and slip face [37] (licensed CC BY-SA 3.0).

Figure 3.
(A) Overview of the location of both areas of interest: (i) in Western Sahara and the Mauritania desert (B) and (ii) in the South Rayan dune field in Egypt (E). Barchan dunes viewed from optical (C,F) and SAR satellites (D,G) over the respective red rectangles from B and E.
Figure 3.
(A) Overview of the location of both areas of interest: (i) in Western Sahara and the Mauritania desert (B) and (ii) in the South Rayan dune field in Egypt (E). Barchan dunes viewed from optical (C,F) and SAR satellites (D,G) over the respective red rectangles from B and E.

Figure 4.
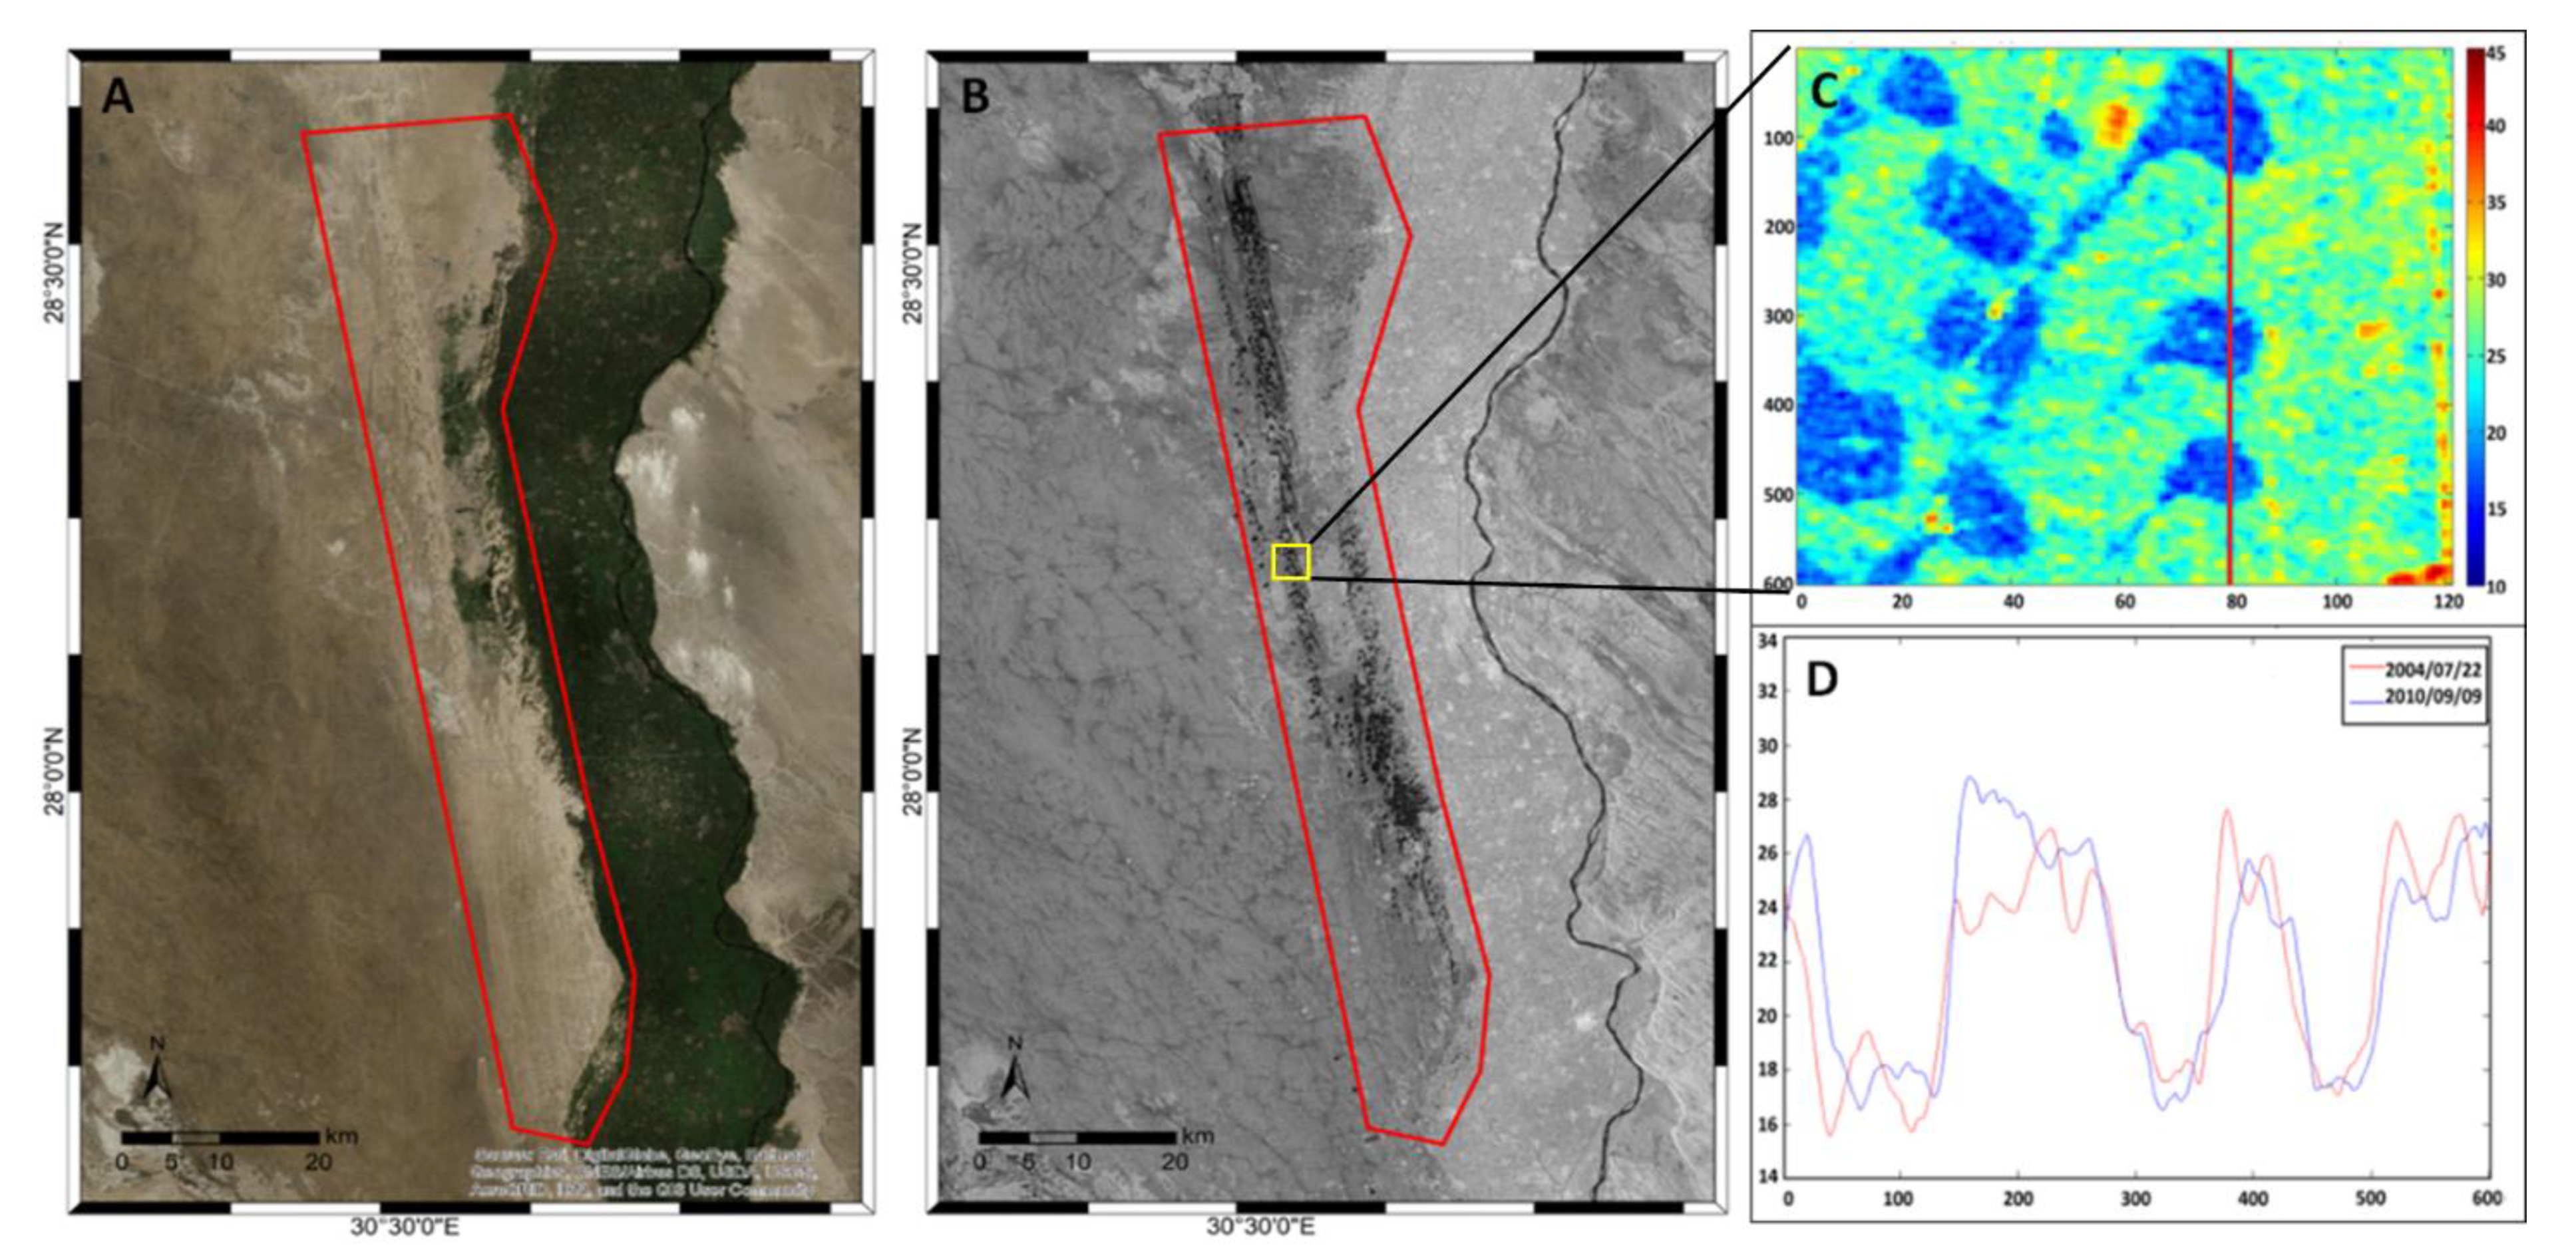
Optical (A) and SAR (B) view over the South Rayan dune field, delimited by the red polygon. Barchan dunes are the dark areas within the red line in (B). (C) shows the intensity of the SAR backscatter signal in decibels over the yellow rectangle in B in radar coordinates. (D) shows the profile of the vertical red line in Figure (C) for two different SAR data acquired on 2004/07/07 and 2010/09/09 depicting a very low intensity of signal over the barchan dunes.
Figure 4.
Optical (A) and SAR (B) view over the South Rayan dune field, delimited by the red polygon. Barchan dunes are the dark areas within the red line in (B). (C) shows the intensity of the SAR backscatter signal in decibels over the yellow rectangle in B in radar coordinates. (D) shows the profile of the vertical red line in Figure (C) for two different SAR data acquired on 2004/07/07 and 2010/09/09 depicting a very low intensity of signal over the barchan dunes.

Figure 5.
Overview of the methodological approach with the three steps discussed in the text.

Figure 6.
(A) Sentinel-1 image acquired over Egypt including the South Rayan dune field showing three levels of tiles similar to those employed in the HSBA. (B) Level 1 (full scene) backscatter histogram. (C) Sentinel-1 image zoomed over the Level 3 tile colored in red in (A), and (D) its corresponding histogram, highlighting the separability of the normal distributions of the dune backscatter (red Gaussian) in the lower part and the other Gaussian in black for the non-dune areas.

Figure 7.
Schematics of: (A) Detected dune, (B) Filled dune, (C) Polygonized dune and (D) dune movement computation based on centroid difference, resulting in the black arrow symbolizing the displacement vector.
Figure 7.
Schematics of: (A) Detected dune, (B) Filled dune, (C) Polygonized dune and (D) dune movement computation based on centroid difference, resulting in the black arrow symbolizing the displacement vector.

Figure 8.
Processing diagram defined using the QGIS processing modeler.

Figure 9.
Example of the merging and splitting phenomena that can occur in dune fields when smaller dunes reach larger dunes. Barchan dunes are characterized as conserving their shape while moving, as illustrated in the images available in Google Earth over the dunes located in the WSM site (i.e., 21.501 North, 16.726 West). Images sorted in acquisition time from left to right. (A) acquired on 25/10/2011; (B) on 18/02/2013; (C) on 20/07/2013; and (D) on 24/07/2016.

Figure 10.
West Sahara dunes detected for 2003. (A) Subset of the SAR image covering the dune field. (B) SAR image overlaid with the detected sand bodies in orange. (C) Zoom showing SAR image in the yellow rectangle in Figure (A) as a background overlaid with the contour of the dunes in orange.
Figure 10.
West Sahara dunes detected for 2003. (A) Subset of the SAR image covering the dune field. (B) SAR image overlaid with the detected sand bodies in orange. (C) Zoom showing SAR image in the yellow rectangle in Figure (A) as a background overlaid with the contour of the dunes in orange.

Figure 11.
Figure showing the delineated dunes in green for 2003 and red for 2013 in (A–G) (right), the Envisat SAR image for 2003 as the background, overlaid with the outline polygons of the manually delineated dunes within yellow rectangles.
Figure 11.
Figure showing the delineated dunes in green for 2003 and red for 2013 in (A–G) (right), the Envisat SAR image for 2003 as the background, overlaid with the outline polygons of the manually delineated dunes within yellow rectangles.

Figure 12.
Dune displacement directions for the different periods analyzed, indicating the number of dunes and the mean values of migration distance, migration rate and direction or heading. (A,C,E,F) show dunes displacement direction in SSW direction for the periods 1992–1999, 2003–2006, 2009–2015 and 2015–2018 respectively. (B) shows a dunes displacement direction in WSW for the inter-sensor period 1999–2003 and, (D) shows a main displacement direction ranging from SSW-SSE for the period 2006–2009.

Figure 13.
South Rayan Dune field view in optical (A), Envisat ASAR (B) and Envisat ASAR overlaid with the detected sand bodies (C).
Figure 13.
South Rayan Dune field view in optical (A), Envisat ASAR (B) and Envisat ASAR overlaid with the detected sand bodies (C).

Figure 14.
(A–C) shows the delineated dunes in green for 2007 and red for 2010. (D) (middle) shows the Envisat SAR image for 2010 as its background, overlaid with the outline polygons of the manually delineated dunes within the yellow rectangles. (E) (right) shows the Envisat SAR image for 2010 as its background, overlaid with the outline polygons of the detected dunes using the automatic approach.

Figure 15.
Dune area variation for the different years of the 30 dunes in common with [39].
Figure 15.
Dune area variation for the different years of the 30 dunes in common with [39].

Figure 16.
Curve dune area versus migration rate for the WSM and SRDF sites, including trend lines.

Figure 17.
(A) False RGB composition of SAR images acquired in 2018 (Red), 2009 (Green) and 2003 (Blue). (B) Polygons of the dunes detected for Envisat and Sentinel-1 data with movement direction indicated by black arrows. (C) Polygons of the dunes detected for all periods, including ERS-2 SAR, which appear misaligned for the years 1992 and 1999 (black and dark green polygons, respectively).


Table 1.
Satellite data, acquisition dates, orbit pass, relative orbit and mean incidence angle in decimal degrees.
Table 1.
Satellite data, acquisition dates, orbit pass, relative orbit and mean incidence angle in decimal degrees.
| Study Area | Satellite | Acquisition Date | Relative Orbit/Track | Orbit Path | Mean Incidence Angle (Degrees) |
|---|---|---|---|---|---|
| South Rayan (Egypt) | ERS-2 | 2000/09/05 | 207 | Descending | 23 |
| Envisat | 2004/07/06 2010/08/24 | 207 | Descending | 23 | |
| Sentinel-1 | 2014/10/14 2019/01/15 | 131 | Ascending | 33.4 | |
| West Sahara & Mauritania | ERS-2 | 1992/12/11 1999/09/20 | 309 | Descending | 22.8 |
| Envisat | 2003/07/27 2006/09/05 2009/02/17 | 309 | Descending | 22.8 | |
| Sentinel-1 | 2015/04/07 2018/02/26 | 60 | Ascending | 33.4 |
Table 2.
Dune migration information of the manually delineated dunes from the West Sahara-Mauritania dune field, obtained between 2003 and 2013, specifying distance, velocity, heading direction, mean area and area loss.
Table 2.
Dune migration information of the manually delineated dunes from the West Sahara-Mauritania dune field, obtained between 2003 and 2013, specifying distance, velocity, heading direction, mean area and area loss.
| Id. Dune | Migration Distance (m) | Migration Rate (m/yr) | Heading (Degrees) | Mean Dune Area (t1,t2) (ha) | Area Loss (%) |
|---|---|---|---|---|---|
| A | 142 | 13 | 190 | 22.90 | 5 |
| B | 305 | 28 | 190 | 2.42 | 5 |
| C | 213 | 19 | 190 | 5.27 | 14 |
| D | 152 | 14 | 189 | 16.35 | 3 |
| E | 152 | 14 | 189 | 14.53 | 9 |
| F | 162 | 15 | 189 | 11.58 | 0 |
Table 3.
Detected sand bodies, and average distance, velocity and heading of the isolated barchan dunes obtained, applying the dune area consistency criterion obtained from the West Sahara-Mauritania dune field.
Table 3.
Detected sand bodies, and average distance, velocity and heading of the isolated barchan dunes obtained, applying the dune area consistency criterion obtained from the West Sahara-Mauritania dune field.
| Period | Sensors | Detected Sand Bodies | Isolated Barchans | Migration Distance (m) | Migration Rate (m/yr) | Heading (Degrees) |
|---|---|---|---|---|---|---|
| 1992–1999 | ERS-2/ERS-2 | 2032 | 181 | 119 | 15 | 183 |
| 1999–2003 | ERS-2/Envisat | 2724 | 116 | 132 | 26 | 219 |
| 2003–2006 | Envisat/Envisat | 7148 | 369 | 74 | 19 | 192 |
| 2006–2009 | Envisat/Envisat | 4911 | 211 | 76 | 19 | 181 |
| 2009–2015 | Envisat/S1 | 4696 | 289 | 112 | 16 | 189 |
| 2015–2018 | S1/S1 | 5052 | 400 | 79 | 20 | 180 |
Table 4.
Dune migration information obtained using the automatic method over the reference dunes (manually delineated) from the WSM dune field, obtained between 2003 and 2015, specifying distance, velocity, heading direction, mean area and area loss.
Table 4.
Dune migration information obtained using the automatic method over the reference dunes (manually delineated) from the WSM dune field, obtained between 2003 and 2015, specifying distance, velocity, heading direction, mean area and area loss.
| Id. Dune | Migration Distance (m) | Migration Rate (m/yr) | Heading (Degrees) | Mean Dune Area (t1,t2) (ha) | Area Loss (%) |
|---|---|---|---|---|---|
| A | 170 | 13 | 183 | 20.29 | 6 |
| B | 178 | 25 | 197 | 1.56 | 8 |
| C | 264 | 20 | 190 | 3.36 | 12 |
| D | 147 | 11 | 190 | 14.44 | 14 |
| E | 193 | 15 | 189 | 11.87 | 18 |
| F | 193 | 15 | 190 | 9.27 | 11 |
Table 5.
Dune information extracted from the manually delineated dunes in Google Earth in 2007 and 2010, located in the South Rayan dune field.
Table 5.
Dune information extracted from the manually delineated dunes in Google Earth in 2007 and 2010, located in the South Rayan dune field.
| Id. Dune | Migration Distance (m) | Migration Rate (m/yr) | Heading (Degrees) | Mean Dune Area (t1,t2) (ha) | Area Loss (%) |
|---|---|---|---|---|---|
| A | 10 | 3 | 163 | 19.81 | 3 |
| B | 20 | 5 | 174 | 11.90 | 0 |
| C | 20 | 5 | 186 | 10.12 | 3 |
Table 6.
Information extracted from [39] on the three selected dunes between 1984 and 2003 using the Landsat 5 TM located in the South Rayan dune field.
Table 6.
Information extracted from [39] on the three selected dunes between 1984 and 2003 using the Landsat 5 TM located in the South Rayan dune field.
| Id. Dune | Migration Distance (m) | Migration Rate (m/yr) | Heading Degrees | Mean Dune Area (t1,t2) (ha) | Area Loss (%) |
|---|---|---|---|---|---|
| A | 83 | 4 | 174 | 20.35 | 4 |
| B | 87 | 5 | 178 | 11.29 | 1 |
| C | 99 | 5 | 166 | 10.48 | 0 |
Table 7.
Average filtered results based on dune area consistency criteria, measured over the South Rayan dune field.
Table 7.
Average filtered results based on dune area consistency criteria, measured over the South Rayan dune field.
| Period | Sensors | Detected Sand Bodies | Isolated Barchans | Migration Distance (m) | Migration Rate (m/yr) | Heading (Degrees) |
|---|---|---|---|---|---|---|
| 2000–2004 | ERS-2/Envisat | 1928 | 43 | 66 | 13 | 208 |
| 2004–2010 | Envisat/Envisat | 2729 | 434 | 45 | 6 | 158 |
| 2010–2014 | Envisat/S1 | 2785 | 93 | 36 | 7 | 177 |
| 2014–2019 | S1/S1 | 1714 | 112 | 176 | 29 | 169 |
| 2000–2010 | ERS-2/Envisat | 1866 | 64 | 89 | 8 | 201 |
| 2000–2019 | ERS-2/S1 | 581 | 73 | 188 | 9 | 184 |
Table 8.
Dune information provided by the automatic method on SAR data acquired in 2004 and 2010 for the same dunes which were also manually delineated, located in the South Rayan dune field.
Table 8.
Dune information provided by the automatic method on SAR data acquired in 2004 and 2010 for the same dunes which were also manually delineated, located in the South Rayan dune field.
| Id. Dune | Migration Distance (m) | Migration Rate (m/yr) | Heading (Degrees) | Mean Dune Area (t1,t2) (ha) | Area Loss (%) |
|---|---|---|---|---|---|
| A | 38 | 5 | 141 | 17.31 | 2 |
| B | 23 | 3 | 149 | 9.12 | 2 |
| C | 21 | 3 | 163 | 6.80 | 8 |
Publisher’s Note: MDPI stays neutral with regard to jurisdictional claims in published maps and institutional affiliations. |
© 2020 by the authors. Licensee MDPI, Basel, Switzerland. This article is an open access article distributed under the terms and conditions of the Creative Commons Attribution (CC BY) license (http://creativecommons.org/licenses/by/4.0/).
Share and Cite
MDPI and ACS Style
Delgado Blasco, J.M.; Chini, M.; Verstraeten, G.; Hanssen, R.F. Sand Dune Dynamics Exploiting a Fully Automatic Method Using Satellite SAR Data. Remote Sens. 2020, 12, 3993. https://0-doi-org.brum.beds.ac.uk/10.3390/rs12233993
AMA Style
Delgado Blasco JM, Chini M, Verstraeten G, Hanssen RF. Sand Dune Dynamics Exploiting a Fully Automatic Method Using Satellite SAR Data. Remote Sensing. 2020; 12(23):3993. https://0-doi-org.brum.beds.ac.uk/10.3390/rs12233993
Chicago/Turabian StyleDelgado Blasco, José Manuel, Marco Chini, Gert Verstraeten, and Ramon F. Hanssen. 2020. "Sand Dune Dynamics Exploiting a Fully Automatic Method Using Satellite SAR Data" Remote Sensing 12, no. 23: 3993. https://0-doi-org.brum.beds.ac.uk/10.3390/rs12233993
Note that from the first issue of 2016, this journal uses article numbers instead of page numbers. See further details here.