Article

Assessing the Potential Replacement of Laurel Forest by a Novel Ecosystem in the Steep Terrain of an Oceanic Island

1
Department of Biogeography, University of Bayreuth, D-95440 Bayreuth, Germany
2
School of Geography, University of Nottingham, Nottingham NG7 2RD, UK
3
Servicio de Medio Ambiente, Cabildo de La Palma, 38700 Santa Cruz de La Palma, Spain
4
Ecology and Evolution Research Group, Instituto de Productos Naturales y Agrobiología (IPNA-CSIC), 38206 San Cristóbal de La Laguna, Spain
5
Department of Geography, University of Bergen, P.O. Box 7802, 5020 Bergen, Norway
6
Biodiversity and Macroecology Group, Department of Biological, Geological & Environmental Sciences, Alma Mater Studiorum-University of Bologna, Via Irnerio 33, 40126 Bologna, Italy
7
Disturbance Ecology, University of Bayreuth, D-95440 Bayreuth, Germany
8
Bayreuth Center for Ecology and Environmental Research BayCEER, D-95440 Bayreuth, Germany
9
Geographical Institute Bayreuth GIB, D-95440 Bayreuth, Germany
*
Author to whom correspondence should be addressed.
Remote Sens. 2020, 12(24), 4013; https://0-doi-org.brum.beds.ac.uk/10.3390/rs12244013
Submission received: 22 September 2020 / Revised: 30 November 2020 / Accepted: 5 December 2020 / Published: 8 December 2020

Abstract

:
Biological invasions are a major global threat to biodiversity and often affect ecosystem services negatively. They are particularly problematic on oceanic islands where there are many narrow-ranged endemic species, and the biota may be very susceptible to invasion. Quantifying and mapping invasion processes are important steps for management and control but are challenging with the limited resources typically available and particularly difficult to implement on oceanic islands with very steep terrain. Remote sensing may provide an excellent solution in circumstances where the invading species can be reliably detected from imagery. We here develop a method to map the distribution of the alien chestnut (Castanea sativa Mill.) on the island of La Palma (Canary Islands, Spain), using freely available satellite images. On La Palma, the chestnut invasion threatens the iconic laurel forest, which has survived since the Tertiary period in the favourable climatic conditions of mountainous islands in the trade wind zone. We detect chestnut presence by taking advantage of the distinctive phenology of this alien tree, which retains its deciduousness while the native vegetation is evergreen. Using both Landsat 8 and Sentinel-2 (parallel analyses), we obtained images in two seasons (chestnuts leafless and in-leaf, respectively) and performed image regression to detect pixels changing from leafless to in-leaf chestnuts. We then applied supervised classification using Random Forest to map the present-day occurrence of the chestnut. Finally, we performed species distribution modelling to map the habitat suitability for chestnut on La Palma, to estimate which areas are prone to further invasion. Our results indicate that chestnuts occupy 1.2% of the total area of natural ecosystems on La Palma, with a further 12–17% representing suitable habitat that is not yet occupied. This enables targeted control measures with potential to successfully manage the invasion, given the relatively long generation time of the chestnut. Our method also enables research on the spread of the species since the earliest Landsat images.

Graphical Abstract

1. Introduction

Oceanic islands play an eminent role in speciation and endemism [1], and they contribute disproportionately to global biodiversity relative to their small area [2]. Their isolation, aggregation in archipelagos, island life cycles, relief dynamics, climate, topography, and natural and anthropogenic disturbance regimes produce and maintain a high diversity of biota and the respective ecosystems formed by those species [3]. Oceanic islands are often seen as evolutionary showcases [4] prone to pulse dynamics [5] or as evolutionary arenas [6], where speciation can be studied. However, the uniqueness of their flora, fauna, and ecosystems is also related to the fact that they host relict species and ecosystems, such as the evergreen laurel forest in the Canary Islands including our study region: the entire island of La Palma [7].
Endemic ecosystems (i.e., specific ecosystems that are characterized and dominated by species with a very limited spatial distribution) are particularly threatened by species invasion [8,9,10,11]. Invasive species are species that establish in new, non-historical ranges and are harmful to their environment [12]. They can decrease native species abundances via competition, predation, parasitism, and alteration of habitat conditions, causing a loss of biodiversity, ecosystem functioning, and services [13]. Invasive species often cause huge economic costs for society [14]. The abundance of invasive species was recently found to have increased by up to 70% across 21 countries since 1970 [15]. The focus of invasion research is mostly on prominent single species of well-known invasion potential, such as Lantana camara or Ailanthus altissima [16,17]. Non-native woody species are disproportionately represented among the most severe invaders around the world [18], and escapes of tree species from plantations have been highlighted as a particular problem [19]. Chestnut (Castanea sativa Mill.) (Fagaceae) is a widespread deciduous tree species across Europe, often managed for fruit and wood production. It is also an important species for apiculture and historically has had other uses such as in tanning and pig farming [20]. The species was introduced to La Palma as early as 1493 [21] and managed in orchards, most of which are abandoned today. Observations of local authorities suggest that the species is increasingly establishing in natural, evergreen forest ecosystems—C. sativa is the agent of change in the ongoing replacement of a native ecosystem by an ecosystem that did not previously exist on La Palma. Such a deciduous broadleaved forest, with pronounced seasonal leaf phenology, is a novel ecosystem in the context of the Canary Islands.
Remote sensing (hereafter abbreviated to RS) has been used for almost 65 years in vegetation science [22]. However, ecological studies from space only began after the launch of Landsat 1 in 1972 [23]. In many cases, RS is the only feasible method for measuring the characteristics of habitats across broad areas and for detecting environmental changes that occur as a result of human or natural processes [24]. It is becoming increasingly popular among conservationists and ecologists. Satellite-based data have a wide range of applications in ecological studies, including mapping of plant communities and also single plant species [25]. A recent study on La Palma used a time series of Sentinel-2 images to identify plant communities and measure beta-diversity [26].
Remote sensing is advancing invasion research and management by detecting and mapping invasive species, their drivers, and potential future distributions [27,28]. Differences in structural, biochemical, and physiological characteristics between species can make it possible to distinguish invasive plant species from native co-occurring vegetation by their spectral signatures [29]. However, there are limits to this if invasives and natives share comparable reflection spectra. If phenological differences between species exist, these can play a key role in identifying invasive species within native vegetation by RS [30]. To detect seasonal phenological differences between plant species, multitemporal RS data are required, for instance, provided by spaceborne Landsat and Sentinel sensors. The timing of RS acquisition is crucial for the detection of phenologically differentiated species. Accordingly, Evangelista et al. [31] used six Landsat 7 ETM+ satellite scenes across the growing season to remotely sense the evergreen Tamarix species invading native deciduous vegetation along the Arkansas River in Colorado, USA.
Slight differences in seasonal phenology can be sufficient to monitor invasive plant species but may require hyperspectral airborne sensors to detect them, with the trade-off of high costs [32]. Such hyperspectral approaches and time series can help to identify invasive plant species even in non-seasonal climate and ecosystems, as demonstrated by Asner et al. [33], who detected the invasive evergreen shrub Myrica faya Dryand. (syn. Morella faya Aiton) in Hawaiian rainforests. However, that study used EO-1 Hyperion satellite data, and this satellite (and sensor) has been decommissioned and is no longer available.
Generally, the potential to detect invasive species remotely increases with finer spectral, spatial, and temporal resolution of RS imagery [34]. Tarantino et al. [17] showed the potential of multi-seasonal panchromatic WorldView-2 satellite imagery for mapping the deciduous tree Ailanthus altissima (Mill.) Swingle, invading a protected area in Southern Italy. In this case, the detection of the invasive tree species was enhanced by the contrast with the grass cover of the invaded ecosystems, as well as the multitemporal, multispectral, and very high-resolution satellite imagery. Even if there is a follow-up satellite (WorldView-3) after the soon-expected end of the lifetime of WorldView-2, the data are not freely accessible, limiting their use for conservation practice and for comparative studies. Free and open-access RS data provide unlimited use but come at the expense of relatively coarse spatial, spectral, and temporal resolution.
Remote sensing also supports invasion research and management indirectly by providing RS data for species distribution and habitat suitability models [27,30]. Vicente et al. [35] were able to map the current and predict the future distribution of the invasive tree species Acacia dealbata Link in northern Portugal using remotely sensed predictor variables. In contrast to species distribution models, ecological niche modelling and habitat suitability mapping aim to reveal the potential distribution of a species by applying interpolation between known species occurrences. Such modelling techniques and resulting maps aim to guide conservation management and planning [36]. Andrew and Ustin [37] modelled the habitat suitability of the noxious pepperweed (Lepidium latifolium L.) invading San Francisco Bay/Sacramento-San Joaquin River Delta, California, USA. Species presence was derived from airborne HyMap hyperspectral imagery and environmental predictors from LiDAR. Accordingly, RS-based modelling approaches can map and predict rapid range expansions of invasive species by monitoring invasive species’ ecological niches [38].
The free availability and global coverage of RS data are beneficial for comparative studies, and for improving the quality of other study outcomes. Result validation and quality control are particularly important for studies of moving targets with enormous impact potential, such as invasive species. Based on the known benefits and limits of RS applications in invasion research, and considering options for compatibility with future studies, we use multitemporal and multispectral Landsat 8 and Sentinel-2 satellite imagery combined with field observations of C. sativa to investigate the current and potential future distribution of the species on the Canary island of La Palma. We used linear image regression [39] and random forest classification [40] to detect C. sativa and map its current spatial distribution. As the very steep and unstable slopes limit the extent of field surveys on La Palma, we utilized C. sativa’s distinctive phenology to map its current spatial distribution through RS. We then conducted and compared ecological niche models (hereafter ENM), also known as habitat suitability models, based on field observations of C. sativa and on remotely sensed C. sativa occurrences. This study thus aims to detect and map the invasive alien chestnut tree C. sativa on the island of La Palma and to assess the risk of the species replacing native and unique ecosystems such as the evergreen laurel forest of the Canary Islands.
We build on previous studies on the detection of invasive plant species through RS, aiming to improve RS-based assessments of invasive plant species not only through comparing the sensitivity of commonly used sensors that offer open RS data (Landsat/Sentinel) but also, and particularly, through linking modelling approaches with RS and with field data. This approach also allows better assessment of existing invasions using long time series. Additionally, we identify new potential for future invasion research. Combining RS and SDMs can provide testable predictions for future invasion processes under climate change. Finally, our study is the first using RS for a better understanding of tree invasion and its consequential impact on the unique laurel forest.

2. Materials and Methods

2.1. Study Site and Field Data

La Palma, also known as “la isla verde” or “la isla bonita”, is one of the highest and western-most islands of the Canary Islands archipelago. Large surfaces of the island are still covered by natural and semi-natural vegetation. The steep slopes in the northeast of the island are exposed to constant moisture supply by trade winds. Here, natural laurel forests are found on steep, almost inaccessible slopes (Figure 1). This ecosystem covered large parts of the northern hemisphere during the Tertiary period, as indicated by fossil records of preserved tree leaves in lignite all over Europe [41]. Today, comparable climatic conditions to the zonal climate of the Miocene (i.e., constant moisture supply and warm temperatures) exist on some oceanic islands of sufficient elevation in the trade-wind zone, including La Palma.
Despite the strong resemblance in the climate, vegetation structure, and characteristic laurophyllous plant functional types between the present-day Canary Islands and the Tertiary period, the current Canary Island laurel forest is not a simple copy of a Tertiary biome. The current laurel forest species composition of the Canaries that established since the Pliocene is an assemblage of taxa that differ in origin [42]. Very likely, oceanic islands that have since eroded to guyots (seamounts) served as stepping-stones of suitable habitat for species dispersal closer to the European continent [43].
However, the laurel forest of the Canary Islands has been strongly reduced through exploitation since the European colonization [44]. Most remnant areas are on steep slopes, where access for forestry is restricted, if not impossible—but this restriction also applies to scientific field work. In consequence, RS approaches, although themselves not free from limitations associated with steepness and cloudiness, need to be implemented for data collection within and across steep valleys, slopes, and remote ridges.
In situ recording of mature individuals of C. sativa in the field was conducted during 10–24 April 2019. We mapped individual trees, recording GPS points for each. The sampling aimed to cover the entire range of the species on the island. This, combined with limited available time in the field and the restricted accessibility to many parts of the range because of very steep and remote terrain, meant that we mostly collected data relatively close to roads. To maximize data collection in these circumstances, we planned the field data acquisition based on previous studies on the island, both by members of our team and through the expertise of the local administration (Cabildo Insular de La Palma).

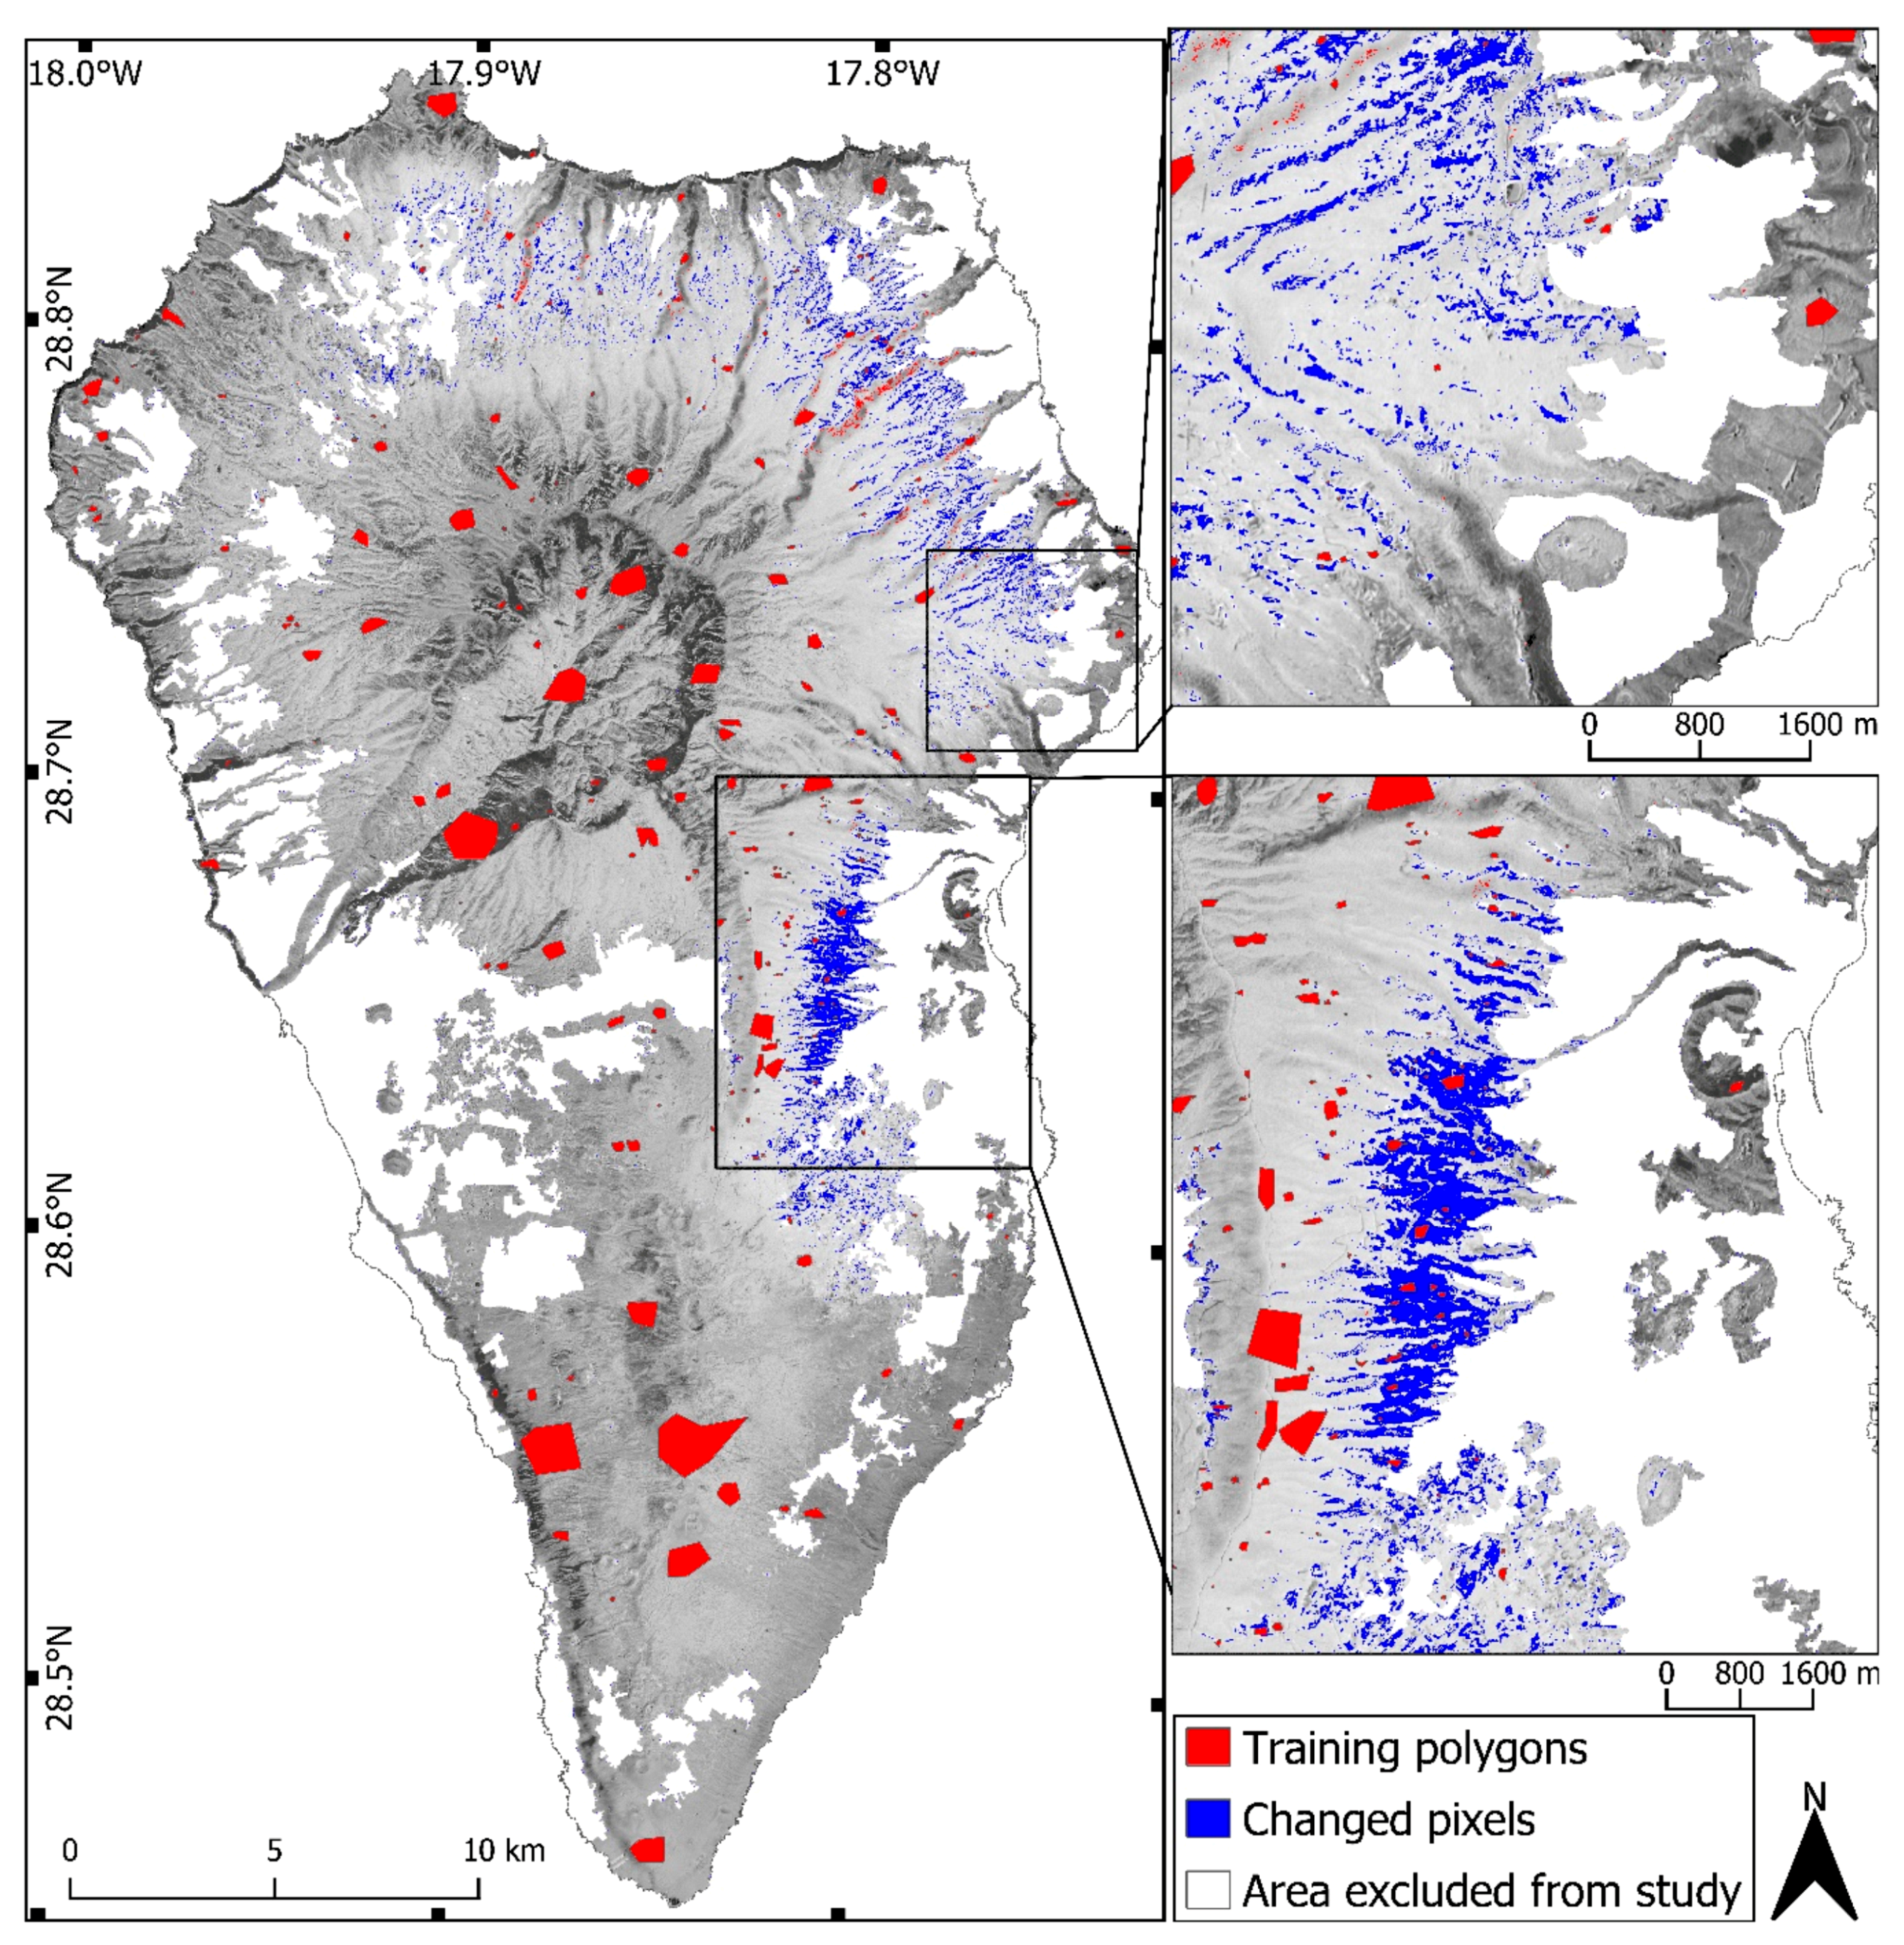
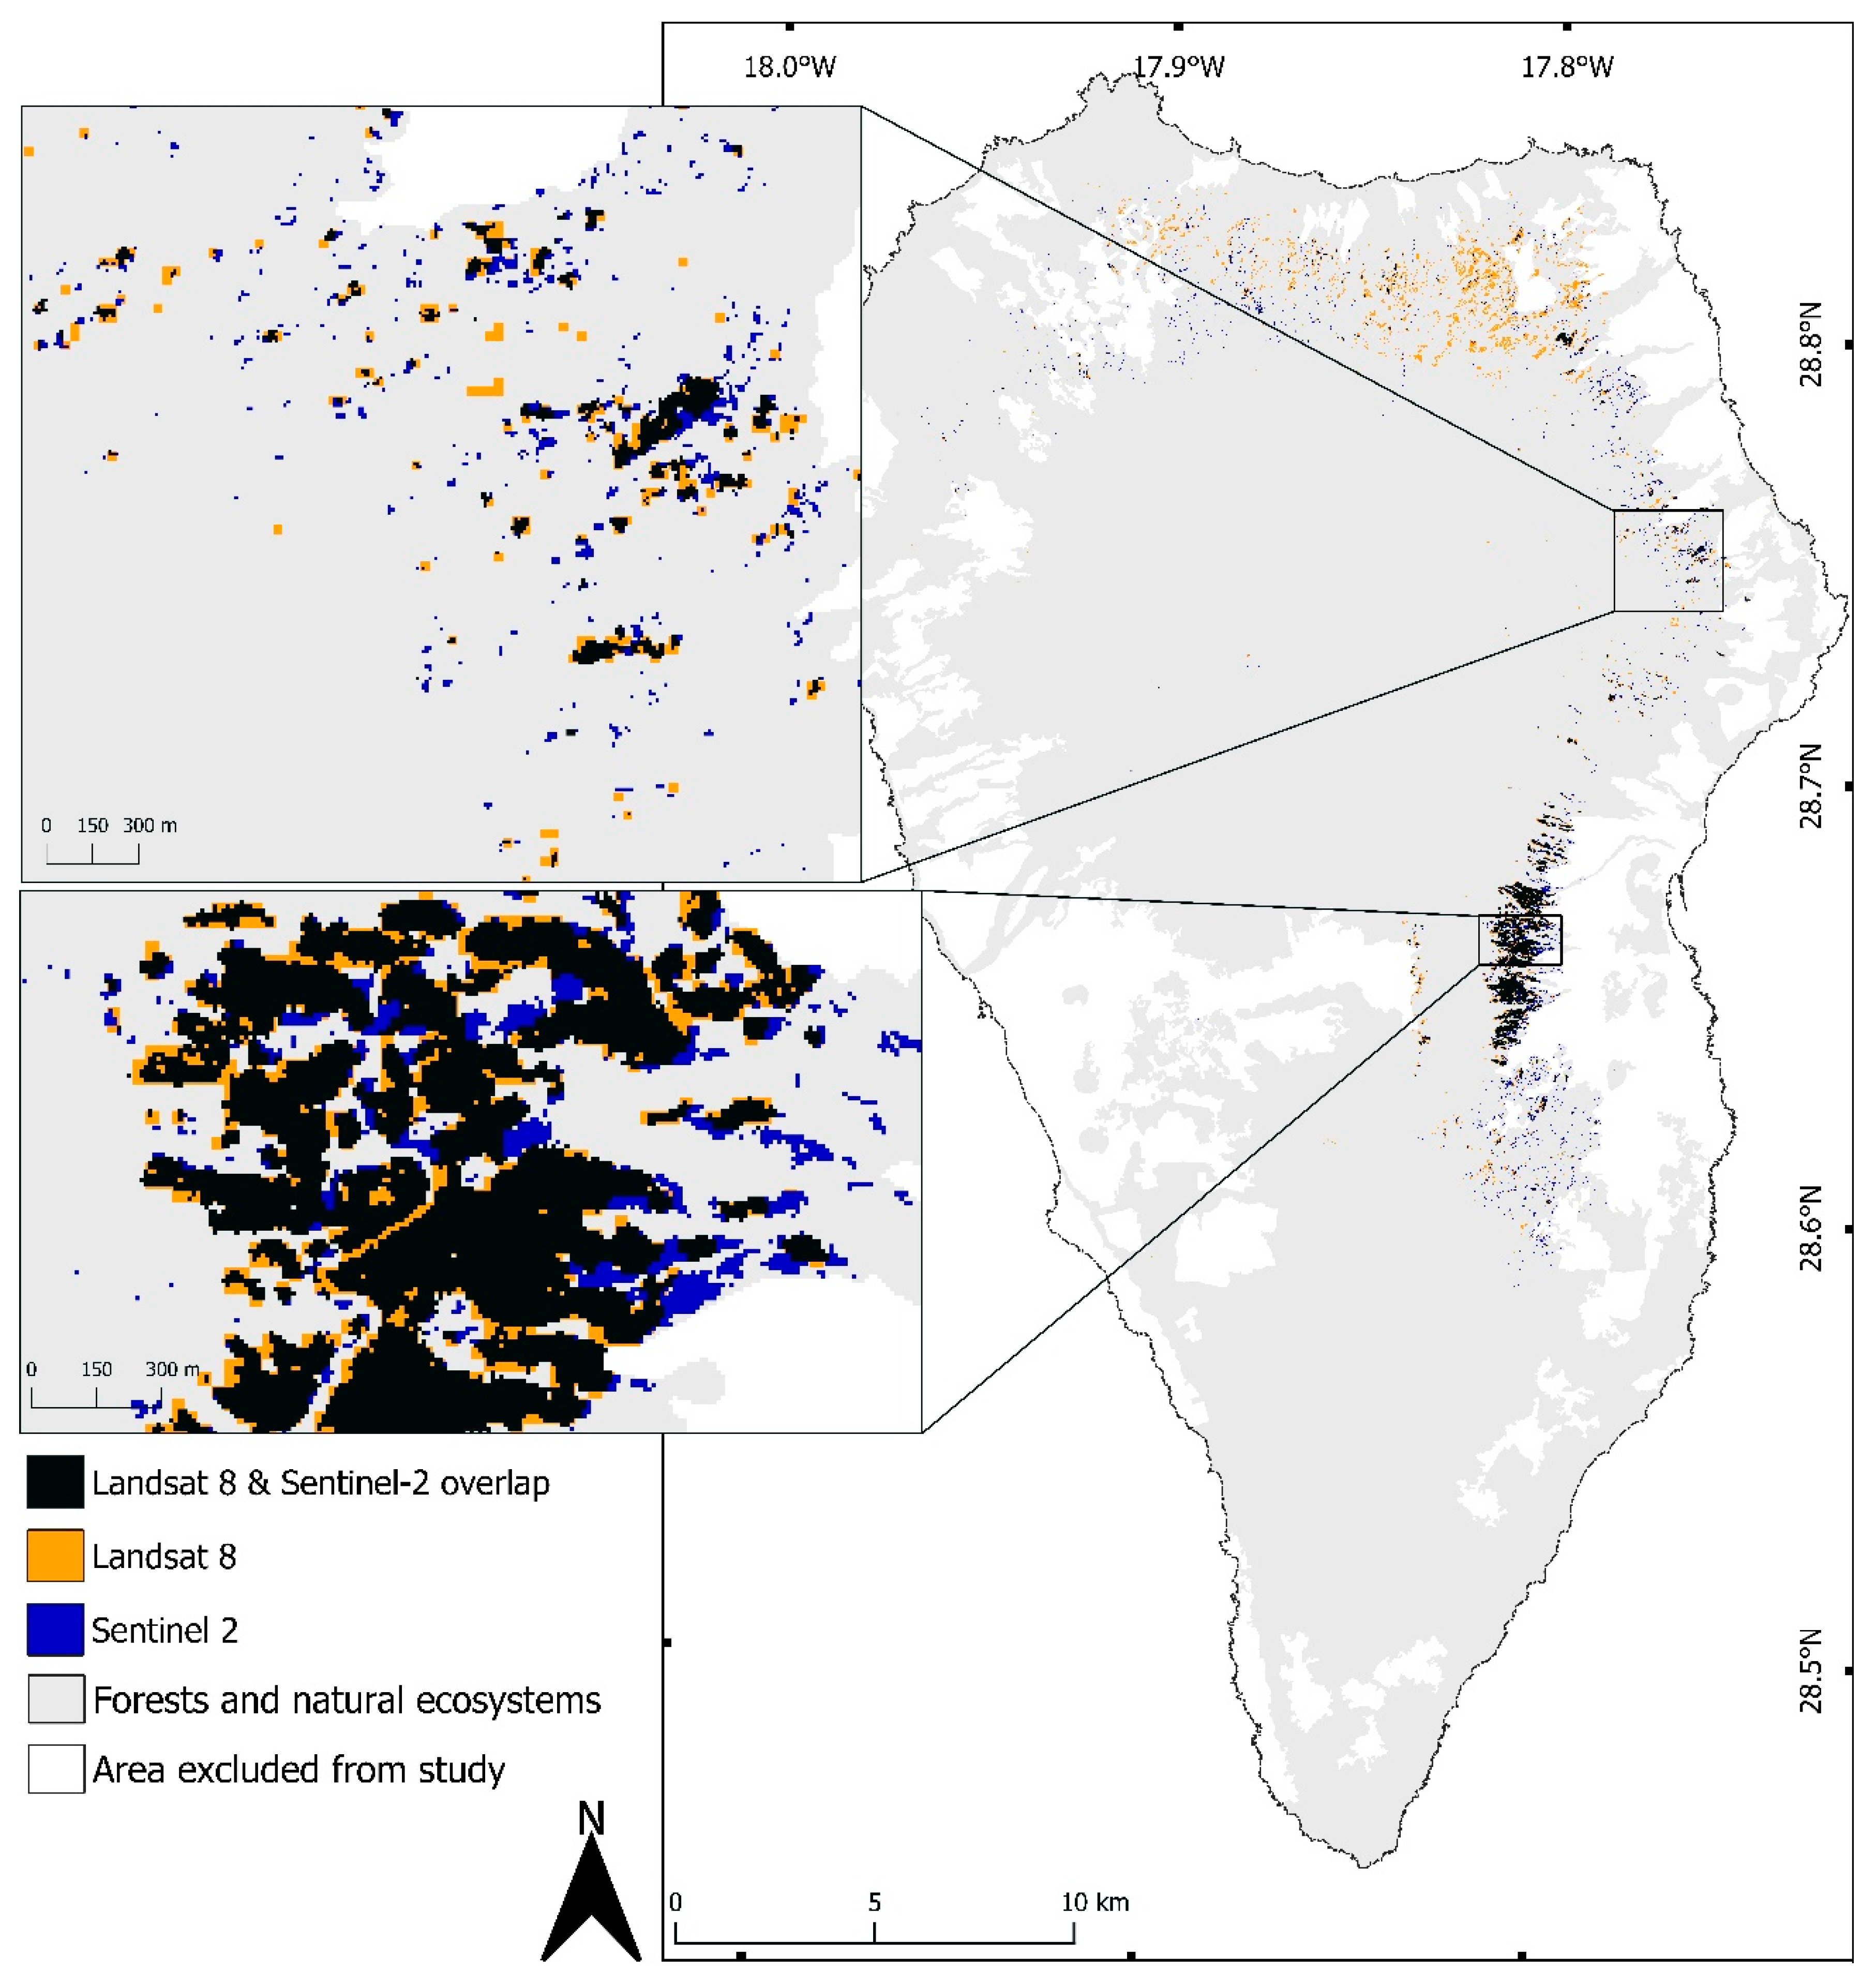
2.2. Change Detection

Deciduous tree species have a distinct phenological cycle with synchronous leaf flush in spring and leaf shedding in autumn. In C. sativa on La Palma, this rhythm is presumably maintained and triggered by the photoperiod, even though harsh winter temperatures are missing, and the evolutionary driver of leaf shedding is no longer effective. In consequence, C. sativa can be mapped in a matrix of evergreen vegetation through digital change detection. Its most distinctive stage is its leaflessness between autumn and spring, making it a unique species in the otherwise evergreen ecosystem. To map C. sativa, we can therefore take advantage of the much larger change between seasons, in satellite images, in places where chestnut is (in-leaf vs. leafless) than in places where it is absent (in-leaf throughout)—making change detection through image regression appropriate for this purpose. We use image regression with the Landsat 8 images from 7 March and 29 July 2017, and with the Sentinel-2 images from 8 July 2018, and 13 February 2019 (Appendix A). By applying change detection to a pair of Landsat 8 images and to a pair of Sentinel-2 images, we can compare the detection performance of the two sensors.
Landsat 8 and Sentinel-2 surface reflectance data were obtained from USGS and Copernicus Open Access Hub. The Landsat 8 surface reflectance data are orthorectified data generated at 30 m grid cell resolution. The data are free from any atmospheric artefacts, illumination, and viewing geometry bias [45]. Similarly, the Sentinel-2 data are geometrically, radiometrically corrected, orthorectified, and spatially registered bottom-of-the-atmosphere reflectance products that are generated at 10, 20, and 60 m spatial resolutions [46]. Therefore, no further pre-processing of the images was carried out for those parameters. However, the part of the Landsat 8 image from March 2017 that contained clouds was cropped out with the help of Quality Assessment band shipped with the Landsat 8 surface reflectance product and compensated with an image from 3 February 2017 after histogram matching in R using the package RStoolbox [47]. A few cloud-contaminated pixels were left around the edges. The areas classified as agriculture and settlements by Corine land cover data 2018 were cropped out. Therefore, our study area, as calculated in R using the study area shapefile, covers approximately 545.82 km2. The Sentinel-2 images used in this study are of 10 m spatial resolution.
Several techniques are used for digital change detection [39,48]; we chose image regression and differentiation for our analysis. Image regression does not need training data and can reduce atmospheric haze and sun angle effect [39]. Change detection, when used on its own, relies on thresholds to discern changed and unchanged pixels. Therefore, we integrated digital change detection with supervised classification, to avoid thresholds. The image regression technique assumes that the pixel values at time t1 are linear functions of the pixel values from time t2. Therefore, an image from one date can be regressed against the image from another date using least-squares regression [39,48].
Here, we used four different bands (blue [B], green [G], red [R], and near-infrared [NIR]) from each sensor, which we refer to as band 1, band 2, band 3, and band 4, respectively. Therefore, t 1 1 n is the image from the date 1 with n = 4 spectral bands, and t 2 1 n is the image from date 2 with the same number of spectral bands. We considered the image from one date to be a linear function of the image from the other date. Therefore, the image from date 1 was regressed on the image from date 2. We arbitrarily assigned the images from July as date 1.
t 1 1 n   =   a   +   b   t 2 1 n +   e  
where, a is intercept, b is slope, and e are the residuals.
If y 1 n is the predicted image on the image t 2 1 n from the regression line in the Equation (1), the changed image can be obtained by
d 1 n =   y 1 n     t 1 1 n
where d 1 n is the subtracted image from band 1 to n.
However, the change in pixels in the images obtained from the Equation (2) were not easily visible and discernible. The NIR band reflects more light from healthy vegetation than from stressed vegetation. Therefore, the NIR bands were subtracted from the red bands in the respective images obtained from the Equation (2).
D   =   d 3     d 4
where, D is the resulted change image.
Finally, the raster results were created using the band composition of D, d3, and d2, respectively, to obtain the changed pixels between two dates. Changed pixels gained from the image regression and image differentiation were compared with Google Earth images and field data.

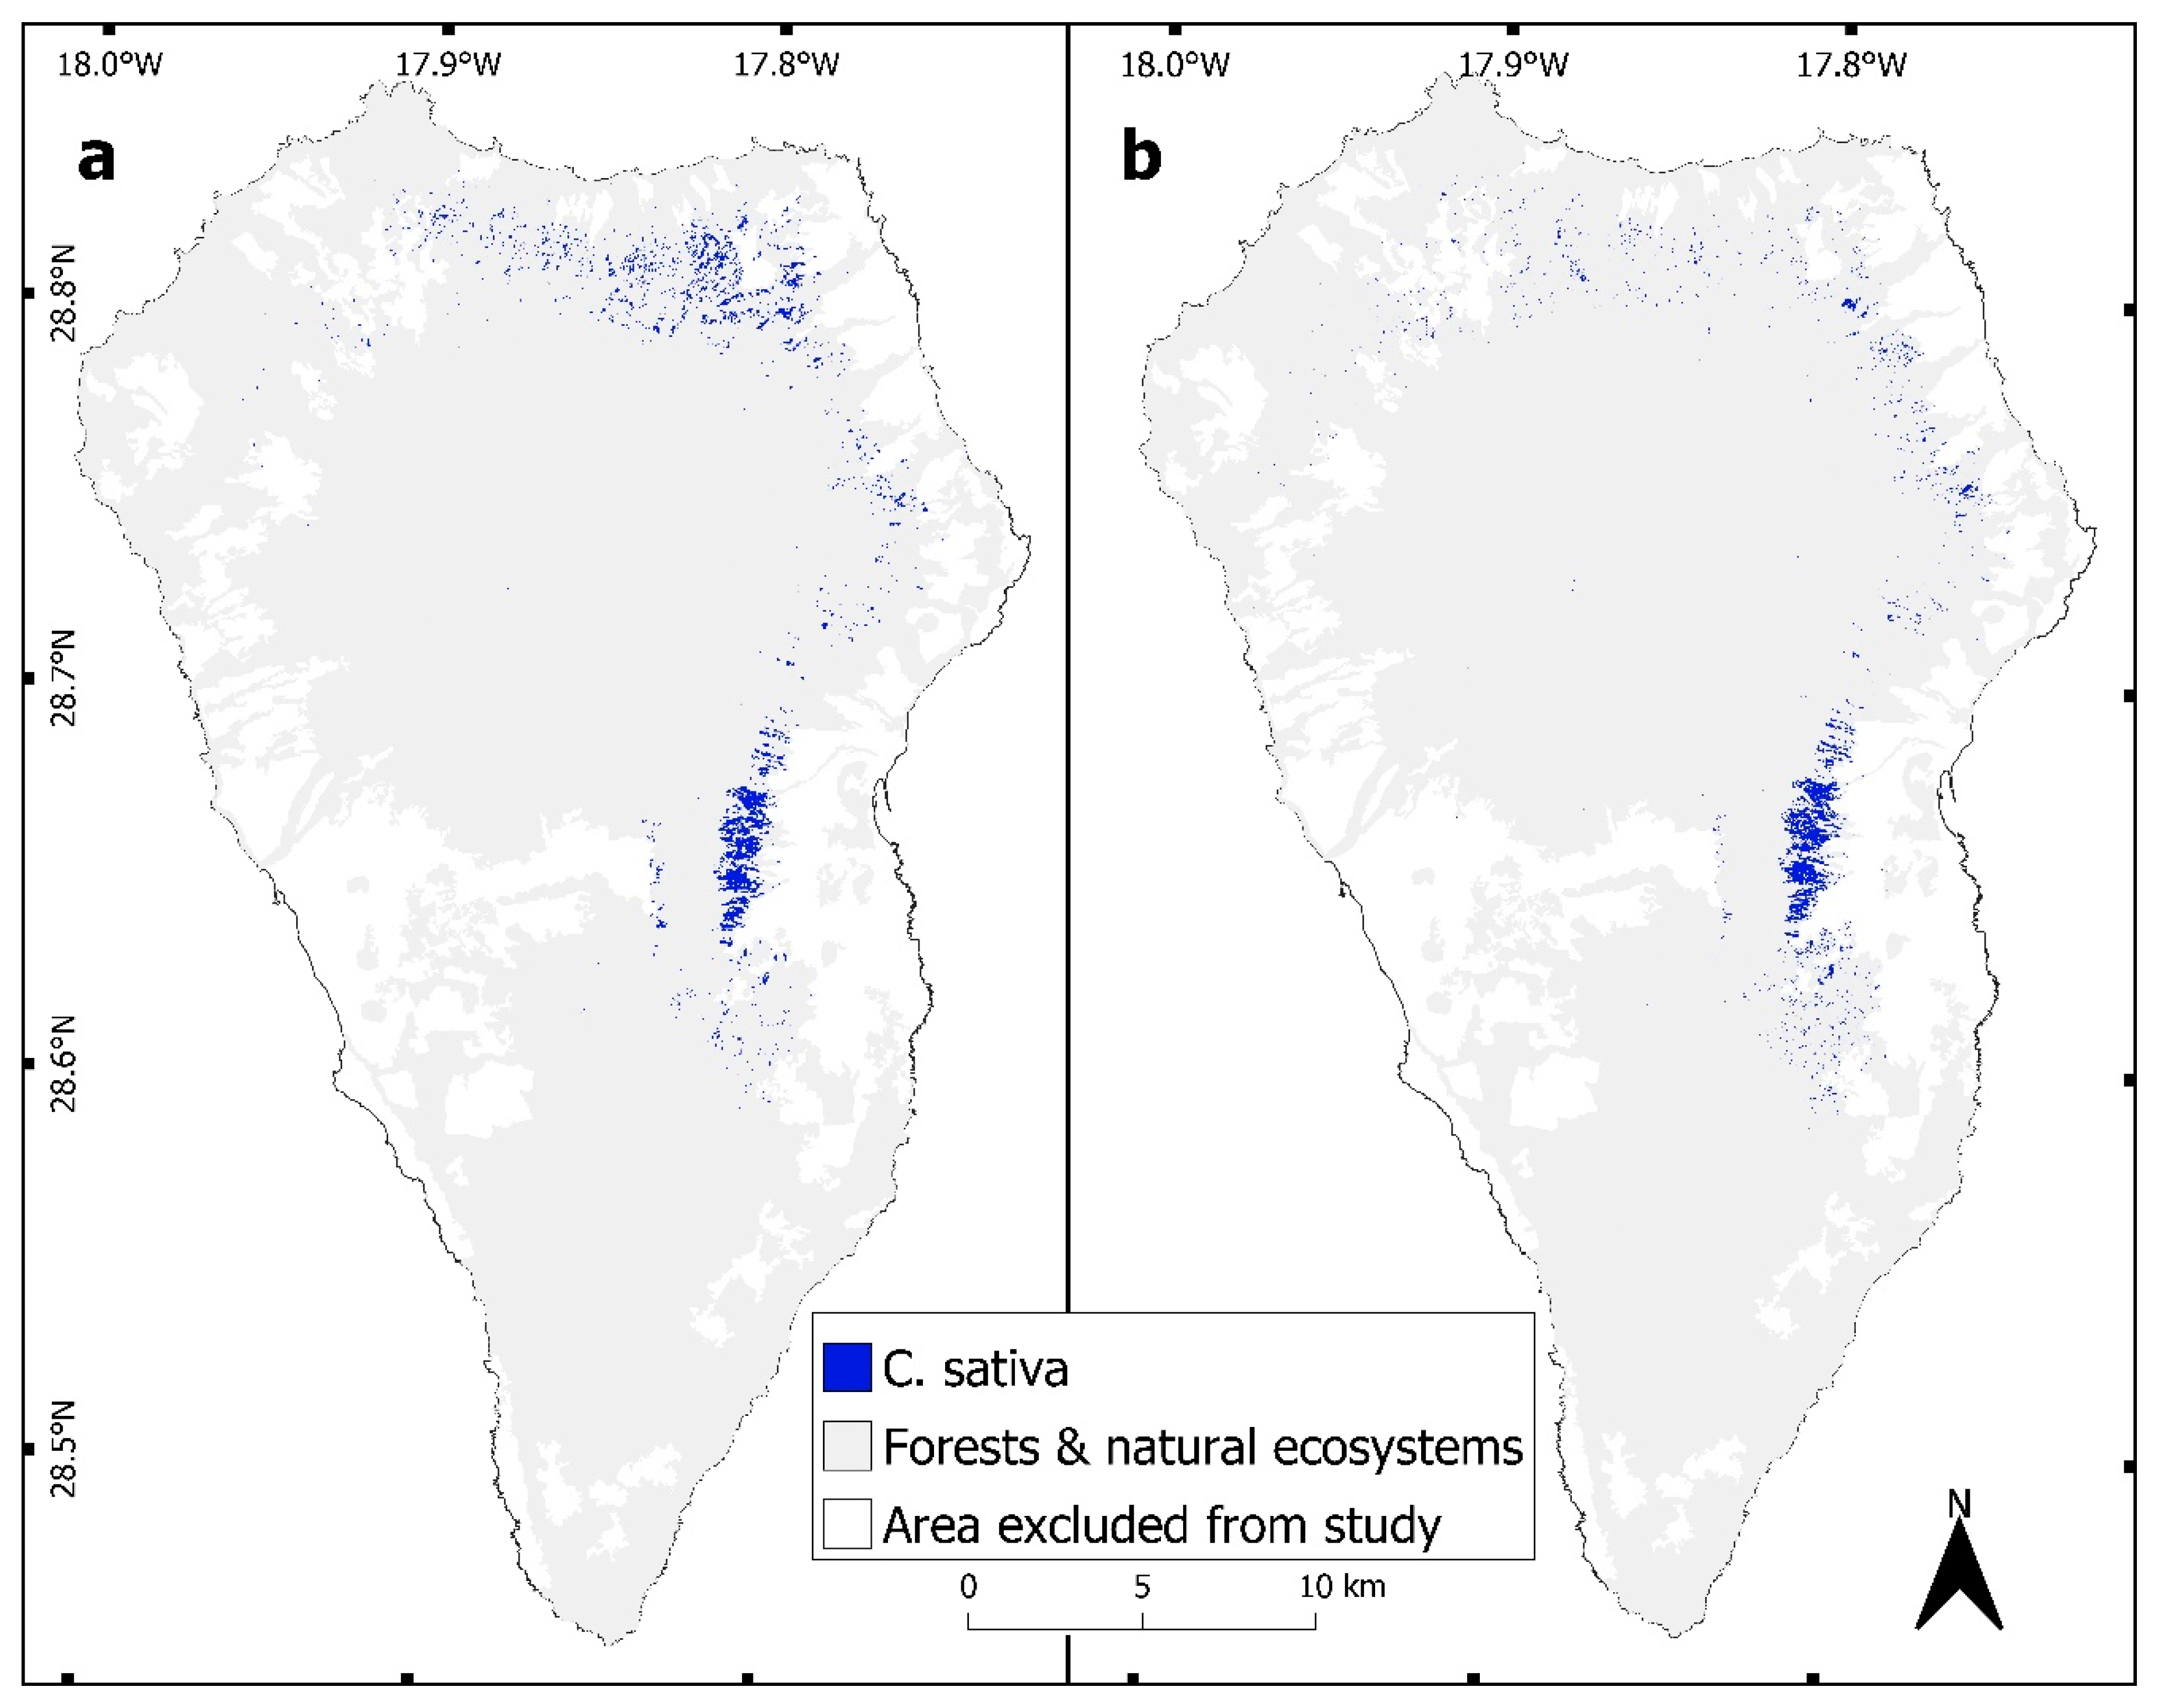
2.3. Random Forest Classifications

The supervised classification algorithm Random Forest (RF) was applied in this study to extract the C. sativa present spatial distribution. RF is a machine learning algorithm that works on bagging approaches: The algorithm grows multiple decision trees from the random subsets of data and gives a final decision based on the majority of votes from the resulting trees [40]. The algorithm has been reported to produce promising results [49].
The changed pixels may not all be associated with C. sativa. Therefore, C. sativa, forests and natural ecosystems were trained in QGIS based on the field reference data (Appendix B) and Google Earth images were taken as references. For the training data, the raster data obtained in Figure 2 and Figure 3 were used to discern changed pixels (C. sativa), and unchanged pixels (forests and other natural ecosystems). The data were split into training and testing data in the ratio of 70% to 30% for each changed image from Landsat 8 and from Sentinel-2. The data used to train the model were cross-validated with ten-fold cross-validation. Supervised classifications were carried out in R with the caret [50] package on the images obtained from the image regression and image subtraction that include five bands as a stack. In the RF models, 650 trees were grown for each supervised classification—the out of bag error in the random forest classification reached a low level at 650 trees and was near-constant with more. The models were validated using the respective testing data (Appendix C).

2.4. Ecological Niche Modelling

Castanea sativa occurrence and coverage were recorded and mapped in the field from 11 April to 23 April 2019, mainly using road access. The sampling was conducted based on expert knowledge, and the change detection map (Figure 2 and Figure 3) as well as through random C. sativa observations. The Global Positioning System (GPS) locations were recorded in the field for presence locations (Appendix B) using a WPL-2000 GPS device.
We retrieved a set of biotic and abiotic environmental variables from Cabildo Insular de La Palma, modified from [51]. Topographic information on aspect and slope was calculated in QGIS from the 2 m spatial resolution digital elevation model obtained from [52]. All environmental variables had a spatial resolution of 100 m except elevation, slope, and aspect; we aggregated the resolution of these to 100 m. After performing a correlation analysis on the entire set of environmental variables (r > 0.7, Appendix D), the following explanatory variables for ENMs remained: winter precipitation, summer precipitation, inter–annual precipitation, intra-annual precipitation, vegetation associations, solar radiation, elevation, slope, aspect, and parent materials (Appendix E). The mean annual temperature was highly correlated with elevation (r > 0.7), and mean annual precipitation was highly correlated with mean winter precipitation (r > 0.7) (Appendix D). We excluded mean annual temperature because La Palma possesses a high altitudinal gradient, and thus, the temperature difference is a major function of elevation even if aspect also plays a role due to differences in cloud cover and insolation. Similarly, mean annual precipitation was excluded because the precipitation exhibits a clear seasonal pattern with high amounts during winter and less precipitation in summer. From an ecological perspective, the variation in precipitation was a better choice to characterize habitat suitability of C. sativa compared to annual mean precipitation.
For the ENMs, both species occurrence data from the field and from RS were used independently. We used R version 3.6.1 [53] and Quantum GIS (QGIS) version 3.6.3, as well as Google Earth applications. To obtain a habitat suitability map for C. sativa, we applied generalized additive models (GAMs), Maximum Entropy (MaxEnt) and Random Forest (RF), combining them into an ensemble model (EM) using biomod2 [54] (see results for each model algorithm in Appendix F). GAMs are data-driven, slightly modified regression models that use non-parametric, data-defined smoothers to fit nonlinear functions. GAMs are capable of modelling complex ecological response shapes [55,56]. MaxEnt is designed to estimate target probability distributions by finding the probability of maximum entropy [57]. The algorithm is extensively used in ENMs [58], but there are limitations when data are missing at the edges of species’ distributions. In consequence, we opted for an EM, in order to obtain more robust outcomes than likely to be delivered by an individual modelling technique [59].
We randomly extracted 2500 RS species occurrence points from the area where spatial agreements in the resulting maps between both images were found. Data obtained were thinned with minimum spatial distances of 300 m and 100 m for RS data and field data, respectively, using spThin [60] package in R, to avoid spatial bias. We used 300 m for RS data thinning and 100 m for field data thinning because the RS data were uniformly rasterised, and field data were clumped due to inaccessible field sites. Applying 300 m in field data would result in far fewer species occurrences. The rationale for a 100 m minimum distance is that the environmental raster data that we used has a spatial resolution of 100 m. Hence, we wanted to avoid more than one species occurrence point in a single pixel. Final numbers of 241 and 172 occurrence points of RS and field, respectively, were used for modelling. With the biomod2 [54] package in R, the three different modelling approaches (GAMs, MaxEnt, and RF models) were integrated for the EMs. We generated the same number of pseudo-absence points as presence, taking prevalence into account [61,62] and excluding the area buffered by a 30 m radius from the species’ occurrence points. The models were each run four times, with ten sets of pseudo-absence records that resulted in 120 models in total for each data set (field-collected species occurrence data and RS species occurrence data).
For EM projections, only models meeting the quality standards of total true skill statistic (TSS) > 0.7 and area under the receiver operating characteristic curve (AUC) > 0.8 were used. Individual models that did not meet these requirements were excluded from building the EM—including all the GAM and MaxEnt models [Appendix G]. Our resulting EMs were based on 50 and 34 single models for RS and field occurrence data, respectively. Mean of the weighted sum of probabilities, committee average across prediction, and mean probabilities across prediction of the ensemble forecasts were used to generate the suitable habitat map for C. sativa.
Receiver operating characteristic curve cut-offs that maximized the sum of specificity and sensitivity were used as the threshold to generate species habitat suitability (binary) maps. The binary maps were used to quantify the suitable habitat for C. sativa from each modelling approach and to analyse the variation in those areas with respect to the environmental variables used for the models.

3. Results

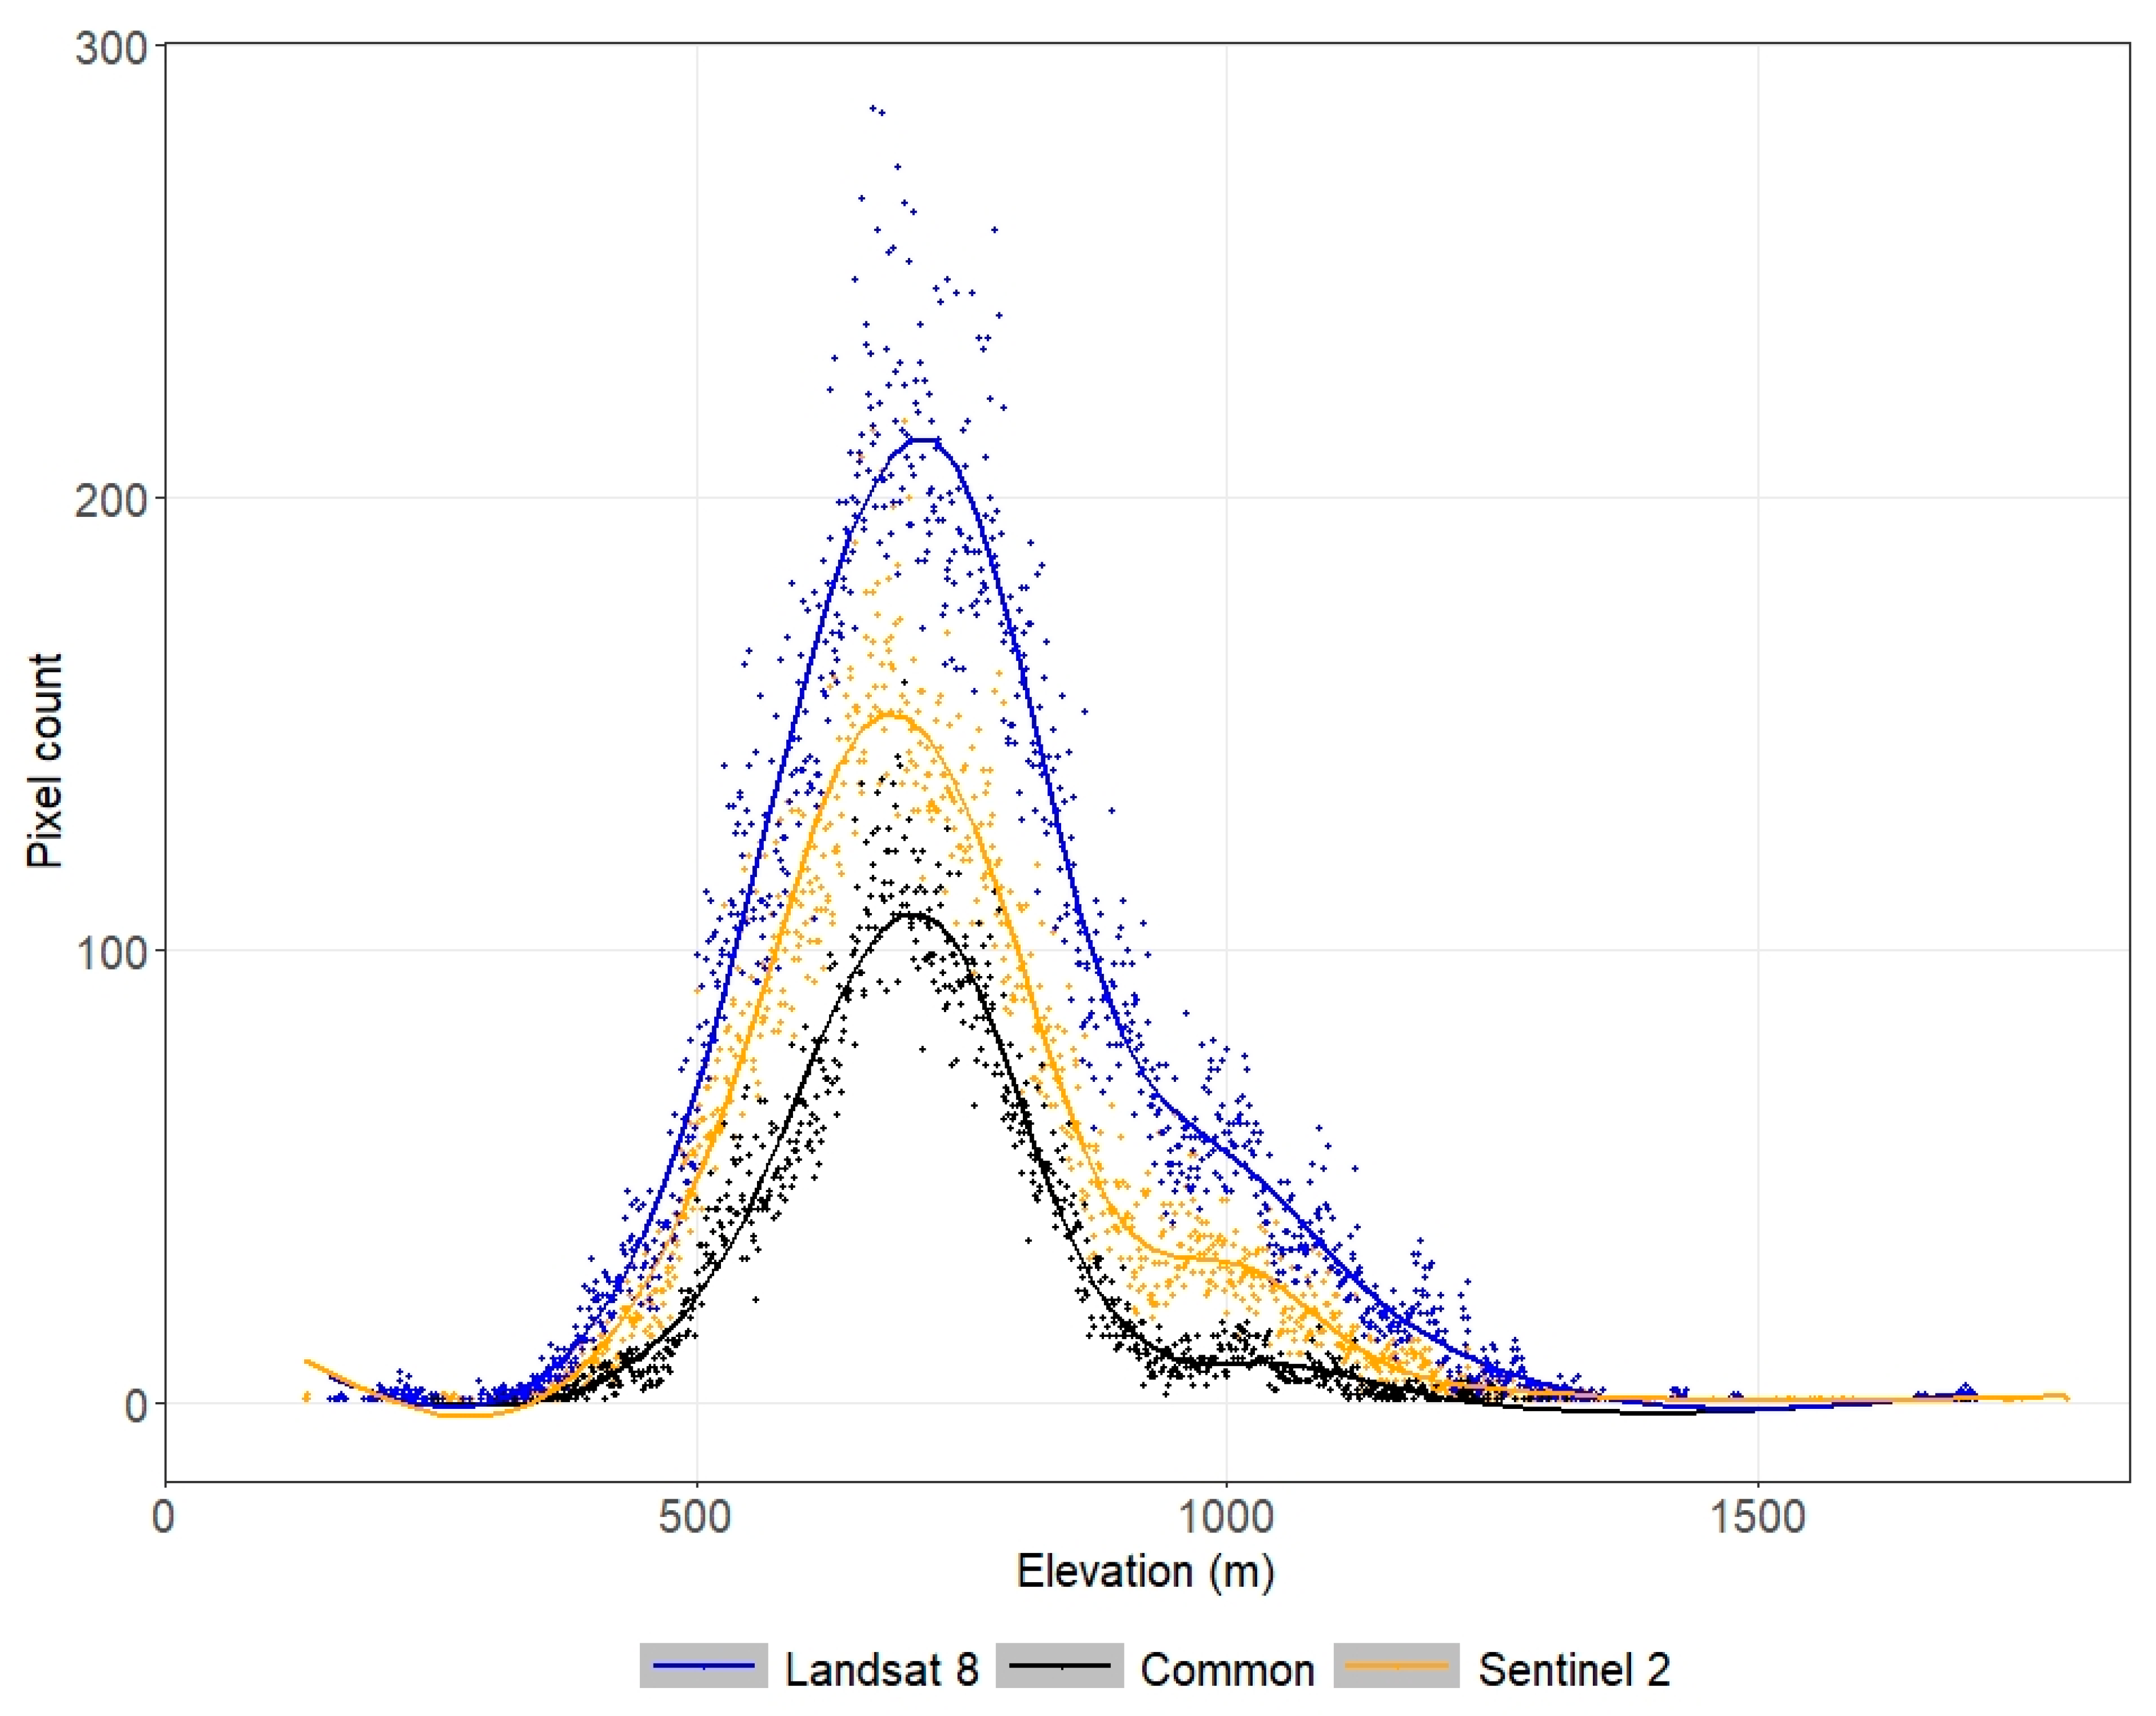
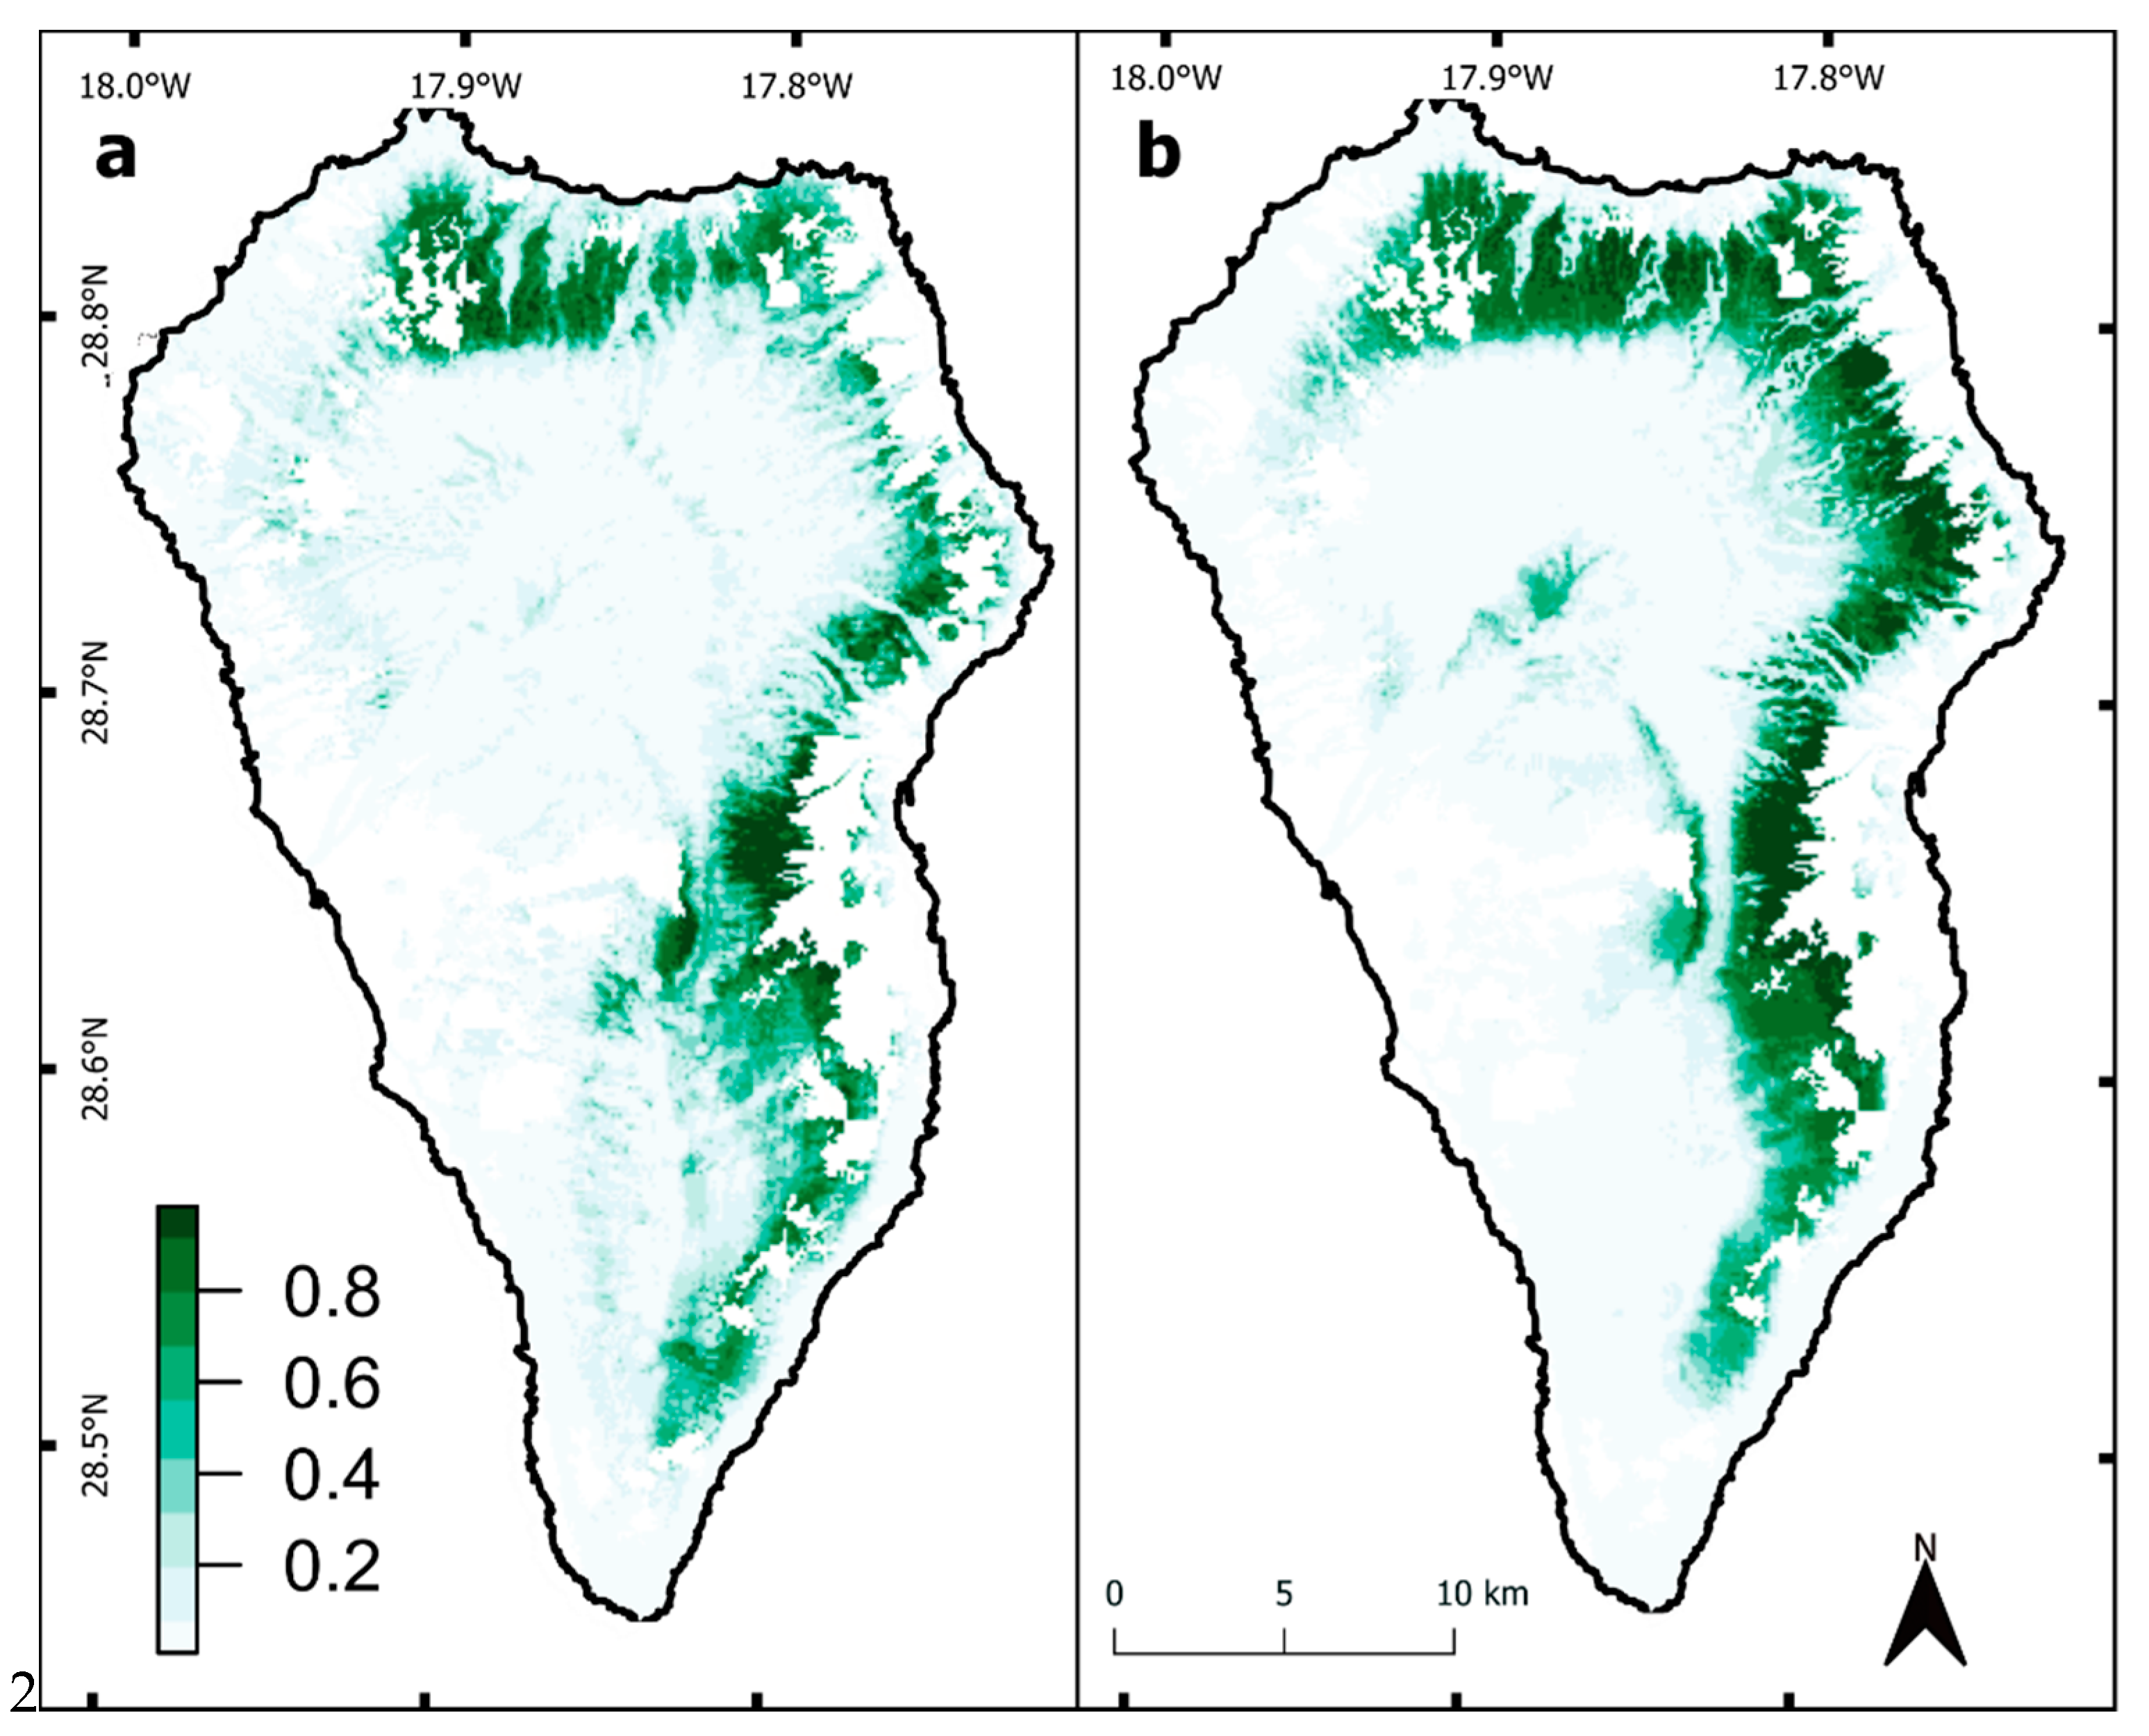
3.1. Change Detection

C. sativa occurrence locations detected by RS and in the field (Appendix B) had strong spatial agreements with the changed pixels (Figure 2 and Figure 3), and model accuracy was high (Table 1). Additional pixels were also detected as changed pixels. However, they were ambiguous and were not distinguishable from other vegetation or attributes in the Google Earth reference image, and those locations were also not available from field data. Such ambiguities may have resulted from land-cover changes rather than from changes that occurred because of C. sativa’s phenological cycle.
The different sensors resulted in different areas of spatial coverage of C. sativa (Figure 4). The total coverages of C. sativa found in 2019 were 5.26 km2 in the Sentinel-2 and 6.72 km2 in the Landsat 8 images, which make 1% and 1.23%, respectively, of the total island area. Most of the detected occurrences of chestnut were from the eastern slopes and northern parts of the island. Only a few occurrences were detected on the southern slopes (Figure 4). Most of the occurrences were close to agricultural land and some were on lapilli fields. No C. sativa occurrences were detected in southern parts and coastal areas of the island. The C. sativa occurrence pixels in the Sentinel-2 are more scattered than in the Landsat 8 image (Figure 4 and Figure 5). Even in the area where both sensors spatially agree, Landsat 8 was found to have a wider coverage than Sentinel-2 (Figure 5).
Spatial coverage of C. sativa increases progressively from 400 m a.s.l. to 700 m a.s.l. and decreases above 700 m a.s.l. in the images from both the sensors (Figure 6).

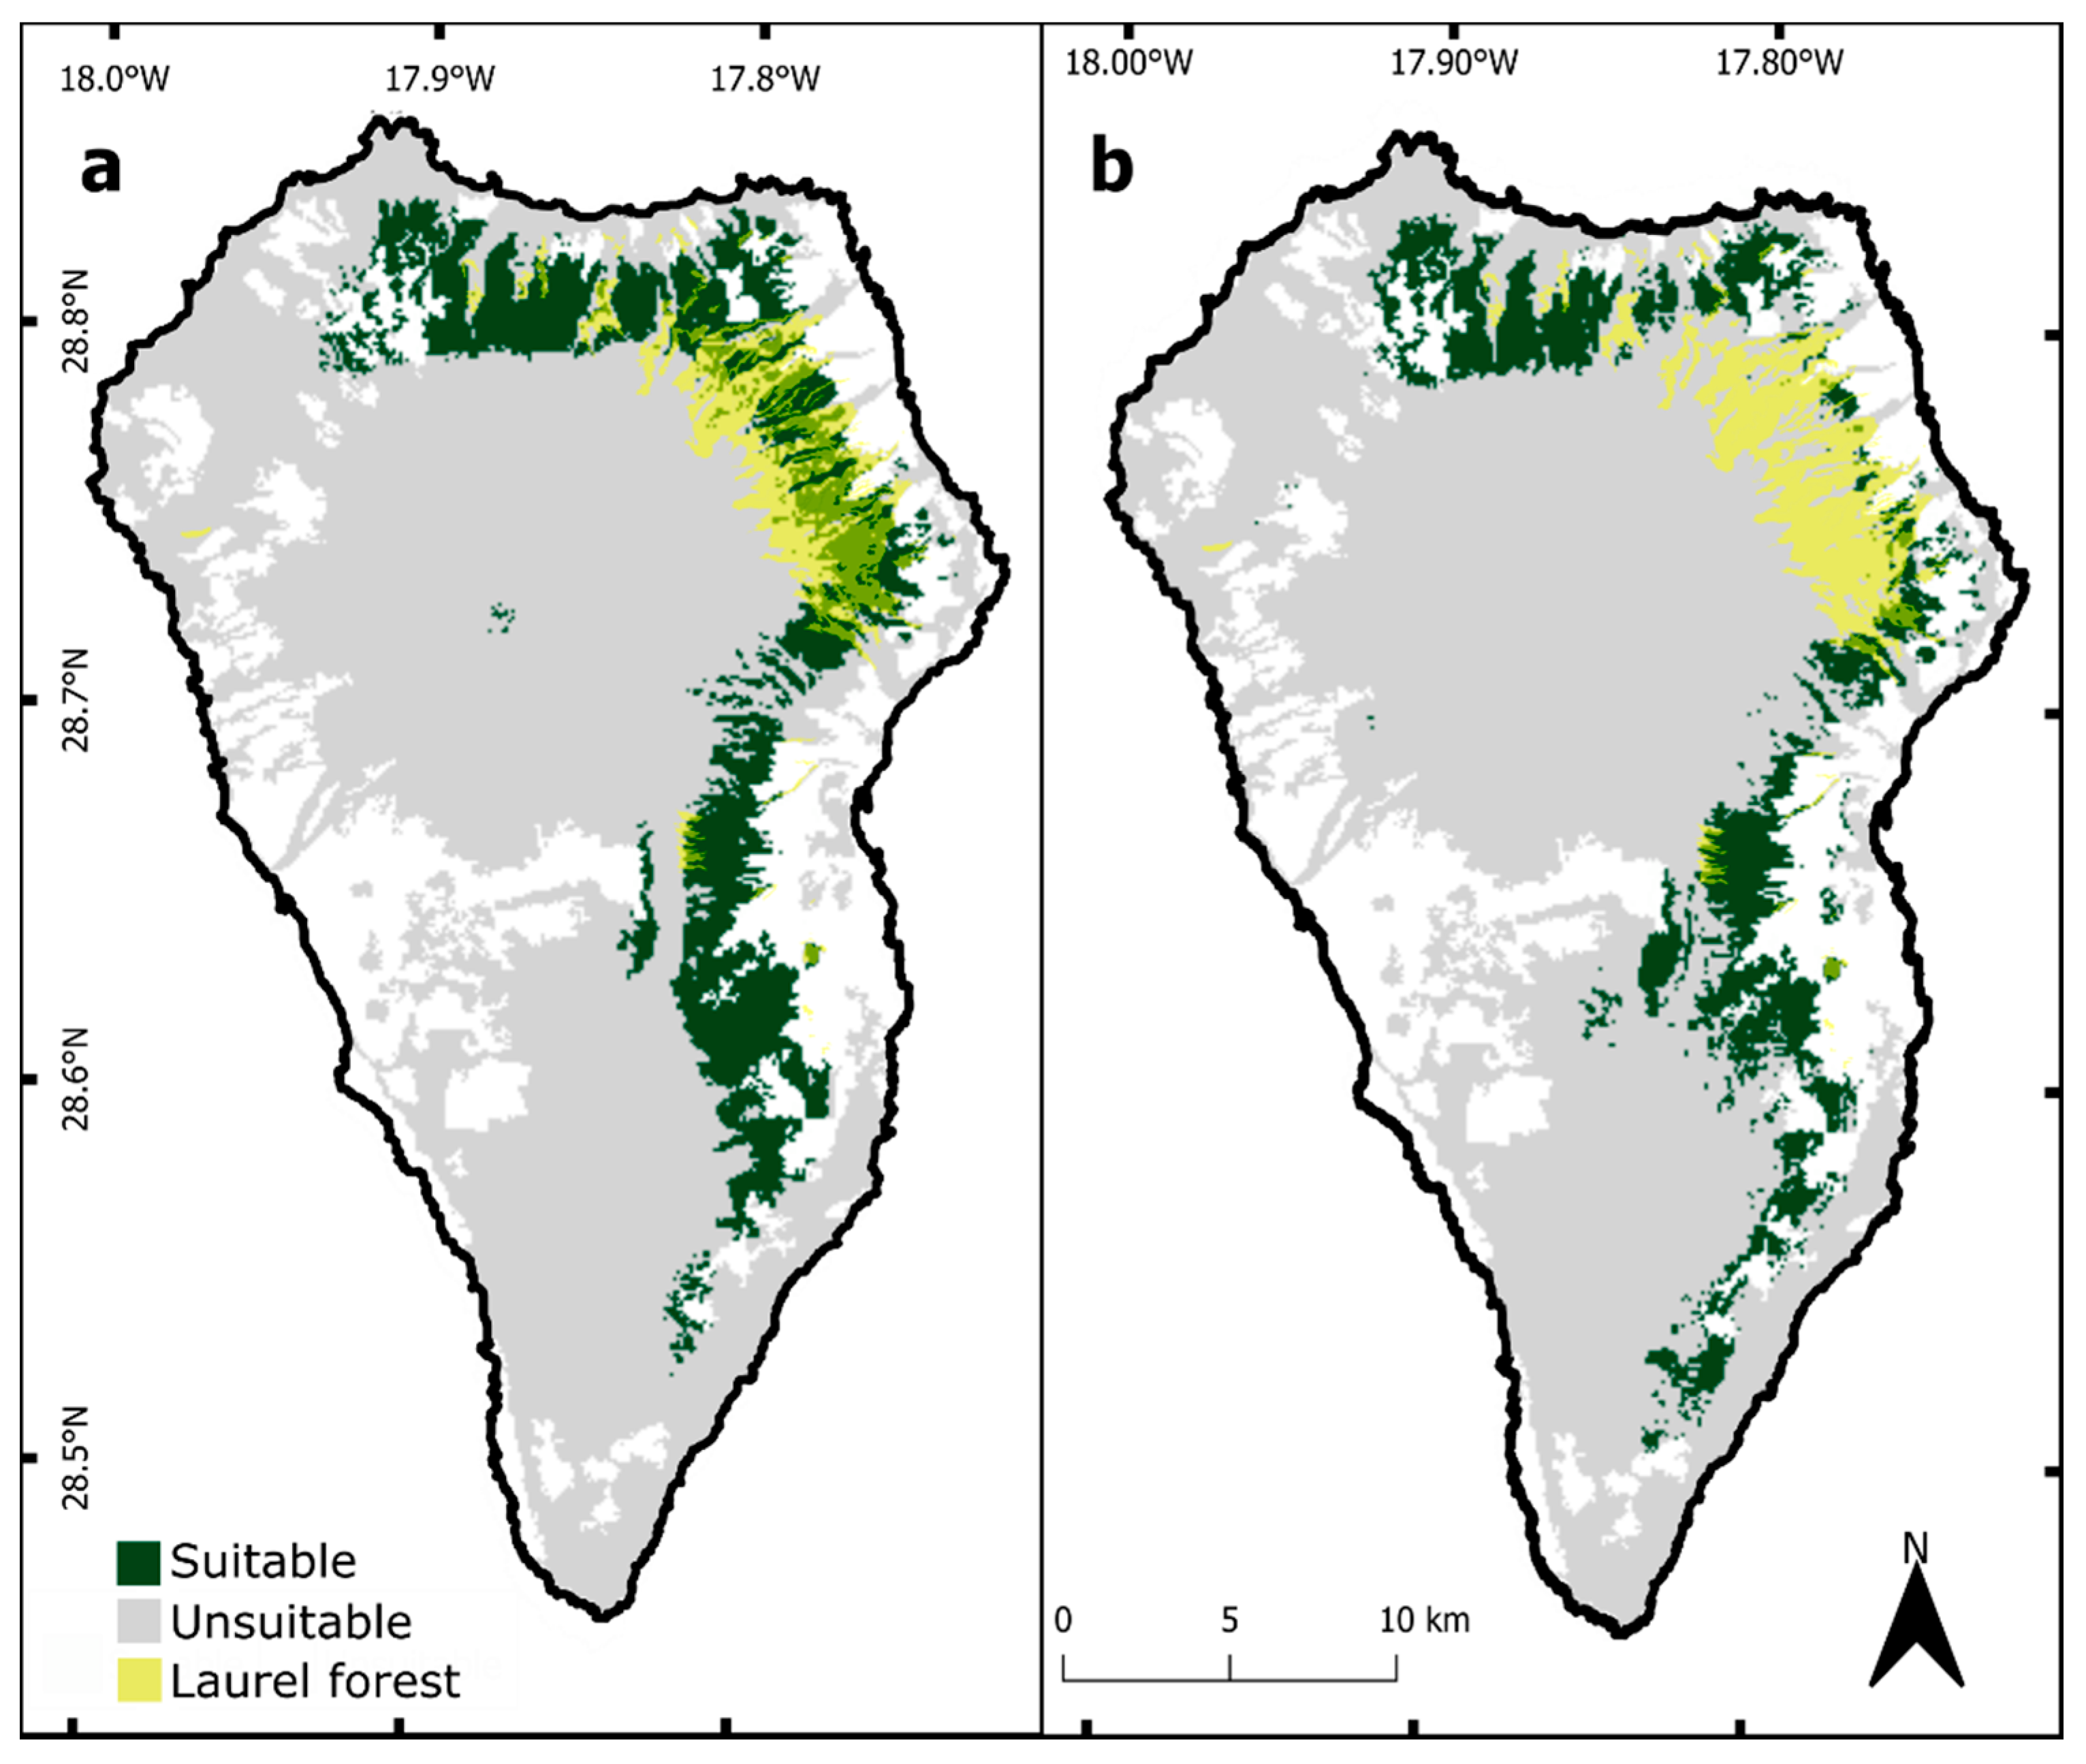
3.2. Ecological Niche Modelling

All ENMs showed that habitats in the eastern and northern parts of the island—including the areas of present distribution—were more suitable for C. sativa (Figure 7 and Figure 8, Appendix F and Appendix H for single model results). The ENMs based on species occurrences from field observation and the ENMs based on species occurrences from RS data were found to have very good AUC and TSS scores (Table 2 and Appendix I). The ENMs based on the RS data (Figure 7b and Figure 8b) predicted larger suitable area for C. sativa compared to the prediction made by the models based on the field-collected species occurrence data (Figure 7a and Figure 8a). However, the models based on the field-collected species occurrences seemed to cover more heterogeneous areas, even tough the total suitable area for the species was predicted to be less in the field-collected species occurrence-based models.

4. Discussion

This study assesses the current and potential distribution of non-native C. sativa, invading the endemic species-rich ecosystems of La Palma. The establishment of deciduous chestnut (C. sativa) on La Palma and its spread into the native laurel forest has the potential to initiate a secondary succession that may change the evergreen broadleaved forest towards a different ecosystem in terms of phenology and light regime. C. sativa was introduced on the island approximately 500 years ago for agricultural purposes [21]. Extremely steep and unstable slopes restrict access to the sites. Further, only estimating the current distribution of the alien species would be problematic because the current situation is just a snapshot of the potential occupied space and ecological niche on the island [64]. Therefore, it is important to combine in-situ and RS data with modelling approaches.
We found through this combined methodology that deciduous chestnut trees and forest today occupy approximately 1.2% of the total area of natural ecosystems (i.e., non-agricultural and excluding infrastructure and settlements) on La Palma, with a further 12–17% representing suitable habitat that is not yet occupied by this species. This is important because this non-native deciduous tree species can reach high canopy cover and has the potential to strongly modify the species composition of the original evergreen forest ecosystems, as well as the nature of the ecosystem (e.g., leafless in winter) and the services it provides. Comparing the current spatial distribution of C. sativa in La Palma obtained from RS and the results obtained from ENMs, we can see that C. sativa has not yet reached its full potential distribution on La Palma. Our results show varying areas of available suitable habitats for C. sativa that could be occupied in the future, depending on the reference data and modelling algorithm. However, in all cases, there is a considerable overlap of the species’ niche with the distribution of the native laurel forest ecosystem in the eastern and northern slopes of the island.
Despite their southern location, the Canary Islands are clearly part of the Holarctic realm. Most of the plant families native to the islands are very abundant across the Mediterranean. In addition, the ecosystems of the archipelago are strongly linked to Mediterranean climate and ecosystems through their evolutionary history and phylogenetic relations. Although the Macaronesian islands have many endemic species, the perennial and woody taxa that shape the islands’ forest and shrubland ecosystems are either shared with the Mediterranean region of Europe (native non-endemics on the Canaries) or in the case of endemic species have their closest relatives there, and not in the Palaeotropcis (e.g., Laurus, Viburnum, Prunus, Pistacia, Olea, Arbutus, Asparagus, Cistus, Echium, Carlina, Genista, Helianthemum, Hypericum, Lavandula, Micromeria, Ononis, Rhamnus, Rubia, Ruscus, Salvia, Sideritis, Smilax, Sonchus, Thesium). Several native ferns of the laurel forest are also abundant in moist forests of the Mediterranean (e.g., Asplenium hemionitis, Selaginella denticulata, Adiantum capillus-veneris, Polystichum setiferum, Woodwardia radicans). Sub-Mediterranean species such as C. sativa find adequate climatic conditions mainly at mid-elevation of the volcanic mountains on those islands that exhibit a pronounced topography.
Habitat suitability is calculated by models that are based either on in situ data or on RS data. Our study combines a slightly modified change detection technique with machine learning supervised classification algorithms. The change detection technique is especially suitable for invasive plant species detection if the species exhibits clear phenological changes compared to native vegetation through time, as shown by the detection of glossy buckthorn (Frangula alnus Mill.) spreading into forests of southern Quebec, Canada, by applying a linear temporal unmixing model to a time series of the normalized difference vegetation index (NDVI) derived from Landsat 8 Operational Land Imager (OLI) [65]. The RS-based C. sativa spatial distribution assessments yielded differences in spatial coverage, with the area estimated by Landsat 8 slightly higher than that estimated by Sentinel-2. The variation in the image resolutions between two sensors may be one of the reasons for greater spatial coverage estimated from the Landsat imagery. As Landsat 8 images have a spatial resolution of 30 m and Sentinel-2 images (used in this study) have a spatial resolution of 10 m, one pixel of Landsat 8 is equivalent to 9 pixels of Sentinel-2.
Smaller spatial extent of C. sativa area extracted from Sentinel-2 compared to Landsat 8 translated into less modelled spatial coverage based on Sentinel-2 compared to Landsat 8. Both sensitivity and grain size in spatial resolution can lead to such findings. Image quality, especially in a heterogeneous environment where plant species cannot easily be discerned, may result in spectral mixing [66], which is poorly represented by a low-spatial-resolution image. Thus, with lower spatial resolution, classification accuracy tends to decrease [67]. However, this relationship can reverse when using very high spatial resolution imagery [68]. Furthermore, residual yet marginal cloud coverage on the image from 7 March 2017, could have influenced the performance of the Landsat 8 scene.
The survival of C. sativa across the heterogeneous environment in La Palma suggests that the species shows high adaptive ability. We find that the moist and humid regions with broad-leaved trees, shrubs, and herbs are most suitable for the species. Similarly, Ríos-Mesa et al. [21] stated that on Tenerife, C. sativa is more dominant in the regions where trade winds humidify the area.
Ecological theory suggests that species-rich ecosystems can be more resistant to invasion [69,70,71]. Since many niches are not occupied on islands, it is expected that more species will naturalize in the future [72]. Such an increasing saturation of species richness could enhance the functioning of ecosystems [73]. However, individual alien species may also modify important ecosystem functions, causing negative effects even centuries after their establishment when replacing other key species such as dominant plant functional types [13].
The replacement of one dominating plant functional type by another can particularly affect sensitive ecosystems on very steep slopes in a humid zone. The natural stability of the laurel forest on these slopes is astounding and results from its species diversity and the clonal root systems of the contributing tree species in combination with their evergreen foliage [44]. A regime shift away from long-lived, clonal evergreen trees can create new risks for the human population downslope through altered run-off, erosion and landslide potential. The respective loss of diversity caused by an invading species also affects ecosystem stability [70].
The development of a forest with deciduous canopy in contrast to the native evergreen forest is creating a novel ecosystem in the Canary Islands, where such ecosystems did not exist before. The emergence of novel ecosystems with altered species composition, structure, and functioning [74] is a common phenomenon worldwide. Such substantial changes are in the first instance linked with uncertainty because expert knowledge on such novel systems does not exist. The lost system may also matter. Functional traits, structures, phenology, and biodiversity can be assessed for newly emerging ecosystems and compared to the replaced ones. In the case of the alien deciduous chestnut forest on the Canary Islands, a highly diverse and evergreen forest is replaced by monodominant stands with seasonal foliage. Consequences for species loss, erosion control, landslide threat, and carbon sequestration are to be expected and require further monitoring [13].
Here we used open-access RS data, which come at the expense of relatively coarse spatial and spectral resolutions. We could, nevertheless, achieve a very high detection accuracy because the application of multi-date RS data made it possible to effectively resolve the phenological differences of deciduous C. sativa in this particular study system. When such clear spectral differences are known, expensive very-high-resolution RS data are not required to detect invasive species, even though most studies recommend such RS data for high accuracy. For example, multispectral Quickbird data including 4 bands and a spatial resolution of 2.4 m were used to map invasive Tamarix species along the Colorado River [75]. However, commission errors were still high due to the relatively coarse spectral resolution. Another comparison revealed that AISA hyperspectral imagery is more effective than Quickbird in identifying invasive individuals [76]. Müllerová et al. [77] investigated the effectiveness of panchromatic, multispectral, and colour very high spatial resolution aerial photography (resolution 0.5 m) and medium spatial resolution satellite data (Rapid Eye, resolution 5 m) in monitoring the noxious invasive giant hogweed (Heracleum mantegazzianum Sommer & Levier) using pixel- and object-based image analysis. The authors found that object-based analysis of aerial 0.5 m resolution data during the flowering period resulted in high detection accuracy, while pixel-based analysis of 5 m resolution satellite data achieved moderate accuracy. Underwood et al. [78] detected iceplant (Carpobrotus edulis L.) and jubata grass (Cortaderia jubata Lemoine ex Carriere) in Mediterranean-type ecosystems of California using Airborne Visible and Infrared Imaging Spectrometer (AVIRIS) imagery with 4 m resolution. These RS data were particularly useful because both invasive species could be distinguished from co-occurring species by leaf water content. Downy brome (Bromus tectorum L.) was mapped in semi-arid rangeland ecosystems of Washington state, USA, using AVIRIS imagery with 4 m [79]. The authors compared the detection accuracy from single-date and multi-date AVIRIS data applying a filtering algorithm for image classification. The accuracy was higher for multitemporal RS data that could resolve phenological differences through time. In terms of the effectiveness of multitemporal RS data, Hestir et al. [80] and Evangelista et al. [31] show that omission errors for mapping phenologically different and invasive plant species depend strongly on acquisition dates of RS images. Interestingly, in the Great Basin, B. tectorum could only be detected with very low accuracy (35%) using multitemporal data from Landsat MSS, TM, and ETM+, which are spaceborne sensors with relatively low spectral and spatial resolution [81]. However, the invasive shrubs Frangula alnus Mill. and Rhamnus cathartica L. were sufficiently mapped in Ohio and Michigan States, USA, by applying multitemporal Landsat TM and ETM+ satellite images [82]. In addition, airborne LiDAR and hyperspectral sensors are commonly used in precision agriculture and forestry to map crop quality, weeds, and pests [83], and thermal spectrometers have also proven to be very advantageous for detecting invasive plant species [84]. In view of all these examples, it remains challenging to select the appropriate RS data, particularly concerning the temporal, spatial and spectral resolution, to efficiently detect invasive plant species among native vegetation [30]. However, given the inaccessibility and high costs of very-high-resolution RS data, free and open-access RS data should be promoted in research and conservation when they are appropriate. Here we prove the effectiveness of open-access RS data for invasion science and management despite relatively coarse spatial, temporal, and spectral resolution of RS data.
Ensemble models perform better than single models in predicting invasive plant species’ habitat suitability [85]. Nevertheless, using correlative models such as ENMs to predict the potential distribution of invasive species can be problematic because invasive species can establish in environmental niches that are new or very restricted compared to their native range [86]. Moreover, our models do not address the question of community saturation, i.e., to what degree environmental drivers limit species richness, composition and invasion of communities [73]. Moreover, the choice of environmental predictors drives the explanation of distributions [30]. The prediction success additionally depends on the frequency of test occurrences that makes prediction success a potentially biased estimator of model performance [61]. Hence, invasives’ distributions in non-native ranges may be severely under- or overestimated by ENMs. However, such predictions are often the only reasonable way to guide conservationists to potential areas of invasion [87,88]. Range expansions of invasive species can happen rapidly due to changes in the species’ invasibility or environmental factors such as land use and climate change [89]. Consequently, models based on species occurrence points should be interpreted as risk of species establishment, not species abundance, or impact [90].
Correlative model predictions involving abiotic factors only are also criticized because real invasion processes such as interspecific competition are ignored [91]. Mechanistic or process-based models may thus perform better than correlative models. However, process-based models require greater understanding of the invasion process than is usually available. Notably, biological mechanisms can be revealed by RS approaches. Asner et al. [33] revealed climate interactions promoting the invasive evergreen tree M. faya spreading into Hawaiian rainforest by analysing a time series of EO-1 Hyperion satellite data only. Once mechanistic models are applied, their performance can be validated by species distribution data directly derived from RS [30].
Detection accuracy depends not only on RS data and modelling approaches but also on algorithms applied for image classification. In Mediterranean forests, spaceborne QuickBird and airborne ADS40-SH52 imagery was combined to identify individual trees of the Iberian wild pear (Pyrus bourgaeana Decne.) [67]. Applying maximum likelihood approach and support vector machines on a pixel-by-pixel basis yielded different results depending on the combination of RS data and classification algorithms. Müllerová et al. [77] conclude that object-based analysis of aerial photography with 0.5 m resolution taken during the flowering period resulted in high detection accuracy, while pixel-based analysis of 5 m resolution Rapid Eye data achieved moderate accuracy in monitoring the noxious invasive giant hogweed (H. mantegazzianum).
The spectral signatures of species change through time due to biochemical, physiological, phenological, and environmental factors [92]. This variation of spectra limits the transferability of the relationships between spectral signatures, species, and environments to other study systems. Consequently, we recommend adapting our methodological approach individually to other systems.

5. Conclusions

This study identifies the probability of invasion of the introduced C. sativa, with particular focus on the laurel forest ecosystems of the island of La Palma, Canary Islands, Spain. Even if the spread of this deciduous tree species has been slow until now, major uncertainties arise from the fact that represents a plant functional type different from the zonal vegetation. Only two, rare native deciduous tree species can be found naturally (Salix pedicellata subsp. canariensis (C. Sm. ex Link) A. K. Skvortsov; Sambucus palmensis Link), along semi-permanent brooks and streams. However, these native deciduous species play no role in the natural evergreen forest ecosystems of the island.
The projected potential for the replacement of an evergreen broadleaved laurel forest rich in endemic tree species by a deciduous broadleaved forest formed by one introduced tree species does not inform about the speed of such processes. Inertia in long-lived tree species that can sprout from their rootstock is likely to avoid a rapid transition. However, a very resilient and stable ecosystem could be replaced by a less resilient and less stable one with only seasonal leaf cover and low species diversity. The steep and moist slopes of the island limit the accessibility in the field. We therefore recommend monitoring the future spread of C. sativa using RS approaches, as herein.
Our findings can be applied to other islands of the archipelago, where comparable climatic conditions are found and the characteristic laurel forest occurs, i.e., El Hierro, La Gomera, Tenerife, and Gran Canaria. For these islands, our findings provide an early warning to generate awareness of possible invasion processes and to start proactive measures to avoid invasion into unique, valuable, and remnant laurel forests. Our results can also be transferred to the islands of Madeira and the Azores, where climatic conditions are very likely even more appropriate for C. sativa. In the case of the Azores, the laurel forest is almost completely replaced by conifer plantations and other invasive species (e.g., Pittosporum undulatum Vent., Hedychium gardnerianum Sheppard ex Ker Gawl.) This makes the preservation of the Canary Island laurel forest an even more important priority in the international context.

Author Contributions

Conceptualization, C.B. and A.J.; methodology, C.B., R.F., and R.S.D.; validation, R.S.D., A.W., S.H., and F.W.; data curation, R.S.D. and C.B.; writing R.S.D., C.B., R.F., S.H., and A.W.; review and editing, A.C., O.R.V., S.H., F.M.M., R.F., and A.J.; visualization, R.S.D. and A.W.; supervision, C.B.; project administration, C.B.; funding acquisition, C.B. All authors have read and agreed to the published version of the manuscript.

Funding

This research was funded by the European H2020 Project ECOPOTENTIAL, grant agreement No. 641762.

Acknowledgments

This work was supported by the European H2020 Project ECOPOTENTIAL, grant agreement No. 641762. We thank Reinhold Stahlmann for his support in all questions related to spatial data.

Conflicts of Interest

The authors declare no conflict of interest.

Appendix A

Table A1. Satellite images used in the study.
SensorScene Id
Landsat 8LC082080402017072901T1-SC20190612132658
Landsat 8LC082080402017030701T1-SC20190128221754
Landsat 8LC082080402017020301T1-SC20190612132509
Sentinel-2S2A_MSIL2A_20180708T120331_N0208_R023_T28RBS_20180708T141805
Sentinel-2S2A_MSIL2A_20190213T120321_N0211_R023_T28RBS_20190213T172742

Appendix B

Table A2. Total number of training and testing data used in Random Forest classification.
SensorData
TrainingTesting
Sentinel-210150143499
Landsat 8115574952

Appendix C

Figure A1. Species occurrence locations recorded from field and species occurrence locations used in Ecological niche modellings (ENMs) with two cut-out sections for details.
Remotesensing 12 04013 g0a1

Appendix D

Figure A2. Pearson correlation coefficients of environmental raster used in ecological niche modelling (ENM).
Remotesensing 12 04013 g0a2
Figure A3. Pearson correlation coefficients of environmental raster used in ecological niche modelling (ENM).
Remotesensing 12 04013 g0a3

Appendix E

Figure A4. Environmental raster used in ecological niche modelling (ENM); Data surfaces are modified from data published in Irl et al., 2015.
Remotesensing 12 04013 g0a4

Appendix F

Figure A5. C. sativa habitat suitability maps (a) from the Random Forest (RF) field-collected species occurrence locations, (b) from the (RF) based on the remote sensing (RS) species occurrence locations, (c) from the Generalized Additive Linear Model (GAM) based on the RS species occurrence locations and (d) from the Maximum Entropy (MaxEnt) Model based on the RS species occurrence locations.
Remotesensing 12 04013 g0a5

Appendix G

Figure A6. The initial model evaluation for the models from the RS data. Among the 120 models, the models which have True Skill Statistics and Area Under ROC scores greater than 0.7 and 0.8 respectively were only considered in habitat suitability modelling.
Remotesensing 12 04013 g0a6
Figure A7. The initial model evaluation for the models from the Field data. Among the 120 models, the models which have True Skill Statistics and Area Under ROC scores greater than 0.7 and 0.8 respectively were only considered in habitat suitability modelling.
Remotesensing 12 04013 g0a7

Appendix H

Figure A8. C. sativa presence absence maps (a) from the Random Forest (RF) field-collected species occurrence locations, (b) from the Random Forest (RF) based on the RS species occurrence locations, (c) from the Generalized Additive Linear Model (GAM) based on the remote sensing (RS) species occurrence locations and (d) from the Maximum Entropy (MaxEnt) Model based on the RS species occurrence locations.
Remotesensing 12 04013 g0a8

Appendix I

Table A3. Ecological niche modelling performances. The GAM and MaxEnt rows for the Field columns are NA because the TSS and AUC from these were less than 0.7 and 0.8 so we excluded these models from the analysis.
ModelParameters
AUCThresholdTSS
FieldRSFieldRSFieldRS
EM0.9820.961564.833634.4170.8850.805
GAMNA0.943NA572.540NA0.789
RF0.9820.968570.875675.6250.8810.811
MaxEntNA0.928NA634.167NA0.730

References

  1. Kier, G.; Kreft, H.; Lee, T.M.; Jetz, W.; Ibisch, P.L.; Nowicki, C.; Mutke, J.; Barthlott, W. A global assessment of endemism and species richness across island and mainland regions. Proc. Natl. Acad. Sci. USA 2009, 106, 9322–9327. [Google Scholar] [CrossRef] [Green Version]
  2. Kreft, H.; Jetz, W.; Mutke, J.; Kier, G.; Barthlott, W. Global diversity of island floras from a macroecological perspective. Ecol. Lett. 2008, 11, 116–127. [Google Scholar] [CrossRef] [PubMed]
  3. Irl, S.; Schweiger, A.; Medina, F.M.; Fernández-Palacios, J.M.; Harter, D.; Jentsch, A.; Provenzale, A.; Steinbauer, M.J.; Beierkuhnlein, C. An island view of endemic rarity–environmental drivers and consequences for nature conservation. Divers. Distrib. 2017, 23, 1132–1142. [Google Scholar] [CrossRef] [Green Version]
  4. Losos, J.B.; Ricklefs, R.E. Adaptation and diversification on islands. Nature 2009, 457, 830–836. [Google Scholar] [CrossRef] [PubMed]
  5. Jentsch, A.; White, P.S. A Theory of pulse dynamics and disturbance in ecology. Ecology 2019, 100, e02734. [Google Scholar] [CrossRef]
  6. Nürk, M.N.; Linder, H.P.; Onstein, R.E.; Marcombe, M.J.; Hughes, C.E.; Pineiro Fernandez, L.; Schlüter, P.M.; Valente, L.M.; Beierkuhnlein, C.; Cutts, V.; et al. Diversification in evolutionary arenas—Assessment and synthesis. Ecol. Evol. 2020, 10, 6163–6182. [Google Scholar] [CrossRef]
  7. Fernández-Palacios, J.M.; Whittaker, R.J. The Canaries. An important biogeographical meeting place. J. Biogeogr. 2008, 35, 379–387. [Google Scholar] [CrossRef]
  8. MEA. Ecosystems and Human Well-Beings: Synthesis; Island Press: Washington, DC, USA, 2005. [Google Scholar]
  9. Pyšek, P.; Jarosik, V.; Hulme, P.E.; Hejda, M.; Schaffner, U.; Vila, M.A. Global assessment of invasive plant impacts on resident species, communities and ecosystems: The interaction of impact measures, invading species traits and environment. Glob. Chang. Biol. 2011, 18, 1725–1737. [Google Scholar] [CrossRef]
  10. IPBES. Summary for Policymakers of the Global Assessment Report on Biodiversity and Ecosystem Services of the Intergovernmental Science-Policy Platform on Biodiversity and Ecosystem Services: Intergovernmental Science-Policy Platform on Biodiversity and Ecosystem Services (Seventh Conference). 2019. Available online: https://www.ipbes.net/system/tdf/ipbes_7_10_add.1_en_1.pdf?file=1&type=node&id=35329 (accessed on 15 September 2020).
  11. Pyšek, P.; Hulme, P.E.; Simberloff, D.; Bacher, S.; Blackburn, T.M.; Carlton, J.T.; Dawson, W.; Essl, F.; Foxcroft, L.C.; Genovesi, P.; et al. Scientists’ warning on invasive alien species. Biol. Rev. Camb. Philos. Soc. 2020, 95, 1511–1534. [Google Scholar] [CrossRef]
  12. Mack, R.N.; Simberloff, D.; Lonsdale, W.M.; Evans, H.; Clout, M.; Bazzaz, F.A. Biotic invasions: Causes, epidemiology, global consequences, and control. Ecol. Appl. 2000, 10, 689–710. [Google Scholar] [CrossRef]
  13. Kumar Rai, P.; Singh, J.S. Invasive alien plant species: Their impact on environment, ecosystem services and human health. Ecol. Indic. 2020, 111, 106020. [Google Scholar] [CrossRef] [PubMed]
  14. Marbuah, G.; Gren, I.-M.; McKie, B. Economics of harmful invasive species: A review. Diversity 2014, 6, 500–523. [Google Scholar] [CrossRef] [Green Version]
  15. Díaz, S.; Settele, J.; Brondízio, E.S.; Ngo, H.T.; Agard, J.; Arneth, A.; Balvanera, P.; Brauman, K.A.; Butchart, S.H.M.; Chan, K.M.A.; et al. Pervasive human-driven decline of life on earth points to the need for transformative change. Science 2019, 366, eaax3100. [Google Scholar] [CrossRef] [PubMed] [Green Version]
  16. Oumar, Z. Assessing the utility of the SPOT 6 sensor in detecting and mapping Lantana camara for a community clearing project in KwaZulu-Natal, South Africa. South Afr. J. Geomat. 2016, 5, 214–226. [Google Scholar] [CrossRef] [Green Version]
  17. Tarantino, C.; Casella, F.; Adamo, M.; Lucas, R.; Beierkuhnlein, C.; Blonda, P. Ailanthus altissima mapping from multi-temporal very high resolution satellite images. J. Photogramm. Remote Sens. 2019, 147, 90–103. [Google Scholar] [CrossRef]
  18. Weber, E. Invasive Plant Species of the World: A Reference Guide to Environmental Weeds; CAB International Publishing: Wallingford, UK, 2003. [Google Scholar]
  19. Richardson, D.M.; Rejmánek, M. Conifers as invasive aliens: A global survey and predictive framework. Divers. Distrib. 2004, 10, 321–331. [Google Scholar] [CrossRef]
  20. Conedera, M.; Krebs, P.; Tinner, W.; Pradella, M.; Torriani, D. The cultivation of Castanea sativa (Mill.) in Europe, form its origin to its diffusion on a continental scale. Veg. Hist. Archaeobotany 2004, 13, 161–179. [Google Scholar] [CrossRef] [Green Version]
  21. Ríos-Mesa, D.; Pereira-Lorenzo, S.; González-Díaz, A.; Hernádez-González, J.; González-Diaz, E.; Saúco, V.G. The status of Chestnut cultivation and utilization in the Canary Islands. Adv. Hortic. Sci. 2011, 25, 90–98. [Google Scholar]
  22. Campbell, J.B.; Wynne, H.R. Introduction to Remote Sensing, 5th ed.; The Guilford Press: New York, NY, USA, 2011. [Google Scholar]
  23. Cohen, W.B.; Goward, S.N. Landsat’s role in ecological applications of remote sensing. BioScience 2004, 54, 535–545. [Google Scholar] [CrossRef]
  24. Kerr, J.T.; Ostrovsky, M. From space to species: Ecological applications for remote sensing. Trends Ecol. Evol. 2003, 18, 299–305. [Google Scholar] [CrossRef]
  25. Matongera, T.N.; Mutanga, O.; Dube, T.; Mbulisi, S. Detection and mapping the spatial distribution of bracken fern weeds using the Landsat 8 OLI new generation sensor. Int. J. Appl. Earth Obs. Geoinf. 2017, 57, 93–103. [Google Scholar] [CrossRef]
  26. Hoffmann, S.; Schmitt, T.M.; Chiarucci, A.; Irl, S.D.H.; Rocchini, D.; Vetaas, O.R.; Tasase, M.A.; Mermoz, S.; Bouvet, A.; Beierkuhnlein, C. Remote sensing of β-diversity: Evidence from plant communities in a semi-natural system. Appl. Veg. Sci. 2019, 22, 13–26. [Google Scholar] [CrossRef] [Green Version]
  27. Vaz, A.S.; Alcaraz-Segura, D.; Vicente, J.R.; Honrado, J.P. The many roles of remote sensing in invasion science. Front. Ecol. Evol. 2019, 7, 370. [Google Scholar] [CrossRef] [Green Version]
  28. Bolch, E.A.; Santos, M.J.; Ade, C.; Khanna, S.; Basinger, N.T.; Reader, M.O.; Hestir, E.L. Remote detection of invasive alien species. In Remote Sensing of Plant Biodiversity; Cavender-Bares, J., Gamon, J., Townsend, P., Eds.; Springer: Cham, Germany, 2020; pp. 267–307. [Google Scholar]
  29. Huang, C.Y.; Asner, G.P. Applications of remote sensing to alien invasive plant studies. Sensors 2009, 9, 4869–4889. [Google Scholar] [CrossRef] [Green Version]
  30. Rocchini, D.; Andreo, V.; Förster, M.; Garzon-Lopez, C.X.; Gutierrez, A.P.; Gillespie, T.W.; Hauffe, H.C.; He, K.S.; Kleinschmit, B.; Mairota, P.; et al. Potential of remote sensing to predict species invasions. Prog. Phys. Geogr. Earth Environ. 2015, 39, 283–309. [Google Scholar] [CrossRef] [Green Version]
  31. Evangelista, P.H.; Stohlgren, T.J.; Morisette, J.T.; Kumar, S. Mapping invasive Tamarisk (Tamarix): A comparison of single-scene and time-series analyses of remotely sensed data. Remote Sens. 2009, 1, 519–533. [Google Scholar] [CrossRef] [Green Version]
  32. Glenn, N.F.; Mundt, J.T.; Weber, K.T.; Prather, T.S.; Lass, L.W.; Pettingill, J. Hyperspectral data processing for repeat detection of small infestations of leafy spurge. Remote Sens. Environ. 2005, 95, 399–412. [Google Scholar] [CrossRef]
  33. Asner, G.P.; Martin, R.E.; Carlson, K.M.; Rascher, U.; Vitousek, P.M. Vegetation–climate interactions among native and invasive species in Hawaiian rainforest. Ecosystems 2006, 9, 1106–1117. [Google Scholar] [CrossRef]
  34. He, K.S.; Rocchini, D.; Neteler, M.; Nagendra, H. Benefits of hyperspectral remote sensing for tracking plant invasions. Divers. Distrib. 2011, 17, 381–392. [Google Scholar] [CrossRef]
  35. Vicente, J.R.; Alagador, D.; Guerra, C.; Alonso, J.M.; Kueffer, C.; Vaz, A.S.; Fernandes, R.F.; Cabral, J.A.; Araújo, M.B.; Honrado, J.P. Cost-effective monitoring of biological invasions under global change: A model-based framework. J. Appl. Ecol. 2016, 53, 1317–1329. [Google Scholar] [CrossRef]
  36. Franklin, J. Mapping Species Distributions; Cambridge University Press: Cambridge, UK, 2010. [Google Scholar]
  37. Andrew, M.E.; Ustin, S.L. Spectral and physiological uniqueness of perennial pepperweed (Lepidium latifolium). Weed Sci. 2006, 54, 1051–1062. [Google Scholar] [CrossRef]
  38. Le Louarn, M.; Clergeau, P.; Briche, E.; Deschamps-Cottin, M. “Kill Two Birds with One Stone”: Urban tree species classification using bi-temporal Pléiades images to study nesting preferences of an invasive bird. Remote Sens. 2017, 9, 916. [Google Scholar] [CrossRef] [Green Version]
  39. Singh, A. Review article digital change detection techniques using remotely sensed data. Int. J. Remote Sens. 1989, 10, 989–1003. [Google Scholar] [CrossRef] [Green Version]
  40. Breiman, L. Random forests. Mach. Learn. 2001, 45, 5–32. [Google Scholar] [CrossRef] [Green Version]
  41. Mai, D.H. Development and regional differentiation of the European vegetation during the Tertiary. In Woody Plants—Evolution and Distribution since the Tertiary; Ehrendorfer, F., Ed.; Springer: Vienna, Austria, 1989. [Google Scholar] [CrossRef]
  42. Kondraskov, P.; Schütz, N.; Schüßler, C.; De Sequeira, M.M.; Guerra, A.S.; Caujapé-Castells, J.; Jaén-Molina, R.; Marrero-Rodríguez, Á.; Koch, M.A.; Linder, P.; et al. Biogeography of Mediterranean Hotspot Biodiversity: Re-Evaluating the ’Tertiary Relict’ Hypothesis of Macaronesian Laurel Forests. PLoS ONE 2015, 10, e0132091. [Google Scholar] [CrossRef]
  43. Fernández-Palacios, J.M.; de Nascimento, L.; Otto, R.; Delgado, J.D.; García-del-Rey, E.; Arévalo, J.R.; Whittaker, R.J. A reconstruction of Palaeo-Macaronesia, with particular reference to the long-term biogeography of the Atlantic island laurel forests. J. Biogeogr. 2011, 38, 226–246. [Google Scholar] [CrossRef]
  44. Fernandez-Palacios, J.M.; Arevalo, J.R.; Balguerias, E.; Barone, R.; de Nascimento, L.; Delgado, J.D.; Elias, R.B.; Fernandez-Lugo, S.; Mendez, J.; de Sequeira, M.M.; et al. The Laurisilva Canaries, Madeira and Azores; Macaronesia Editorial: La Laguna, Spain, 2019. [Google Scholar]
  45. U.S. Geological Survey. Landsat Surface Reflectance Data; U.S. Geological Survey: Reston, VA, USA, 2015.
  46. SUHET Sentinel-2 User Handbook (Issue 1.2). Available online: https://sentinels.copernicus.eu/web/sentinel/user-guides/document-library/asset_publisher/xlslt4309D5h/content/sentinel-2-user-handbook (accessed on 5 April 2019).
  47. Leutner, B.; Horning, N.; Schwalb-Willmann, J. RStoolbox: Tools for Remote Sensing Data Analysis. R Package Version 0.2.6. 2019. Available online: https://CRAN.R-project.org/package=RStoolbox (accessed on 15 September 2020).
  48. Devi, R.N.; Jiji, D.G. Change detection techniques–A survey. Int. J. Comput. Sci. Eng. 2015, 5, 45–57. [Google Scholar] [CrossRef]
  49. Tian, S.; Zhang, X.; Tian, J.; Sun, Q. Random forest classification of wetland landcovers from multi-sensor data in the arid region of Xinjiang, China. Remote Sens. 2016, 8, 954. [Google Scholar] [CrossRef] [Green Version]
  50. Kuhn, M. Caret: Classification and Regression Training. R Package Version 6.0-86. 2020. Available online: https://CRAN.R-project.org/package=caret (accessed on 9 September 2020).
  51. Irl, S.D.H.; Harter, D.E.V.; Steinbauer, M.J.; Puyol, D.G.; Fernández-Palacios, J.M.; Jentsch, A.; Beierkuhnlein, C. Climate vs. topography–Spatial patterns of plant species diversity and endemism on a high-elevation island. J. Ecol. 2015, 103, 1621–1633. [Google Scholar] [CrossRef]
  52. Cabildo Insular de La Palma. Personal communication, 2019.
  53. R Core Team. R: A Language and Environment for Statistical Computing R Foundation for Statistical Computing, Vienna, Austria. 2020. Available online: https://www.R-project.org/ (accessed on 15 September 2020).
  54. Thuiller, W.; Georges, D.; Engler, R.; Breiner, F. biomod2: Ensemble Platform for Species Distribution Modeling. R Package Version 3.4.6. 2020. Available online: https://CRAN.R-project.org/package=biomod2 (accessed on 15 September 2020).
  55. Yee, T.W.; Mitchell, N.D. Generalized additive models in plant ecology. J. Veg. Sci. 1991, 2, 587–602. [Google Scholar] [CrossRef]
  56. Elith, J.; Graham, C.H.; Anderson, R.P.; Dudík, M.; Ferrier, S.; Guisan, A.; Hijmans, R.J.; Huettmann, F.; Leathwick, J.R.; Lehmann, A.; et al. Novel methods improve prediction of species’ distributions from occurrence data. Ecography 2006, 29, 129–151. [Google Scholar] [CrossRef] [Green Version]
  57. Phillis, S.J.; Anderson, R.P.; Schapire, R.E. Maximum entropy modeling of species geographic distributions. Ecol. Model. 2006, 190, 231–259. [Google Scholar] [CrossRef] [Green Version]
  58. Chalghaf, B.; Chemkhi, J.; Mayala, B.; Harrabi, M.; Benie, G.B.; Michael, E.; Salah, A.B. Ecological niche modeling predicting the potential distribution of Leishmania vectors in the Mediterranean basin: Impact of climate change. Parasites Vectors 2018, 11, 461. [Google Scholar] [CrossRef] [PubMed]
  59. Valvi, R.; Shafizadeh-Moghadam, H.; Matkan, A.; Shakiba, A.; Mirbagheri, B.; Kia, S.H. Modelling climate change effects on Zagros forests in Iran using individual and ensemble forecasting approaches. Theor. Appl. Climatol. 2019, 137, 1015–1025. [Google Scholar] [CrossRef]
  60. Aiello-Lammens, M.D.; Boria, R.A.; Radosavljevic, A.; Vilela, B.; Andrson, R.P. SpThin: An R package for spatial thinning of species occurrence records for use in ecological niche models. Ecography 2015, 38, 541–545. [Google Scholar] [CrossRef]
  61. Manel, S.; Williams, H.C.; Ormerod, S.J. Evaluating presence-absence models in ecology: The need to account for prevalence. J. Appl. Ecol. 2001, 38, 921–931. [Google Scholar] [CrossRef]
  62. Liu, C.; Berry, P.M.; Dawson, T.P.; Pearson, R.G. Selecting thresholds of occurrence in the prediction of species distributions. Ecography 2005, 28, 385–393. [Google Scholar] [CrossRef]
  63. Del Arco Aguilar, M.; Wildpret, W.; Pérez de Paz, P.L.; Rodríguez Delgado, O.; Acebes, J.R.; García Gallo, A.; Martín Osorio, V.E.; Reyes Betancort, A.; Salas, M.; Díaz, M.A.; et al. Vegetation Map of the Canary Islands; GRAFCAN: Santa Cruz de Tenerife, Spain, 2006. (In Spanish) [Google Scholar]
  64. Walentowitz, A.J.; Irl, S.D.H.; Acevedo Rodriguez, A.J.; Palomarez-Martinez, A.; Vetter, V.; Zennaro, B.; Medina, F.M.; Beierkuhnlein, C. Graminoid invasion in an insular endemism hotspot and its protected areas. Diversity 2019, 11, 192. [Google Scholar] [CrossRef] [Green Version]
  65. Labonté, J.; Drolet, G.; Sylvain, J.-D.; Thiffault, N.; Hébert, F.; Girard, F. Phenology-based mapping of an alien invasive species using time series of multispectral satellite data: A case-study with glossy buckthorn in Québec, Canada. Remote Sens. 2020, 12, 922. [Google Scholar] [CrossRef] [Green Version]
  66. Price, J.C. How unique are spectral signatures? Remote Sens. Environ. 1994, 49, 181–186. [Google Scholar] [CrossRef]
  67. Fisher, J.R.B.; Acosta, E.A.; Dennedy-Frank, P.J.; Kroeger, T.; Boucher, T.M. Impact of satellite imagery spatial resolution on land use classification accuracy and modeled water quality. Remote Sens. Ecol. Conserv. 2018, 4, 137–149. [Google Scholar] [CrossRef]
  68. Arenas-Castro, S.; Fernández-Haeger, J.; Jordano-Barbudo, D. Evaluation and comparison of QuickBird and ADS40-SH52 multispectral imagery for mapping Iberian wild pear trees (Pyrus bourgaeana, Decne) in a Mediterranean mixed forest. Forests 2014, 5, 1304–1330. [Google Scholar] [CrossRef]
  69. Kennedy, A.T.; Naeem, S.; Howe, K.M.; Knops, J.M.H.; David, T.M.; Peter, R. Biodiversity as a barrier to ecological invasion. Nature 2002, 417, 636–638. [Google Scholar] [CrossRef] [PubMed]
  70. Stachowicz, J.; Tilman, D. Species Invasions and the Relationships between Species Diversity, Community Saturation, and Ecosystem Functioning. In Species Invasions: Insights into Ecology, Evolution, and Biogeography; Sax, D.F., Stachowicz, J.J., Gaines, S.D., Eds.; Sinauer Associates: Sunderland, MA, USA, 2005; pp. 41–64. [Google Scholar]
  71. Mallon, C.A.; Poly, F.; Le Roux, X.; Marring, I.; van Elsas, J.D.; Salles, J.F. Resource pulses can alleviate the biodiversity–invasion relationship in soil microbial communities. Ecology 2015, 96, 915–926. [Google Scholar] [CrossRef] [PubMed] [Green Version]
  72. Sax, D.; Gaines, S.D. Species invasions and extinction: The future of native biodiversity on islands. Proc. Natl. Acad. Sci. USA 2005, 105 (Suppl. 1), 11490–11497. [Google Scholar] [CrossRef] [PubMed] [Green Version]
  73. Mateo, R.G.; Mokany, K.; Guisan, A. Biodiversity models: What if unsaturation is the rule? Trends Ecol. Evol. 2017, 32, 556–566. [Google Scholar] [CrossRef] [Green Version]
  74. Hobbs, R.J.; Higgs, E.; Harris, J.A. Novel ecosystems: Implications for conservation and restoration. Trends Ecol. Evol. 2009, 24, 599–605. [Google Scholar] [CrossRef]
  75. Carter, G.; Lucas, K.; Blossom, G.; Lassitter, C.; Holiday, D.; Mooneyhan, D.; Fastring, D.; Holcombe, T.; Griffith, J. Remote sensing and mapping of tamarisk along the Colorado River, USA: A comparative use of summer-acquired Hyperion, Thematic Mapper and QuickBird data. Remote Sens. 2009, 1, 318–329. [Google Scholar] [CrossRef] [Green Version]
  76. Wang, L. Invasive species spread mapping using multi-resolution remote sensing data. Int. Arch. Photogramm. Remote Sens. Spat. Inf. Sci. Beijing 2008, 37, 135–142. [Google Scholar]
  77. Müllerová, J.; Pergl, J.; Pyšek, P. Remote sensing as a tool for monitoring plant invasions: Testing the effects of data resolution and image classification approach on the detection of a model plant species Heracleum mantegazzianum (Giant Hogweed). Int. J. Appl. Earth Obs. Geoinformatics 2013, 25, 55–65. [Google Scholar] [CrossRef]
  78. Underwood, E.C.; Ustin, S.L.; Ramirez, C.M.A. Comparison of spatial and spectral image resolution for mapping invasive plants in coastal California. Environ. Manag. 2007, 39, 63–83. [Google Scholar] [CrossRef] [PubMed]
  79. Noujdina, N.V.; Ustin, S.L. Mapping downy brome (Bromus tectorum) using multidate AVIRIS data. Weed Sci. 2008, 56, 173–179. [Google Scholar] [CrossRef]
  80. Hestir, E.L.; Khanna, S.; Andrew, M.E.; Santos, M.J.; Viers, J.H.; Greenberg, J.A.; Rajapakse, S.S.; Ustin, S.L. Identification of invasive vegetation using hyperspectral remote sensing in the California delta ecosystem. Remote Sens. Environ. 2008, 112, 4034–4047. [Google Scholar] [CrossRef]
  81. Bradley, B.A.; Mustard, J.F. Characterizing the landscape dynamics of an invasive plant and risk of invasion using remote sensing. Ecol. Appl. 2006, 16, 1132–1147. [Google Scholar] [CrossRef] [Green Version]
  82. Becker, R.H.; Zmijewski, K.A.; Crail, T. Seeing the forest for the invasives: Mapping buckthorn in the oak openings. Biol. Invasions 2013, 15, 315–326. [Google Scholar] [CrossRef]
  83. Mulla, D.J. Twenty-five years of remote sensing in precision agriculture: Key advances and remaining knowledge gaps. Biosyst. Eng. 2013, 114, 358–371. [Google Scholar] [CrossRef]
  84. Ullah, S.; Schlerf, M.; Skidmore, A.K.; Hecker, C. Identifying plant species using mid-wave infrared (2.5–6 μm) and thermal infrared (8–14 μm) emissivity spectra. Remote Sens. Environ. 2012, 118, 95–102. [Google Scholar] [CrossRef]
  85. Stohlgren, T.J.; Ma, P.; Kumar, S.; Rocca, M.; Morisette, J.T.; Jarnevich, C.S.; Benson, N. Ensemble habitat mapping of invasive plant species. Risk Anal. 2010, 30, 224–235. [Google Scholar] [CrossRef]
  86. Guisan, A.; Thuiller, W. Predicting species distribution: Offering more than simple habitat models. Ecol. Lett. 2005, 8, 993–1009. [Google Scholar] [CrossRef]
  87. Zhu, L.; Sun, O.J.; Sang, W.; Li, Z.; Ma, K. Predicting the spatial distribution of an invasive plant species (Eupatorium adenophorum) in China. Landsc. Ecol. 2007, 22, 1143–1154. [Google Scholar] [CrossRef]
  88. Warren, D.L. In defense of ‘Niche Modeling’. Trends Ecol. Evol. 2012, 27, 497–500. [Google Scholar] [CrossRef] [PubMed]
  89. Dehnen-Schmutz, K.; Boivin, T.; Essl, F.; Groom, Q.J.; Harrison, L.; Touza, J.M.; Bayliss, H. Alien futures: What is on the horizon for biological invasions? Divers. Distrib. 2018, 24, 1149–1157. [Google Scholar] [CrossRef] [Green Version]
  90. Bradley, B.A. Distribution models of invasive plants over-estimate potential impact. Biol. Invasions 2013, 15, 1417–1429. [Google Scholar] [CrossRef]
  91. Gutierrez, A.P.; Ponti, L. Eradication of invasive species: Why the biology matters. Environ. Entomol. 2013, 42, 395–411. [Google Scholar] [CrossRef] [PubMed] [Green Version]
  92. Feilhauer, H.; Schmidtlein, S. On variable relations between vegetation patterns and canopy reflectance. Ecol. Inform. 2011, 6, 83–92. [Google Scholar] [CrossRef]
Figure 1. (a) Sentinel-2 true natural colour image of the study area (Red: band 4, Green: band 3, Blue: band 2). (bd) are Google satellite zooms of characteristic landscape units. Trees with yellow canopy in the boxes (bd) represent single trees, groups or patches of C. sativa.
Remotesensing 12 04013 g001
Figure 2. Changed pixels (proxy for leaf on/leaf off) between March 2017 and July 2017 in the Landsat 8 image obtained from the image regression and image differentiation, grayscale raster composite, red-NIR, red, green, each band with 1/3 saturation. Blue colour highlights changed pixels between those dates. Training polygons (red) are the training samples used to discriminate between changed and unchanged pixels. Settlements and other intensive human land-uses were cropped out (shown in white).
Remotesensing 12 04013 g002
Figure 3. Changed pixels (proxy for leaf on/leaf off) between July 2018 and February 2019 in the Sentinel-2 image obtained from the image regression and image differentiation, grayscale raster composite, red-NIR, red, green, each band with 1/3 saturation. Blue colour highlights changed pixels between those dates. Training polygons (red) are the training samples used to discriminate between changed and unchanged pixels. Settlements and other intensive human land-uses were cropped out (shown in white, excluded from study).
Remotesensing 12 04013 g003
Figure 4. C. sativa spatial coverage (blue) detected on (a) the Landsat 8 image and (b) Sentinel-2 image obtained from the Random Forest (RF) classifications. The classifications were carried out on the images obtained from the image regression and differentiation. ‘Forests and natural ecosystems’ (grey shading) are land cover not related to direct human land use. Settlement and agriculture (areas used for direct human purposes, including roads, buildings, agricultural lands, etc.) were cropped out and not included in the analysis.
Remotesensing 12 04013 g004
Figure 5. C. sativa spatial coverage in the images from the Landsat 8 and Sentinel-2 overlapping, Landsat 8 only, and Sentinel-2 only. Black are pixels where C. sativa was detected in both sensors’ images; orange are pixels where C. sativa was only detected in the Landsat 8 image; blue are pixels where C. sativa was only detected in the Sentinel -2 image. The spatial resolution of Landsat 8 is 30 m, and Sentinel-2 is 10 m. ‘Forests and natural ecosystems’ (grey shading) are areas not directly used for human purposes. Human settlements, infrastructure, and agriculture (white) were cropped out.
Remotesensing 12 04013 g005
Figure 6. Number of pixels associated with C. sativa detected from RS along the altitudinal gradient. Values along the y-axis are the total number of pixels covered by C. sativa and values along the x-axis are the elevational gradient of La Palma (in m a.s.l.). Blue: Landsat 8 only; orange: Sentinel 2 only; black: shared pixels of both Landsat 8 and Sentinel-2. The spatial resolution of Landsat 8 was disaggregated to 10 m for comparison purpose.
Remotesensing 12 04013 g006
Figure 7. C. sativa habitat suitability maps obtained from the ecological niche modelling (ENM) using ensemble models (EM). (a) The map obtained from the model based on field-collected species occurrence data. (b) The map obtained from the model based on the species occurrence data derived from remote sensing. The vertical legend on the bottom-left shows the degree of suitability; values closer to 1 indicate comparatively higher habitat suitability.
Remotesensing 12 04013 g007
Figure 8. C. sativa binary habitat suitability maps from (a) the ensemble model (EM) based on the field-collected species occurrence locations, and from (b) the EM based on RS-derived species occurrence locations. These maps are the outcomes of the binary transformation of the predicted maps from the respective models. The extent of the laurel forest (based on the plant communities defined by Del Arco Aguilar et al. [63]) is indicated as a yellow semi-transparent layer.
Remotesensing 12 04013 g008
Table 1. Statistical evaluation of Random Forest (RF) performance and map accuracy assessment. The overall accuracy and kappa were obtained from the testing data and the out-of-bag error (OOB) generated by RF of each of the model obtained from training data.
SensorsParameters
OOB Error %Overall Accuracy %Kappa
Landsat 81.2998.80.798
Sentinel-20.4499.50.878
Table 2. Statistical parameters of model performances, thresholds applied to convert maps resulted from each modelling approach to binary maps and area suitable for C. sativa. All the parameters are means of ensemble model outputs.
ModelParameters
AUCThresholdTSSArea (km2)
FieldRSFieldRSFieldRSFieldRS
EM0.9820.961564.83634.420.8850.80566.7390.12
Publisher’s Note: MDPI stays neutral with regard to jurisdictional claims in published maps and institutional affiliations.

