Article

Integrating Spectral Information and Meteorological Data to Monitor Wheat Yellow Rust at a Regional Scale: A Case Study

1
Key Lab of Guangdong for Utilization of Remote Sensing and Geographical Information System, Guangdong Open Laboratory of Geospatial Information Technology and Application, Research Center of Guangdong Province for Engineering Technology Application of Remote Sensing Big Data, Guangzhou Institute of Geography, Guangdong Academy of Sciences, Guangzhou 510070, China
2
Key Laboratory of Digital Earth Science, Aerospace Information Research Institute, Chinese Academy of Sciences, Beijing 100094, China
3
Key Laboratory for Earth Observation of Hainan Province, Sanya 572029, China
*
Author to whom correspondence should be addressed.
Submission received: 11 December 2020 / Revised: 8 January 2021 / Accepted: 12 January 2021 / Published: 14 January 2021
(This article belongs to the Special Issue Crop Disease Detection Using Remote Sensing Image Analysis)

Abstract

:
Wheat yellow rust has a severe impact on wheat production and threatens food security in China; as such, an effective monitoring method is necessary at the regional scale. We propose a model for yellow rust monitoring based on Sentinel-2 multispectral images and a series of two-stage vegetation indices and meteorological data. Sensitive spectral vegetation indices (single- and two-stage indices) and meteorological features for wheat yellow rust discrimination were selected using the random forest method. Wheat yellow rust monitoring models were established using three different classification methods: linear discriminant analysis (LDA), support vector machine (SVM), and artificial neural network (ANN). The results show that models based on two-stage indices (i.e., those calculated using images from two different days) significantly outperform single-stage index models (i.e., those calculated using an image from a single day), the overall accuracy improved from 63.2% to 78.9%. The classification accuracies of models combining a vegetation index with meteorological feature are higher than those of pure vegetation index models. Among them, the model based on two-stage vegetation indices and meteorological features performs best, with a classification accuracy exceeding 73.7%. The SVM algorithm performed best for wheat yellow rust monitoring among the three algorithms; its classification accuracy (84.2%) was ~10.5% and 5.3% greater than those of LDA and ANN, respectively. Combined with crop growth and environmental information, our model has great potential for monitoring wheat yellow rust at a regional scale. Future work will focus on regional-scale monitoring and forecasting of crop disease.

Graphical Abstract

1. Introduction

Wheat is the main grain crop for mankind [1]. Yellow rust (Puccinia striiformis f. sp. tritici Erikss) is a devastating disease in wheat planting that affects wheat growth, thus seriously affecting the quality and yield of wheat in China [1,2]. The average annual area of wheat yellow rust is 4 million hm2, resulting in a reduction in wheat production of more than 1 billion kg per year [3]. Traditional methods of wheat yellow rust involve manual surveys that are time-consuming, laborious, and inefficient [4]. In recent decades, remote sensing technology has been proved to be an effective tool for monitoring of crop disease and pest, with advantages of large-scale and real time simultaneous monitoring [4,5]. Therefore, timely, effective, and accurate monitoring of wheat yellow rust based on remote sensing technology and multi-source data of disease occurrence is essential to ensure food security and agricultural sustainability in China.
It is well-known that the phenology of vegetation is closely related to the seasonality of meteorological variables [6]. In addition, the integration of meteorological data with satellite hydrological models can improve irrigation scheduling management and help farmers to properly make rational irrigation plans [7]. For pathogens, the propagation, spread, and infection of pathogen spores require suitable environmental support; thus, the monitoring of crop pests and diseases is related to environmental conditions [4,8]. Meteorological data, such as temperature, humidity, sunshine, and rainfall are the key factors to determining the occurrence, development, and prevalence of crop diseases [4]. Zhang et al. showed that integrating meteorological data (precipitation, temperature, humidity, and solar radiation) and remote sensing features has significant potential to forecast the occurrence probability of wheat powdery mildew [9]. Papastamati et al. stated that the inoculation concentrations, temperature, and rainfall time were related to light leaf spot epidemics in winter oilseed rape disease and proposed a new model for predicting the disease [10]. Habitat monitoring has great potential for evaluating the occurrence and distribution of plant diseases on a regional scale [8].
In addition, biophysical parameters of the host have a certain effect on the infection of diseases [11]. In different infestation stages, plants exhibit specific host–pathogen interactions, such as a reduction in leaf area index, pigment content changes, and canopy structure morphology destruction [12]. These changes respond in the visible to near-infrared regions of the spectrum and can even be captured through multi-temporal observations [11,12,13]. Zhang et al. used single- and multi-temporal images from HJ satellite to monitor wheat powdery mildew, and proved that multi-stage images were superior to single-temporal images for wheat disease monitoring, with monitoring accuracy reaching 78% [14]. Ma et al. developed a multi-temporal vegetation index that indicated crop growth status and habitat characteristics to monitor wheat powdery mildew based on the k-nearest neighbor approach [15]. Therefore, the integration of habitat information and the host growth status related to disease and pest occurrence have great potential for crop stress monitoring.
Classifiers can learn the characteristics of target classes from training samples and apply this information to unclassified data. Methods, such as decision tree (DT), k-nearest neighbors (kNN) method, support vector machine (SVM), and artificial neural network (ANN), have been developed and applied in objects recognition and species classification in the remote sensing field [16,17,18]. Among these, the SVM and ANN methods are popular for crop classification and disease remote sensing monitoring [4,16].
Satellites with different spatial resolutions have been used in agricultural disease identification and monitoring [4]. Razz et al. and Yue et al. effectively utilized the high-resolution of PlantScope imagery (3 m) to detect soybean sudden death syndrome and rice diseases, respectively [19,20]. Calderón et al. used high spatial resolution and hyperspectral imagery for Verticillium wilt of olive for early detection [21]. Yuan et al. used high spatial resolution (Worldview 2) and medium-spatial resolution (Landsat 8) satellite images to monitor the distribution of wheat disease and pest, achieving a monitoring accuracy of more than 71.0% [8]. Therefore, satellite imagery has proven to be an efficient tool for monitoring crop disease and pest in farms on large regional scales. The Sentinel-2 multispectral satellite launched in 2015, has a 290 km swath width and a 10 days revisit cycle, although it can reach up to 5 days if two satellites work simultaneously [22]. Sentinel-2 multispectral images have 13 spectral bands with a spectral range that includes visible, near-infrared, and shortwave infrared regions; their spatial resolutions are 10, 20, and 60 m, respectively (Figure 1). The most innovative feature of the Sentinel-2 satellite is that it contains rich red-edge bands information with center wavelengths of 705, 740, and 783 nm, which provides abundant information for vegetation biophysical status monitoring and estimation [23,24]. In summary, Sentinel-2 has an unpreceded spatial, temporal resolution and revisit cycle, which is suitable for monitoring crop growth processes such as crop diseases or pest stress [25].
Yellow rust is an air-dispersed pandemic disease [2]; its occurrence is strongly related to habitat conditions, such as humidity, sunshine, and temperature. However, most of the existing remote sensing identification methods for wheat yellow rust depend on spectral data; few studies have considered the habitat characteristics of yellow rust disease [8]. In this study, we considered the characteristics of spectral changes and meteorological factors in the occurrence period of wheat yellow rust; and developed a large-scale and high-precision monitoring method for wheat yellow rust on a regional scale that integrates environment conditions and growth status. The primary aims of this research are: (1) To present a series of two-temporal vegetation indices for monitoring wheat yellow rust using two-stages satellite remote sensing images on a regional scale; (2) to explore the feasibility of combining remote sensing and meteorological information for yellow rust monitoring; and (3) to develop an optimal classification method for monitoring wheat yellow rust utilizing both spectral information and meteorological data on a regional scale.

2. Materials and Methods

2.1. Field Survery and Data Collection

2.1.1. Field Survey Area

Field surveys of wheat yellow rust were conducted in Ningqiang county (118°35′19.5″ E, 37°35′51.75″ N), Shaanxi province, China from 11 May 2018 to 14 May 2018 (i.e., the filling stage, Figure 2). In Ningqiang County, wheat is a major crop, and yellow rust is the dominant wheat disease; a severe infestation occurred in 2018. The average annual temperature and precipitation of this area are 13 °C, and 1812.2 mm, respectively; low temperature and high humidity environment conditions are conductive to the occurrence, spread, and epidemic of wheat yellow rust [23]. Shaanxi Province is considered to be an important spring epidemic area and winter breeding area of wheat yellow rust in China [26]. Therefore, there is an urgent demand to monitor wheat yellow rust disease in this region.
Three data types, including field survey data of yellow rust disease, multispectral satellite images, and meteorological information, were collected to develop a wheat yellow rust monitoring model on a regional scale.

2.1.2. Disease Survey Data Collection

In this field survey, 58 samples (22 healthy, 36 infected) were investigated from 11 May 2018 to 14 May 2018. Considering the pixels size of remote sensing images, uniformly growing wheat samples were randomly selected with a continuous area of 10 × 10 m, and the severity of disease was surveyed. We selected five representative 1 × 1 m plots (located at the four corners and centers of the 10 × 10 m plots), and the average severity of yellow rust for the five plots was used to represent the disease degree for one sample [8]. The center coordinate of each sample was recorded by a differential global positioning system (GPS) sensor (Trimble GeoXH). The field severity survey and disease index calculation of wheat yellow rust referenced the rule of the National Rules for the Investigation and Forecasting of Crop Diseases (GB/T 15795-1995) [12]. The information of wheat growth, disease incidence, and location are recorded in Appendix A Table A1.

2.1.3. Remote Sensing Data Collection and Wheat Planting Area Extraction

Sentinel-2A remote sensing images (processing level 1C) on 2 April 2018 (early onset of disease) and 12 May 2018 (disease outbreak stage) were downloaded from the European Space Agency Sentinels Scientific Date Hub (https://scihub.copernicus.eu/) for the study region [23]. The preprocessing of Sentinel-2A images included atmospheric correction, and clipping. Atmospheric correction was performed using the Sen2cor module (version 2.2.1) within the Sentinel-2 Toolbox, and image mosaic and cropping were implemented in the Sentinel Application Platform software (SNAP, 4.0.2) [23]. In addition, the Sentinel-2A multispectral data carried 13 bands that include three different spatial resolution (Figure 1). For subsequent analysis, the spatial resolutions of the 13 bands were resampled to 10 m using the resampling tool in the software. The large-scale crop disease monitoring was based on the extraction of wheat planting area; therefore, we used the decision tree and multi-temporal phenological information methods, as proposed by Zhang et al. and Xu et al., to extract the planting area of wheat [14,27]. Field survey points were used to verify the accuracy of the extracted wheat area, which reached 94%. This result meets the demand of subsequent remote sensing monitoring of crop diseases.

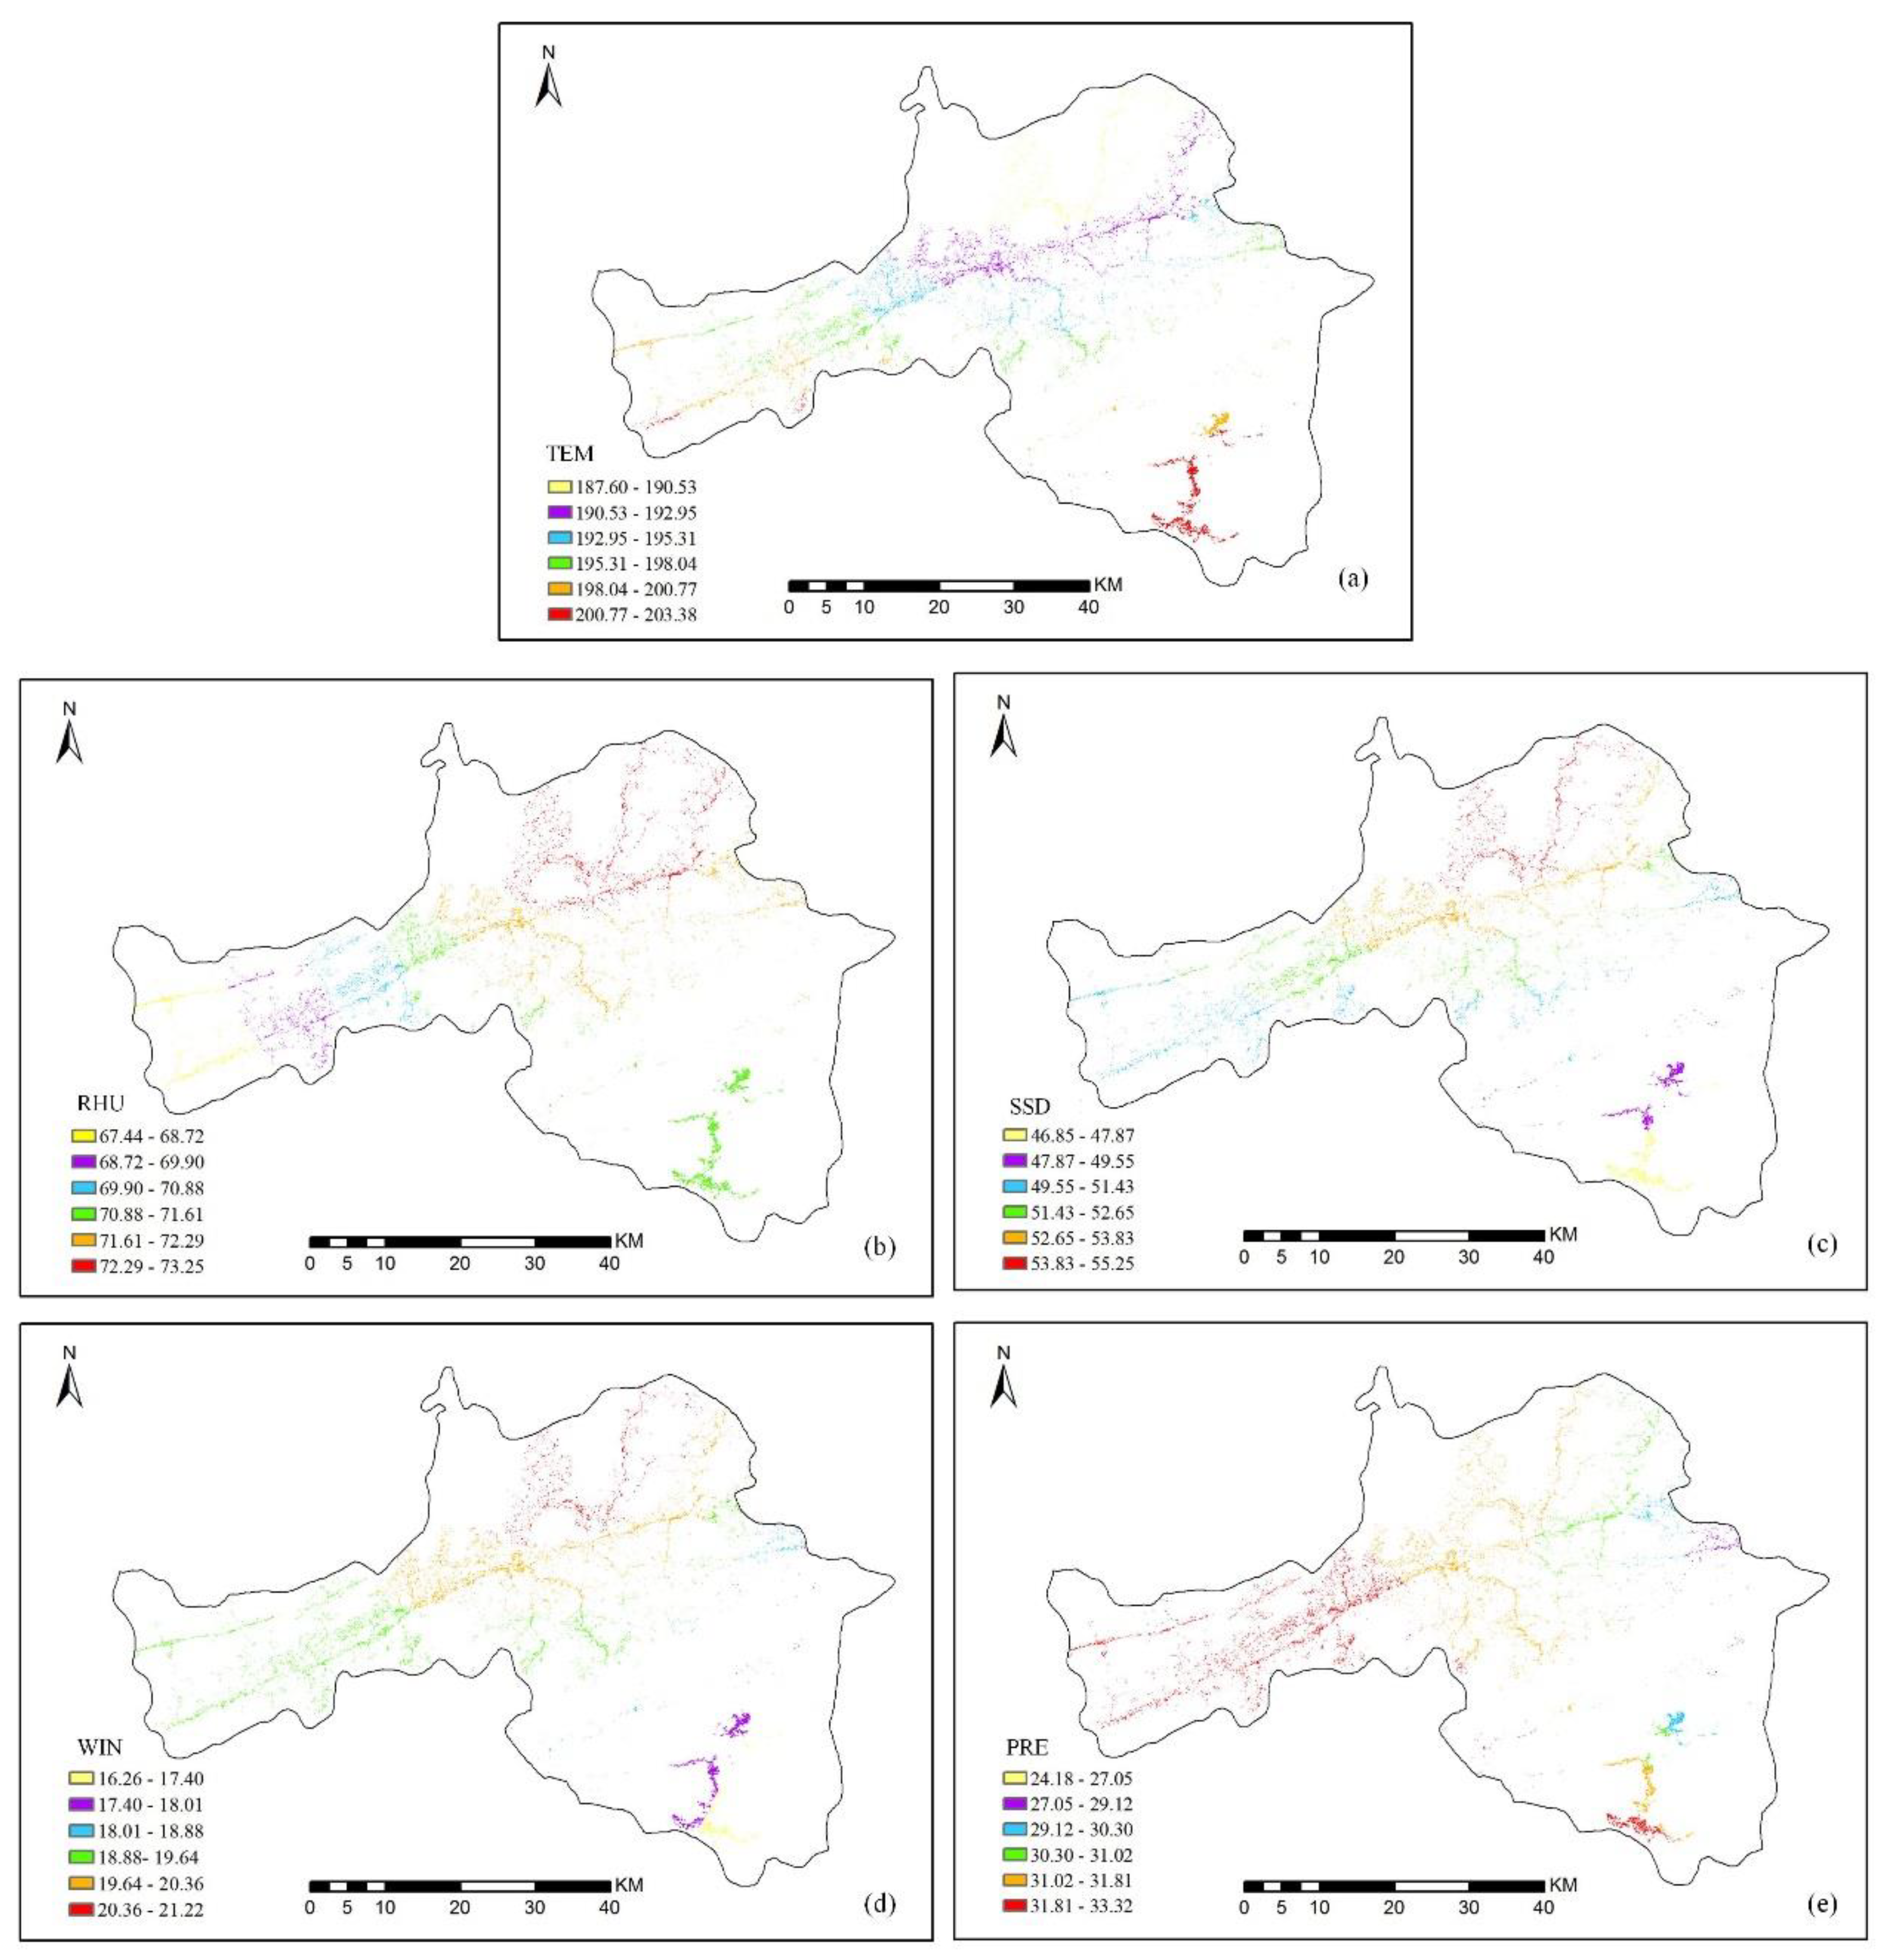
2.1.4. Meteorological Data

Meteorological data are the basis for analyzing and describing climate characteristics and their laws of change [28]. The occurrence and prevalence of wheat yellow rust depend on the interaction among wheat varieties, amount of yellow rust disease, and environmental conditions [1,4,8]. When both pathogen and host have the potential for an epidemic, environmental conditions, specifically meteorological conditions, become the dominant factor in a wheat yellow rust epidemic [4,29].
Considering the influence of climate conditions on the wheat infection of yellow rust pathogens, five types of meteorological data were collected for March to May 2018 from the National Meteorological Information Center in 37 sampling sites around Ningqiang county, including average temperature (TEM), precipitation (PRE), sunshine hours (SSD), wind speed (WIN), and relative humidity (RHU). From each of these, we calculated a monthly mean value for March, April, and May. Therefore, a total of 15 meteorological features were calculated in this study.

2.2. Vegetation Indices for Plant Diseases Discrimination

Crop under the stress of pests and diseases often undergo changes that impact their spectral properties, including pigmentation, moisture, and biomass. The sensitive spectral bands were combined to construct vegetation indices (VIs) in the relevant mathematical forms. VIs related to plant growth status, vegetation coverage, and pigmentation content were used to capture the physiological and biochemical changes caused by wheat yellow rust infection (Table 1).

2.3. Two-Stage Vegetation Index for Wheat Yellow Rust Monitoring

The study area belongs to the wheat region of southwest China. Generally, the initial stage of wheat yellow rust disease in this region is from the end of March to the beginning of April, the yellow rust outbreak occurred in mid-May in 2018. Accordingly, we selected Sentinel-2 images acquired on 2 April and 12 May 2018. Based on the commonly used vegetation indices listed in Table 1, we calculated the change in magnitude from 2 April to 12 May using the normalization quantification formula:
nVIs = V I 12 May V I 2 April V I 12 May + V I 2 April
where nVIs represents the change of vegetation index features between two-stages; V I 2 April and V I 12 May indicate the values of the vegetation index extracted from the images at the time of the first occurrence (2 April 2018) of yellow rust and at the large outbreak of yellow rust (12 May 2018), respectively.

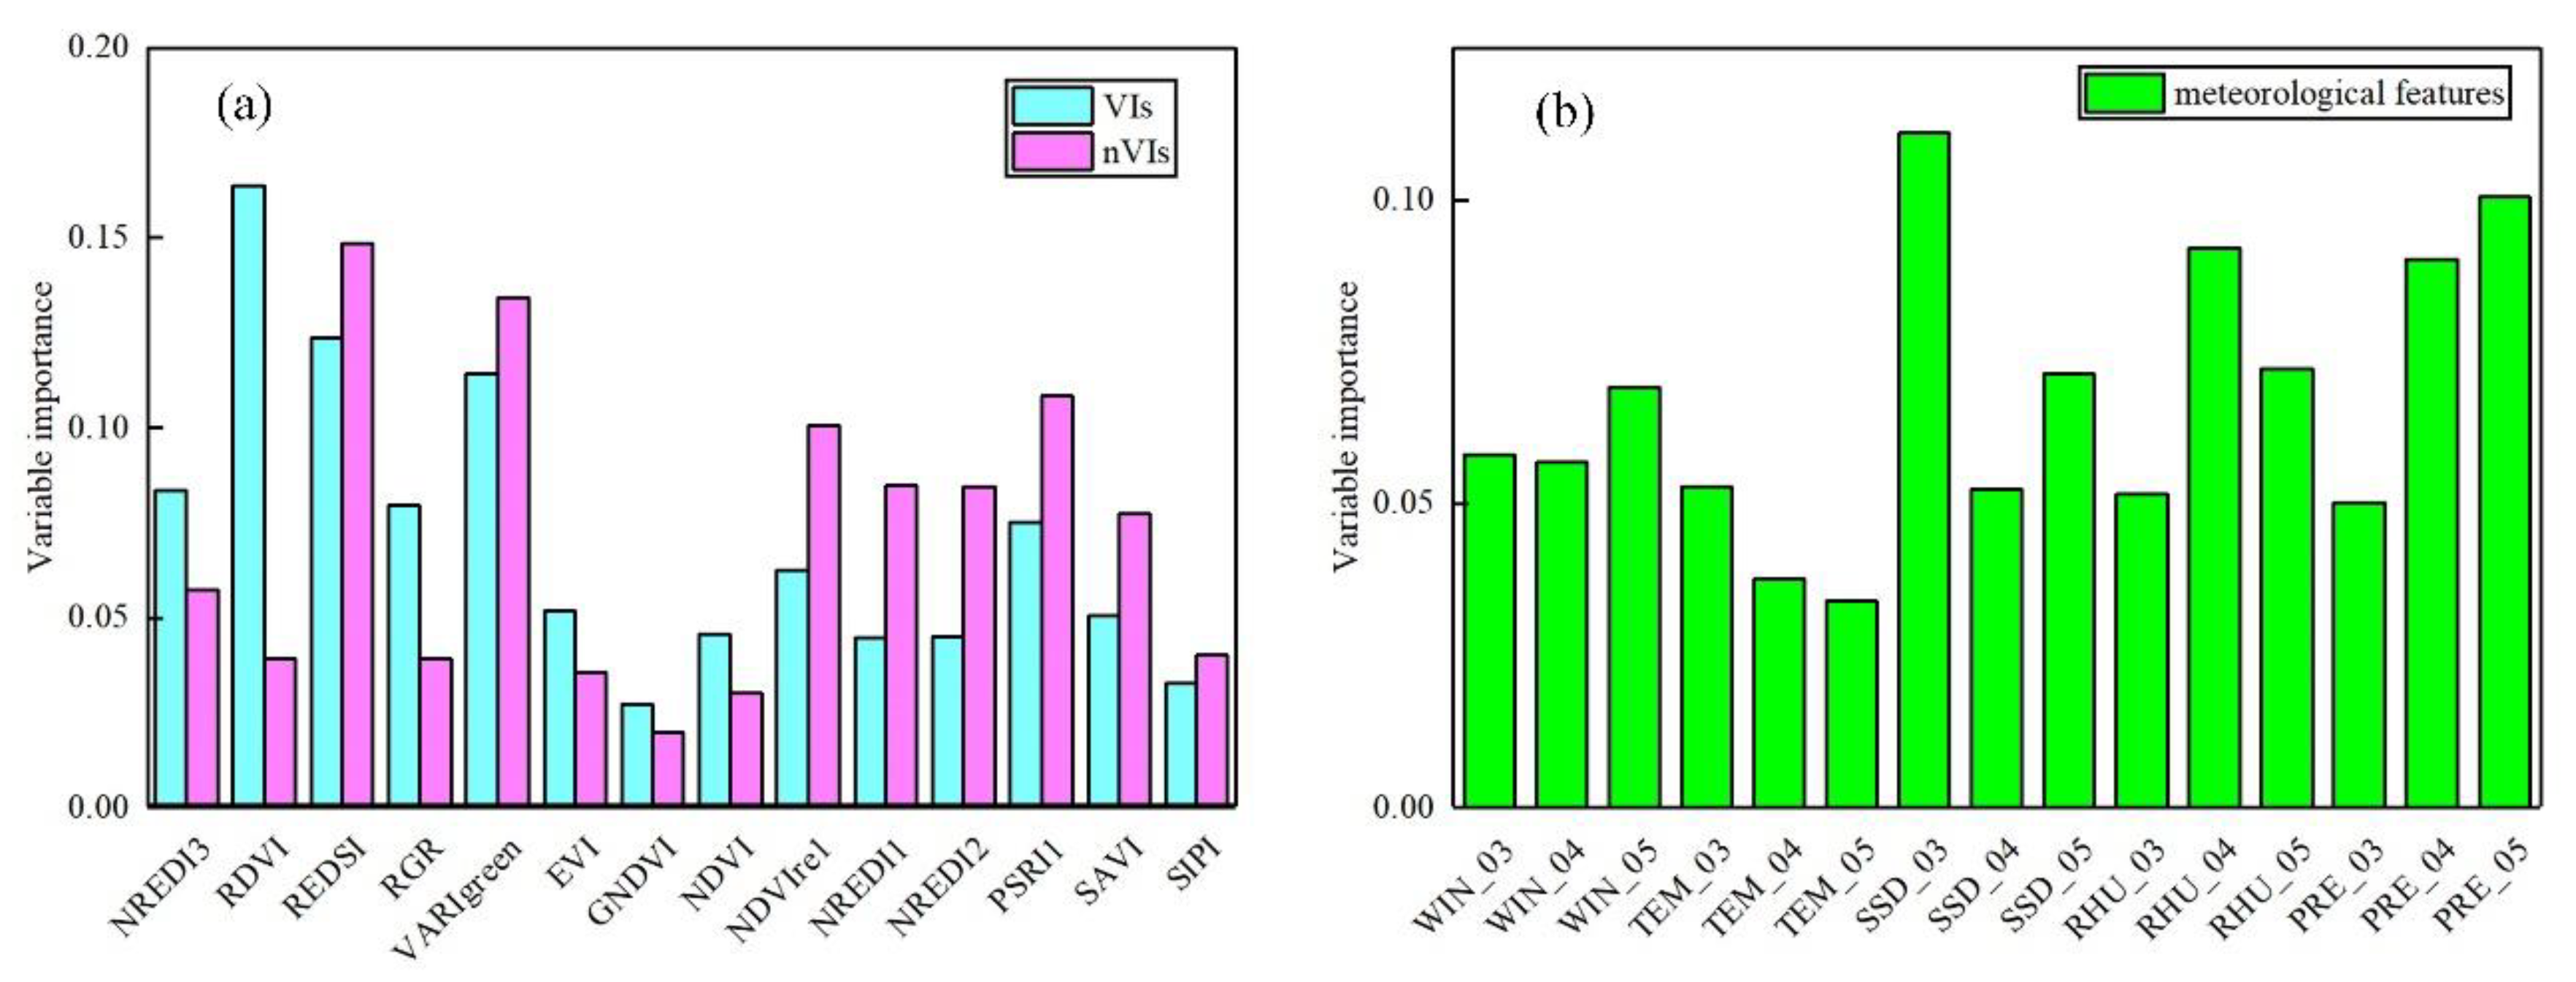
2.4. Spectral VIs and Meteorological Features Importance Ranking

There are many features including vegetation indices and meteorological parameters that are potentially relevant to crop diseases monitoring, however the sensitivity of these features varies substantially. It is necessary to describe the degree that how much a feature will impact on the model predictions. In this study, random forest (RF) was applied for classification and feature importance analysis and was first described by Breimen et al. [39]. It is an ensemble approach for building decision trees for predictions. The feature importance in RF is computed as the average contribution of each feature on each tree in the RF [39]. We used the out-of-bag (OOB) data to calculate the error ( errOO B t ) for each tree in the RF algorithm. Subsequently, we compared the difference in the OOB error of each feature before ( errOO B t ) and after adding noise ( errOO B t i ) to calculate the importance of the feature ( X ), where Ntree denotes the number of trees in RF [22]. Finally, the importance of feature X i was defined as:
V ( X i ) = 1 N t ( e r r O O B t e r r O O B t i )
In addition, we used the analysis of variance methods to test the significance of the selected features [40]. The statistical significance expressed by the ρ value reflects the suitability of the feature [9,40]. Finally, we selected the features that were highly important and significant as the optimal features for yellow rust detection.

2.5. Monitoring Methods

The main purpose of this research is to explore the feasibility of remote sensing monitoring of crop diseases by meteorological data information. In addition, because of the small sample size in this experiment, three commonly used methods of liner discriminant analysis (LDA), SVM, and ANN and regular parameter settings were selected to construct wheat yellow rust monitoring models.
LDA is a dimensionality reduction method based on the best classification effect [41], usually by finding a set of linear feature combinations to classify two or more targets. The primary idea is to find a linear combination of variables to maximize in-between variance and minimize within-class variance [41]. The LDA model was implemented using the Statistical Package for the Social Sciences (SPSS 20.0). The parameters were set as default value.
In the SVM classification algorithm, the primary idea is to determine an optimal decision boundary and maximize the distance of the closest samples in two categories as much possible across the boundary [42]. Using the radial basis function (RBF) as the kernel function for SVM classification exhibited superior performance in the case of inseparable linearity [17]. The key parameters of SVM are shown in Table 2. The model is trained and tested in the Matlab R2016 software.
ANNs can be described as parallel and complex computing systems composed of large numbers of interconnected simple processors (neurons, also called nodes) [43]. As an important data mining tool, ANNs have comprehensive mathematical mechanisms and have been applied in various fields of remote sensing, such as ground objects identification and change detection [18,43]. In this study, the vegetation indices and meteorological data were the ANN input parameters. The transfer functions of logarithm sigmoid (logsig) transfer and linear (purelin) were used to activate the hidden layers and weighted output layers, respectively [44,45]. The learning rule takes the approach of a gradient descent backpropagation (traingd) training function. The key parameters of ANN are shown in Table 2. We used the MATLAB R2016 software to run the ANN models.
Once sensitive spectral features and meteorological features were identified, the three classification algorithms (LDA, SVM, and ANN) were used to establish a classification model for wheat yellow rust. According to the three methods, wheat yellow rust classification was conducted using the following datasets: case 1: spectral vegetation indices (containing single temporal VIs and two-temporal nVIs); case 2: a combination of spectral vegetation indices and meteorological information.

2.6. Classification Accuracy Assessment

Considering the number of samples (n = 58, of which healthy samples = 22, and disease samples = 36), the samples were divided into three parts, two of which (n = 39) were used as training samples for model training; with the remaining part (n = 19) used as a validation dataset to verify the accuracy of the model. Accuracy evaluation was determined by the overall classification accuracy (OA), kappa coefficient, user’s accuracy (U.a), and producer’s accuracy (P.a) from confusion matrices [46].

3. Results

3.1. Vegetation Index Response for Yellow Rust Disease

The responses of the 14 VIs and corresponding two-stage vegetation indices (nVIs) are shown in Figure 3, where their mean and difference values are compared for healthy and yellow rust-infected wheat. The values of the re-normalized difference vegetation index (RDVI), and red-edge disease stress index (REDSI) were reduced by 100 times to maintain the same magnitude as that of the other indices. On the single-stage indices, according to the difference information of each vegetation index in healthy and diseased wheat, RDVI, REDSI, enhance vegetation index (EVI), soil adjusted vegetation index (SAVI), and normalized red-edge3 index (NREDI3) were most suitable for discriminating healthy and yellow rust-infected wheat (Figure 3a). Among them, the difference value of RDVI for healthy and disease samples was the largest, reaching 5.5. However, the magnitude of the difference value in the entire single-stage VIs was relatively small, except for RDVI and REDSI.
Regarding the normalized two-stage indices, the difference between health samples and yellow rust infection samples was evident, specifically for the normalized REDSI (nREDSI), normalized visible atmospherically resistant index (nVARIgreen), normalized difference vegetation index reg-edge 1 (nNDVIre1), and normalized plant senescence reflectance index (nPSRI1). Among them, the difference between healthy and diseased samples in nREDSI was up to 1.1 (Figure 3b). The two-stage nVIs (using images from both 2 April and 12 May 2018) exhibited a greater difference between healthy and yellow rust-infested wheat compared with the corresponding single-stage VIs (using the images from 12 May). This confirms that nVIs are closely related to the pathological progress of the crop, which can more clearly reflect leaf wilting, leaf tissue death, and canopy structure changes caused by the yellow rust pathogen.

3.2. Meteorological Data Processing and Selection

Each type of meteorological data was averaged by month to obtain its monthly average value. Then, the meteorological factors from March to May 2018 were spatially interpolated using an inverse distance weighted method in the ArcGIS software for subsequent continuous spatial pixel-scale analysis [9]. All meteorological factors were interpolated at a spatial resolution of 10 m, which matches the resolution of the Sentinel-2 satellite imagery. Figure 4 presents the results of meteorological data spatial resolution in May Finally, based on continuous meteorological data, meteorological characteristics were extracted for wheat yellow rust habitat monitoring.

3.3. VIs and Meteorological Features Sensitivity of Yellow Rust Monitoring

We observed a strong correlation between VIs as well as wheat physiological and, biochemical parameters caused by the development of yellow rust; however, correlations and multiple collinearities among different VIs limit the extraction of sensitive information for wheat yellow rust discrimination. Therefore, we selected the single- and two-stage VIs most sensitive to reflect the state of the crop after being stressed by disease using the important criterion in the RF method. The selected single-stage vegetation index, normalized two-stage vegetation index, and meteorological data were used to determine the important features for yellow rust detection (Figure 5).
The relative importance of the three features for wheat yellow rust discrimination were analyzed using the RF method (Figure 5). According to the importance ranking of spectral VIs (Figure 5a), we selected the features with variable importance greater than 0.05 for subsequent analysis. In terms of single-stage VIs, the RDVI, REDSI, VARIgreen, NREDI3, RGR, PSRI1, NDVIre1, SAVI, and EVI were selected; for nVIs, the nREDSI, nVARIgreen, nPSRI1, nNDVIre1, nNREDI1, nNREDI2, nSAVI, and nNREDI3 were selected. For meteorological data, the SSD_03, PRE_05, RHU_04, PRE_04, RHU_05, WIN_03, WIN_04, TEM_03 and SSD_05 were selected. To avoid information redundancy of selected features, we used the analysis of variance (ANOVA) method to optimize important features (Table 3). For VIs, the EVI, NREDIre1, PSRI1, and SAVI showed no significant differences (ρ > 0.05); and for nVIs, the differences of nNREDI3, nNREDI2, and nSAVI with other nVIs were insignificant (ρ > 0.05).
The variable importance values of the vegetation indices based on a single image and two images taken at different times in the discrimination of wheat yellow ruts differed. The five most important vegetation indices were selected for subsequent analysis. For single-stage imagery, the RDVI, REDSI, NREDI3, RGR, and VARIgreen were most sensitive to wheat yellow rust (Figure 5a, indigo histogram); for two-stage imagery, nREDSI, nVARIgreen, nPSRI1, nNREDI1, and nNDVIre1 were most sensitive to wheat yellow rust (Figure 5a, magenta histogram). This is generally consistent with the results shown in Figure 3b and allows us to distinguish between healthy wheat and yellow rust infection. Similarly, the meteorological features of WIN_03, WIN_04, TEM_03, and SSD_05 were excluded using ANOVA.
Figure 5b demonstrated the importance ranking of meteorological features. Due to the strong correlation between the same type of meteorological data, we selected the features above the average value (0.07) of all variable importances for yellow rust identification. Accordingly, five of the most important meteorological features were selected for monitoring wheat yellow rust on a regional scale: average sunshine hours in March (SSD_03), average relative humidity (RHU_04, RHU_05) in April and May, and average precipitation (PRE_04, PRE_05) in April and May.

3.4. Wheat Yellow Rust Monitoring Based on Spectral Vegetation Indices

Monitoring models for wheat yellow rust were built using the LDA, SVM, and ANN algorithms. The RDVI, REDSI, NREDI3, RGR, and VARIgreen were selected for use in single-stage monitoring models; nREDSI, nVARIgreen, nPSRI1, nNREDI1, and nNDVIre1 were selected for use in two-stage monitoring models. Table 4 presents the classification results of the three algorithms using the different VIs.
For the single-stage vegetation index model, the overall classification accuracy and kappa coefficient were 63.2% and 0.18 for the LDA algorithm, respectively; 73.7% and 0.42 for the SVM algorithm, respectively; and 63.2% and 0.23 for the ANN algorithm, respectively. For the nVIs models, the overall classification accuracy and kappa coefficient were 68.4% and 0.32 for the LDA algorithm, respectively; 78.9% and 0.55 for the SVM algorithm, respectively; and 68.4% and 0.32 for the ANN algorithm, respectively. Based on these results, the classification accuracy of wheat yellow rust monitoring models using nVIS as the input features is better than that of models using VIs; the overall accuracy is improved by 5.2%. Compared with the VIs model, the P.a of healthy wheat identification and yellow rust wheat exceeded 57.1% and 83.3%, respectively, for nVIs. Among the algorithms, SVM performed the best.

3.5. Wheat Yellow Rust Monitoring Based on Meteorological Data and Spectral Information

The classification results of the three algorithms based on both vegetation indices (VIs and nVIs) and meteorological data are shown in Table 5. For the single-stage vegetation index model, the overall classification accuracy and kappa coefficient were 68.4% and 0.32 for the LDA algorithm, respectively; 78.9% and 0.55 for the SVM algorithm, respectively; and 73.7% and 0.45 for the ANN algorithm, respectively. For the two-stage models, the overall classification accuracy and kappa coefficient were 73.7% and 0.42 for the LDA algorithm, respectively; 84.2% and 0.65 for the SVM algorithm, respectively; and 78.9% and 0.55 for the ANN algorithm, respectively.
According to these results, the accuracies of wheat yellow rust monitoring models with the nVIs and meteorological data as the input features are higher than those based on VIs and meteorological data. This is consistent with the results based on the pure VIs model (see Section 3.4). Among the three algorithms, SVM again had the highest classification accuracy. Moreover, the U.a of healthy and yellow rust wheat identification was 83.3% and 84.6%, respectively; the P.a of yellow rust reached 91.7% in the nVIs and meteorological model (nVIs_meteorological data). The results confirm that the inclusion of meteorological data improves model accuracy and offers the potential for crop disease monitoring on a regional scale.

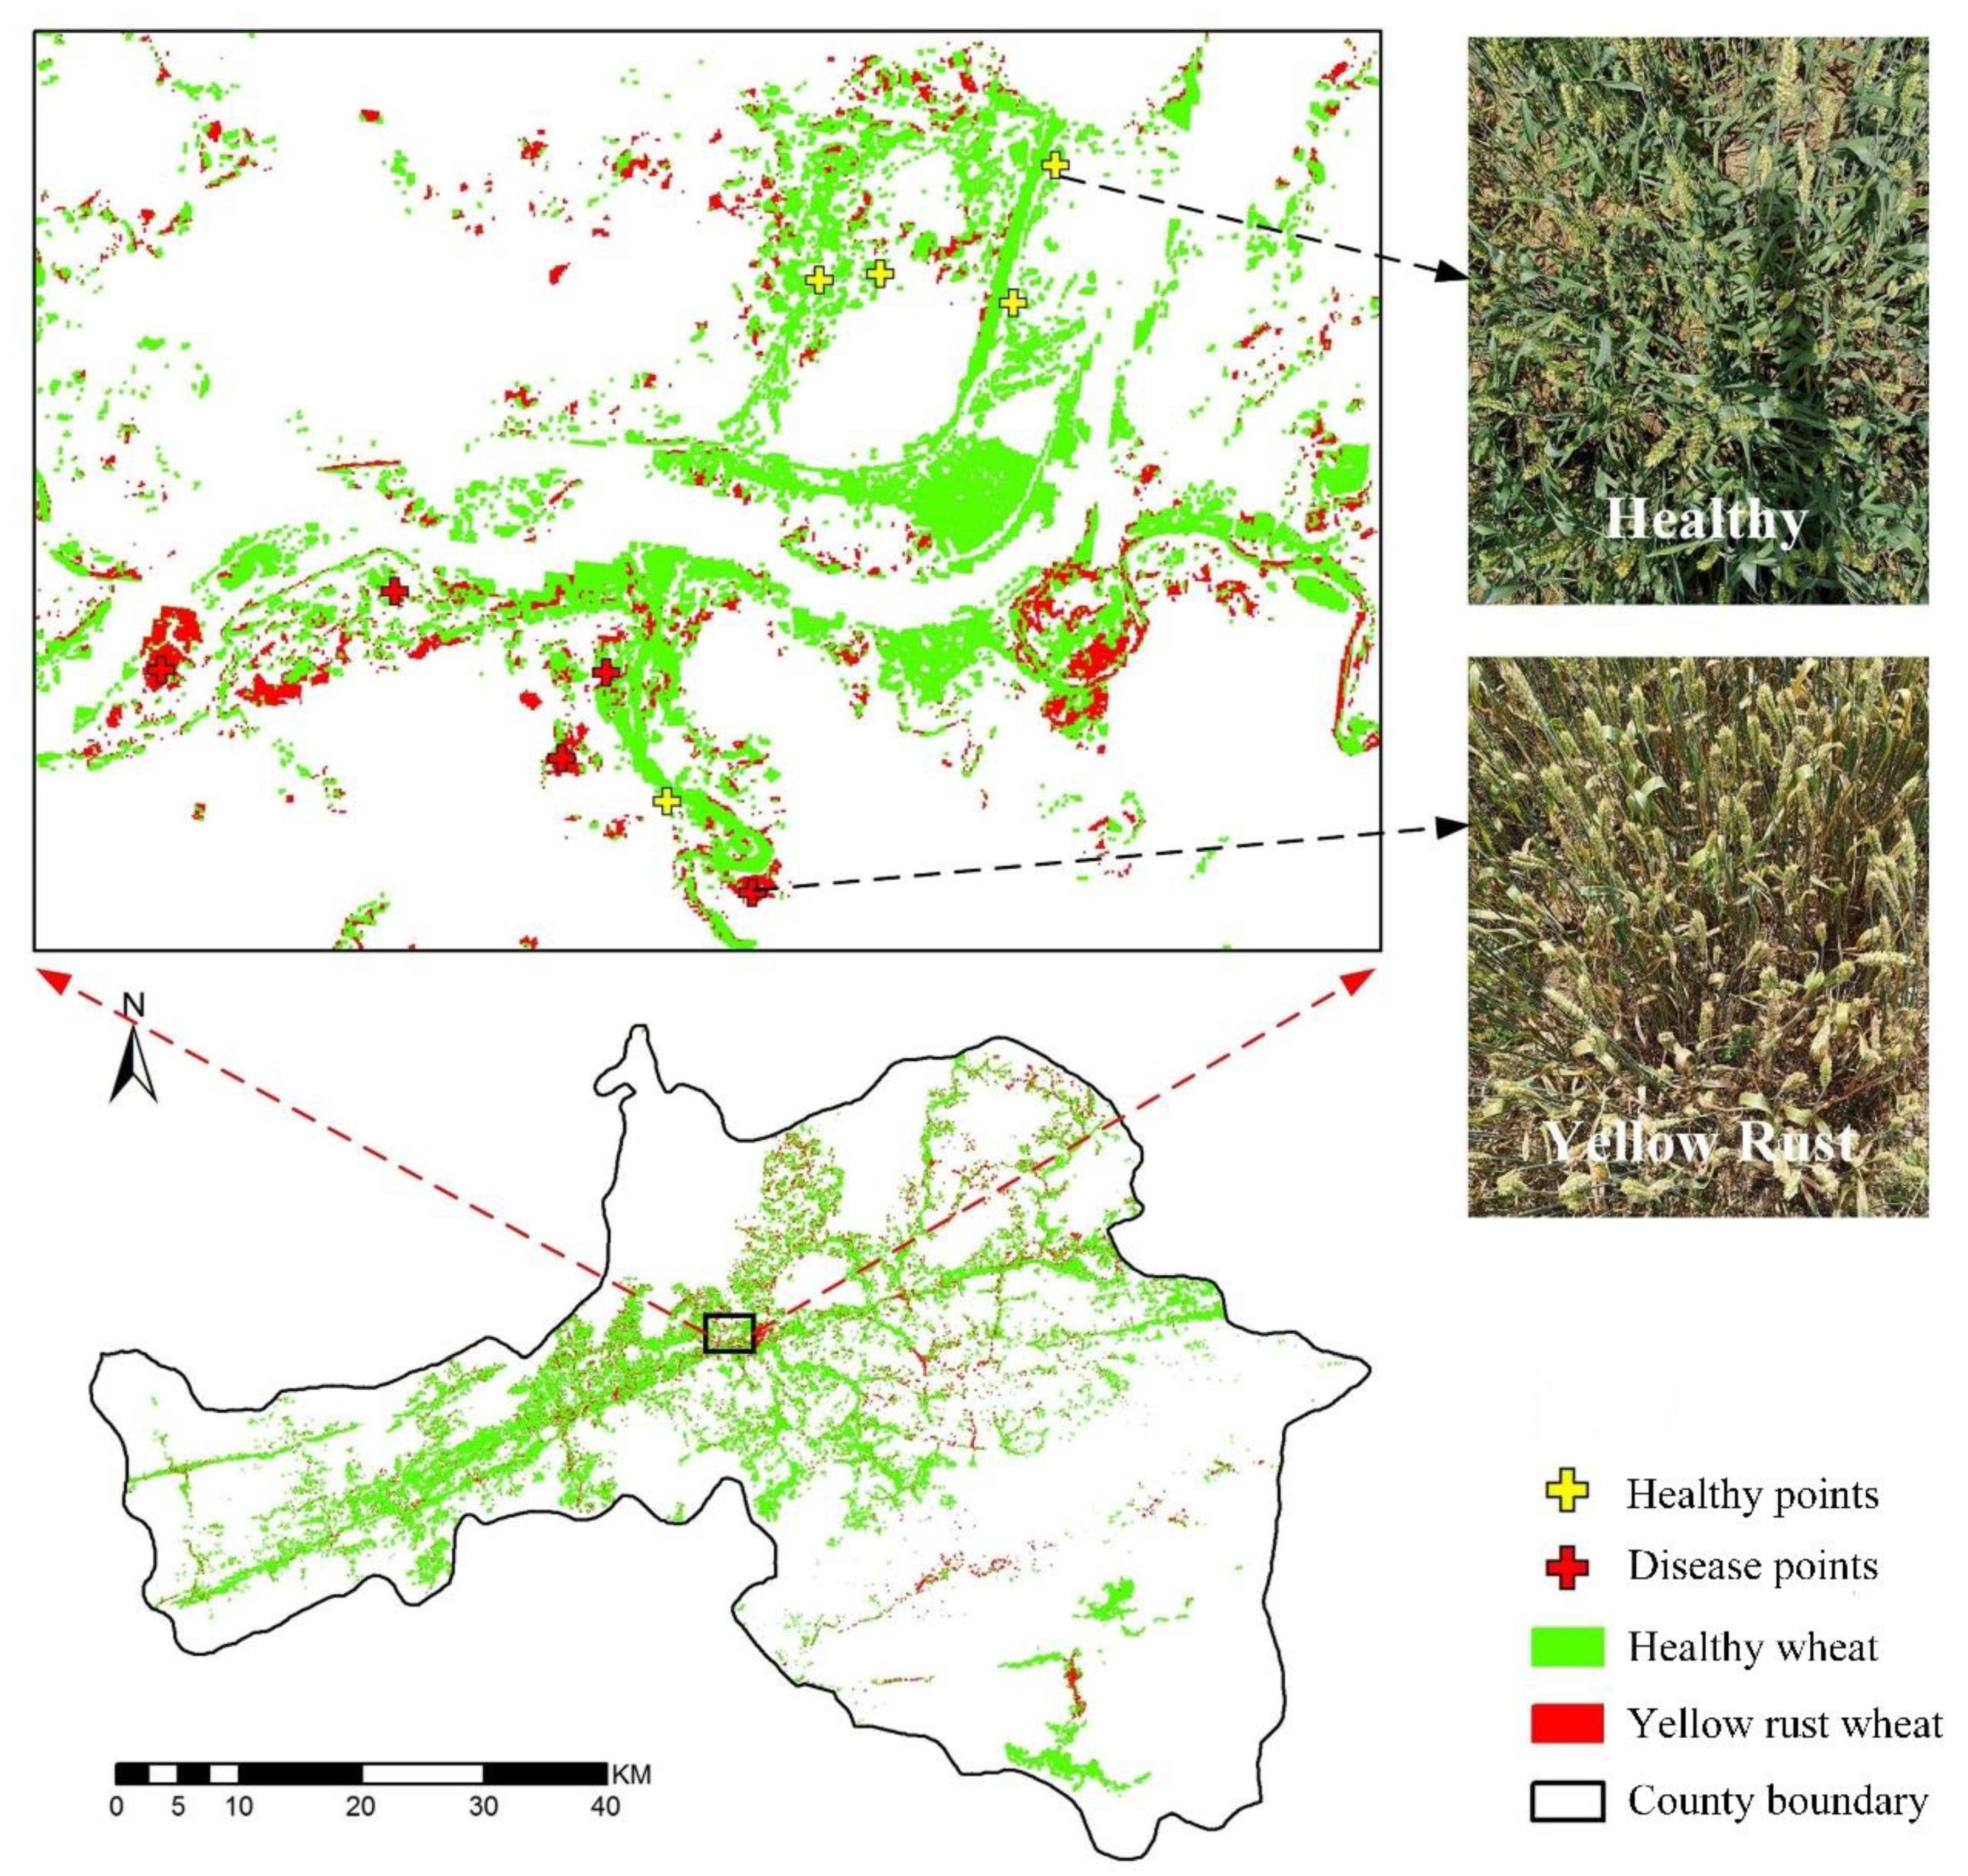
3.6. Mapping Wheat Yellow Rust Using the Optimal Monitoring Model

Figure 6 shows a map of wheat yellow rust in Ningqiang county, Shaanxi Province during the filling period based on the optimal model (SVM algorithm using two-stage spectral vegetation indices and meteorological data). The wheat yellow rust infected region is highly consistent with the field observation, which verifies the feasibility of the model for crop disease monitoring. This remote sensing method has the potential for effective, rapid (near real-time), and a spatially continuous regional monitoring of crop disease, offering substantial labor-, time-, and cost-savings.

4. Discussion

Remote sensing data has the characteristics of spatial continuity and rich information, which facilitates the acquisition of crop growth and environmental information, and provided a basis for crop pest monitoring [8,47]. This study explored the potential of spectral VIs and meteorological information related to disease occurrence to monitor wheat yellow rust infestation on a regional-scale.

4.1. Performance of Spectral Vegetation Indices in Wheat Yellow Rust Discrimination

VIs can reflect the biophysical and biochemical change of crops, and can be used for detection and identification of plant diseases [37,48]. Yellow rust primarily infects wheat leaves, causing green fading and deformation of leaf tissue, thereby significantly changing the chlorophyll content and biomass [23]. We selected VIs with highly sensitive yellow rust discrimination during the wheat milking stage based on single- and two-stage remote sensing images. The Sentinel-2 satellite has rich red-edge information that are significant for crop growth status and stress monitoring [22,23]. In particular, REDSI consists of red edges and bands and was proposed by Zheng for monitoring wheat yellow rust, particularly during the filling stage [12,23]. In this study, REDSI and VARIgreen were more important for wheat yellow rust discrimination among the single-stage indices; PSRI1, NREDI1, and NDVIre1 were most sensitive wheat yellow rust among the two-stage indices. This is primarily related to the destruction of the tissue structure of leaf cells and the decrease of leaves chlorophyll content under yellow rust disease stress, resulting in the shift of the spectrum on the red edge [22,49]. PSRI1 can be used to assess the crop pigment content and status [10]. Moreover, the band combination of nPSRI1, nNREDI1, and nNDVIre1 contains red-edge information that can capture changes in physiological and biochemical parameter, and better eliminate the effects of growth factors compared with single-stage vegetation index models (classification accuracy is 5.2% higher, Table 4) [23]. Here, the optimal model (i.e., that using the two-stage vegetation indices) captured changes caused by yellow rust disease with a classification accuracy of 78.9%.

4.2. Performance of Meteorological Data in Wheat Yellow Rust Discrimination

The propagation, spread, and infection of pathogen spores require suitable environmental conditions (such as, precipitation, humidity, and temperature). Wheat yellow rust disease occurs in high humidity and low-temperature environments. Favorable climate conditions such as warm winters and heavy rainfall in early spring are external causes of wheat yellow rust occurrence and epidemics in Shaanxi Province [26]. In this study, the average relative humidity (RHU_04, RHU_05) and average precipitation (PRE_04, PRE_05) were sensitive to yellow rust discrimination (Figure 5b). Moreover, the TEM in Shaanxi Province reaches a suitable range for the incidence of wheat yellow rust in April and May. The study area belongs to the winter breeding region of wheat yellow rust in China [50]. That is, the yellow rust pathogen in this area infects wheat during the winter, making WIN less important in the monitoring of wheat yellow rust than RHU and PRE [26]. However, as wheat yellow rust disease is an air-borne bacterium, WIN can provide important information for forecasting. In summary, our results confirm that meteorological information can provide crop disease monitoring, which is consistent with the conclusions of Yuan et al. [8].

4.3. Performance of Wheat Yellow Rust Monitoring Classification Algorithms

Among LDA, SVM, and ANN, the SVM algorithm exhibited the best performance for distinguishing healthy and yellow rust-infested wheat, with a classification accuracy of 73.7–84.2%. The SVM classifier is based on the threshold discriminant rule and maps the samples to appropriate feature space. Some researchers have also shown that the SVM is superior to LDA in remote sensing classification or extraction in plants [40,41,51]. For example, Yue et al. reported that SVM-based models achieve higher classification accuracies than those using LDA in wheat yellow rust monitoring on leaf scale [40].
In terms of classification accuracy, SVM outperformed the ANN classifiers by 5.2–10.5% in different feature spaces. These results differ from those of Raczko et al. who found that ANN performed better than the SVM model [18]. However, ANNs are more difficult to use and optimize, and require many parameters. The number of samples in this study was limited, and ANN requires a large number of parameters to set the initial value of the network topology, weights, and thresholds, thereby making it difficult to optimize the model [18]. Compared with ANNs, the SVM algorithm can solve classification problems for nonlinear and small sample situations, and avoid the neural network structure selection and local minima problem [52]. Overall, considering that monitoring and positioning crop disease on a regional scale are more complicated and challenging than at the canopy and on leaf scales, the classification accuracy achieved in this study (73.7–84.2% based on SVM classifier) is acceptable.
Although the current classification accuracy is lower than that obtained based on airborne hyperspectral images (for example, Zhang et al. used deep convolutional neural network to identify wheat yellow rust based on airborne hyperspectral images with an accuracy of 85.0% [53]), it meets the practical demands of disease monitoring and management. It is majorly based on airborne hyperspectral images, for which fine spectral resolution enables more abundant spectral information to be extracted and analyzed, which may lead to a certain improvement in the accuracy of disease mapping. Many researchers have used medium- and high-resolution satellite images to monitor crop disease. Chemura et al. used spectral indices to identify coffee leaf rust infection based on Sentinel-2 satellite data, with the discrimination accuracy of 82.5% [22]. Yuan et al. used the crop growth index (GNDVI and VARIred-edge) and environmental characteristics to monitor crop disease and pests based on the Wordview2 and Landsat 8 satellite, and proved that the accuracy (82.0%) of models combining VIs and environmental characteristics are better than those of traditional monitoring models that only rely on spectral information [8]. However, despite the significant potential for crop disease monitoring, we should optimize the parameters of the methods to build more robust and reasonable models under the condition of enough samples, and improve the accuracy of crop disease monitoring for practical applications.
In this study, adding monthly average meteorological data to the remote sensing monitoring of crop diseases, we established an effective remote sensing monitoring model for wheat yellow rust. However, crop disease occurrence is also the result of environmental factors, the amount of pathogen, crop planting landscape patterns, and farmland management [4,29]. Therefore, future work should integrate more multi-source data (remote sensing and non-remote sensing data) with well-characterized mechanisms and high stability to further improve crop disease monitoring and forecasting. Moreover, due to the influence of weather and manpower, the sample size of wheat yellow rust in this study was small. In the future, we will collect wheat yellow rust data from large areas in different years to verify and improve the wheat yellow rust monitoring model. Furthermore, we will attempt to effectively utilize the complementary features of meteorological data (for example, various types of meteorological data and 10-day average meteorological data), terrain features, and remote sensing data to establish a collaborative scheme for forecasting crop disease at an early stage.
The rapid and large-scale monitoring of crop disease and pests relieves huge pressure on plant protection personnel. It is a weapon to prevent and control disease, promote healthy development of agriculture, and achieve the goal of sustainable agricultural development. In addition, this will contribute to eradicating hunger, achieving food security, improving nutrition and promoting sustainable agriculture as outlined in the United Nations Sustainable Development Goals.

5. Conclusions

In this study, multispectral satellite imagery (Sentinel-2A) and meteorological data were used to monitor wheat yellow rust disease based on three classification methods (linear discriminant analysis, a support vector machine, and an artificial neural network) on a regional scale. Five meteorological features (sunshine hours in March (SSD_03), average relative humidity in April and May (RHU_04, RHU_05), and average precipitation in April and May (PRE_04, PRE_05)) combined with two-stage vegetation indices using the SVM algorithm were found to be optimal for wheat yellow rust monitoring. In addition, the model for yellow rust monitoring base of two-stage vegetation indices significantly outperformed single-stage vegetation index models, with the overall classification accuracy increasing from 63.2% to 78.9%. Moreover, the addition of meteorological data, which is closely related to yellow rust occurrence, increased the accuracy of the two-stage index SVM model to 84.2%. The proposed model is suitable for rapid, large-scale monitoring and forecasting of biotic (bacterial and fungal disease) stress in crops and offers an effective approach for reducing the impacts of crop disease, including the implications for global food security. In the future, we will consider information from multiple sources to develop further comprehensive and reliable crop disease forecasting models.

Author Contributions

Q.Z.: field survey, methodology, writing—original draft. H.Y. and W.H.: conceived and designed the experiments; Y.D.: data collection; H.J.: software and processed the data; C.W., D.L., and L.W.: provided advices to improve manuscript; S.C.: modified the structure of the paper and grammar. All authors have read and agreed to the published version of the manuscript.

Funding

This research was funded by GDAS’ Project of Science and Technology Development (2020GDASYL-20200103004), Guangdong Province Agricultural Science and Technology Innovation and Promotion Project (No.2020KJ102), Guangzhou Basic Research Project (202002020076), National special support program for high-level personnel recruitment (Wenjiang Huang).

Institutional Review Board Statement

This study not involving humans.

Informed Consent Statement

This study not involving humans.

Data Availability Statement

Data sharing is not application to this article.

Conflicts of Interest

The authors declare no conflict of interest.

Appendix A

Table A1. Field survey record form for wheat yellow rust.
Contents12
Survey date
Location (longitude, latitude)
Crop growth informationCultivated varieties
Growth stage
Plant height
Planting density
Disease informationNumber of leaves investigated
Number of diseased leaves
Disease severity (%)
Damage percentage (%)
Remarks (Altitude, irrigation information, etc.)

References

  1. Wan, A.M.; Chen, X.M.; He, Z.H. Wheat stripe rust in China. Aust. J. Agric. Res. 2007, 58, 605–619. [Google Scholar] [CrossRef]
  2. Wang, H.; Yang, X.B.; Ma, Z. Long-Distance Spore Transport of Wheat Stripe Rust Pathogen from Sichuan, Yunnan, and Guizhou in Southwestern China. Plant Dis. 2010, 94, 873–880. [Google Scholar] [CrossRef] [PubMed]
  3. Chen, W.Q.; Kang, Z.S.; Ma, Z.H.; Xu, S.C.; Jiang, Y.Y. Integrated Management of Wheat Stripe Rust Caused by Puccinia striiformis f.sp.tritici in China. Sci. Agric. Sin. 2013, 46, 4254–4262. [Google Scholar]
  4. Zhang, J.C.; Huang, Y.B.; Pu, R.L.; Gonzalez-Moreno, P.; Yuan, L.; Wu, K.H.; Huang, W.J. Monitoring plant diseases and pests through remote sensing technology: A review. Comput. Electron. Agric. 2019, 165, 104943. [Google Scholar] [CrossRef]
  5. Huang, W.; Guan, Q.; Luo, J.; Zhang, J.; Zhao, J.; Liang, D.; Huang, L.; Zhang, D. New optimized spectral indices for identifying and monitoring winter wheat diseases. IEEE J. Sel. Top. Appl. Earth Obs. Remote Sens. 2014, 7, 2516–2524. [Google Scholar] [CrossRef]
  6. Coluzzi, R.; D’Emilio, M.; Imbrenda, V.; Giorgio, G.A.; Lanfredi, M.; Macchiato, M.; Ragosta, M.; Simoniello, T.; Telesca, V. Investigating climate variability and long-term vegetation activity across heterogeneous Basilicata agroecosystems. Geomat. Nat. Hazards Risk 2019, 10, 168–180. [Google Scholar] [CrossRef] [Green Version]
  7. Corbari, C.; Salerno, R.; Ceppi, A.; Telesca, V.; Mancini, M. Smart irrigation forecast using satellite LANDSAT data and meteo-hydrological modeling. Agric. Water Manag. 2019, 212, 283–294. [Google Scholar] [CrossRef]
  8. Yuan, L.; Bao, Z.; Zhang, H.; Zhang, Y.; Liang, X. Habitat monitoring to evaluate crop disease and pest distributions based on multi-source satellite remote sensing imagery. Opt. Int. J. Light Electron. Opt. 2017, 145, 66–73. [Google Scholar] [CrossRef]
  9. Zhang, J.; Pu, R.; Yuan, L.; Huang, W.; Nie, C.; Yang, G. Integrating Remotely Sensed and Meteorological Observations to Forecast Wheat Powdery Mildew at a Regional Scale. IEEE J. Sel. Top. Appl. Earth Obs. Remote Sens. 2017, 7, 4328–4339. [Google Scholar] [CrossRef]
  10. Papastamati, K.; Bosch, F.v.d.; Welham, S.J.; Fitt, B.D.L.; Evans, N.; Steed, J.M. Modelling the daily progress of light leaf spot epidemics on winter oilseed rape (Brassica napus), in relation to Pyrenopeziza brassicae inoculum concentrations and weather factors. Ecol. Model. 2002, 148, 169–189. [Google Scholar] [CrossRef]
  11. Cunniffe, N.J.; Koskella, B.E.; Metcalf, C.J.; Parnell, S.; Gottwald, T.R.; Gilligan, C.A. Thirteen challenges in modelling plant diseases. Epidemics 2015, 10, 6–10. [Google Scholar] [CrossRef] [PubMed] [Green Version]
  12. Zheng, Q.; Huang, W.; Cui, X.; Dong, Y.; Shi, Y.; Ma, H.; Liu, L. Identification of Wheat Yellow Rust Using Optimal Three-Band Spectral Indices in Different Growth Stages. Sensors 2018, 19, 35. [Google Scholar] [CrossRef] [Green Version]
  13. Sankaran, S.; Mishra, A.; Ehsani, R.; Davis, C. A review of advanced techniques for detecting plant diseases. Comput. Electron. Agric. 2010, 72, 1–13. [Google Scholar] [CrossRef]
  14. Zhang, J.; Pu, R.; Yuan, L.; Wang, J.; Huang, W.; Yang, G. Monitoring powdery mildew of winter wheat by using moderate resolution multi-temporal satellite imagery. PLoS ONE 2014, 9, e93107. [Google Scholar] [CrossRef] [PubMed] [Green Version]
  15. Ma, H.; Jing, Y.; Huang, W.; Shi, Y.; Dong, Y.; Zhang, J.; Liu, L. Integrating Early Growth Information to Monitor Winter Wheat Powdery Mildew Using Multi-Temporal Landsat-8 Imagery. Sensors 2018, 18, 3290. [Google Scholar] [CrossRef] [Green Version]
  16. Hou, J.; Hu, Y.; Hou, L.; Guo, K.; Satake, T. Classification of ripening stages of bananas based on support vector machine. Int. J. Agric. Biol. Eng. 2015, 8, 99–103. [Google Scholar]
  17. Thanh Noi, P.; Kappas, M. Comparison of Random Forest, k-Nearest Neighbor, and Support Vector Machine Classifiers for Land Cover Classification Using Sentinel-2 Imagery. Sensors 2018, 18, 18. [Google Scholar] [CrossRef] [Green Version]
  18. Raczko, E.; Zagajewski, B. Comparison of support vector machine, random forest and neural network classifiers for tree species classification on airborne hyperspectral APEX images. Eur. J. Remote Sens. 2017, 50, 144–154. [Google Scholar] [CrossRef] [Green Version]
  19. Raza, M.M.; Harding, C.; Liebman, M.; Leandro, L.F. Exploring the Potential of High-Resolution Satellite Imagery for the Detection of Soybean Sudden Death Syndrome. Remote Sens. 2020, 12, 1213. [Google Scholar] [CrossRef] [Green Version]
  20. Yue, S.; Wenjiang, H.; Huichun, Y.; Chao, R.; Naichen, X.; Yun, G.; Yingying, D.; Dailiang, P. Partial Least Square Discriminant Analysis Based on Normalized Two-Stage Vegetation Indices for Mapping Damage from Rice Diseases Using PlanetScope Datasets. Sensors 2018, 18, 1901. [Google Scholar] [CrossRef] [Green Version]
  21. Calderón, R.; Navas-Cortés, J.A.; Lucena, C.; Zarco-Tejada, P.J. High-resolution airborne hyperspectral and thermal imagery for early detection of Verticillium wilt of olive using fluorescence, temperature and narrow-band spectral indices. Remote Sens. Environ. 2013, 139, 231–245. [Google Scholar] [CrossRef]
  22. Chemura, A.; Mutanga, O.; Dube, T. Separability of coffee leaf rust infection levels with machine learning methods at Sentinel-2 MSI spectral resolutions. Precis. Agric. 2017, 18, 859–881. [Google Scholar] [CrossRef]
  23. Zheng, Q.; Huang, W.; Cui, X.; Shi, Y.; Liu, L. New spectral index for detecting wheat yellow rust using Sentinel-2 multispectral imagery. Sensors 2018, 18, 868. [Google Scholar] [CrossRef] [PubMed] [Green Version]
  24. Fernández-Manso, A.; Fernández-Manso, O.; Quintano, C. Sentinel-2A red-edge spectral indices suitability for discriminating burn severity. Int. J. Appl. Earth Obs. Geoinf. 2016, 50, 170–175. [Google Scholar] [CrossRef]
  25. Zarco-Tejada, P.J.; Hornero, A.; Beck, P.S.A.; Kattenborn, T.; Kempeneers, P.; Hernández-Clemente, R. Chlorophyll content estimation in an open-canopy conifer forest with Sentinel-2A and hyperspectral imagery in the context of forest decline. Remote Sens. Environ. 2019, 223, 320–335. [Google Scholar] [CrossRef]
  26. Dengke, L.; Zhao, W.; Feizhou, X. Occurrence regularity and meteorological influencing factors of wheat stripe rust in Shaanxi province. J. Catastrophol. 2019, 34, 59–65. [Google Scholar]
  27. Xu, Q.; Yang, G.; Long, H.; Wang, C.; Li, X.; Huang, D. Crop information identification based on MODIS NDVI time-series data. Nongye Gongcheng Xuebao Trans. Chin. Soc. Agric. Eng. 2014, 30, 134–144. [Google Scholar]
  28. Grinn-Gofroń, A.; Nowosad, J.; Bosiacka, B.; Camacho, I.; Pashley, C.; Belmonte, J.; De Linares, C.; Ianovici, N.; Manzano, J.M.M.; Sadyś, M. Airborne Alternaria and Cladosporium fungal spores in Europe: Forecasting possibilities and relationships with meteorological parameters. Sci. Total Environ. 2019, 653, 938–946. [Google Scholar] [CrossRef]
  29. Newlands, N.K. Model-Based Forecasting of Agricultural Crop Disease Risk at the Regional Scale, Integrating Airborne Inoculum, Environmental, and Satellit-Based Monitoring Data. Front. Environ. Sci. 2018, 6, 16. [Google Scholar] [CrossRef] [Green Version]
  30. Rouse, J.W., Jr.; Haas, R.H.; Schell, J.A.; Deering, D.W. Monitoring vegetation systems in the great plains with Erts. NASA Spec. Publ. 1973, 351, 309. [Google Scholar]
  31. Gitelson, A.A.; Kaufman, Y.J.; Merzlyak, M.N. Use of a green channel in remote sensing of global vegetation from EOS-MODIS. Remote Sens. Environ. 1996, 58, 289–298. [Google Scholar] [CrossRef]
  32. Huete, A.R. A soil-adjusted vegetation index (SAVI). Remote Sens. Environ. 1988, 25, 295–309. [Google Scholar] [CrossRef]
  33. Penuelas, J.; Filella, I.; Lloret, P.; Munoz, F.; Vilajeliu, M. Reflectance assessment of mite effects on apple trees. Int. J. Remote Sens. 1995, 16, 2727–2733. [Google Scholar] [CrossRef]
  34. Huete, A.; Didan, K.; Miura, T.; Rodriguez, E.P.; Gao, X.; Ferreira, L.G. Overview of the radiometric and biophysical performance of the MODIS vegetation indices. Remote Sens. Environ. 2002, 83, 195–213. [Google Scholar] [CrossRef]
  35. Roujean, J.L.; Breon, F.M. Estimating PAR absorbed by vegetation from bidirectional reflectance measurements. Remote Sens. Environ. 1995, 51, 375–384. [Google Scholar] [CrossRef]
  36. Gamon, J.A.; Surfus, J.S. Assessing leaf pigment content and activity with a reflectometer. New Phytol. 1999, 143, 105–117. [Google Scholar] [CrossRef]
  37. Gitelson, A.A.; Kaufman, Y.J.; Stark, R.; Rundquist, D. Novel algorithms for remote estimation of vegetation fraction. Remote Sens. Environ. 2002, 80, 76–87. [Google Scholar] [CrossRef] [Green Version]
  38. Gitelson, A.; Merzlyak, M.N. Quantitative estimation of chlorophyll-a using reflectance spectra: Experiments with autumn chestnut and maple leaves. J. Photochem. Photobiol. B Biol. 1994, 22, 247–252. [Google Scholar] [CrossRef]
  39. Breiman, L. Random Forests. Mach. Learn. 2001, 45, 5–32. [Google Scholar] [CrossRef] [Green Version]
  40. Shi, Y.; Huang, W.; González-Moreno, P.; Luke, B.; Dong, Y.; Zheng, Q.; Ma, H.; Liu, L. Wavelet-Based Rust Spectral Feature Set (WRSFs): A Novel Spectral Feature Set Based on Continuous Wavelet Transformation for Tracking Progressive Host–Pathogen Interaction of Yellow Rust on Wheat. Remote Sens. 2018, 10, 525. [Google Scholar] [CrossRef] [Green Version]
  41. Zheng, Q.; Huang, W.; Ye, H.; Dong, Y.; Shi, Y.; Chen, S. Using continous wavelet analysis for monitoring wheat yellow rust in different infestation stages based on unmanned aerial vehicle hyperspectral images. Appl. Opt. 2020, 59, 8003–8013. [Google Scholar] [CrossRef] [PubMed]
  42. Vapnik, V.N. The Nature of Statistical Learning Theory; Springer: Berlin, Germany, 1995. [Google Scholar]
  43. Ye, H.; Huang, W.; Huang, S.; Cui, B.; Jin, Y. Identification of banana fusarium wilt using supervised classification algorithms with UAV-based multi-spectral imagery. Int. J. Agric. Biol. Eng. 2020, 13, 136–142. [Google Scholar]
  44. Martí, P.; Shiri, J.; Duran-Ros, M.; Arbat, G.; de Cartagena, F.R.; Puig-Bargués, J. Artificial neural networks vs. Gene Expression Programming for estimating outlet dissolved oxygen in micro-irrigation sand filters fed with effluents. Comput. Electron. Agric. 2013, 99, 176–185. [Google Scholar] [CrossRef]
  45. Azarmdel, H.; Jahanbakhshi, A.; Mohtasebi, S.S.; Munoz, A.R. Evaluation of image processing technique as an expert system in mulberry fruit grading based on ripeness level using artificial neural networks (ANNs) and support vector machine (SVM). Postharvest Biol. Technol. 2020, 166, 12. [Google Scholar] [CrossRef]
  46. Congalton, R.G.; Mead, R.A. A quantitative method to test for consistency and correctness in photointerpretation. Photogramm. Eng. Remote Sens. 1983, 49, 69–74. [Google Scholar]
  47. Das, P.K.; Laxman, B.; Rao, S.V.C.K.; Seshasai, M.V.R.; Dadhwal, V.K. Monitoring of bacterial leaf blight in rice using ground-based hyperspectral and LISS IV satellite data in Kurnool, Andhra Pradesh, India. PANS Pest Artic. News Summ. 2015, 61, 359–368. [Google Scholar] [CrossRef]
  48. Chemura, A.; Mutanga, O.; Sibanda, M.; Chidoko, P. Machine learning prediction of coffee rust severity on leaves using spectroradiometer data. Trop. Plant Pathol. 2017, 43, 117–127. [Google Scholar] [CrossRef]
  49. Devadas, R.; Lamb, D.W.; Backhouse, D.; Simpfendorfer, S. Sequential application of hyperspectral indices for delineation of stripe rust infection and nitrogen deficiency in wheat. Precis. Agric. 2015, 16, 477–491. [Google Scholar] [CrossRef] [Green Version]
  50. Shi, S.; Ma, Z.; Wang, H.; Zhao, Z.; Jiang, Y. Climate-based regional classification for overwintering of Puccinia striiformis in China with GIS and geostatistics. J. Northwest Sci-Tech Univ. Agric. For. 2005, 32, 29–32. [Google Scholar]
  51. Bandos, T.V.; Bruzzone, L.; Camps-Valls, G. Classification of Hyperspectral Images with Regularized Linear Discriminant Analysis. IEEE Trans. Geosci. Remote Sens. 2009, 47, 862–873. [Google Scholar] [CrossRef]
  52. Pal, M.; Mather, P.M. Support vector machines for classification in remote sensing. Int. J. Remote Sens. 2005, 26, 1007–1011. [Google Scholar] [CrossRef]
  53. Zhang, X.; Han, L.X.; Dong, Y.Y.; Shi, Y.; Huang, W.J.; Han, L.H.; Gonzalez-Moreno, P.; Ma, H.Q.; Ye, H.C.; Sobeih, T. A Deep Learning-Based Approach for Automated Yellow Rust Disease Detection from High-Resolution Hyperspectral UAV Images. Remote Sens. 2019, 11, 1554. [Google Scholar] [CrossRef] [Green Version]
Figure 1. Parameters and information of Sentinel-2 multispectral satellite.
Remotesensing 13 00278 g001
Figure 2. Map of Ningqiang county, Shaanxi province in China. Green crosses denote field survey locations of healthy wheat, red denote field survey locations of yellow rust-infested wheat.
Remotesensing 13 00278 g002
Figure 3. Mean and difference values for healthy wheat and yellow rust infected wheat. (a) Single—stage vegetation indices and (b) normalized two—stage vegetation indices.
Remotesensing 13 00278 g003
Figure 4. Spatial interpolation of meteorological data in Ningqiang county in May 2018. (a) Average temperature (TEM; 0.1 °C), (b) average relative humidity (RHU; %), (c) average sunshine hours (SSD; 0.1 h), (d) average wind speed (WIN; 0.1 m/s), (e) average of precipitation (PRE; 0.1 mm).
Remotesensing 13 00278 g004
Figure 5. Variable importance of vegetation indices and meteorological factors in identifying yellow rust-infected wheat. (a) Vegetation indices (VIs) and normalized VIs (nVIs) based on a single- and two-stage imagery; (b) meteorological data from March to May 2018.
Remotesensing 13 00278 g005
Figure 6. Mapping wheat yellow rust disease in Ningqiang county during the filling period (May 2018) based on the support vector machine (SVM) algorithm using two-stage spectral vegetation indices and meteorological data.
Remotesensing 13 00278 g006
Table 1. Multispectral vegetation indices for wheat yellow rust discrimination.
Vegetation IndicesNameFormulaReference
NDVINormalized differece vegetation index ( R N I R R R ) / ( R N I R + R R ) [30]
GNDVIGreen normalized difference vegetation index ( R N I R R G ) / ( R N I R + R G ) [31]
SAVISoil adjusted vegtation index ( ( R N I R R R ) 1.5 ) / ( R N I R + R R + 0.5 ) [32]
SIPIStructural independent pigment index ( R N I R R B ) / ( R N I R R R ) [33]
EVIEnhanced vegetation index 2.5 ( R N I R R R ) / ( R N I R + 6 R R 0.5 R B + 1 ) [34]
RDVIRe—noramalied difference vegetation index ( R N I R R R ) / ( R N I R + R R ) [35]
RGRRation of red and green R R / R G [36]
VARIgreenVisible atmospherically resistant index ( R G R R ) / ( R G + R R ) [37]
NDVIre1Normalied difference vegetation index red—edge1 ( R N I R R Re 1 ) / ( R N I R + R Re 1 ) [30]
NREDI1Normalied red—edge1 index ( R Re 2 R R e 1 ) / ( R Re 2 + R R e 1 ) [38]
NREDI2Normalied red—edge2 index ( R Re 3 R R e 1 ) / ( R Re 3 + R R e 1 ) [38]
NREDI3Normalied red—edge3 index ( R Re 3 R R e 2 ) / ( R Re 3 + R R e 2 ) [38]
PSRI1Plant senescence reflectance index ( R R R G ) / R Re 1 [24]
REDSIRed—edge disease stress index ( ( 705 665 ) ( R Re 3 R R ) ( 783 665 ) ( R Re 1 R R ) ) / ( 2 R R ) [23]
Table 2. Key parameters used for support vector machine (SVM) and artificial neural network (ANN) classification.
ClassifierParameter NameDescriptionOptimized Parameter
SVMsType of SVM0 (SVC)
tType of kernel function2 (RBF)
cRegularization parameter1
γKernel coefficient for “RBF”0.5
ANNNumber of hidden neurons-[10,2]
net.trainParam.lrLearning rate0.01
net.trainParam.epochsLearning number13
net.trainParam.goalTarget error0.01
Table 3. ANOVA for vegetation indices feature sets (VIs and nVIs).
VIsRDVINDVIre1NREDI3VARIgEVIREDSIRGRSAVIPSRI1
RDVI-
NDVIre10.0180 a-
NREDI30.0047 b0.31-
VARIg0.0087 b0.0660.043 a-
EVI0.12500.0580.032 a0.04 a-
REDSI0.0016 b0.1320.0007 c0.002 b0.15-
RGR0.0003 c0.027 a0.0035 b0.012 a0.03 a0.015 a-
SAVI0.09100.1320.001 b0.019 a0.160.001b0.05-
PSRI10.0370 a0.2240.0009 c0.320.060.1290.009 b0.078-
nVIsnREDSI1nNREDI3nVARIgnNDVIre1nNREDI1nPSRI1nNREDI2nSAVI
nREDSI1-
nNREDI30.14-
nVARIgr0.0001 c0.14-
nNDVIre10.0720.060.019 a-
nNREDI10.002 b0.270.0004 c0.0002 c-
nPSRI10.0005 c0.380.0027 b0.0004 c0.0002 c-
nNREDI20.350.060.00030.026 a0.0004 c0.003 b-
nSAVI0.0004 c0.0740.150.0001 c0.110.0009 c0.26-
Note: “a” indicates the difference is significant at the 0.95 confidence level, “b” indicates the difference is significant at the 0.99 confidence level, and “c” indicates the difference is significant at the 0.999 confidence level; “VARIg” = VARIgreen, “nVARIg” = nVARIgreen,” and “mete” = meteorological.
Table 4. Classification accuracies of three classification algorithms using single- and two-stage vegetation indices (VIs and nVIs, respectively; n = 19).
ClassifierVIsnVIs
LDAHealthyYRP.a (%)OA (%)KappaHealthyYRP.a (%)OA (%)Kappa
Healthy3342.963.20.184357.168.40.32
YR4975.0 3975.0
U.a (%)50.069.2 57.175
SVM
Healthy4257.173.70.425271.478.90.55
YR31083.3 21083.3
U.a (%)66.776.9 71.483.3
ANN
Healthy4457.163.20.234357.168.40.32
YR3866.7 3975.0
U.a (%)50.072.7 57.175
Note: P.a = producer’s accuracy, U.a = user’s accuracy, OA = overall classification accuracy.
Table 5. Classification accuracies for three classification algorithms using single- and two-stage vegetation indices (VIs and nVIs, respectively) combined with meteorological data (n = 19).
ClassifierVIs_Meteorological DatanVIs_Meteorological Data
LDAHealthyYRP.a (%)OA (%)KappaHealthyYRP.a (%)OA (%)Kappa
Healthy4357.168.40.324257.173.70.42
YR3975.0 31083.3
U.a (%)57.175.0 66.776.9
SVM
Healthy5271.478.90.555171.484.20.65
YR21083.3 21191.7
U.a (%)71.483.3 83.384.6
ANN
Healthy5371.473.70.455271.478.90.55
YR2975.0 21083.3
U.a (%)62.581.8 71.483.3
Publisher’s Note: MDPI stays neutral with regard to jurisdictional claims in published maps and institutional affiliations.

