Article

Impacts of Urbanization on the Muthurajawela Marsh and Negombo Lagoon, Sri Lanka: Implications for Landscape Planning towards a Sustainable Urban Wetland Ecosystem

by
Darshana Athukorala
1,*,
Ronald C. Estoque
2,
Yuji Murayama
3 and
Bunkei Matsushita
3
1
Graduate School of Life and Environmental Sciences, University of Tsukuba, 1-1-1 Tennodai, Tsukuba, Ibaraki 305-8572, Japan
2
National Institute for Environmental Studies, Tsukuba, Ibaraki 305-8506, Japan
3
Faculty of Life and Environmental Sciences, University of Tsukuba, 1-1-1, Tennodai, Tsukuba, Ibaraki 305-8572, Japan
*
Author to whom correspondence should be addressed.
Submission received: 25 November 2020 / Revised: 11 January 2021 / Accepted: 12 January 2021 / Published: 18 January 2021

Abstract

:
Urban wetland ecosystems (UWEs) play important social and ecological roles but are often adversely affected by urban landscape transformations. Spatio-temporal analyses to gain insights into the trajectories of landscape changes in these ecosystems are needed for better landscape planning towards sustainable UWEs. In this study, we examined the impacts of urbanization on the Muthurajawela Marsh and Negombo Lagoon (MMNL), an important UWE in Sri Lanka that provides valuable ecosystem services. We used remote sensing data to detect changes in the land use/cover (LUC) of the MMNL over a two-decade period (1997–2017) and spatial metrics to characterize changes in landscape composition and configuration. The results revealed that the spatial and socio-economic elements of rapid urbanization of the MMNL had been the main driver of transformation of its natural environment over the past 20 years. This is indicated by a substantial expansion of settlements (+68%) and a considerable decrease of marshland and mangrove cover (−41% and −21%, respectively). A statistical analysis revealed a significant relationship between the change in population density and the loss of wetland due to settlement expansion at the Grama Niladhari division level (n = 99) (where wetland includes marshland, mangrove, and water) (1997–2007: R2 = 0.435, p = 0.000; 2007–2017: R2 = 0.343, p = 0.000). The findings also revealed that most of the observed LUC changes occurred in areas close to roads and growth nodes (viz. Negombo, Ja-Ela, Wattala, and Katana), which resulted in both landscape fragmentation and infill urban expansion. We conclude that, in order to ensure the sustainability of the MMNL, there is an urgent need for forward-looking landscape and urban planning to promote environmentally conscious urban development in the area which is a highly valuable UWE.

Graphical Abstract

1. Introduction

Although wetlands account only for 4–6% of the world’s surface area [1], they are regarded as one of the most productive ecosystems [2,3]. A wetland ecosystem includes marsh, fen, peatland, shallow water areas, as well as natural and human-made areas with evidence of intermittent and permanent waterlogged areas between natural wet aquatic habitats and dry terrestrial ecosystems [4,5]. Wetlands provide valuable social and ecological benefits, e.g., coastal protection, flood control, carbon sequestration and biodiversity conservation, among other ecosystem services [6,7,8,9]. As such, wetlands play important roles in the context of the United Nations’ sustainable development goals (SDGs) and targets [10,11,12]. Unfortunately, almost 64–71% of the world’s wetlands have been transformed, degraded or have disappeared in recent decades as a result of anthropogenic activities, including industrialization, agriculture, and urbanization [1,13,14,15].
In 2018, more than 55% of the world’s population lived in urban areas, and this proportion is projected to reach 68% by 2050 [16]. Such a development would exert tremendous pressure on the natural environment across urban areas in the world as large areas transform to impervious surfaces. Studies have shown that rapid, uncontrolled, and unplanned urbanization has been impacting the quality of urban ecological environments across the world [17,18,19,20,21,22], including urban wetland ecosystems (UWEs) [23,24,25,26,27].
Advances in geospatial technology, including geographic information systems (GIS) and remote sensing, have greatly improved the monitoring of landscape changes over space and time. Today, information derived from these advancements provides important input to landscape planning and decision-making in many contexts, biodiversity conservation [28,29,30,31], and sustainable urbanization [32,33,34]. In fact, Earth observation technologies, particularly remote sensing, play important roles in the monitoring of various social and ecological indicators related to the United Nations’ SDGs and targets [35], including those that are associated with wetlands [11,36,37].
With changes in land use/cover (LUC) due to urbanization, natural landscapes suffer from irreversible transformation [38]. The monitoring of landscape status over space and time is hence an essential endeavor. Scholars have shown the usefulness of geospatial techniques for characterizing landscape patterns, including those of UWEs [27,39,40], and their changes over time [41,42,43]. Such information that facilitates impact analysis on ecosystem services and biodiversity [44,45,46] can be used to direct landscape and urban development planning towards sustainable UWEs [45,47,48].
The Muthurajawela Marsh and Negombo Lagoon (MMNL), the biggest coastal saltwater peat bog in Sri Lanka, is located on the western coastal belt between the Kelani River and Negombo Lagoon lying inland to Katana, Wattala, Ja-Ela, and Negombo in the Gampaha District of the Western Province. The Muthurajawela Marsh, together with the lagoon, creates an integrated coastal wetland ecosystem. The complex development of this landscape during the Holocene period (Circa 6000–5000 years) progressed after the final glacial period (Figure 1) [49,50,51]. The MMNL has been, and is still today, an important UWE in the country. Its estimated monetary value is around Rs 726.5 million per year, including benefits from flood prevention, treatment of wastewater, and shallow coastal fisheries [52].
The Colombo Metropolitan Region (CMR), the country’s capital and the location of the MMNL, has grown very rapidly over the recent decades. For example, CMR’s population grew from 3.9 million in 1981 to 5.8 million in 2012 [53]. Consequently, the area of built-up lands in the CMR also expanded dramatically from 11,165 ha in 1992 to 35,876 ha in 2014 [54]. There have been several studies on MMNL [55,56], but a study that focuses on the impacts of urbanization on this highly valuable UWE is still lacking.
Hence, the focus in this study is specifically on detecting changes in the LUC and examining the landscape composition and configuration of the MMNL over the past two decades (1997–2017) by using remote sensing data and spatial metrics respectively. The loss of wetland (water, mangrove, and marshland) due to urbanization (settlement expansion) was quantified and the influence of population growth to this LUC transition was investigated. The implications of the findings for landscape and urban planning towards sustainable UWEs are discussed.

2. Materials and Methods

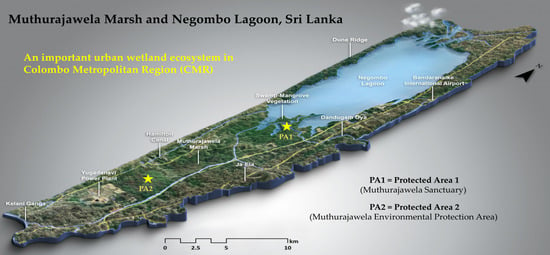
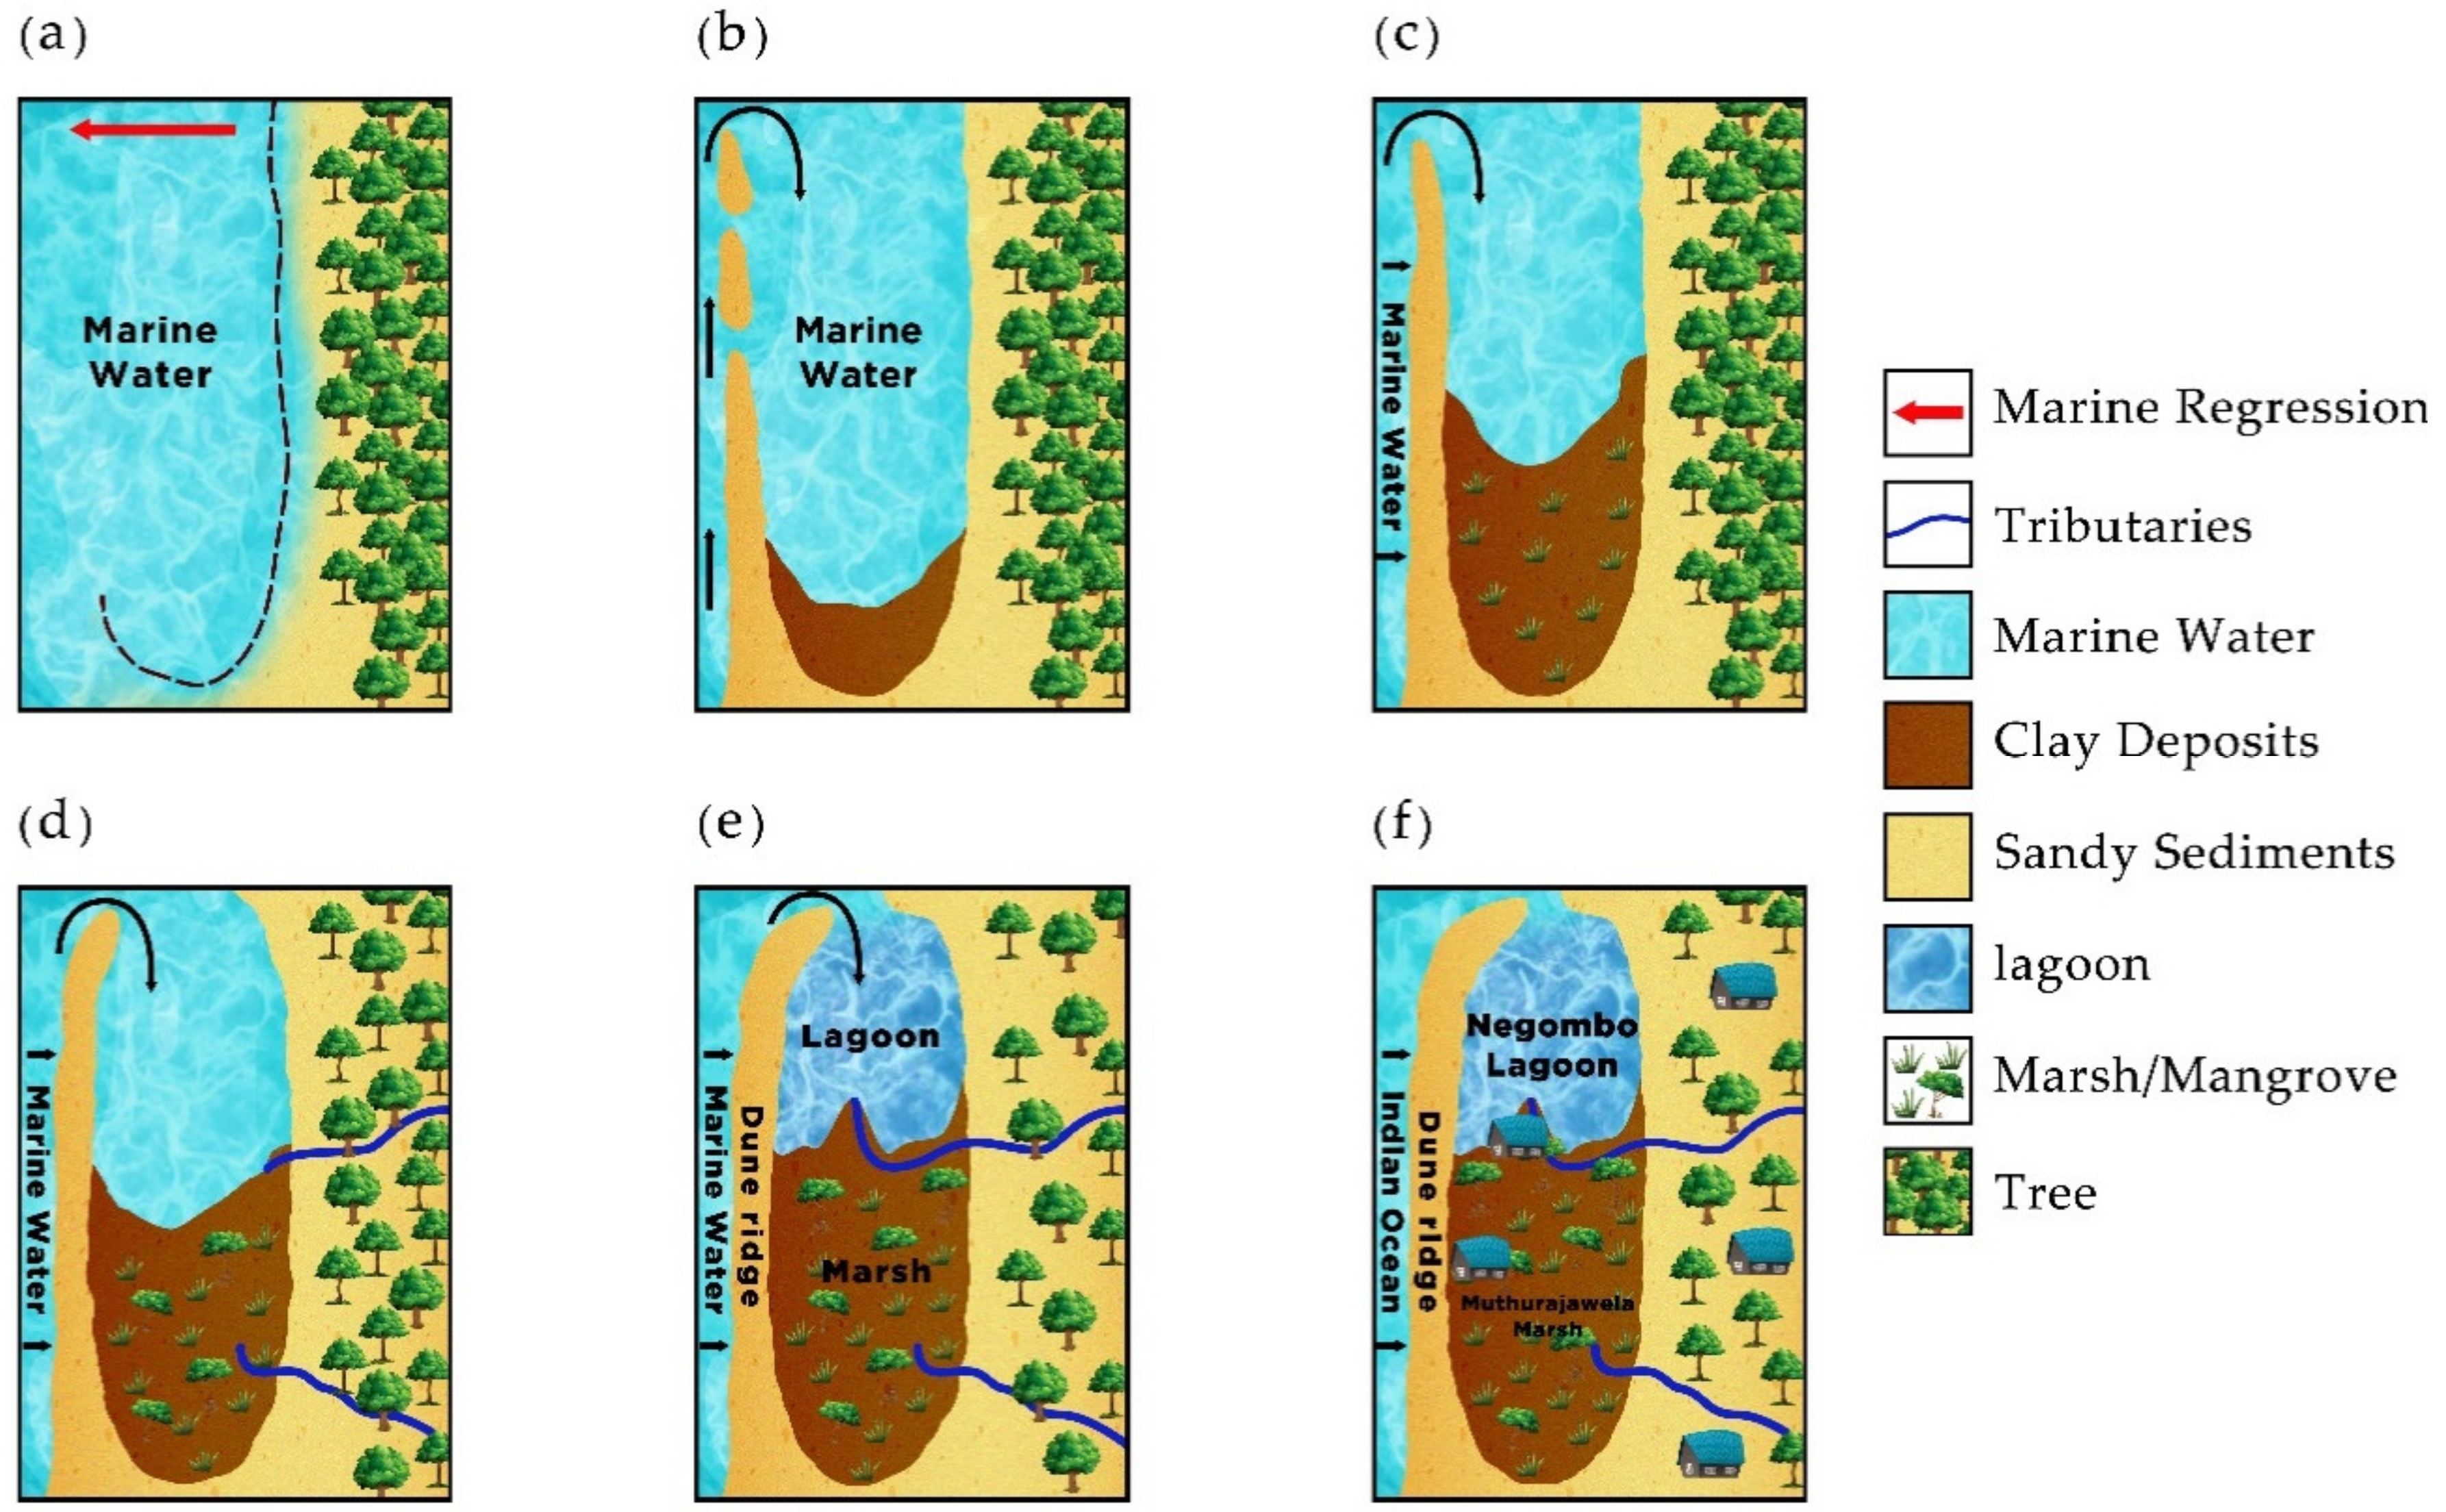
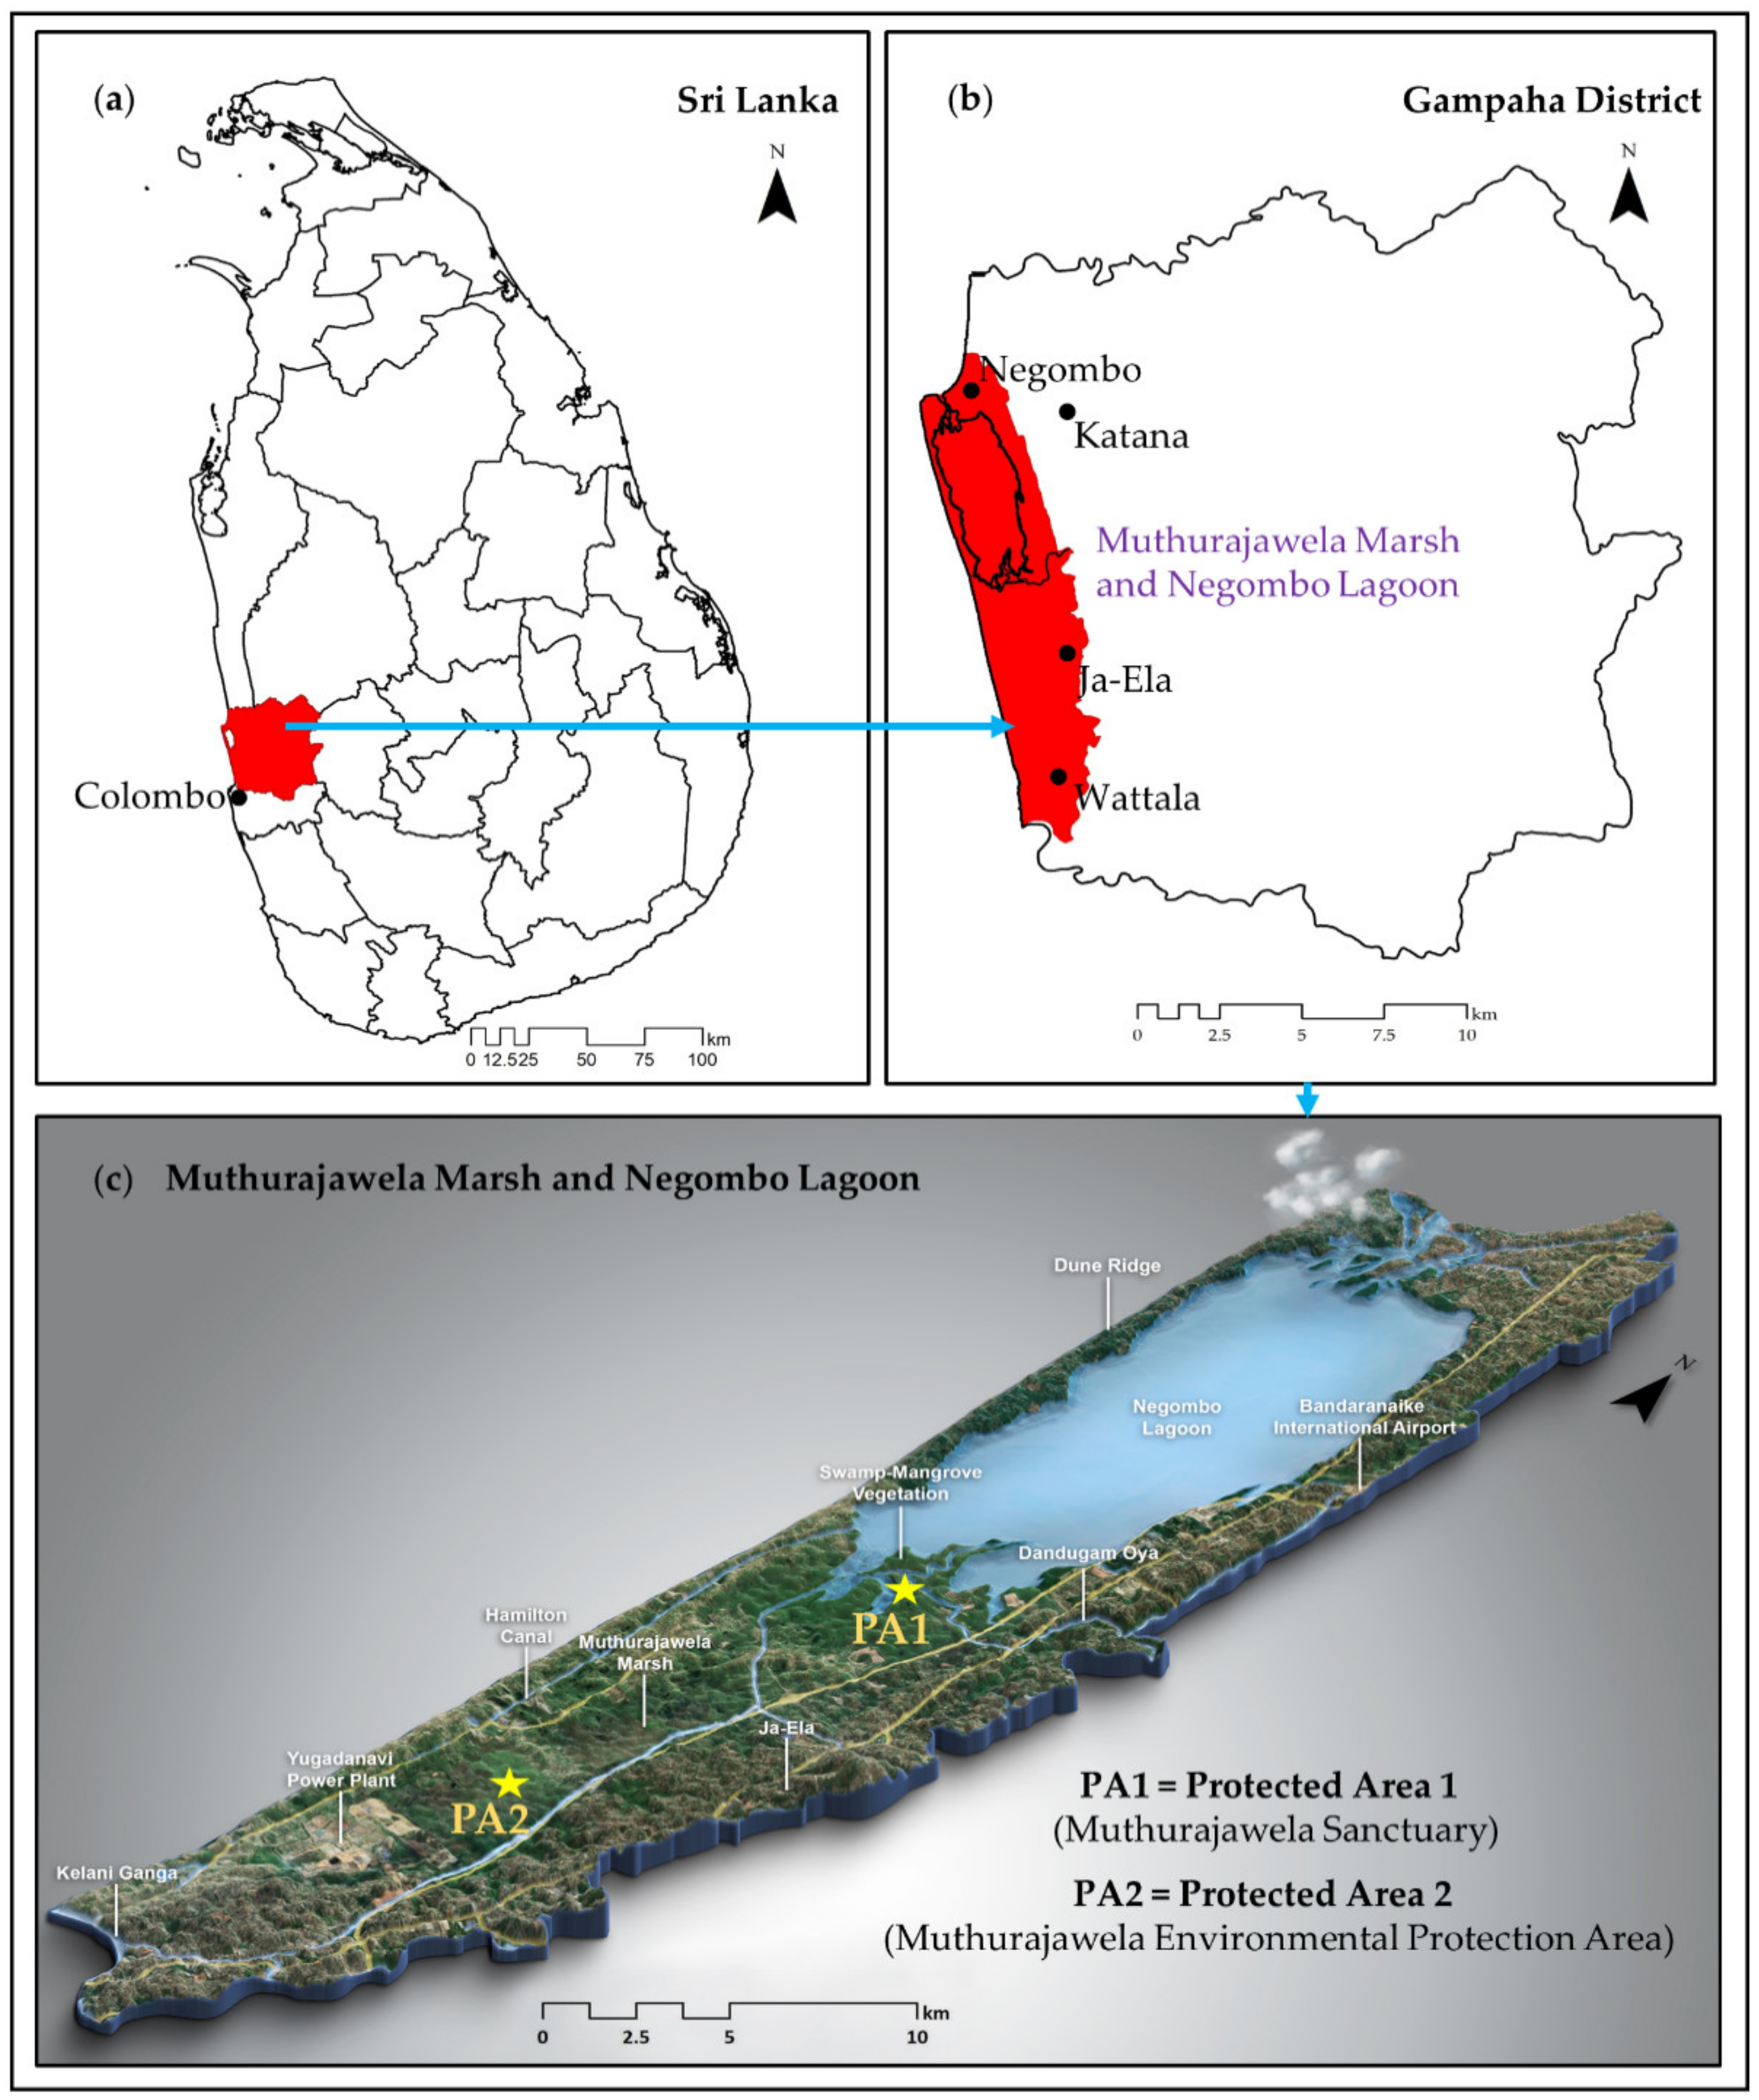
2.1. The MMNL, Sri Lanka

The MMNL, extending over roughly 134 km2 (Figure 2), consists of the Gampaha District’s four Divisional Secretariats (DS). This area has been experiencing rapid urbanization and economic growth over the past three decades. The landscape of the MMNL encompasses various land surface features, including the lagoon and marsh and mangrove areas, as well as some highly and moderately urbanized lands.
The MMNL receives freshwater from the eastward direction via two channels (viz. lower Aththanagalu Oya and lower Kelani Ganga). The area has a gentle slope, with an elevation range of 0–30 m. According to the geological timetable, the MMNL belongs to the Quaternary soil group, which is composed of soil deposits from wind-blown sands, river deposits, and lacustrine sediments [57]. The area has a tropical monsoon climate as per the Koppen classification [58]. The wet season is from May to September, and the dry season is from December to early March. Mean annual rainfall is between 2000 mm and 2500 mm, with mean annual daytime temperatures ranging from 22.5 °C to 25.0 °C [59].
Demographically, the MMNL contains urban and rural settlements. However, due to a rising population and rapid urban expansion, many parts of this valuable UWE have become highly vulnerable to the impacts of urbanization, including the Muthurajawela Marsh, which contains two protected areas (Figure 2). The lagoon is a shallow-water coastal water body and a highly productive fish area [52]. It is joined to the Indian Ocean by a single narrow opening in the north. This, too, will continue to be affected if the rapid urbanization of the area is not controlled and carefully planned.
In fact, the lagoon had initially been utilized by the fishing industry and the neighboring area had been occupied by settlements and industries [51,60]. However, over the past 60 years, parts of the lagoon have been reclaimed for various purposes, including illegitimate settlements that have extended to intertidal sands along the channel segments of the estuary [51,52]. Unlawful activities, such as illegal settlements, illegal fishing, and illegal cutting of trees, as well as waste dumping and water pollution, are among the important current concerns with regard to the management of the MMNL [51,52].

2.2. LUC Mapping

We used three Landsat images for this study, viz. two TM (Thematic Mapper) images captured in 1997-02-07 and 2007-01-02, and one OLI/TIRS (Operational Land Imager/ Thermal Infrared Sensor) image captured in 2017-01-31. They were sourced from the USGS (https://earthexplorer.usgs.gov/). The images have a spatial resolution of 30 m. Only one Landsat scene was needed for the study area. Temporal consistency and cloud cover were considered in the selection of the images. All the images were acquired during the cloud-free, dry season.
Before LUC classification, we first created a wetland classification scheme comprising four classes: settlement, marshland, mangrove, and water (Table 1). These LUC classes reflect the physical characteristics of the study area and have been widely used in previous studies [61,62,63].
The three Landsat images were classified using a hybrid classification method, i.e., a combination of unsupervised and supervised classification techniques [64,65], which was performed in ArcGIS 10.6. First, we used the ISODATA clustering algorithm, an unsupervised classification algorithm, to produce 14 clusters for each image. We used bands 5, 4, and 3 for the TM images and bands 6, 5, and 4 for the OLI/TIRS image. Second, we performed a supervised classification using the maximum likelihood algorithm and the result of the first step as input. For the training sites, we digitized 15 training samples for each class, where the number of pixels per sample ranged from 20 to 782. In total, we digitized 60 samples per image. We assessed the accuracy of the classified 1997, 2007, and 2017 LUC maps using 400 random points. Google Earth was the source of reference data for 2007 and 2017. For 1997, we used topographic maps from the Survey Department of Sri Lanka [66].

2.3. Assessment of LUC Changes in the MMNL

We calculated the loss and gain areas and rates for each LUC class using Equations (1) and (2), respectively [67].
L / G   a r e a   = A b   A a
L / G   r a t e   ( % )   =   A b A a / A a × 100
where L/G area refers to the area that each class lost or gained (ha) between two time points. L/G rate refers to the percentage of loss or gain (%) of each class area. Aa and Ab are the beginning and the end values of each class, respectively.

2.4. Assessment of Wetland Loss Across Grama Niladhari (GN) Divisions

Due to rapid urbanization, there is a high likelihood of the wetland area and its surrounding areas being converted to urban land use. Here, we identified the top wetland-losing GNs susceptible to urbanization (settlement expansion) over the study period. Currently, there are 99 GN divisions in the study area. To do this, we calculated the density of wetland loss due to urbanization across the GNs during the first time period (TP1) (1997–2007) and second time period (TP2) (2007–2017) using Equations (3) and (4), respectively.
W L D T P 1 % = W L T P 1 A × 100
W L D T P 2 % = W L T P 2 A × 100
where W L D T P 1 %   and W L D T P 2 % refer to the density of wetland loss density in a particular GN due to urbanization (settlement expansion) during the two time periods (first and second, respectively). W L T P 1 and W L T P 2 are the areas of wetland loss in a particular GN due to urbanization during the two time periods (first and second, respectively). A refers to the area of a particular GN. Wetland includes water, mangrove, and marshland.

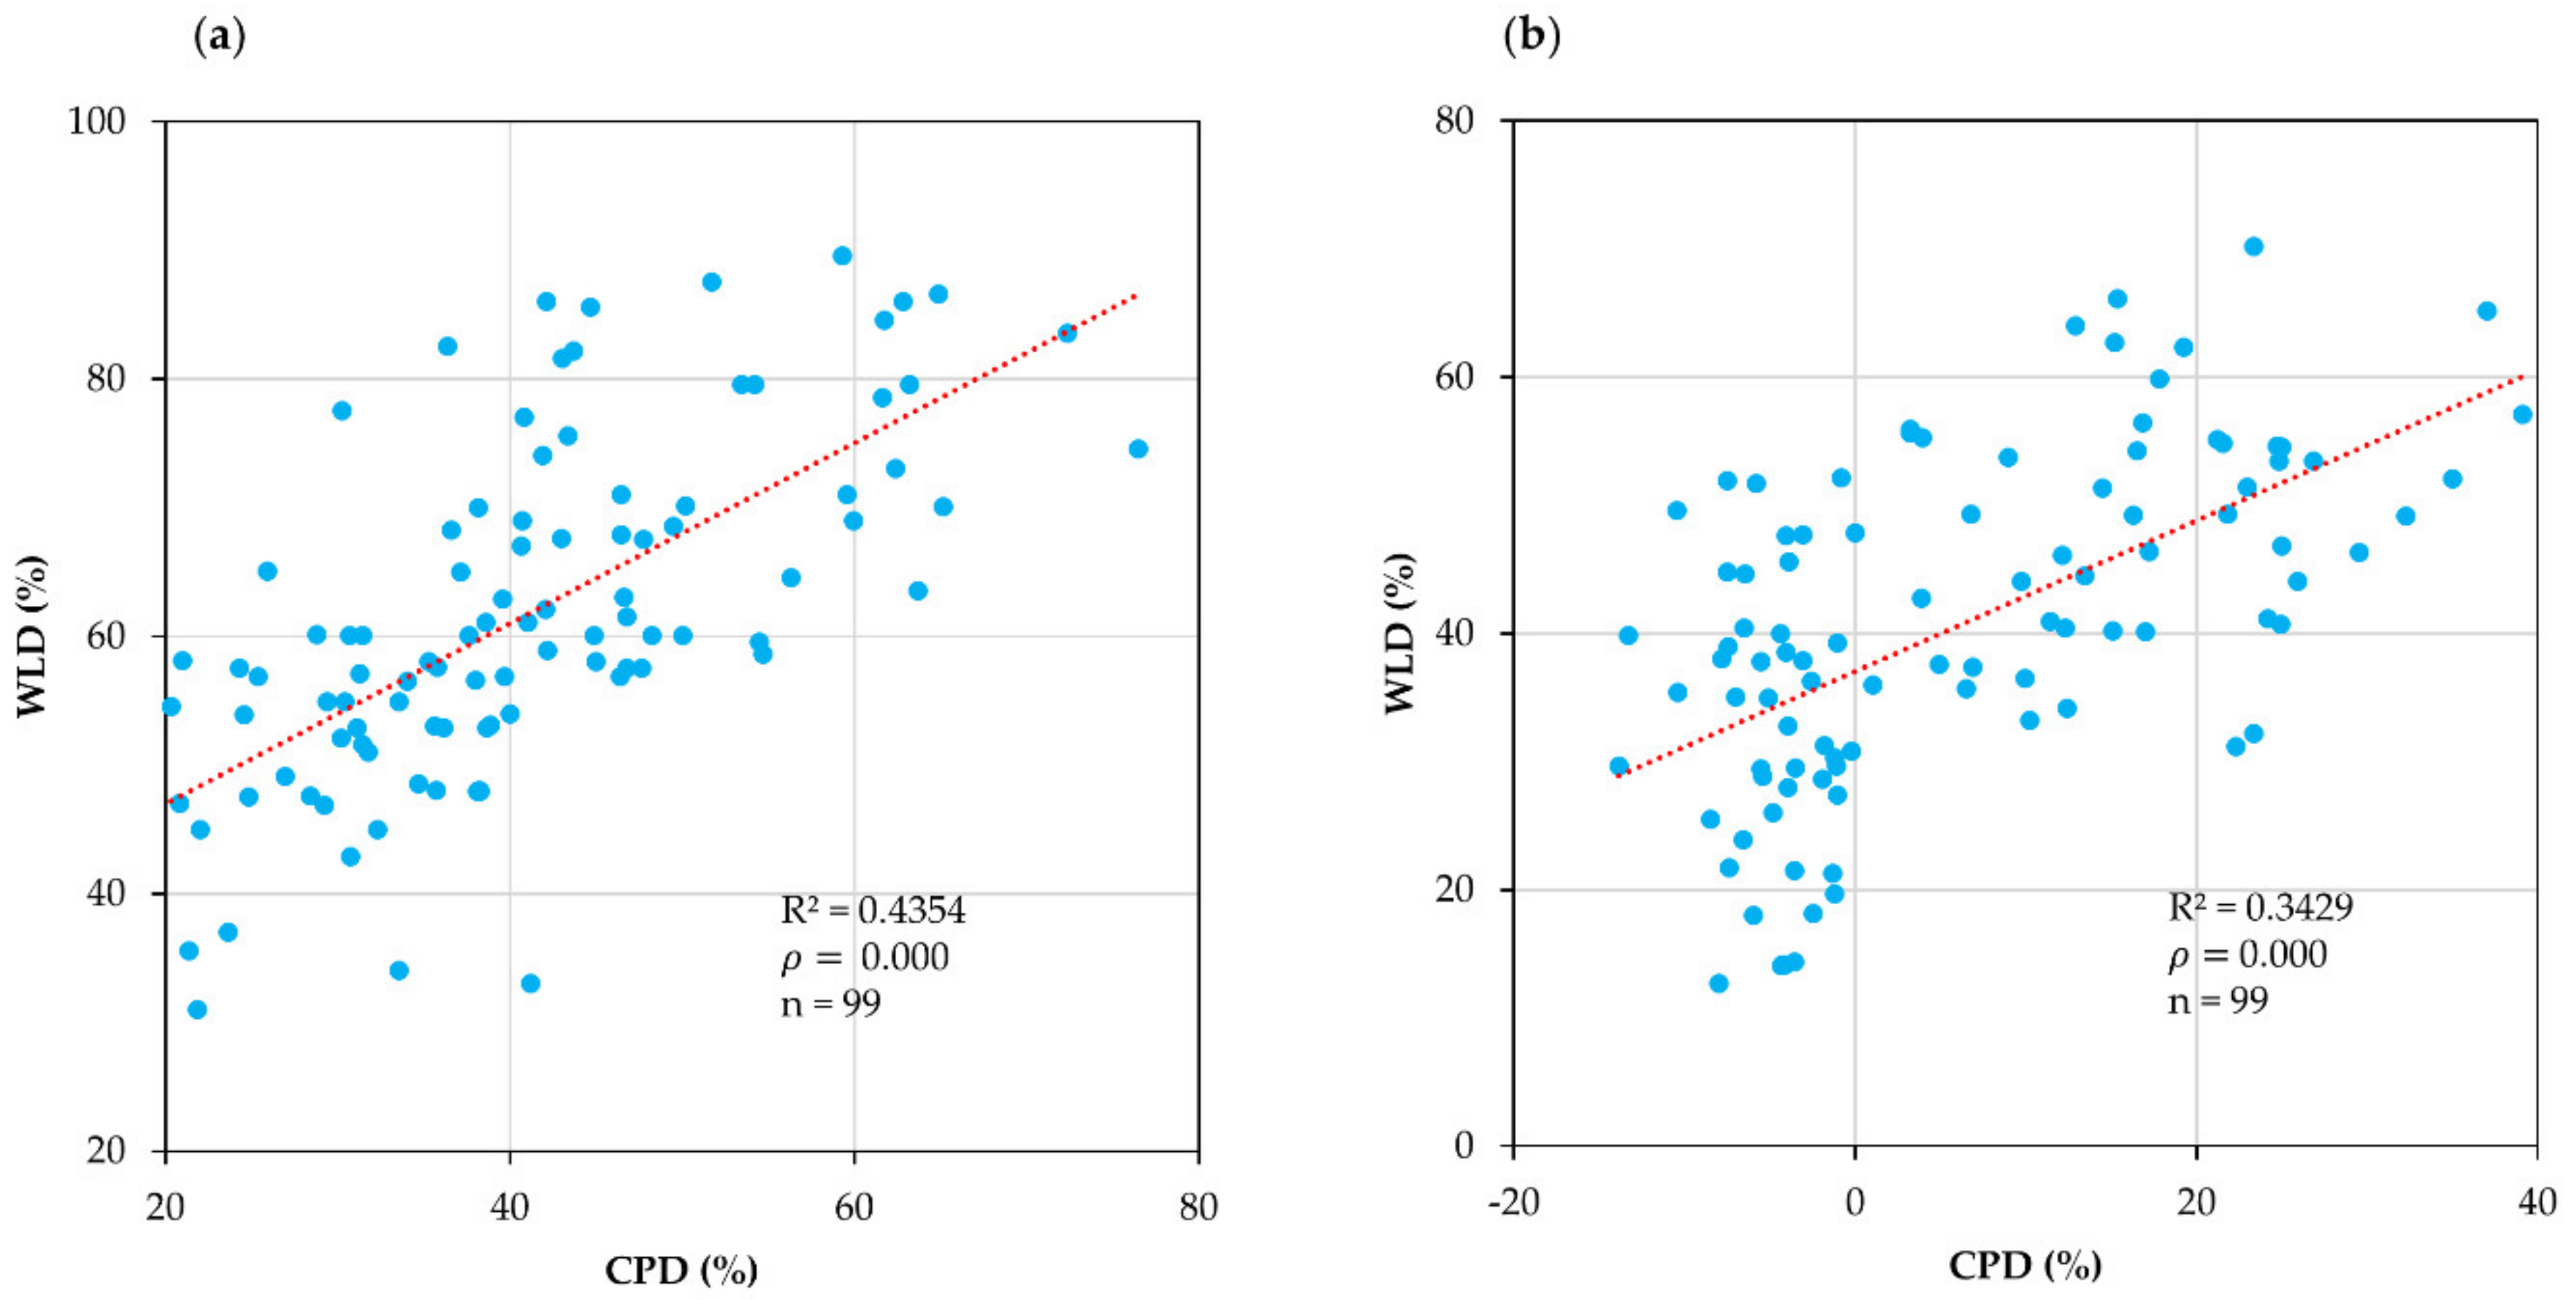
2.5. Relationship between Urbanization and Wetland Loss

We examined the relationship between urbanization as proxied by the change in population density (CPD) (Equations (5) and (6)) and density of wetland loss due to settlement expansion (WLD) at the GN division level. Since the 1997, 2007, and 2017 population data at the GN division level were not available, we extrapolated such data based on the average population growth rate (APGR) of Katana Wattala, Ja-Ela, and Negombo DS divisions for 1981, 2001, and 2012 census years. Each of these DS divisions consisted of a number of GN divisions. Thus, for those GN divisions that belonged to a particular DS division, only one APGR was used. Finally, scatter plots were produced between CPD (x) and WLD (y) for both periods (TP1 and TP2) to examine the relationship between urbanization and wetland loss.
C P D T P 1 % = P D 2007 P D 1997 P D 1997 × 100
C P D T P 2 % = P D 2017 P D 2007 P D 2007 × 100
where C P D T P 1 %   and C P D T P 2 % refer to the change in population density in a particular GN during the two time periods (first and second, respectively). P D refers to the population density of a particular GN.

2.6. Landscape Pattern Analysis

Many scholars have discussed the usefulness of spatial metrics for landscape pattern analysis [68,69]. Landscape-level metrics provide general information about landscape patterns in the study area. On the other hand, class-level metrics include more detailed descriptions of landscape patterns based on class-level information. Using FRAGSTATS V4.2, landscape-level and class-level metrics were computed to gain insights into the changes in the landscape pattern of the MMNL (Table 2).

3. Results

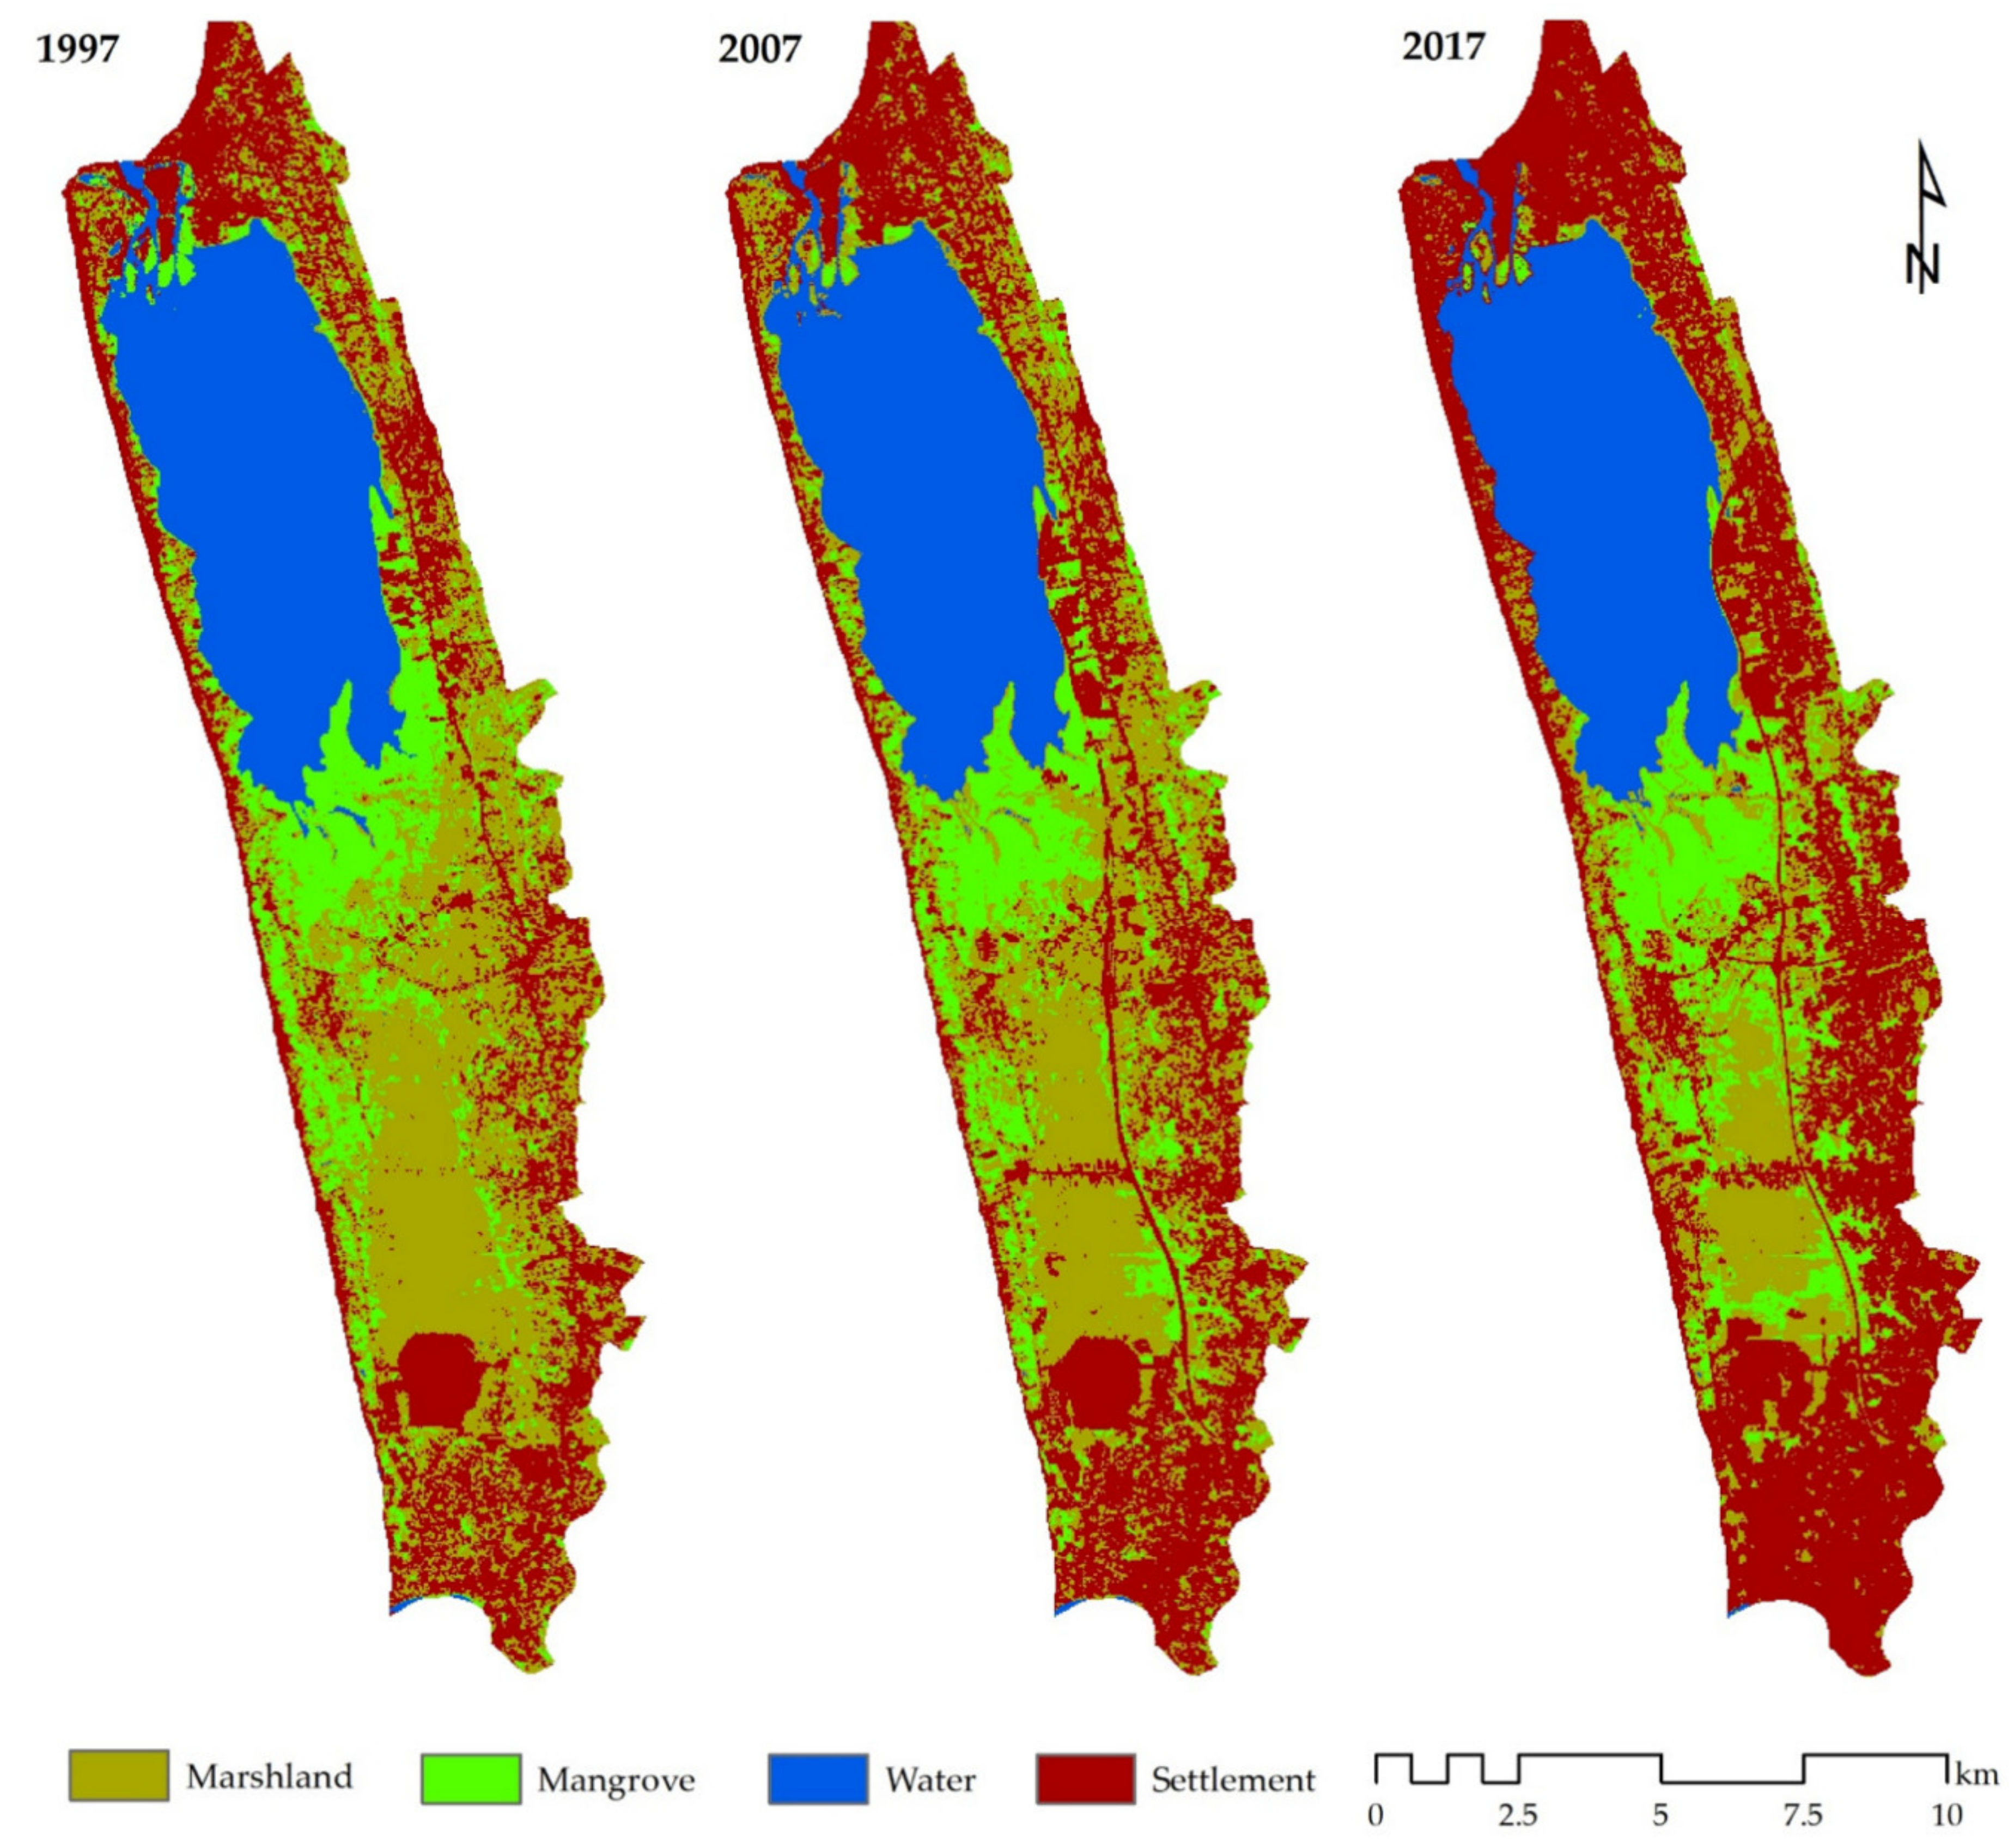
3.1. Classification Accuracy and LUC Changes

The overall accuracy of the three classified LUC maps was 83.0% in 1997, 84.5% in 2007, and 84.8% in 2017 (Appendix A Table A1). The primary cause of the classification errors was spectral confusion because some of the pixels of the LUC classes had similar spectral reflectance due to soil moisture levels and vegetation types [71,72]. We found that some mangrove pixels were misclassified as marsh, and some marsh pixels were misclassified as settlements and mangroves, and so on (Appendix A Table A1). Nevertheless, the accuracy levels of the classified LUC maps of the MMNL are adequate for this study. Other related studies have reported overall accuracies ranging from 69% to 82% [73,74,75].
The LUC change analysis revealed that marshland in the MMNL had been drastically shrinking due primarily to the expansion of settlements. For example, of the 1767 ha and 2282 ha total loss of the marshland class in TP1 and TP2, respectively, 820.89 ha (43%) and 691.92 ha (42%) were lost from the mangrove class (Figure 3 and Table 3). During TP1, the settlement class gained a total area of 1464 ha, whereas during TP2, it gained a total area 1880.91 ha.
The mangrove class experienced considerable losses to both the marshland and settlement classes in the two periods. There were some gains in the area of the mangrove class, but its total loss outweighed its total gain, resulting in net losses during both periods. Nevertheless, the gain of mangrove from marshland in both periods (520 ha in TP1 and 538 ha in TP2) is a positive sign. This could have been due to the government’s efforts to conserve the MMN by conducting mangrove reforestation activities in previous years.
Table 4 shows the L/G of the LUC classes in the MMNL in terms of area and rate. The results revealed that the mangrove class had a net decrease of 266 ha (14%) and 126 ha (8%) in TP1 and TP2, respectively. The marshland class had a net reduction of 539 ha (11%) and 1406 ha (33%). By contrast, the settlement class had a net increase of 883 ha (25%) and 1528 ha (35%).
Figure 4 shows the spatial distribution of wetland loss due to urbanization (settlement expansion) in both periods, i.e., the loss of marshland, mangrove, and water. The results revealed that the central part (south of the lagoon) and the east part of the MMNL became more fragmented due to road construction. During the 2007–2017 period, the area exhibited a ribbon type of development. Another pattern that emerged is the settlement cluster in the middle, western part of the MMNL. In general, settlements consumed mostly the marshland and mangrove areas in the northern, eastern, and southern parts of the MMNL.

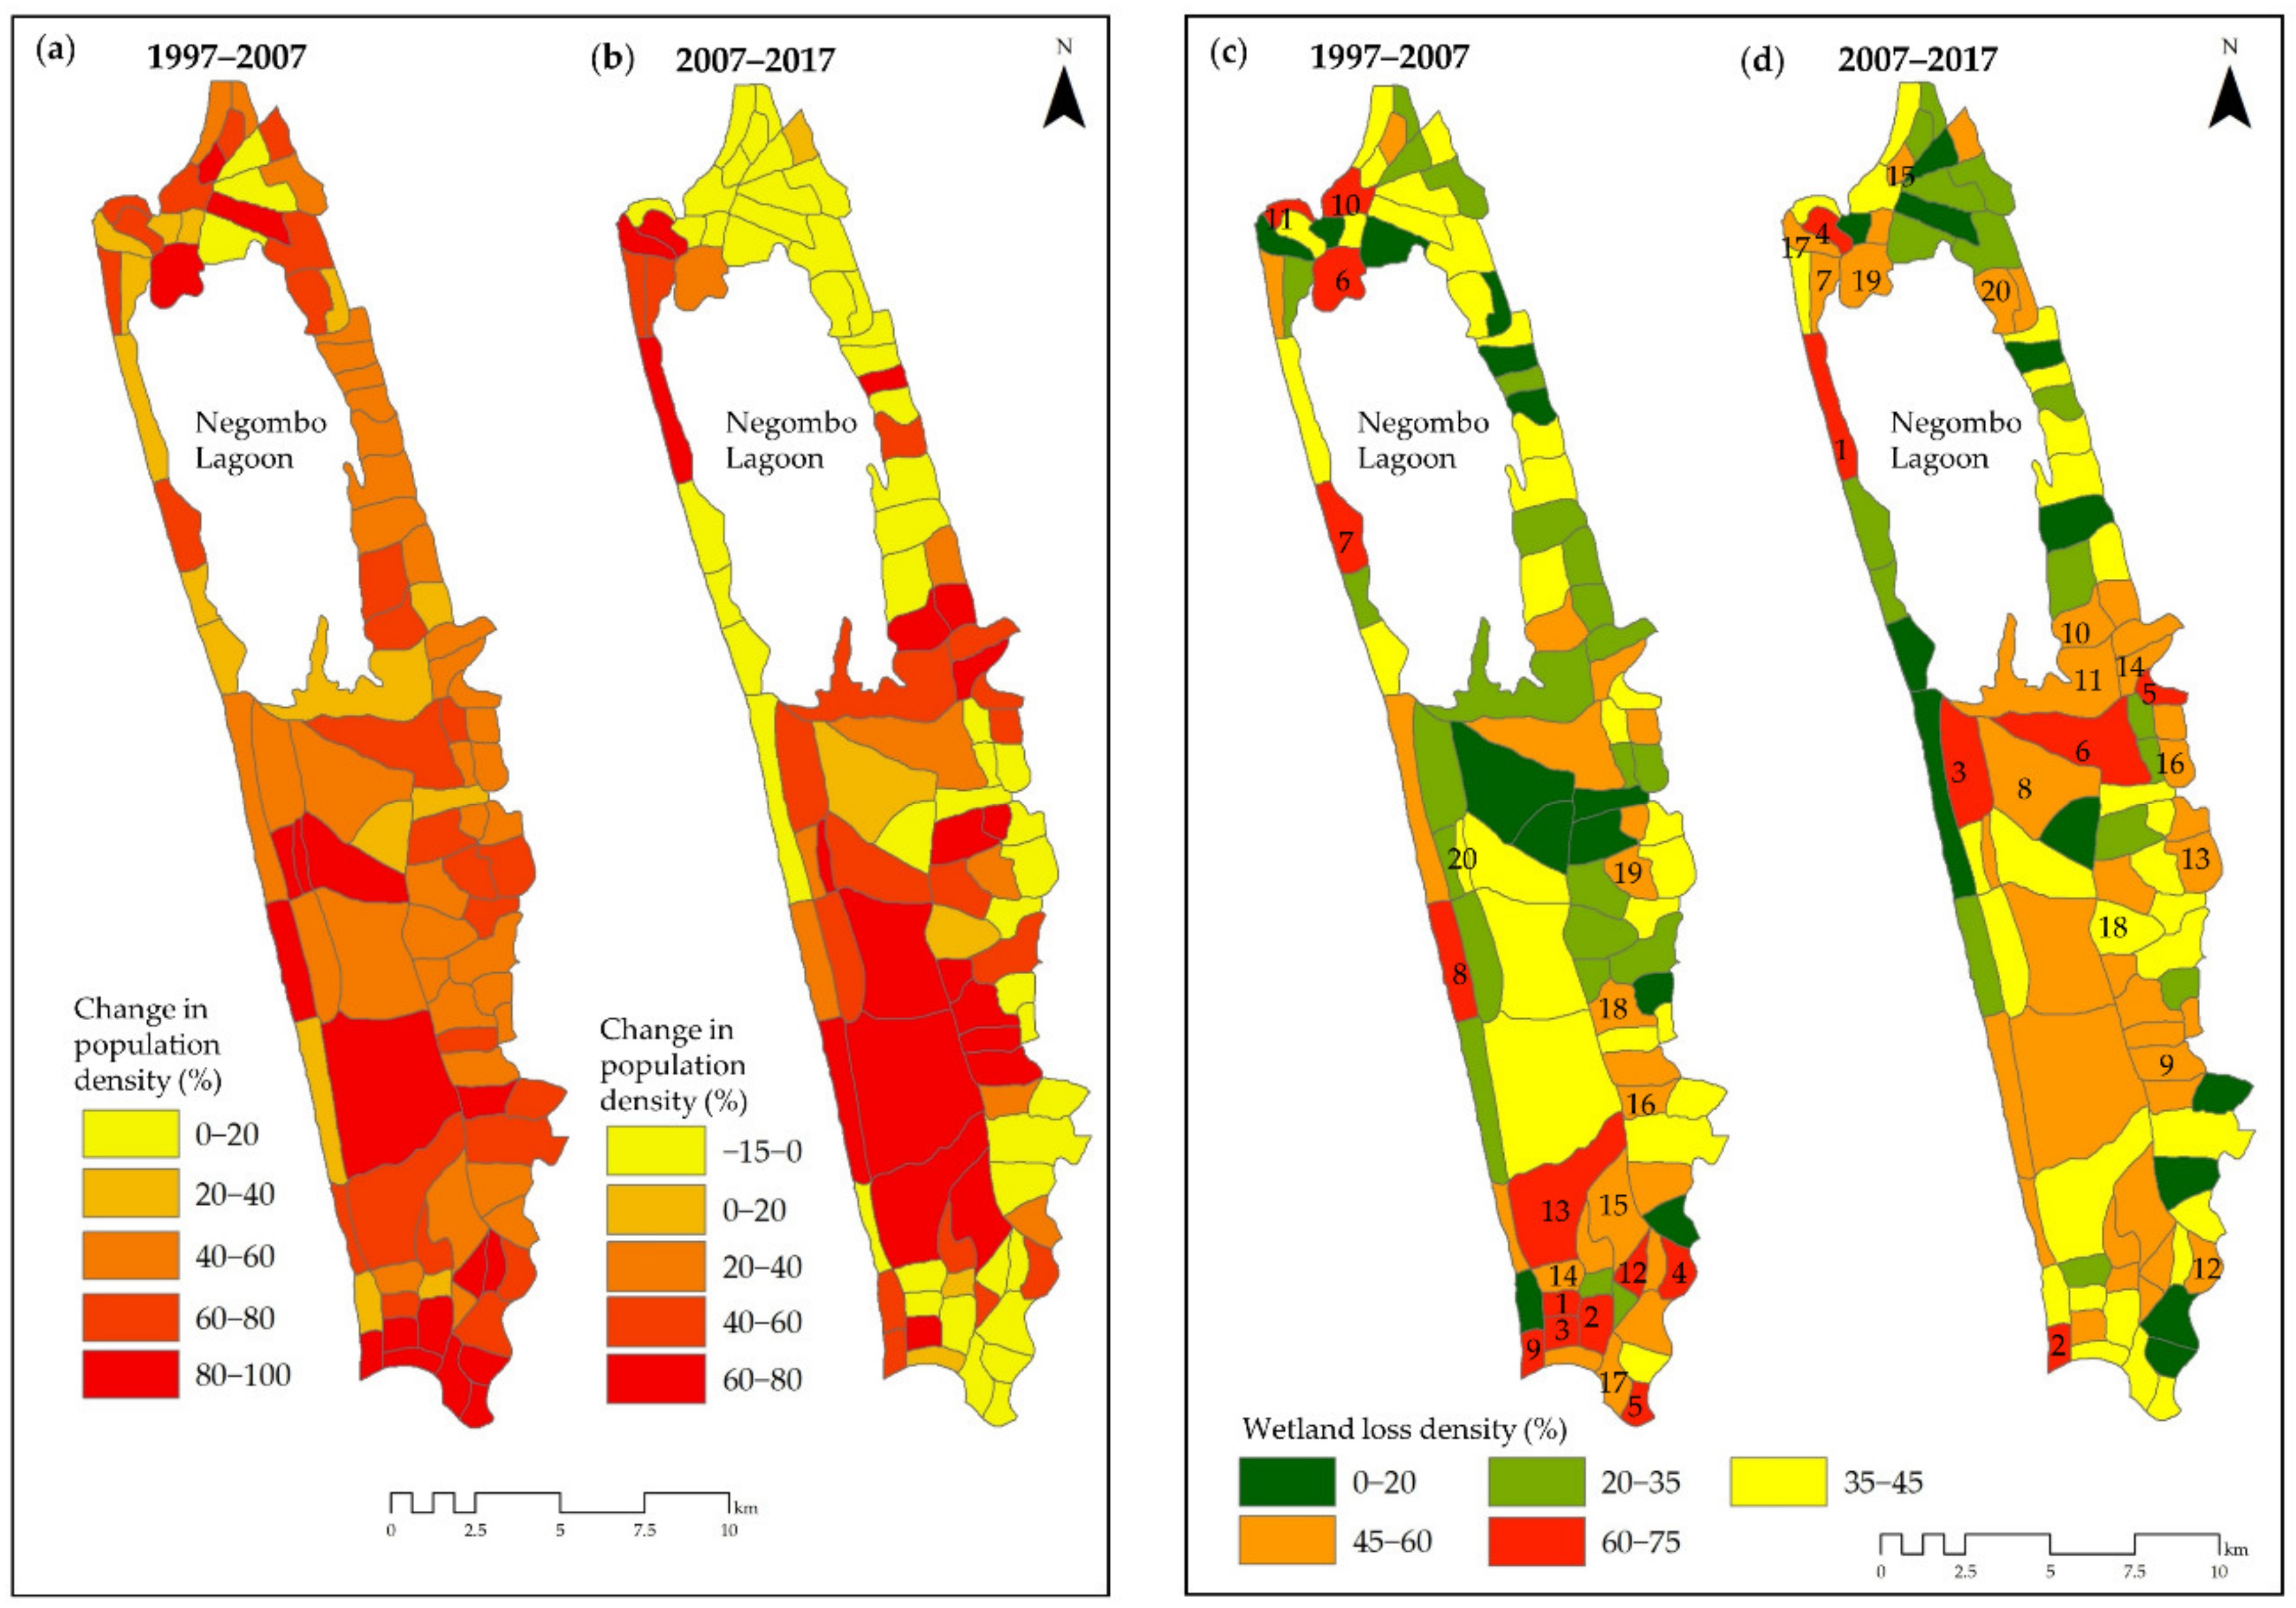
3.2. Change in Population Density and Loss of Wetland Due to Urbanization

The maps of the GN-level change in population density (CPD) and density of wetland loss due to urbanization (settlement expansion) (WLD) are shown in Figure 5. The top five GNs in terms of WLD during TP1 were Thimbirigasyaya, Nayakakanda South, Kurunduhena, Welikadamulla, Telangapatha; those during TP2 were Thalahena, Palliyawatta South, Maha Pamunugama, Pitipana North, Udammita South. A more exhaustive list of the top GNs in terms of WLD is given in Appendix A Table A2.
The statistical analysis revealed a positive, significant correlation between CPD and WLD in both time periods (TP1: R2 = 0.435, p = 0.000; TP2: R2 = 0.343, p = 0.000) (Figure 6), indicating that as the CPD increased, the WLD also increased. This suggests that urbanization was, indeed, an important factor or a driver of wetland loss in the MMNL.

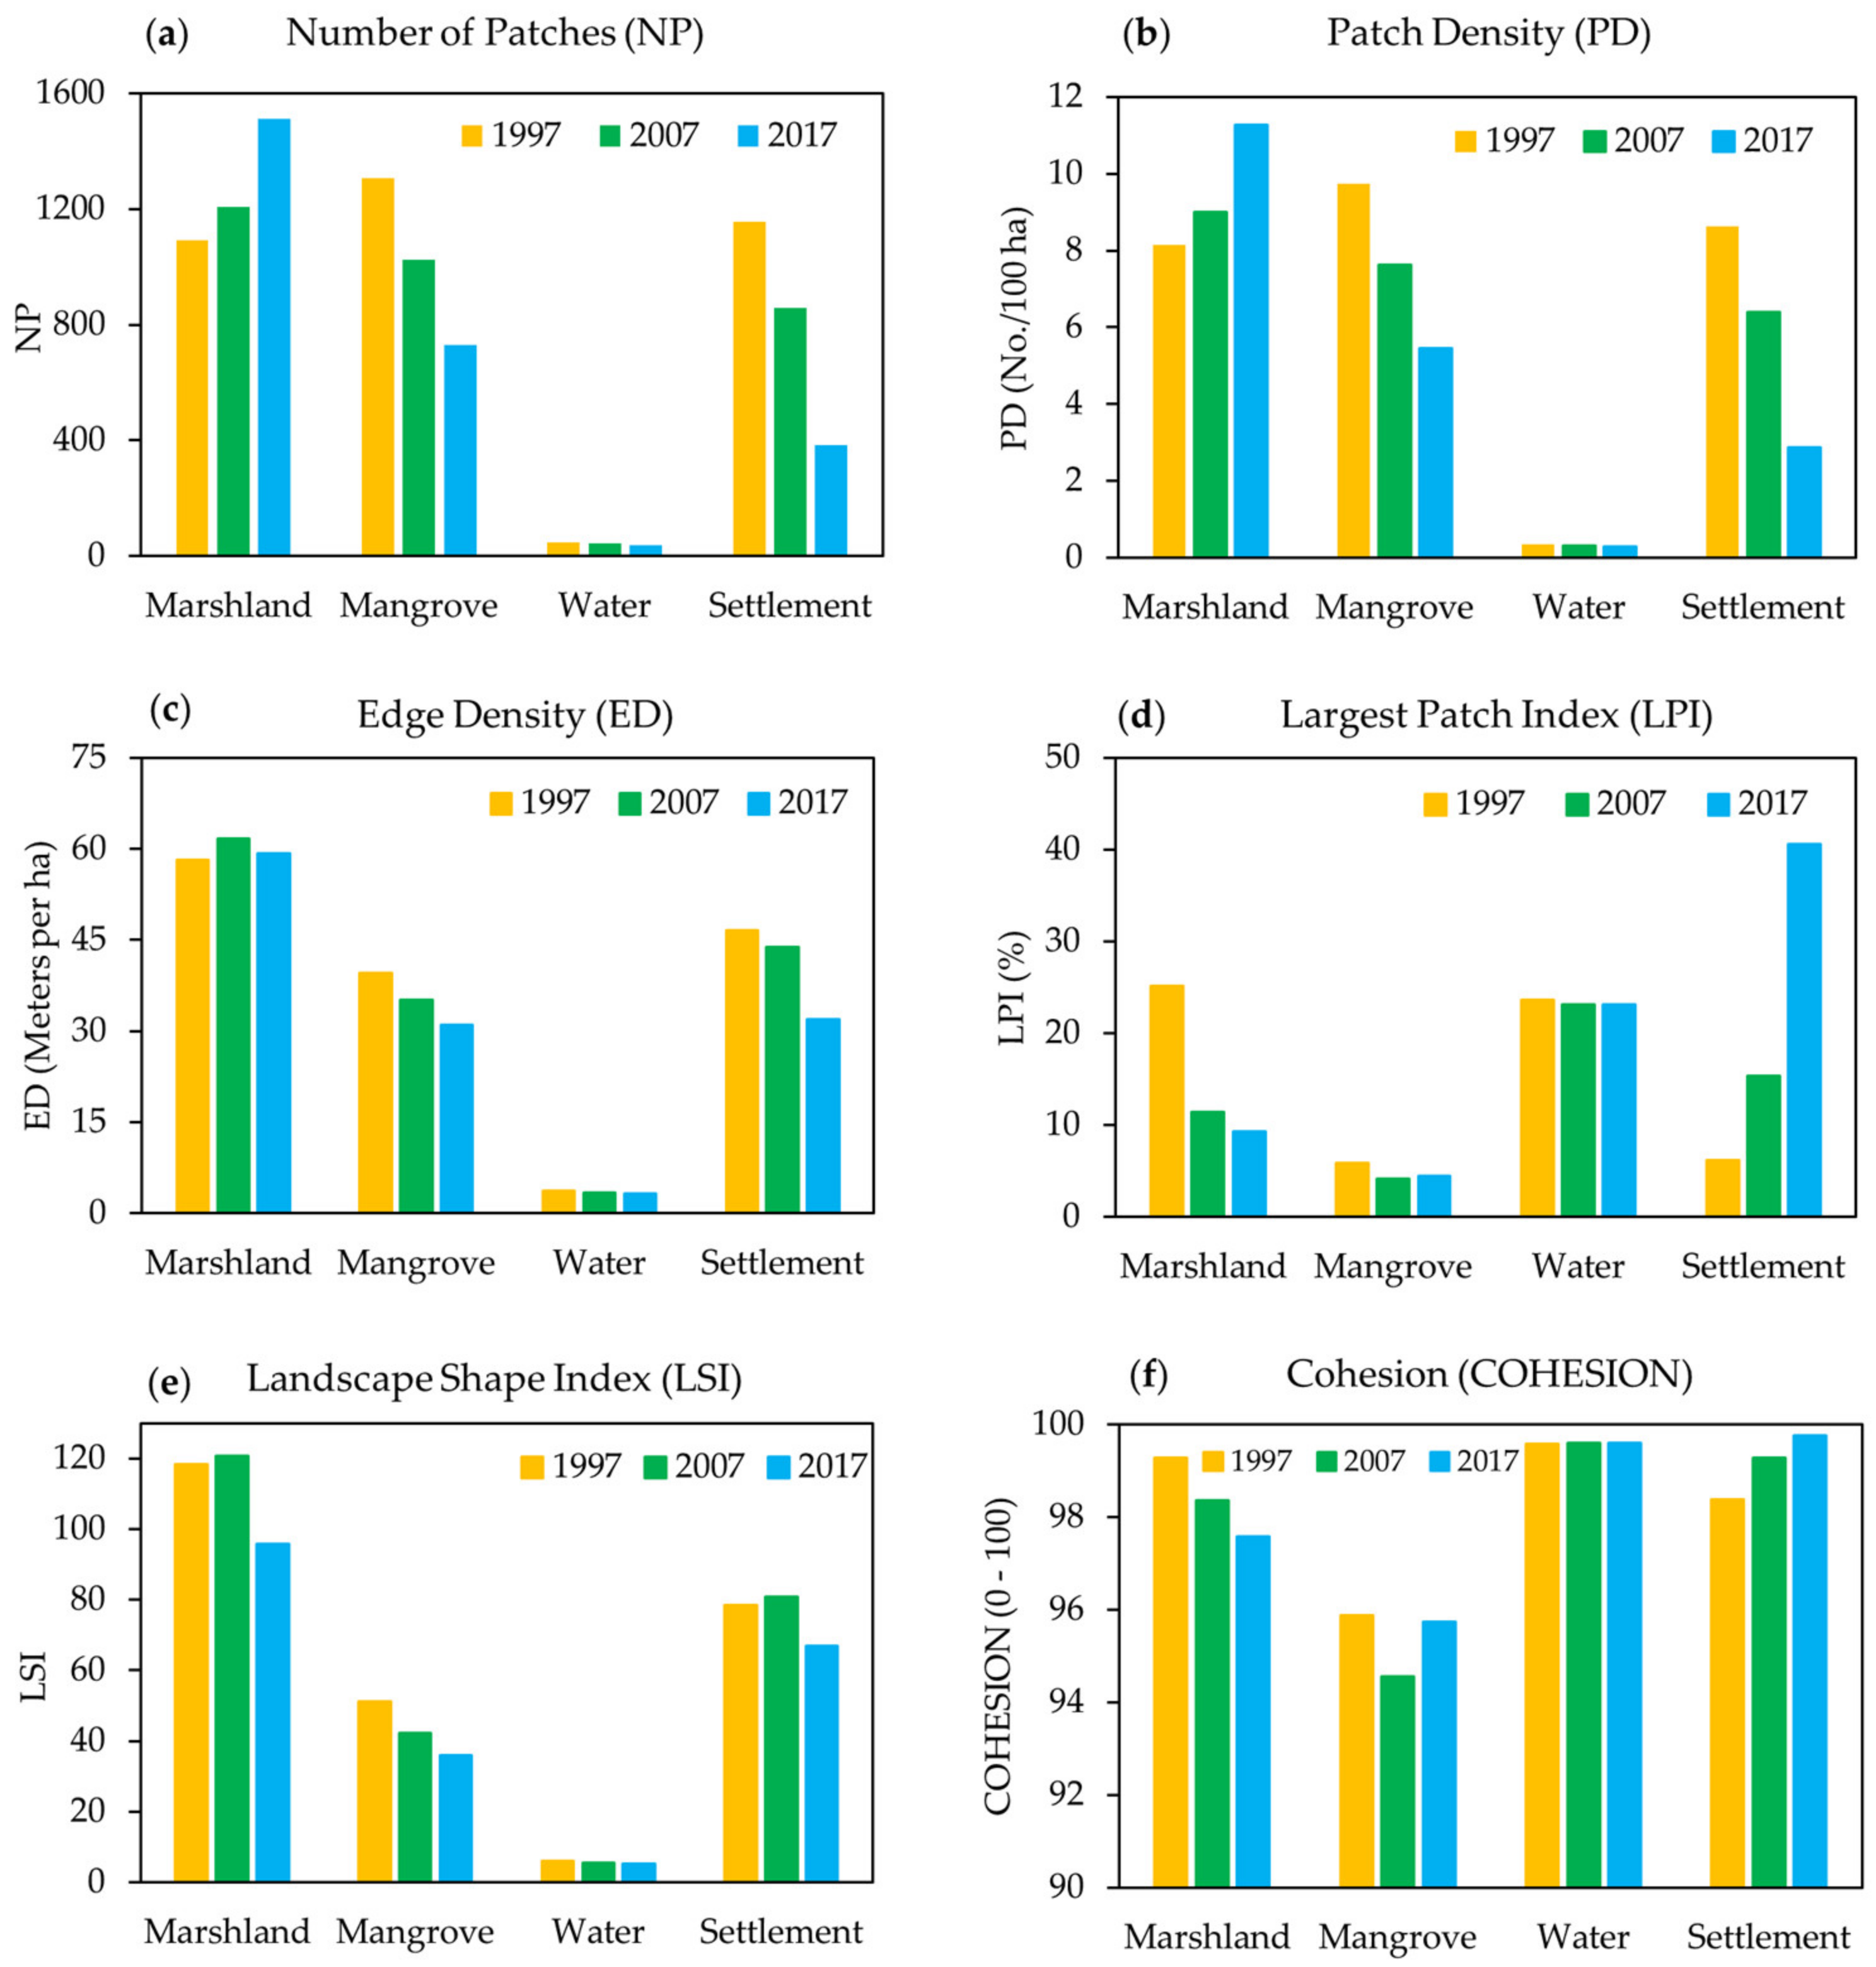
3.3. Changes in Landscape Composition and Configuration

At the class-level, the results revealed that between 1997 and 2017, the marshland class had become more fragmented, as indicated by the overall increase in its number of patches (NP), patch density (PD), edge density (ED), and the decline in its largest patch index (LPI), landscape shape index (LSI), and COHESION due to conversions to settlement marshland and water classes (Figure 7). On the other hand, the mangrove class had become less fragmented, as indicated by the overall decrease in its NP, PD, and ED. While its COHESION decreased during the first period, it increased during the second period. This suggests that the mangrove class, with the loss of some of its fragmented patches, had become more contiguous from 2007 to 2017. The decrease in LPI and LSI during the 1997–2017 period was due to mangrove gains, especially those resulting from the conversion of marshland, suggesting the development of more regular shapes at the edges of the mangrove. Conversely, the analysis results showed that LPI and LSI in marshland had fewer regular shapes at the edges, and the patches were more adjoining compared to the mangrove class. Therefore, the overall result of the mangrove showed less fragmentation than the marshland class. The settlement class had also become less fragmented, as indicated by the overall decrease in its NP, PD, and ED, and the overall increase in its COHESION. The expansion of settlements to adjacent areas resulted in an infilling pattern of urban growth, and eventually in a more contiguous and aggregated configuration of the settlement class. This observation is also supported by the increasing pattern of the settlement class’ LPI.
At the landscape level, the results revealed that SHDI and SHEI had gradually declined from 1997 to 2017 (Table 5). This indicates that the landscape of MMNL had tended to be less fragmented, clustering, and aggregating. Moreover, the overall decrease in patch richness at the class-level had resulted in an overall decrease in SHDI and SHEI at the landscape-level in the study area.

4. Discussion

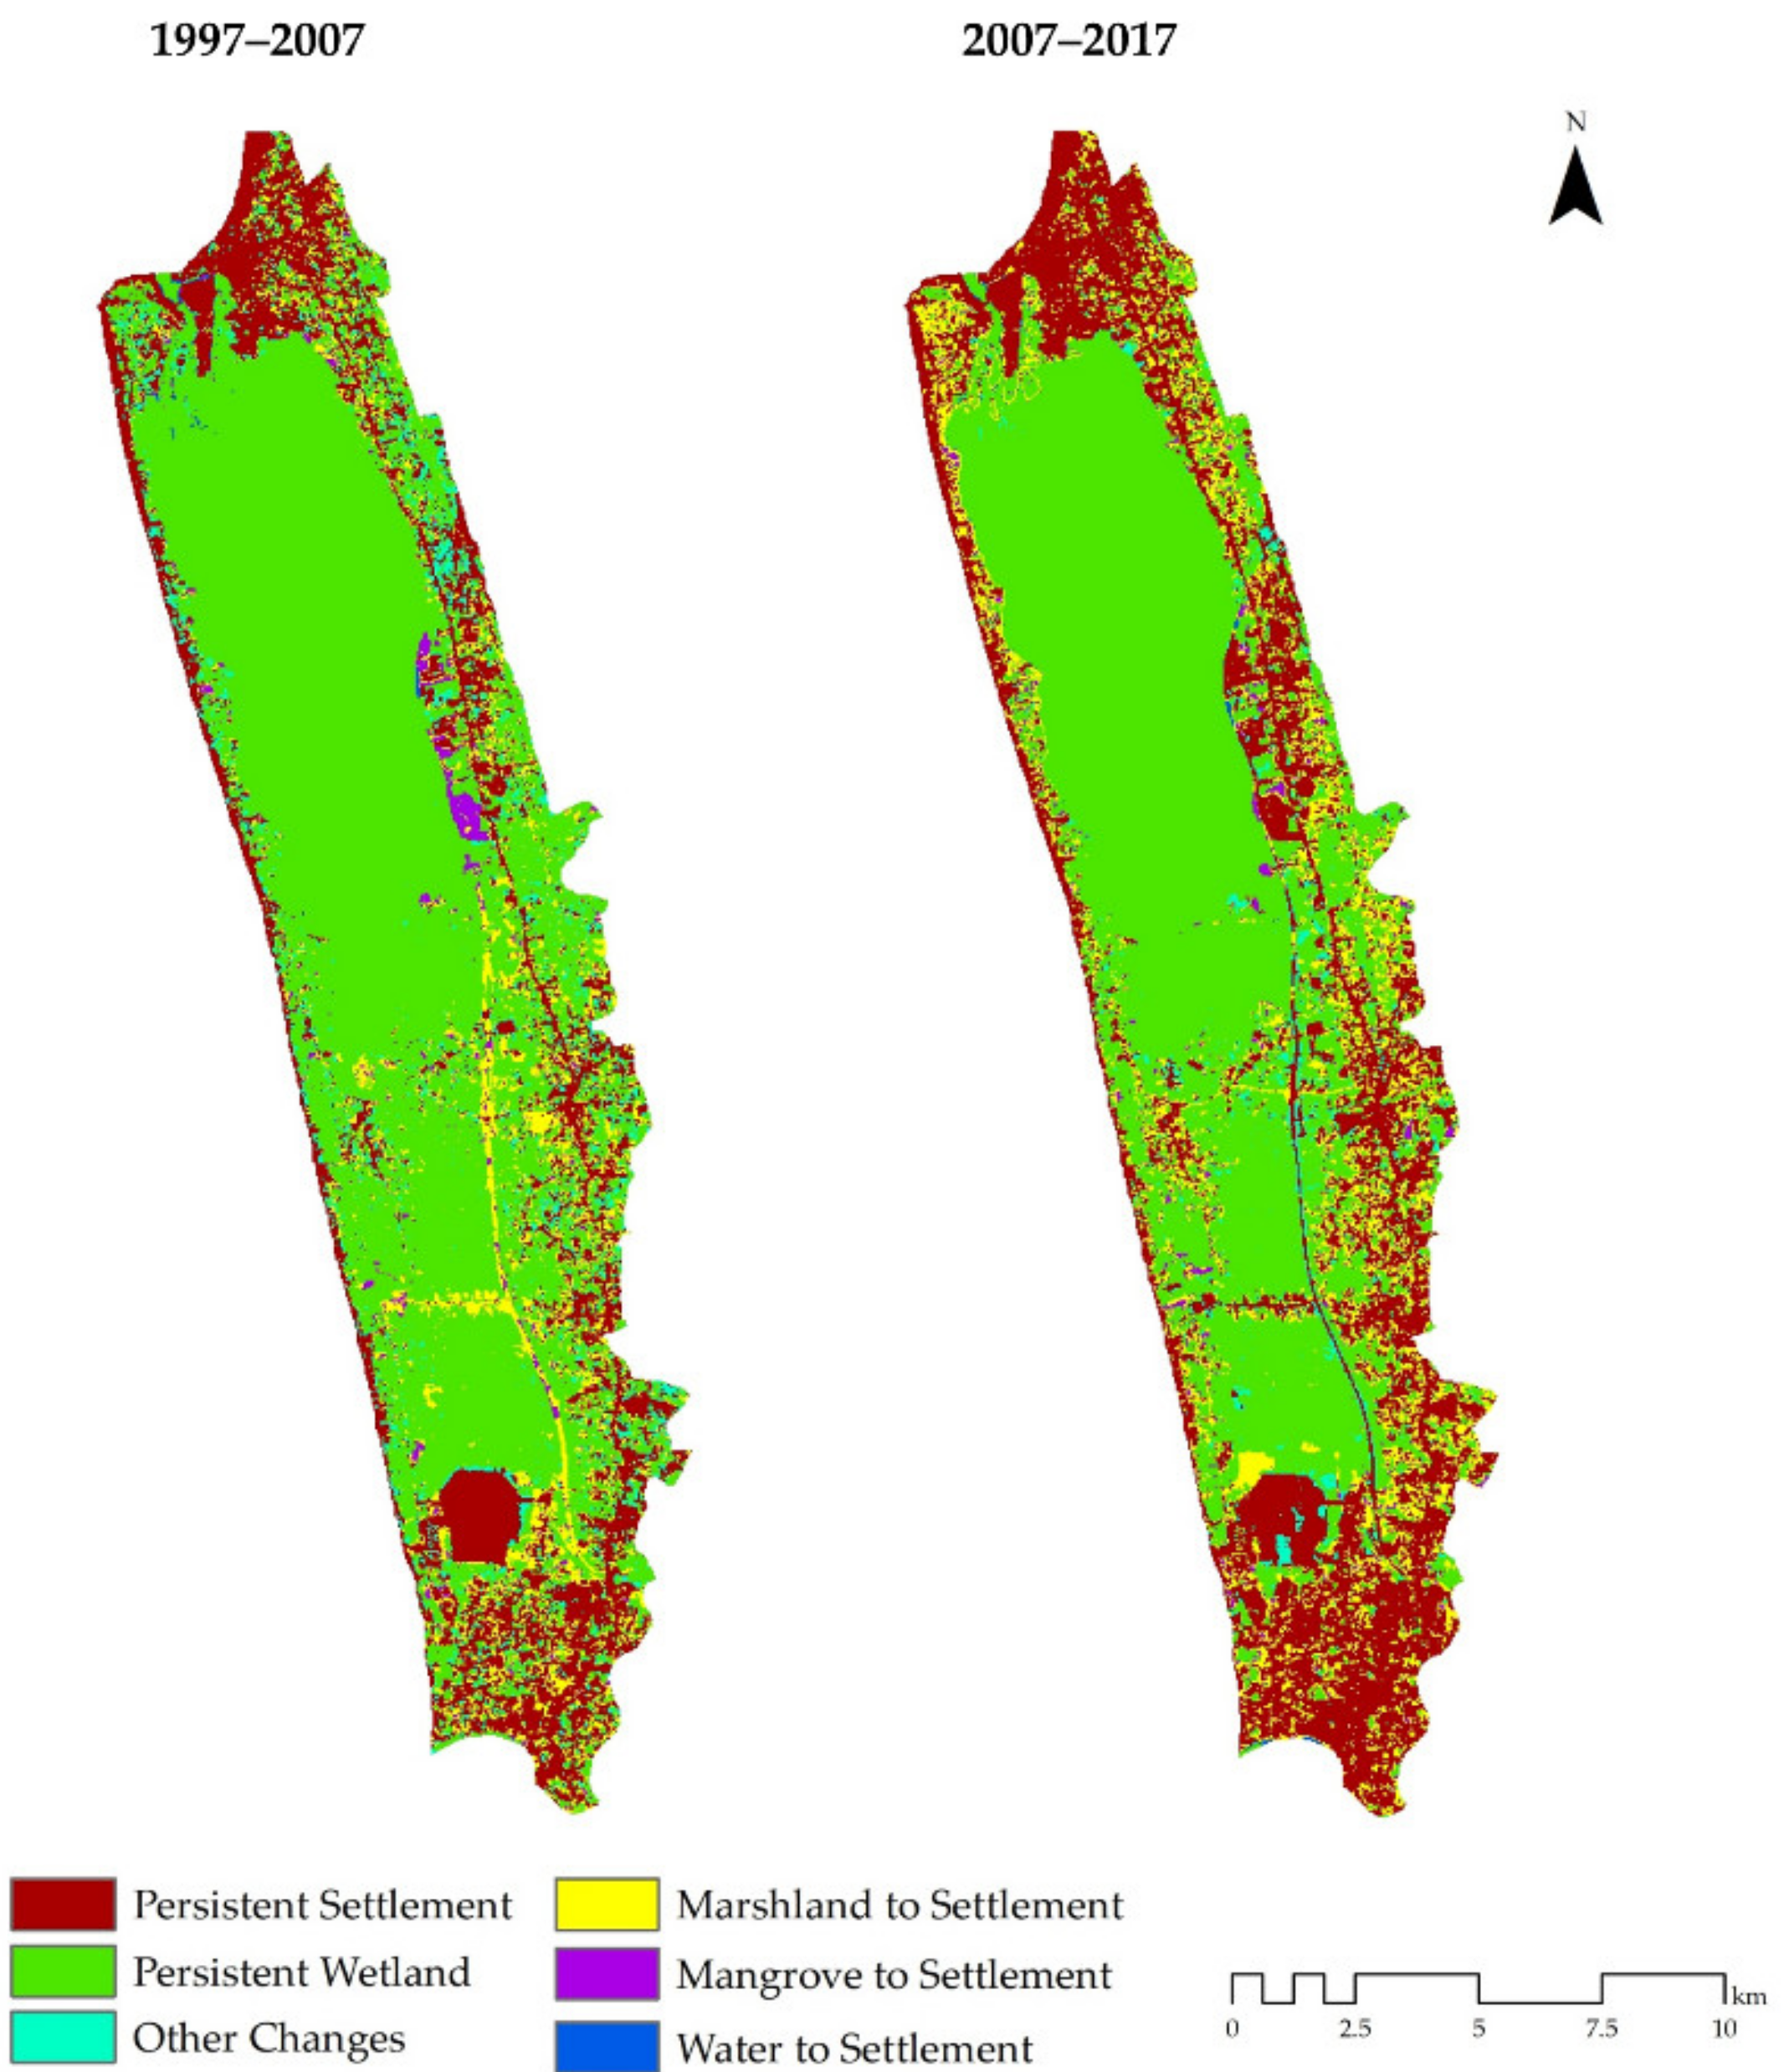
4.1. Landscape Transformation of the MMNL

The MMNL is an important UWE in Sri Lanka owing to its biodiverse ecosystem that is home to numerous wildlife, water habitat species, and migratory birds [50], besides the various ecosystem services it provides [52]. Our findings showed that the landscape of this highly valuable UWE had been transformed dramatically over the past two decades, losing considerable expanses of its marshland and mangrove cover due to rapid, unplanned and uncontrolled urbanization (settlement expansion) (Figure 3 and Figure 4; Table 3).
Urbanization, led by socio-economic and biophysical factors, has altered and is still altering the MMNL landscape. If this wetland change trend continues, it may adversely impact the ecosystem services, biodiversity and aesthetic value of the area. There are indications of an infilling urban growth pattern in the MMNL (Figure 3) and clear signs of illegal settlements inside the wetland area. The uncontrolled urban expansion of the CMR and its effects on landscape changes have caused many socio-economic and ecological problems, as well as an overall degradation of the natural environment in the study area.
Today, the MMNL has been fragmented into four parts owing to settlements, the construction of the main road and the Colombo-Katunayake Expressway [76], and the area experiencing a ribbon type-development during the 2007–2017 period. This expressway runs along the marshland, and a small piece of the Negombo lagoon can be clearly identified in our classified maps, especially in 2007 and 2017 (Figure 3 and Figure 4). Using urban wetland modelling, Zubair et al. (2017) [77] found that two of the main watersheds had increased, but subsequently decreased in one due to urban expansion. These findings generally support our results on the effects of human intervention, as indicated in previous research [78].
Availability and reclamation of natural wetland areas according to environment-friendly policies and enforcement of regulations are crucial to the protection and conservation of the MMNL. Restoration of wetland vegetation is vital, particularly in the highly populated areas of the GN divisions. A top-to-bottom approach should be adopted to ensure judicious use of wetland to ensure its protection and sustainability. Generally, wetland areas play an essential role in mitigating the urban heat island effect [79]. The MMNL is situated in the CMR which covers a considerable area. Conserving this highly valuable wetland will promote the cooling effect for better living conditions for the city dwellers of the CMR. Therefore, the protection and sustainability of the wetland should be promoted systematically by policymakers and urban planners.
In this study, we used a hybrid method (unsupervised and supervised) to classify the LUC of the MMNL from Landsat imagery (see Section 2.2). The method minimized classification errors. Overall, this hybrid classification provides comprehensive classifications of natural plant vegetation and soil moisture levels in urban wetland areas [80]. The overall accuracy of our three classified LUC maps was 83.0% in 1997, 84.5% in 2007, and 84.8% in 2017. Similar findings were reported by reference [64] in their small wetlands mapping in Kenya and Tanzania, where using unsupervised and supervised approaches, the overall classification accuracy was 83%. Lane et al. (2014) [81] reports an overall accuracy of 86.5% in wetland classification using eight-band high-resolution satellite data and a hybrid mapping approach in the Selenga River Delta in southeastern Siberia, Russia.
In general, settlement expansion can be correlated with rapid population growth in the MMNL. It is important to note that the MMNL is located in the Gampaha District of Sri Lanka, the second most populous district in Sri Lanka after the Colombo District. Rural-urban migration due to the establishment of Export Processing Zones (viz. Biyagama, Katunayake) in the Gampaha District [82] contributed to the higher population growth during the 1990s. Job opportunities in these Export Processing Zones provided better living conditions for migrants. Given the decline in agricultural productivity in the country’s dry regions, the government encouraged rural-urban migration to reduce poverty [83]. In particular, post-war policies and development projects in the CMR resulted in the country’s industrial capital becoming an important driver of rapid urban growth of the CMR after 2009 [84].
Figure 8 projects continuous growth in four DS divisions in the study area from 1981 to 2051. The dramatic increase in the urban population of four DS divisions in the study area is expected to continue in the future. From 1997 to 2017, the population of the study area increased by 15.51%. The population density of the Wattala and Ja-Ela DS divisions was higher than that of Katana and Negombo, indicating high urban pressure radiating from the capital of Colombo and the core of the Gampaha District (Figure 2, Figure 3,Figure 5). However, the Negombo DS division should not be ignored because this DS division has a significant effect on the wetland’s northern part (Figure 2), which has been impacted by rapid population growth leading to residential (including illegal settlements) and non-residential developments in industrial and commercial sectors.
In wetland change analyses, researchers have identified some implications of wetland landscape pattern changes due to urbanization [86,87]. There is evidence that environmental degradation is very much related to economic growth, as reflected particularly in per capita income [88]. A spatial metrics analysis shows that the MMNL settlement areas have become less fragmented (Figure 7) due to the decrease in the number of settlement patches along the roads and the dispersion of newly established patches from existing settlement areas around growth nodes (i.e., Negombo, Ja Ela, and Wattala) (Figure 2) and administrative centers. Furthermore, current settlement patches have become more extensive, and the gaps between settlement patches have diminished. While the expansion process has led to the development of settlement patches, there is a reduction in the distance between settlement patches due to the impact of dispersion in the MMNL. This rapid urban development of the MMNL and its subsequent wetland landscape changes have created many socio-ecological problems (Figure 9).
The MMNL has already been encroached upon by the urban sprawl; further infilling patterns are anticipated. Several factors can cause further fragmentation of the MMNL’s landscape and dispersed growth. The MMNL is located in the western coastal plain of Sri Lanka (Figure 2), and there are no significant physical restrictions, such as high altitudes and steep slopes, which promote fragmentation of the landscape. In the past two decades, a significant expansion of road networks (Figure 3) has shortened travel time from the urban center (capital city of Colombo and the core of the Gampaha District) to the suburbs (Negombo, Katana, Wattala, and Ja Ela) and Katunayake Bandaranaike International Airport. While people moving to the suburbs facilitate the fragmentation of the wetland landscape, the lagoon fishing industry and its settlements, as well as illegal wetland reclamation, also contribute to wetland degradation and land fragmentation. Wetland areas along the roads have progressively been turned into settlements (Figure 4). Moreover, push factors, such as high housing costs and service value and land prices in urban core areas have facilitated the fragmentation of wetland areas, including marshland and mangrove areas, over the last two decades in the MMNL. Accordingly, such issues concerning future wetland landscape and urban planning activities in and around the MMNL must be addressed.

4.2. Implications for Wetland Sustainability

A variety of environmental and socio-economic problems have arisen as a result of the rapid urbanization process in the MMNL, such as extensive degradation of wetland ecosystems and loss of important wetland ecosystem services that affect flood control, carbon sequestration, wetland productivity, the quantity of fish in the lagoon, urban poverty, and slum development. Besides the ongoing urbanization process that has led to the loss of wetland areas, current policies and regulations have not adequately addressed increasing land fragmentation and scattered settlements in the MMNL. Land fragmentation is threatening the sustainability of this urban wetland.
This study was performed on 4 DS divisions and 99 GN divisions in the Gampaha District (Figure 2 and Figure 5). Local government authorities should consider stricter enforcement of protection and conservation measures for wetland areas that have become increasingly degraded. It would be useful for the Department of Wildlife Conservation, the Ministry of Environment, the Central Environmental Authority, and the Urban Development Authority to undertake wetland conservation projects, in particular, wetland restoration projects and community-based approaches with judicious use of wetland. While local NGOs and communities are also involved in implementing the Muthurajawela Wetland Management Plan [49,50,89], the aims of their management plan have yet to be achieved. Time is of the essence. Therefore, it is strongly recommended that city planners and local policymakers implement new laws and legislation without further delay to protect this wetland.
RS data and GIS techniques are useful for spatial analysis [90]. The above study could be useful in determining how much of the future landscape changes (e.g., the spatial extent of urban areas towards natural environment and urban wetland areas) could be compensated by comprehensive land-use practices and environmental rehabilitation activities such as reforestation programs in mangrove and also natural areas. The recovery of the wetland has significant potential to reduce the pressure on the carrying capacity of the MMNL by human activity. Once the MMNL has been changed into a settlement, it would be difficult to reverse the conversion.
Against this backdrop, it is evident that scientifically sound knowledge is needed to help urban landscape planners and policymakers tackle socio-ecological issues and achieve the essential SDGs [35] to ensure wise and sustainable use of the MMNL. Indeed, wetlands provide multiple services and benefits to people and are vital to attaining the SDGs [91] and Aichi Targets of the Convention on Biological Diversity [92]. The fourth Strategic Plan (2016–2024) of the Ramsar Convention has identified four major objectives and 19 specific objectives in this regard. Therefore, the authorities should aim to implement the Ramsar Convention’s Strategic Plans and attain the Aichi Targets so as to mitigate socio-ecological problems associated with urbanization and protect wetland landscapes.

4.3. Limitations and Prospects for Future Wetland Study

This study used three satellite images captured in 1997, 2007, and 2017. More satellite images taken at different time points would provide valuable details, leading to a better spatial-temporal analysis. We need to point out that this investigation was limited by the lack of other clear and accessible satellite images temporarily compatible with the three satellite images employed. Another limitation was the unavailability of actual socio-economic data of the study area. Simultaneous and direct measurements are required to understand effective wetland conservation and protection strategies. Direct observations of urban wetlands can provide valuable knowledge for potential wetland management over the next few decades. We propose that future studies use much higher-resolution remote sensing images to investigate wetlands (at least for Sri Lanka). We need contemporary and long-term observations to appreciate the challenges in ensuring urban wetland sustainability.

5. Conclusions

We examined the impacts of urbanization on the Muthurajawela Marsh and Negombo Lagoon (MMNL), an important urban wetland ecosystem (UWE) in Sri Lanka owing to the valuable ecosystem services it provides. We found a substantial expansion of its settlements (+68%) and a considerable decrease in the extent of its marshland and mangrove forests (−41% and −21%, respectively). A statistical analysis revealed a positive, significant relationship between the change in population density and the loss of wetland due to settlement expansion, indicating that urbanization had indeed played a major role in the landscape transformation of the MMNL. The findings also revealed that most of the observed LUC changes occurred in areas close to roads and growth nodes (viz. Negombo, Ja-Ela, Wattala, and Katana), resulting in landscape fragmentation and infill urban expansion. The results indicated that the spatial and socio-economic elements of rapid urbanization of the MMNL had been the main driver of the transformation of its natural environment over the past 20 years. The study also showed that a hybrid mapping approach (unsupervised and supervised) can improve urban wetland mapping accuracy from remote sensing satellite imagery.
Overall, we conclude that, in order to ensure the sustainability of the MMNL, which is a highly valuable UWE, there is an urgent need for forward-looking landscape and urban planning that could promote environmentally-conscious urban development in the area.

Author Contributions

Conceptualization, D.A.; methodology, D.A. and R.C.E.; software, D.A. and R.C.E.; validation D.A., R.C.E., and Y.M.; formal analysis, D.A. and R.C.E.; investigation, D.A. and R.C.E.; resources, D.A.; data curation, D.A.; writing—original draft preparation, D.A.; writing—review and editing, R.C.E., Y.M., and B.M.; visualization, D.A.; supervision, Y.M. and B.M.; project administration, Y.M. All authors have read and agreed to the published version of the manuscript.

Funding

This research received no external funding.

Institutional Review Board Statement

Not applicable.

Informed Consent Statement

Not applicable.

Data Availability Statement

The data that support the findings of this study are available from the corresponding author on reasonable request.

Conflicts of Interest

The authors declare no conflict of interest.

Abbreviations

UWEsUrban Wetland Ecosystems
MMNLMuthurajawela Marsh and Negombo Lagoon
SDGsSustainable Development Goals
GISGeographic Information Systems
LUCLand Use/Cover
CMRColombo Metropolitan Region
DSDivisional Secretariat
TMThematic Mapper
OLI/TIRSOperational Land Imager/Thermal Infrared Sensor
ETM+Enhanced Thematic Mapper Plus
GNGrama Niladhari
WLDWetland Loss Density
WLWetland Loss
CPDChange in Population Density
APGRAverage Population Growth Rate
PDPopulation Density
NPNumber of Patches
PDPatch Density
EDEdge Density
LPILargest Patch Index
LSILandscape Shape Index
COHESIONCohesion
SHDIShannon’s Diversity Index
SHEIShannon’s Evenness Index
TPTime Point
RSRemote Sensing

Appendix A

Table A1. Confusion matrices of the classified LUC maps of the MMNL.
Classified DataReference DataTotalUser’s Accuracy (%)
MarshlandMangroveWaterSettlement
(a) 1997
Marshland108173613480.86
Mangrove151054512981.40
Water734215379.25
Settlement340778491.67
Total1331294989400
Producer’s accuracy (%)81.2081.4085.7186.52
Overall accuracy (%) = 83.01
(b) 2007
Marshland112165413781.75
Mangrove11984311684.48
Water614715585.45
Settlement551819288.04
Total1341205789400
Producer’s accuracy (%)83.5881.6782.4691.01
Overall accuracy (%) = 84.50
(c) 2017
Marshland9377911680.17
Mangrove121084312785.04
Water534215182.35
Settlement4519610690.57
Total11412354109400
Producer’s accuracy (%)81.5887.8077.7888.07
Overall accuracy (%) = 84.75
Table A2. Top 20 GNs in the MMNL in terms of density of wetland loss due to urbanization (settlement expansion) (WLD) (%) (see Equations (3) and (4)).
RankGNs1997–2007 (TP1)GNs2007–2017 (TP2)
1Thimbirigasyaya76.47Thalahena70.24
2Nayakakanda South72.37Palliyawatta South66.13
3Kurunduhena64.86Maha Pamunugama66.11
4Welikadamulla63.69Pitipana North65.22
5Telangapatha63.21Udammita South64.06
6Siriwardana Pedesa62.82Dandugama61.13
7Dungalpitiya62.36Pitipana South East56.51
8Paranambalama61.74Delathura West56.01
9Palliyawatta South61.63Nagoda55.18
10Munnakkarai North59.94Bandarawatta West53.51
11Doowa59.57Ambalammulla52.41
12Hendala North59.26Welikadamulla52.35
13Balagala56.3Ja-Ela52.18
14Elakanda54.68Alawathupitiya52.12
15Kerawalapitiya54.47Wella Weediya South52.02
16Welisara54.20Kudahakapola South51.72
17Galwetiya53.42Pitipana Central51.46
18Nedurupitiya51.71Indivitiya51.37
19Weligampitiya North50.19Siriwardana Pedesa51.21
20Bopitiya50.01Kurana West50.13

References

  1. Gardner, R.C.; Barchiesi, S.; Beltrame, C.; Finlayson, C.; Galewski, T.; Harrison, I.; Paganini, M.; Perennou, C.; Pritchard, D.; Rosenqvist, A.; et al. Ramsar Convention State of the World’s Wetlands and Their Services to People: A Compilation of Recent Analyses; Ramsar Briefing note 7: Gland, Switzerland, 2015.
  2. Costanza, R.; D’Arge, R.; De Groot, R.; Farber, S.; Grasso, M.; Hannon, B.; Limburg, K.; Naeem, S.; O’Neill, R.V.; Paruelo, J.; et al. The value of the world’s ecosystem services and natural capital. Nature 1997, 387, 253–260. [Google Scholar] [CrossRef]
  3. Dronova, I.; Gong, P.; Wang, L. Object-based analysis and change detection of major wetland cover types and their classification uncertainty during the low water period at Poyang Lake, China. Remote Sens. Environ. 2011, 115, 3220–3236. [Google Scholar] [CrossRef]
  4. Ramsar. RAMSAR Homepage. Available online: https://www.ramsar.org/ (accessed on 10 October 2020).
  5. Ramsar Convention. An Introduction to the Convention on Wetlands, 5th ed.; Ramsar Convention Secretariat: Gland, Switzerland, 2016. [Google Scholar]
  6. Penatti, C.N.; Almeida, T.I.R.D.; Ferreira, L.G.; Arantes, E.A.; Coe, M.T. Satellite-based hydrological dynamics of the world’s largest continuous wetland. Remote Sens. Environ. 2015, 170, 1–13. [Google Scholar] [CrossRef]
  7. Reiss, C.K.; Hernandez, E.; Brown, M.T. Application of the landscape development intensity (LDI) index in wetland mitigation banking. Ecol. Modell. 2014, 271, 83–89. [Google Scholar] [CrossRef]
  8. Gedan, K.B.; Kirwan, M.L.; Wolanski, E.; Barbier, E.B.; Silliman, B.R. The present and future role of coastal wetland vegetation in protecting shorelines: Answering recent challenges to the paradigm. Clim. Chang. 2011, 7–29. [Google Scholar] [CrossRef]
  9. Dabrowska-Zielinska, K.; Budzynska, M.; Tomaszewska, M.; Bartold, M.; Gatkowska, M.; Malek, I.; Turlej, K.; Napiorkowska, M. Monitoring Wetlands Ecosystems Using ALOS PALSAR (L-Band, HV) Supplemented by Optical Data: A Case Study of Biebrza Wetlands in Northeast Poland. Remote Sens. 2014, 1605. [Google Scholar] [CrossRef] [Green Version]
  10. Ramsar Convention. The Fourth Ramsar Strategic Plan 2016–2024, 5th ed.; Ramsar Convention Secretariat: Gland, Switzerland, 2016. [Google Scholar]
  11. Weise, K.; Höfer, R.; Franke, J.; Guelmami, A.; Simonson, W.; Muro, J.; O’Connor, B.; Strauch, A.; Flink, S.; Eberle, J.; et al. Wetland extent tools for SDG 6.6.1 reporting from the Satellite-based Wetland Observation Service (SWOS). Remote Sens. Environ. 2020, 247, 111892. [Google Scholar] [CrossRef]
  12. United Nations. Sustainable Development Goals. Available online: https://www.un.org/sustainabledevelopment/sustainable-development-goals/ (accessed on 10 October 2020).
  13. MA (Millennium Ecosystem Assessment). Ecosystems and Human Well-Being: Synthesis; Island Press: Washington, DC, USA, 2005. [Google Scholar]
  14. Euliss, N.H.; Mushet, D.M.; Newton, W.E.; Otto, C.R.V.; Nelson, R.D.; Labaugh, J.W.; Scherff, E.J.; Rosenberry, D.O. Placing prairie pothole wetlands along spatial and temporal continua to improve integration of wetland function in ecological investigations. J. Hydrol. 2014, 513, 490–503. [Google Scholar] [CrossRef]
  15. Bouahim, S.; Rhazi, L.; Ernoul, L.; Mathevet, R.; Amami, B.; Er-riyahi, S.; Muller, S.D.; Grillas, P. Combining vulnerability analysis and perceptions of ecosystem services in sensitive landscapes: A case from western Moroccan temporary wetlands. J. Nat. Conserv. 2015, 27, 1–9. [Google Scholar] [CrossRef]
  16. United Nations, Department of Economic and Social Affairs, Population Division. World Urbanization Prospects: The 2018 Revision; United Nations: New York, NY, USA, 2019. [Google Scholar]
  17. Estoque, R.C.; Murayama, Y. Quantifying landscape pattern and ecosystem service value changes in four rapidly urbanizing hill stations of Southeast Asia. Landsc. Ecol. 2016, 31, 1481–1507. [Google Scholar] [CrossRef]
  18. Michishita, R.; Jiang, Z.; Xu, B. Monitoring two decades of urbanization in the Poyang Lake area, China through spectral unmixing. Remote Sens. Environ. 2012, 117, 3–18. [Google Scholar] [CrossRef]
  19. Zhou, D.; Zhao, S.; Zhang, L.; Liu, S. Remotely sensed assessment of urbanization effects on vegetation phenology in China’s 32 major cities. Remote Sens. Environ. 2016, 176, 272–281. [Google Scholar] [CrossRef] [Green Version]
  20. Zhang, F.; Yang, X. Improving land cover classification in an urbanized coastal area by random forests: The role of variable selection. Remote Sens. Environ. 2020, 251, 112105. [Google Scholar] [CrossRef]
  21. Gold, A.C.; Thompson, S.P.; Magel, C.L.; Piehler, M.F. Urbanization alters coastal plain stream carbon export and dissolved oxygen dynamics. Sci. Total Environ. 2020, 747, 141132. [Google Scholar] [CrossRef]
  22. Gillies, R.R.; Box, J.B.; Symanzik, J.; Rodemaker, E.J. Effects of urbanization on the aquatic fauna of the Line Creek watershed, Atlanta-A satellite perspective. Remote Sens. Environ. 2003, 86, 411–422. [Google Scholar] [CrossRef] [Green Version]
  23. Mondal, B.; Dolui, G.; Pramanik, M.; Maity, S.; Biswas, S.S.; Pal, R. Urban expansion and wetland shrinkage estimation using a GIS-based model in the East Kolkata Wetland, India. Ecol. Indic. 2017, 83, 62–73. [Google Scholar] [CrossRef]
  24. Das, A.; Basu, T. Assessment of peri-urban wetland ecological degradation through importance-performance analysis (IPA): A study on Chatra Wetland, India. Ecol. Indic. 2020, 114, 106274. [Google Scholar] [CrossRef]
  25. Hou, X.; Feng, L.; Tang, J.; Song, X.P.; Liu, J.; Zhang, Y.; Wang, J.; Xu, Y.; Dai, Y.; Zheng, Y.; et al. Anthropogenic transformation of Yangtze Plain freshwater lakes: Patterns, drivers and impacts. Remote Sens. Environ. 2020, 248, 111998. [Google Scholar] [CrossRef]
  26. Li, Z.; Jiang, W.; Wang, W.; Chen, Z.; Ling, Z.; Lv, J. Ecological risk assessment of the wetlands in Beijing-Tianjin-Hebei urban agglomeration. Ecol. Indic. 2020, 117, 106677. [Google Scholar] [CrossRef]
  27. Lin, W.; Cen, J.; Xu, D.; Du, S.; Gao, J. Wetland landscape pattern changes over a period of rapid development (1985–2015) in the ZhouShan Islands of Zhejiang province, China. Estuar. Coast. Shelf Sci. 2018, 213, 148–159. [Google Scholar] [CrossRef]
  28. Nagendra, H.; Lucas, R.; Honrado, J.P.; Jongman, R.H.G.; Tarantino, C.; Adamo, M.; Mairota, P. Remote sensing for conservation monitoring: Assessing protected areas, habitat extent, habitat condition, species diversity, and threats. Ecol. Indic. 2013, 33, 45–59. [Google Scholar] [CrossRef]
  29. Yang, C.; Zhang, C.; Li, Q.; Liu, H.; Gao, W.; Shi, T.; Liu, X.; Wu, G. Rapid urbanization and policy variation greatly drive ecological quality evolution in Guangdong-Hong Kong-Macau Greater Bay Area of China: A remote sensing perspective. Ecol. Indic. 2020, 115, 106373. [Google Scholar] [CrossRef]
  30. Wiens, J.; Sutter, R.; Anderson, M.; Blanchard, J.; Barnett, A.; Aguilar-Amuchastegui, N.; Avery, C.; Laine, S. Selecting and conserving lands for biodiversity: The role of remote sensing. Remote Sens. Environ. 2009, 113, 1370–1381. [Google Scholar] [CrossRef] [Green Version]
  31. Wabnitz, C.C.; Andréfouët, S.; Torres-Pulliza, D.; Müller-Karger, F.E.; Kramer, P.A. Regional-scale seagrass habitat mapping in the Wider Caribbean region using Landsat sensors: Applications to conservation and ecology. Remote Sens. Environ. 2008, 112, 3455–3467. [Google Scholar] [CrossRef]
  32. Zhang, D.; Xu, J.; Zhang, Y.; Wang, J.; He, S.; Zhou, X. Study on sustainable urbanization literature based on Web of Science, Scopus, and China national knowledge infrastructure: A scientometric analysis in CiteSpace. J. Clean. Prod. 2020, 264, 121537. [Google Scholar] [CrossRef]
  33. Dewan, A.M.; Yamaguchi, Y. Land use and land cover change in Greater Dhaka, Bangladesh: Using remote sensing to promote sustainable urbanization. Appl. Geogr. 2009, 29, 390–401. [Google Scholar] [CrossRef]
  34. Zhu, Z.; Zhou, Y.; Seto, K.C.; Stokes, E.C.; Deng, C.; Pickett, S.T.A.; Taubenböck, H. Understanding an urbanizing planet: Strategic directions for remote sensing. Remote Sens. Environ. 2019, 228, 164–182. [Google Scholar] [CrossRef]
  35. Estoque, R.C. A review of the sustainability concept and the state of SDG monitoring using remote sensing. Remote Sens. 2020, 12. [Google Scholar] [CrossRef]
  36. Jaramillo, F.; Desormeaux, A.; Hedlund, J.; Jawitz, J.W.; Clerici, N.; Piemontese, L.; Rodríguez-Rodriguez, J.A.; Anaya, J.A.; Blanco-Libreros, J.F.; Borja, S.; et al. Priorities and interactions of Sustainable Development Goals (SDGs) with focus on wetlands. Water 2019, 11. [Google Scholar] [CrossRef] [Green Version]
  37. Fitoka, E.; Tompoulidou, M.; Hatziiordanou, L.; Apostolakis, A.; Höfer, R.; Weise, K.; Ververis, C. Water-related ecosystems’ mapping and assessment based on remote sensing techniques and geospatial analysis: The SWOS national service case of the Greek Ramsar sites and their catchments. Remote Sens. Environ. 2020, 245, 111795. [Google Scholar] [CrossRef]
  38. Estoque, R.C.; Murayama, Y. Measuring Sustainability Based Upon Various Perspectives: A Case Study of a Hill Station in Southeast Asia. Ambio 2014, 43, 943–956. [Google Scholar] [CrossRef] [PubMed] [Green Version]
  39. Liu, A.J.; Cameron, G.N. Analysis of landscape patterns in coastal wetlands of Galveston Bay, Texas (USA). Landsc. Ecol. 2001, 16, 581–595. [Google Scholar] [CrossRef]
  40. Festus, O.; Ji, W.; Zubair, O.A. Characterizing the Landscape Structure of Urban Wetlands Using Terrain and Landscape Indices. Land 2020, 9, 29. [Google Scholar] [CrossRef] [Green Version]
  41. Hassan, M.M. Monitoring land use/land cover change, urban growth dynamics and landscape pattern analysis in five fastest urbanized cities in Bangladesh. Remote Sens. Appl. Soc. Environ. 2017, 7, 69–83. [Google Scholar] [CrossRef]
  42. Aguilera, F.; Valenzuela, L.M.; Botequilha-Leitão, A. Landscape metrics in the analysis of urban land use patterns: A case study in a Spanish metropolitan area. Landsc. Urban Plan. 2011, 99, 226–238. [Google Scholar] [CrossRef]
  43. Japelaghi, M.; Gholamalifard, M.; Shayesteh, K. Spatio-temporal analysis and prediction of landscape patterns and change processes in the Central Zagros region, Iran. Remote Sens. Appl. Soc. Environ. 2019, 15, 100244. [Google Scholar] [CrossRef]
  44. Su, S.; Xiao, R.; Jiang, Z.; Zhang, Y. Characterizing landscape pattern and ecosystem service value changes for urbanization impacts at an eco-regional scale. Appl. Geogr. 2012, 34, 295–305. [Google Scholar] [CrossRef]
  45. Liu, G.; Zhang, L.; Zhang, Q.; Musyimi, Z.; Jiang, Q. Spatio-temporal dynamics of wetland landscape patterns based on remote sensing in yellow river delta, China. Wetlands 2014, 34, 787–801. [Google Scholar] [CrossRef]
  46. Haas, J.; Ban, Y. Urban growth and environmental impacts in Jing-Jin-Ji, the Yangtze, River Delta and the Pearl River Delta. Int. J. Appl. Earth Obs. Geoinf. 2014, 30, 42–55. [Google Scholar] [CrossRef]
  47. Li, Y.; Zhu, X.; Sun, X.; Wang, F. Landscape effects of environmental impact on bay-area wetlands under rapid urban expansion and development policy: A case study of Lianyungang, China. Landsc. Urban Plan. 2010, 94, 218–227. [Google Scholar] [CrossRef]
  48. McInnes, R. Urban Development, Biodiversity and Wetland Management; UN HABITAT: Bioscan (UK) Ltd: Oxford, UK, 2010. [Google Scholar]
  49. Greater Colombo Economic Commission, Euroconsult. Master Plan of Muthurajawela and Negombo Lagoon; Gunaratne offset Ltd.: Colombo, Sri Lanka, 1991. [Google Scholar]
  50. Central Environmental Authority, Euroconsult. Conservation Master Plan, Muthurajawela Marsh and Negombo Lagoon; Gunaratne offset Ltd.: Colombo, Sri Lanka, 1994. [Google Scholar]
  51. Bambaradeniya, C.N.B.; Ekanayake, S.P.; Kekulandala, L.D.C.B.; Samarawickrama, V.A.P.; Ratnayake, N.D.; Fernando, R.H.S.S. An Assessment of the Status of Biodiversity in the Muthurajawela Wetland Sanctuary; IUCN: Colombo, Sri Lanka, 2002; ISBN 9558177172. [Google Scholar]
  52. Central Environmental Authority (CEA). National Wetland Directory of Sri Lanka; CEA: Colombo, Sri Lanka, 2006; ISBN 9558177547. [Google Scholar]
  53. The World Bank. Turning Sri Lanka’s Urban Vision into Policy and Action; The World Bank: Washington, DC, USA, 2012; ISBN 9789558908440. [Google Scholar]
  54. Subasinghe, S.; Estoque, R.; Murayama, Y. Spatiotemporal Analysis of Urban Growth Using GIS and Remote Sensing: A Case Study of the Colombo Metropolitan Area, Sri Lanka. ISPRS Int. J. Geo-Inf. 2016, 5, 197. [Google Scholar] [CrossRef] [Green Version]
  55. Jayathilake, M.B.; Chandrasekara, W.U. Variation of avifaunal diversity in relation to land-use modifications around a tropical estuary, the Negombo estuary in Sri Lanka. J. Asia-Pac. Biodivers. 2015, 8, 72–82. [Google Scholar] [CrossRef] [Green Version]
  56. Rebelo, L.M.; Finlayson, C.M.; Nagabhatla, N. Remote sensing and GIS for wetland inventory, mapping and change analysis. J. Environ. Manag. 2009, 90, 2144–2153. [Google Scholar] [CrossRef] [PubMed]
  57. Cooray, P.G. An Introduction to the Geology of Sri Lanka (Ceylon), 2nd ed.; Colombo National Museums Publication: Colombo, Sri Lanka, 1984. [Google Scholar]
  58. Köppen, W. Klassifikation der Klimate nach Temperatur, Niederschlag und Jahresablauf (Classification of climates according to temperature, precipitation and seasonal cycle). Petermanns Geogr. Mitt. 1918, 64, 193–203. [Google Scholar]
  59. Department of Meteorology, Sri Lanka. Weather Forecasts. Available online: http://www.meteo.gov.lk/index.php?lang=en (accessed on 10 October 2020).
  60. Greater Colombo Economic Commission, Euroconsult. Environmental Profile of Muthurajawela and Negombo Lagoon; Gunaratne offset Ltd.: Colombo, Sri Lanka, 1991. [Google Scholar]
  61. Mao, D.; Wang, Z.; Du, B.; Li, L.; Tian, Y.; Jia, M.; Zeng, Y.; Song, K.; Jiang, M.; Wang, Y. National wetland mapping in China: A new product resulting from object-based and hierarchical classification of Landsat 8 OLI images. ISPRS J. Photogramm. Remote Sens. 2020, 164, 11–25. [Google Scholar] [CrossRef]
  62. Reschke, J.; Hüttich, C. Continuous field mapping of Mediterranean wetlands using sub-pixel spectral signatures and multi-temporal Landsat data. Int. J. Appl. Earth Obs. Geoinf. 2014, 28, 220–229. [Google Scholar] [CrossRef]
  63. Ghosh, S.; Das, A. Urban expansion induced vulnerability assessment of East Kolkata Wetland using Fuzzy MCDM method. Remote Sens. Appl. Soc. Environ. 2019, 13, 191–203. [Google Scholar] [CrossRef]
  64. Mwita, E.; Menz, G.; Misana, S.; Becker, M.; Kisanga, D.; Boehme, B. Mapping small wetlands of Kenya and Tanzania using remote sensing techniques. Int. J. Appl. Earth Obs. Geoinf. 2012, 21, 173–183. [Google Scholar] [CrossRef]
  65. Shanmugam, P.; Ahn, Y.H.; Sanjeevi, S. A comparison of the classification of wetland characteristics by linear spectral mixture modelling and traditional hard classifiers on multispectral remotely sensed imagery in southern India. Ecol. Modell. 2006, 194, 379–394. [Google Scholar] [CrossRef]
  66. Survey Department of Sri Lanka. Available online: https://www.survey.gov.lk/ (accessed on 2 May 2020).
  67. Liu, X.; Dong, G.; Wang, X.; Xue, Z.; Jiang, M.; Lu, X.; Zhang, Y. Characterizing the spatial pattern of marshlands in the Sanjiang Plain, Northeast China. Ecol. Eng. 2013, 53, 335–342. [Google Scholar] [CrossRef]
  68. Estoque, R.C.; Murayama, Y. Landscape pattern and ecosystem service value changes: Implications for environmental sustainability planning for the rapidly urbanizing summer capital of the Philippines. Landsc. Urban Plan. 2013, 116, 60–72. [Google Scholar] [CrossRef]
  69. Zhang, Q.; Chen, C.; Wang, J.; Yang, D.; Zhang, Y.; Wang, Z.; Gao, M. The spatial granularity effect, changing landscape patterns, and suitable landscape metrics in the Three Gorges Reservoir Area, 1995–2015. Ecol. Indic. 2020, 114, 106259. [Google Scholar] [CrossRef]
  70. McGarigal, K. Fragstats; US Department of Agriculture, Forest Service, Pacific Northwest Research Station: Corvallis, OR, USA, 2015; pp. 1–182. [Google Scholar] [CrossRef]
  71. Lu, D.; Weng, Q. Urban Classification Using Full Spectral Information of Landsat ETM+ Imagery in Marion County. Indiana 2005, 71, 1275–1284. [Google Scholar] [CrossRef] [Green Version]
  72. Liu, Y.; Zha, Y.; Gao, J.; Ni, S. Assessment of grassland degradation near Lake Qinghai, West China, using Landsat TM and in situ reflectance spectra data. Int. J. Remote Sens. 2004, 25, 4177–4189. [Google Scholar] [CrossRef]
  73. Sader, S.A.; Ahl, D.; Liou, W.S. Accuracy of landsat-TM and GIS rule-based methods for forest wetland classification in Maine. Remote Sens. Environ. 1995, 53, 133–144. [Google Scholar] [CrossRef]
  74. Slagter, B.; Tsendbazar, N.-E.; Vollrath, A.; Reiche, J. Mapping wetland characteristics using temporally dense Sentinel-1 and Sentinel-2 data: A case study in the St. Lucia wetlands, South Africa. Int. J. Appl. Earth Obs. Geoinf. 2020, 86, 102009. [Google Scholar] [CrossRef]
  75. Singh, P.; Javed, S.; Shashtri, S.; Singh, R.P.; Vishwakarma, C.A.; Mukherjee, S. Influence of changes in watershed landuse pattern on the wetland of Sultanpur National Park, Haryana using remote sensing techniques and hydrochemical analysis. Remote Sens. Appl. Soc. Environ. 2017, 7, 84–92. [Google Scholar] [CrossRef]
  76. Expressway Operation Maintenance And Management Division Road Development Authority-Sri Lanka. Available online: http://www.exway.rda.gov.lk/index.php?page=expressway_network/e03 (accessed on 5 May 2020).
  77. Zubair, O.A.; Ji, W.; Weilert, T.E. Modeling the Impact of Urban Landscape Change on Urban Wetlands Using Similarity Weighted Instance-Based Machine Learning and Markov Model. Sustainability 2017, 9, 2223. [Google Scholar] [CrossRef] [Green Version]
  78. Wei, Z.; Jingang, J.; Yubi, Z.H.U. Change in Urban Wetlands and Their Cold Island Effects in Response to Rapid Urbanization. Chin. Geogr. Sci. 2015, 25, 462–471. [Google Scholar] [CrossRef] [Green Version]
  79. Athukorala, D.; Murayama, Y. Spatial Variation of Land Use/Cover Composition and Impact on Surface Urban Heat Island in a Tropical Sub-Saharan City of Accra, Ghana. Sustainability 2020, 12, 7953. [Google Scholar] [CrossRef]
  80. Ozesmi, S.L.; Bauer, M.E. Satellite remote sensing of wetlands. Wetl. Ecol. Manag. 2002, 10, 381–402. [Google Scholar] [CrossRef]
  81. Lane, C.R.; Liu, H.; Autrey, B.C.; Anenkhonov, O.A.; Chepinoga, V.V.; Wu, Q. Improved Wetland Classification Using Eight-Band High Resolution Satellite Imagery and a Hybrid Approach. Remote Sens. 2014, 6, 12187. [Google Scholar] [CrossRef] [Green Version]
  82. Abeywardene, J.; de Alwis, R.; Jayasena, A.; Jayaweera, S.; Sanmugam, T. Export Processing Zones in Sri Lanka: Economic Impact and Social Issues; Center for Women’s Research: Colombo, Sri Lanka, 1994. [Google Scholar]
  83. Kelegama, S.; Corea, G. Economic Policy in Sri Lanka: Issues and Debates; SAGE Publications: New York, NY, USA, 2004; ISBN 9780761932789. [Google Scholar]
  84. Hogg, C.L. Sri Lanka: Prospects for Reform and Reconciliation; Chatham House: London, UK, 2011. [Google Scholar]
  85. Department of Census and Statistics-Sri Lanka. Available online: http://www.statistics.gov.lk/ (accessed on 3 May 2020).
  86. Ancog, R.; Ruzol, C. Urbanization adjacent to a wetland of international importance: The case of Olango Island Wildlife Sanctuary, Metro Cebu, Philippines. Habitat Int. 2015, 49, 325–332. [Google Scholar] [CrossRef]
  87. Thibault, P.A.; Zippererb, W.C. Temporal changes of wetlands within an urbanizing agricultural landscape. Landsc. Urban Plan. 1994, 28, 245–251. [Google Scholar] [CrossRef]
  88. Akbostanci, E.; Türüt-Aşik, S.; Tunç, G.I. The relationship between income and environment in Turkey: Is there an environmental Kuznets curve? Energy Policy 2009, 37, 861–867. [Google Scholar] [CrossRef]
  89. Ramsar. Implementation of the Ramsar Convention in General, and of the Ramsar Strategic Plan 1997-2002 in Particular, during the Period Since the National Report Prepared in 1995 for Ramsar COP6 and 30 June 1998. Available online: https://www.ramsar.org/document/cop7-national-reports-sri-lanka (accessed on 14 January 2021).
  90. Estoque, R.C.; Murayama, Y. Examining the potential impact of land use/cover changes on the ecosystem services of Baguio city, the Philippines: A scenario-based analysis. Appl. Geogr. 2012, 35, 316–326. [Google Scholar] [CrossRef]
  91. Ramsar Convention. Scaling up Wetland Conservation, Wise Use and Restoration to Achieve the Sustainable Development Goals; Ramsar Convention: Ramsar, Iran, 2018; pp. 1–13. [Google Scholar]
  92. United Nations Environment programme (UNEP). The Aichi Passport; United Nations Environment programme (UNEP): Nairobi, Kenya, 2012. [Google Scholar]
Figure 1. Geological evolution of the Muthurajawela Marsh and Negombo Lagoon (MMNL), Sri Lanka, from the Holocene period to the present. (a) The MMNL in the mid-Holocene period, marked with a marine regression, exposing a wider coastal area; (b) Wetland started to form (c. 7000); (c) Formation of wetland from south to north and clay deposits continued (c. 6500); (d) Marshland and lagoon started to form as an interdependent ecological system (c. 6500–6300); (e) Formation of marshland and lagoon continued at the final stage, forming one contiguous wetland (c. 6000); and (f) The present condition in which the MMNL is an important urban wetland ecosystem (UWE) in the Colombo Metropolitan Region with high socio-ecological significance. The images were sourced from the MMNL’s master plan and MMNL’s conservation management plan [49,50].
Remotesensing 13 00316 g001
Figure 2. Location of the MMNL. (a) Map of Sri Lanka, (b) Gampaha District, and (c) a 3D map of the MMNL produced using a 30 m digital elevation model (ASTER). The Google Earth image was acquired on 17 February 2017.
Remotesensing 13 00316 g002
Figure 3. LUC maps of the MMNL in 1997, 2007, and 2017 derived from Landsat data (see Methods).
Remotesensing 13 00316 g003
Figure 4. Spatial distribution of wetland loss in the MMNL due to urbanization (settlement expansion). (left) 1997 to 2007; and (right) 2007 to 2017. Wetland includes water, mangrove, and marshland.
Remotesensing 13 00316 g004
Figure 5. GN-level change in population density (CPD) (a,b) and density of wetland loss due to urbanization (settlement expansion) (WLD) (c and d) in the MMNL. Wetland includes water, mangrove, and marshland. The numbers on maps (c,d) refer to the numbers of the GNs in Appendix A Table A2.
Remotesensing 13 00316 g005
Figure 6. Relationship between change in population density (CPD) and density of wetland loss due to settlement expansion (WLD) in the MMNL during (a) 1997–2007 (TP1) and (b) 2007–2017 (TP1). Each point is a GN division.
Remotesensing 13 00316 g006
Figure 7. Class-level spatial metrics for the MMNL (1997–2017).
Remotesensing 13 00316 g007
Figure 8. Projected population trend for Wattala, Ja-Ela, Katana and Negombo DSDs of Gampaha District: The population data for 1981, 2001 and 2012 were sourced from the Department of Census and Statistics, Sri Lanka [85]. The 1991 population was projected using growth rates of 5.1%, 2.6%, 2.1%, and 6.9% for Wattala, Ja-Ela, Katana, and Negombo, respectively. From 2021 to 2051, growth rates were projected using rates of 0.87%, 0.83%, 0.51%, and −0.13% for Wattala, Ja-Ela, Katana, and Negombo, respectively.
Remotesensing 13 00316 g008
Figure 9. Some fieldwork photos of the MMNL: (a) Human encroachment in Negombo Lagoon area, (b) Illegal settlements of the study area, (c) Dumping of garbage into the lagoon, and (d) Human activities inside the Muthurajawela marshland. Source: First author (D. A.), 2017.
Remotesensing 13 00316 g009
Table 1. Wetland classification scheme used in this study.
LUC ClassLand Surface Features
SettlementUrban, residential, industrial, transportation (roads, train lines), communications and utilities infrastructure, airports, home gardens, concrete structures, power plants, and asphalt areas.
MarshlandSeasonally flooded areas with abandoned paddy fields, intermittently flooded areas with agriculture, marsh plant communities, trees, scrub and grassland, peat soil, bog soil and back swamp, and other cultivated areas.
MangroveSeasonally flooded areas with mangroves, intermittently flooded areas with mangroves and mangrove pneumatophore areas.
WaterLagoon, streams, canals, and ponds.
Table 2. Class and landscape-level spatial metrics [70].
MetricEquationUnitDefinition
Number of Patches (NP)NP = n i NoneReflects the number of patches of the similar patch type or LUC class; a simple measure of the degree of fragmentation
Patch Density (PD) PD = n i A   10,000 100 No. per 100 haEqual to the number of patches at each LUC class per unit area. A limited, yet important feature of the landscaping
Edge Density (ED) ED = k = 1 m e i k A   ( 10,000 ) Meters per haMeasures based on edge length of a specific LUC class per unit area
Largest Patch Index (LPI) LPI = n m a x j = i   a i j A   100 PercentQuantifies the percentage of total landscape area taken up by the largest patch at the class level. It is a simple indicator of dominance
Landscape Shape Index (LSI) LSI = 0.25   k = 1 m e ik * A NoneA measure of the total edge or edge density within the landscape divided by the total landscape.
Cohesion (COHESION) COHESION = 1   j = 1 n P i j * j = 1 n P i j * a i j * .   1   1 Z 1 .   ( 100 ) None
0–100
The physical connectivity of the corresponding patch type of LUC class. Rises with more clustering of the patch type in its configuration, resulting in a more physical combination.
Shannon’s Diversity Index (SHDI)SHDI =   i 1 m ( P i   ° I nP i ) InformationReflects the landscape heterogeneity and compares various landscapes or the same landscape at different times as a relative index.
Shannon’s Evenness Index (SHEI) SHEI = i = 1 m (   P i   ° I n P i ) I n m NoneMaximum evenness of the area, reflecting a clear trend among the patch types at the landscape level.
Where: i = any LUC patch; n i = number of patches of LUC category i; A = total area of LUC (m2);   e i k   i s   s u m   o f   edge total (m) in LUC class I—counting landscape boundary and segments; j = 1,2, 3,…, n sum of the specific patch area;   a i j = patch area ij in number of the pixel ;   p i = proportion of the i—any LUC area of the total landscape;     p i j = circumference of patch ij regarding the sum of cell surface; Z = total pixel in the landscape; m = total patch in the entire area, without landscape border. Patch number was determined based on the eight-cell neighborhood rule.
Table 3. LUC transitions in the MMNL (ha).
19972007TotalLoss
MarshlandMangroveWaterSettlement
(a) 1997–2007
Marshland3007.89519.932.431244.884775.131767.24
Mangrove615.421081.442.79202.681902.33820.89
Water65.071.443118.4116.833201.7583.34
Settlement547.2933.121.082950.383531.87581.49
Total4235.671635.933124.714414.7713,411.08
Gain1227.78554.496.31464.39
20072017TotalLoss
MarshlandMangroveWaterSettlement
(b) 2007–2017
Marshland1953.45538.230.511713.514235.672282.22
Mangrove541.71944.010.9149.311635.93691.92
Water10.623.153092.8518.093124.7131.86
Settlement324.0924.484.324061.884414.77352.89
Total2829.871509.843128.585942.7913,411.08
Gain876.42565.8335.731880.91
Table 4. Losses and gains of the LUC classes in the MMNL.
L/G Area (ha)L/G Rate (%)
1997–2007
Marshland−539.46−11.30
Mangrove−266.40−14.00
Water−77.04−2.41
Settlement882.9025.00
2007–2017
Marshland−1405.80−33.19
Mangrove−126.09−7.71
Water3.870.12
Settlement1528.0234.61
Table 5. Landscape-level spatial metrics for the MMNL (1997–2017).
YearSHDISHEI
19971.33830.9654
20071.32630.9567
20171.28320.9256
Publisher’s Note: MDPI stays neutral with regard to jurisdictional claims in published maps and institutional affiliations.

