Article

Landslide Hazard Assessment Map as an Element Supporting Spatial Planning: The Flysch Carpathians Region Study

1
The Faculty of Civil, Environmental Engineering and Architecture, Rzeszow University of Technology, Powstańców Warszawy 12, 35-959 Rzeszow, Poland
2
Civil Engineering Department, Tongji Zhejiang College,168 Nanhu Avenue, Jiaxing 314001, China
3
The Department of Geotechnical Engineering, Tongji University, 1239 Siping Road, Shanghai 200092, China
4
The Faculty of Civil Engineering, Cracow University of Technology, Warszawska 24, 31-155 Krakow, Poland
*
Author to whom correspondence should be addressed.
Submission received: 1 December 2020 / Revised: 14 January 2021 / Accepted: 15 January 2021 / Published: 18 January 2021
(This article belongs to the Special Issue Geoinformation Technologies in Civil Engineering and the Environment)

Abstract

:
Landslides and rock falls are among the many phenomena that have an impact on sustainable construction and infrastructure safety. The main causes of landslides are natural meteorological and hydrological phenomena. In building design and construction, environmental monitoring by identifying geotechnical hazards must be taken into account, as appropriate hazard assessment contributes to ensuring future construction safety. The Carpathian region in southern Poland is particularly predisposed to landslide formation. This may be favored by the nature of the shapes associated with the high and steep slopes of the region’s valleys. Another reason for concern is the flysch geological structure, which is characterized by alternating layers of water-permeable sandstones and poorly permeable shales, clays, and marls. Furthermore, the presence of a quaternary weathering cover makes the geological structure more susceptible to landslide processes and tectonic formations. The paper presents the results of a study whose aim was to elaborate a detailed landslide hazard map for a selected area in the Polish Carpathians, using statistical methods. The approach is based on the Hellwig method, which seems particularly useful in the assessment of susceptibility and landslide hazards on a local scale for a relatively small area. A two-stage study was conducted. The first stage of the research involved the creation of a database associated with environmental parameters and triggering factors, whereas the second stage consisted of the adoption of weights for seven thematic sections and their special features on the basis of expert knowledge. The hazard map developed as a result was compared to the mapping made using the weight-of-evidence method. The proposed data normalization method allows the use and analysis of both qualitative and quantitative data collected from various sources. The advantage of this method is the simple calculation procedure. A large-scale (1:2000) map might be used to assess the landslide hazard for specific cadastral units. Such a map becomes the basis for municipal spatial planning and may be able to influence investment decisions. Detailed landslide hazard maps are crucial for more precise risk evaluation for specific cadastral units. This, in turn, allows one to reduce serious economic and social losses, which might be the future results of landslides.

Graphical Abstract

1. Introduction

Over the past few decades, extreme natural phenomena, such as heavy or prolonged precipitation and the associated increased landslide risk, have caused significant economic and financial losses in the affected areas. Slope failure is one of the most frequent geological hazards. Quantitative risk assessment for slope failure is a powerful tool for hazard mitigation and has been widely applied around the world [1]. Several problems may arise in assessing risks in a large and a small area. One major problem is related to the efficiency of the assessment of landslide risk.
The current situation should compel constant improvement of the principles and research methods used in defining landslide areas, including monitoring landslides and mapping landslide probability, or mapping landslide hazard.
Landslide susceptibility and hazard assessment has been critically examined in several papers [2,3,4,5]. In the present article, both qualitative and quantitative approaches were considered, and different aspects of susceptibility modeling and terrain zonation were discussed. A thorough review of statistically based landslide susceptibility models was conducted in [2]. Paper [3] focused on the applicability of various approaches at different geographical scales, from site-specific engineering methods referring to single slopes or landslides to geomorphological approaches best suited for regional analyses, with their advantages and limitations highlighted. The authors of papers [2,3] also stressed the importance of hazard assessment for landslide risk analysis and specifically for the assessment of acceptable risk levels. Paper [6] underscored the need for good-quality landslide and geo-environmental information, the selection of appropriate terrain subdivisions, and the different modeling approaches adopted for landslide susceptibility zonation, focusing on discussion and classification of statistically based modeling approaches.
Papers [7,8,9] presented systematic reviews of landslide susceptibility assessment approaches; the present article analyzed specific aspects of statistically based modeling methods for hazard evaluation. Papers [2,10] applied geo-environmental information for landslide susceptibility, hazard, and vulnerability assessments, focusing on the type and relevance of the thematic and environmental information needed for each assessment and the methods used to obtain the information. The availability of geo-environmental information conditions the scale and the approach best suited for susceptibility, hazard, and vulnerability analyses, which significantly influence landslide assessment [11].
Paper [12] provided a list of variables used in the literature to model rainfall-induced landslides. It was found that the most sensitive variables are terrain slope and shape and geology/lithology. They significantly change with the type of landslide and the type of landslide startup. When selecting explanatory variables, investigators should use their knowledge and understanding of landslide processes. Landslide movements triggered by rainfall can be foreseen by modeling the relation between rainfall amount and landslide occurrence [5].
To prevent future risk caused by mass movement, effective methods of detecting, mapping, monitoring, and remediating landslides are needed. Ideally, an automatic or semi-automatic detection method [2,6] should identify early warning signs of potentially hazardous mass movement and/or rainfall, allowing for a better understanding of landslide behavior. Most of the existing techniques require intensive manual effort and are typically based on field inspection, aerial photograph interpretation, and contour map analysis. However, all these methods may be used to reduce the hazard and assess risk. Risk assessment is necessary to map small landslides with a high confidence level. Many sites are not easily accessible for field inspections. Dense land cover poses difficulties for both on-site inspection and aerial photo interpretation. Historical contour maps do not have the spatial resolution necessary to map small failures in dense land cover, whereas conventional remote sensing methods cannot penetrate the vegetation. For these reasons, traditional methods and techniques are still sufficiently effective for landslide detection. These methods are still the most useful for field data collecting. This is necessary for susceptibility and hazard mapping at a large scale (e.g., 1:2000, 1:5000) for small-area needs.
The problem of landslide hazard and risk assessment has not yet been discussed in the scientific literature for the analyzed area (the Gwozdzianka village located in the northern part of the Subcarpathian province). This paper refers to the Hellwig data normalization method [13] based on a synthetic quality indicator. Methods of synthetic measures have been successfully applied in identifying intensively developing countries and developing technical infrastructure for rural areas. However, the authors of the present article have not encountered the application of this method in landslide hazard assessment on both local and regional scales. The applicative character of this method and its advantages under the Polish Carpathian conditions are a prerequisite for its wider use and correlation with the results of other methods. The research performed so far has often been based on the method proposed by Van Westen [14], the statistical weight-of-evidence method based on Bayesian probability [15,16], or the index method. Therefore, the proposed methodology is different from the approaches presented so far. The final landslide hazard map for the analyzed area was developed using the data normalization method. The results obtained were verified and compared with mapping elaborated according to the weight-of-evidence method.
Risk assessment starts with identifying major potential hazards that may lead to different failure scenarios. A hazard describes the volume and probability of the occurrence of a landslide. Hazard identification requires an understanding of slope failure processes and the relationship between these processes and the geomorphology, geology, hydrogeology, climate, and vegetation at the site in question. Then, on the basis of available data for past slope failures, the change of probability for slope failure within a time period and space becomes possible to estimate. The probability of slope failure includes both spatial and temporal probabilities [17]. The former is related to static environmental factors such as slope shape, geotechnical parameters of the ground, and depth, while the latter is related indirectly to some static environmental factors such as slope and hydraulic conductivity and directly to dynamic factors such as rain input and drainage. Paper [17] discussed the difficulties related to the assessment of temporal and spatial probabilities. Determining spatial and temporal probabilities is usually the most challenging task in risk assessment. It is, however, a key step in risk analysis. Risk assessment in relation to planned and existing buildings and the transportation infrastructure is a very important task due to its potential social, economic, and financial consequences. In recent years, a significant number of small- and medium-size landslides in the Polish Carpathians have brought huge economic and social losses, which could have been reduced or avoided by having more accurate information on potential hazards. A significant increase in landslide occurrence in this area was recorded in spring and summer 2010 due to heavy rainfalls. While landslide processes are taken into account when designing and implementing large engineering investments, they are rarely considered when implementing smaller projects. This applies to the development of not only private properties but also communal areas. In view of the above, the research undertaken seems to be justified.
The methodology determining a landslide hazard with regard to the geo-environmental specificity of the analyzed area is presented in this paper. The proposed approach has both methodical and practical significance. It could be a supporting instrument for solving tasks that aim to limit and/or prevent the effects of natural disasters. Detailed landslide hazard maps are crucial for spatial planning in small areas of districts and communes. Hazard assessment for specific cadastral units is the basis for more precise risk evaluation.

2. General Overview of the Landslide Problem in Poland

2.1. Geospatial Management

The main reason for the high financial losses occurring in the landslide areas of Poland is that the locating of construction and transportation infrastructure on vulnerable or active slopes is not well considered by investors. Financial expenditures for reconstructing and/or repairing damaged facilities and roads remain significant. Losses caused by landslides are counted in the millions. In the Lesser Poland province alone, financial repercussions of landslides that occurred in the year 2010 amounted to approximately 50 million euros, whereas the losses across the country in the period from May to June 2010 were estimated at almost 3 billion euros (government data). In comparison, the average economic loss per year in Europe is estimated at approximately 4.7 billion euros [18]. However, it should be emphasized that in many cases, only the resulting damage, and not the cause of mass movements, is removed. Incorrect stabilization of landslides is often the result of insufficient geological recognition, based only on theoretical premises, and not confirmed by appropriate geotechnical research [19]. Financial and economic losses caused by landslides may be estimated, while social and moral losses are nearly impossible to valuate. The only effective solution to the landslide problem is to avoid building new developments on those areas that are prone to active landslides and to limit those buildings predisposed to their occurrence. Above all, it is imperative to establish appropriate monitoring and develop landslide hazard maps. The System Guards Against Landslides (SOPO) project [20], implemented in Poland in recent years, offers the chance to avoid major future problems related to mass movements by introducing landslide data cards, containing descriptions of individual landslides and regular observations and monitoring results, in particularly threatened areas to limit private and public construction work in at-risk areas. The SOPO project plans to limit the negative effects of mass movements throughout Poland [20].
The difficulty in forecasting landslides is closely related to rainfall, and it results from irregularities in the occurrence of various weather phenomena. Catastrophic rains may occur once every several years or every several hundred years. Their occurrence is, in practice, unpredictable, and only its statistical probability can be determined.
The end of the 20th century and the beginning of the 21st century were marked by an exceptional severity of catastrophic events in the Polish Carpathians. After a long hiatus in the years 1980–1990, and with no high precipitation in the area occurring since July 1997, there has been a radical change in the amount of precipitation and spatial distribution. After the rainfall in July 1997, a great amount of water contributed to the launch of the Carpathian slopes. New landslides evolved and old ones were renewed in the western and central parts of the mountains, in areas with existing housing and communications infrastructure, leading to infrastructure deterioration. The weather conditions in the winter of 1999–2000 contributed to the renewal of many landslides, mainly in the area of the Carpathian foothills (over 2500 reported cases) [19].
A specific cluster of extreme phenomena, which began with catastrophic precipitation in the summer of 1996, was recorded. It marked the activation of an enormous number of landslide processes in the Carpathians. The cluster lasted for several years, until 2010. The end of the landslide process is hardly strictly determined, as a landslide is in a state of unstable equilibrium once the stability of the slope is disturbed, even by a less efficient driving force [21].
Landslides formed as a result of recent catastrophic precipitation and the associated floods, together with the losses counted each year in hundreds of millions, caused mass movements to be listed into the catalog of natural disasters and included in Polish law. Therefore, it is necessary to develop effective methods that allow for the assessment of at-hazard areas.

2.2. Climate and Hydrological Conditions of the Polish Carpathians

Each landslide occurrence contains basic information about the hillslope. Evidently, the informative content of a single landslide occurrence is related to its characteristics. From a qualitative point of view, it is possible to distinguish between two distinct cases. The first case corresponds to a situation in which the rainfall that triggers a landslide movement, while being very intense, is not significantly more intense than the rainfall recorded in other rainy periods when no landslide movement occurred. In this case, it can be said that the event has high informative content. The occurrence of an event of this kind contains much information about the nature of a landslide. Evidently, this kind of event causes a considerable reduction in the extension of the admissibility field, or a limited extension if the event occurs for the first time. In such a case, the ranking technique may be employed. The other case occurs when a landslide is triggered in correspondence with rains significantly more intense than those recorded in other periods. In this case, the phenomenon causes only a small reduction in the admissibility field, or a large extension if the phenomenon occurs for the first time. An event of this kind could be characterized as having low informative content.
In the majority of cases, the main indicating factor for landslides and slope failures is the soil moisture condition [22]. Slope failures and landslides occur during or immediately after heavy or prolonged rainfall. When rainwater infiltrates a soil slope, the soil is initially unsaturated. Subsequently, there is an increase in the groundwater table or a decrease in negative pore water pressure (matric suction). This leads to an increase in pore water pressure and a subsequent decrease in effective stresses, which reduces the soil’s shear strength to sustain loads. When the shear strength mobilized along a critical slip surface is no longer adequate to support the shear stress, the soil mass slips and the slope fails [23].
Rainfall-induced landslides are caused by changes in pore water pressure and additional seepage forces. Two distinct ways of failure have been defined for rainfall-induced landslides. One way is when a significant buildup of positive pressure may be observed in the toe of the slope or along the soil/bedrock interface. Movements along the sliding surface lead to liquefaction along the surface, resulting in rapid displacement, long runout distances, and, finally, complete liquefaction of the failed mass. The in situ stress path can be a constant shear stress path. The other way is when the soil is unsaturated and slope failure happens mainly due to rainfall infiltration and deterioration of the shear strength when soil suction is decreased or dissipated.
Poland is located in a moderate climate zone [24] and is exposed to various extreme phenomena of induced landslides, which represent a major hazard not only in the Carpathian region but also in other parts of the country (e.g., the Sandomierz Upland) [19,20]. In southern Poland, there is a threat of landslides in all districts and communes located within the Carpathians, and in the provinces of Silesia, Lesser Poland, and Subcarpathians (Figure 1), where the state of the ground changes after rainfall. Rainwater infiltration greatly contributes to soil slope instability in this region.
Preliminary statistics show that in the Polish Carpathian region, most catastrophic landslide events are associated with rainfall. Landslide processes are generally triggered after a certain delay in rainfall. This explains why they can occur in the weeks following an occurrence of heavy and continuous precipitation. In the Carpathians, after a rainfall exceeding 70–100 mm, shallow landslides generally become active, whereas after a rainfall exceeding 400 mm, large and deep landslides can form [19]. Landslides are triggered there by rapid saturation of soil, which, in turn, reduces cohesion, surface tension, and friction. The rains that occurred in the years 1980–1990 and 1997–2010 exacerbated landslide hazards, resulting in an urgent need to establish early warning systems in the Carpathian region.
In the Carpathians, which occupy about 6% of the total surface area of Poland, 23,000 landslides have been identified and documented, which is about 95% of all registered landslides in Poland. In the most susceptible regions of the mountains, about 40% of the area is covered by landslides or other forms of mass movements. The Polish Carpathians cover approximately 19,500 km2; therefore, it can be estimated that in this region of Poland, there is, on average, one landslide for every square kilometer of the area and every 5 km of road infrastructure network (Figure 2) [19,20].
Heavy or volatile rains come from storm clouds (cumulonimbus); they usually last several dozen minutes to a few hours and are characterized by high intensity and a varied local range, covering an area of several square kilometers to several hundred square kilometers. They occur in the Polish Carpathians during summer, from May to September, most frequently in July [24]. Rain phenomena that last longer (up to several days) usually consist of several periods of precipitation occurring immediately one after the other, separated by periods without precipitation. As for the design of the slopes and the occurrence of landslide phenomena, the most important factor is the long-term (widespread) rainfall affecting the state of the soil [21]. This type of rainfall causes the largest water infiltration into the subsoil. Therefore, it is necessary to limit the detrimental effects of such unpredictable precipitation by both determining its probability and performing risk quantification. There have been numerous attempts to identify rainfall amounts responsible for triggering landslides, and much literature is available, e.g., [26,27]. In some landslide areas, early warning systems based on rainfall amount measurement are currently in use.
To increase the reliability of the road infrastructure and construction objects designed on slopes according to EN 1990 [28] and ISO 2394 [29], it has become crucial to refine the principles of dimensioning based on continuous precipitation measurements over several decades [30]. There is a need to capture the possible trend of climate change, especially in recent decades, and to develop methods for estimating both the hazard and the risk, while taking into account the economic consequences. The efficiency and credibility of each calculation method, as evidenced by the principles of reliability, determine the fulfillment of requirements for safe and durable use in the designed life span [30].

2.3. Subsoil Conditions and Geotechnical Parameters

The Polish Carpathians are predisposed to landslide formation due to the nature of the region’s topography (high and steeply inclined valley slopes); flysch geological structure (alternating layers of water-permeable sandstones and poorly permeable shales, claystones, and marls); the presence of thicker, clayey weathering covers; and tectonic construction (rock placement, cracks, faults) [31]. The Outer Flysch Carpathians occupy 94% of the total surface area of the Polish Carpathians. Quaternary weathering covers are often made of silty soils (silts and silty clays). These deposits can be extremely solid when dry but significantly lose cohesion when partially or fully saturated. In the state of stiff consistency (soil consistency index IC > 0.75), they constitute a load-bearing and stable subsoil. However, silty soils are characterized by high susceptibility to the influence of water, both surficial runoff (Figure 3) and groundwater.
Sensitivity to water content changes is directly related to a decrease in the strength parameters of the subsoil—the angle of internal friction and cohesion. In the state of soft consistency, the values of these parameters can decrease to zero. This is one of the primary causes of landslide hazards in the area analyzed here. Silts in this region have soft consistency at water content wn = 24% and liquefy if that percentage increases (wn > 27%), as shown in Figure 4.
Seasonal changes in the natural water content have a particularly strong impact on the value of the cohesion parameter. It is mainly forces of cohesion that determine slope stability. For example, observations from one of the investigation sites prove that a natural water content change of the silty layer in the range of wn = 18–23% results in a twofold decrease in the internal friction angle from 24° to 12° and an over fourfold decrease in cohesion from 25 to 6 kPa. In turn, due to their higher plasticity, clays are less sensitive to changes in the moisture content.
It is necessary to predict the values of mechanical parameters depending on the potential changes in the water content and to estimate their impact on slope stability and the size of settlements [32,33]. This process requires appropriate computational analyses in order to characterize changes in the strength properties of the subsoil, the piezometric level of groundwater (generating additional downstream pressure), and the infiltration of rainwater and flood waters. These analyses require advanced computational tools using methods of artificial intelligence, discrete methods (finite element method, FEM), and probabilistic methods [16,17,34]. Analyzing moisture transfer in soils is a highly complicated process.

3. Materials and Methods

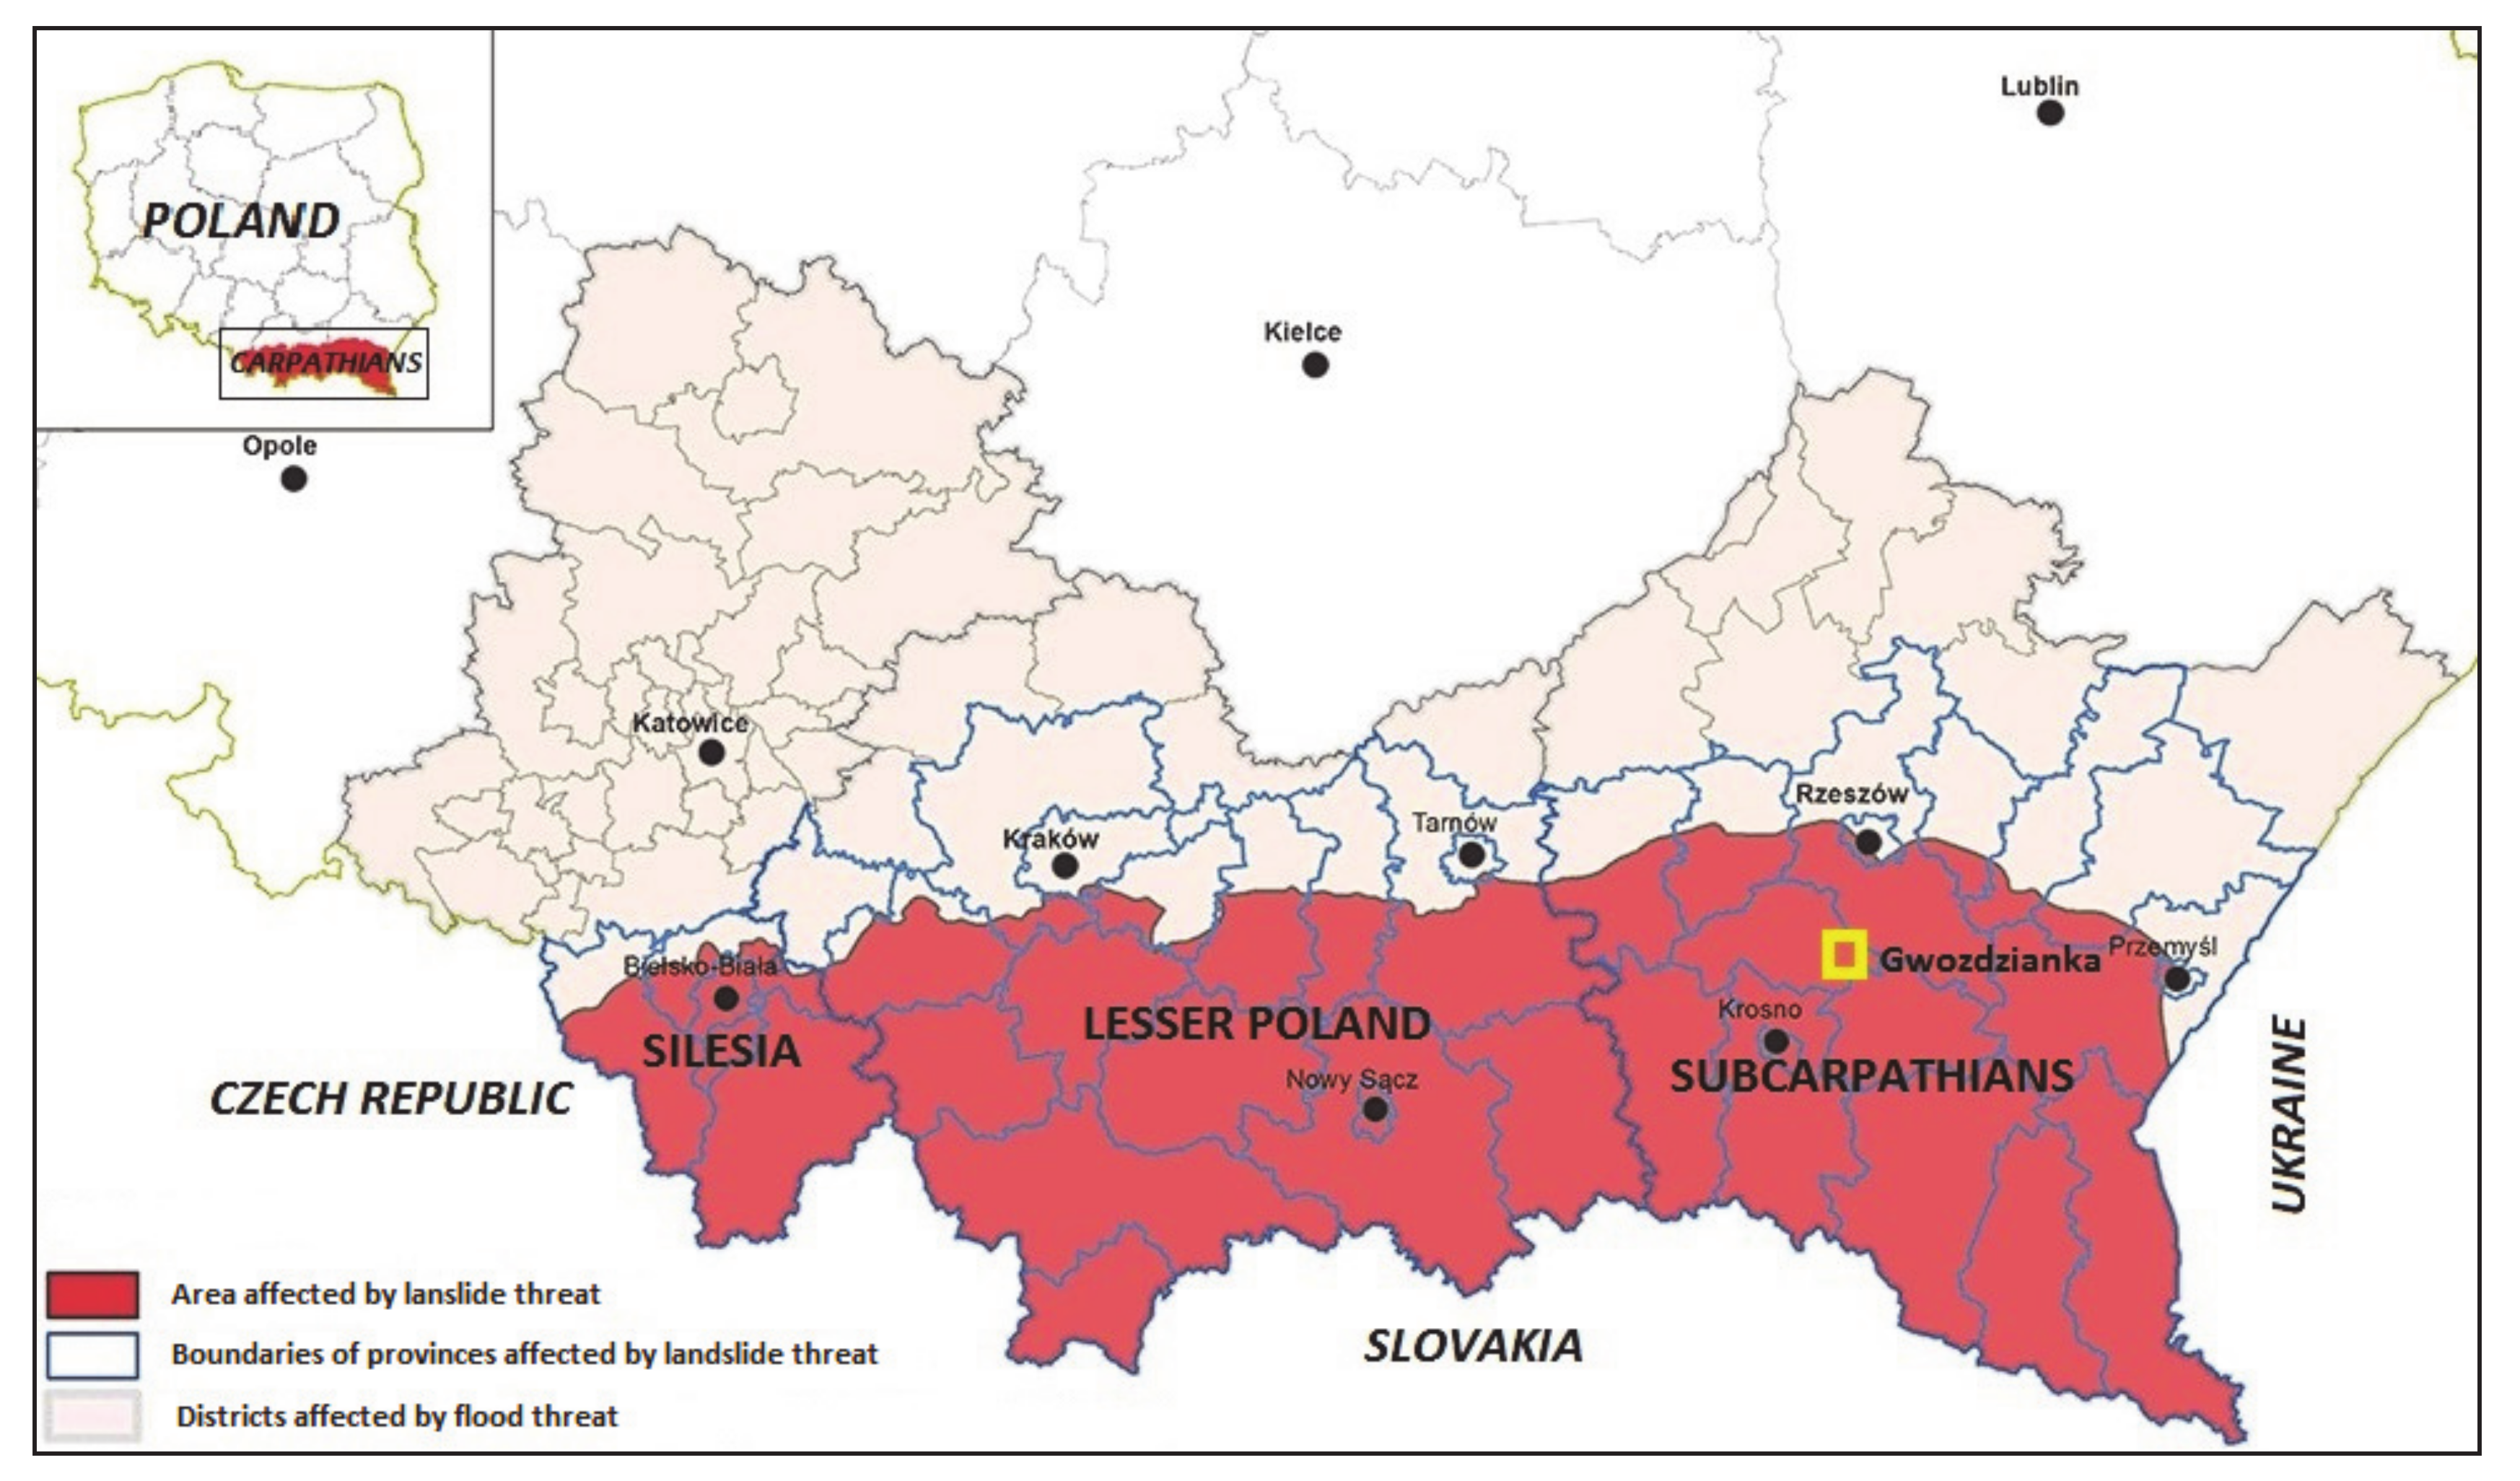
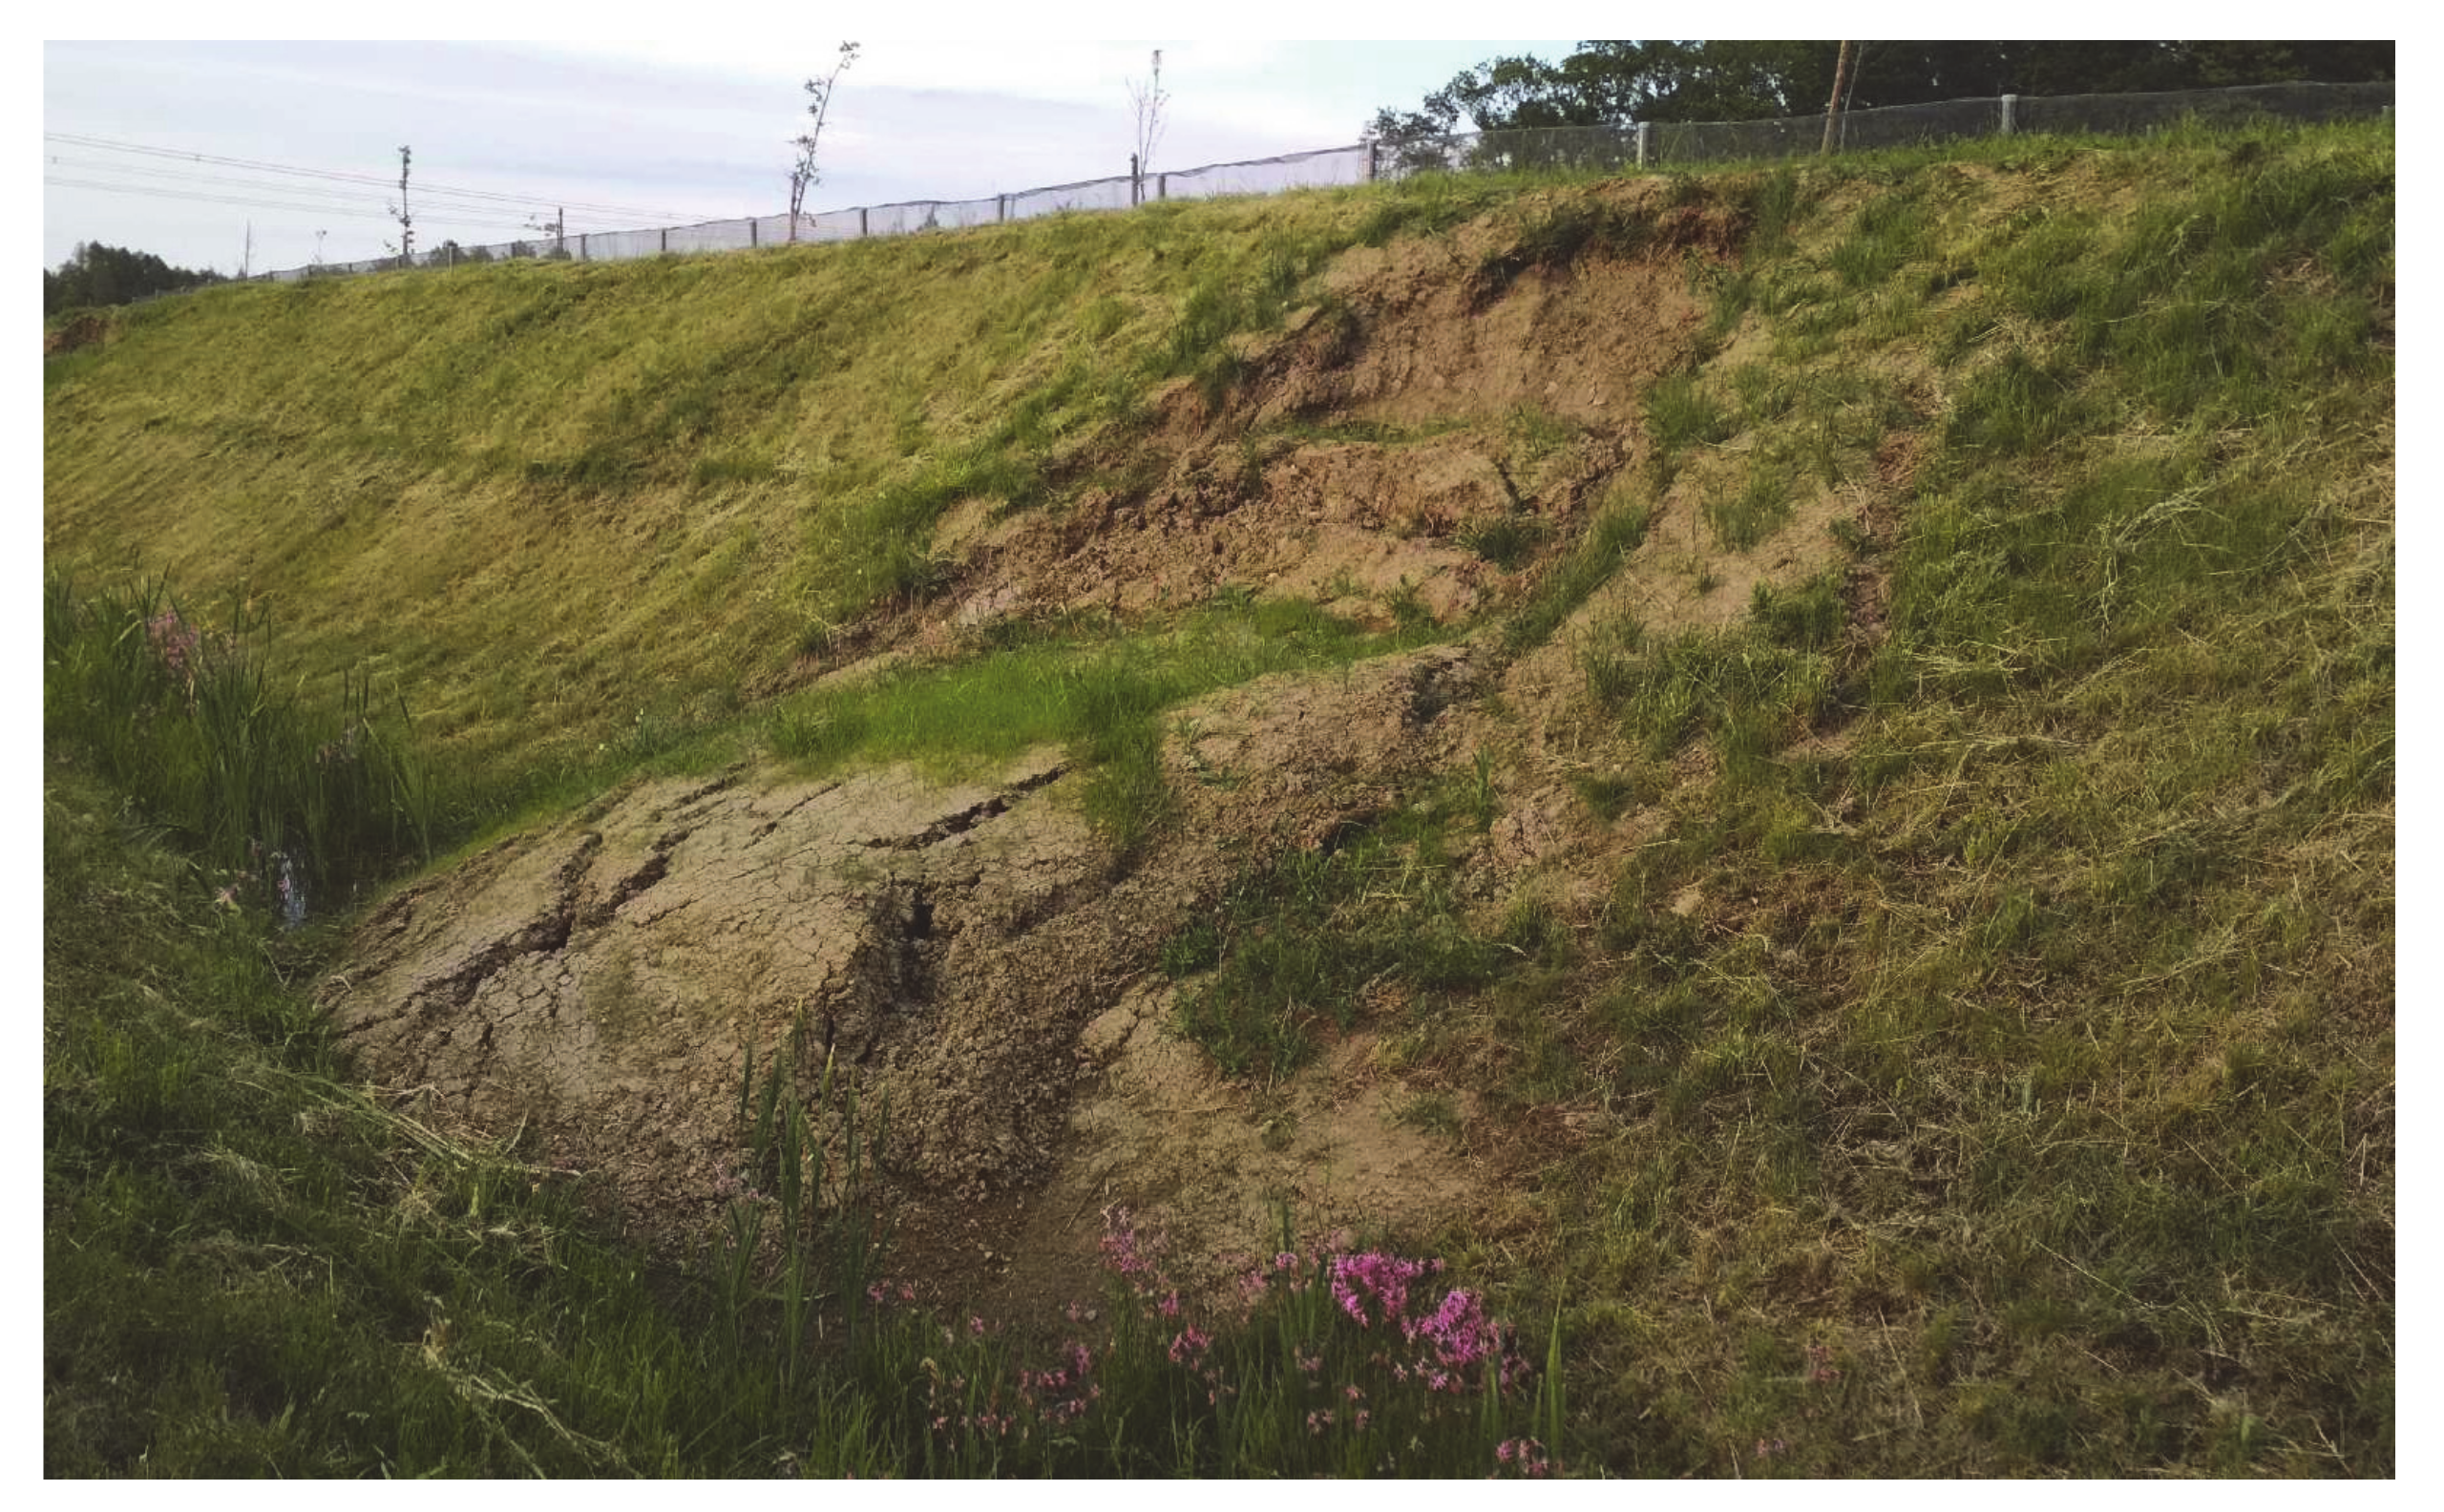
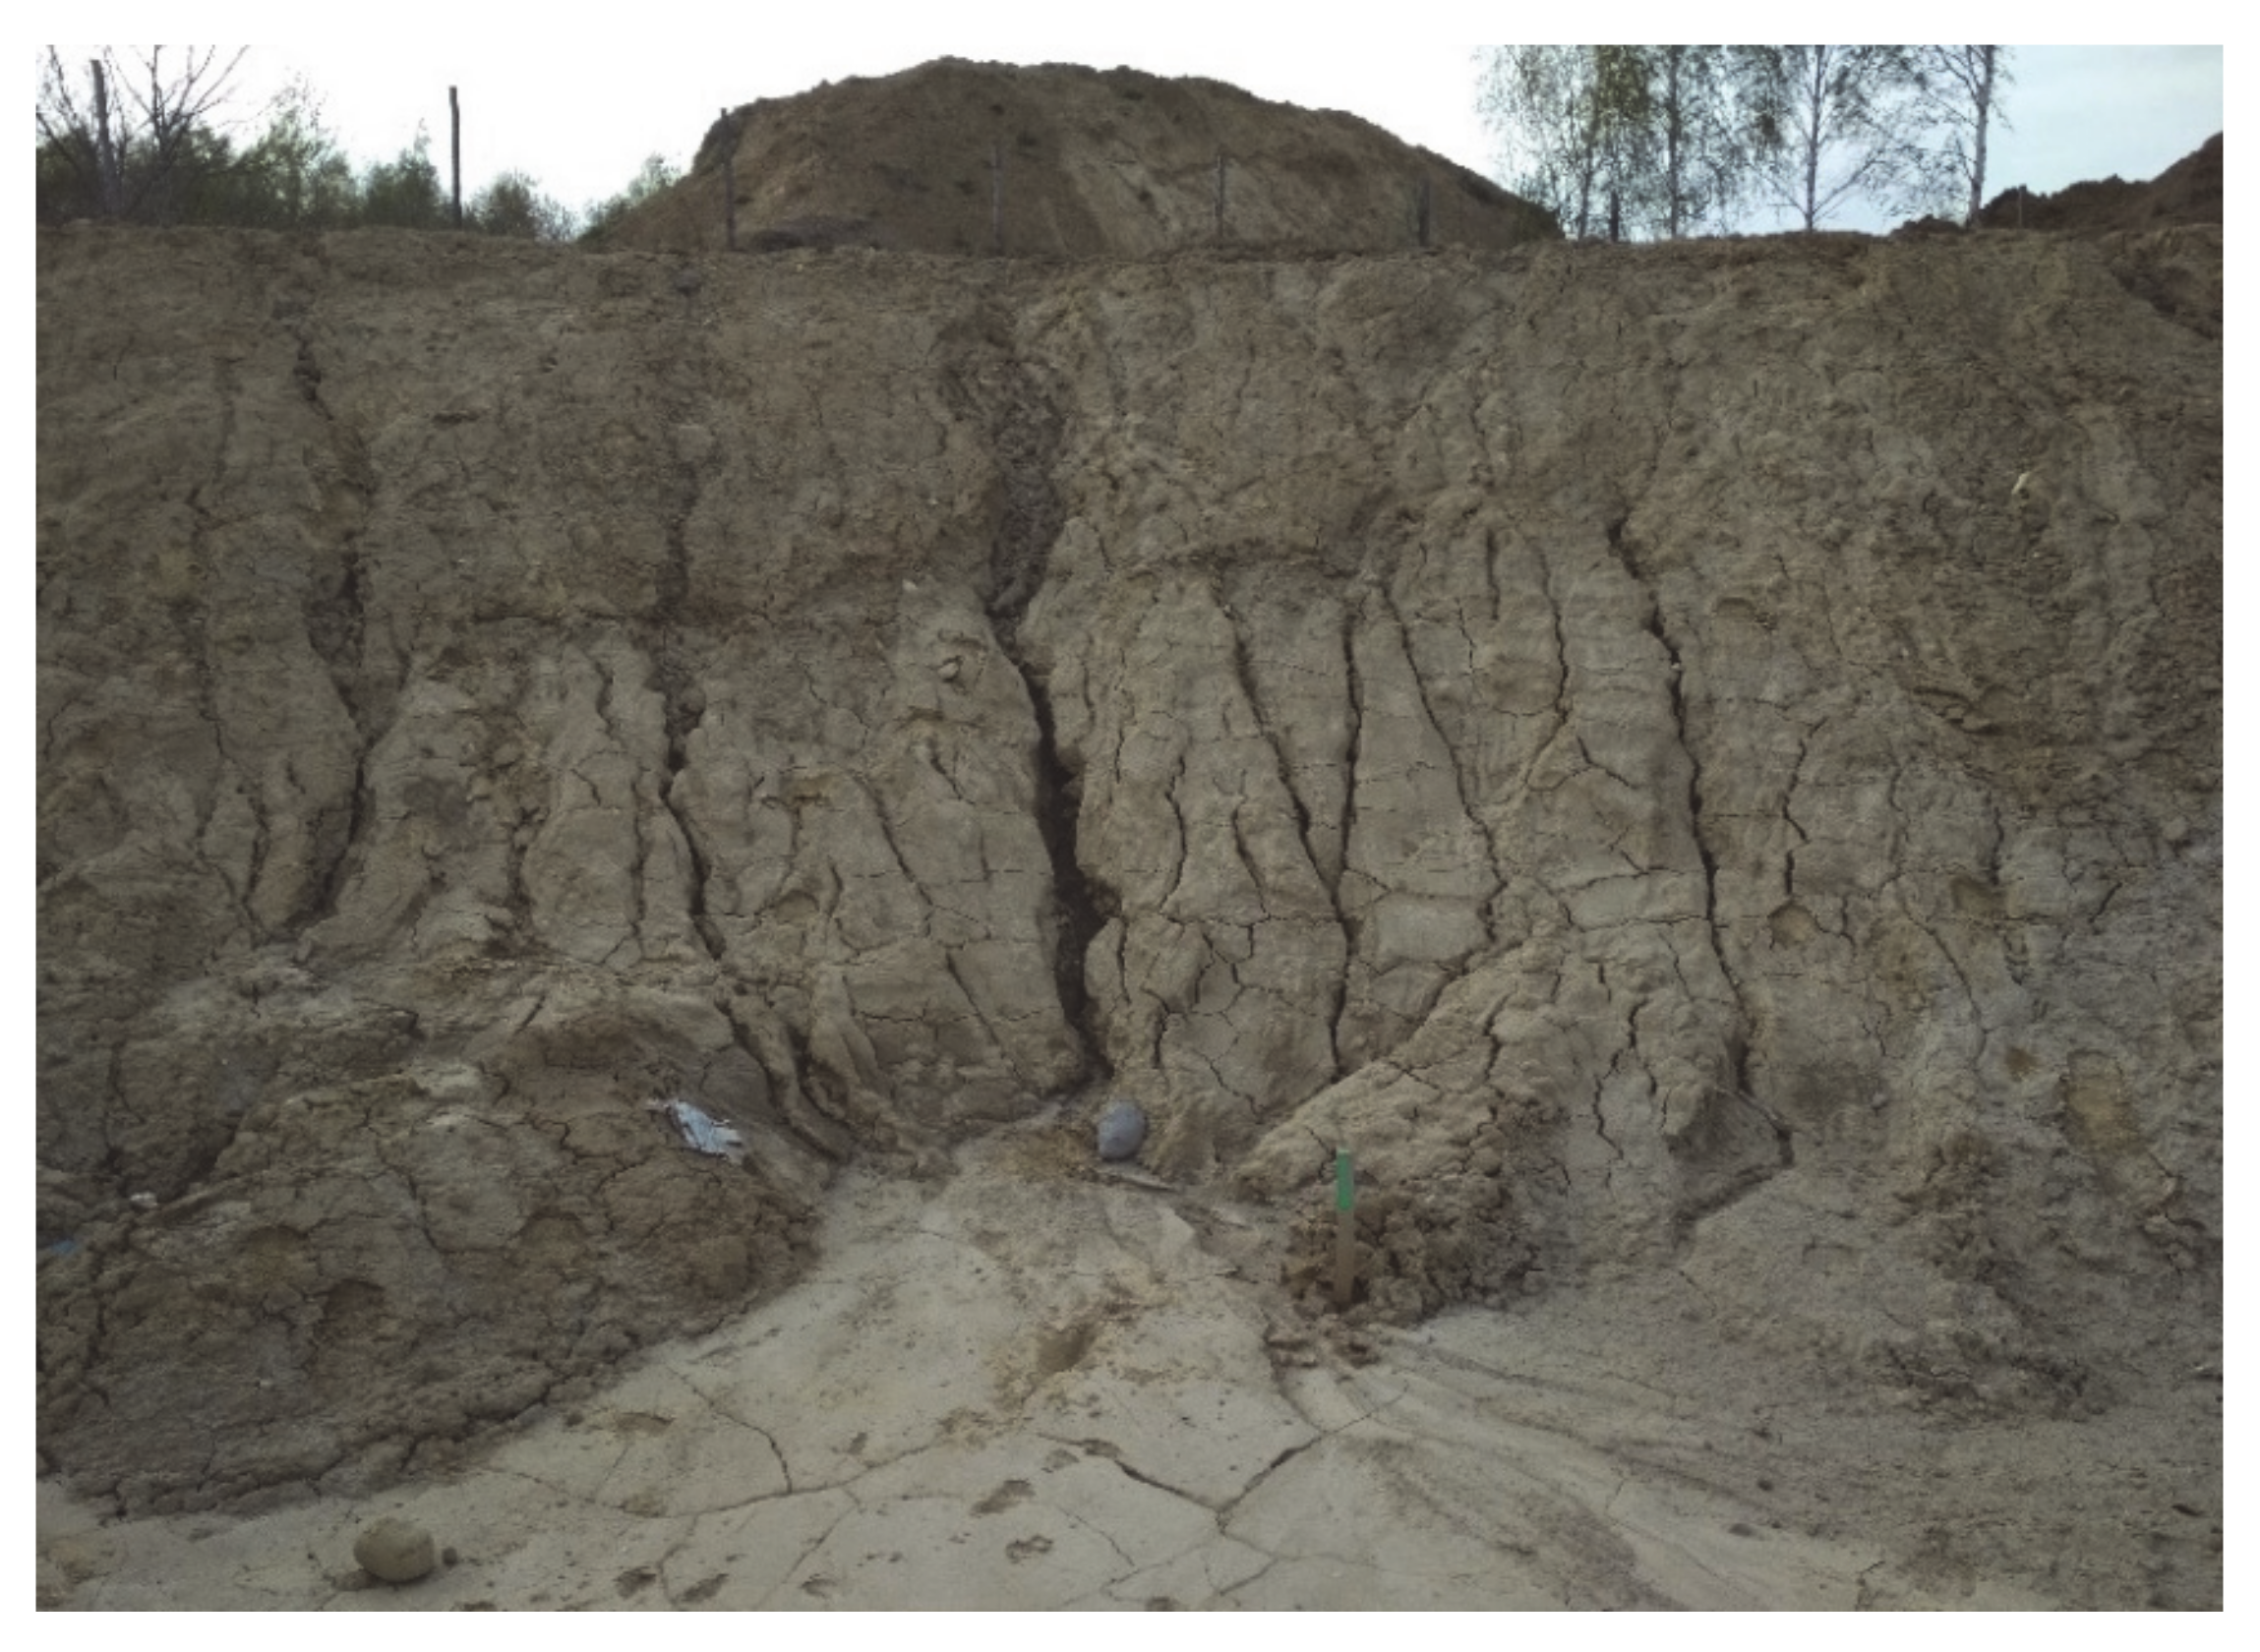
3.1. Characteristics of the Case Study Area
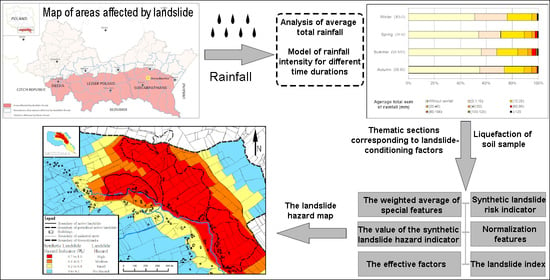
The case study sought to develop a landslide hazard map for the area of the Gwozdzianka village. The village spans the commune of Niebylec, in the southern part of the Subcarpathian province. Gwozdzianka is geologically located in the Skole Nappe, the northern zone of the Outer Carpathians, called the Flysch Carpathians. The village is located 280–445 m above sea level and covers an area of 3.48 km2. In the area under consideration (Figure 5), there is one old landslide of 0.5 km2, reactivated in the central part of the area, under the main slope. The landslide developed at the bottom of the slope and covered residential and commercial buildings, as well as infrastructure and transmission lines (gas pipelines). The active zone was located in the middle part of the slope, whereas periodic activity was recorded in the western and eastern parts. The colluvial material is composed of silty clays (siCl), clays (Cl), and clayey gravels (clGr). Thin-walled sandstones and shales are present in the substrate. Within the landslide, a surface water reservoir was observed, with a stream just below. The inclination of the slope is equal to 16°, while the inclination of the colluvium surface is equal to 13°, both values being significant. Due to these factors, under conditions of increased rainfall and/or infiltration of water from melting ice, there is a very high probability for further landslide movements, which is confirmed by the Hellwig analysis and the developed landslide hazard map.
There were several reasons for the formation of the landslide in Gwozdzianka; the direct cause turned out to be torrential rainfall. The association of the formation or activation of landslides in the Carpathians with the height and intensity of precipitation is indisputable and has already been described many times [21]. It is repeatedly emphasized that the emergence of new or the renewal of older landslides takes place when precipitation, usually in a short time (1–3 days), exceeds the threshold (critical) values. These values are usually presented as a certain percentage of the amount of annual precipitation in the analyzed period preceding the formation of a landslide or as the absolute value of precipitation in this period, expressed in millimeters. These critical precipitation values are characteristic for a given region, characterized by a specific ground state (with its lithology, weathering, morphology, and slope angle) [21,37,38]. With such a background, the landslide in Gwozdzianka does not significantly differ from those previously described when considering its parameters and local precipitation (Figure 6).
When analyzing hydrometeorological conditions for the development of several Carpathian landslides caused by heavy rains, some authors confirm that the number of landslides increases when the total precipitation over roughly 20–40 days preceding the formation of a landslide exceeds 200–250 mm. The Gwozdzianka landslide evolved when the total rainfall over 30 days preceding mass movements was equal to 238 mm [24]. The authors [21,37] claim that the amount of critical rainfall for the Carpathian region, approximately 100 mm, is usually reported within a few days before landslide activation. The landslide in Gwozdzianka was activated in 2010 after a rainfall of 123 mm over three days preceding landslide movements, with an average precipitation intensity of around 41 mm/day [24].
The amount of precipitation has a significant influence on mass movement dynamics. The fluctuation of groundwater is conditioned by the intensity of precipitation and significantly affects the nature and speed of movement of various landslide components. These are different in specific parts of the landslide, depending on the nature of water absorption by the colluvium. The degree of hydration and the volume of the colluvium as well as the degree of sealing of the substrate determine the distribution of surface and subsurface rainwater runoff [21], which leads to the differentiation of the movement dynamics of individual landslide parts.
According to the PANDa model recommended by the Polish Atlas of Rainfall Intensities [39] for the investigation area, dependable rainfall intensities I for time duration t = 4320 min calculated for selected probabilities p (along with the confidence interval) amount to I = 3.2276 dm3/s·ha for probability p = 20%, with confidence interval I = (2.9550–3.4975) dm3/s·ha, and I = 3.8435 dm3/s·ha for probability p = 10%, with confidence interval I = (3.4512–4.1969) dm3/s·ha (Figure 7).
In contrast, according to the Euler type II distribution, for the village of Gwozdzianka, model rainfall for a rainfall duration of 435 min amounts to 9.3 mm for probability p = 20% and 10.8 mm for probability p = 10% (Figure 8).
An enlargement of the form of the landslide in Gwozdzianka is particularly favored by lithological and geotechnical conditions related to the presence of silty clays and clayey gravels, which are especially susceptible to mass movements. The structure of the Skole tectonic unit is very diverse, and the quaternary weathering cover of considerable thickness is very sensitive to landslide processes. As a result of changing weather conditions, the strength parameters of the subsoil may deteriorate rapidly, e.g., during periods of heavy rainfall. Determining these parameters therefore requires consideration of changes in the natural water content in relation to extreme climatic conditions (periods of drought and floods). Figure 9 illustrates the influence of the moisture content on the strength parameters.
The anthropogenic element is also an important factor in the initiation of mass movements related to infrastructure and building development.
The predictability of a landslide movement depends on its informative content. The occurrence of a landslide movement event in a cadastral unit increases the reliability of mapping for a landslide hazard for future forecasting. These considerations, in the case of landslides characterized by a unique event, allow for qualitative evaluation of the reliability of the risk map. If the map was developed on the basis of cadastral units with high informative content, it would be characterized by high reliability. If, on the other hand, the map was developed on the basis of cadastral units with low informative content, it would have low reliability. Finally, it is worth noting that increased the reliability of the map might be derived not only from landslide displacement observations but also from periods of intense rains without any landslide observations.

3.2. Methodology

Identification of landslide factors and hazards in the village of Gwozdzianka was made using the data normalization method according to Hellwig [13].
Regardless of the adopted approach, the selection of the mapping unit is an important prerequisite for landslide hazard modeling [40,41,42]. In searching the database, a common mapping unit, the cadastral unit, was identified and adopted.
First, a database related to the susceptibility and hazard of landslides for each cadastral unit of the analyzed area was created. The hazard analysis included seven thematic sections: physiographic, tectonic, hydrological and hydrogeological, lithological, morphometrical, geotechnical, and land cover. Subsequently, special features were defined for each thematic section. Overall, 29 different special features for landslide hazard analysis and mapping were used as input factors. A physiographic and tectonic database containing the slope angle information and dislocations was developed using the Digital Elevation Model (DEM) and the SOPO landslide cards [35,36]. Lithology and morphometrical data were taken from the geological database and the SOPO map inventory. The main type of soil in the region is clay formed in solifluction layers. Clays, which are superimposed on marl debris, were also identified as landslide indicators. Slopes with angles from 11° to 26° are composed of clay as well as silty colluvial material. These findings are in agreement with previous geomorphological studies in the same area. Geotechnical parameters were derived from Ground Investigation Reports (GIRs), Geotechnical Design Reports (GDRs), the laboratory of the Rzeszow University of Technology, and in situ tests.
The weights for assessing the value of features between sections for synthetic measures of hazards were arbitrarily adopted based on the analysis of the data collected locally for the Polish Flysch Carpathians and numerical simulations performed in FEM Plaxis software, here used for landslide modeling. Regarding the influence of possible factors on clay movement in this specific case study, the effects of rainfall infiltration and surface water runoff are considered important [43,44,45]; therefore, the hydrological and hydrogeological section and lithological section are determined to be two crucial factors. The weight value for these sections is defined as 0.2. Intense rainfall is a major triggering factor of slope failures in this area. Water infiltration into the soil in this area has a significant impact on pore water pressure buildup, which affects surficial slope stability. In addition, on the basis of references, it can be concluded that geological structures and soil properties can also be important factors affecting the landslide mechanism. Hence, the weight values for the tectonic, morphometrical, and geotechnical sections were taken as 0.18, 0.2, and 0.2, respectively. Physiographic and land cover factors are widely known as main susceptibility parameters [46,47,48,49]. The analyzed area is slightly hilly and poorly developed, which is why the physiographic and land cover sections have the same lowest value of 0.01. Weights were defined subjectively, and a very small land area was analyzed. For a different landslide area, larger values would be defined.

4. Results

On the basis of expert and engineering knowledge, weights were adopted for each thematic section and special features in each thematic section (Table 1). For each section and its special features, the principle adopted was that the sum of weights w i = 1 .
Among the effective factors in the tectonic, hydrological and hydrogeological, lithological, morphometrical, and geotechnical thematic sections, weights equal to 0.18, 0.2, 0.2, 0.2, and 0.2, respectively, were identified as crucial factors in the development of landslides in the area of research, which together sum up to a total weight of 0.98 (i.e., 98%). The role of other factors decreases according to their weight in a landslide hazard. The significance and values of accepted weights for thematic sections and their special features were verified using the analytical hierarchy process (AHP) developed by Saaty [50]. The AHP is a well-known multi-attribute weighting method for supporting decision making, widely used also in the field of civil engineering [51,52,53,54]. Pairwise comparisons are used in this decision-making process to form a reciprocal matrix by transforming qualitative data to crisp ratios. One of the strengths of the AHP is that it allows for inconsistent relationships, while providing a consistency ratio (CR) as an indicator of the degree of consistency or inconsistency. The final score (synthetic landslide hazard indicator) is calculated by overlaying the layers (Figure 10) in a GIS environment and using relative weights. The integration of the various causative factors and classes in a synthetic landslide hazard indicator ( W k ) is obtained by a procedure based on the weighted linear sum using the simple additive weighting method.
Table 2 and Table 3 show the comparison matrix between set factors and the standardized matrix used to derive the weighted percentage value. In the AHP, the consistency used to build a matrix is checked by a consistency index, which depends on the number of parameters. The weights (Czn) obtained by the AHP for the seven analyzed thematic sections, listed in the same order as in Table 1, were equal to 0.04, 0.18, 0.17, 0.17, 0.19, 0.22, and 0.02, respectively, while the consistency index (IC) was equal to = –0.28.
To build a landslide hazard map, after defining the weights for the individual sections and the features contained in those sections, a synthetic landslide risk indicator was computed by Equations (1)–(3) [13,55].
The weighted average of j-special features in the k-thematic section was calculated using the following Equation (1):
s k j =   1 w k j c k j w k j                   j   =   1 ,   2 ,   3 ,   4 ,   ,   n
where ckj is the value of j-special features in the k-thematic section and wki is the corresponding j-weight for j-special features in the k-thematic section.
Normalization features to facilitate a comparison of values between the k-thematic sections were performed according to Equation (2):
c z n k = ( s k j / s m a x ) k
where k is the number of the thematic section k = 1–7.
The value of the synthetic landslide hazard indicator ( W k ) was calculated according to the following Equation (3):
W k =   k = 1 7 c z n k w k
where wk is the corresponding k-weight in the k-thematic section.
The landslide index was classified into four groups: high, medium, low, and no hazard. The result map is shown in Figure 11.

5. Discussion

The methodology seems to have widespread applicability beyond this local research area, with the limitation that knowledge of the past landslide data input into the model affects the value of the final risk.
According to the final landslide hazard maps for the village of Gwozdzianka (Figure 11), approximately 74% (2.41 km2) of the cadastral unit area is located in hazard zones (from high to small) and about 26% (1.07 km2) of the area is situated in the no-hazard zone. Nearly 50% of the area at risk is located in the high- and medium-hazard zone, while some roads, residential buildings, and forests are close to the high-hazard area.
The adopted calculation model was verified on the basis of multiple calculations, with different weight values taken into account. The correctness of the indicator values obtained and the hazard map developed were verified in comparison with the landslide area map created as part of the SOPO program (Figure 5) and the mapping elaborated according with the weight-of-evidence method [14,56] (Figure 12).
As a result, on the basis of the proposed methodology, one may obtain large-scale maps of a landslide hazard (1:2000, 1:5000). Based on these maps, the hazard degree and landslide consequences for life and property losses might be more precisely determined. As a result, appropriate procedures might be developed in order to avoid or minimize financial losses. Bearing in mind the hydrological and hydrogeological parameters, the developed hazard map may be used in the areas managed during crisis situations and may support the decision-making process. This is due to the fact that the landslide threat frequently goes hand in hand with local flooding. The methodology developed here has both advantages and disadvantages. One advantage is the possibility of considering temporal and spatial factors, as well as qualitative and quantitative data. Another advantage is the relatively simple calculation procedure, including data from various sources: administrative, historical, scientific, and other.
The proposed methodology may be indicated for the development of hazard maps on a local scale (village, commune), when it requires a large amount of data for individual cadastral units. The development of a small-size hazard map may be helpful in determining the threat to specific parcels of land. The main disadvantage is that the value of the developed hazard map depends on the quality of the input data. Another disadvantage is the lack of a standard and universal weight value assessment that might be used for small areas in different regions. Hazard maps elaborated according to this methodology may support municipal administrative decisions in the field of construction investments. They can also affect investment decisions of landowners and the amount of property insurance. The presented hazard assessment methodology can be implemented in areas of other municipalities, especially those located within the European belt of the Flysch Carpathians. This tectonic unit occupies a large part of the Czech, Slovakian, Ukrainian, and Romanian Carpathians. It is affected by similar landslide problems as the Polish Carpathians, with regard to origin and formation mechanisms.

6. Conclusions

Landslides and floods are natural hazards that cause losses both in the natural environment and in infrastructure and construction. Communes in southeastern Poland are affected with both flood risk and landslide risk. These two hazards often coexist, as long-term precipitation causes flooding of buildings located near watercourses, and at the same time also start landslide processes on slopes above river valleys. Knowledge of hydrogeological conditions and monitoring of geotechnical and hydrological parameters of a given terrain are the basis for forecasting the occurrence of these hazards and developing a landslide risk map. This paper underscores the issue of monitoring these two hazards simultaneously. Hydrogeological recognition of the area, confirmed by appropriate tests of geotechnical parameters, should be the basis for correctly assessing landslide hazards and effectively stabilizing active landslides.
In the analyzed case of mass movements, the geological structure of the ground that is especially susceptible to precipitation (silty clays and clays susceptible to soaking and moisture) and the anthropogenic transformations of the slope play an important role in the initiation and character of the growth of Gwozdzianka landslides, as confirmed by the developed landslide hazard map.
Implementing development projects on a landslide, in the vicinity of a landslide area, or in a flood risk area is possible if they are combined with technical activities that enable both the identification of hazards and the estimation of hazard risk. After recognizing and assessing the risk, an economic calculation of the project will indicate whether it is economically justified to invest in such areas. On the other hand, due to the cost of necessary safeguards, it may be more beneficial to withdraw from a project in such a risky area. This problem concerns not only private projects but also public ones. It also involves the design and construction of linear infrastructure facilities used for roads and railways, which should be carried out taking into account the risk assessment. Furthermore, it is important to ensure the safety of people and existing building infrastructure. Increasing the level of security each time increases the economic costs of projects, especially in relation to the societies of developing countries. However, in the near future, such investments may provide better development conditions and prevent the potential migration of people from these endangered areas.
Possible further works on the discussed methodology will involve a consistent extension of the input data set and seasonal analyses of the strength parameters in reference to precipitation amount observations. The works will also focus on the methodology of estimating temporal probability and dynamic factors such as rain input and water infiltration. The obtained database will allow for more accuracy in landslide hazard mapping, which, in turn, will make it possible to develop matrixes and hazard maps.

Author Contributions

Conceptualization, I.S., W.K., and J.K.; methodology, I.S. and W.K.; software, I.S.; validation, I.S, W.K., and J.K.; formal analysis, I.S., W.K., Y.T., and J.K.; investigation, I.S., W.K., and D.Z.; resources, I.S. and W.K.; data curation, I.S., W.K., and D.Z.; writing—original draft preparation, I.S., W.K., D.Z., and J.K.; writing—review and editing, I.S., W.K., and Y.T.; visualization, W.K., D.Z., and Y.T.; supervision, I.S. and Y.T.; and project administration, I.S. and W.K. All authors have read and agreed to the published version of the manuscript.

Funding

The research presented in this paper was partly funded by the Ministry of Science and Higher Education within the statutory research at the Rzeszow University of Technology (Grant nos. DS.BG.18.001 and UPB.BG.20.001).

Data Availability Statement

The data presented in this study can be available on request from the corresponding author.

Conflicts of Interest

The authors declare no conflict of interest.

References

  1. Van Westen, C.J.; Rengers, N.; Soeters, R. Use of Geomorphological information in indirect landslide susceptibility assessment. Nat. Hazards 2003, 30, 399–419. [Google Scholar] [CrossRef]
  2. Reichenbach, P.; Rossi, M.; Malamud, B.D.; Mihir, M.; Guzzetti, F. A review of statistically-based landslide susceptibility models. Earth Sci. Rev. 2018, 180, 60–91. [Google Scholar] [CrossRef]
  3. Aleotti, P.; Chowdhury, R. Landslide hazard assessment: Summary review and new perspectives. Bull. Eng. Geol. Environ. 1999, 58, 21–44. [Google Scholar] [CrossRef]
  4. Zhao, X.; Chen, W. Optimization of Computational Intelligence Models for Landslide Susceptibility Evaluation. Remote Sens. 2020, 12, 2180. [Google Scholar] [CrossRef]
  5. Dou, J.; Yunus, A.P.; Bui, D.T.; Merghadi, A.; Sahana, M.; Zhu, Z.; Chen, C.-W.; Khosravi, K.; Yang, Y.; Pham, B.T. Assessment of advanced random forest and decision tree algorithms for modeling rainfall-induced landslide susceptibility in the Izu-Oshima Volcanic Island, Japan. Sci. Total Environ. 2019, 662, 332–346. [Google Scholar] [CrossRef] [PubMed]
  6. Carrara, A.; Guzzetti, F.; Cardinali, M.; Reichenbach, P. Use of GIS technology in the prediction and monitoring of landslide hazard. Nat. Hazards 1999, 20, 117–135. [Google Scholar] [CrossRef]
  7. Chacón, J.; Irigaray, C.; Fernandez, T.; El Hamdouni, R. Engineering geology maps: Landslides and geographical information systems. Bull. Eng. Geol. Environ. 2006, 65, 341–411. [Google Scholar] [CrossRef]
  8. Fell, R.; Corominas, J.; Bonnard, C.; Cascini, L.; Leroi, E.; Savage, W.Z. Guidelines for landslide susceptibility, hazard and risk zoning for land use planning. Eng. Geol. 2008, 102, 85–98. [Google Scholar] [CrossRef] [Green Version]
  9. Galli, F.; Ardizzone, M.; Cardinali, F.; Guzzetti, P.; Reichenbach, F. Comparing landslide inventory maps. Geomorphology 2008, 94, 268–289. [Google Scholar] [CrossRef]
  10. Van Westen, C.J.; Castellanos, E.; Kuriakose, S.L. Spatial data for landslide susceptibility, hazard, and vulnerability assessment: An overview. Eng. Geol. 2008, 102, 112–131. [Google Scholar] [CrossRef]
  11. Shahri, A.A.; Spross, J.; Johansson, F.; Larsson, S. Landslide susceptibility hazard map in southwest Sweden using artificial neural network. Catena 2019, 183, 104225. [Google Scholar] [CrossRef]
  12. Kanungo, D.; Arora, M.; Sarkar, S.; Gupta, R. Landslide susceptibility zonation (LSZ) mapping—A review. J. South Asian Stud. 2009, 2, 81–105. [Google Scholar]
  13. Hellwig, Z. Application of the taxonomic method to the typological division of countries due to the level of their development and the resources and structure of qualified personnel. Stat. Rev. 1968, 4, 307–327. [Google Scholar]
  14. Van Westen, C.J.; Rengers, N.; Terlien, M.T.J.; Soeters, R. Prediction of the occurrence of slope instability phenomena through GIS-based hazard zonation. Geol. Rundsch. 1997, 86, 404–414. [Google Scholar] [CrossRef]
  15. Kaminski, M. Landslide susceptibility map in a regional scale—Example from of San valley in the Dynow foothills. Bull. PIG 2012, 452, 109–118. (In Polish) [Google Scholar]
  16. Wang, Y.; Cao, Z.; Li, D. Bayesian perspective in geotechnical variability and site characterization. Eng. Geol. 2016, 203, 117–125. [Google Scholar] [CrossRef]
  17. Van Westen, C.J.; Van Asch, T.W.J.; Soeters, R. Landslide hazard and risk zonation why is it still so difficult? Bull. Eng. Geol. Environ. 2006, 65, 167–184. [Google Scholar] [CrossRef]
  18. Haque, U.; Blum, P.; da Silva, P.F.; Andersen, P.; Pilz, J.; Chalov, S.R.; Malet, J.-P.; Auflic, M.J.; Andres, N.; Poyiadji, E.; et al. Fatal landslides in Europe. Landslides 2016, 13, 1545–1554. [Google Scholar] [CrossRef]
  19. Grabowski, D.; Raczkowski, R. Geohazards in Poland—Landslides. Available online: http://www.kgfiks.oig.ug.edu.pl/downloads/2012/jc/gp_pugp-materialy-1-geozagrozenia.pdf (accessed on 10 July 2020).
  20. Polish Geological Institute. System of Landslide Protection—SOPO. Available online: http://geoportal.pgi.gov.pl/portal/page/portal/SOPO (accessed on 10 July 2020).
  21. Starkel, L. Geomorphic hazards in the Polish Flysch Carpathians. Studia Geomorphol. Carpatho Balc. 2006, 40, 7–19. [Google Scholar]
  22. Segoni, S.; Rosi, A.; Lagomarsino, D.; Fanti, R.; Casagli, N. Brief communication: Using averaged soil moisture estimates to improve the performances of a regional-scale landslide early warning system. Nat. Hazards Earth Syst. Sci. 2018, 18, 807–812. [Google Scholar] [CrossRef] [Green Version]
  23. Zhang, L.L.; Zhang, L.; Zhang, L.M. Stability analysis of rainfall induced slope failure: A review. Geotech. Eng. 2011, 164, 299–316. [Google Scholar] [CrossRef] [Green Version]
  24. Climate Data. Available online: https://pl.climate-data.org/location/417671/ (accessed on 12 August 2020).
  25. Landslides. Available online: https://www.pgi.gov.pl/en/krakow/oddzial-karpacki/monit/krakow1/osuwiska-komunikaty/6325-uwaga-osuwiska.html (accessed on 6 September 2020).
  26. Zhang, L.; Li, J.; Li, X.; Zhang, J.; Zhu, H. Rainfall-Induced Soil Slope Failure, Florida; Taylor & Francis Group: Abingdon, UK, 2016. [Google Scholar]
  27. Rosi, A.; Peternel, T.; Jemec Auflič, M.; Komac, M.; Segoni, S.; Casagli, N. Rainfall thresholds for rainfall-induced landslides in Slovenia. Landslides 2016, 13, 1571–1577. [Google Scholar] [CrossRef]
  28. European Committee for Standardization. Eurocode—Basis of Structural Design; European Standard, EN 1990:2002; European Committee for Standardization: Brussels, Belgium, 2002. [Google Scholar]
  29. International Organization for Standardization. Standard, ISO 2394:2015—General Principles on Reliability for Structures; International Organization for Standardization: Geneva, Switzerland, 2015. [Google Scholar]
  30. Phoon, K.-K.; Retief, J.V. Reliability of Geotechnical Structures in ISO2394; CRC Press: Boca Raton, FL, USA, 2016. [Google Scholar]
  31. Thiel, K. (Ed.) Rock Mechanics in Hydroengineering. Developments in Geotechnical Engineering; Elsevier: New York, NY, USA, 1989; Volume 51. [Google Scholar]
  32. Kokoszka, W.; Skrzypczak, I.; Wilk, K. Analysis of geotechnical properties of miocene deposits of the Carpathian foredeep. Civ. Environ. Eng. Rep. 2018, 28, 62–70. [Google Scholar] [CrossRef] [Green Version]
  33. Kogut, J. Landslide formation modeling and surveying of the slope in unsaturated and saturated ground conditions. E3S Web Conf. 2019, 133, 01010. [Google Scholar] [CrossRef]
  34. Sulewska, M. Applying artificial neural networks for analysis of geotechnical problems. Comput. Assist. Mech. Eng. Sci. 2011, 18, 230–241. [Google Scholar]
  35. Landslide Documentation Card AB7. Available online: http://www.strzyzowski.pl/bip/atach/3/50/3817/Karta%20dokumentacyjna%2018-19-032-ab7.pdf (accessed on 12 July 2020).
  36. Landslide Documentation Card AB9. Available online: http://www.strzyzowski.pl/bip/atach/3/50/3819/Karta%20dokumentacyjna%2018-19-032-ab9.pdf (accessed on 12 July 2020).
  37. Zabuski, L.; Gil, E.; Bochenek, W. Interdependence between groundwater level and displacement of the landslide slope. Pol. Geol. Inst. Spec. Pap. 2004, 15, 39–41. [Google Scholar]
  38. Raczkowski, W.; Mrozek, T. Activating of landsliding in the Polish flysch Carpathians by the end of the 20th century. Studia Geomorphol. Carpatho Balc. 2002, 36, 91–111. [Google Scholar]
  39. PANDa Rainfall Model. Available online: https://retencja.pl/uslugi/modelowanie/model-opadowy-panda-polski-atlas-natezen-deszczow/ (accessed on 12 January 2021).
  40. Mokritskaya, T.P.; Samoylych, K.A. Attempt to Create a Cartographic Forecast Model of Subsidence Degradation for the Right Bank Area of the City Dnipro. Dnipropetr. Univ. Bull. Ser. Geol. Geogr. 2017, 25, 117–122. [Google Scholar]
  41. Skrzypczak, I.; Kokoszka, W.; Kogut, J.; Oleniacz, G. Methods of Measuring and Mapping of Landslide Areas. In IOP Conference Series: Earth and Environmental Science; IOP Publishing: Bristol, UK, 2017; p. 022013. [Google Scholar]
  42. Remondo, J.; Gonzalez, A.; Diaz de Teran, J.R.; Cendrero, A.; Fabbri, A.G.; Chung, C.J.F. Validation of landslide susceptibility maps: Examples and applications from a case study in Northern Spain. Nat. Hazards 2003, 30, 437–449. [Google Scholar] [CrossRef]
  43. Conte, E.; Donato, A.; Troncone, A. A simplified method for predicting rainfall-induced mobility of active landslides. Landslides 2017, 14, 35–45. [Google Scholar] [CrossRef]
  44. Brocca, L.; Ponziani, F.; Moramarco, T.; Melone, F.; Berni, N.; Wagner, W. Improving Landslide Forecasting Using ASCAT-Derived Soil Moisture Data: A Case Study of the Torgiovannetto Landslide in Central Italy. Remote Sens. 2012, 4, 1232–1244. [Google Scholar] [CrossRef] [Green Version]
  45. Caloiero, T.; Pasqua, A.A.; Petrucci, O. Damaging Hydrogeological Events: A Procedure for the Assessment of Severity Levels and an Application to Calabria (Southern Italy). Water 2014, 6, 3652–3670. [Google Scholar] [CrossRef] [Green Version]
  46. Chae, B.G.; Park, H.J.; Catani, F.; Simoni, A.; Berti, M. Landslide prediction, monitoring and early warning: A concise revive of state of arte. Geosci. J. 2017, 21, 1033–1070. [Google Scholar] [CrossRef]
  47. Lagomarsino, D.; Segoni, S.; Rosi, A.; Rossi, G.; Battistini, A.; Catani, F.; Casagli, N. Quantitative comparison between two different methodologies to define rainfall thresholds for landslide forecasting. Nat. Hazards Earth Syst. Sci. 2015, 15, 2413–2423. [Google Scholar] [CrossRef] [Green Version]
  48. Pellicani, R.; Van Westen, C.J.; Spilotro, G. Assessing landslide exposure in areas with limited landslide information. Landslides 2014, 11, 463–480. [Google Scholar] [CrossRef]
  49. Bardi, F.; Raspini, F.; Frodella, W.; Lombardi, L.; Nocentini, M.; Gigli, G.; Morelli, S.; Corsini, A.; Casagli, N. Monitoring the Rapid-Moving Reactivation of Earth Flows by Means of GB-InSAR: The April 2013 Capriglio Landslide (Northern Appennines, Italy). Remote Sens. 2017, 9, 165. [Google Scholar] [CrossRef] [Green Version]
  50. Saaty, L.T. Decision making with the analytic hierarchy process. Int. J. Serv. Sci. 2008, 1, 83–98. [Google Scholar] [CrossRef] [Green Version]
  51. Komac, M.A. Landslide susceptibility model using the Analytical Hierarchy Process method and multivariate statistics in perialpine Slovenia. Geomorphology 2006, 74, 17–28. [Google Scholar] [CrossRef]
  52. Leśniak, A.; Wieczorek, D.; Górka, M. Selection of the variant of the aluminium-glass facade implementation using the AHP method. In International Scientific Siberian Transport Forum; Springer: Cham, Switzerland, 2019; pp. 536–543. [Google Scholar]
  53. Sztubecka, M.; Skiba, M.; Mrówczyńska, M.; Bazan-Krzywoszańska, A. An Innovative Decision Support System to Improve the Energy Efficiency of Buildings in Urban Areas. Remote Sens. 2020, 12, 259. [Google Scholar] [CrossRef] [Green Version]
  54. Leśniak, A.; Kubek, D.; Plebankiewicz, E.; Zima, K.; Belniak, S. Fuzzy AHP application for supporting contractors’ bidding decision. Symmetry 2018, 10, 642. [Google Scholar] [CrossRef] [Green Version]
  55. Leń, P.; Oleniacz, G.; Skrzypczak, I.; Mika, M. Methodology for Assessing the Size and Liquidation of the Outer Patchwork of Land. In IOP Conference Series: Earth and Environmental Science; IOP Publishing: Bristol, UK, 2017; p. 032020. [Google Scholar]
  56. Bonham-Carter, G.F.; Agterberg, F.P.; Wright, D.F. Weights of Evidence Modeling: A New Approach to Mapping Mineral Potential. In Statistical Applications in the Earth Sciences; Agterberg, F.P., Bonham-Carter, G.F., Eds.; Canadian Government Publishing Centre: Ottawa, ON, Canada, 1989; pp. 171–183. [Google Scholar]
Figure 1. Map of areas affected by landslide threat in the Polish Carpathians (authors’ elaboration based on [25]).
Remotesensing 13 00317 g001
Figure 2. Example of a road landslide in the Polish Carpathian region.
Remotesensing 13 00317 g002
Figure 3. Rills and gullies caused by surficial runoff in silty soil as seen on-site.
Remotesensing 13 00317 g003
Figure 4. Liquefaction of a silty soil sample taken from the investigation site under the influence of moisture (sugar cube effect). (a) Dry soil sample, (b) soil sample after moistening, and (c) cross section of collapsed soil sample.
Remotesensing 13 00317 g004
Figure 5. Sketch of a landslide map according to [35,36].
Remotesensing 13 00317 g005
Figure 6. Average total rainfall for the Gwozdzianka village in the years 1987–2017 (authors’ elaboration based on [24]).
Remotesensing 13 00317 g006
Figure 7. PANDa model of rainfall intensity I for different time durations t for the village of Gwozdzianka.
Remotesensing 13 00317 g007
Figure 8. Euler type II model rainfall distribution for the village of Gwozdzianka.
Remotesensing 13 00317 g008
Figure 9. Internal friction angle (Φ) and cohesion (c) versus moisture content for tested silt samples collected from a depth of 0.5 to 5.5 m at the investigation site, presented on the background of other types of soils (own elaboration based on [31]).
Remotesensing 13 00317 g009
Figure 10. Thematic sections corresponding to landslide-conditioning factors: (a) surface height msl, (b) exposure, (c) river proximity, (d) slope ranges, (e) land cover, and (f) subsiding vulnerability.
Remotesensing 13 00317 g010
Figure 11. Fragment of the landslide hazard map for the village of Gwozdzianka.
Remotesensing 13 00317 g011
Figure 12. Landslide susceptibility map for the village of Gwozdzianka.
Remotesensing 13 00317 g012
Table 1. Adopted weights for thematic sections and special features in individual thematic sections.
kThematic Section (Czn)Weight (wk)jSpecial Feature in Thematic SectionWeight (w­j)
1Physiographic0.011
2
Slope angle > 15 (°)
Slope angle 9~15 (°)
0.4
0.6
2Tectonic0.181
2
Fault dislocations
Fold dislocations
0.6
0.4
3Hydrological
and hydrogeological
0.21
2
3
Maximum depth of groundwater (m)
Average total sum of rainfall > 100 (mm)
and rainfall intensity
Pore fissure water
0.3
0.5

0.2
4Lithological0.21
2
3
Shales and sandstones
Silty clays
Clays
0.25
0.5
0.25
5Morphometrical0.21aTotal surface (ha)0.01
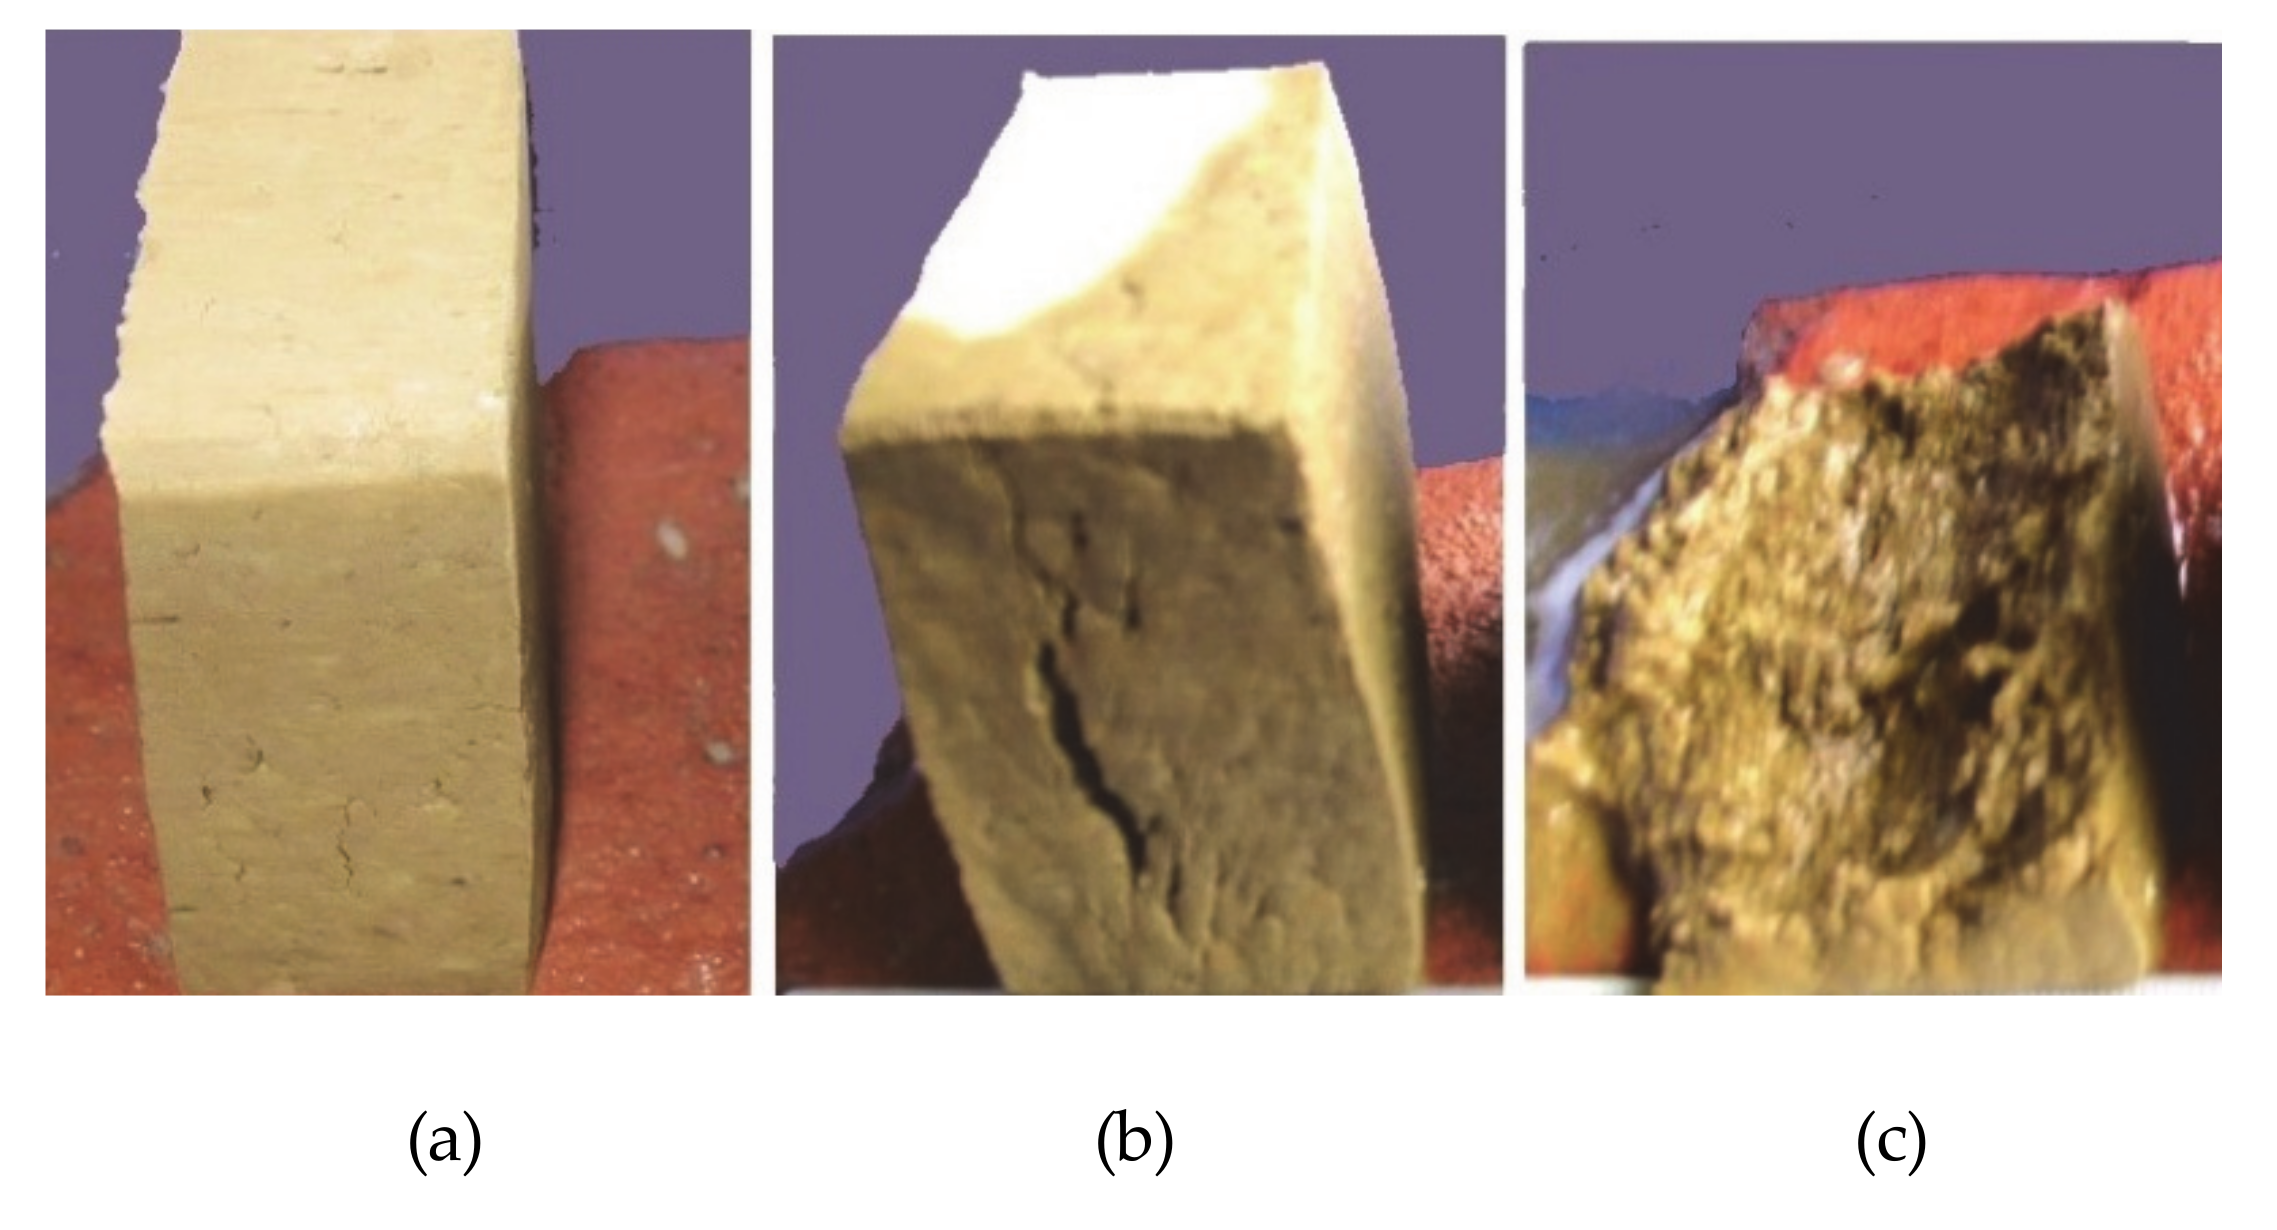
(a) General
(b) Main landslide scarp
(c) Toe and colluvium
2aSlope angle (°)0.25
3aLength (m)0.01
4aWidth (m)0.01
5aHeight max. (m asl)0.1
6aHeight min. (m asl)0.03
7aPart of another landslide (ha)0.01
1bScarp height (m)0.07
2bSlope angle (°)0.12
3bMinor scarps (pcs)0.01
4bInitial fissures (pcs)0.01
1cAverage thickness (m)0.3
2cSlip surface0.07
6Geotechnical0.21
2
3
Angle of internal friction (°)
Cohesion (kPa)
Moisture content (%)
0.3
0.3
0.4
7Land cover0.011
2
3
Intensive
Medium
Poor
0.4
0.4
0.2
Table 2. Pairwise comparison matrix of thematic sections.
PhysiographicTectonicHydrological and HydrogeologicalLithologicalMorphometricalGeotechnicalLand Cover
Physiographic1.00000.14291.00000.11111.00000.25001.0000
Tectonic7.00001.00009.00001.00004.00001.00000.1429
Hydrological and hydrogeological9.00000.11111.00000.25001.00007.00001.0000
Lithological6.00003.00004.00001.00000.14291.00003.0000
Morphometrical3.00000.11119.00007.00001.00000.33331.0000
Geotechnical4.00002.00004.00000.20003.00001.00009.0000
Land cover0.11110.14290.14290.14290.14290.11111.0000
Table 3. Calculating the weights of thematic sections by the AHP method.
PhysiographicTectonicHydrological and HydrogeologicalLithologicalMorphometricalGeotechnicalLand CoverWeight (wk)
Physiographic0.0330.0220.0360.0110.0970.0230.0620.04
Tectonic0.2320.1540.3200.1030.3890.0940.0090.19
Hydrological and hydrogeological0.2990.0170.0360.0260.0970.6550.0620.17
Lithological0.1990.4610.1420.1030.0140.0940.1860.17
Morphometrical0.1000.0170.3200.7210.0970.0310.0620.19
Geotechnical0.1330.3070.1420.0210.2920.0940.5580.22
Land cover0.0040.0220.0050.0150.0140.0100.0620.02
Publisher’s Note: MDPI stays neutral with regard to jurisdictional claims in published maps and institutional affiliations.

