Article

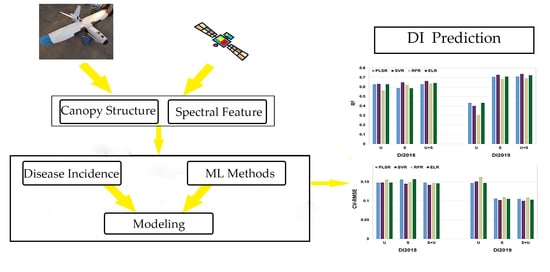
UAV Data as an Alternative to Field Sampling to Monitor Vineyards Using Machine Learning Based on UAV/Sentinel-2 Data Fusion

1
State Key Laboratory of Desert and Oasis Ecology, Xinjiang Institute of Ecology and Geography, Chinese Academy of Sciences, Urumqi 830011, China
2
University of Chinese Academy of Sciences, Beijing 100049, China
*
Author to whom correspondence should be addressed.
Submission received: 21 December 2020 / Revised: 24 January 2021 / Accepted: 25 January 2021 / Published: 28 January 2021
(This article belongs to the Special Issue Remote Sensing for Future Food Security and Sustainable Agriculture)

Abstract

:
Pests and diseases affect the yield and quality of grapes directly and engender noteworthy economic losses. Diagnosing “lesions” on vines as soon as possible and dynamically monitoring symptoms caused by pests and diseases at a larger scale are essential to pest control. This study has appraised the capabilities of high-resolution unmanned aerial vehicle (UAV) data as an alternative to manual field sampling to obtain sampling canopy sets and to supplement satellite-based monitoring using machine learning models including partial least squared regression (PLSR), support vector regression (SVR), random forest regression (RFR), and extreme learning regression (ELR) with a new activation function. UAV data were acquired from two flights in Turpan to determine disease severity (DS) and disease incidence (DI) and compared with field visual assessments. The UAV-derived canopy structure including canopy height (CH) and vegetation fraction cover (VFC), as well as satellite-based spectral features calculated from Sentinel-2A/B data were analyzed to evaluate the potential of UAV data to replace manual sampling data and predict DI. It was found that SVR slightly outperformed the other methods with a root mean square error (RMSE) of 1.89%. Moreover, the combination of canopy structure (CS) and vegetation index (VIs) improved prediction accuracy compared with single-type features (RMSEcs of 2.86% and RMSEVIs of 1.93%). This study tested the ability of UAV sampling to replace manual sampling on a large scale and introduced opportunities and challenges of fusing different features to monitor vineyards using machine learning. Within this framework, disease incidence can be estimated efficiently and accurately for larger area monitoring operation.

Graphical Abstract

1. Introduction

China, which has the second largest grape planting area of in the world, has seen steady growth in planted area. The largest wine-grape growing region of China is Xin-jiang province with 371,152 acres planted in 2018. Especially in Turpan city, given the high economic benefits of this commodity crop, and the enormous planted area and production, there is significant interest in developing a strategy to ensure grape quality and yield [1]. In the present study, the quality and yield of grapes were found to depend on their content of sugars, acids, and phenols, and the accumulation of these substances during grape development and maturation was influenced by the health of the grapes [2,3]. However, pests and diseases incidence seriously affected the health of the grapes [4]. Studies have shown that environmental (climatic and rainfall) conditions and vineyard management programs play a vital role in the occurrence of pests and diseases. In particular, increases in temperature and humidity with climate change have caused increasing occurrences of pests and diseases [5]. Pests and diseases are a major threat to grape yield and composition, because they often dramatically affect the spongy tissues of leaves, change the ratio between different kinds of pigments, and damage photosynthetic pigments of microalgae [6,7], thus affecting photosynthesis during the growth stage. The use of pesticides is still a mainly pests and diseases control [8]. However, food security and sustainability are of major importance to agriculture production [9]. In recent years, many studies have shown that scientific pest management programs are important because overuse of pesticides can be harmful to human health and the environment [8,10]. Therefore, an in-depth understanding of the incidence and distribution of pests and diseases in vineyards for the purpose of pest control has become difficult for local governments and growers to achieve. It is necessary to evaluate infection indicators as important evidence to predict the development of pests and diseases, so as to develop scientific and organic protection plans [9]. Monitoring vineyards affected by pests is an initial and crucial step during pest control, because it can provide reference information and valuable parameters for government and growers to generate a strategy for pesticide purchases [1].
To provide important information on vineyard status at different scales all year round for different managers, remote sensing is an outstanding choice [11]. Traditional and classical crop monitoring provides two main methods to monitor the status of crops and changes caused by various factors such as plant stress, pests, and diseases. One is measuring leaves and shoots under field conditions based on the polarization characteristics of reflected radiation and using a hand-held spectrometer and fluorometer to estimate plant stress [12]. In addition to leaf-scale measurements, the vegetation index, leaf water indices, and chlorophyll fluorescence can be measured for the entire canopy and crops [12,13]. Both traditional methods have the common weakness that they do not lend themselves to large-scale monitoring operation [14]. Recent advances in remote sensing techniques provide an additional tool to monitor plants at the canopy scale, which has facilitated the discrimination of crops affected by pest infestation [15,16]. Among remote sensing platforms, satellites and unmanned aerial vehicle (UAV) platforms are the most widely used to carry sensors in present-day research. Although satellite optical data are widely used, their limitations due to spatial resolution and atmospheric effects cannot be ignored [17]. When separating the contributions of different land-surface components such as canopy and soil, the accuracy of satellite data cannot meet application requirements due to mixed pixels [18,19]. In addition, one crucial step of monitoring by Sentinel-2 imagery is collecting validation and reference data. These data for remote sensing applications are traditionally acquired through manual field surveys, which are associated with some limitations and risks [20]. Moreover, the lack of three-dimensional canopy information impedes the accuracy of crop monitoring applications in precision agriculture [21].
In remote sensing monitoring applications, considering the weaknesses of satellite platforms and the fact that UAV platforms to support high-resolution data can be easily obtained, more and more small commercial UAVs with various types of sensors are being used to provide measurements. Over the past decade, a growing number of researchers have used multi-sensor data to monitor crops [14]. In previous studies, many researchers have proposed various methods of combining canopy 3D structures extracted from UAV data and spectral information from Sentinel-2 data to estimate bio-physical crops’ parameters such as Chlorophyll (Chl) a content, Chl b content, and leaf nitrogen concentration (N) [1,22]. Researchers have used fusion of data from low-cost RGB, multispectral, and thermal data to estimate biophysical and biochemical [14,23], such as nitrogen concentration and Chl a content [14]. For large-scale monitoring, UAV and Sentinel-2 data have been used to estimate the initial biomass of green algae in the sea [24], as well as the combination of UAV and Sentinel-2A data has been used to evaluate plant physiological status under water stress in vineyards [25]. Several researchers have used low-cost sensors integrated onto a UAV and satellite imaging for stress detection [15]. Previous studies have shown the combination of UAV-extracted information with the Sentinel-2-based vegetation index is effective for crop monitoring and disaster assessment [25,26,27].
However, as demand for precision agriculture increases from growers and governments, providing physiological monitoring results is not enough. It is necessary to provide visual results when monitoring crops to help growers and government workers visualize crop conditions. Unfortunately, it is difficult to provide intuitive quantitative data on disease incidence for growers, because quantitative research studies on disease incidence are still lacking, especially in pergola crops such as vineyards. In addition, field sampling is a common method of assessing vine disease in each row of existing pest incidence studies, which is a difficult process due to several limitations: (1) this is difficult, expensive, and time-consuming work [28]; (2) the reliability of ground-based positioning data may be affected by the impact and density of canopy cover [29,30]; (3) field assessment is restricted by topography [31,32]; (4) considering that the vine canopies vigor is well related to vines diseases status, field assessment can not observe the whole vine canopies from a bird’s eye view [18]. In order to overcome these limitations, UAV data are used as an alternative source for reference data for field assessment. In addition, the fusion of high-resolution UAV-derived information and Sentinel-2 based vegetation index is used for monitoring vineyards and quantifying disease incidence and severity.
The fusion of satellite data with UAV data provides a wealth of information as explanatory variables to improve estimation performance of grapevine quality. Nevertheless, the health status of the grapevine is determined by the interaction of many factors, and the relationship between them is not always linear, so it cannot be predicted by linear statistical methods [33]. To overcome the nonlinearity inherent in a large number of variables, machine learning is usually used for estimation. Over the past decade, the growing number of studies focused on modern agricultural applications based on remote sensing using different machine learning (ML) methods have shown the capability of ML methods for classification and regression analysis. Approaches such as partial least squares regression (PLSR) [34], random forest regression (RFR) [35], support vector regression (SVR) [36], and the extreme learning machine (ELM) and its variants [37] have been used for a series of remote sensing-based agricultural analyses. PLSR overperformed in yield prediction of drought-stressed spring crops [38]. Especially, ELM and extended ELM algorithms with the sigmoid activation function replaced by various new activation functions were applied to berry yield and quality prediction [33]. These previous studies demonstrated that ML methods have achieved accurate yield predictions by overcoming the drawbacks of remote sensing datasets such as nonlinearity and spatial autocorrelation [39].
This study has investigated the ability to combine Sentinel-2 data and UAV-derived canopy structure data for monitoring the pests caused by Lycorma delicatula, using UAV data as an alternative to field data. This study assessed the following: (i) the feasibility and ability of replacing field samples by UAV data to monitor pest incidence and severity; (ii) the capability of VIs calculated from Sentinel-2 data to accurately evaluate disease severity (DS) and disease incidence (DI) levels in pest-infected vineyards in Turpan; (iii) the potential for combining features regarding canopy spectral and structure from UAV data and temporal Sentinel-2 data to monitor and predict DI in vineyards using ML methods.

2. Materials

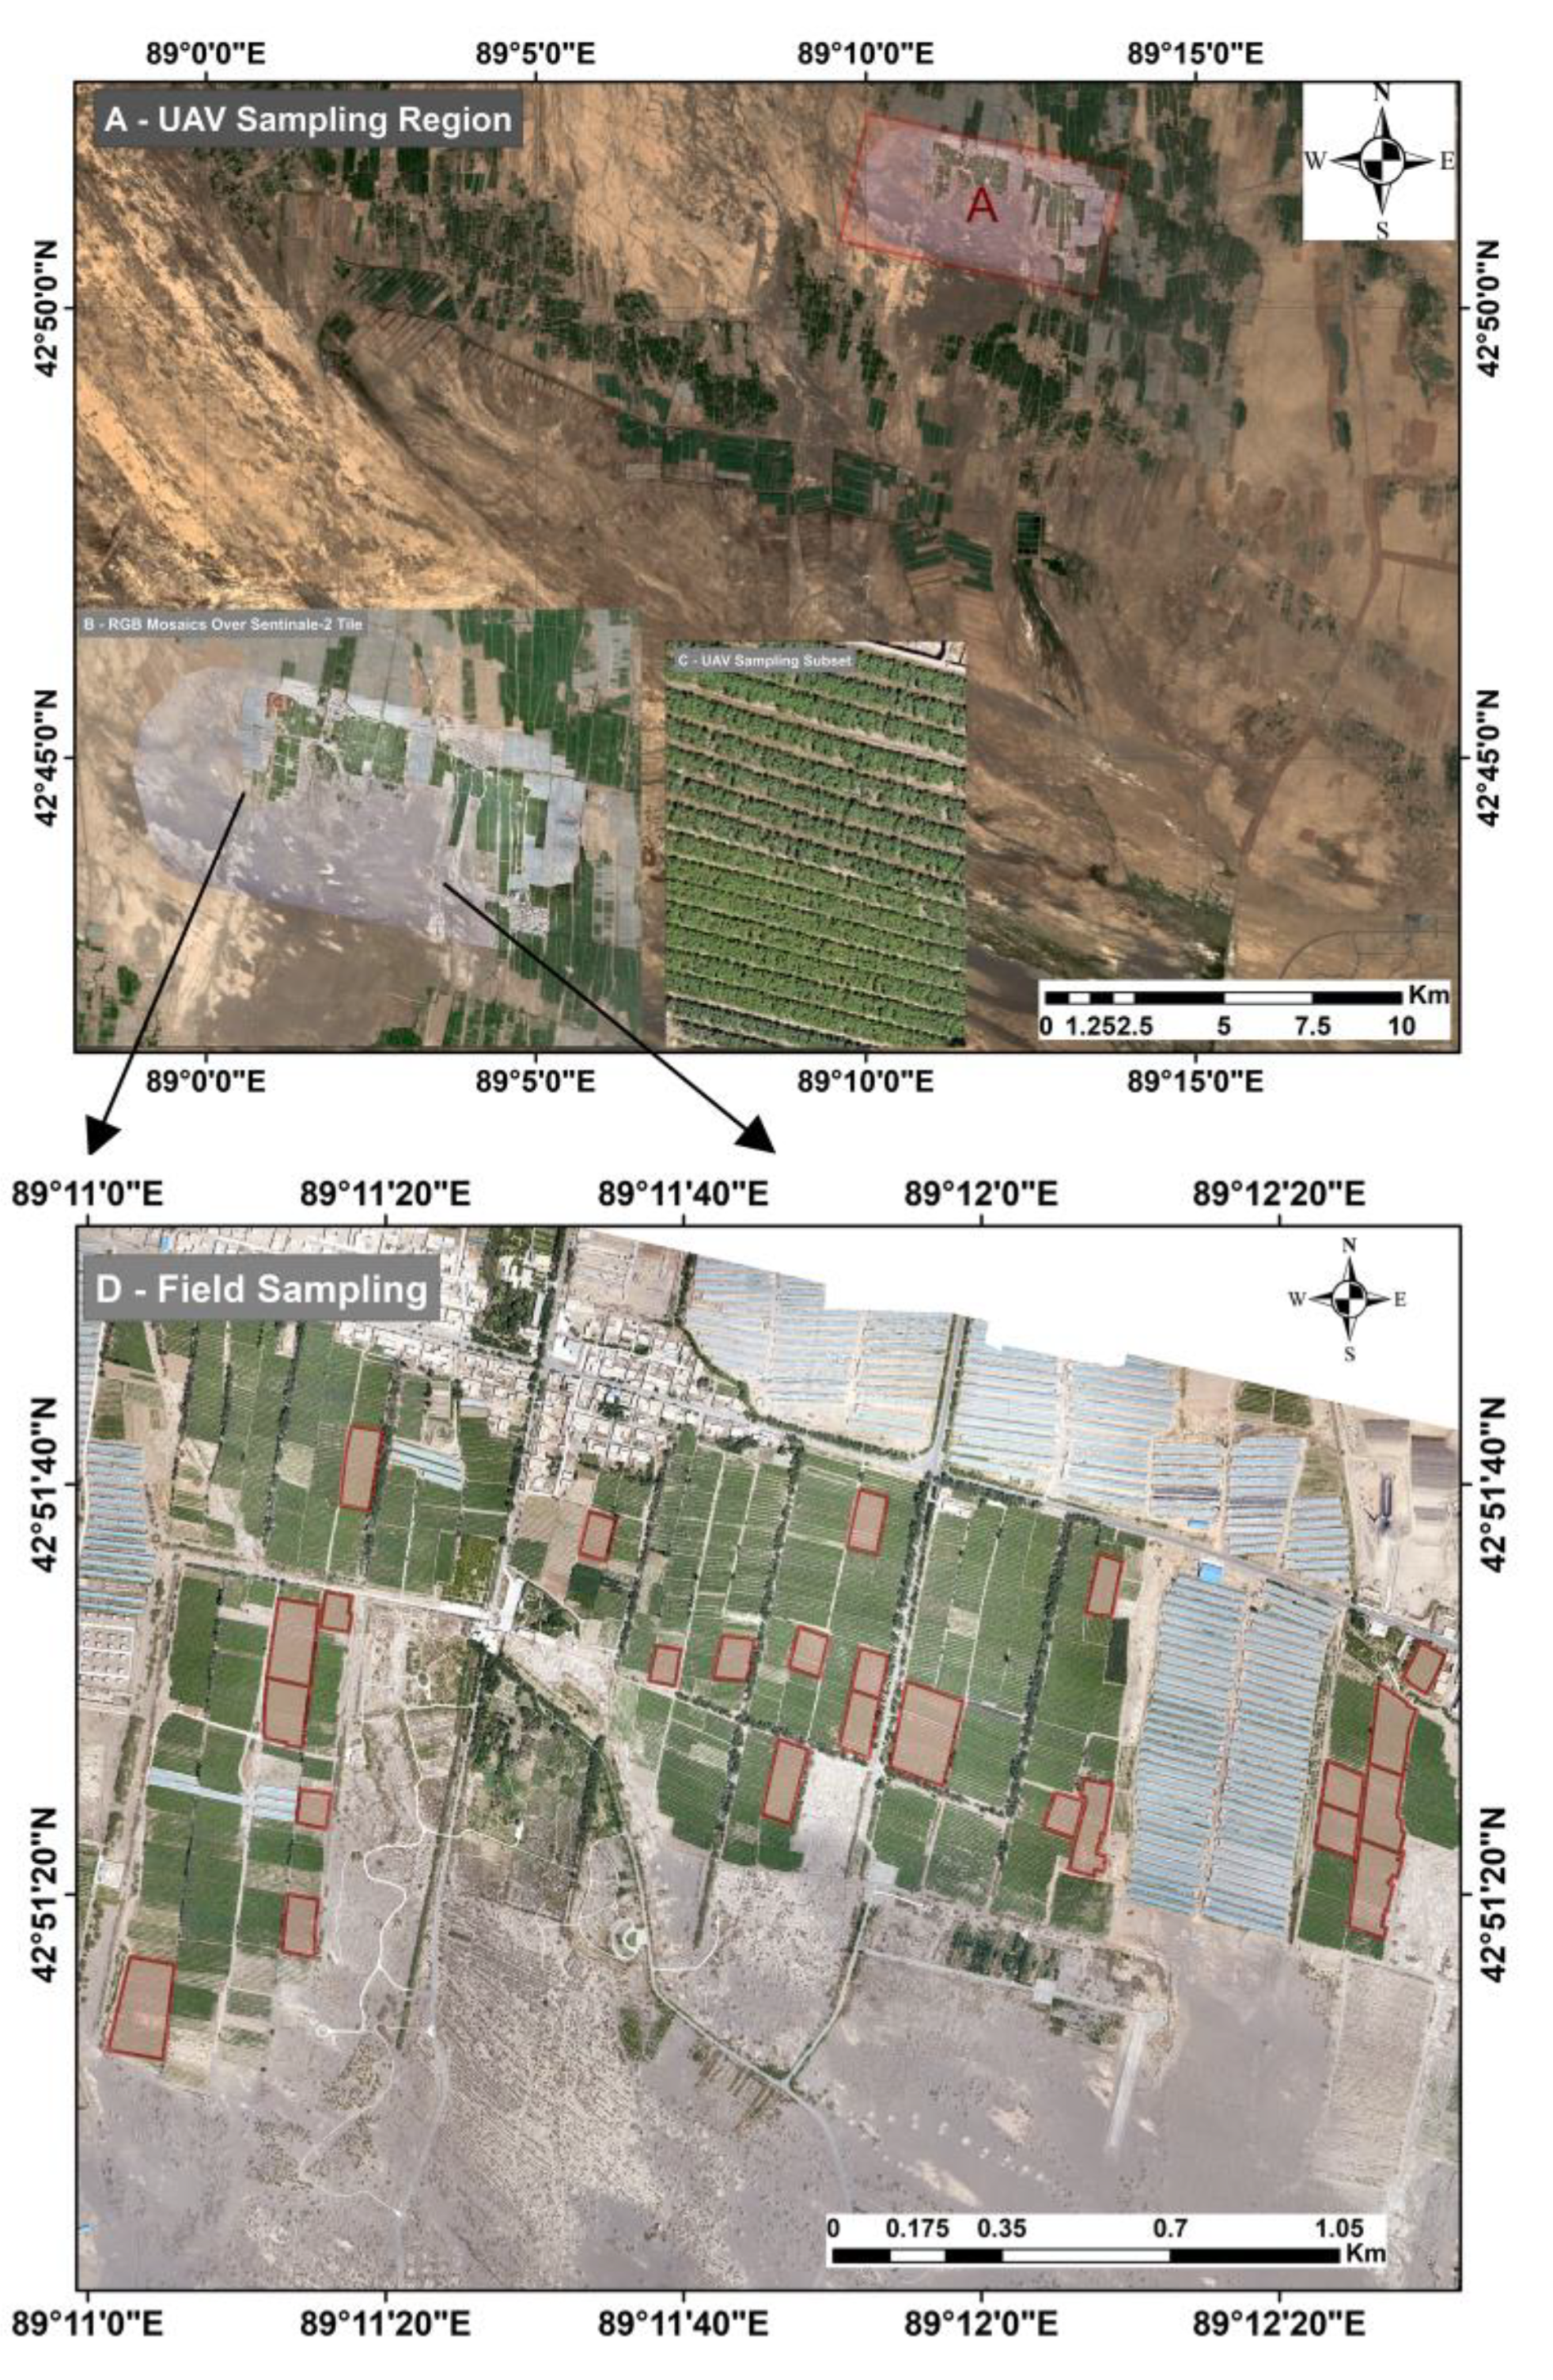
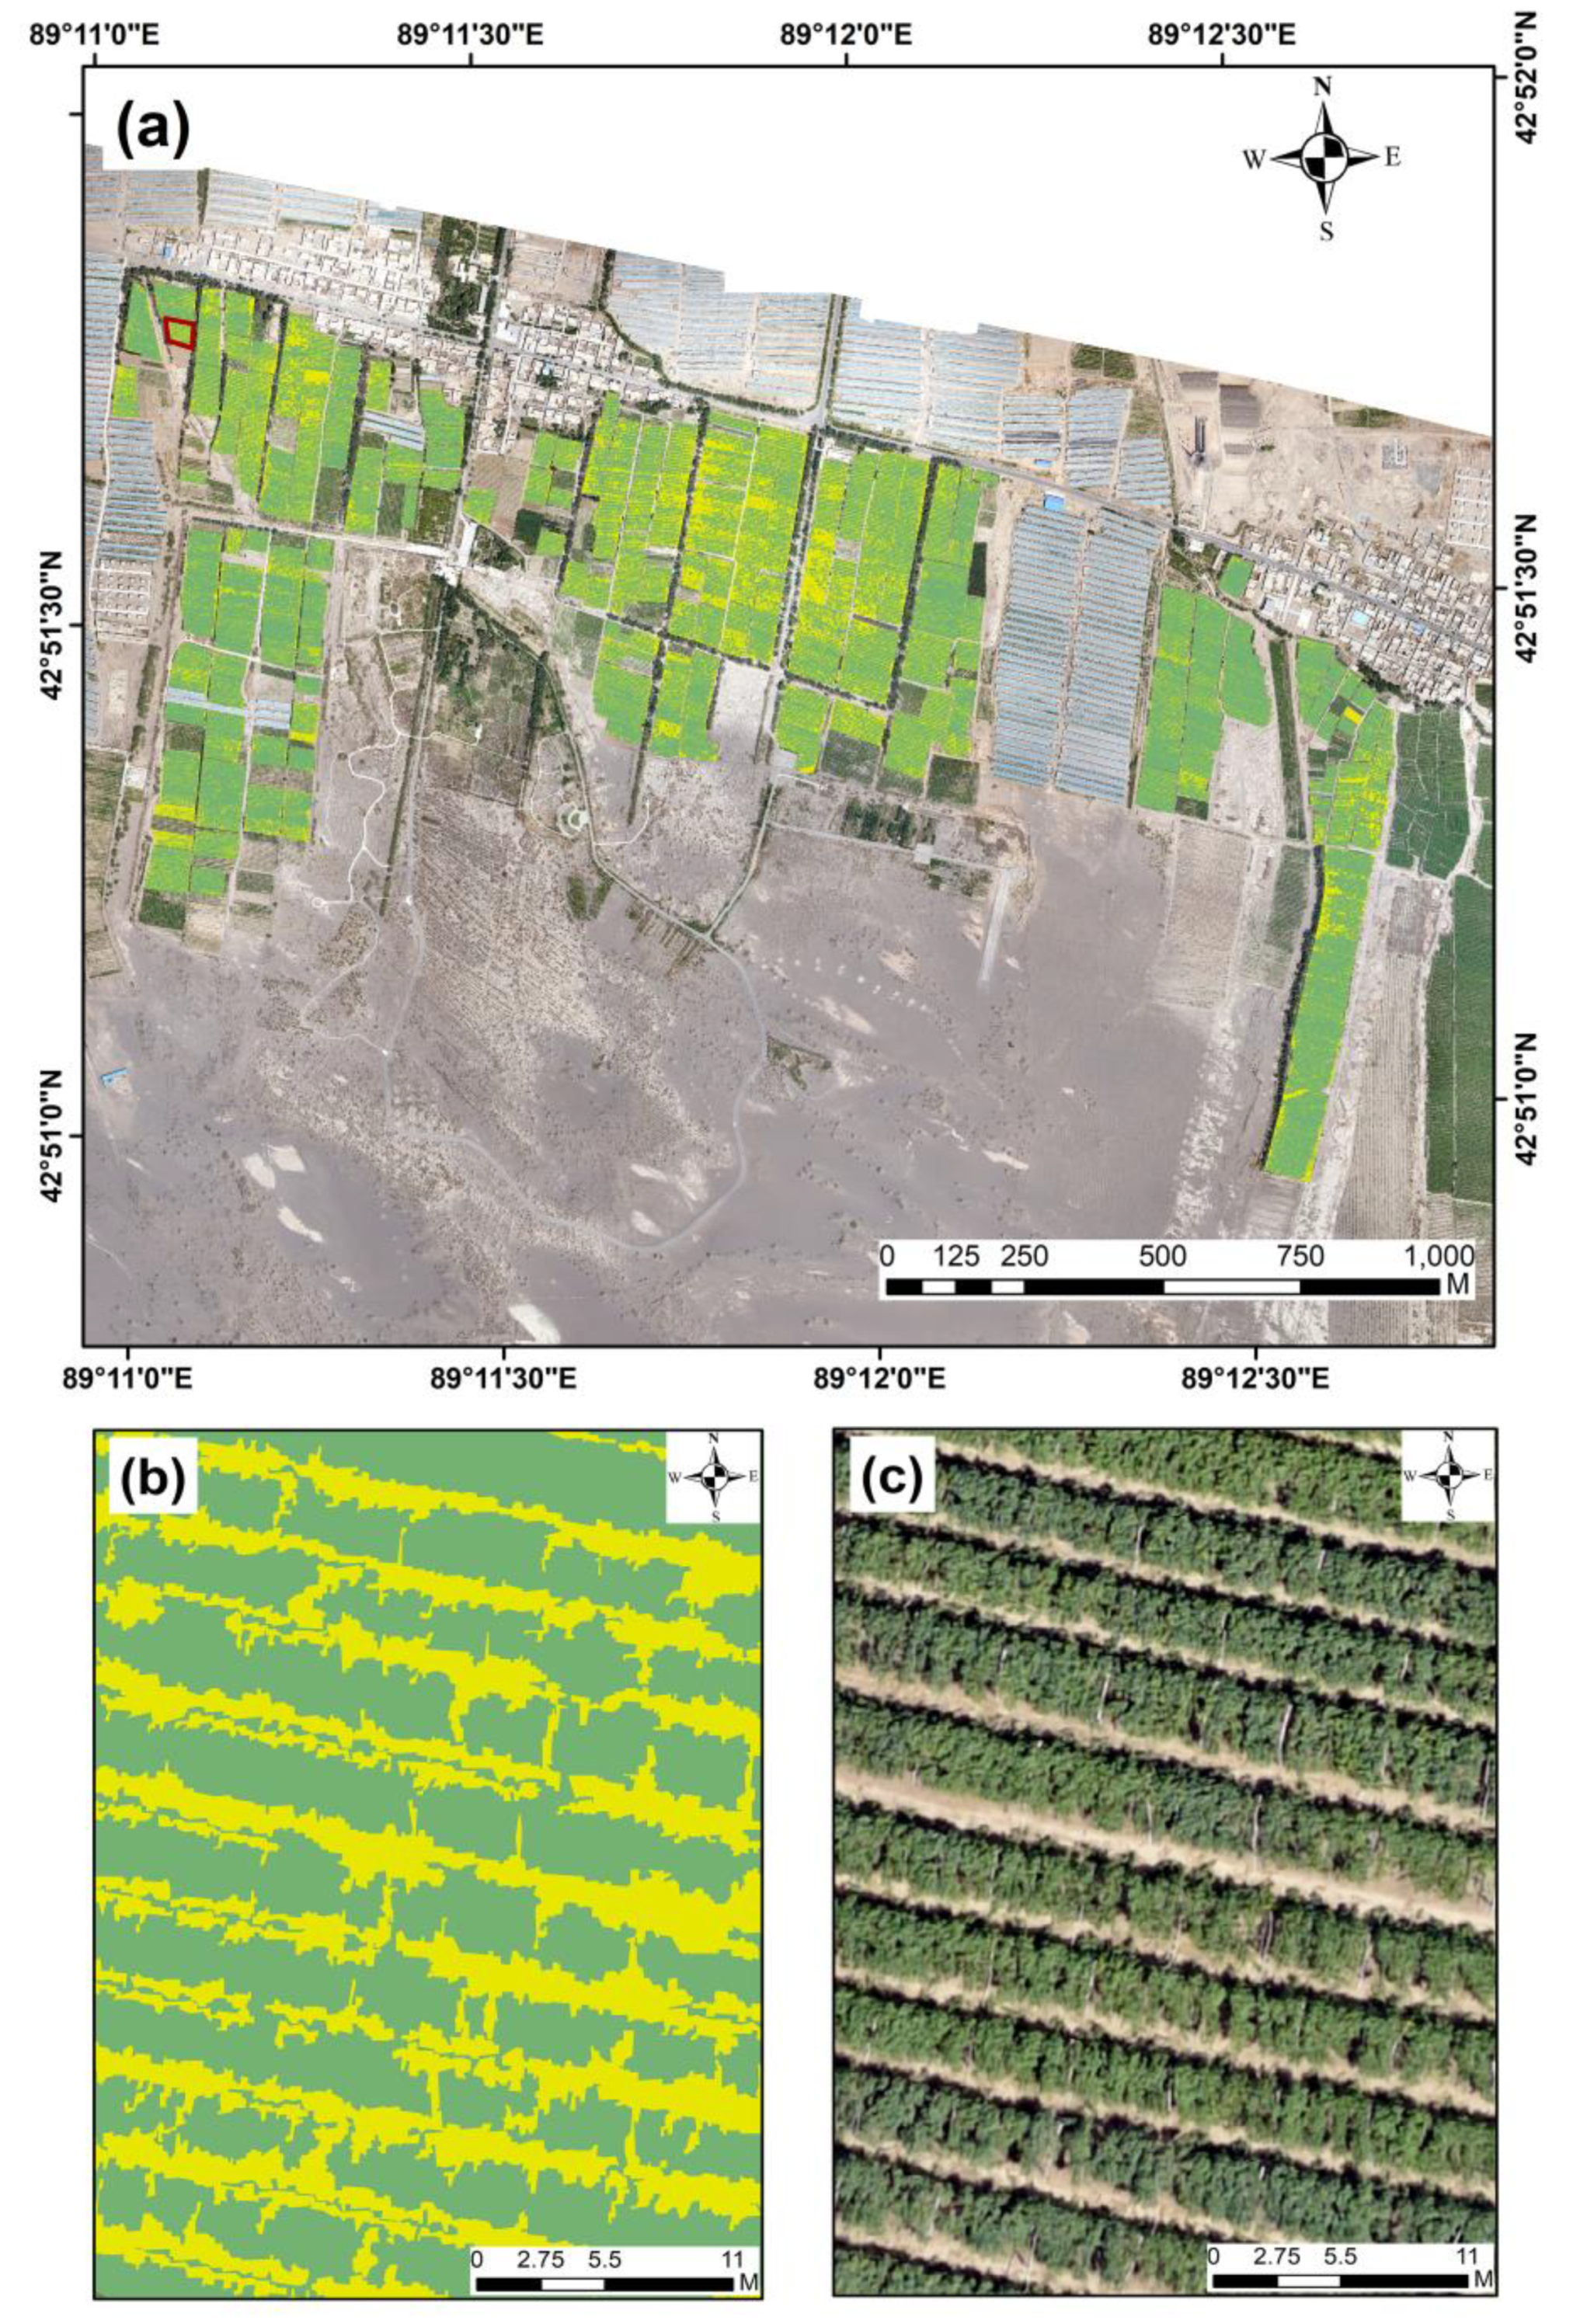
2.1. Study Site and Field Data Collection

The study was conducted in a grape-growing area in Turpan (northwestern China, 87°6′ E, 41°12′ N), where various kinds of grape are widely planted and have been affected by pests and diseases in recent years showed in Figure 1. The region has a continental warm temperate desert climate with a mean annual precipitation of 16.4 mm and a mean annual temperature of 13.9 °C. As studied by Serrano [25], the grapevine canopies were more affected by pests when high temperatures and heavy rainfall occurred during the vegetative period and during the initial growth period of the berries. Therefore, the Turpan grape plantation became a suitable research area.
The field survey was conducted on 16 May to 18 May 2019, observing 25 fields. According to the information provided by grape growers and local professionals, different grades of symptoms and damaged area were classified as shown in Table 1, and individual rows graded data as 0 (Healthy), 1 (Initial infestation), 2 (Medium infestation), 3 (High infestation), and 4 (Very high infestation) within a sampling area. In the next section, these criteria were also used to determine whether a vine is sick based on high-resolution UAV data.

2.2. Remote Sensing Data Acquisition

2.2.1. UAV Data

Using UAV data as an alternative to field data, high-resolution multispectral data were collected on 16 July 2018 and 25 May 2019 using an airborne vehicle with a Parrot Sequoia+ agricultural camera. This camera consists of two sensors: one was a multispectral sensor that included four 1.2-million-pixel monochrome sensors (global shutter single-band multispectral agricultural camera) that registered bands in the spectral ranges of Green (530–570 nm, Central Wavelength (CWL) at 550), Red (640–680 nm, CWL at 660), Red Edge (730–740 nm, CWL at 735) and Near infrared (770–810 nm, CWL at 790), with a horizontal angular field of view (HFOV) of 61.9, a vertical angular field of view (VFOV) of 48.5, and an RGB camera. When collecting each image, four monochrome sensors were simultaneously triggered to produce four raw images in 12-bit tiff format, which also recorded a set of latitude and longitude coordinates and the height of the ellipsoid coordinates in the WGS84 coordinate system, as well as the rotation angle, position accuracy, and rotation accuracy in the Exchangeable Image File (EXIF) information. Triggering all four sensors simultaneously and recording EXIF information solves the lens parallax problem and ensures the accuracy of four-band image geographical registration in the preprocessing process. The second sensor was a Sunshine Sensor, which had the same interference filter as the four monochrome sensor bands. This component was equipped with Global Position System (GPS), Inertial Measurement Unit (IMU), and a magnetometer. As for the external elements of the Sunshine Sensor, the irradiance at the moment of recording and the size of the bottom angle were also recorded and were later used in the radiometric calibration. Parrot Sequoia+ is set to automatic exposure in flight, and the sensor has an International Organization for Standardization (ISO) of 100. More sensor details can be found in the official Parrot Store.
In this study, the RGB map mosaicked from UAV data had a ground resolution of 6 cm, which made it possible distinguish canopy from background components and assess disease severity (DS) and disease incidence (DI) for every vineyard quickly. DS indicates the severity of the disease, and DI was the proportion of diseased rows in a plot [40,41]. A value 0 was used to represent no incidence and 1 was used to represent incidence. DS and DI were estimated by equations as follows:
DS = ( x i n i ) / N
DI = x / N ,
where xi represented the DS level shown in Table 1, ni represented the number of diseased rows on different DS level, x was the number of diseased rows, and N represented the number of rows within a plot [41]. Two variables, ∆DS and ∆DI, were defined to express the increase or decrease is pests and disease in vineyards as follows:
Δ DS = ( DS 2019 DS 2108 ) / DS 2018
Δ DI   = ( DI 2019 DI 2018 ) / DI 2018 .

2.2.2. Sentinel-2 Data

Sentinel-2 is a high-resolution multispectral imaging satellite carrying a multispectral instrument (MSI). The Sentinel-2 system is made up of two satellites, 2a and 2b, that acquire data once every 10 days under constant observation conditions. The complementarity of the two satellites results in 5-day revisit time. The MSI covers 13 bands from 442 nm up to 2202 nm with different resolutions: 10 m (Central Wavelength (CWL) at 490, 560, 665, and 842 nm with bandwidths of 65, 35, 30, and 115 nm, respectively), 20 m (CWL at 705, 740, 783, 865, 1610, and 2190 nm with bandwidths of 15, 15, 20, 20, 90, and 180 nm, respectively), and 60 m (CWL at 443, 940, and 1375 nm with bandwidths of 20, 20, and 30 nm, respectively) [17]. Sentinel-2 images have been available for free since 2015 [17]. Sentinel-2 improved the feasibility of satellite-based crop monitoring because its spectral band located in the red-edge region greatly increased the estimation accuracies of chlorophyll content, the fractional cover of forest canopies, and leaf area index (LAI) [11]. Furthermore, the short revisit interval (every 2–3 days) of the Sentinel-2 satellite at moderate latitudes provides abundant information on crop status in the short term over a large area.
A multi-temporal Sentinel-2 dataset was used to analyze the correlation between VIs derived from Sentinel-2 data and DS, DI acquired from UAV images, and the feasibility of detecting pests and disease using VI trends. This dataset consists of 22 cloud-free Sentinel-2 data including 2a and 2b, and it covered a vegetative period and initial berry growth period over two years from May to July 2018 and from May to July 2019. These Level-1C (L1C) data cover May to July 2018 from Google Earth Engine (GEE) (https://earthengine.google.com/), and Level-2A (L2A) data covering May to July 2019 were downloaded from the European Space Agency (ESA) (https://scihub.copernicus.eu/dhus/#/home).

2.3. Image Preprocessing

2.3.1. UAV Data Preprocessing

Previous studies provided evidence that Pix4Dmapper is more user-friendly than other similar software [42]. We used Pix4Dmapper4.3 for photogrammetry and radiometric raw UAV images processing in three steps, including initial processing, dense point cloud point, digital surface model (DSM), orthomosaic, and index map. Raw images were radiometrically calibrated in a target-less automatic workflow [43]. The cooperation between Parrot Sequoia+ and Pix4Dmapper provided absolute reflectance measurements without the need to use radiometric calibration target. Typical workflow and details are described in official technical papers [44]. In addition, an RGB image with 6 cm resolution was acquired by an RGB camera using the Pix4Dmapper software for this study.

2.3.2. Sentinel-2 Data Preprocessing

The multi-temporal Sentinel-2 dataset included L1C and L2A data. The L1C data were atmospherically corrected to L2A expressed in terms of bottom-of-atmosphere reflectance with the Sen2cor Atmospheric Correction Processor (version255) in ESA SNAP. Resampling was performed using a tool specifically designed for Sentinel-2 in ESA SNAP before calculating the VIs.
Meanwhile, the ability of UAV data to be used as field data was tested using field samples and spectral analysis. Previous studies showed that the spectral band of Parrot Sequoia+ was very similar to that of ASD [45]. Therefore, this study tested the correlation between VIs derived from Sentinel-2 and Parrot Sequoia+ and compared the results with the appearance of the high-resolution UAV and Sentinel-2 images.

3. Methods

3.1. Feature Extraction

3.1.1. UAV Imagery-Based Canopy Feature Extraction

Canopy height is an important characteristics of canopy structure. Alessandro [46] has researched the correlation between canopy height (CH) and vine vigor by comparing the CH and the vigor map obtained from Normalized Difference Vegetation Index (NDVI). A digital elevation model (DEM) was generated from UAV point data using the Pix4D mapper (v.4.3), and a digital surface model (DSM) was generated from UAV point data using ArcGIS. The canopy height (CH) was obtained by subtracting DEM from DSM [47,48].
In addition, there are two indicators that can reflect the density and vigor of vines and have been used in previous studies: canopy coverage (CC) and fractional vegetation coverage (VFC). They are both based on computing the percentage green vegetation area per plot using different methods. In this study, vegetation was extracted from high-resolution RGB images using the SVM classifier [49,50,51] shown in Figure 2. The classification result was tested using random selected 288 samples with an overall accuracy of 96.9% and Kappa coefficient of 0.936. Then, the CC is calculated by dividing the area that is classified as grapes by the total plot area, and VFC was calculated based on multispectral information as follows:
VFC =   ( NDVI NDVIsoil   )   /   ( NDVI veg   NDVIsoil   )
where NDVI soil and   NDVI veg represent the NDVI on bare soil and under full vegetation coverage [52,53,54], respectively; these were normally replaced by the minimum and maximum NDVI in the test area. The two indicators are compared in the next section.

3.1.2. Sentinel-2 Imagery-Based VI Feature Extraction

To find suitable VIs that correlated with changes in pest incidence and severity, this study selected 17 VIs that were sensitive to changes in vegetation-related physiological and biochemical parameters and that were calculated from the Sentinel-2 spectral bands as shown in Table 2. For 144 vineyards, the average of the accurate values was used to fill the gap, and daily VIs were reconstructed through an S-G filter to reduce the effect of atmospheric conditions and other factors [55]. The time series VI consists of data from three weeks before and after the UAV sampling date, and VI_2019/VI_2018 was calculated to determine the strength of statistical relationships among VI, ∆DI, and ∆DS through Pearson correlations and p-values.
To connect these features (CH and VIs) with DI, the average of CH and the VIs was computed for every plot. A binary mask layer was applied to exclude soil/shadow and weeds from the background components. Figure 3 shows the workflow, including data preprocessing, feature extraction, machine learning modeling, and analysis.

3.2. Modeling Methods

ML methods have been efficiently applied to remote sensing studies because these methods have the potential to monitor crops and estimate vegetation parameters and crop yield using spectral information and canopy structure derived from satellite and UAV data, including machine learning regression algorithms, such as PLSR, RFR, SVR, and extreme learning regression (ELR). To address the nonlinearity of remote sensing datasets, several studies have indicated that these methods are useful. PLSR is a popular method used in crop monitoring because of its ability to decrease loss of the information contained in the input variables, which is similar to Principal Component Regression (PCR) in that it uses statistic rotation [68]. Random forests(RF) is a regression technique; its basic idea is to grow “trees” using Classification and Regression Trees (CART) methodology. RFR is the regression version of RF. The difference between random forests for regression and for classification is that the former’s predictor and output values are numerical [69]. SVR is an important branch of SVM(support vector machine); its basic concept is to transform the original input features into a new hyper-space using kernel functions [70]. ELR is the implementation of ELM for regression; the classic ELM is a simple and faster learning algorithm for Single-hidden Layer Feedforward Neural Network (SLFN), which can be easily implemented and decrease training error. In this study, an extension of classic ELM, which has a different activation function from the classic ELM and has been applied to crop monitoring in previous studies [37], was modified. The activation function of this new ELM proposed by Maimaitiyiming [33] and called TanhRe is the combination of two frequently used functions: the rectified linear unit (ReLU) and the hyperbolic tangent (Tanh) functions, with the goal of fitting an input pattern better. TanhRe takes the following form: if x > 0 , the nonlinear activation f ( x ) = x ; if x 0 , f ( x ) = c · t a n h ( x ) , where the reasonable range of the constant c is from 0 to 1.
One hundred vineyard samples (70% of the total) including VIs (ARVI, OSAVI, and GNDVI), VFC, CH, and DI were used as input features to train the models; the rest of the samples were used as validation samples to assess the performance and reliability of the prediction models. In the process of implementing the ML method, grid search was used to determine the number of principal components for PLSR, the parameter C, and the coefficient c for ELR. For the SVR method, poly was determined as the kernel function, and the parameter C was determined by tuning. For the RFR method, the number of trees was 400. To assess the performance of these methods, the coefficient of determination (R2), the root mean square error (RMSE), and the coefficient of variance of the RMSE (CV-RMSE) were calculated [71]:
R 2 = 1 i = 1 N ( y i y i ^ ) 2 i = 1 N ( y i y i ¯ ) 2
R M S E = i = 1 N ( y i y i ^ ) 2 n 1
C V R M S E = R M S E m e a n ( o b s e r v a t i o n s )
where y i and y i ^ are the measured and the predicted parameters, respectively. y i ¯ is the mean of measured parameters, and n is the number of samples. These machine learning methods and accuracy assessments are implemented through the sklearn package in Python.

4. Results

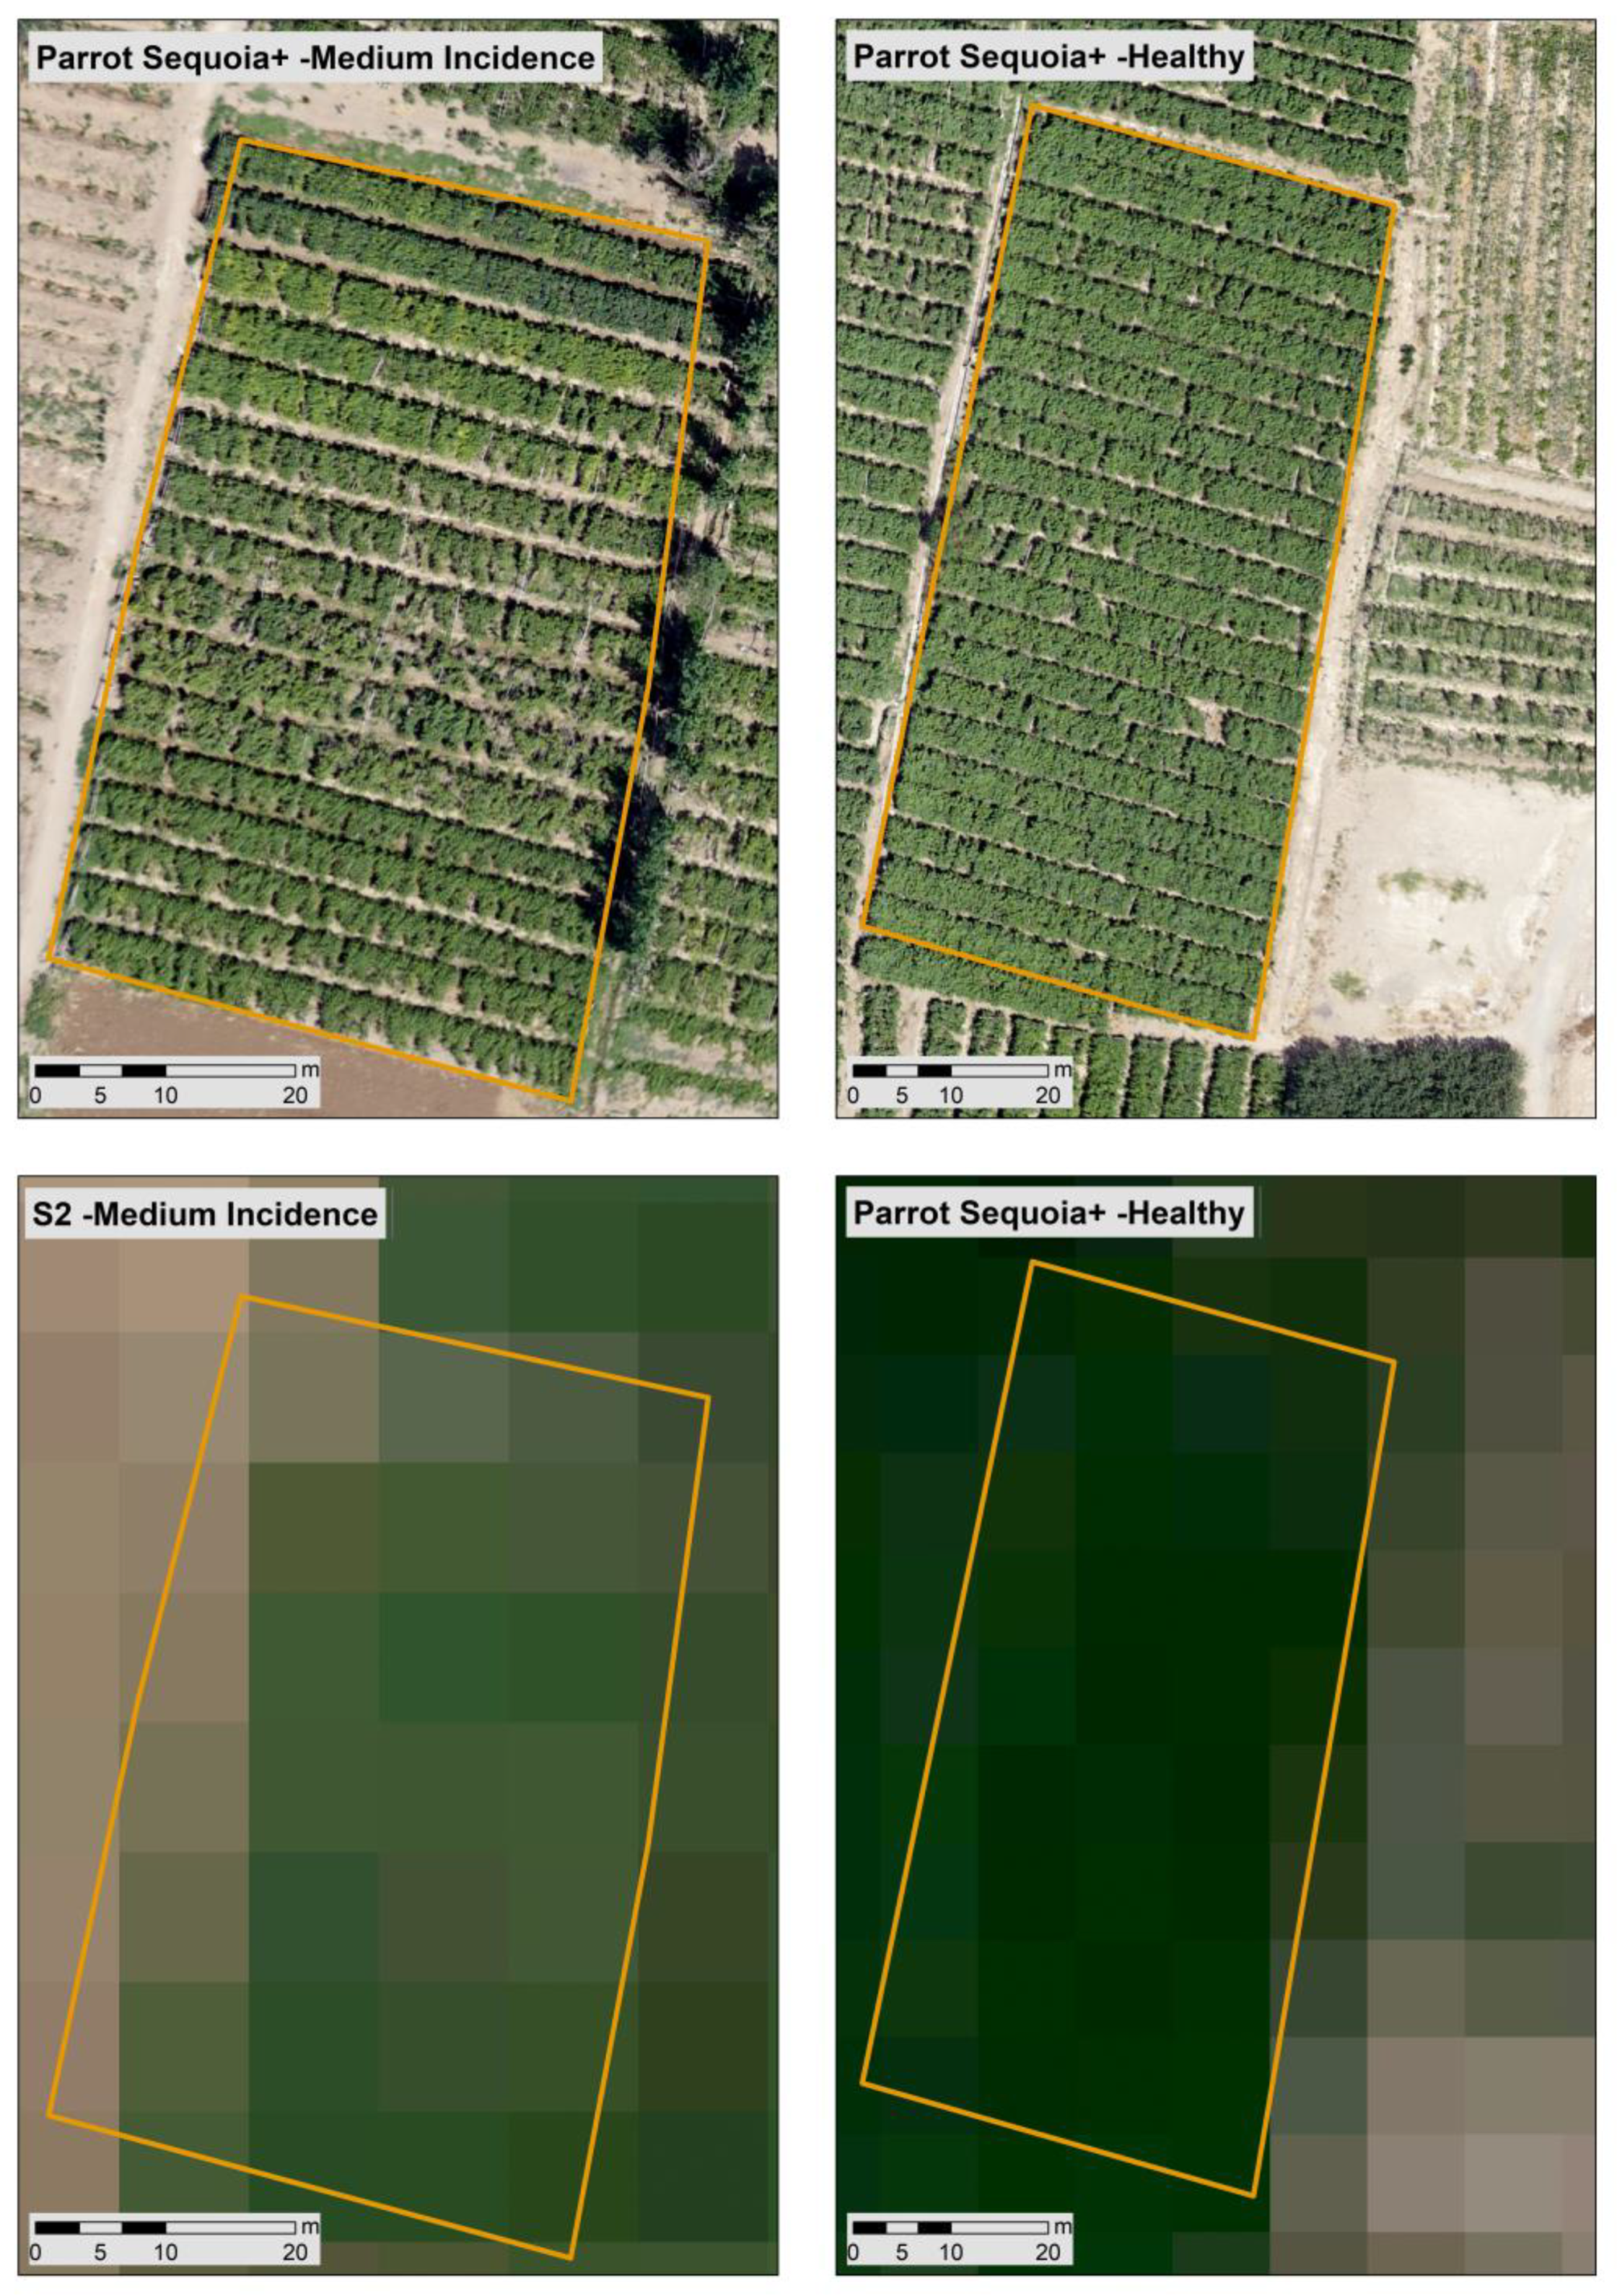
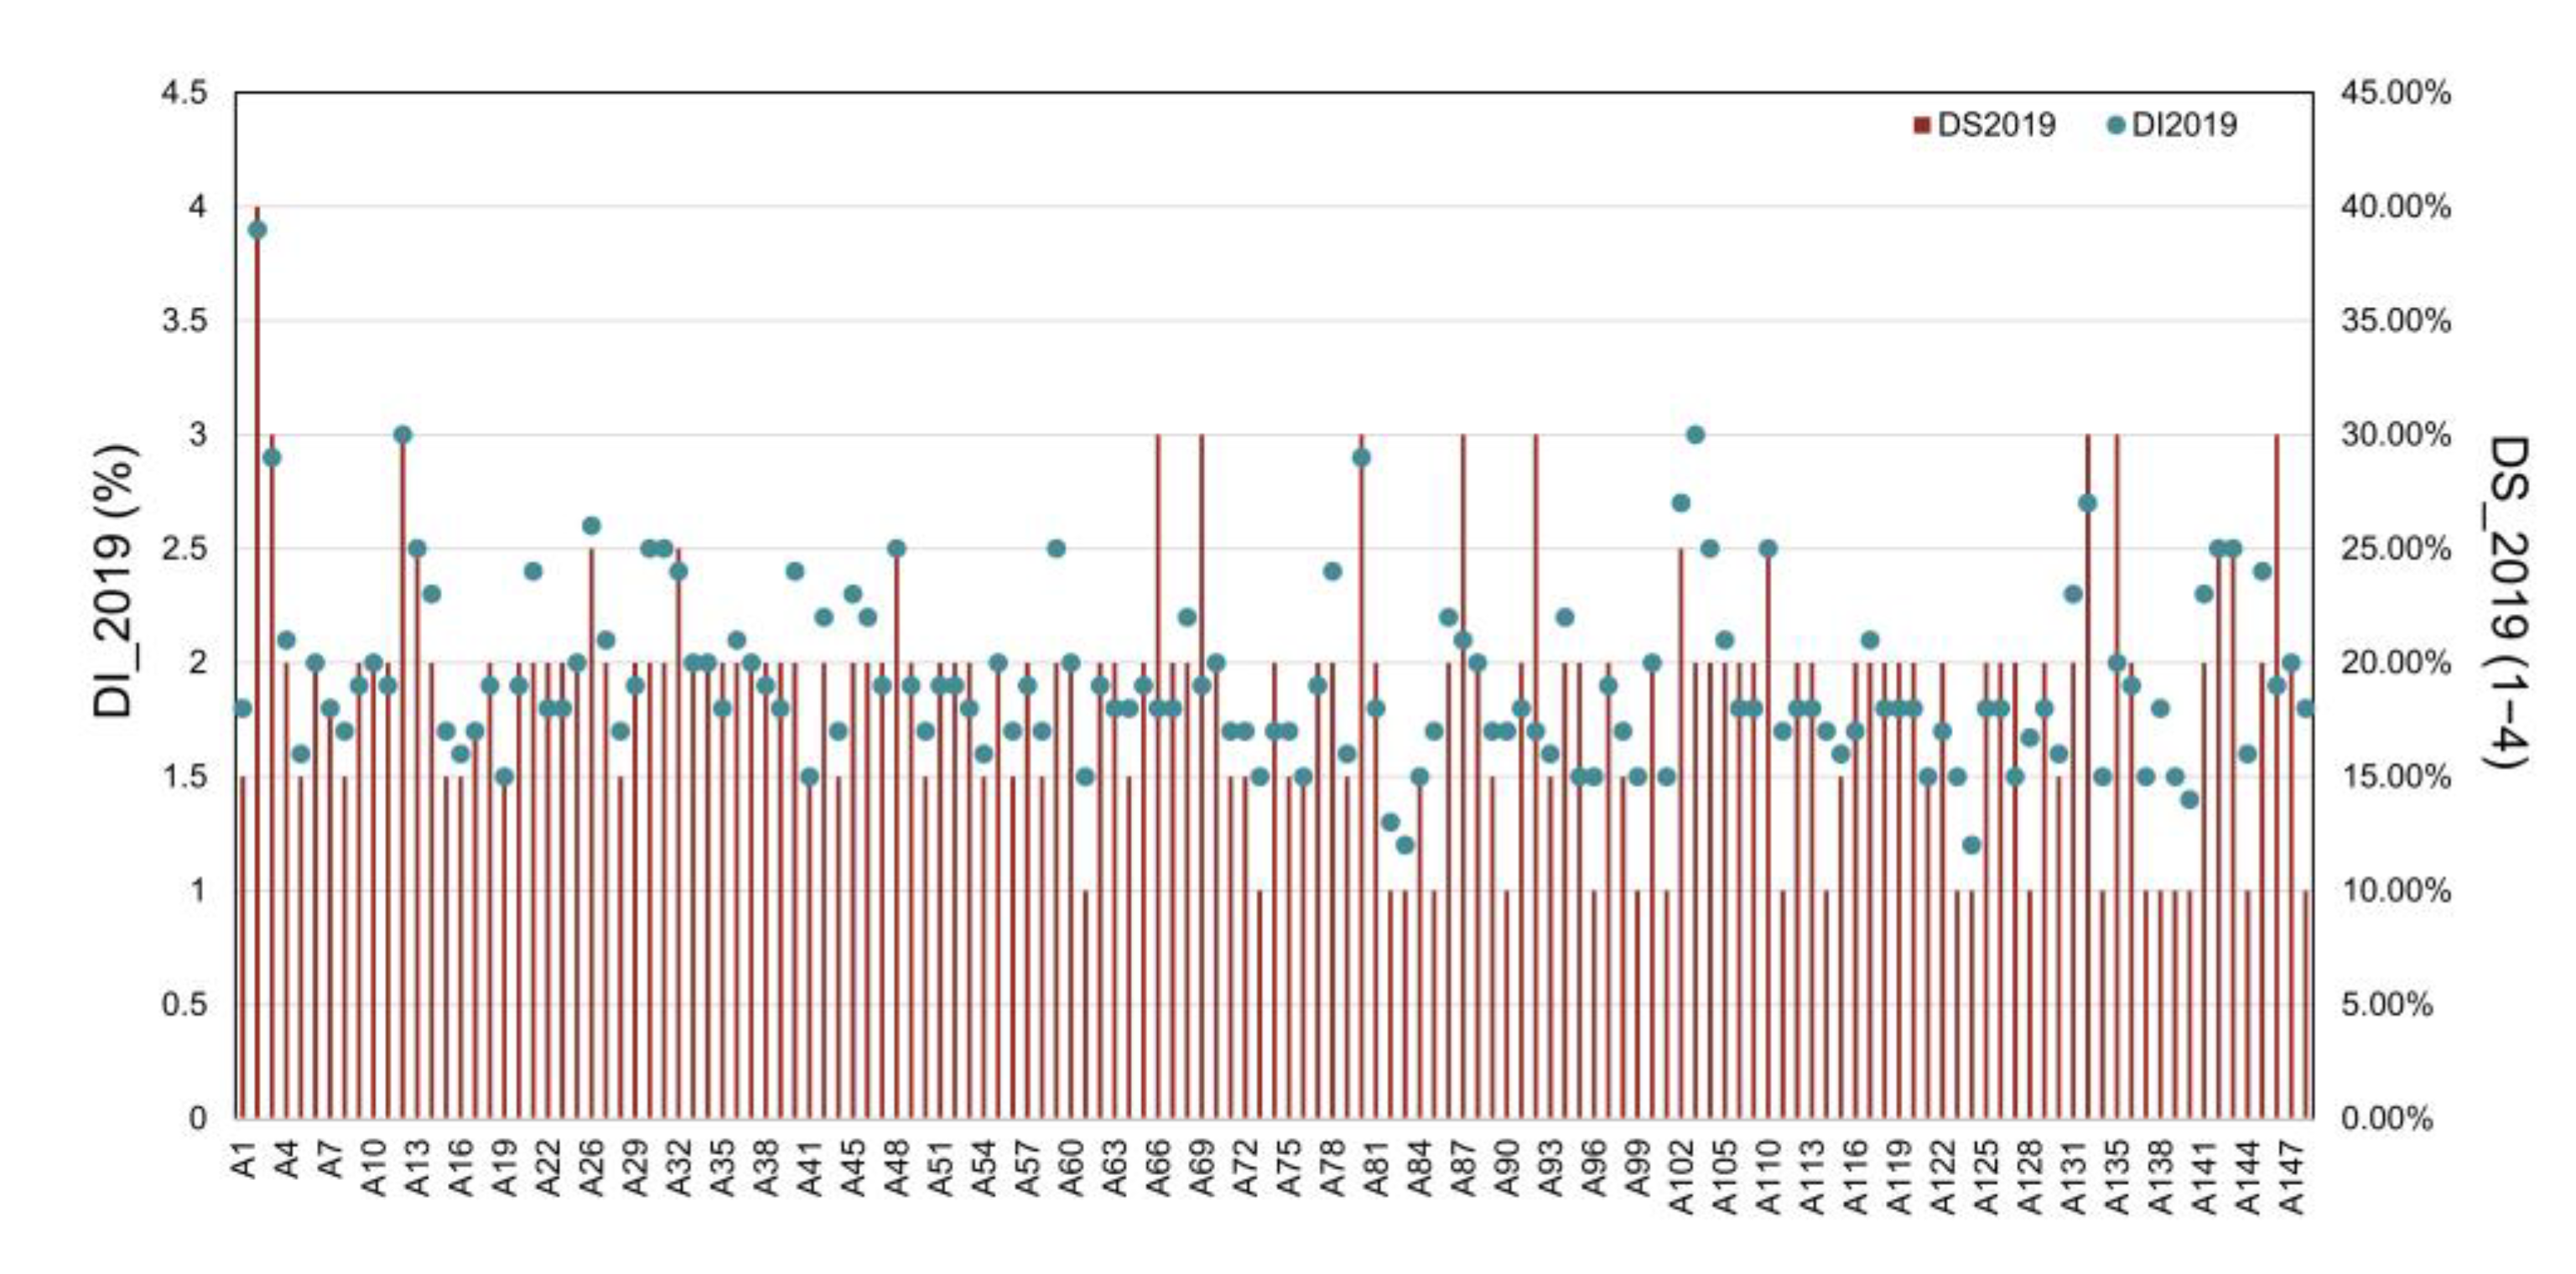
4.1. Assessment of Sampling Data Based on the UAV

4.1.1. Validation of Canopy Height

CH derived from UAV imagery was validated by comparison with the field samples in 22 vineyards, which presented an R2 of 0.82 and an RMSE of 0.047 m, as shown in Figure 4. The slight error can usually be attributed to Geometric Standard Deviation (GSD), the corresponding DSM calculation, and deviation of the edge pixels [72].

4.1.2. Assessment of the Relevance of UAV Data to Sentinel-2 Data

The next step was to validate the ability of UAV high-spatial-resolution data alternating with field samples for monitoring vineyards. Figure 5 shows very high-resolution images taken on May 16, 2019 for two health conditions: healthy and medium pest incidence, as well as the corresponding Sentinel-2 images. Through visual interpretation, the distinctness of the two conditions can be clearly observed from a bird’s-eye and a global perspective. The comparison between the appearance of the high-resolution UAV image and the Sentinel-2 image is obvious. VIs acquired from UAV and Sentinel-2 data over the 144 vineyards, and Figure 6 shows a strong correlation between the two (R2 = 0.85, p < 0.001 for NDVI and R2 = 0.71, p < 0.001 for OSAVI). NDVI lightly outperformed OSAVI. Compared with NDVI, OSAVI is more sensitive to vegetation and is more susceptible to changes in atmospheric correction results and observation angle, which also leads to the slightly poor correlation between UAV-derived OSAVI and satellite-derived OSAVI [73].

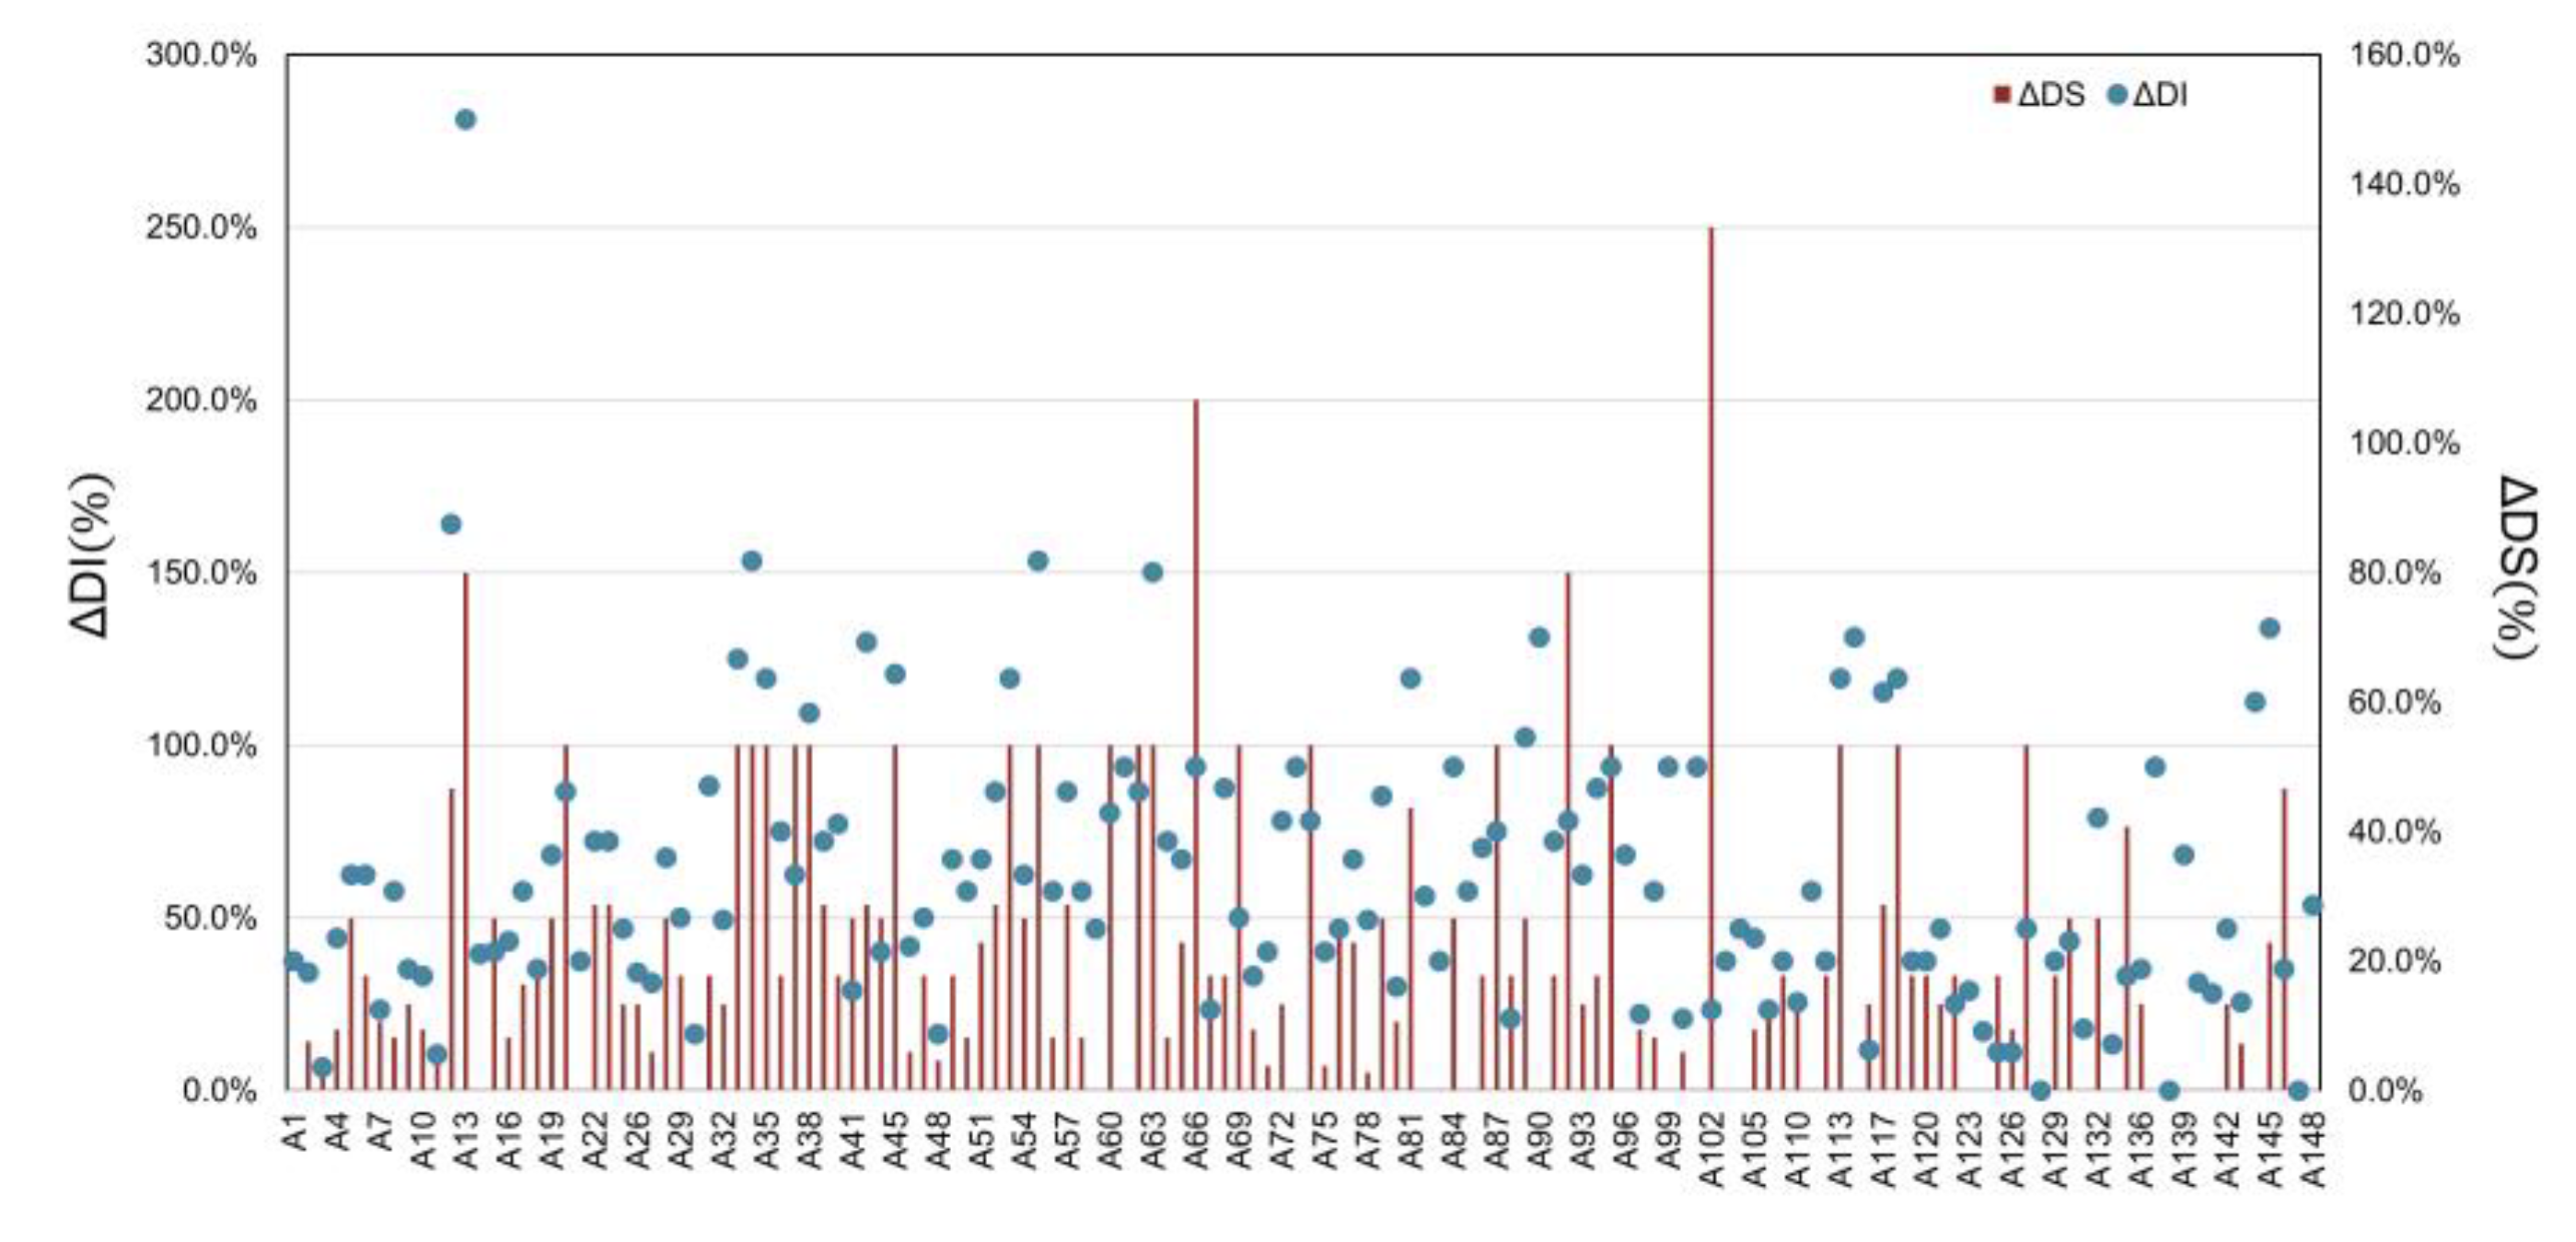
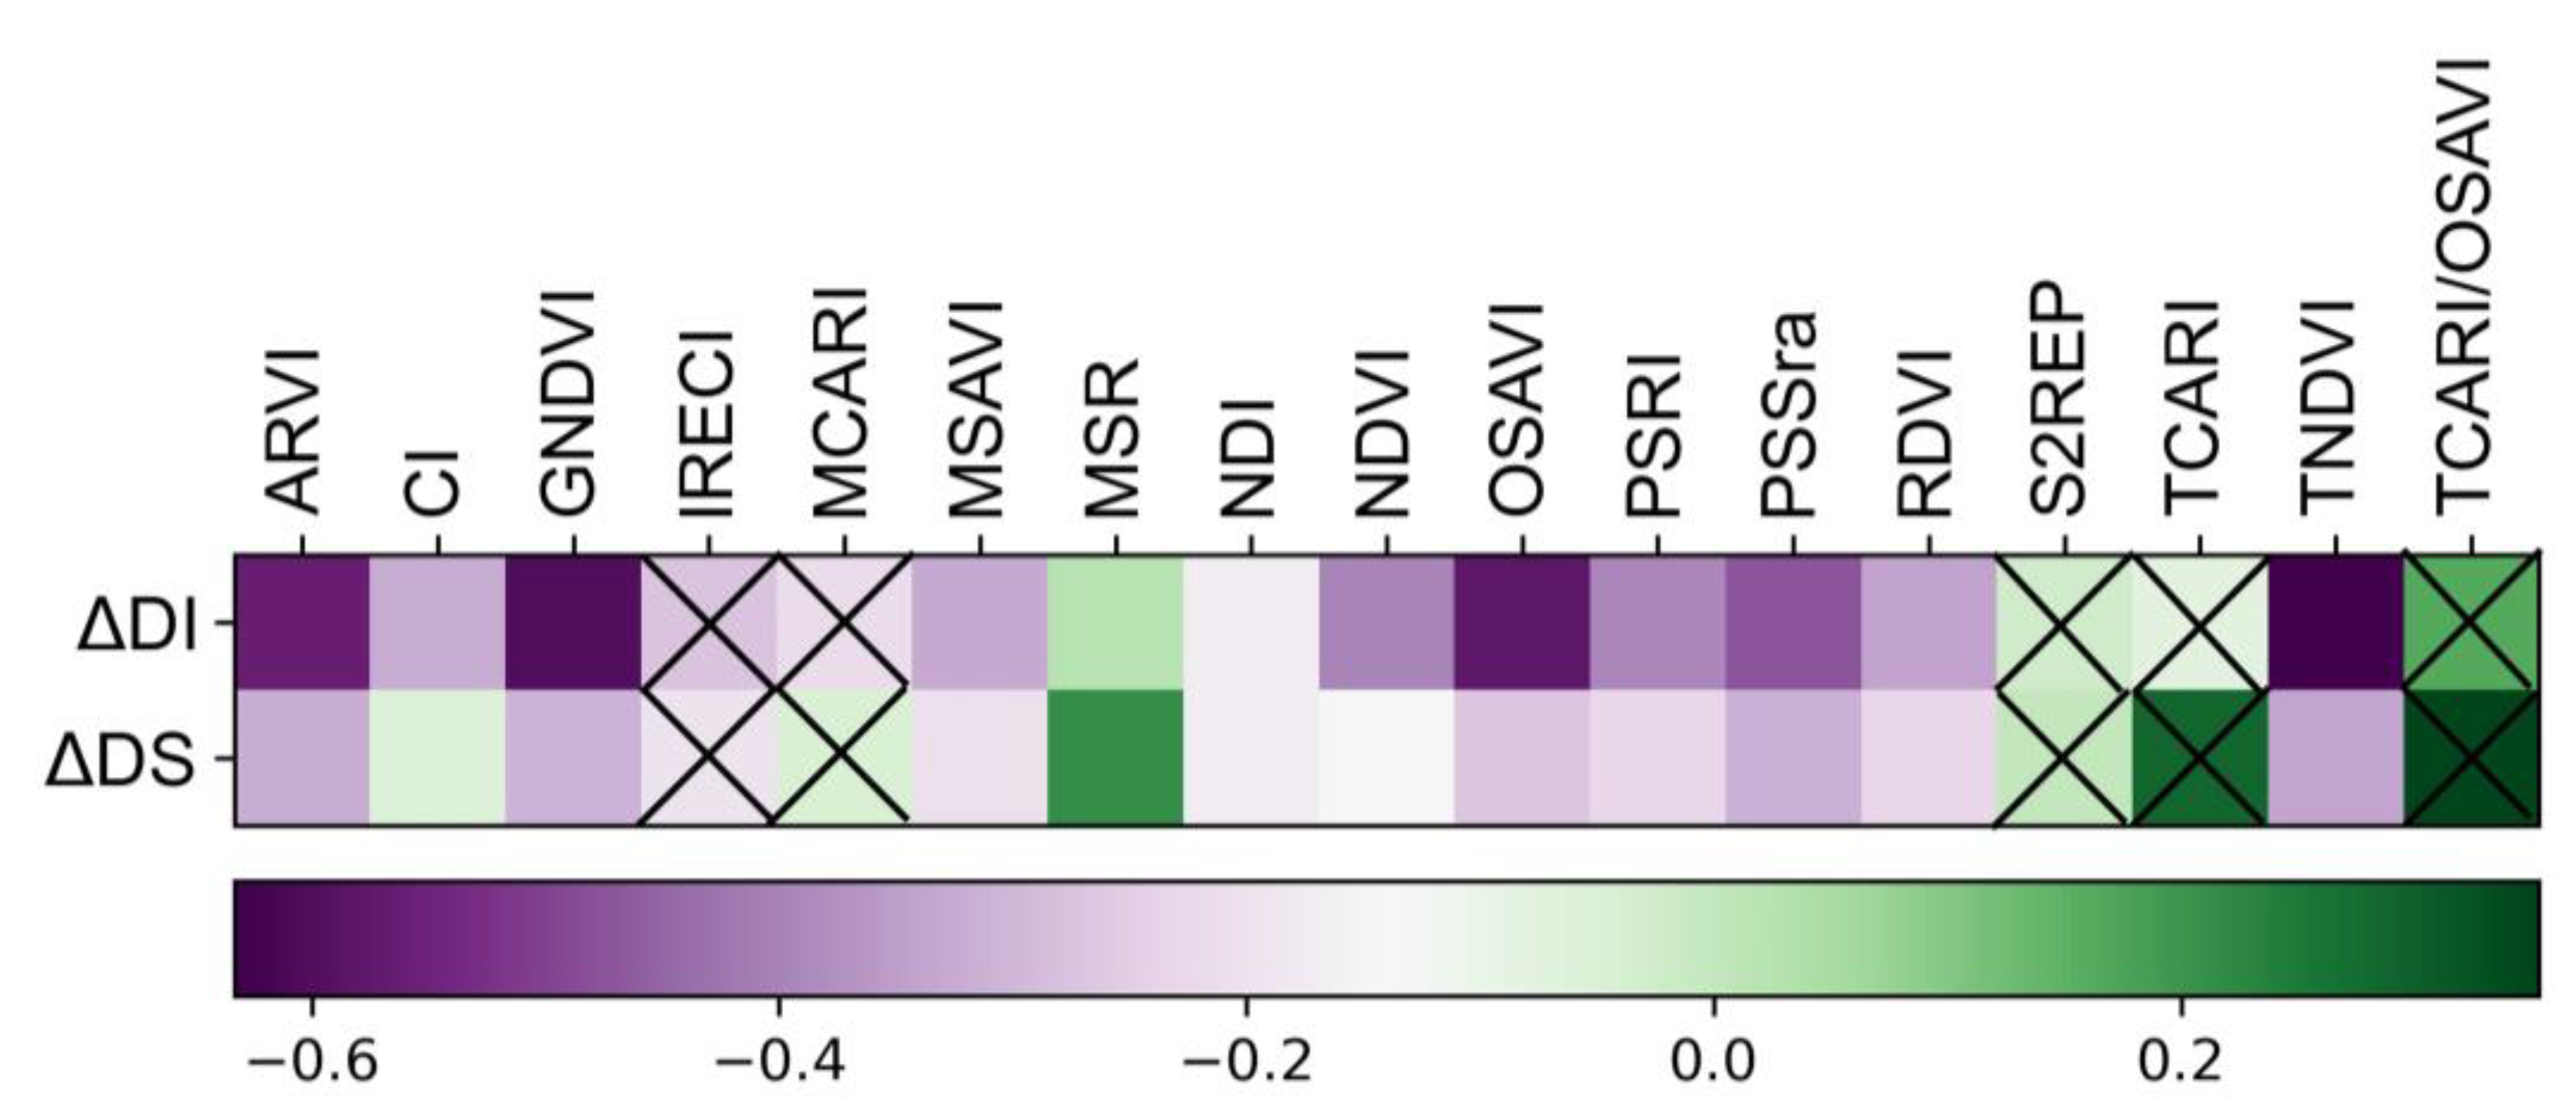
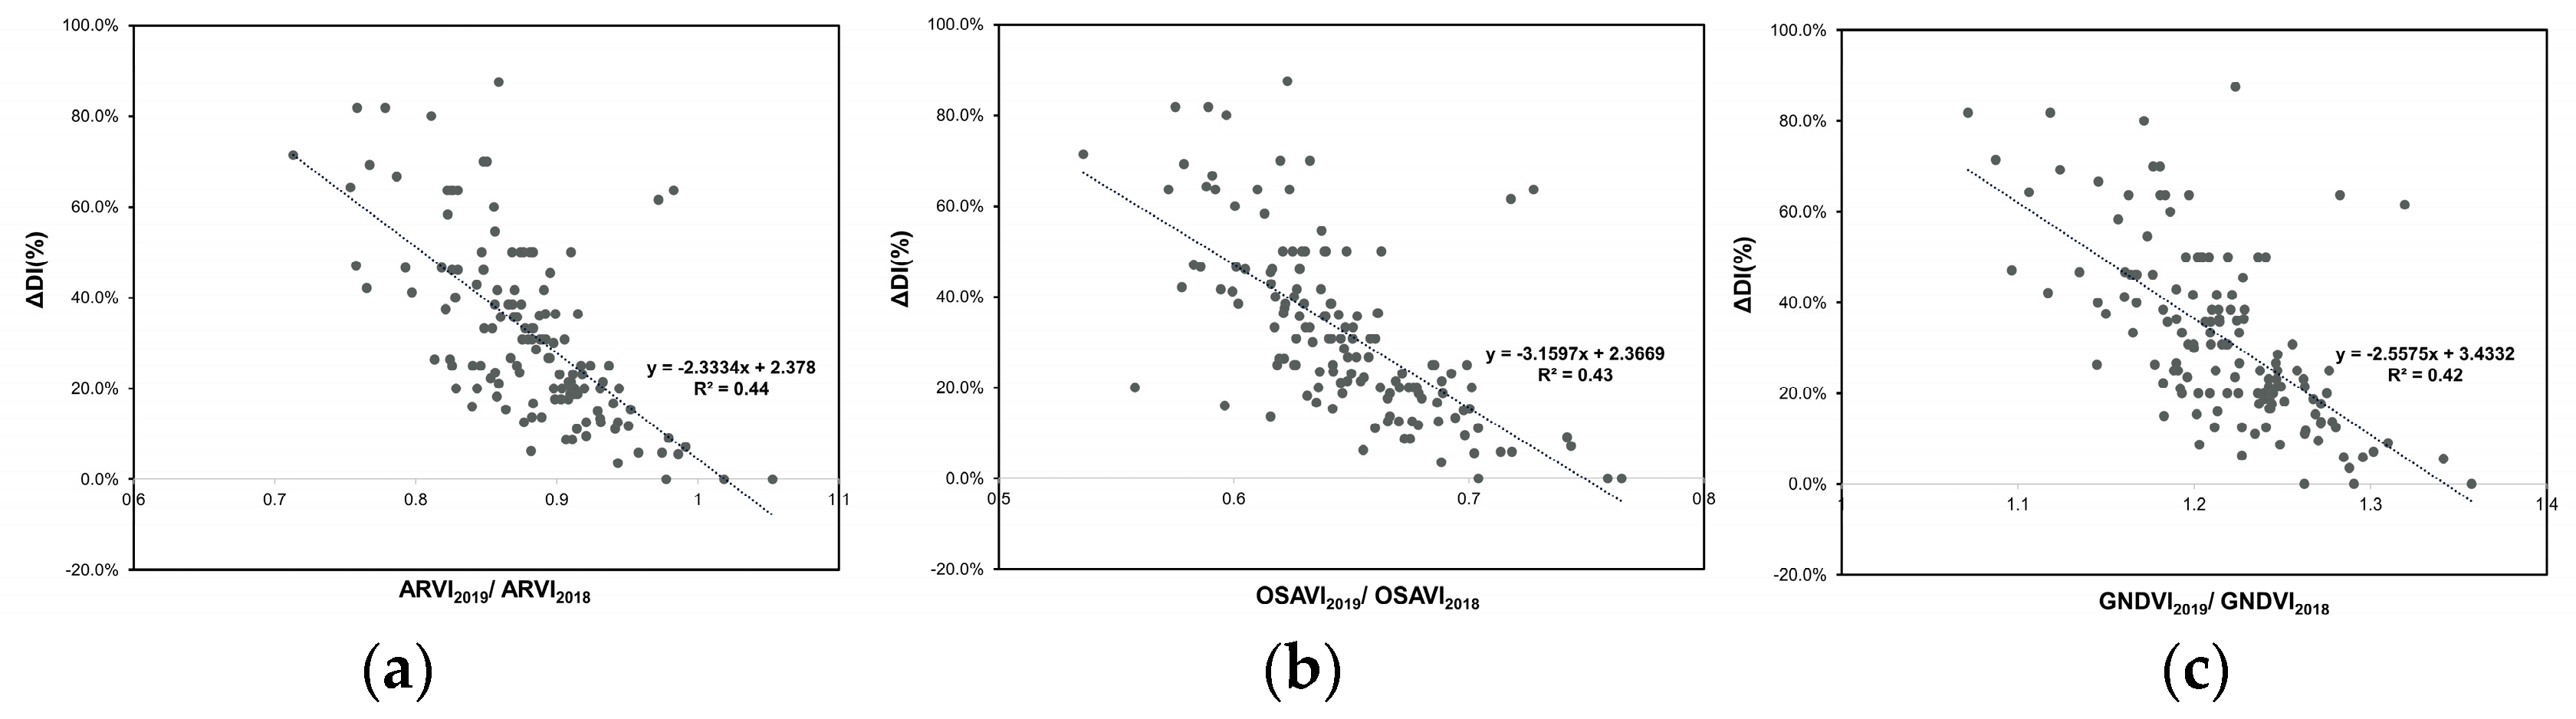
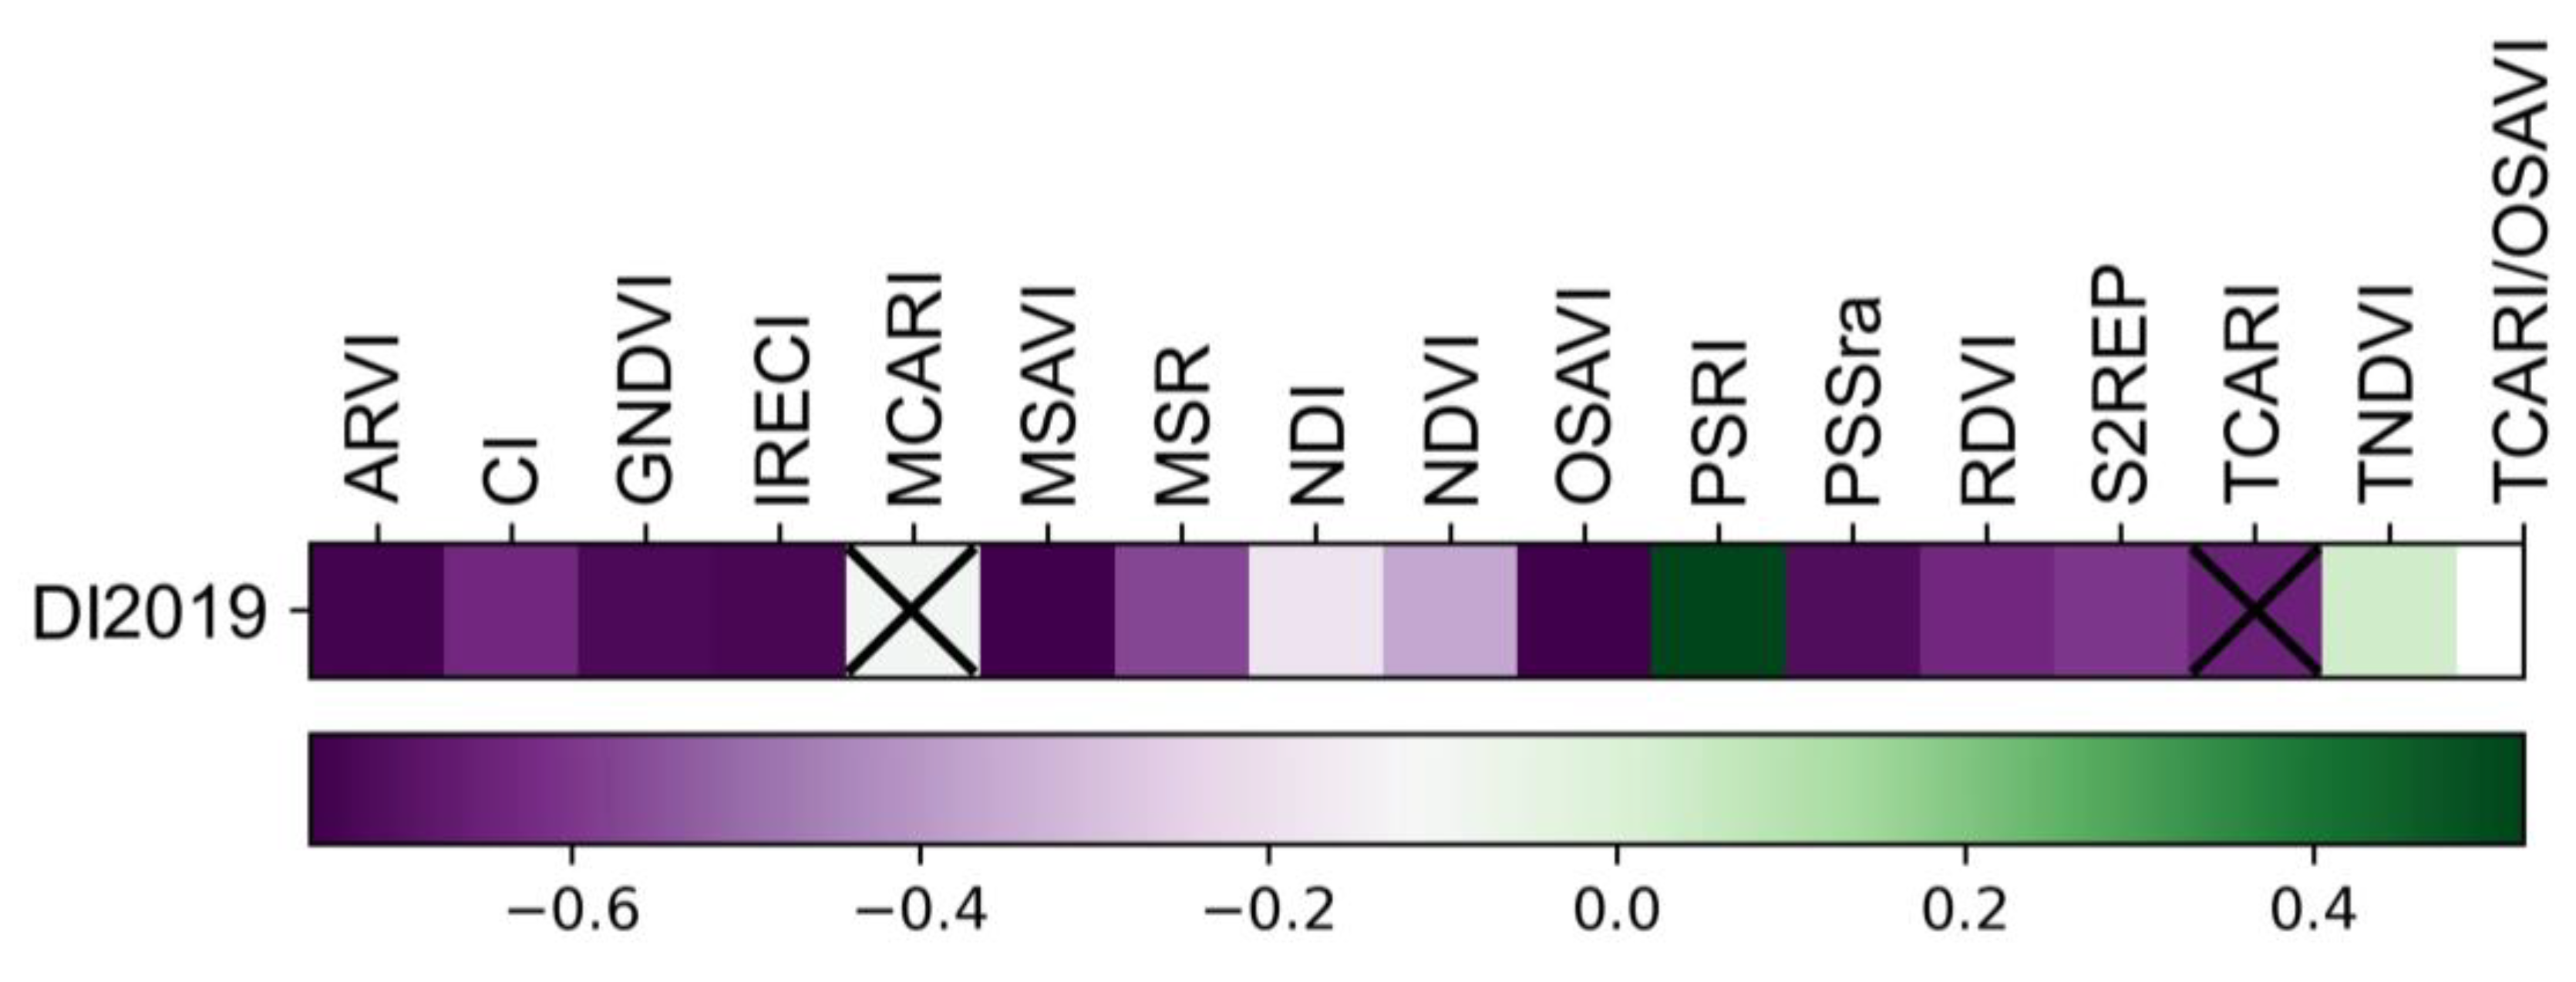
4.1.3. Correlation between DI and VIs

In addition, the potential of UAV sampling data to monitor vineyards was assessed on two scales: the relationship between temporal DI trends and the rate of change in vegetation indices was examined, and DI was related to VIs in 2019. All DI and DS were derived from images acquired by Parrot Sequoia+ in July 2018 and May 2019 from the surveyed vineyards (Figure 7 and Figure 8). The correlation between DS and DI was significant (r2 = 0.728, p < 0.001), as well as that between temporal change rates ∆DS and ∆DI (r2 = 0.489, p < 0.001). Vineyards affected by pests show different rates of change in incidence and severity, and vineyards that had already been affected lightly in 2018 showed an obvious increase in 2019 (e.g., A66 and A102).
Figure 9 shows the significant correlation of 12 out of 17 VIs with both DI and DS. Among the VIs, ARVI, OSAVI, and GNDVI produced higher correlations and coefficients of determination (R2) with ∆DI than the others (R2ARVI = 0.44, R2OSAVI = 0.42, R2GNDVI = 0.43). These coefficients of determination (R2) demonstrated that using a temporal rate of change in VI to fit ∆DI is not very accurate. It can be speculated that the relationship between pests and diseases caused by the change of climate in early spring with temporal vegetation incidence is not obvious. This speculation needs further confirmation. Notably, the results showed that ∆DI decreased with smaller increase in VI (Figure 10). In addition, the VIs and DI in 2019 were correlated for every plot in Figure 10 and showed strong correlation, and three coefficients of determination (R2ARVI = 0.55, R2OSAVI = 0.57, R2GNDVI = 0.51) outperformed the others, as shown in Figure 11.

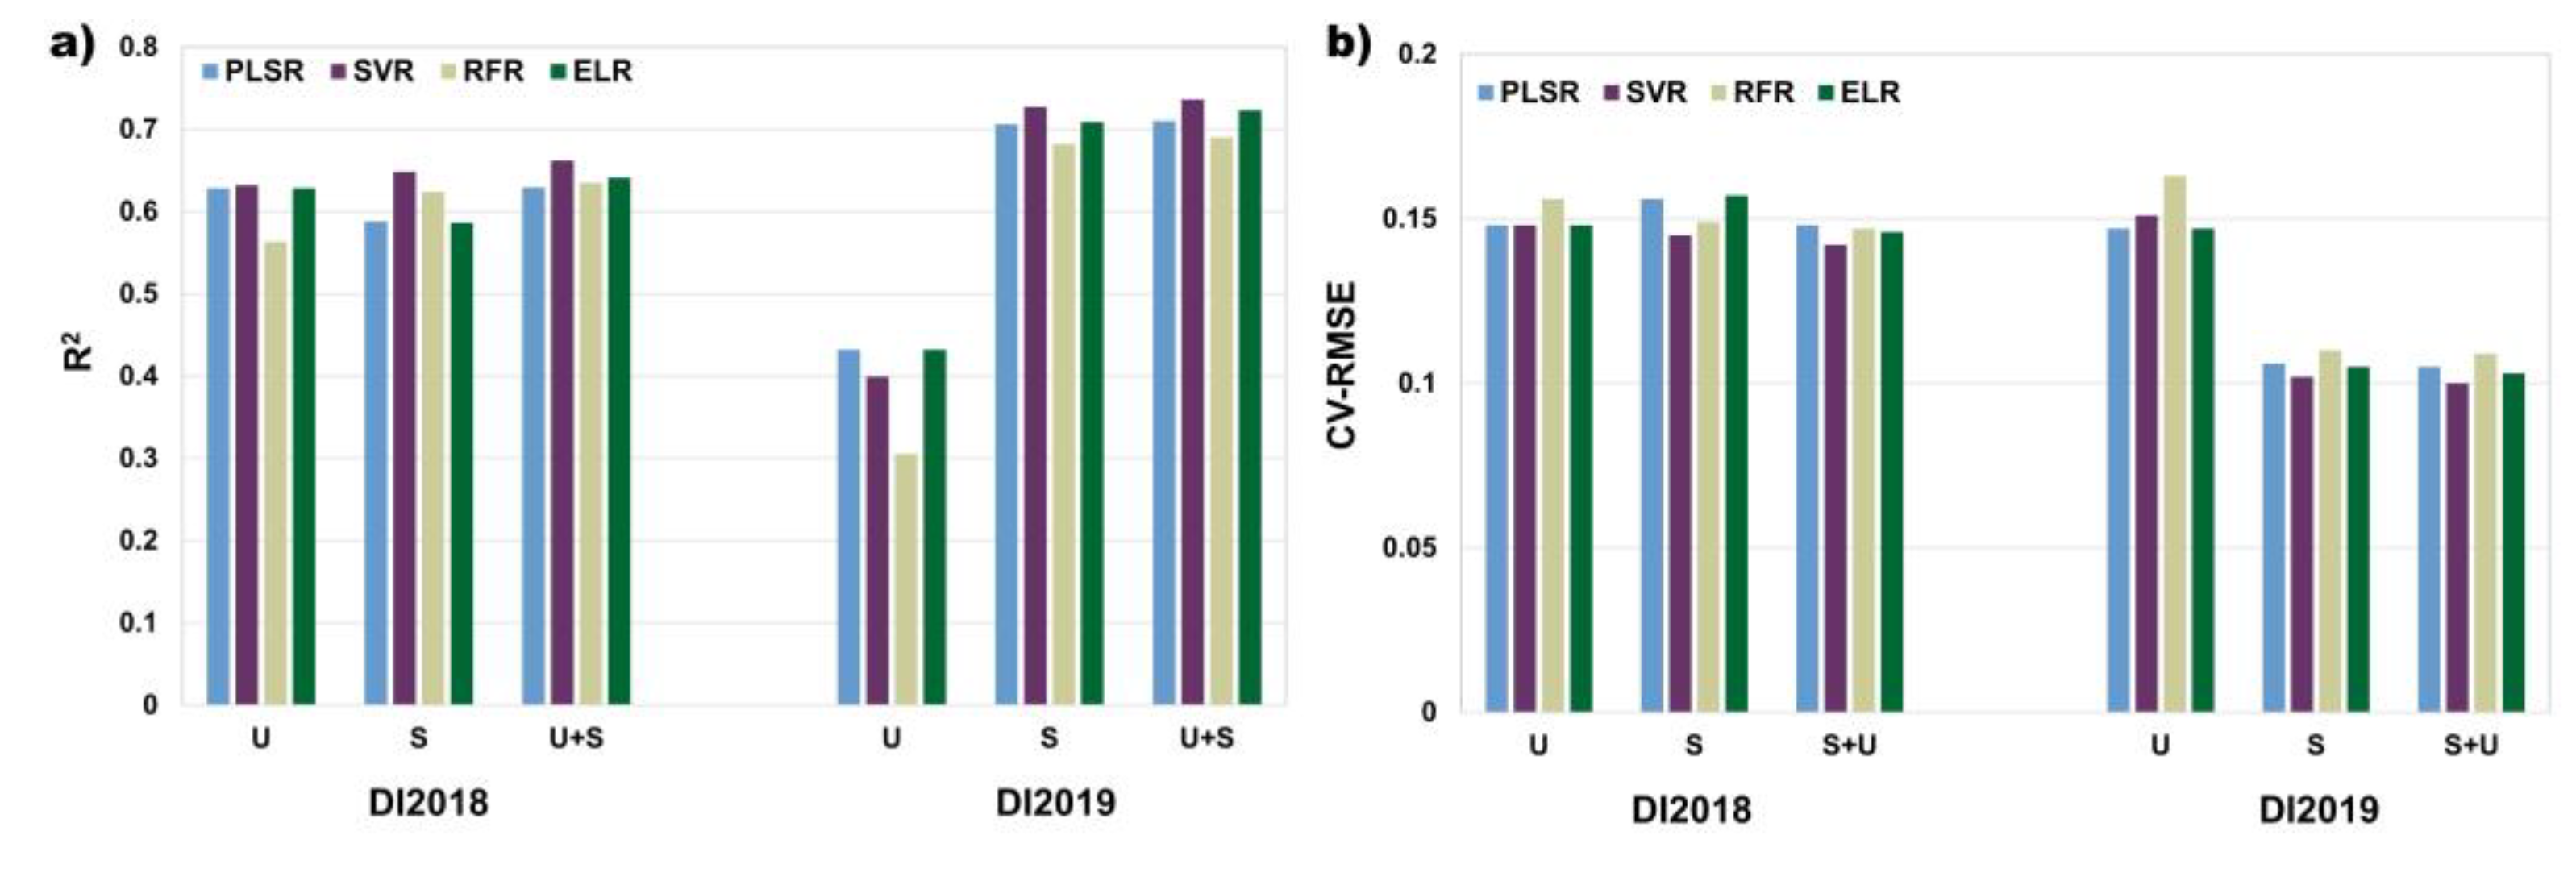
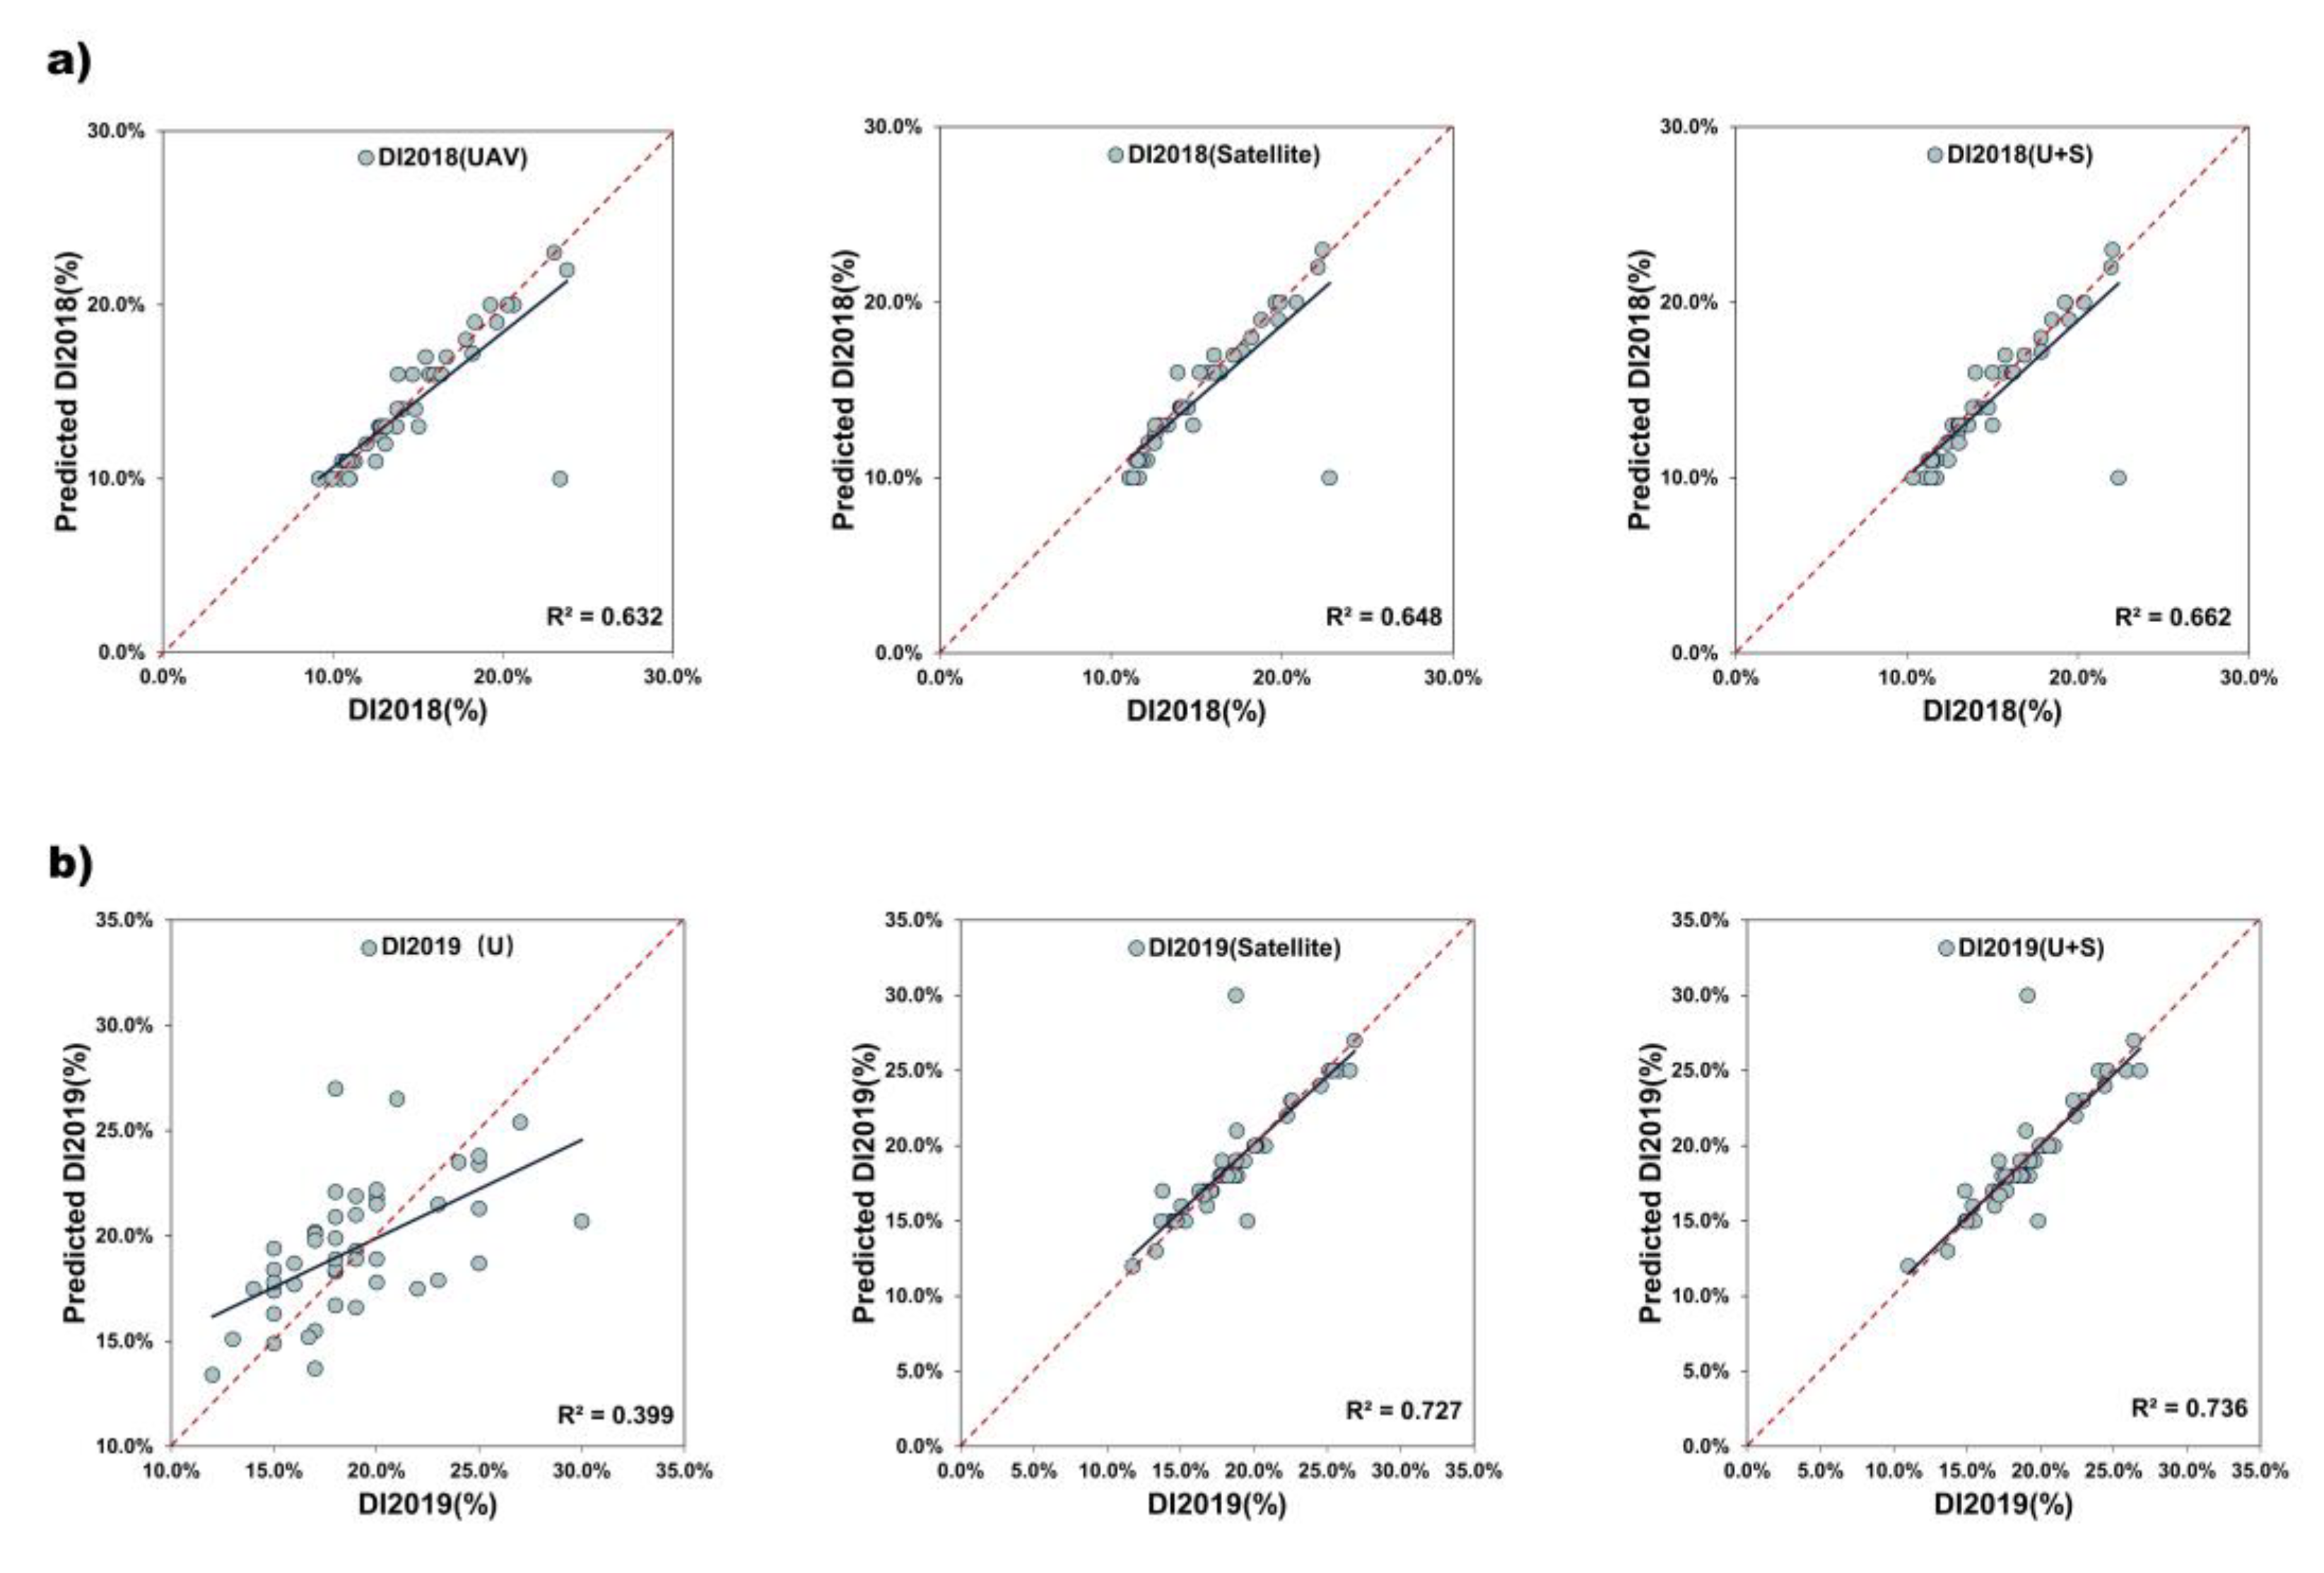
4.2. Machine Learning Modeling

Table 3 shows the relationship between the training and reference samples. It presents the mean, median, minimum, maximum, coefficient of variation (CV), kurtosis, and skewness of samples clearly. ML methods including PLSR, SVR, RFR, and SVR were used to predict DI using the UAV-derived canopy structure, satellite-based VIs, and the combination of canopy structure and VIs.
The performance of the UAV-derived canopy structure information used in the models was not ideal with R2 ranging from 0.305 to 0.432 and CV-RMSE ranging from 0.163 to 0.147. Satellite-based VIs performed better than UAV-derived information regardless of the regression model used, with R2 ranging from 0.682 to 0.728 and CV-RMSE ranging from 0.11 to 0.1. A combination of UAV-derived canopy structure and satellite-based VIs outperformed the others described, with R2 ranging from 0.69 to 0.736 and CV-RMSE ranging from 0.109 to 0.1. Table 4 provides details of the validation metrics for DI2019 estimation. In addition, canopy coverage extraction results using different methods were combined with spectral information separately. UAV-derived VFC yielded superior performance to UAV-derived CC with R2 ranging from 0.69 to 0.736 and CV-RMSE from 0.109 to 0.1. CC features presented poorer performance with R2 varying from 0.68 to 0.716 and CV-RMSE varying from 0.11 to 0.104. Although at a minor scale, VFC features slightly outperformed CC features regardless of the regression models.
In addition, Figure 12 shows the comparison of DI2018 and DI2019 prediction results by PLSR, SVR, RFR, and ELR. R2 and CV-RMSE are presented in this figure to show the accuracy of the various models. Taken as a whole, the performance of SVR was superior to other models in this study with higher R2 and lower CV-RMSE.

5. Discussion

5.1. Overall Potential of UAV Data as Alternative to Field Sampling

This study has shown that UAV data have the potential to replace field sampling in vineyards affected by pests and diseases. Since leaf damage and branch wilt are the most direct manifestations of pests and diseases for individual plants, UAV high-resolution RGB images can well reflect the phenomenon of dying canopy leaves and tree branches to evaluate the presence of grape diseases. Therefore, it is reasonable to distinguish between onset and incidence by visual interpretation. There was a strong correlation between the incidence rate and vegetation index, and the incidence decreased with increases in the vegetation index. In addition, DI calculated by UAV image interpretation can be predicted by machine learning methods over a large area.
It is worth noting that high spatial-resolution UAV data can replace field data as a more economical and convenient method to acquire large-area vineyards canopy information. Specifically, the Parrot Sequoia+ agricultural camera integrated four single spectral sensors that solved the robustness problem resulting from parallax during rectification of image pairs. This sensor is a good choice for canopy structure extraction.

5.2. Comparison of Machine Learning Models

As evidenced by high R2 and low CV-RMSE, SVR produced more accurate model in DI prediction. The SVR model has been reported to deal better with high-dimensional and overfitting datasets in previous studies [74]. In second place was the less powerful ELR, which presented superior ability to identify plant traits and perform yield prediction, especially for vineyards, with a new activation function combining Tanh and the ReLu function [33]. However, its performance was slightly inferior to SVR for DI estimation. RFR and PLSR were slightly inferior to the other models. RFR was comparable to SVR in most previous studies because both can tackle high data dimensionality, which is a strength that was also apparent in this study [75]. Although RFR has better noise tolerance, SVR has provided higher accuracies than RFR when using Sentinel-2 imagery in a few studies [76]. PLSR has limitations in dealing with nonlinear relationships between target and features, which also has been demonstrated [77].

5.3. Contributions of Different Types of Features Extracted from Multiplicity Sensors

SVR yielded the best performance for predicting DI compared to other ML models (Figure 9). Therefore, it was used to generate a prediction of DI2018 based on various input features including UAV-derived information, satellite-based VIs, and the fusion of UAV with satellite-based features.
It has already been shown that UAV-derived canopy information can improve the accuracy of predicting DI [78] (Table 5 and Figure 13). Canopy features can reflect canopy growth status and supplement satellite-based spectral information. Specifically, the contribution of VFC can be demonstrated from two important aspects: one is increasing DI along with lower VFC, and the other is that adding VFC as a supplement can reduce noise resulting from satellite-based spectral information with background soil reflectance in crop monitoring.
Among spectral variables, the most crucial VIs included ARVI, OSAVI, and red-edge bands, which were also found to be important in other studies on crop monitoring [79]. Furthermore, these variables have been reported as predictors because they are related to changes in DI and the growth status of canopy affected by pests and diseases.
Notably, test results showed that the UAV-based canopy structure input SVR for DI2019 performed poorly compared to DI2018. In addition, spectral information lightly outperformed canopy structures in the case of a single feature type. This may have been due to the relatively sparse canopy in areas of high incidence and severity in 2019. Undergrowth crops under a sparse canopy interfere with vegetation coverage. Especially for pergola crops such as grapes, there are many undergrowth crops under the canopy, which makes it difficult to distinguish the canopy from the background [22]. In addition, when the grape is seriously damaged, not only the death of branches and leaves and the growth of understory vegetation will occur, but also some physiological parameters of the canopy will change, resulting in the instability of the CH. The unstable performance of CH at different growth stage in crop monitoring has also been reported by Näsi et al. [79,80]. This may be due to a weaker correlation between UAV-derived features and DI in 2019 than in 2018 when the grapes were growing well. The error caused by undergrowth crops and the unstable performance of CH reduce the performance of high-resolution UAV data in the year 2019. By using the fusion of UAV and satellite data, the canopy structure can reduce soil reflectivity and improve performance [22,79]. However, it is still necessary to conduct experiments on how to remove understory vegetation accurately when calculating canopy coverage. Further investigation should be conducted to examine the potential/possibility of canopy structure features for crop monitoring at different development stages over different crop species and environments.

6. Conclusions

This study has demonstrated the potential of high-resolution UAV data acquired by Parrot Sequoia+ to replace manual field samples and supplement satellite-based crop monitoring. With the capability to provide high-resolution canopy features and multispectral information, the Parrot Sequoia+ camera showed itself to be an up-and-coming tool to replace field samples. It has also been shown that the fusion of UAV-derived canopy information with essential Sentinel-2 derived VIscan improve the accuracy of DI estimation using machine learning models. Among the machine learning models, SVR outperformed the others in DI prediction. Additionally, to improve the availability of canopy structures information, it may be feasible to extract accurate canopy structure through 3D transfer models or vegetation biophysical variables to reduce errors caused by understory vegetation for monitoring grapevines, and tree heights under different growth states can be studied to improve the monitoring accuracy.

Author Contributions

Conceptualization, X.Z.; Methodology, X.Z.; Validation, X.Z.; Data curation, X.Z. and B.C.; Writing—original draft preparation, X.Z.; Writing—review and editing, L.Y. and B.C.; Supervision, L.Y. and W.W.; Project administration, L.Y.; Funding acquisition, L.Y. and W.W. All authors have read and agreed to the published version of the manuscript.

Funding

This research was funded in part by The National Key Research and Development Program of China (2017YFB0504204).

Acknowledgments

The authors thank the UAV data collection team from The Research Center for UAV Application and Regulation, Chinese Academy of Sciences, Xinjiang sub center in the data collection.

Conflicts of Interest

The authors declare no conflict of interest.

References

  1. Brook, A.; De Micco, V.; Battipaglia, G.; Erbaggio, A.; Ludeno, G.; Catapano, I.; Bonfante, A. A Smart Multiple Spatial and Temporal Resolution System to Support Precision Agriculture from Satellite Images: Proof of Concept on Aglianico Vineyard. Remote Sens. Environ. 2020, 240. [Google Scholar] [CrossRef]
  2. King, P.D.; Smart, R.E.; McClellan, D.J. Timing of Crop Removal Has Limited Effect on Merlot Grape and Wine Composition. Agric. Sci. 2015, 6, 456–465. [Google Scholar] [CrossRef] [Green Version]
  3. Meggio, F.; Zarco-Tejada, P.J.; Núñez, L.C.; Sepulcre-Cantó, G.; González, M.R.; Martín, P. Grape Quality Assessment in Vineyards Affected by Iron Deficiency Chlorosis Using Narrow-Band Physiological Remote Sensing Indices. Remote Sens. Environ. 2010, 114, 1968–1986. [Google Scholar] [CrossRef] [Green Version]
  4. Oerke, E.C. Crop Losses to Pests. J. Agric. Sci. 2005, 144, 31–43. [Google Scholar] [CrossRef]
  5. Jasrotia, P.; Yadav, J.; Lal Kashyap, P.; Kumar Bhardwaj, A.; Kumar, S.; Singh, G.P. Chapter 13—Impact of Climate Change on Insect Pests of Rice–Wheat Cropping System: Recent Trends and Mitigation Strategies. In Improving Cereal Productivity Through Climate Smart Practices; Sareen, S., Sharma, P., Singh, C., Jasrotia, P., Pratap Singh, G., Sarial, A.K., Eds.; Woodhead Publishing: Sawston, UK, 2021; pp. 225–239. [Google Scholar] [CrossRef]
  6. Zhang, J.; Pu, R.; Huang, W.; Yuan, L.; Luo, J.; Wang, J. Using In-Situ Hyperspectral Data for Detecting and Discriminating Yellow Rust Disease from Nutrient Stresses. Field Crops Res. 2012, 134, 165–174. [Google Scholar] [CrossRef]
  7. Grisham, M.P.; Johnson, R.M.; Zimba, P.V. Detecting Sugarcane Yellow Leaf Virus Infection in Asymptomatic Leaves with Hyperspectral Remote Sensing and Associated Leaf Pigment Changes. J. Virol. Methods 2010, 167, 140–145. [Google Scholar] [CrossRef]
  8. Aktar, W.; Sengupta, D.; Chowdhury, A. Impact of Pesticides Use in Agriculture: Their Benefits and Hazards. Interdiscip. Toxicol. 2009, 2, 1–12. [Google Scholar] [CrossRef] [Green Version]
  9. Muneret, L.; Thiéry, D.; Joubard, B.; Rusch, A.; McKenzie, A. Deployment of Organic Farming at a Landscape Scale Maintains Low Pest Infestation and High Crop Productivity Levels in Vineyards. J. Appl. Ecol. 2018, 55, 1516–1525. [Google Scholar] [CrossRef]
  10. Rodríguez-San Pedro, A.; Allendes, J.L.; Beltrán, C.A.; Chaperon, P.N.; Saldarriaga-Córdoba, M.M.; Silva, A.X.; Grez, A.A. Quantifying Ecological and Economic Value of Pest Control Services Provided by Bats in a Vineyard Landscape of Central Chile. Agric. Ecosyst. Environ. 2020, 302, 107063. [Google Scholar] [CrossRef]
  11. Ramoelo, A.; Dzikiti, S.; van Deventer, H.; Maherry, A.; Cho, M.A.; Gush, M. Potential to Monitor Plant Stress Using Remote Sensing Tools. J. Arid Environ. 2015, 113, 134–144. [Google Scholar] [CrossRef]
  12. Weiss, M.; Jacob, F.; Duveiller, G. Remote Sensing for Agricultural Applications: A meta-Review. Remote Sens. Environ. 2020, 236. [Google Scholar] [CrossRef]
  13. Seelig, H.D.; Hoehn, A.; Stodieck, L.S.; Klaus, D.M.; Adams, W.W.; Emery, W.J. Relations of Remote Sensing Leaf Water Indices to Leaf Water Thickness in Cowpea, Bean, and Sugarbeet Plants. Remote Sens. Environ. 2008, 112, 445–455. [Google Scholar] [CrossRef]
  14. Maimaitijiang, M.; Ghulam, A.; Sidike, P.; Hartling, S.; Maimaitiyiming, M.; Peterson, K.; Shavers, E.; Fishman, J.; Peterson, J.; Kadam, S.; et al. Unmanned Aerial System (UAS)-Based Phenotyping of Soybean Using Multi-Sensor Data Fusion and Extreme Learning Machine. ISPRS J. Photogramm. Remote Sens. 2017, 134, 43–58. [Google Scholar] [CrossRef]
  15. Sagan, V.; Maimaitijiang, M.; Sidike, P.; Maimaitiyiming, M.; Erkbol, H.; Hartling, S.; Peterson, K.T.; Peterson, J.; Burken, J.; Fritschi, F. Uav/Satellite Multiscale Data Fusion for Crop Monitoring and Early Stress Detection. ISPRS Int. Arch. Photogramm. Remote Sens. Spat. Inf. Sci. 2019, XLII-2/W13, 715–722. [Google Scholar] [CrossRef] [Green Version]
  16. Mutanga, O.; Dube, T.; Galal, O. Remote Sensing of Crop Health for Food Security in Africa: Potentials and Constraints. Remote Sens. Appl. Soc. Environ. 2017, 8, 231–239. [Google Scholar] [CrossRef]
  17. Vuolo, F.; Żółtak, M.; Pipitone, C.; Zappa, L.; Wenng, H.; Immitzer, M.; Weiss, M.; Frederic, B.; Atzberger, C. Data Service Platform for Sentinel-2 Surface Reflectance and Value-Added Products: System Use and Examples. Remote Sens. 2016, 8, 938. [Google Scholar] [CrossRef] [Green Version]
  18. Khaliq, A.; Comba, L.; Biglia, A.; Ricauda Aimonino, D.; Chiaberge, M.; Gay, P. Comparison of Satellite and UAV-Based Multispectral Imagery for Vineyard Variability Assessment. Remote Sens. 2019, 11, 436. [Google Scholar] [CrossRef] [Green Version]
  19. Moeckel, T.; Safari, H.; Reddersen, B.; Fricke, T.; Wachendorf, M. Fusion of Ultrasonic and Spectral Sensor Data for Improving the Estimation of Biomass in Grasslands with Heterogeneous Sward Structure. Remote Sens. 2017, 9, 98. [Google Scholar] [CrossRef] [Green Version]
  20. Wang, R.; Gamon, J.A. Remote Sensing of Terrestrial Plant Biodiversity. Remote Sens. Environ. 2019, 231. [Google Scholar] [CrossRef]
  21. Wang, C.; Nie, S.; Xi, X.; Luo, S.; Sun, X. Estimating the Biomass of Maize with Hyperspectral and LiDAR Data. Remote Sens. 2016, 9, 11. [Google Scholar] [CrossRef] [Green Version]
  22. Hornero, A.; Hernández-Clemente, R.; North, P.R.J.; Beck, P.S.A.; Boscia, D.; Navas-Cortes, J.A.; Zarco-Tejada, P.J. Monitoring the Incidence of Xylella fastidiosa Infection in Olive Orchards Using Ground-Based Evaluations, Airborne Imaging Spectroscopy and Sentinel-2 Time Series Through 3-D Radiative Transfer Modelling. Remote Sens. Environ. 2020, 236. [Google Scholar] [CrossRef]
  23. Sepulcre-Cantó, G.; Zarco-Tejada, P.J.; Jiménez-Muñoz, J.C.; Sobrino, J.A.; Soriano, M.A.; Fereres, E.; Vega, V.; Pastor, M. Monitoring Yield and Fruit Quality Parameters in Open-Canopy Tree Crops under Water Stress. Implications for ASTER. Remote Sens. Environ. 2007, 107, 455–470. [Google Scholar] [CrossRef]
  24. Xu, F.; Gao, Z.; Jiang, X.; Shang, W.; Ning, J.; Song, D.; Ai, J. A UAV and S2A Data-Based Estimation of the Initial Biomass of Green Algae in the South Yellow Sea. Mar. Pollut. Bull. 2018, 128, 408–414. [Google Scholar] [CrossRef] [PubMed]
  25. Serrano, L.; González-Flor, C.; Gorchs, G. Assessment of Grape Yield and Composition Using the Reflectance Based Water Index in Mediterranean Rainfed Vineyards. Remote Sens. Environ. 2012, 118, 249–258. [Google Scholar] [CrossRef] [Green Version]
  26. Pla, M.; Bota, G.; Duane, A.; Balagué, J.; Curcó, A.; Gutiérrez, R.; Brotons, L. Calibrating Sentinel-2 Imagery with Multispectral UAV Derived Information to Quantify Damages in Mediterranean Rice Crops Caused by Western Swamphen (Porphyrio porphyrio). Drones 2019, 3, 45. [Google Scholar] [CrossRef] [Green Version]
  27. Rischbeck, P.; Elsayed, S.; Mistele, B.; Barmeier, G.; Heil, K.; Schmidhalter, U. Data Fusion of Spectral, Thermal and Canopy Height Parameters for Improved Yield Prediction of Drought Stressed Spring Barley. Eur. J. Agron. 2016, 78, 44–59. [Google Scholar] [CrossRef]
  28. Kattenborn, T.; Lopatin, J.; Förster, M.; Braun, A.C.; Fassnacht, F.E. UAV Data as Alternative to Field Sampling to Map Woody Invasive Species Based on Combined Sentinel-1 and Sentinel-2 Data. Remote Sens. Environ. 2019, 227, 61–73. [Google Scholar] [CrossRef]
  29. Ordóñez Galán, C.; Rodríguez Pérez, J.R.; García Cortés, S.; Bernardo Sánchez, A. Analysis of the Influence of Forestry Environments on the Accuracy of GPS Measurements by Means of Recurrent Neural Networks. Math. Comput. Model. 2013, 57, 2016–2023. [Google Scholar] [CrossRef]
  30. Wing, M.G.; Frank, J. Vertical Measurement Accuracy and Reliability of Mapping-Grade GPS Receivers. Comput. Electron. Agric. 2011, 78, 188–194. [Google Scholar] [CrossRef]
  31. Turner, W. Sensing Biodiversity. Science 2014, 346, 301–302. [Google Scholar] [CrossRef]
  32. Leitao, P.J.; Schwieder, M.; Pötzschner, F.; Pinto, J.R.R.; Teixeira, A.M.C.; Pedroni, F.; Sanchez, M.; Rogass, C.; van der Linden, S.; Bustamante, M.M.C.; et al. From Sample to Pixel: Multi-Scale Remote Sensing Data for Upscaling Aboveground Carbon Data in Heterogeneous Landscapes; Humboldt-Universität zu Berlin: Berlin, Germany, 2018. [Google Scholar] [CrossRef]
  33. Maimaitiyiming, M.; Sagan, V.; Sidike, P.; Kwasniewski, M. Dual Activation Function-Based Extreme Learning Machine (ELM) for Estimating Grapevine Berry Yield and Quality. Remote Sens. 2019, 11, 740. [Google Scholar] [CrossRef] [Green Version]
  34. Margenot, A.; O’Neill, T.; Sommer, R.; Akella, V. Predicting Soil Permanganate Oxidizable Carbon (POXC) by Coupling DRIFT Spectroscopy and Artificial Neural Networks (ANN). Comput. Electron. Agric. 2020, 168. [Google Scholar] [CrossRef]
  35. Loozen, Y.; Rebel, K.T.; de Jong, S.M.; Lu, M.; Ollinger, S.V.; Wassen, M.J.; Karssenberg, D. Mapping Canopy Nitrogen in European Forests Using Remote Sensing and Environmental Variables with the Random Forests Method. Remote Sens. Environ. 2020, 247, 111933. [Google Scholar] [CrossRef]
  36. Were, K.; Bui, D.T.; Dick, Ø.B.; Singh, B.R. A Comparative Assessment of Support Vector Regression, Artificial Neural Networks, and Random Forests for Predicting and Mapping Soil Organic Carbon Stocks across an Afromontane Landscape. Ecol. Indic. 2015, 52, 394–403. [Google Scholar] [CrossRef]
  37. Huang, G.-B.; Zhu, Q.-Y.; Siew, C.-K. Extreme Learning Machine: Theory and Applications. Neurocomputing 2006, 70, 489–501. [Google Scholar] [CrossRef]
  38. Meacham-Hensold, K.; Montes, C.M.; Wu, J.; Guan, K.; Fu, P.; Ainsworth, E.A.; Pederson, T.; Moore, C.E.; Brown, K.L.; Raines, C.; et al. High-Throughput Field Phenotyping Using Hyperspectral Reflectance and Partial Least Squares Regression (PLSR) Reveals Genetic Modifications to Photosynthetic Capacity. Remote Sens. Environ. 2019, 231. [Google Scholar] [CrossRef]
  39. Maimaitijiang, M.; Sagan, V.; Sidike, P.; Hartling, S.; Esposito, F.; Fritschi, F.B. Soybean Yield Prediction from UAV Using Multimodal Data Fusion and Deep Learning. Remote Sens. Environ. 2020, 237. [Google Scholar] [CrossRef]
  40. Cardoso, J.; Santos, A.A.; Rossetti, A.; Vidal, J. Relationship between Incidence and Severity of Cashew Gummosis in Semiarid North-Eastern Brazil. Plant Pathol. 2004, 53, 363–367. [Google Scholar] [CrossRef]
  41. Carisse, O.; Lefebvre, A.; Heyden, H.; Roberge, L.; Brodeur, L. Analysis of Incidence–Severity Relationships for Strawberry Powdery Mildew as Influenced by Cultivar, Cultivar Type, and Production Systems. Plant Dis. 2013, 97, 354–362. [Google Scholar] [CrossRef] [Green Version]
  42. Govorcin, M.; Pribicevic, B.; Đapo, A. Comparison and Analysis of Software Solutions for Creation of a Digital Terrain Model Using Unmanned Aerial Vehicles. In Proceedings of the 14th International Multidisciplinary Scientific GeoConference SGEM 2014, Albena, Bulgaria, 17–26 June 2014. [Google Scholar] [CrossRef]
  43. Cubero-Castan, M.; Schneider-Zapp, K.; Bellomo, M.; Shi, D.; Rehak, M.; Strecha, C. Assessment of the Radiometric Accuracy in a Target Less Work Flow Using Pix4D Software. In Proceedings of the 2018 9th Workshop on Hyperspectral Image and Signal Processing: Evolution in Remote Sensing (WHISPERS), Amsterdam, The Netherlands, 23–26 September 2018; pp. 1–4. [Google Scholar]
  44. Generate High Resolution Outputs for Any Project and Use Case. Available online: https://www.pix4d.com/product/pix4dmapper-photogrammetry-software (accessed on 27 January 2021).
  45. Deng, L.; Mao, Z.; Li, X.; Hu, Z.; Duan, F.; Yan, Y. UAV-Based Multispectral Remote Sensing for Precision Agriculture: A Comparison between Different Cameras. ISPRS J. Photogramm. Remote Sens. 2018, 146, 124–136. [Google Scholar] [CrossRef]
  46. Matese, A.; Di Gennaro, S.; Berton, A. Assessment of a Canopy Height Model (CHM) in a Vineyard Using UAV-Based Multispectral Imaging. Int. J. Remote Sens. 2016, 38, 1–11. [Google Scholar] [CrossRef]
  47. Wilke, N.; Siegmann, B.; Klingbeil, L.; Burkart, A.; Kraska, T.; Muller, O.; van Doorn, A.; Heinemann, D.G.S. Quantifying Lodging Percentage and Lodging Severity Using a UAV-Based Canopy Height Model Combined with an Objective Threshold Approach. Remote Sens. 2019, 11, 515. [Google Scholar] [CrossRef] [Green Version]
  48. Panagiotidis, D.; Abdollahnejad, A.; Surovy, P.; Chiteculo, V. Determining Tree Height and Crown Diameter from High-Resolution UAV Imagery. Int. J. Remote Sens. 2017, 38. [Google Scholar] [CrossRef]
  49. Tzotsos, A.; Argialas, D. Support Vector Machine Classification for Object-Based Image Analysis. In Lecture Notes in Geoinformation and Cartography; Springer Nature: Cham, Switzerland, 2008; pp. 663–677. [Google Scholar] [CrossRef]
  50. Wan, L.; Cen, H.; Zhu, J.; Zhang, J.; Zhu, Y.; Sun, D.; Du, X.; Zhai, L.; Weng, H.; Li, Y.; et al. Grain Yield Prediction of Rice Using Multi-Temporal UAV-Based RGB and Multispectral Images and Model Transfer—A Case Study of Small Farmlands in the South of China. Agric. For. Meteorol. 2020, 291. [Google Scholar] [CrossRef]
  51. Schirrmann, M.; Giebel, A.; Gleiniger, F.; Pflanz, M.; Lentschke, J.; Dammer, K.-H. Monitoring Agronomic Parameters of Winter Wheat Crops with Low-Cost UAV Imagery. Remote Sens. 2016, 8, 706. [Google Scholar] [CrossRef] [Green Version]
  52. Song, Y.; Lu, Y.; Liu, T.; Li, H.; Yue, Z.; Liu, H.; Gao, T. Variation of Vegetation Fractional Coverage and Its Relationship with Climate in a Desert Steppe: Optimization of Farmland Layout in a Farming–Pastoral Ecotone Using the Ecological Suitability Index. Ecol. Eng. 2020, 150, 105834. [Google Scholar] [CrossRef]
  53. Tong, S.; Zhang, J.; Ha, S.; Lai, Q.; Ma, Q. Dynamics of Fractional Vegetation Coverage and Its Relationship with Climate and Human Activities in Inner Mongolia, China. Remote Sens. 2016, 8, 776. [Google Scholar] [CrossRef] [Green Version]
  54. Wang, Y.; Sun, M.; Song, B. Public Perceptions of and Willingness to Pay for Sponge City Initiatives in China. Resour. Conserv. and Recycl. 2017, 122, 11–20. [Google Scholar] [CrossRef]
  55. Jönsson, P.; Eklundh, L. Seasonality Extraction by Function Fitting to Time-Series of Satellite Sensor Data. IEEE Trans. Geosci. Remote Sens. 2002, 40, 1824–1832. [Google Scholar] [CrossRef]
  56. Chauhan, S.; Darvishzadeh, R.; Boschetti, M.; Pepe, M.; Nelson, A. Remote Sensing-Based Crop Lodging Assessment: Current Status and Perspectives. ISPRS J. Photogramm. Remote Sens. 2019, 151, 124–140. [Google Scholar] [CrossRef] [Green Version]
  57. Gitelson, A.; Kaufman, Y.; Merzlyak, M. Use of a Green Channel in Remote Sensing of Global Vegetation from EOS-MODIS. Remote Sens. Environ. 1996, 58, 289–298. [Google Scholar] [CrossRef]
  58. Roujean, J.-L.; Breon, F.-M. Estimating PAR Absorbed by Vegetation from Bidirectional Reflectance Measurements. Remote Sens. Environ. 1995, 51, 375–384. [Google Scholar] [CrossRef]
  59. Chen, J.M. Evaluation of Vegetation Indices and a Modified Simple Ratio for Boreal Applications. Can. J. Remote Sens. 1996, 22, 229–242. [Google Scholar] [CrossRef]
  60. Haboudane, D.; Miller, J.R.; Tremblay, N.; Zarco-Tejada, P.J.; Dextraze, L. Integrated Narrow-Band Vegetation Indices for Prediction of Crop Chlorophyll Content for Application to Precision Agriculture. Remote Sens. Environ. 2002, 81, 416–426. [Google Scholar] [CrossRef]
  61. Qi, J.; Chehbouni, A.; Huete, A.R.; Kerr, Y.H.; Sorooshian, S. A Modified Soil Adjusted Vegetation Index. Remote Sens. Environ. 1994, 48, 119–126. [Google Scholar] [CrossRef]
  62. Nichol, C.J.; Huemmrich, K.F.; Black, T.A.; Jarvis, P.G.; Walthall, C.L.; Grace, J.; Hall, F.G. Remote Sensing of Photosynthetic-light-Use Efficiency of Boreal Forest. Agric. For. Meteorol. 2000, 101, 131–142. [Google Scholar] [CrossRef] [Green Version]
  63. Zarco-Tejada, P.J.; Miller, J.R.; Mohammed, G.H.; Noland, T.L.; Sampson, P.H. Estimation of Chlorophyll Fluorescence under Natural Illumination from Hyperspectral data. Int. J. Appl. Earth Obs. Geoinf. 2001, 3, 321–327. [Google Scholar] [CrossRef] [Green Version]
  64. Frampton, W.J.; Dash, J.; Watmough, G.; Milton, E.J. Evaluating the Capabilities of Sentinel-2 for Quantitative Estimation of Biophysical Variables in Vegetation. ISPRS J. Photogramm. Remote Sens. 2013, 82, 83–92. [Google Scholar] [CrossRef] [Green Version]
  65. Blackburn, G.A. Spectral Indices for Estimating Photosynthetic Pigment Concentrations: A Test Using Senescent Tree Leaves. Int. J. Remote Sens. 1998, 19, 657–675. [Google Scholar] [CrossRef]
  66. Hunt, E.R.; Daughtry, C.S.T.; Eitel, J.U.H.; Long, D.S. Remote Sensing Leaf Chlorophyll Content Using a Visible Band Index. Agron. J. 2011, 103, 1090–1099. [Google Scholar] [CrossRef] [Green Version]
  67. Merzlyak, M.N.G.; Anatoly, A.; Chivkunova, O.B.; Rakitin, V.Y. Non-Destructive Optical Detection of Pigment Changes during Leaf Senescence and Fruit Ripening. Physiol. Plant. 1999, 106, 135–141. [Google Scholar] [CrossRef] [Green Version]
  68. Yeniay, Ö.; Goktas, A. A Comparison of Partial Least Squares Regression with Other Prediction Methods. Hacet. J. Math. Stat. 2002, 31, 99–111. [Google Scholar]
  69. Genuer, R.; Poggi, J.-M. Random Forests with R; Springer: Berlin, Germany, 2020; pp. 33–55. [Google Scholar] [CrossRef]
  70. Gholizadeh, A.; Boruvka, L.; Saberioon, M.; Vašát, R. A Memory-Based Learning Approach as Compared to Other Data Mining Algorithms for the Prediction of Soil Texture Using Diffuse Reflectance Spectra. Remote Sens. 2016, 8, 341. [Google Scholar] [CrossRef] [Green Version]
  71. Walker, S.; Khan, W.; Katic, K.; Maassen, W.; Zeiler, W. Accuracy of Different Machine Learning Algorithms and Added-Value of Predicting Aggregated-Level Energy Performance of Commercial Buildings. Energy Build. 2020, 209. [Google Scholar] [CrossRef]
  72. Johansen, K.; Raharjo, T.; McCabe, M. Using Multi-Spectral UAV Imagery to Extract Tree Crop Structural Properties and Assess Pruning Effects. Remote Sens. 2018, 10, 854. [Google Scholar] [CrossRef] [Green Version]
  73. Steven, M. The Sensitivity of the OSAVI Vegetation Index to Observational Parameters. Remote Sens. Environ. 1998, 63, 49–60. [Google Scholar] [CrossRef]
  74. Xiao, X.; Zhang, T.; Zhong, X.; Shao, W.; Li, X. Support Vector Regression Snow-Depth Retrieval Algorithm Using Passive Microwave Remote Sensing Data. Remote Sens. Environ. 2018, 210, 48–64. [Google Scholar] [CrossRef]
  75. Rodriguez-Galiano, V.; Sánchez Castillo, M.; Chica-Olmo, M.; Chica Rivas, M. Machine Learning Predictive Models for Mineral Prospectivity: An Evaluation of Neural Networks, Random Forest, Regression Trees and Support Vector Machines. Ore Geol. Rev. 2015, 71. [Google Scholar] [CrossRef]
  76. Grabska, E.; Frantz, D.; Ostapowicz, K. Evaluation of Machine Learning Algorithms for Forest Stand Species Mapping Using Sentinel-2 Imagery and Environmental Data in the Polish Carpathians. Remote Sens. Environ. 2020, 251. [Google Scholar] [CrossRef]
  77. Pullanagari, R.R.; Kereszturi, G.; Yule, I.J. Mapping of Macro and Micro Nutrients of Mixed Pastures Using Airborne AisaFENIX Hyperspectral Imagery. ISPRS J. Photogramm. Remote Sens. 2016, 117, 1–10. [Google Scholar] [CrossRef]
  78. Stanton, C.; Starek, M.J.; Elliott, N.; Brewer, M.; Maeda, M.M.; Chu, T. Unmanned Aircraft System-Derived Crop Height and Normalized Difference Vegetation Index Metrics for Sorghum Yield and Aphid Stress Assessment. J. Appl. Remote Sens. 2017, 11. [Google Scholar] [CrossRef] [Green Version]
  79. Maimaitijiang, M.; Sagan, V.; Sidike, P.; Daloye, A.M.; Erkbol, H.; Fritschi, F.B. Crop Monitoring Using Satellite/UAV Data Fusion and Machine Learning. Remote Sens. 2020, 12, 1357. [Google Scholar] [CrossRef]
  80. Näsi, R.; Viljanen, N.; Kaivosoja, J.; Alhonoja, K.; Hakala, T.; Markelin, L.; Honkavaara, E. Estimating Biomass and Nitrogen Amount of Barley and Grass Using UAV and Aircraft Based Spectral and Photogrammetric 3D Features. Remote Sens. 2018, 10, 1082. [Google Scholar] [CrossRef] [Green Version]
Figure 1. The top image area A covered by a light red mask shows the unmanned aerial vehicle (UAV) sampling region in Gaochang zone of Turpan, and area B shows RGB mosaics over a Sentinel-2A tile, and C is a 6-cm spatial resolution image acquired on 16 May 2019. Multispectral images were acquired on the same day and covered the same area. The bottom image area covered by a light red mask shows the locations of the observed field plots.
Remotesensing 13 00457 g001
Figure 2. Distribution of vegetation fraction and soil and shadow: (a) shows the whole field; (b) and (c) show a small area of the field in the red box.
Remotesensing 13 00457 g002
Figure 3. A workflow chart including data preprocessing, feature extraction, machine learning modeling, and analysis.
Remotesensing 13 00457 g003
Figure 4. Comparison of measured canopy height from 22 vineyards on 23 May 2019.
Remotesensing 13 00457 g004
Figure 5. Example of vineyards with different pests and diseases incidences viewed by a high-resolution RGB camera and Sentinel-2. (Left) panels show medium incidence, and (right) panels show a healthy vineyard.
Remotesensing 13 00457 g005
Figure 6. The left image is a comparison between NDVI derived from Sentinel_2 and Parrot Sequoia+. The right image is a comparison between OSAVI based on Sentinel_2A and Parrot Sequoia+ surveyed in May 2019.
Remotesensing 13 00457 g006
Figure 7. (Top) Disease severity (DS) and disease incidence (DI) in 2019 derived from high-resolution RGB images. The X-axis indicates the vineyards sampled, which were labeled from A1 to A148. Due to lack of space, not all labels are shown.
Remotesensing 13 00457 g007
Figure 8. (bottom) ∆DS and ∆DI between 2018 and 2019. The X-axis indicates the vineyards sampled, which were labeled from A1 to A148. Due to lack of space, not all labels are shown.
Remotesensing 13 00457 g008
Figure 9. Relationship between ΔDI, ΔDS, and the temporal rate of change in VI. The range co-domain of the correlation coefficients is shown in the color bar. (X) symbols represent non-significant relationships (p ≥ 0.001).
Remotesensing 13 00457 g009
Figure 10. Relationship between ΔDI and temporal rate of change in VIs: ARVI (a), OSAVI (b), GNDVI (c).
Remotesensing 13 00457 g010
Figure 11. Relationship between DI2019 and vegetation indexes (VIs). The range co-domain of the correlation coefficients is shown in the color bar. (X) symbols represent non-significant relationships (p ≥ 0.001).
Remotesensing 13 00457 g011
Figure 12. R2 and coefficient of variance of the root mean square error (CV-RMSE) of DI2018 and DI2019 estimates with different machine learning methods using UAV-derived canopy information (U), satellite-based spectral information (S), and the fusion of both (U + S).
Remotesensing 13 00457 g012
Figure 13. Cross-validation of measuring against SVR-based results. The red line is the bisector, and the black line is trendline. (a) shows Cross-validation of measuring against SVR-based results for DI2018. (b) shows Cross-validation of measuring against SVR-based results for DI2019.
Remotesensing 13 00457 g013
Table 1. Pests and diseases evaluation criteria.
DS LevelSeveritySymptomDamaged AreaIncidence
0HealthySymptomless0%No Incidence
1Initial Leaves became brown and curled up0%–25%Incidence
2MediumCanopy with a small portion of dead branches and brown leaves25%–45%Incidence
3HighCanopy with a large area of dead branches 45%–65%Incidence
4Very highDead canopy>65%Incidence
Table 2. Description of spectral features derived from Sentinel-2.
Vegetation IndexEquationReference
Normalized Difference Vegetation Index NDVI = R 800 R 670 R 800 + R 670 [56]
Green Normalized Difference Vegetation Index GNDIV = R 800 R 550 R 800 + R 550 [57]
Renormalized Difference Vegetation Index RDVI = R 800 R 670 ( R 800 + R 670 ) [58]
Modified Simple Ratio MSR = R 800 / R 670 1 ( R 800 / R 670 ) [59]
Transformed NDVI TNDVI = ( R 800 R 670 ) / ( R 800 + R 670 ) + 0.5 [59]
Normalized Difference Index NDI = ( R 706 R 664 ) / ( R 706 + R 664 ) [60]
Optimized Soil-Adjusted Vegetation Index OSAVI = ( 1 + 0.16 ) R 800 R 670 R 800 + R 670 + 0.16 [59]
Modified Soil-Adjusted Vegetation Index MSAVI = ( 1 + L ) R 800 R 670 R 800 + R 670 + L [61]
Atmospherically Resistant Vegetation Index ARVI = R 800 R 670 y ( R 670 R 450 ) R 800 + R 670 y ( R 670 R 450 ) [62]
Chlorophyll Index   CI = R 750 R 710 [63]
Inverted Red-Edge Chlorophyll Index IRECI = ( R 783 R 665 ) / ( R 705 + R 740 ) [64]
Pigment Specific Simple Ratio A PSSra = R 800 R 680 [65]
Sentinel-2 Red Edge Position S 2 REP = 705 + 35 * ( ( R 783 + R 665 ) / 2 R 705 ) / ( R 740 R 705 ) [65]
Transformed Chlorophyll Absorption Ratio Index TCARI = 3 ( ( R 700 R 670 ) 0.2 ( R 700 R 550 ) R 700 R 670 ) [60]
Modified Chlorophyll Absorption Ratio Index MCARI = [ ( R 700 R 665 ) 0.2 * ( R 705 R 550 ) ] * ( R 700 / R 670 ) [66]
TCARI/OSAVI TCARI OSAVI = TCARI / OSAVI [60]
Plant Senescence Reflectance Index PSRI = R 678 R 500 R 750 [67]
Table 3. Statistical data of training and reference samples for the study area.
D I 2019 ( % ) All SamplesTrainingReference
No. of Samples14410044
Mean19.319.418.9
Median181818
Minimum121212
Maximum393939
Kurtosis4.0505.3430.711
Skewness1.4971.7840.849
CV0.2050.2070.197
Table 4. Predictions of results from partial least squared regression (PLSR), support vector regression (SVR), random forest regression (RFR), and extreme learning regression (ELR) based on different features.
PlatformMetricRSLRSVRRFRELR
Parrot Sequoia+
(CH, VFC)
R20.4320.3990.3050.432
RMSE2.7852.8633.0782.785
CV-RMSE0.1470.1510.1630.147
Satellite
(VI)
R20.7060.7280.6820.709
RMSE2.0091.9252.0831.989
CV-RMSE0.1060.10.110.105
Satellite+
Parrot Sequoia+
(CH, VFC, VI)
R20.710.7360.690.723
RMSE1.9821.8982.0571.946
CV-RMSE0.1050.10.1090.103
Satellite+
RGB
(CH,CC,VI)
R20.690.7160.680.69
RMSE2.0581.972.0762.058
CV-RMSE0.1090.1040.110.109
Table 5. Results for DI2018 and DI2019 using support vector regression (SVR) estimation.
PlatformMetricDI2018DI2019
Parrot Sequoia+
(CH, VFC)
R20.6320.399
RMSE2.112.863
CV-RMSE0.1480.151
Satellite
(VI)
R20.6480.727
RMSE2.0661.928
CV-RMSE0.1450.102
Satellite+
Parrot Sequoia+
(CH, VFC, VI)
R20.6620.736
RMSE2.0241.898
CV-RMSE0.1420.1
Publisher’s Note: MDPI stays neutral with regard to jurisdictional claims in published maps and institutional affiliations.

