
Interdecadal Changes in Aerosol Optical Depth over Pakistan Based on the MERRA-2 Reanalysis Data during 1980–2018

 , , , and
Abstract
:
1. Introduction
2. Data and Methods
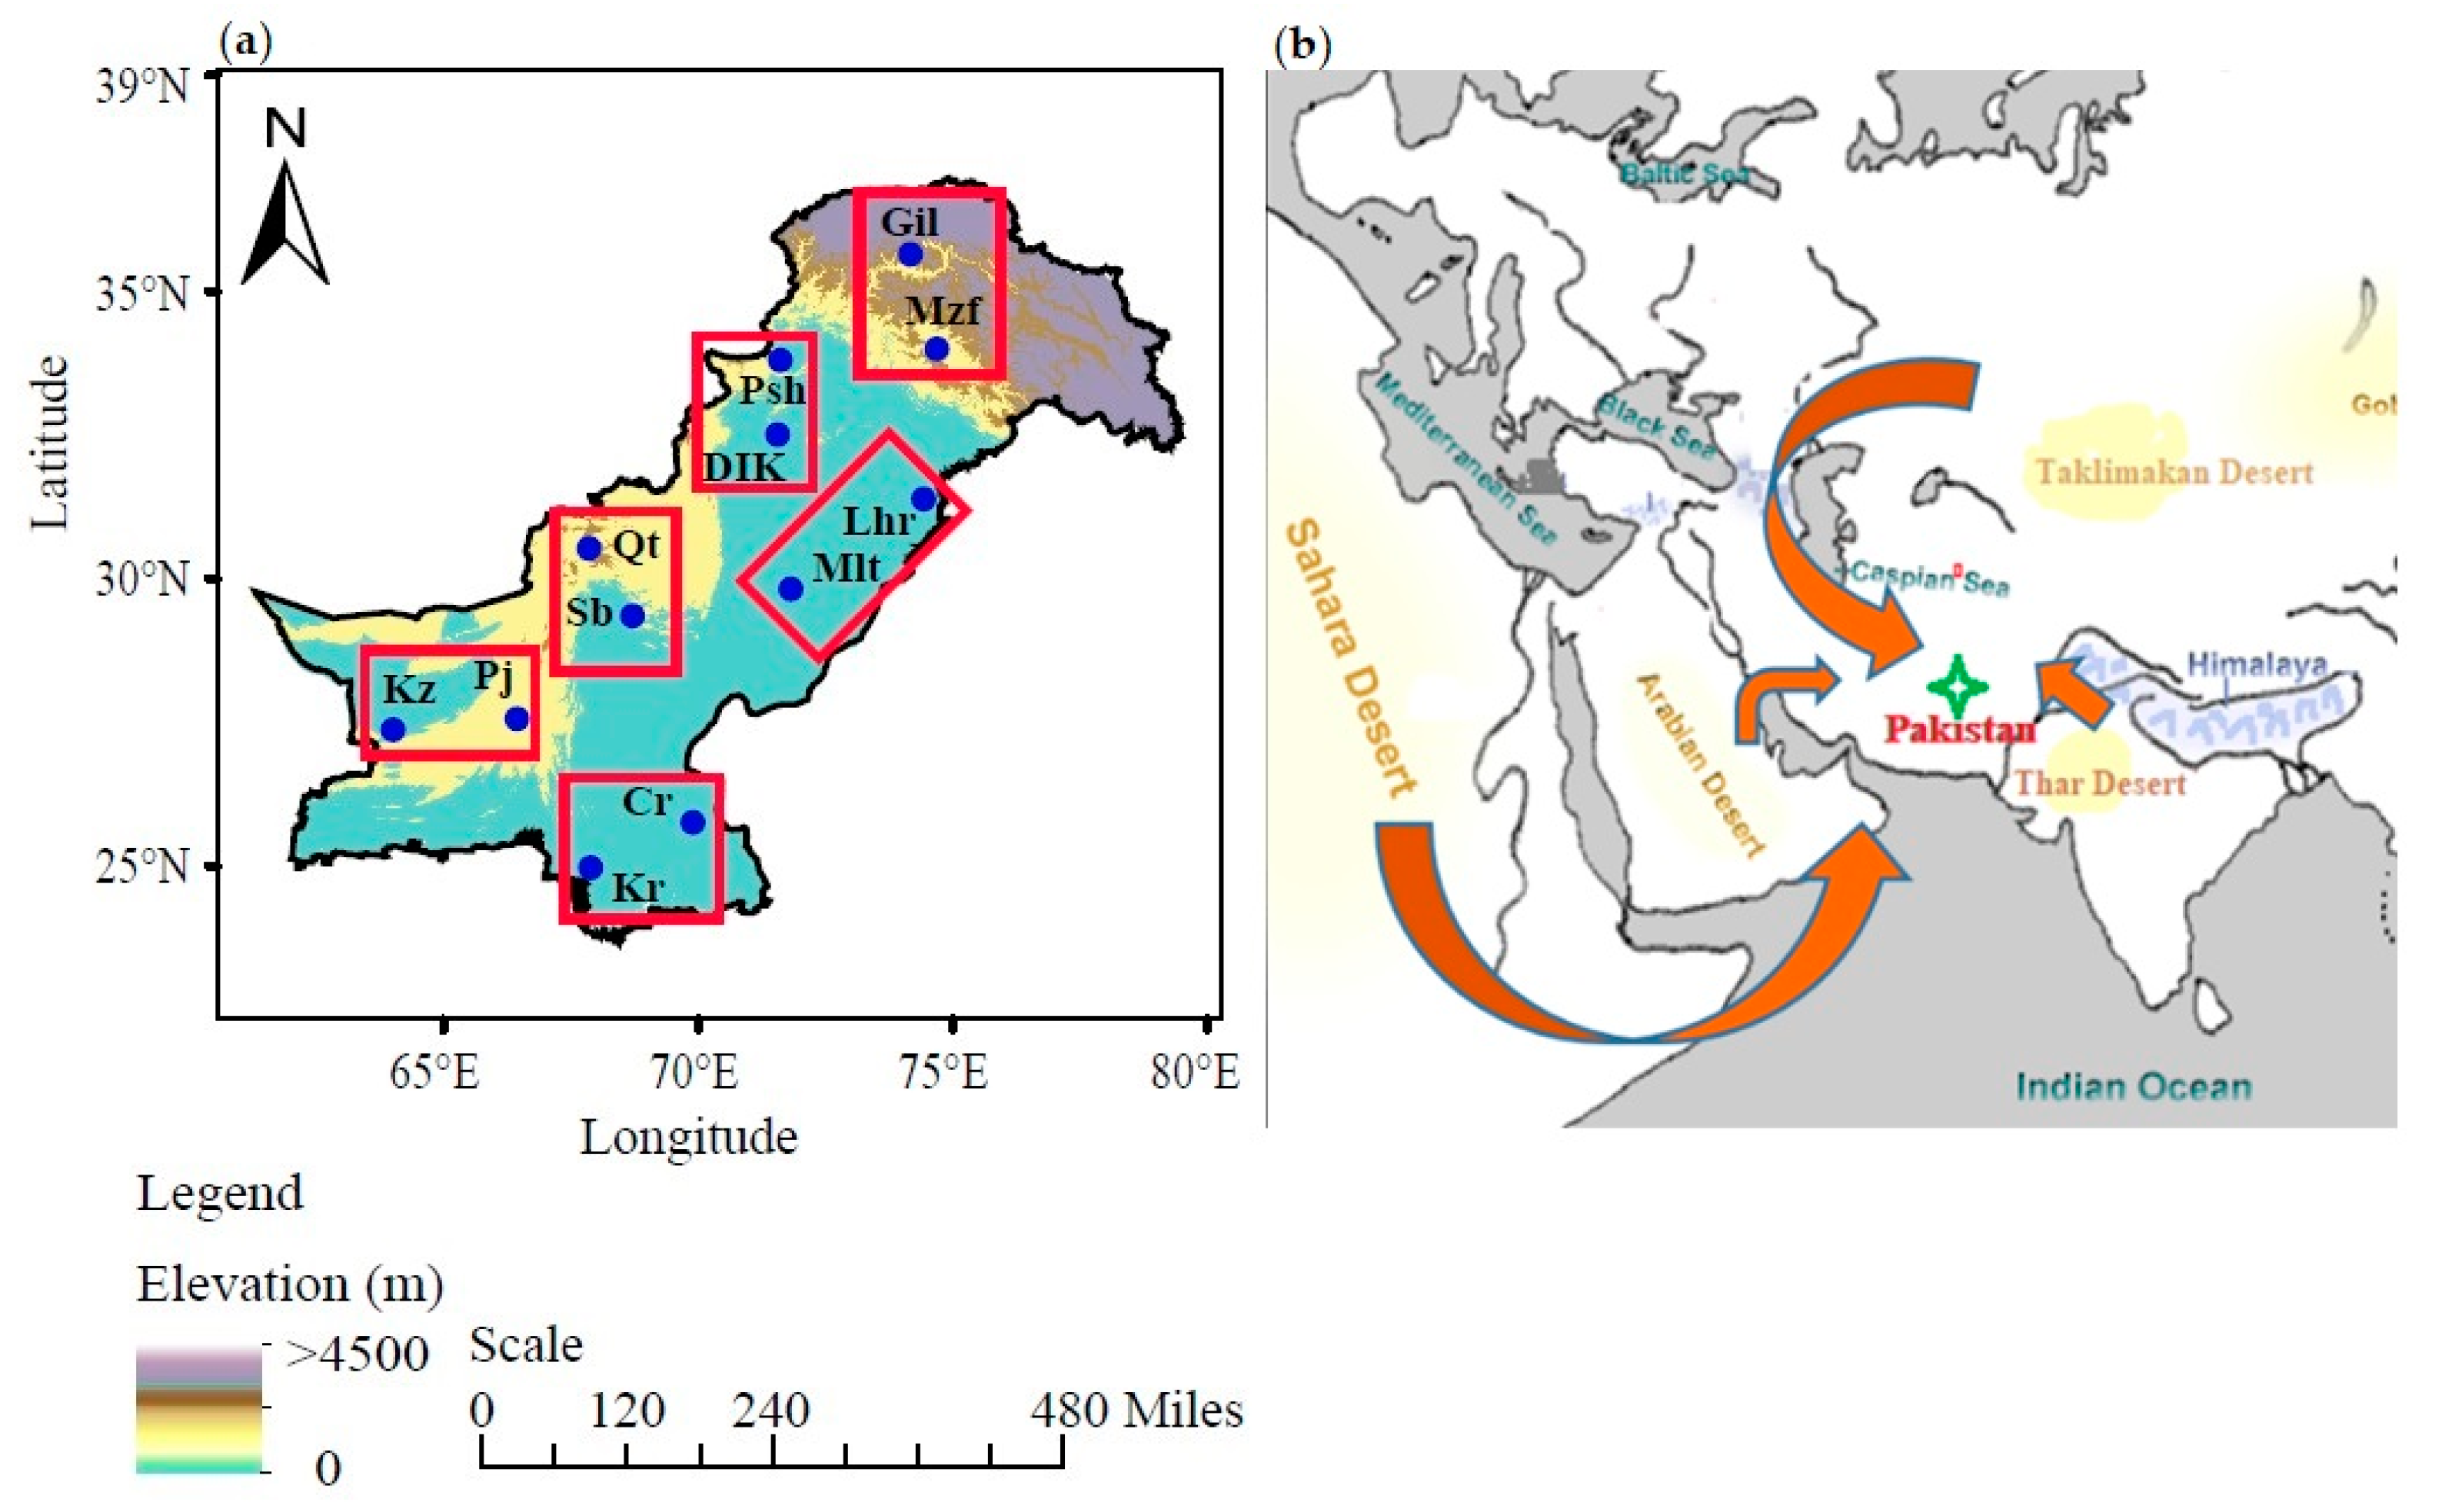
2.1. Study Region
2.2. The AOD Data
2.2.1. The MERRA-2 Reanalysis Data
2.2.2. The MODIS Sensor
2.3. Statistical Analysis and Modeling
2.3.1. Mann–Kendall Test
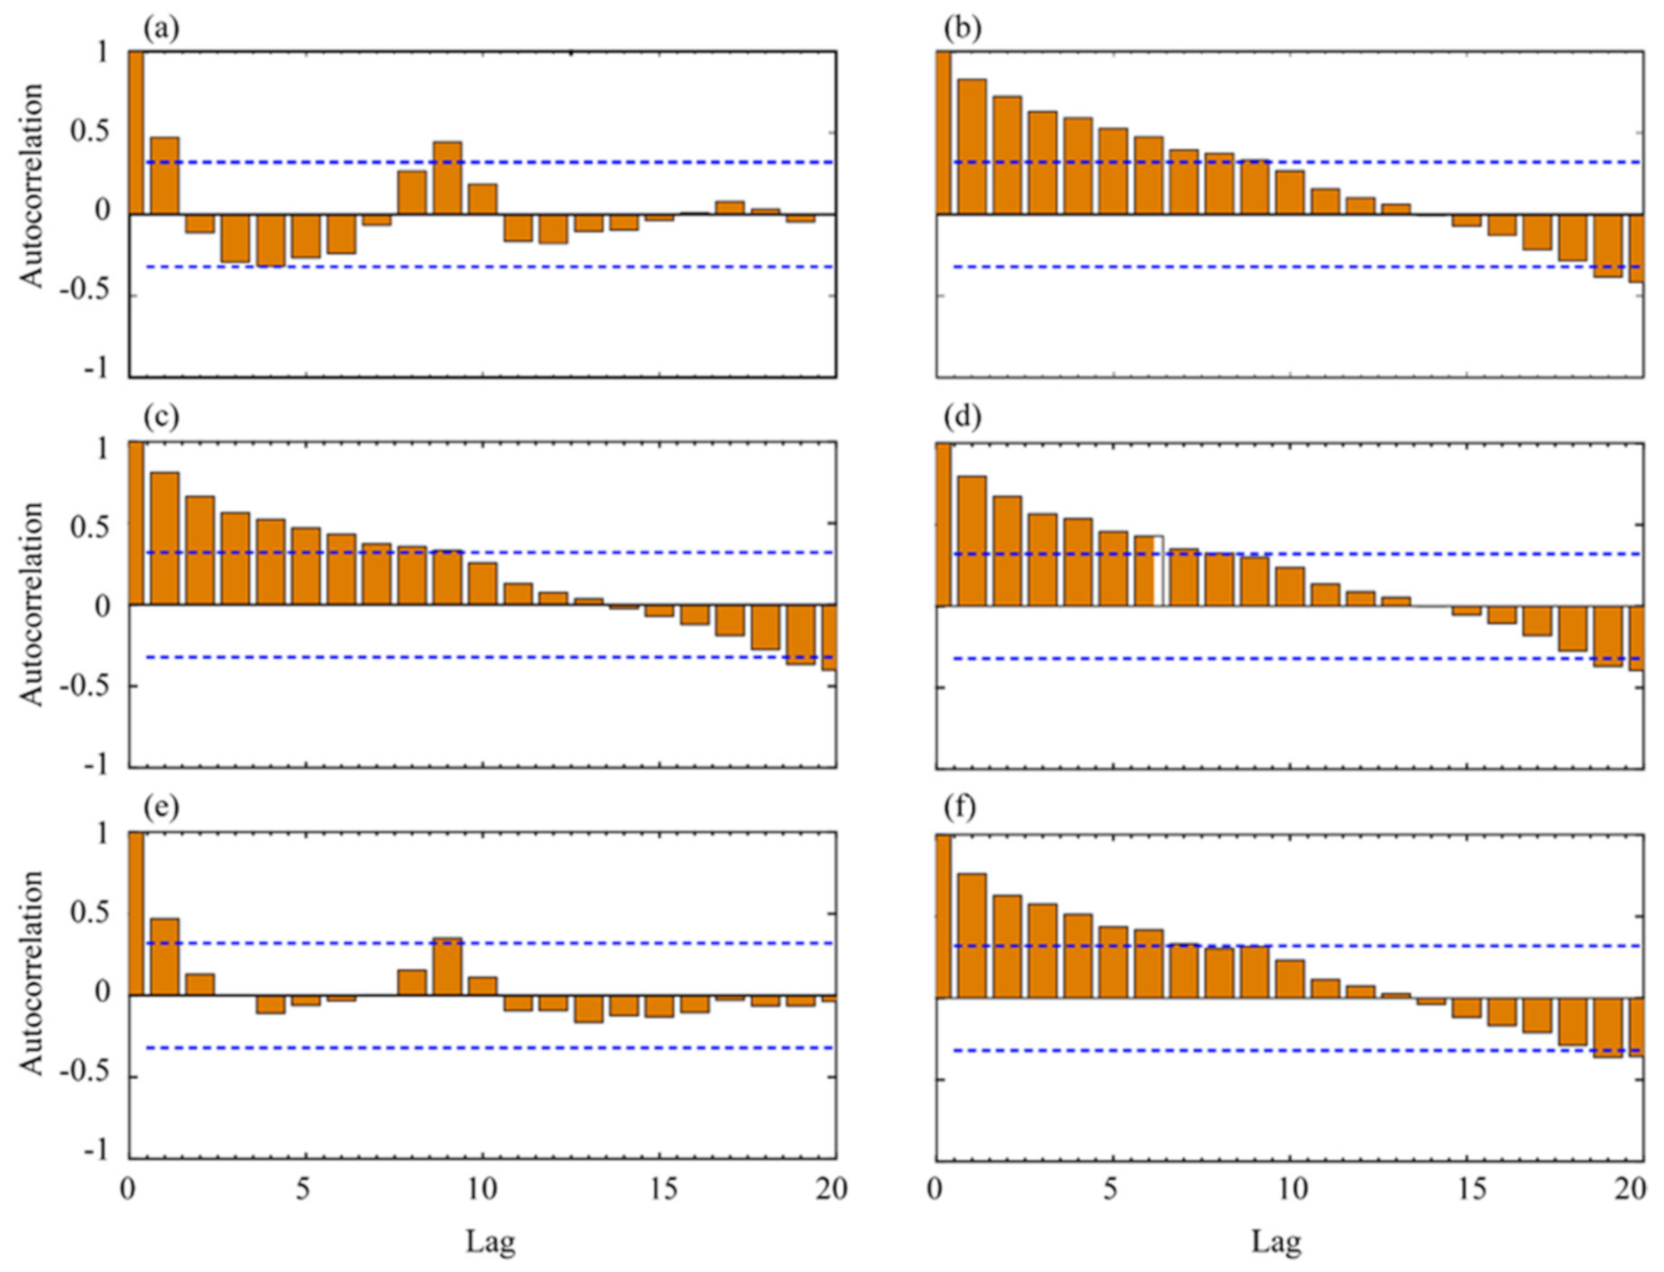
2.3.2. Autocorrelation Test
2.3.3. Linear Regression
3. Results
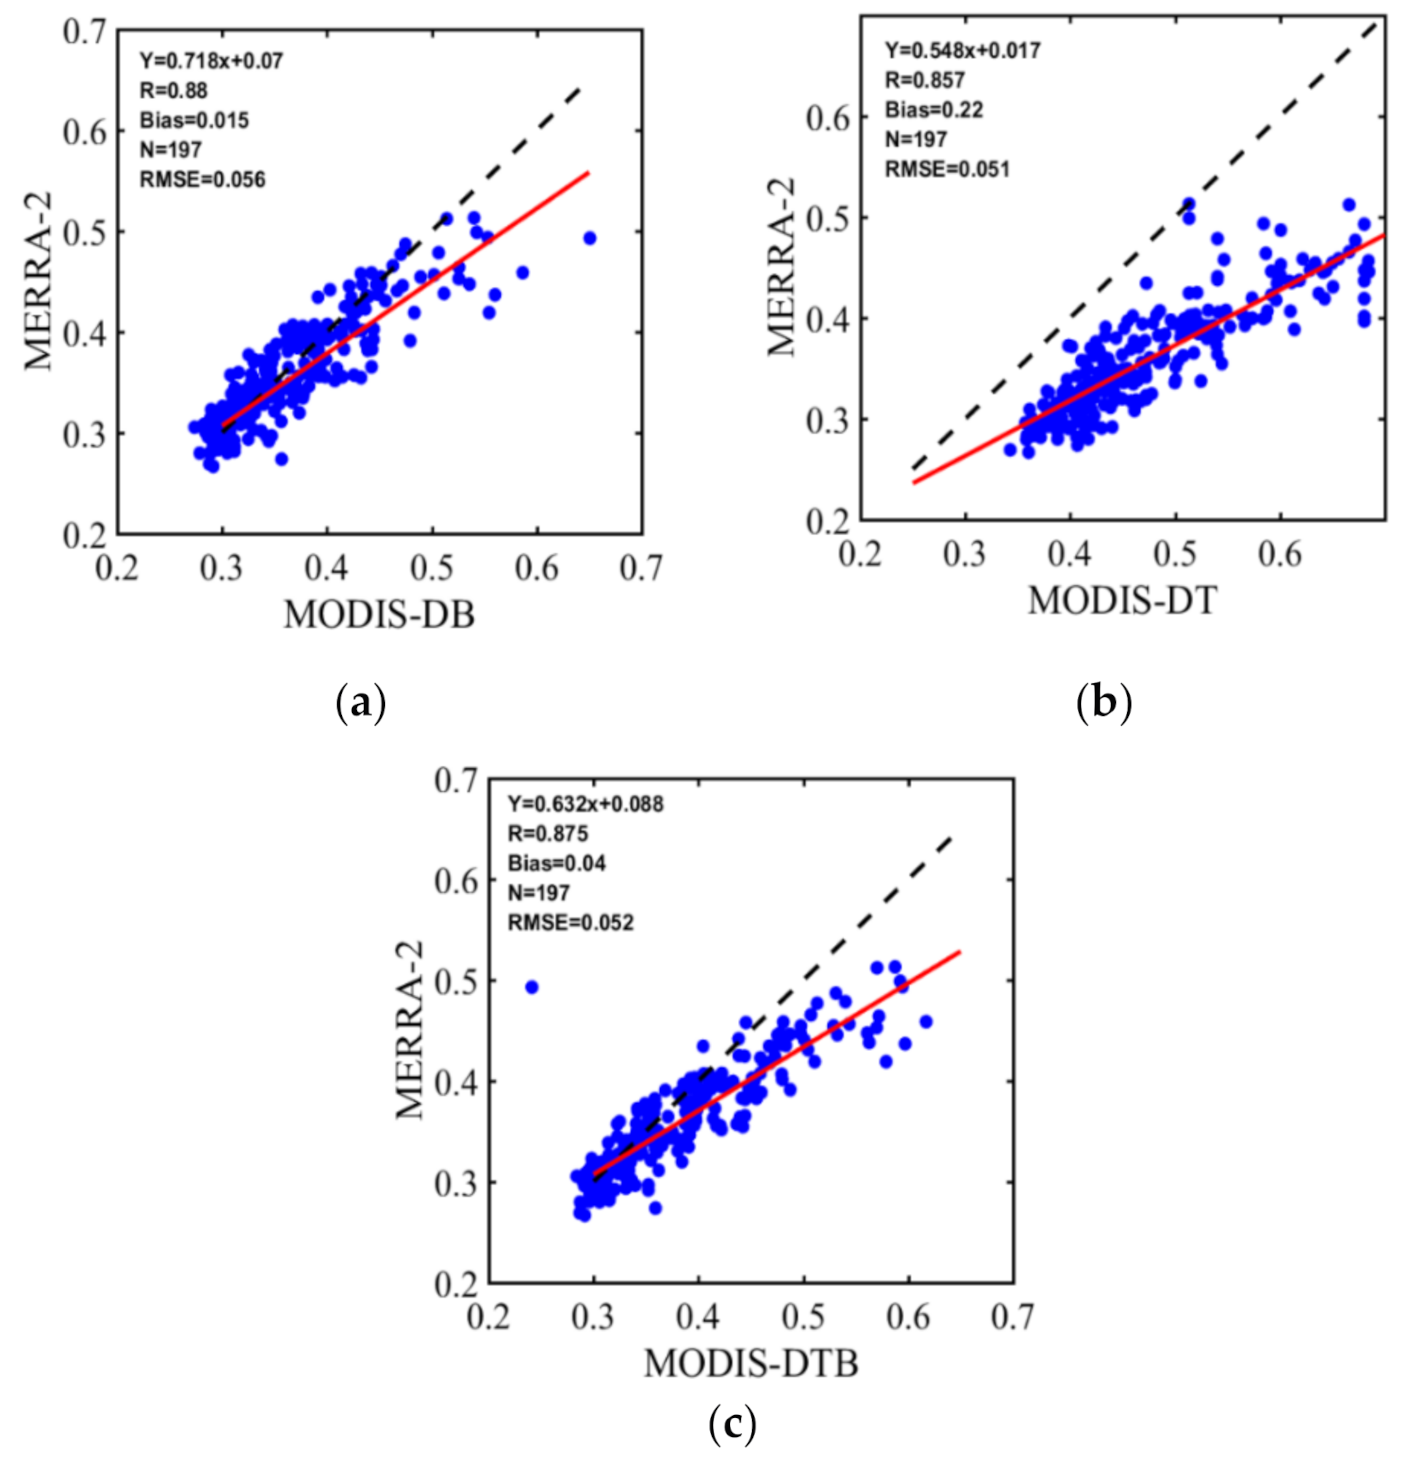
3.1. Comparison of Datasets
3.2. Spatiotemporal Distributions of AOD
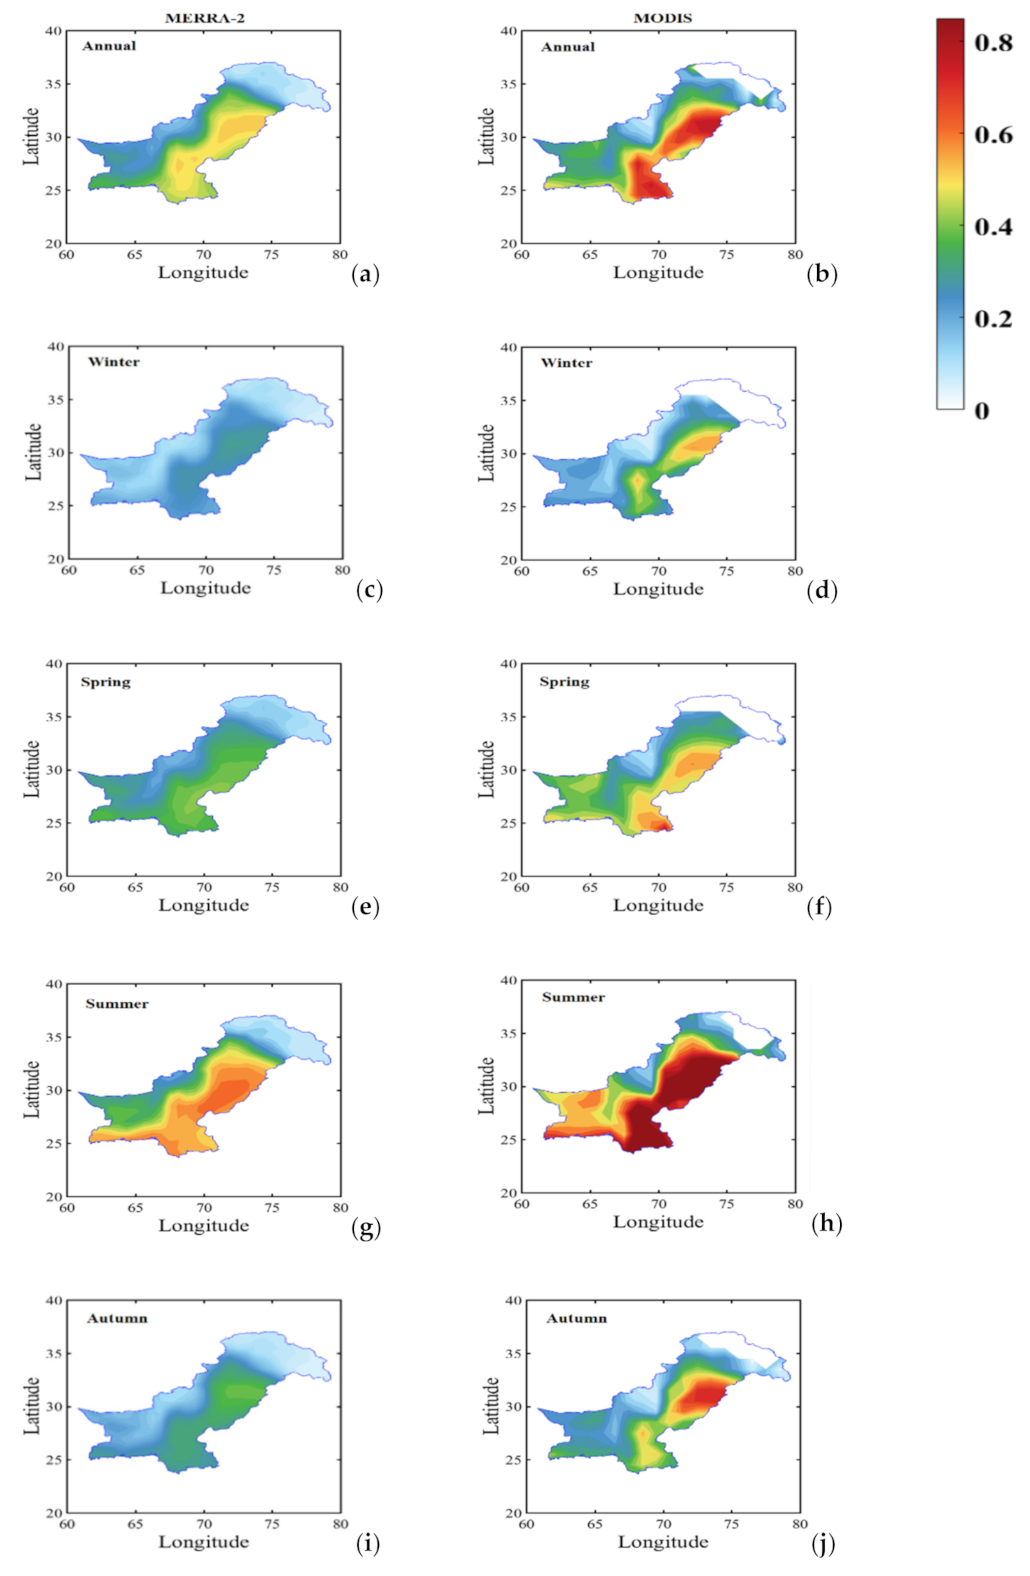
3.2.1. Spatial Variations
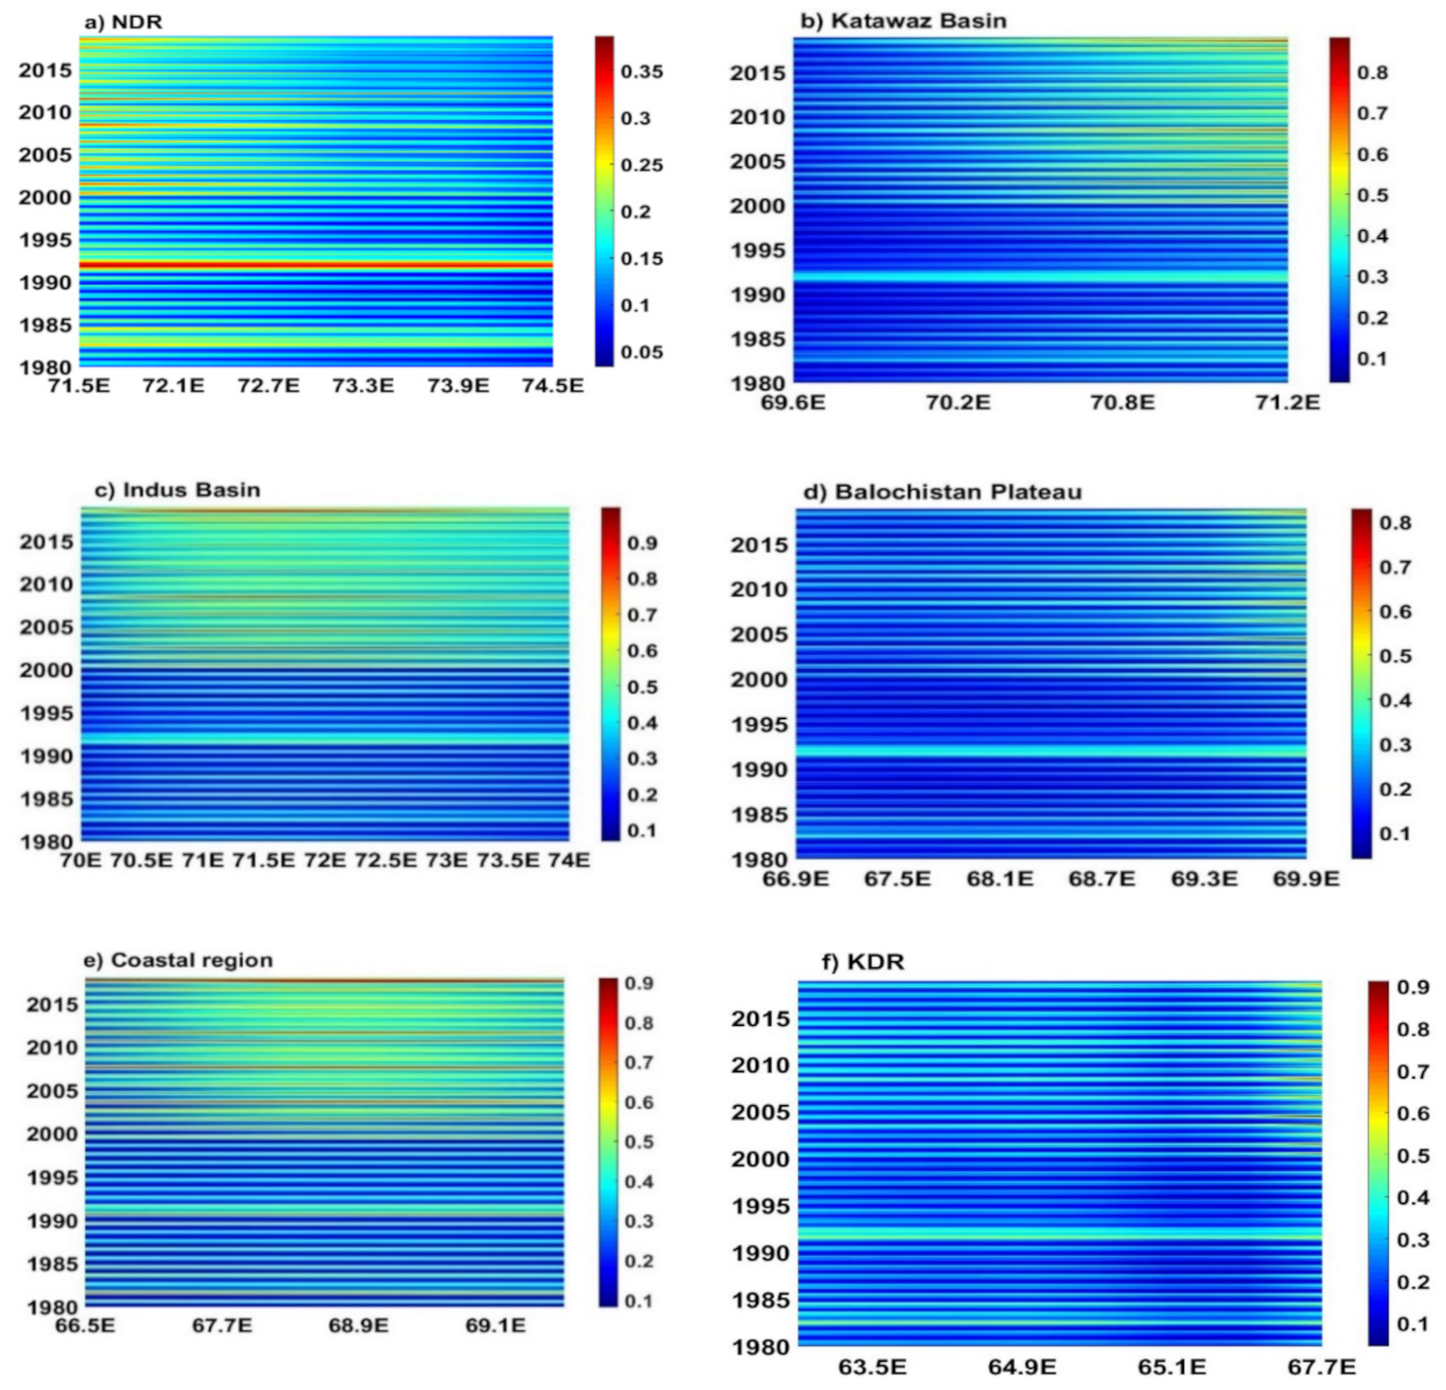
3.2.2. Temporal Variations
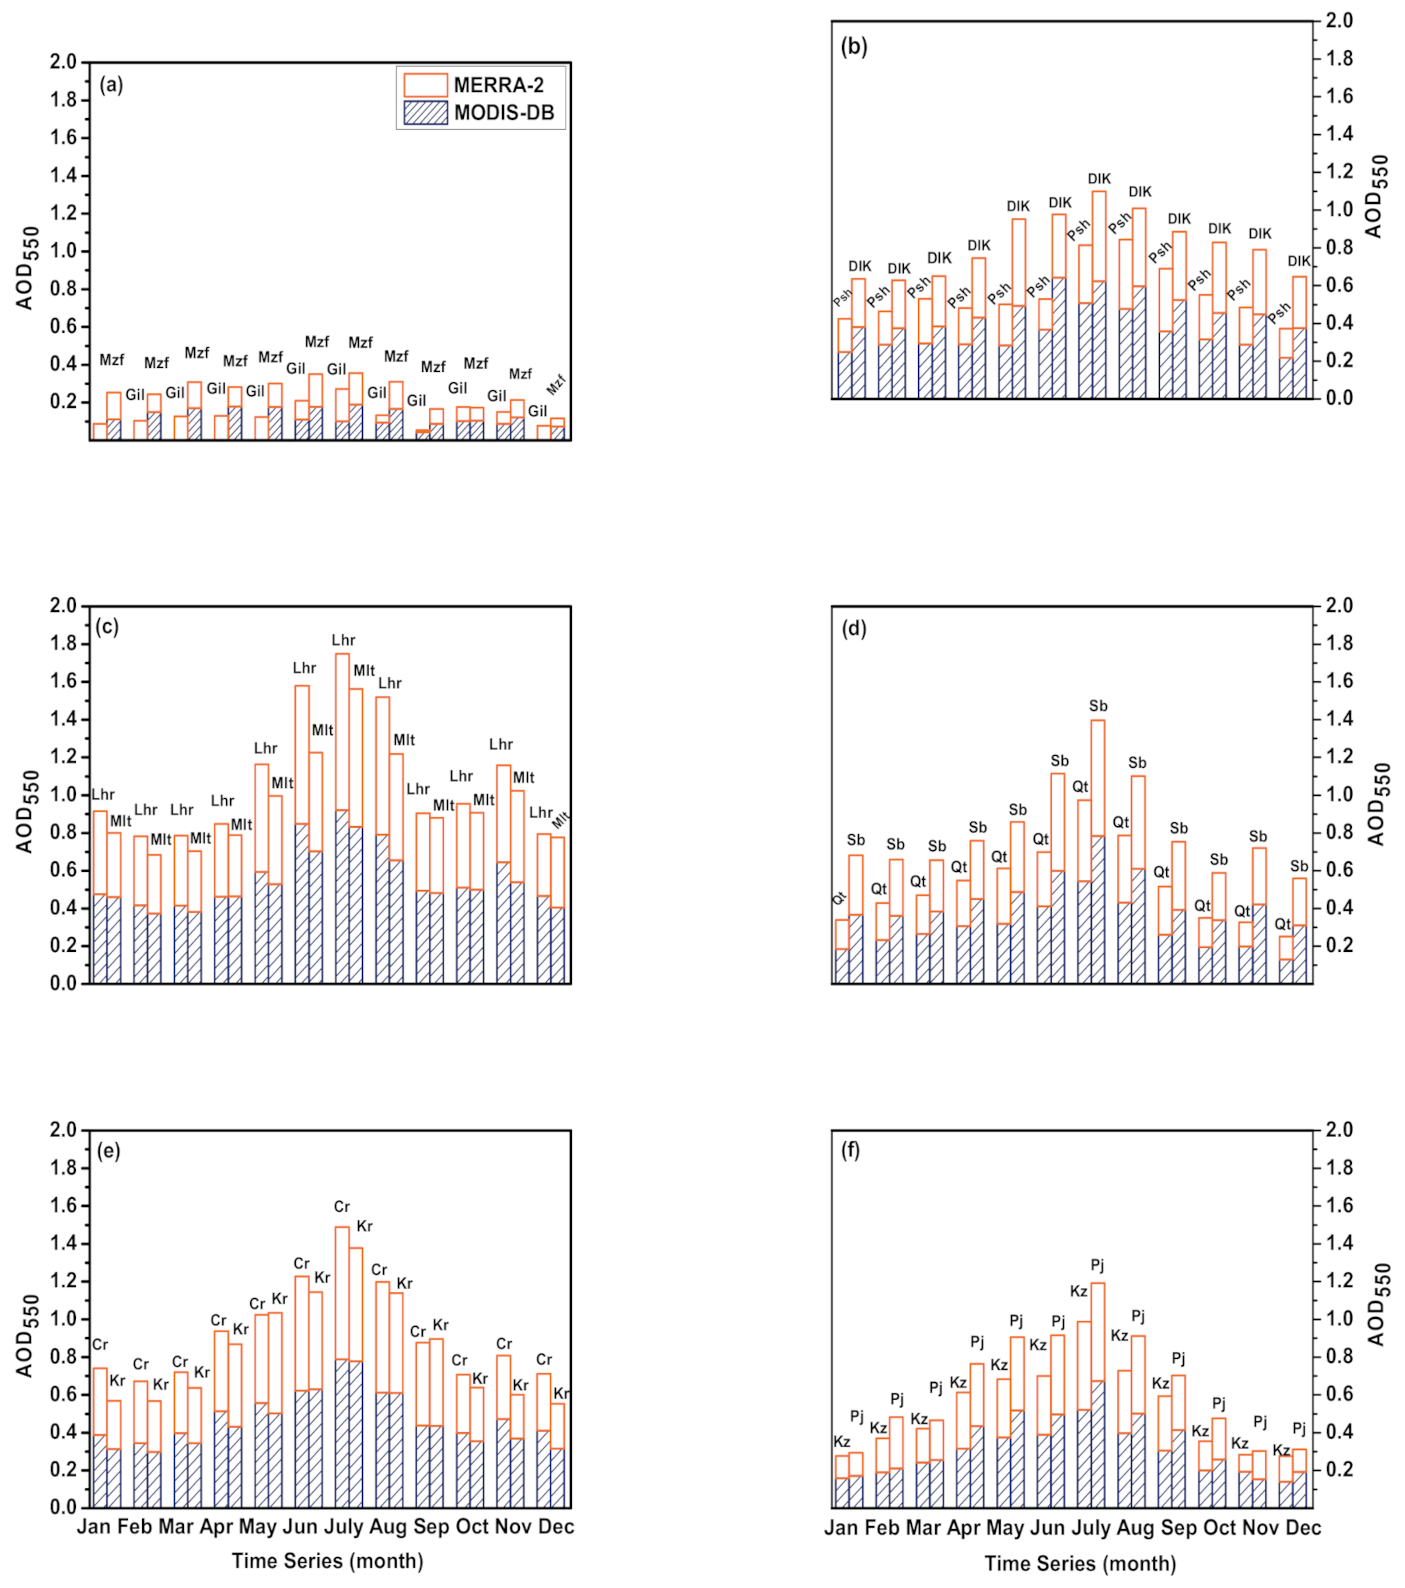
Monthly Variation
Seasonal and Annual Variations
3.3. Trend Analysis of AOD
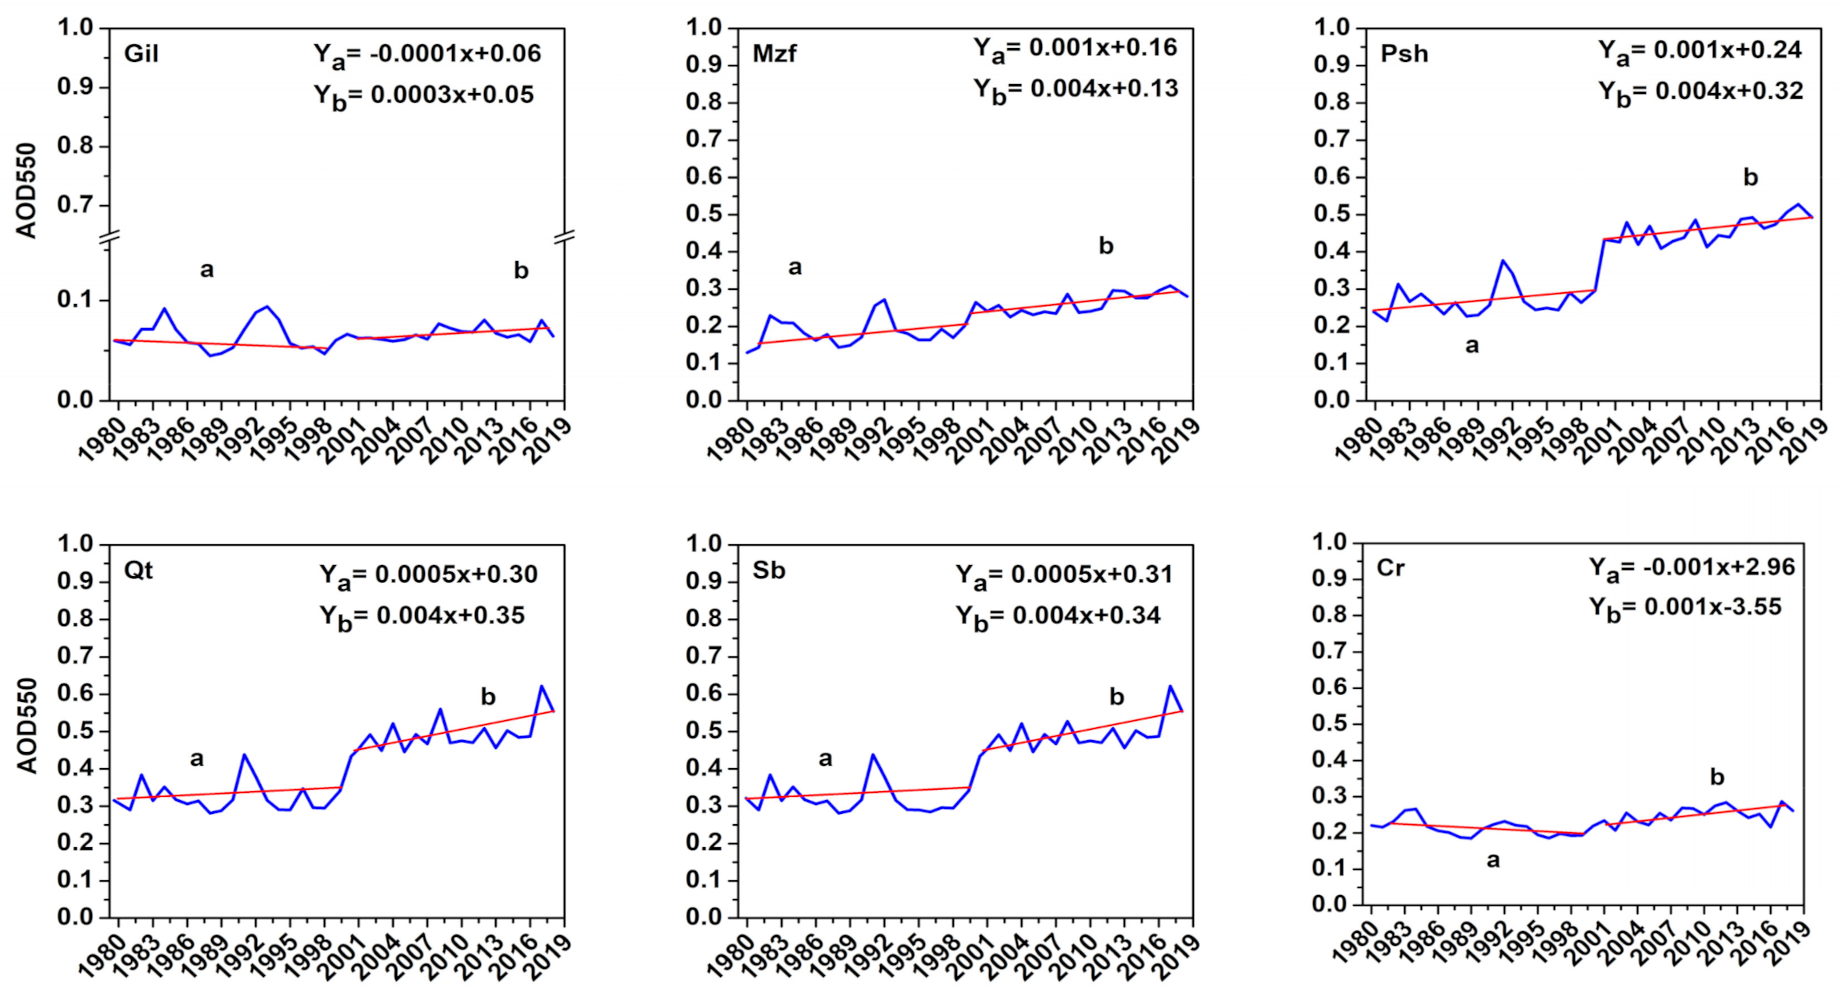
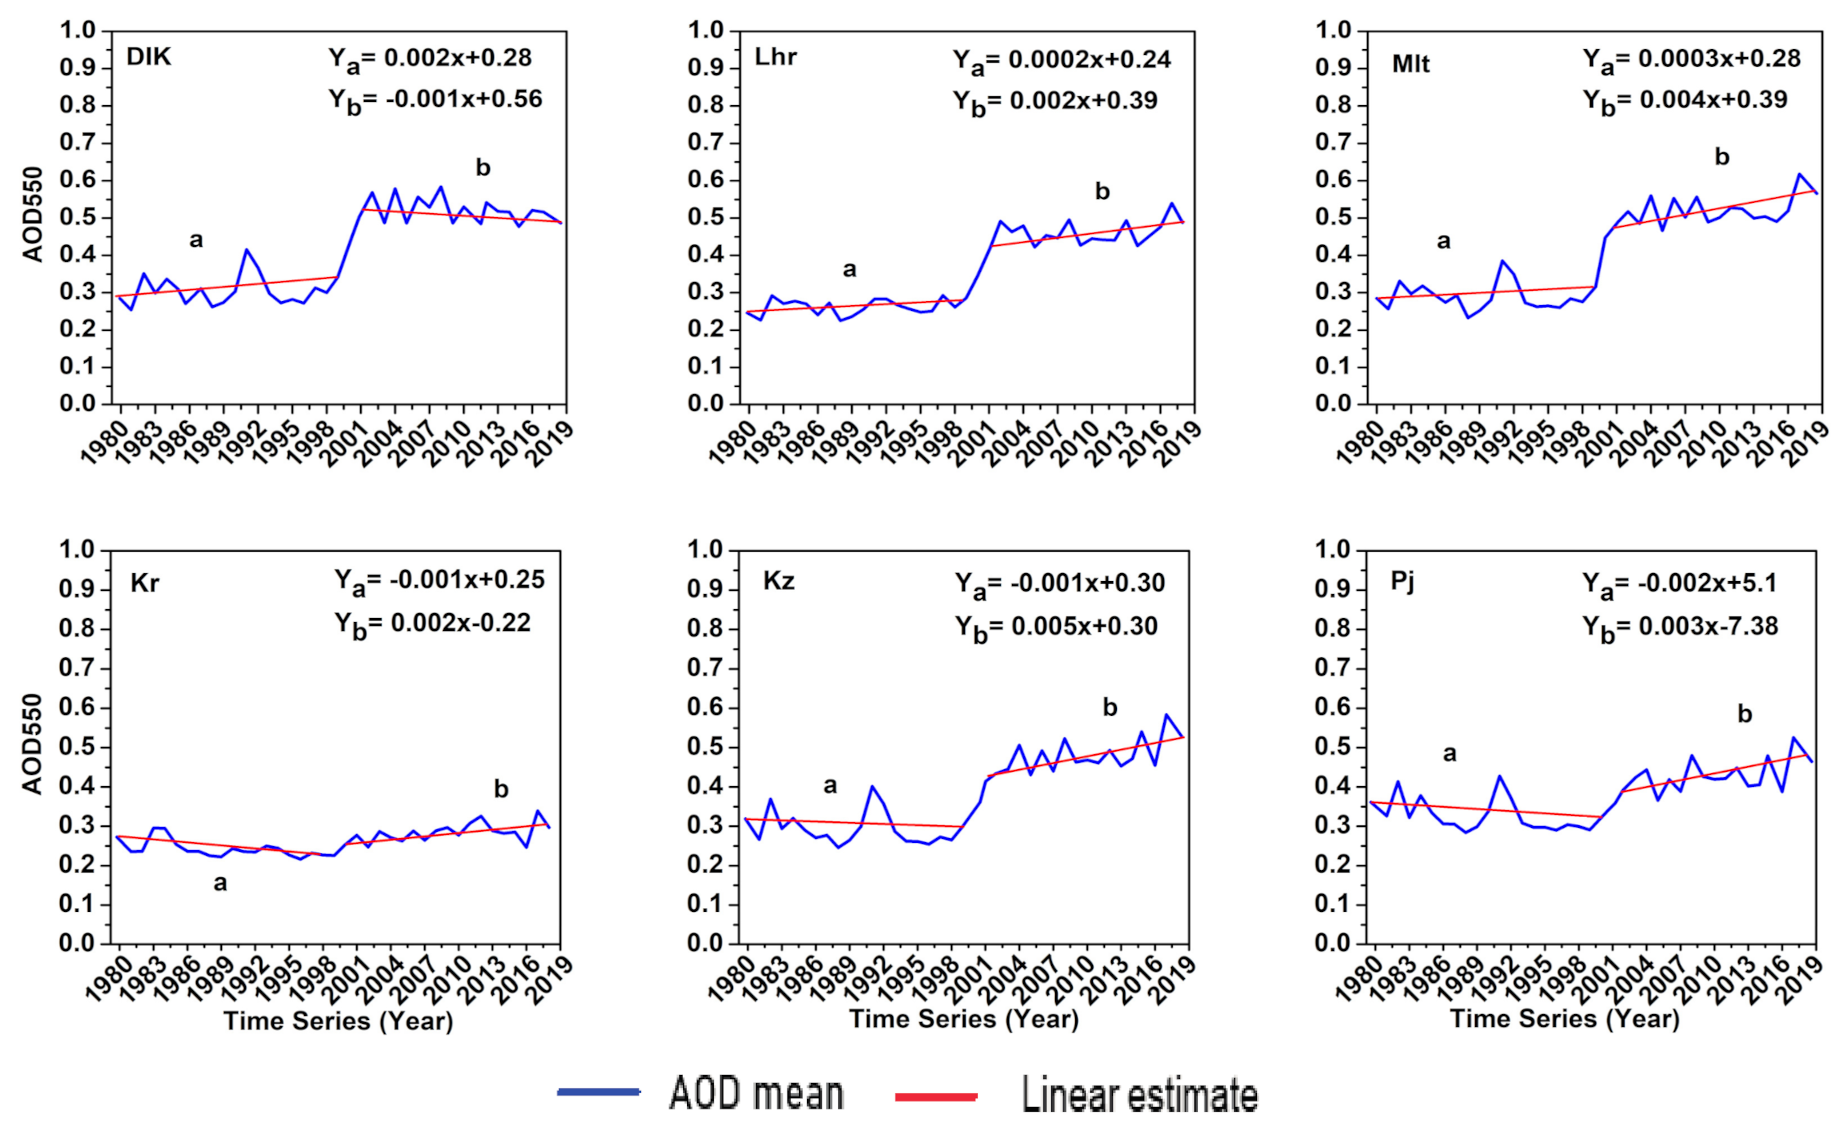
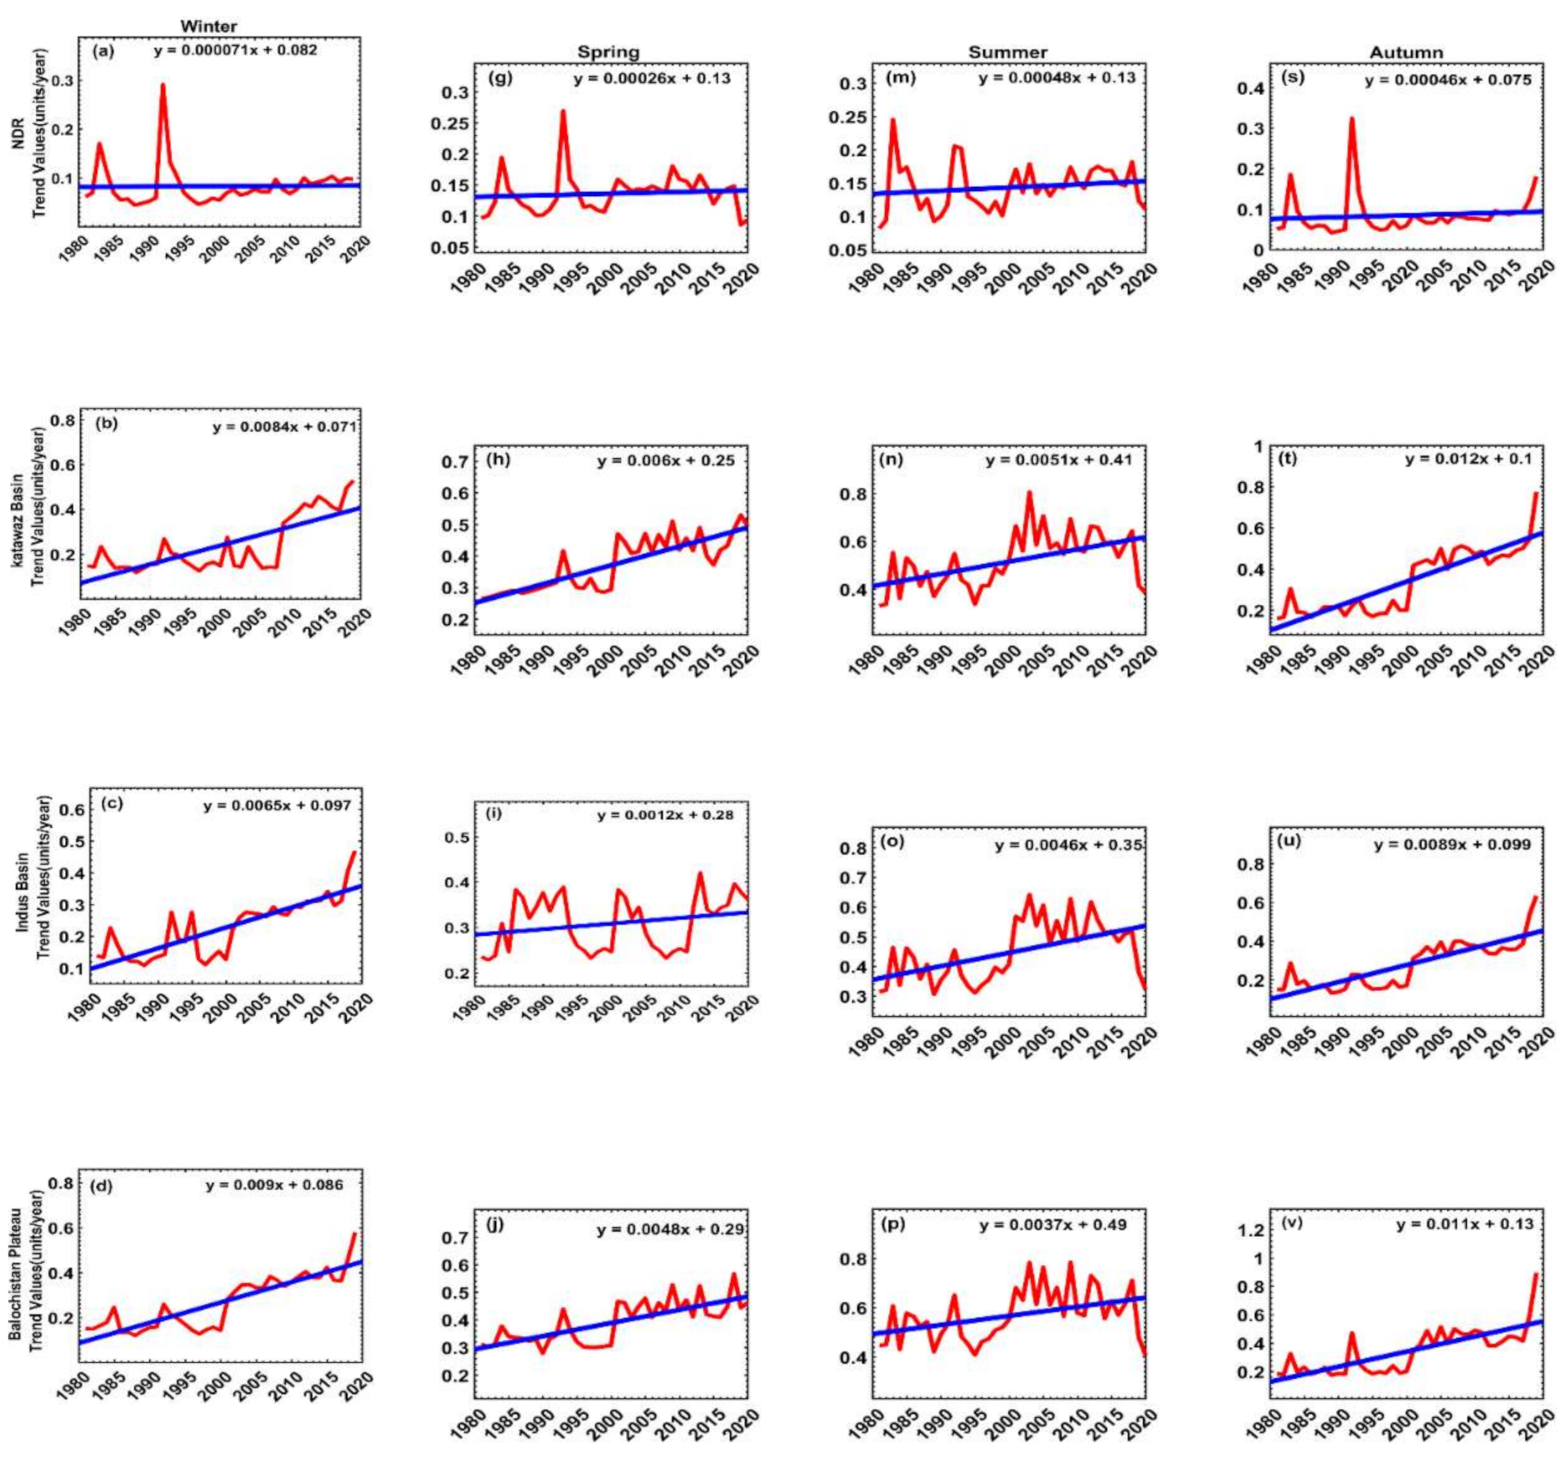
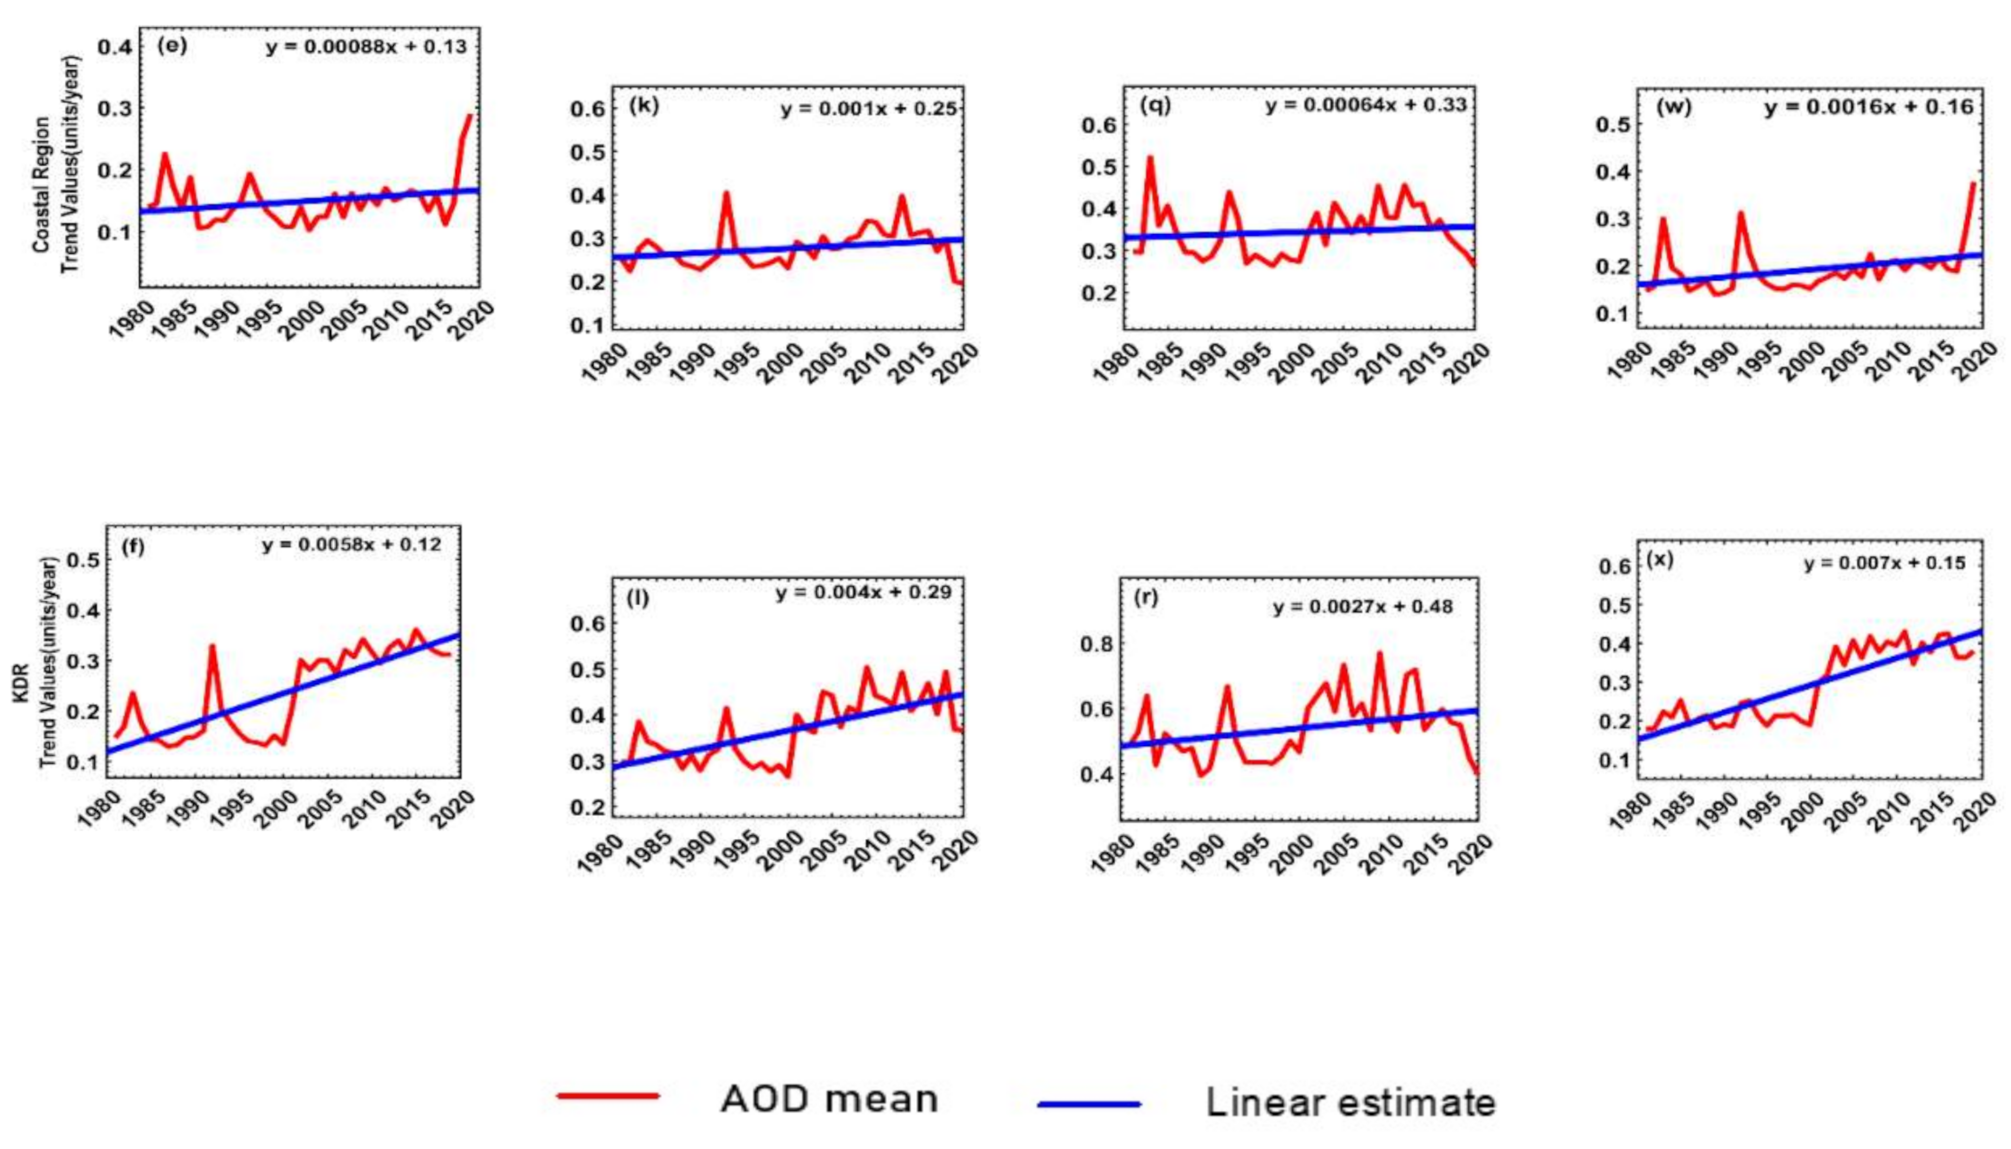
3.3.1. Temporal Trend
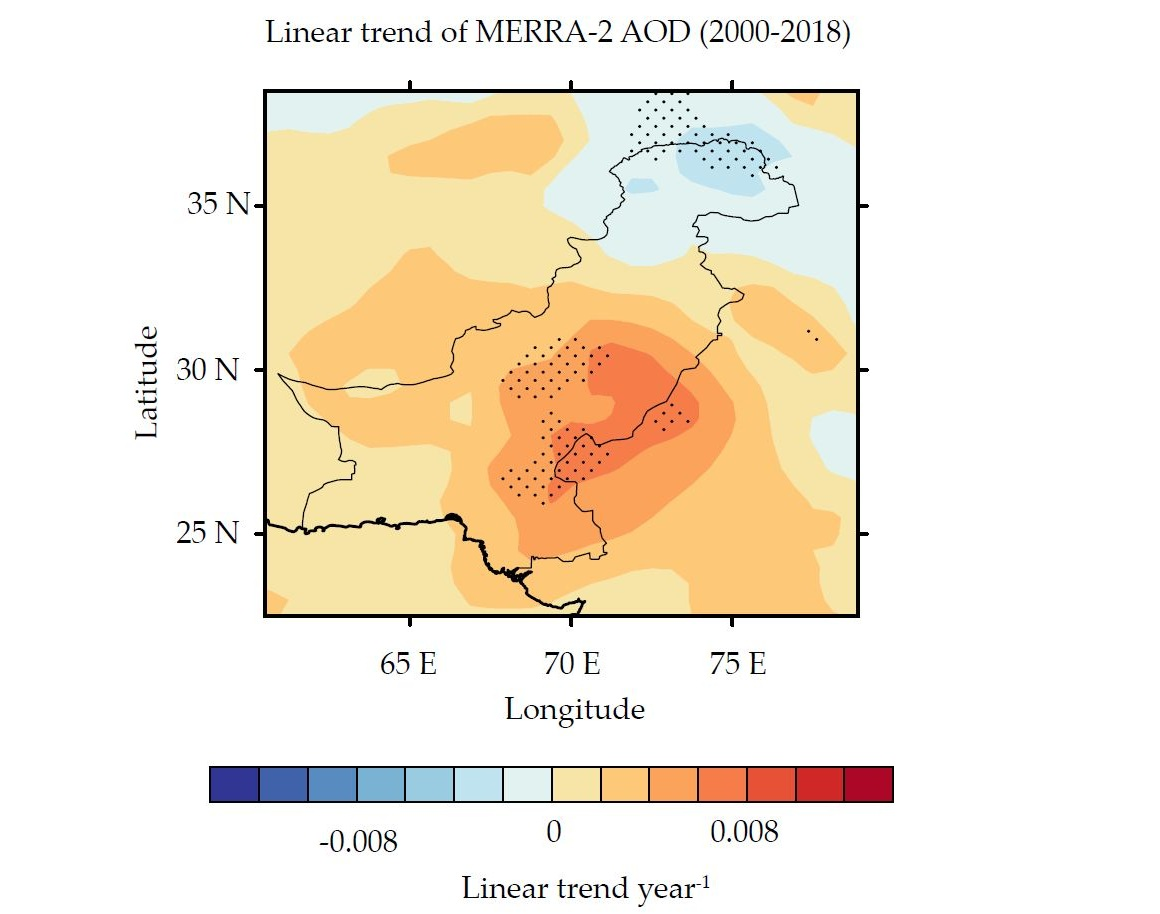
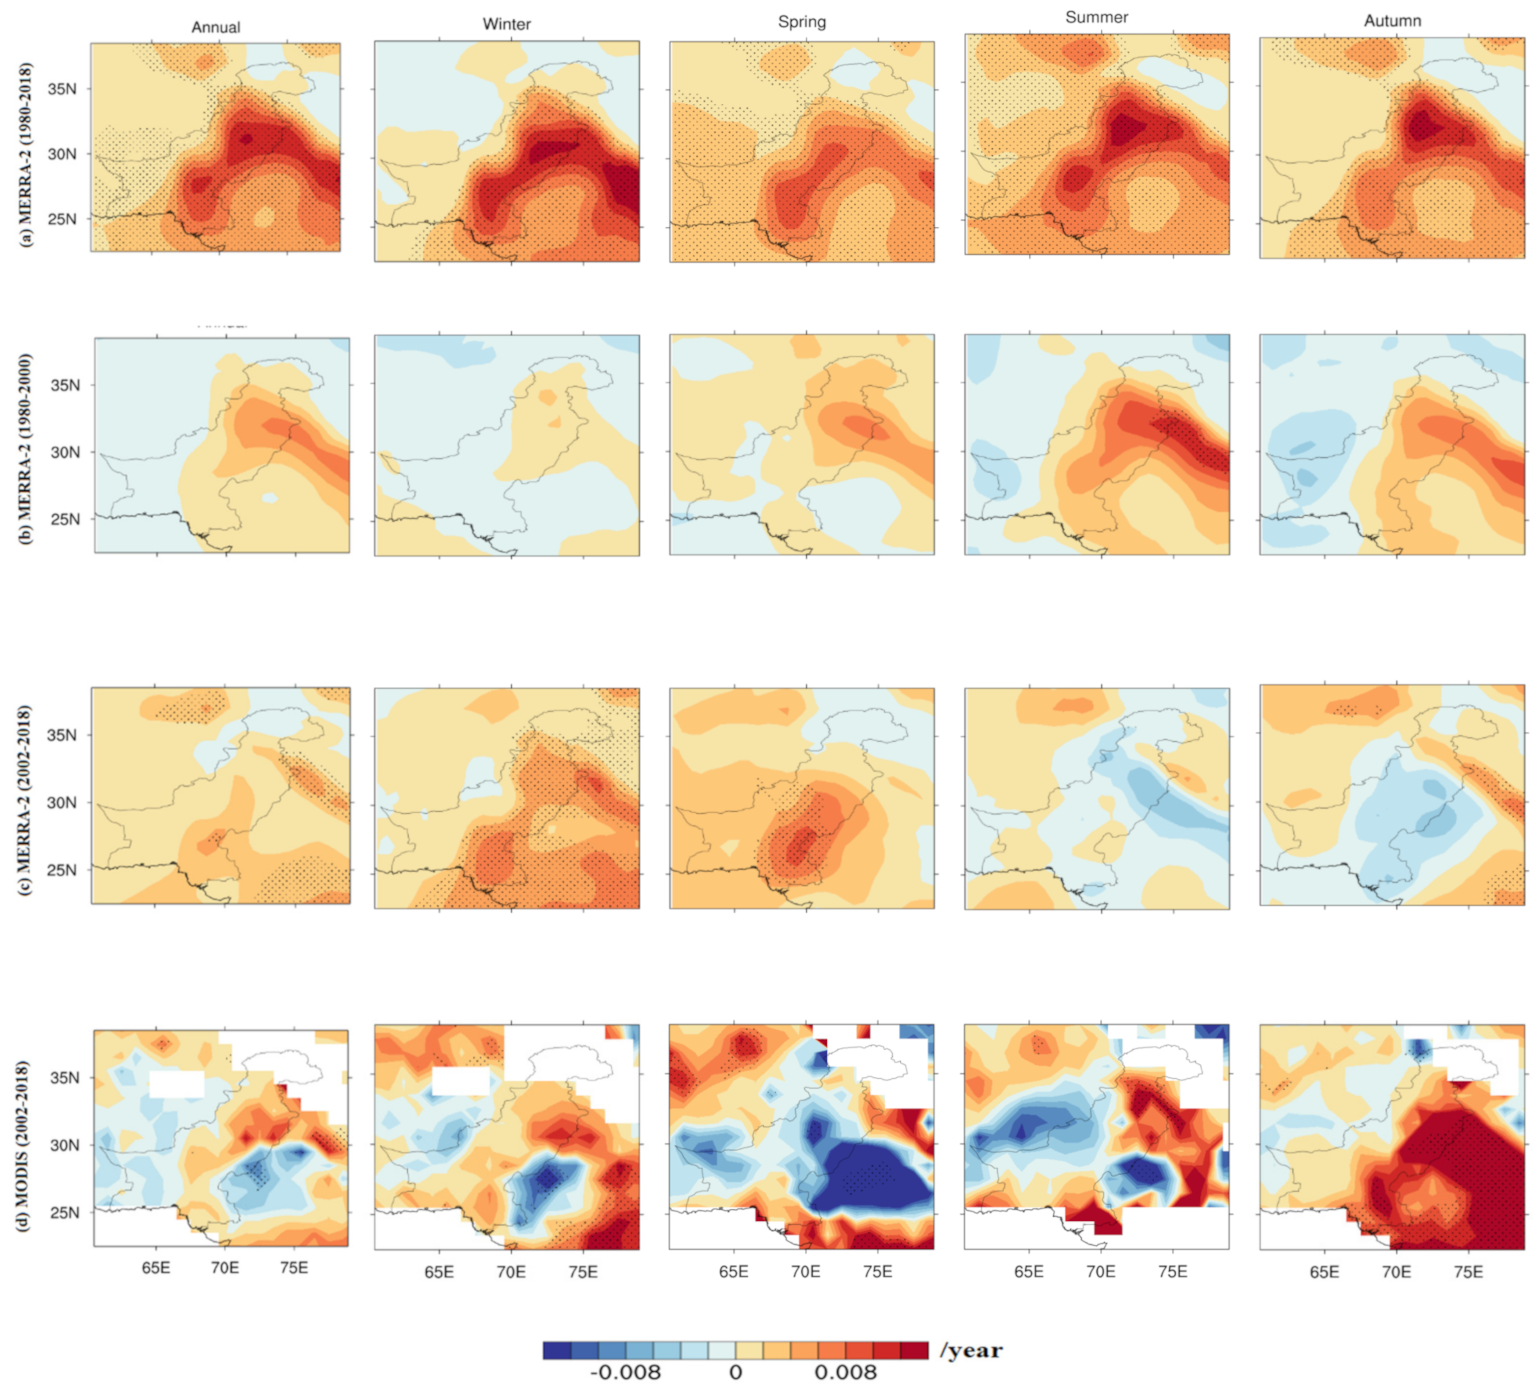
3.3.2. Spatial Variation of AOD Trends Across Pakistan
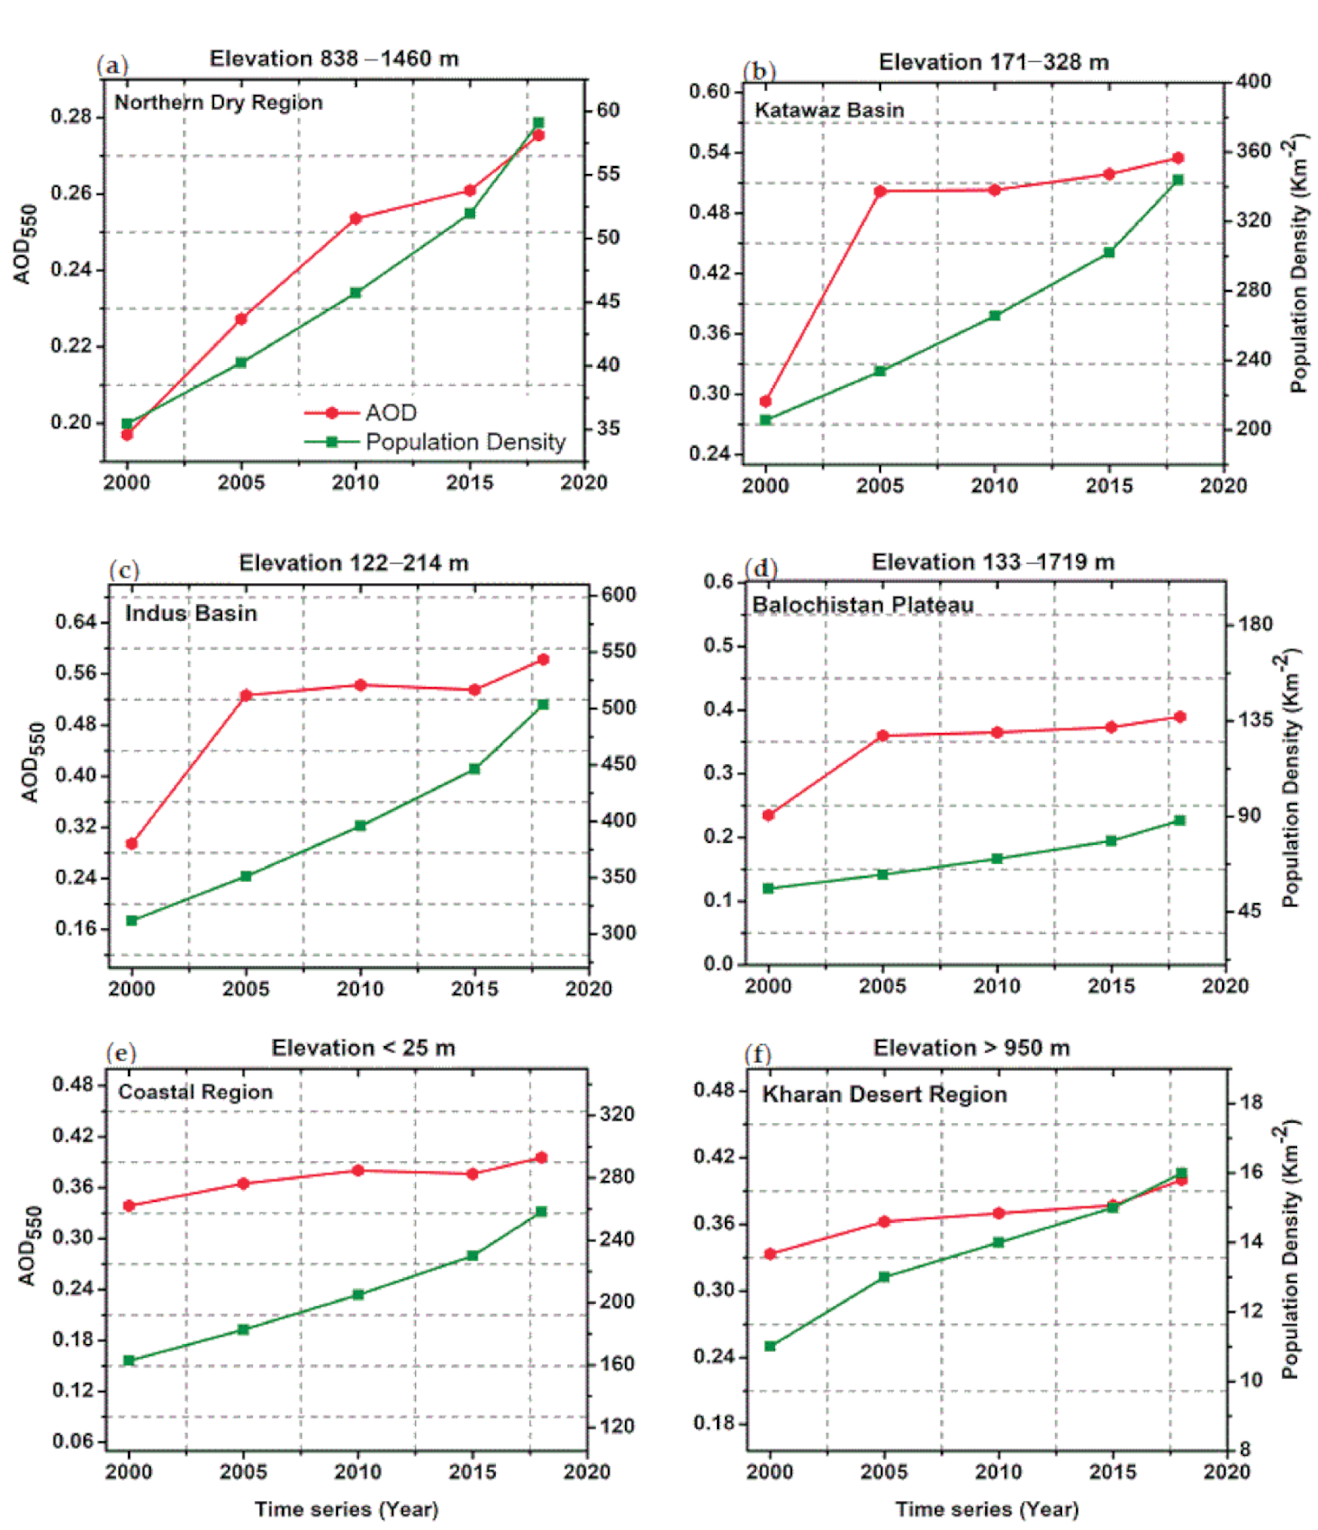
3.4. Variation in AOD with Elevation and Population Density
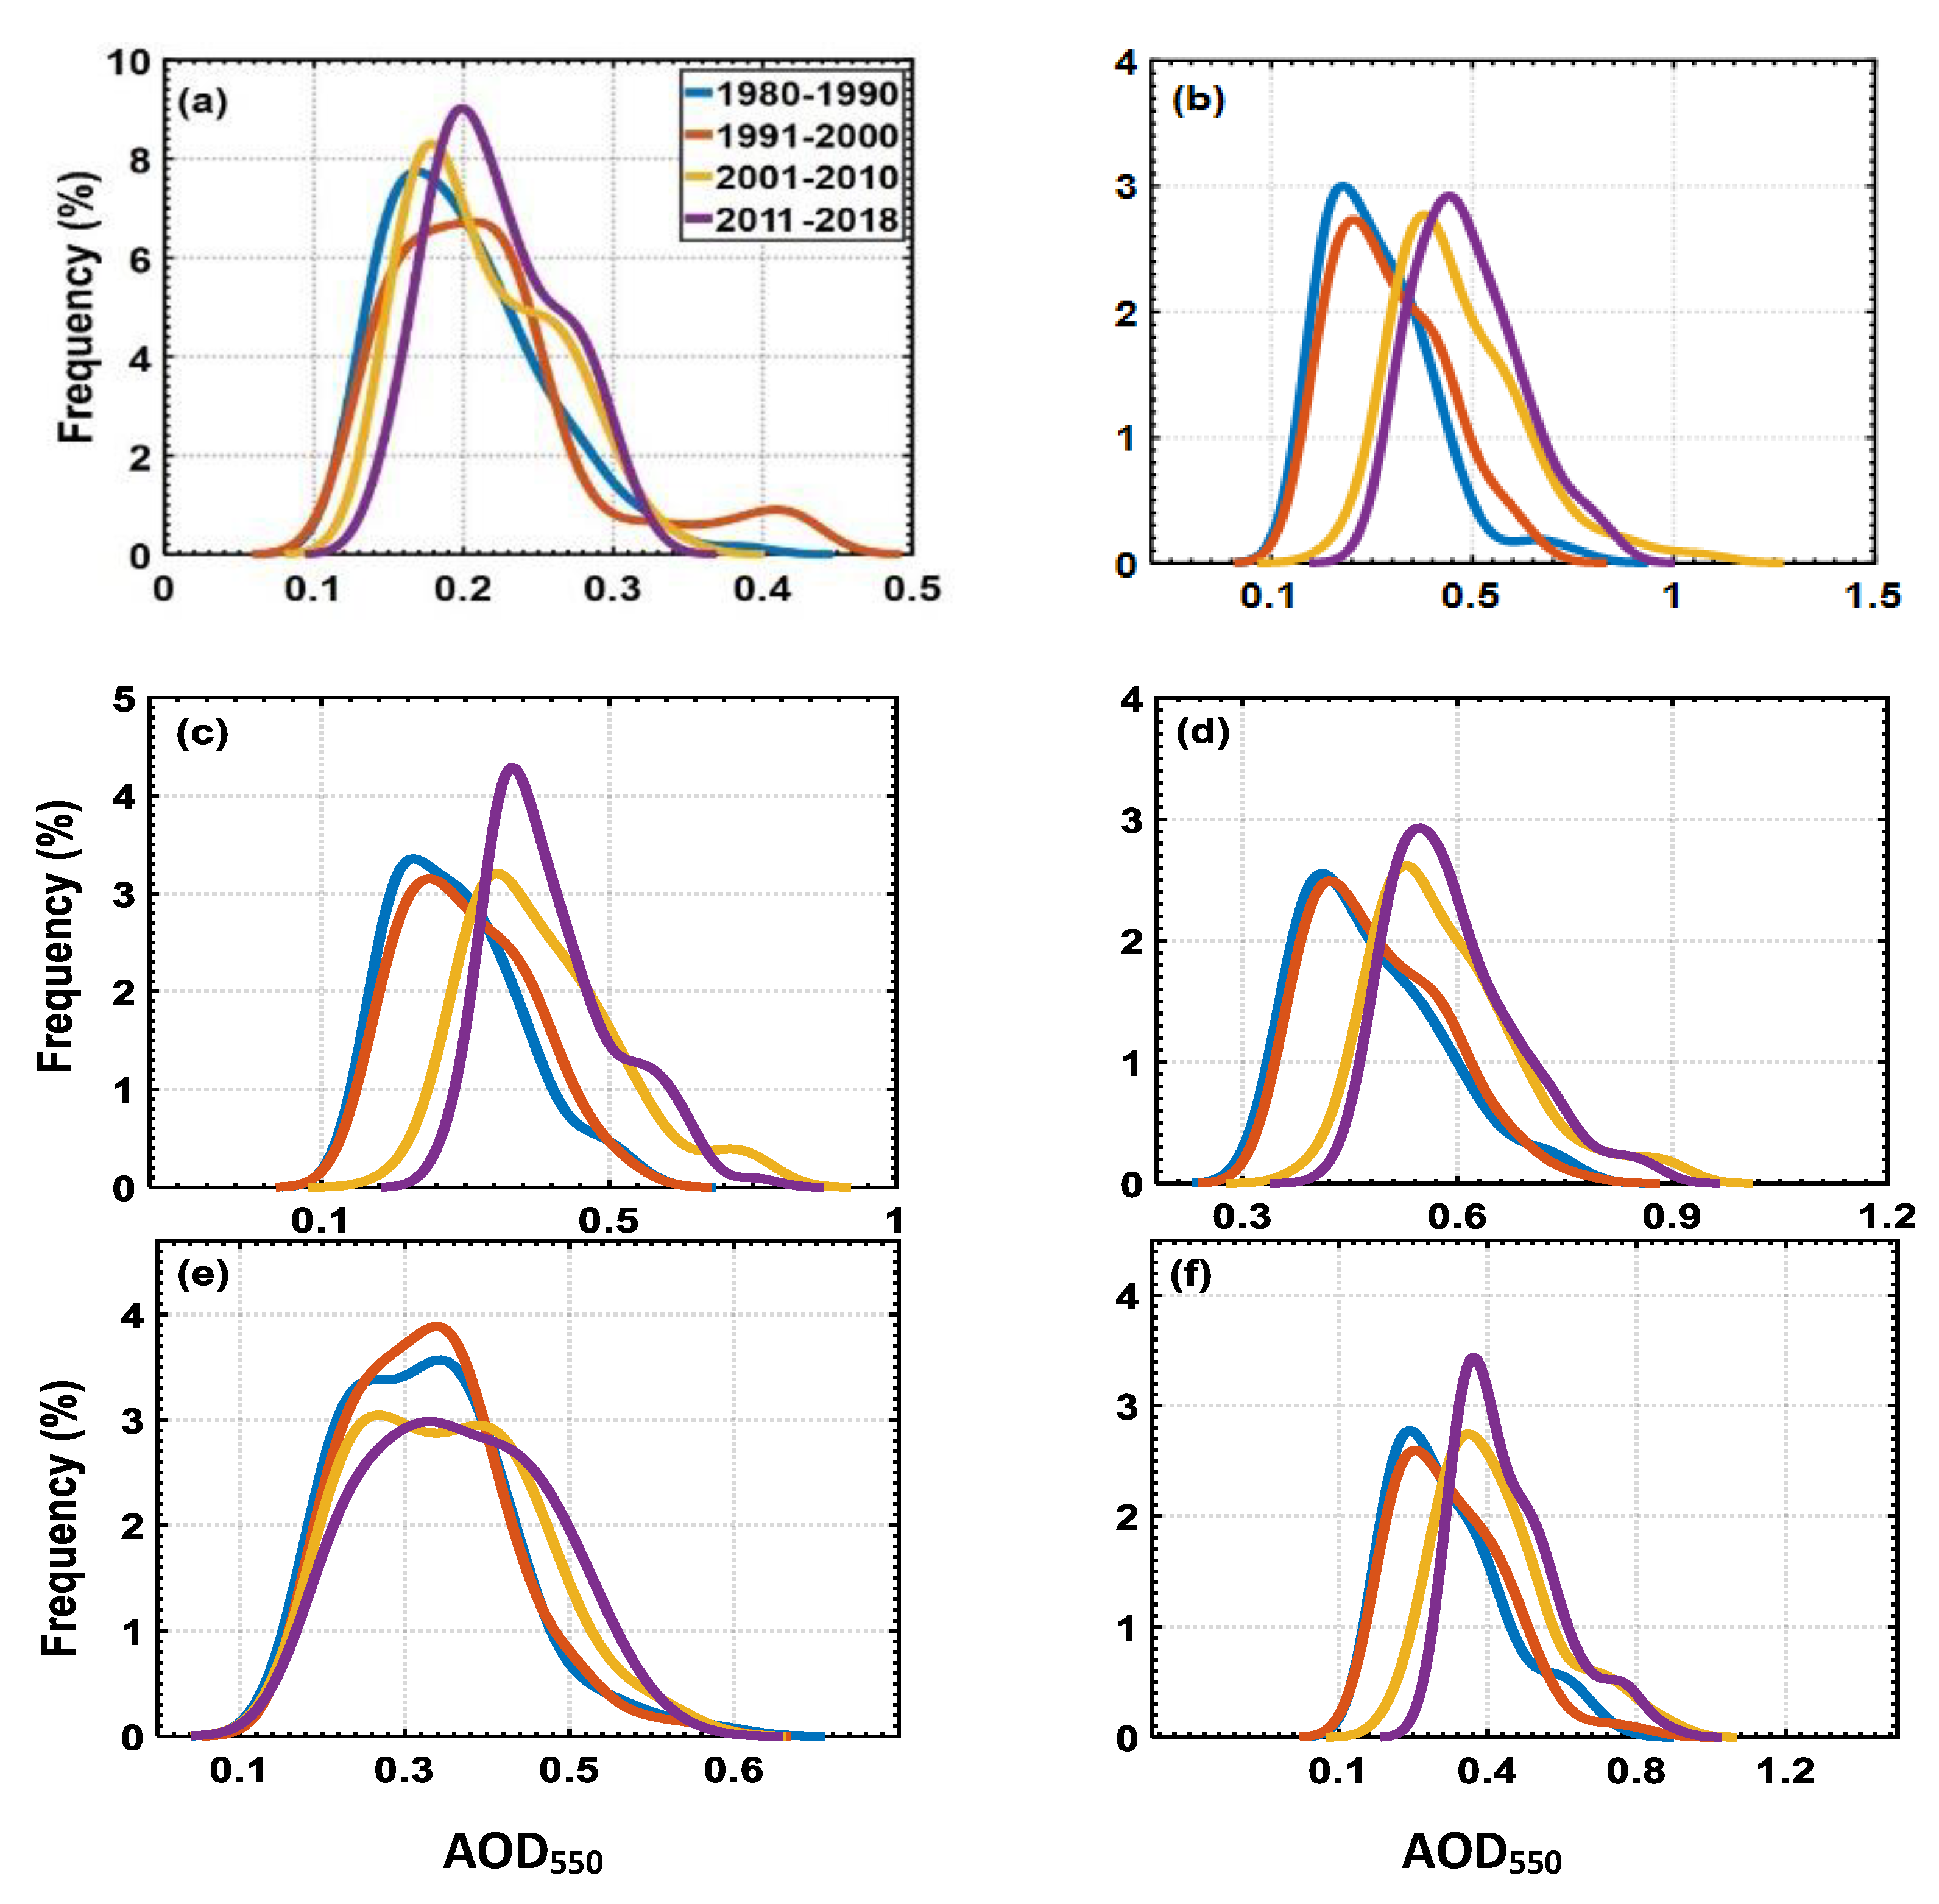
3.5. Probability Distribution Function
4. Discussion
5. Conclusions
- The MERRA-2 and MODIS (DT, DB, and DTB) AOD datasets were compared, and the validation shows a strong positive correlation, especially with the MODIS DB AOD product. However, the MERRA-2 tends to underestimate MODIS AOD, especially at larger AOD levels;
- The spatial distribution of AOD shows high concentrations over economically, and industrialized urban areas of the Indus Basin; low AOD is observed over cities in the NDR and Kharan Desert regions, which are high-altitude arid regions with the sparse population;
- The AOD shows a clear seasonal variation in the coastal region and the Indus Basin with the highest AOD during the summer ( >0.6) and smaller values in the spring ( ~0.5), autumn (0.3), and winter ( <0.1);
- The AOD changes with the elevation and increases with increasing population density. These parameters may not be independent, and the observed tendencies are likely due to the relation of these parameters with economic and industrial activity. In addition, some relation with population density may be due to domestic activities and transport phenomena;
- The MERRA-2 and MODIS trends (2002–2018) were compared, and the results show differences between the AOD datasets as a result of using different versions and collection methods;
- The annual and seasonal spatiotemporal trend analysis shows a statistically significant increase of the theAODMERRA-2 (at the 95% confidence level (p < 0.05) in all study regions, with the largest trends in the Katawaz Basin followed by Balochistan Plateau, Indus Basin, and KDR, with 2.29%, 2.12%, 1.87%, and 1.56% per year, respectively.
Supplementary Materials
Author Contributions
Funding
Informed Consent Statement
Data Availability Statement
Acknowledgments
Conflicts of Interest
References
- Intergovernmental Panel on Climate Change (IPCC) 5th Assessment Report (AR5). Observed Climate Change Impacts Database, version 2.01; NASA Socioeconomic Data and Applications Center: Palisades, NY, USA, 2017. [Google Scholar]
- Charlson, R.J.; Schwartz, S.E.; Hales, J.M.; Cess, R.D.; Coakley, J.A.; Hansen, J.E.; Hofmann, D.J. Climate forcing by anthropogenic aerosols. Science 1992, 255, 423–430. [Google Scholar] [CrossRef]
- Dubovik, O.; Holben, B.N.; Eck, T.F.; Smirnov, A.; Kaufman, Y.J.; King, M.D.; Tanre, D.; Slutsker, I. Variability of absorption and optical properties of key aerosol types observed in worldwide locations. J. Atmos. Sci. 2002, 59, 590–608. [Google Scholar] [CrossRef]
- He, Q.Q.; Zhang, M.; Huang, B. Spatio-temporal variation and impact factors analysis of satellite-based aerosol optical depth over China from 2002 to 2015. Atmos. Environ. 2016, 129, 79–90. [Google Scholar] [CrossRef]
- Dockery, D.; Pope III, A.; Xu, X.; Spengler, J.; Ware, J.; Fay, M.; Ferris, B.; Speizer, F. An association between air pollution and mortality in six US cities. N. Engl. J. Med. 1993, 329, 1753–1759. [Google Scholar] [CrossRef] [PubMed] [Green Version]
- Liu, Q.; Wang, S.; Zhang, W.; Li, J.; Dong, G. The effect of natural and anthropogenic factors on PM2. 5: Empirical evidence from Chinese cities with different income levels. Sci. Total Environ. 2019, 653, 157–167. [Google Scholar] [CrossRef]
- Kaskaoutis, D.G.; Singh, R.P.; Gautam, R.; Sharma, M.; Kosmopoulus, P.G.; Tripathi, S.N. Variability and trends of aerosol properties over Kanpur, northern India using AERONET data (2001–2010). Environ. Res. Lett. 2012, 7, 024003. [Google Scholar] [CrossRef] [Green Version]
- Kumar, K.R.; Sivakumar, V.; Yin, Y.; Reddy, R.R.; Kang, N.; Diao, Y.; Adesina, A.J.; Yu, X. Long-term (2003–2013) climatological trends and variations in aerosol optical parameters retrieved from MODIS over three stations in South Africa. Atmos. Environ. 2014, 95, 400–408. [Google Scholar] [CrossRef]
- Kumar, M.; Parmar, K.S.; Kumar, D.B.; Mhawish, A.; Broday, D.M.; Mall, R.K.; Banerjee, T. Long-term aerosol climatology over Indo-Gangetic Plain: Trend, prediction and potential source fields. Atmos. Environ. 2018, 180, 37–50. [Google Scholar] [CrossRef]
- Boiyo, R.K.; Raghavendra, K.; Zhaoa, T. Spatial variations and trends in AOD climatology over East Africa during 2002–2016: A comparative study using three satellite data sets. Int. J. Climatol. 2018, 38, 1221–1240. [Google Scholar] [CrossRef]
- Sun, E.; Xu, X.; Che, H.; Tang, Z.; Gui, K.; An, L.; Lu, C.; Shi, G. Variation in MERRA-2 aerosol optical depth and absorption aerosol optical depth over China from 1980 to 2017. J. Atmos. Solar-Terrest. Phys. 2019, 186, 8–19. [Google Scholar] [CrossRef]
- Dey, S.; Di Girolamo, L. A decade of change in aerosol properties over the Indian subcontinent. Geophys. Res. Lett. 2011, 38, 14811. [Google Scholar] [CrossRef] [Green Version]
- Pan, H.; Wang, M.; Kumar, K.R.; Zhang, J.; Meng, L. A Decadal Global Climatology of Ice Cloud Fraction with Their Microphysical and Optical Properties Inferred from the CALIPSO and Reanalysis Data. Remote. Sens. 2020, 12, 3795. [Google Scholar] [CrossRef]
- Ali, G.; Bao, Y.; Ullah, W.; Ullah, S.; Guan, Q.; Liu, X.; Li, L.; Lei, Y.; Li, G.; Ma, J. Spatiotemporal Trends of Aerosols over Urban Regions in Pakistan and Their Possible Links to Meteorological Parameters. Atmosphere 2020, 11, 306. [Google Scholar] [CrossRef] [Green Version]
- Alam, K.; Qureshi, S.; Blaschke, T. Monitoring spatio-temporal aerosol patterns over Pakistan based on MODIS, TOMS and MISR satellite data and a HYSPLIT model. Atmos. Environ. 2011, 45, 4641–4651. [Google Scholar] [CrossRef]
- Alam, K.; Trautmann, T.; Blaschke, T.; Subhan, F. Changes in aerosol optical properties due to dust storms in the Middle East and Southwest Asia. Remote. Sens. Environ. 2014, 143, 216–227. [Google Scholar] [CrossRef]
- Alam, K.; Trautmann, T.; Blaschke, T.; Majid, H. Aerosol optical and radiative properties during summer and winter seasons over Lahore and Karachi. Atmos. Environ. 2012, 50, 234–245. [Google Scholar] [CrossRef]
- Levy, R.C.; Mattoo, S.; Munchak, L.A.; Remer, L.A.; Sayer, A.M.; Patadia, F.; Hsu, N.C. The Collection 6 MODIS aerosol products over land and ocean. Atmos. Meas. Tech. 2013, 6, 2989–3034. [Google Scholar] [CrossRef] [Green Version]
- Luo, Y.; Zheng, X.; Zhao, T.; Chen, J. A climatology of aerosol optical depth over China from recent 10 years of MODIS remote sensing data. Int. J. Clim. 2013, 34, 863–870. [Google Scholar] [CrossRef]
- Popp, T.; de Leeuw, C.G.; Bingen, C.; Brühl, V.; Capelle, A.; Chedin, L.; Clarisse, O.; Dubovik, R.; Grainger, J.; Griesfeller, A.; et al. Development, production and evaluation of aerosol Climate Data Records from European satellite observations (Aerosol_cci). Remote. Sens. 2016, 8, 421. [Google Scholar] [CrossRef] [Green Version]
- De Leeuw, G.; Sogacheva, L.; Rodriguez, E.; Kourtidis, K.; Georgoulias, A.K.; Alexandri, G.; Amiridis, V.; Proestakis, E.; Marinou, E.; Xue, Y.; et al. Two decades of satellite observations of AOD over mainland China using ATSR-2, AATSR and MODIS/Terra: Data set evaluation and large-scale patterns. Atmos. Chem. Phys. Discuss. 2018, 18, 1573–1592. [Google Scholar] [CrossRef] [Green Version]
- Sogacheva, L.; Popp, T.; Sayer, A.M.; Dubovik, O.; Garay, M.J.; Heckel, A.; Hsu, N.C.; Jethva, H.; Kahn, R.A.; Kolmonen, P.; et al. Merging regional and global aerosol optical depth records from major available satellite products. Atmos. Chem. Phys. Discuss. 2020, 20, 2031–2056. [Google Scholar] [CrossRef] [Green Version]
- Sogacheva, L.; de Leeuw, G.; Rodriguez, E.; Kolmonen, P.; Georgoulias, A.K.; Alexandri, G.; Kourtidis, K.; Proestakis, E.; Marinou, E.; Amiridis, V.; et al. Spatial and seasonal variations of aerosols over China from two decades of multi-satellite observations—Part 1: ATSR (1995–2011) and MODIS C6.1 (2000–2017). Atmos. Chem. Phys. 2018, 18, 11389–11407. [Google Scholar] [CrossRef] [Green Version]
- Torres, O.; Jethva, H.; Bhartia, P.K. Retrieval of Aerosol Optical Depth above Clouds from OMI Observations: Sensitivity Analysis and Case Studies. J. Atmos. Sci. 2012, 69, 1037–1053. [Google Scholar] [CrossRef]
- Mc Carty, W.; Coy, L.; Gelaro, R.; Huang, A.; Merkova, D.; Smith, E.B.; Sienkiewicz, M.; Wargan, K. MERRA-2input observations: Summary and assessment; NASA TM-2016- 104606; NASA Global Modeling and Assimilation Office: Phoenix, AZ, USA, 2016; Volume 46, p. 64. [Google Scholar]
- Randles, C.A.; Da Silva, A.M.; Buchard, V.; Colarco, P.R.; Darmenov, A.; Govindaraju, R.; Mirnov, A.; Holben, B.; Ferrare, R.; Hair, J.; et al. The MERRA-2 aerosol reanalysis, 1980 onward. Part I, System description and data assimilation evaluation. J. Clim. 2017, 30, 6823–6850. [Google Scholar] [CrossRef]
- Klingmüller, K.; Pozzer, A.; Metzger, S.; Stenchikov, G.L.; Lelieveld, J. Aerosol optical depth trend over the Middle East. Atmos. Chem. Phys. Discuss. 2016, 16, 5063–5073. [Google Scholar] [CrossRef] [Green Version]
- Che, H.; Gui, K.; Xia, X.; Wang, Y.; Holben, B.N.; Goloub, P.; Cuevas-Agulló, E.; Wang, H.; Zheng, Y.; Zhao, H.; et al. Large contribution of meteorological factors to inter-decadal changes in regional aerosol optical depth. Atmos. Chem. Phys. Discuss. 2019, 19, 10497–10523. [Google Scholar] [CrossRef] [Green Version]
- Khan, R.; Kumar, K.R.; Zhao, T. The climatology of aerosol optical thickness and radiative effects in Southeast Asia from 18-years of ground-based observations. Environ. Pollut. 2019, 254, 113025. [Google Scholar] [CrossRef] [PubMed]
- Gupta, P.; Khan, M.N.; Da Silva, A.; Patadia, F. MODIS aerosol optical depth observations over urban areas in Pakistan: Quantity and quality of the data for air quality monitoring. Atmos. Pollut. Res. 2013, 4, 43–52. [Google Scholar] [CrossRef] [Green Version]
- Wu, J.; Luo, J.; Zhang, L.; Xia, L.; Zhao, D.; Tang, J. Improvement of aerosol optical depth retrieval using visibility data in China during the past 50 years. J. Geophys. Res. Atmos. 2014, 119, 370. [Google Scholar] [CrossRef]
- Qin, W.; Liu, Y.; Wang, L.; Lin, A.; Xia, X.; Che, H.; Bilal, M.; Zhang, M. Characteristic and Driving Factors of Aerosol Optical Depth over Mainland China during 1980–2017. Remote. Sens. 2018, 10, 1064. [Google Scholar] [CrossRef] [Green Version]
- He, L.; Wang, L.; Lin, A.; Zhang, M.; Xia, X.; Tao, M.; Zhou, H. What drives changes in aerosol properties over the Yangtze River Basin in past four decade? Atmos. Environ. 2018, 190, 269–283. [Google Scholar] [CrossRef]
- Khan, R.; Kumar, K.R.; Zhao, T.; Ali, G. The contribution of different aerosol types to direct radiative forcing over distinct environments of Pakistan inferred from the AERONET data. Environ. Res. Lett. 2020, 15, 114062. [Google Scholar] [CrossRef]
- Bibi, H.; Alam, K.; Chishtie, F.; Bibi, S.; Shahid, I.; Blaschke, T. Intercomparison of MODIS, MISR, OMI, and CALIPSO Aerosol Optical Depth Retrievals for Four Locations on the Indo-Gangetic Plains and Validation against AERONET Data. Atmos. Environt. 2015, 111, 113–126. [Google Scholar] [CrossRef]
- Iftikhar, M.; Alam, K.; Sorooshian, A.; Syed, W.A.; Bibi, S.; Bibi, H. Contrasting aerosol optical and radiative properties between dust and urban haze episodes in megacities of Pakistan. Atmos. Environ. 2018, 173, 157–172. [Google Scholar] [CrossRef]
- Hsu, N.C.; Tsay, S.-C.; King, M.D.; Herman, J.R. Aerosol Properties over Bright-Reflecting Source Regions. IEEE Trans. Geosci. Remote. Sens. 2004, 42, 557–569. [Google Scholar] [CrossRef]
- Hsu, N.C.; Jeong, M.-J.; Bettenhausen, C.; Sayer, A.; Hansell, A.R.; Seftor, C.S.; Huang, J.; Tsay, S.-C. Enhanced Deep Blue aerosol retrieval algorithm: The second generation. J. Geophys. Res. Atmos. 2013, 118, 9296–9315. [Google Scholar] [CrossRef]
- Sayer, A.M.; Hsu, N.C.; Bettenhausen, C.; Jeong, M.J. Validation and uncertainty estimates for MODIS Collection 6 “deep Blue” aerosol data. J. Geophys. Res.-Atmos. 2013, 118, 7864–7872. [Google Scholar] [CrossRef] [Green Version]
- Sayer, A.; Munchak, L.A.; Hsu, N.C.; Levy, R.C.; Bettenhausen, C.; Jeong, M.J. MODIS Collection 6 aerosol products: Comparison between Aqua’s e-Deep Blue, Dark Target, and “merged” data sets, and usage recommendations. J. Geophys. Res. Atmos. 2014, 119. [Google Scholar] [CrossRef]
- Sayer, A.M.; Hsu, N.C.; Bettenhausen, C.; Jeong, M.; Meister, G. Effect of MODIS Terra radiometric calibration improvements on Collection 6 Deep Blue aerosol products: Validation and Terra/Aqua consistency. J. Geophys. Res. Atmos. 2015, 120. [Google Scholar] [CrossRef] [Green Version]
- Khalid, B.; Khalid, A.; Muslim, S.; Habib, A.; Khan, K.; Alvim, D.S.; Shakoor, S.; Mustafa, S.; Zaheer, S.; Zoon, M.; et al. Estimation of aerosol optical depth in relation to meteorological parameters over eastern and western routes of China Pakistan economic corridor. J. Environ. Sci. 2021, 99, 28–39. [Google Scholar] [CrossRef] [PubMed]
- Ilyas, S.Z.; Khattak, A.I.; Nasir, S.M.; Qurashi, T.; Durrani, R. Air pollution assessment in urban areas and its impact on human health in the city of Quetta, Pakistan. Clean Technol. Environ. Policy 2009, 12, 291–299. [Google Scholar] [CrossRef]
- Gelaro, R.; Mccarty, W.; Suárez, M.J.; Todling, R.; Molod, A.; Takacs, L.; Randles, C.A.; Darmenov, A.; Bosilovich, M.G.; Reichle, R.; et al. The Modern-Era Retrospective Analysis for Research and Applications, Version 2 (MERRA-2). J. Clim. 2017, 30, 5419–5454. [Google Scholar] [CrossRef]
- Buchard, V.; Randles, C.A.; Da Silva, A.M.; Darmenov, A.; Colarco, P.R.; Govindaraju, R.; Ferrare, R.; Hair, J.; Beyersdorf, A.J.; Ziemba, L.D.; et al. The MERRA-2 Aerosol Reanalysis, 1980 Onward. Part II: Evaluation and Case Studies. J. Clim. 2017, 30, 6851–6872. [Google Scholar] [CrossRef] [PubMed]
- Feng, F.; Wang, K. Does the modern-era retrospective analysis for research and applications-2 aerosol reanalysis introduce an improvement in the simulation of surface solar radiation over China? Int. J. Clim. 2018, 39, 1305–1318. [Google Scholar] [CrossRef]
- Kaufman, Y.J.; Tanré, D.; Remer, L.A.; Vermote, E.F.; Chu, A.; Holben, B.N. Operational remote sensing of tropospheric aerosol over land from EOS moderate resolution imaging spectroradiometer. J. Geophys. Res. Space Phys. 1997, 102, 17051–17067. [Google Scholar] [CrossRef]
- Mann, H.B. Nonparametric tests against trend. Econometrica 1945, 13, 245–259. [Google Scholar] [CrossRef]
- Sonali, P.; Kumar, N.D. Review of trend detection methods and their application to detect temperature changes in India. J. Hydrol. 2013, 476, 212–227. [Google Scholar] [CrossRef]
- Hirsch, R.M.; Slack, J.R. A Nonparametric Trend Test for Seasonal Data with Serial Dependence. Water Resour. Res. 1984, 20, 727–732. [Google Scholar] [CrossRef] [Green Version]
- Salman, S.A.; Shahid, S.; Ismail, T.; Chung, E.-S.; Al-Abadi, A.M. Long-term trends in daily temperature extremes in Iraq. Atmos. Res. 2017, 198, 97–107. [Google Scholar] [CrossRef]
- Hamed, K.H.; Ramachandra, R. A modified Mann-Kendall trend test for auto correlated data. J. Hydrol. 1998, 204, 182–196. [Google Scholar] [CrossRef]
- Partal, T. Wavelet transform-based analysis of periodicities and trends of Sakarya basin (Turkey) streamflow data. River Res. Appl. 2009, 26, 695–711. [Google Scholar] [CrossRef]
- Nasri, M.; Modarres, R. Dry spell trend analysis of Isfahan Province, Iran. Int. J. Clim. 2009, 29, 1430–1438. [Google Scholar] [CrossRef]
- Ahmad, I.; Zhang, F.; Tayyab, M.; Anjum, M.N.; Zaman, M.; Liu, J.; Farid, H.U.; Saddique, Q. Spatiotemporal analysis of precipitation variability in annual, seasonal and extreme values over upper Indus River basin. Atmos. Res. 2018, 213, 346–360. [Google Scholar] [CrossRef]
- Rashid, M.; Beecham, S.; Chowdhury, R.K. Assessment of trends in point rainfall using Continuous Wavelet Transforms. Adv. Water Resour. 2015, 82, 1–15. [Google Scholar] [CrossRef]
- Tsidu, M.G.; Bililign, S. Comparison of MERRA-2 and Collection 6 Modis AODs at 0.55 Micron over Diverse Surfaces of Southern Africa during 2000-2017. In Proceedings of the AGU Fall Meeting, Washington, DC, USA, 10–14 December 2018. 51J-2.2301. [Google Scholar]
- Ahmed, K.; Shahid, S.; Chung, E.; Ismail, T.; Wang, X. Spatial distribution of secular trends in annual and seasonal precipitation over Pakistan. Clim. Res. 2017, 74, 95–107. [Google Scholar] [CrossRef]
- Von Storch, H. Misuses of statistical analysis in climate research. In Analysis of Climate Variability; Springer: Berlin/Heidelberg, Germany, 1999; pp. 11–26. [Google Scholar]
- Douglas, E.; Vogel, R.; Kroll, C. Trends in floods and low flows in the United States: Impact of spatial correlation. J. Hydrol. 2000, 240, 90–105. [Google Scholar] [CrossRef]
- Rupakheti, D.; Kang, S.; Rupakheti, M.; Cong, Z.; Panday, A.K.; Holben, B.N. Identification of absorbing aerosol types at a site in the northern edge of Indo-Gangetic plain and a polluted valley in the foothills of the central Himalayas. Atmos. Res. 2019, 223, 15–23. [Google Scholar] [CrossRef]
- Mehta, M.; Singh, R.; Singh, A.; Singh, N. Anshumali. Recent global aerosol optical depth variations and trends—A comparative study using MODIS and MISR level 3 datasets. Remote. Sens. Environ. 2016, 181, 137–150. [Google Scholar] [CrossRef]
- Wang, J.; Wu, S.; Zhou, S.L.; Tang, J. Relationship between aerosol optical depth and population density in typical area of East China. Appl. Ecol. Env. Res. 2017, 15, 1041–1056. [Google Scholar] [CrossRef]


| Region | Trend (Year−1) | Period | Data Set | Citation |
|---|---|---|---|---|
| Pakistan(Indus Basin) | 0.008 | 1980–2018 | MERRA-2 | Present study |
| Pakistan(Balochistan) | 0.0052 | 1980–2018 | MERRA-2 | Present study |
| Pakistan(Kharan) | 0.002 | 1980–2018 | MERRA-2 | Present study |
| Pakistan(Karachi) | 0.01 | 2001–2018 | AERONET | Khan et al. [29] |
| Pakistan(Lahore) | −0.002 | 2001–2018 | AERONET | Khan et al. [29] |
| Pakistan(Multan) | 0.002 | 2006–2015 | MODIS | Kumar et al. [9] |
| Pakistan(Lahore) | 0.003 | 2006–2015 | MODIS | Kumar et al. [9] |
| Pakistan(Karachi) | 0.004 | 2006–2015 | MODIS | Kumar et al. [9] |
| Pakistan(Karachi) | −0.0013 | 2003–2017 | MODIS | Ali et al. [14] |
| Pakistan(Quetta) | −0.0025 | 2003–2017 | MODIS | Ali et al. [14] |
| Pakistan(Lahore) | 0.0024 | 2003–2017 | MODIS | Ali et al. [14] |
| Pakistan(Lahore) | −0.0006 | 2001–2010 | MODIS | Gupta et al. [30] |
| Middle East (Iran) | 0.005 | 2001–2012 | MODIS | Klingmülleret al. [27] |
| Middle East (Iraq) | 0.034 | 2001–2013 | MODIS | Klingmülleret al. [27] |
| China | 0.004 | 1960–2009 | MISR | Wu et al. [31] |
| China | 0.002 | 1980–2017 | MERRA-2 | Qin et al. [32] |
| East Africa | 0.002 | 2009–2016 | MODIS-DB | Boiyoet al. [10] |
| China(Yangtze River Delta) | 0.0065 | 1980–2016 | MERRA-2 | He et al. [33] |
| Site | Lat (N°) | Lon (E°) | Elevation (m) | ρ | Precipitation (mm) | Study Region | Climate |
|---|---|---|---|---|---|---|---|
| (per km2) | |||||||
| Gilgit (Gil) | 35.92 | 74.33 | 1460 | 17 | 159 | Northern Dry Region | Semiarid region |
| Muzaffarabad (Mzf) | 34.37 | 73.48 | 838 | 300 | 1457 | ||
| Peshawar (Psh) | 34.02 | 71.58 | 328 | 287 | 384 | Katawaz Basin | Semiurban |
| D.I.Khan (DIK) | 31.49 | 70.56 | 171 | 220.4 | 268.8 | ||
| Lahore (Lhr) | 31.35 | 74.24 | 214 | 6300 | 628.8 | Indus Basin | Industrialized, desert |
| Multan (Mlt) | 30.12 | 71.26 | 122 | 6500 | 186.8 | ||
| Quetta (Qt) | 30.11 | 67.57 | 1719 | 5600 | 260.09 | Balochistan Plateau | Suburban, hot desert |
| Sibbi (Sb) | 29.33 | 67.55 | 133 | 32 | 144.3 | ||
| Chhor (Cr) | 25.31 | 69.42 | 5 | 43 | 216.03 | Coastal Region | Urban, coastal |
| Karachi (Kr) | 24.89 | 67.16 | 22 | 3900 | 174.7 | ||
| Khuzdar (Kz) | 27.5 | 66.38 | 1231 | 23 | 252.4 | Kharan Desert Region | Semiurban |
| Panjgur (Pj) | 26.58 | 64.1 | 968 | 19 | 108.7 |
| Scheme | Winter | Spring | Summer | Autumn | Annual |
|---|---|---|---|---|---|
| NDR | 0.08 ± 0.05 | 0.15 ± 0.04 | 0.14 ± 0.04 | 0.08 ± 0.05 | 0.12 ± 0.04 |
| Katawaz Basin | 0.29 ± 0.17 | 0.46 ± 0.12 | 0.52 ± 0.16 | 0.34 ± 0.17 | 0.40 ± 0.15 |
| Indus Basin | 0.23 ± 0.12 | 0.37 ± 0.08 | 0.45 ± 0.12 | 0.28 ± 0.13 | 0.33 ± 0.09 |
| Balochistan Plateau | 0.14 ± 0.06 | 0.30 ± 0.06 | 0.35 ± 0.08 | 0.19 ± 0.08 | 0.24 ± 0.07 |
| Coastal Region | 0.28 ± 0.16 | 0.48 ± 0.11 | 0.57 ± 0.15 | 0.34 ± 0.17 | 0.41 ± 0.13 |
| KDR | 0.25 ± 0.14 | 0.44 ± 0.09 | 0.54 ± 0.13 | 0.31 ± 0.14 | 0.38 ± 0.12 |
| Study Regions | Winter (%) | Spring (%) | Summer (%) | Autumn (%) | Annual (%) | p-Value |
|---|---|---|---|---|---|---|
| NDR | 0.09 | 0.19 | 0.33 | 0.54 | 0.29 | 5210 E-9 |
| Katawaz Basin | 3.06 | 1.61 | 0.99 | 3.51 | 2.29 | 0.0001 E-9 |
| Indus Basin | 2.87 | 0.39 | 1.03 | 3.17 | 1.87 | 0.001 E-9 |
| Balochistan Plateau | 3.35 | 1.23 | 0.65 | 3.23 | 2.12 | 0.0001 E-9 |
| Coastal Region | 0.58 | 0.36 | 0.19 | 0.82 | 0.49 | 0.0001 E-9 |
| KDR | 2.42 | 1.09 | 0.5 | 2.21 | 1.56 | 0.0001 E-9 |
| Pakistan | 2.06 | 0.81 | 0.62 | 2.25 | 1.43 | 0.141 E-0 |
| Season | Period | NDR | Katawaz Basin | Indus Basin | Balochistan Plateau | Coastal Region | KDR | Pakistan |
|---|---|---|---|---|---|---|---|---|
| Winter | 1980–1990 | 0.06 ± 0.04 | 0.13 ± 0.03 | 0.12 ± 0.04 | 0.12 ± 0.03 | 0.14 ± 0.03 | 0.14 ± 0.04 | 0.12 ± 0.03 |
| 1991–2000 | 0.08 ± 0.08 | 0.17 ± 0.08 | 0.16 ± 0.08 | 0.14 ± 0.07 | 0.17 ± 0.07 | 0.16 ± 0.06 | 0.15 ± 0.07 | |
| 2001–2010 | 0.06 ± 0.13 | 0.41 ± 0.09 | 0.30 ± 0.07 | 0.13 ± 0.02 | 0.40 ± 0.08 | 0.31 ± 0.07 | 0.27 ± 0.05 | |
| 2011–2018 | 0.08 ± 0.02 | 0.48 ± 0.09 | 0.36 ± 0.10 | 0.17 ± 0.09 | 0.46 ± 0.11 | 0.411 ± 0.14 | 0.33 ± 0.09 | |
| Spring | 1980–1990 | 0.13 ± 0.04 | 0.37 ± 0.13 | 0.30 ± 0.08 | 0.27 ± 0.05 | 0.42 ± 0.12 | 0.38 ± 0.10 | 0.31 ± 0.08 |
| 1991–2000 | 0.14 ± 0.04 | 0.40 ± 0.13 | 0.32 ± 0.09 | 0.27 ± 0.04 | 0.42 ± 0.11 | 0.37 ± 0.08 | 0.32 ± 0.07 | |
| 2001–2010 | 0.16 ± 0.02 | 0.55 ± 0.12 | 0.44 ± 0.09 | 0.33 ± 0.04 | 0.56 ± 0.13 | 0.49 ± 0.11 | 0.42 ± 0.08 | |
| 2011–2018 | 0.15 ± 0.04 | 0.51 ± 0.12 | 0.40 ± 0.09 | 0.32 ± 0.07 | 0.53 ± 0.13 | 0.50 ± 0.10 | 0.40 ± 0.08 | |
| Summer | 1980–1990 | 0.13 ± 0.05 | 0.43 ± 0.12 | 0.37 ± 0.07 | 0.33 ± 0.08 | 0.50 ± 0.12 | 0.48 ± 0.11 | 0.37 ± 0.08 |
| 1991–2000 | 0.14 ± 0.05 | 0.47 ± 0.12 | 0.39 ± 0.09 | 0.30 ± 0.07 | 0.51 ± 0.11 | 0.49 ± 0.10 | 0.38 ± 0.08 | |
| 2001–2010 | 0.14 ± 0.03 | 0.61 ± 0.17 | 0.54 ± 0.10 | 0.37 ± 0.06 | 0.65 ± 0.16 | 0.61 ± 0.12 | 0.49 ± 0.09 | |
| 2011–2018 | 0.16 ± 0.03 | 0.58 ± 0.13 | 0.51 ± 0.09 | 0.36 ± 0.07 | 0.62 ± 0.13 | 0.58 ± 0.11 | 0.47 ± 0.08 | |
| Autumn | 1980–1990 | 0.07 ± 0.04 | 0.19 ± 0.07 | 0.17 ± 0.06 | 0.17 ± 0.06 | 0.21 ± 0.08 | 0.21 ± 0.09 | 0.17 ± 0.06 |
| 1991–2000 | 0.09 ± 0.08 | 0.25 ± 0.11 | 0.21 ± 0.09 | 0.19 ± 0.08 | 0.24 ± 0.09 | 0.24 ± 0.10 | 0.20 ± 0.09 | |
| 2001–2010 | 0.07 ± 0.01 | 0.46 ± 0.09 | 0.36 ± 0.05 | 0.18 ± 0.04 | 0.45 ± 0.08 | 0.38 ± 0.06 | 0.32 ± 0.04 | |
| 2011–2018 | 0.10 ± 0.03 | 0.51 ± 0.13 | 0.41 ± 0.11 | 0.24 ± 0.08 | 0.49 ± 0.17 | 0.46 ± 0.15 | 0.37 ± 0.10 |
| Study Region | Statistics | Winter | Spring | Summer | Autumn | Annual |
|---|---|---|---|---|---|---|
| p | 0.033 | 0.007 | 7.5 E-07 | 4.51 E-07 | 5.21E-07 | |
| NDR | z | 2.12 | 2.69 | 5.37 | 3.5 | 5.0185 |
| c | 0.0070 E-02 | 0.026 E-02 | 0.048E-02 | 0.046 E-02 | 0.031E-02 | |
| p | 4.13E-09 | 1.48E-07 | 6.41E-04 | 1.05E-12 | 0.00E+00 | |
| Katawaz Basin | z | 5.8791 | 5.2546 | 3.4138 | 7.1237 | 14.683 |
| c | 0.0084 | 0.0063 | 0.0050 | 0.0121 | 0.0351 | |
| p | 4.22E-15 | 8.20E-09 | 1.39E-05 | 1.33E-07 | 1.45E-13 | |
| Indus Basin | z | 7.846 | 5.7644 | 4.3452 | 5.2742 | 7.3913 |
| c | 0.0065 | 0.0012 | 0.0046 | 0.0089 | 0.0053 | |
| p | 2.86E-13 | 4.05E-06 | 0.0016 | 6.06E-06 | 0.00E+00 | |
| Balochistan Plateau | z | 7.3 | 4.6089 | 3.1574 | 4.52 | 0 |
| c | 0.009 | 0.0048 | 0.0037 | 0.011 | 0.0071 | |
| p | 0.009 | 0.2584 | 0.5066 | 0.0153 | 1.77E-04 | |
| Coastal Region | z | 2.6129 | 1.1302 | 0.6641 | 2.4243 | 3.7498 |
| c | 0.087E-02 | 0.001 | 0.064E-02 | 0.0016 | 0.001 | |
| p | 0.0021 | 0.1799 | 0.584 | 0.0039 | 0.004 | |
| KDR | z | 3.0726 | 1.341 | 0.5476 | 2.8857 | 2.8791 |
| c | 0.0058 | 0.0041 | 0.00271 | 0.0070 | 0.0045 |
Publisher’s Note: MDPI stays neutral with regard to jurisdictional claims in published maps and institutional affiliations. |
© 2021 by the authors. Licensee MDPI, Basel, Switzerland. This article is an open access article distributed under the terms and conditions of the Creative Commons Attribution (CC BY) license (http://creativecommons.org/licenses/by/4.0/).
Share and Cite
Khan, R.; Kumar, K.R.; Zhao, T.; Ullah, W.; de Leeuw, G. Interdecadal Changes in Aerosol Optical Depth over Pakistan Based on the MERRA-2 Reanalysis Data during 1980–2018. Remote Sens. 2021, 13, 822. https://0-doi-org.brum.beds.ac.uk/10.3390/rs13040822
Khan R, Kumar KR, Zhao T, Ullah W, de Leeuw G. Interdecadal Changes in Aerosol Optical Depth over Pakistan Based on the MERRA-2 Reanalysis Data during 1980–2018. Remote Sensing. 2021; 13(4):822. https://0-doi-org.brum.beds.ac.uk/10.3390/rs13040822
Chicago/Turabian StyleKhan, Rehana, Kanike Raghavendra Kumar, Tianliang Zhao, Waheed Ullah, and Gerrit de Leeuw. 2021. "Interdecadal Changes in Aerosol Optical Depth over Pakistan Based on the MERRA-2 Reanalysis Data during 1980–2018" Remote Sensing 13, no. 4: 822. https://0-doi-org.brum.beds.ac.uk/10.3390/rs13040822