
Variable Magnitude and Intensity of Strombolian Explosions: Focus on the Eruptive Processes for a First Classification Scheme for Stromboli Volcano (Italy)

 ,
,  , , and
Abstract
:
1. Introduction
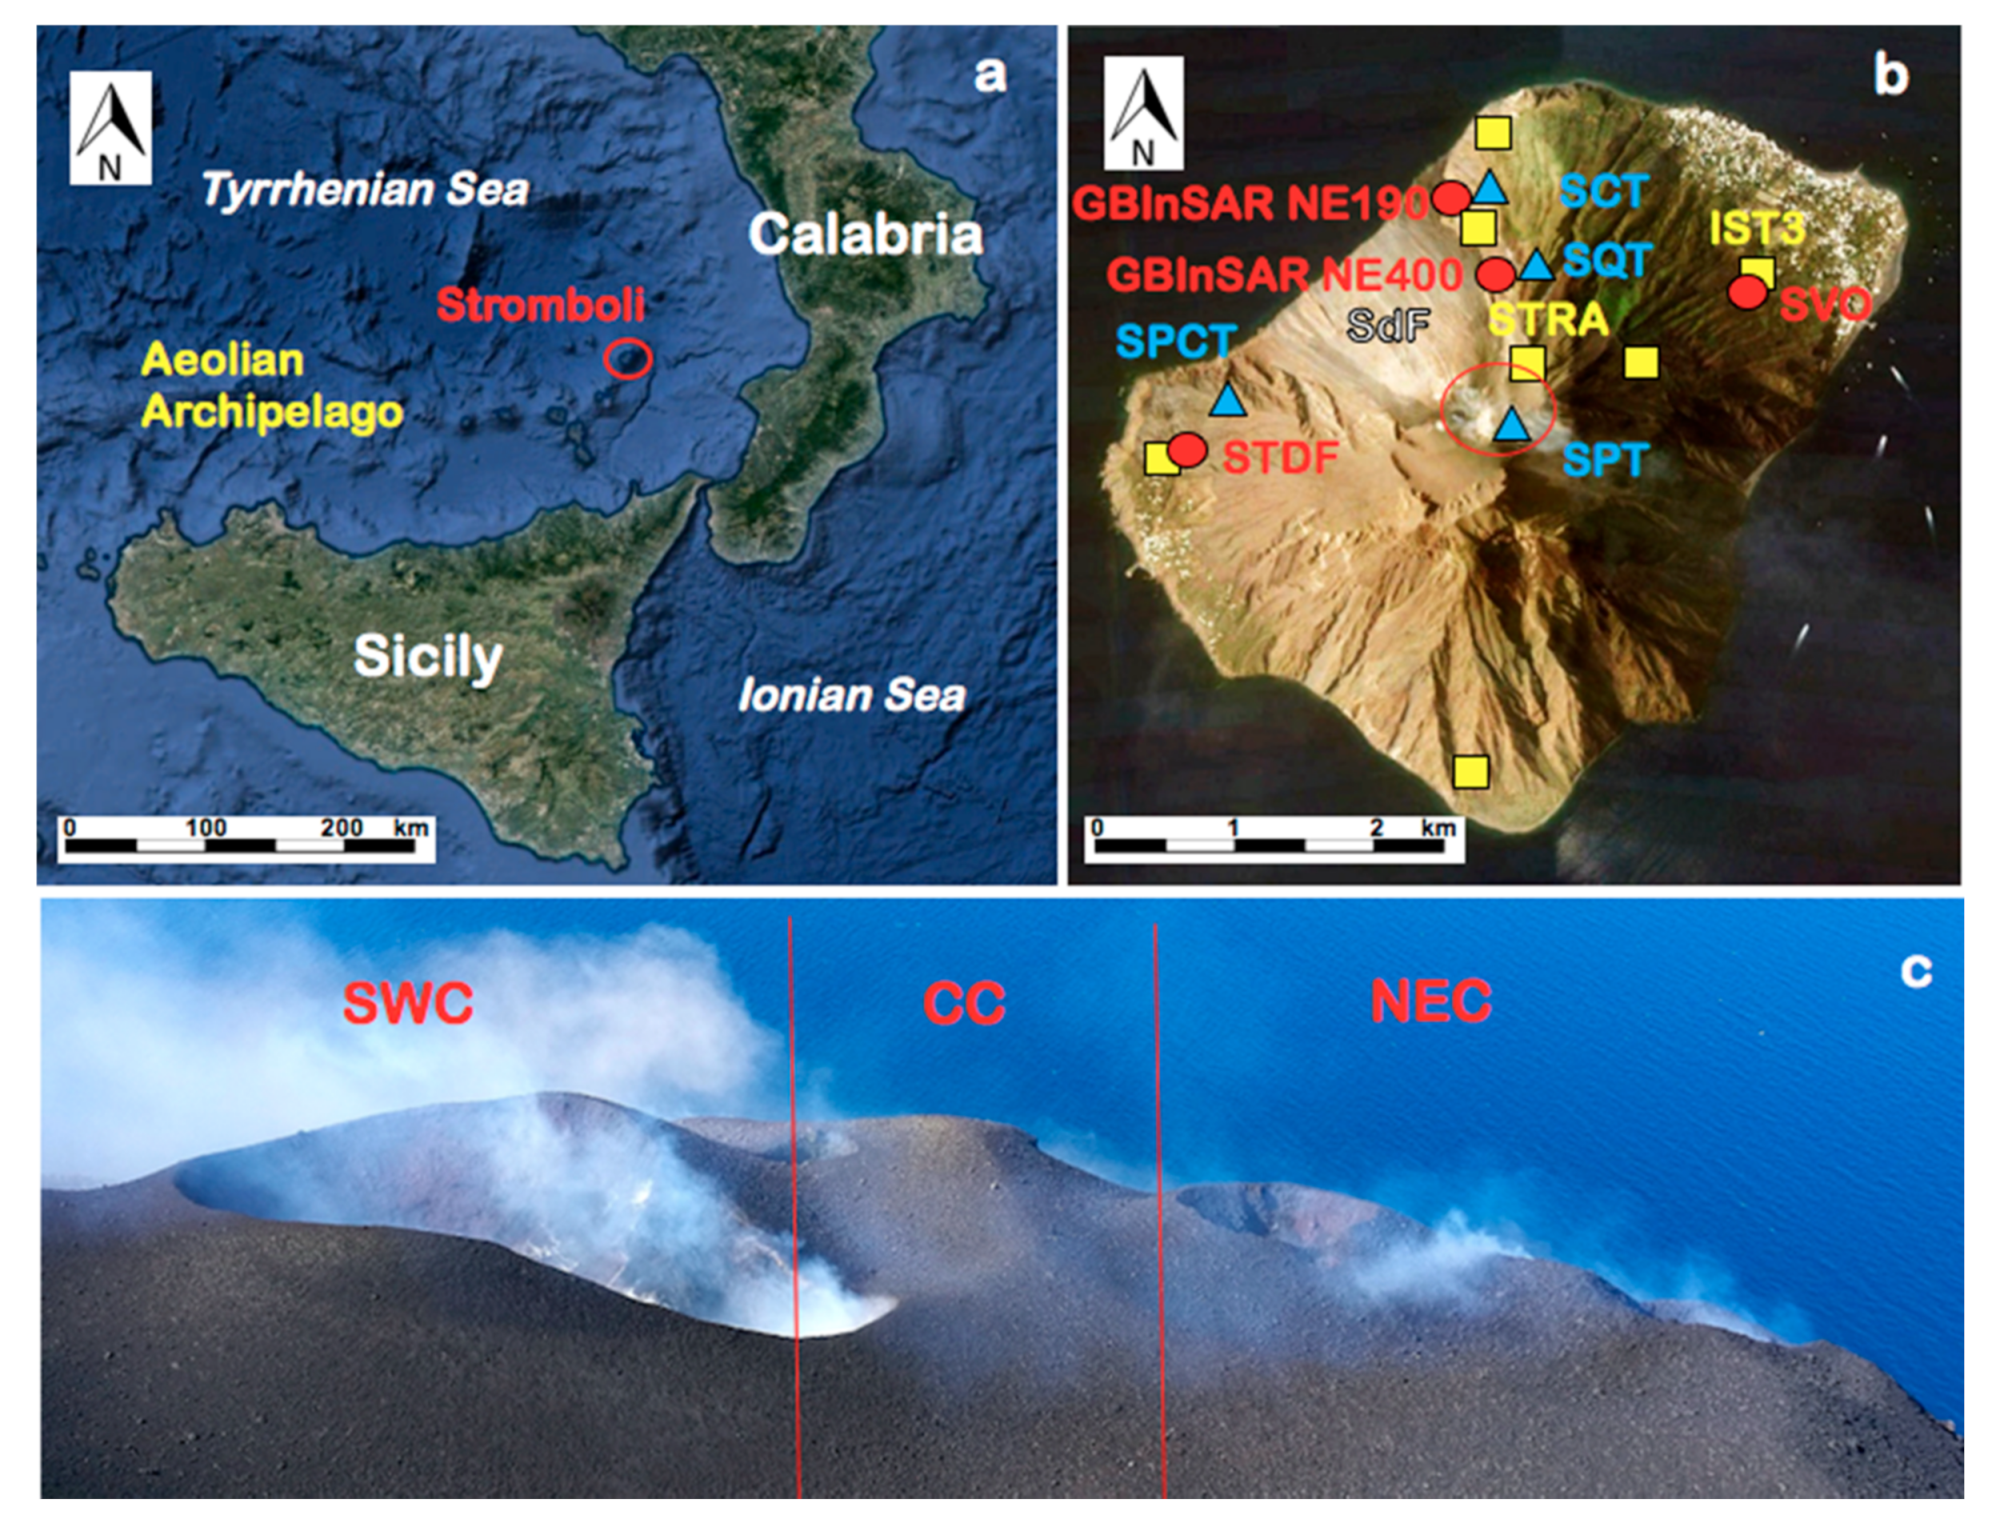
2. Methods
3. Results
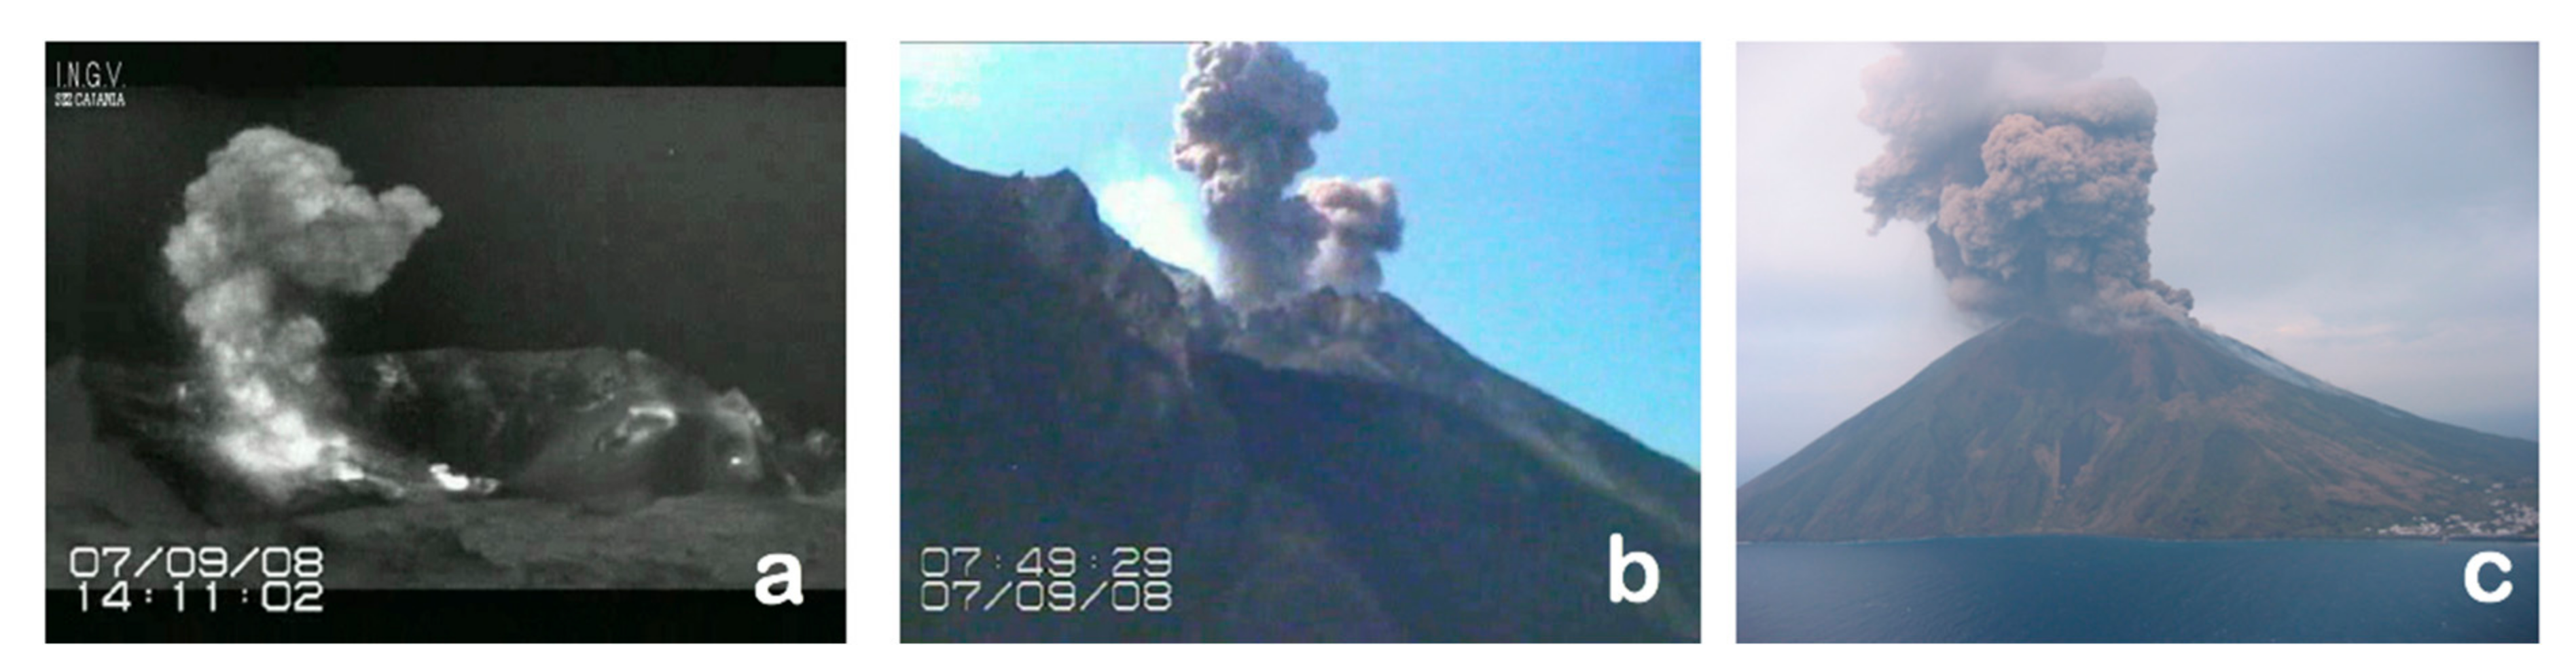
3.1. Explosive Events Description
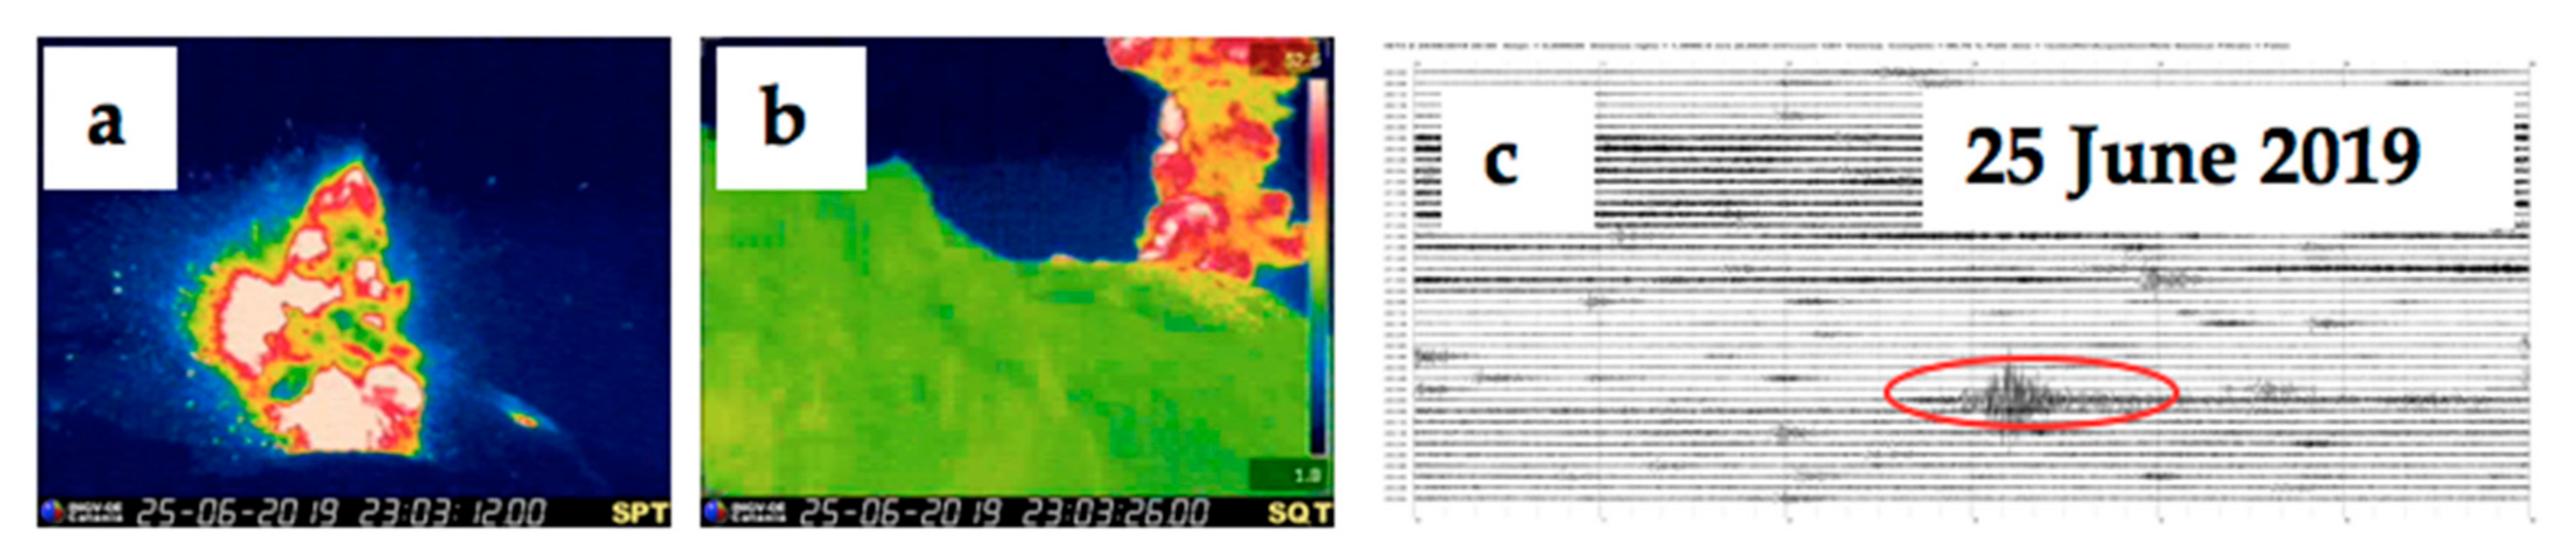
3.1.1. The 25 June 2019 Event

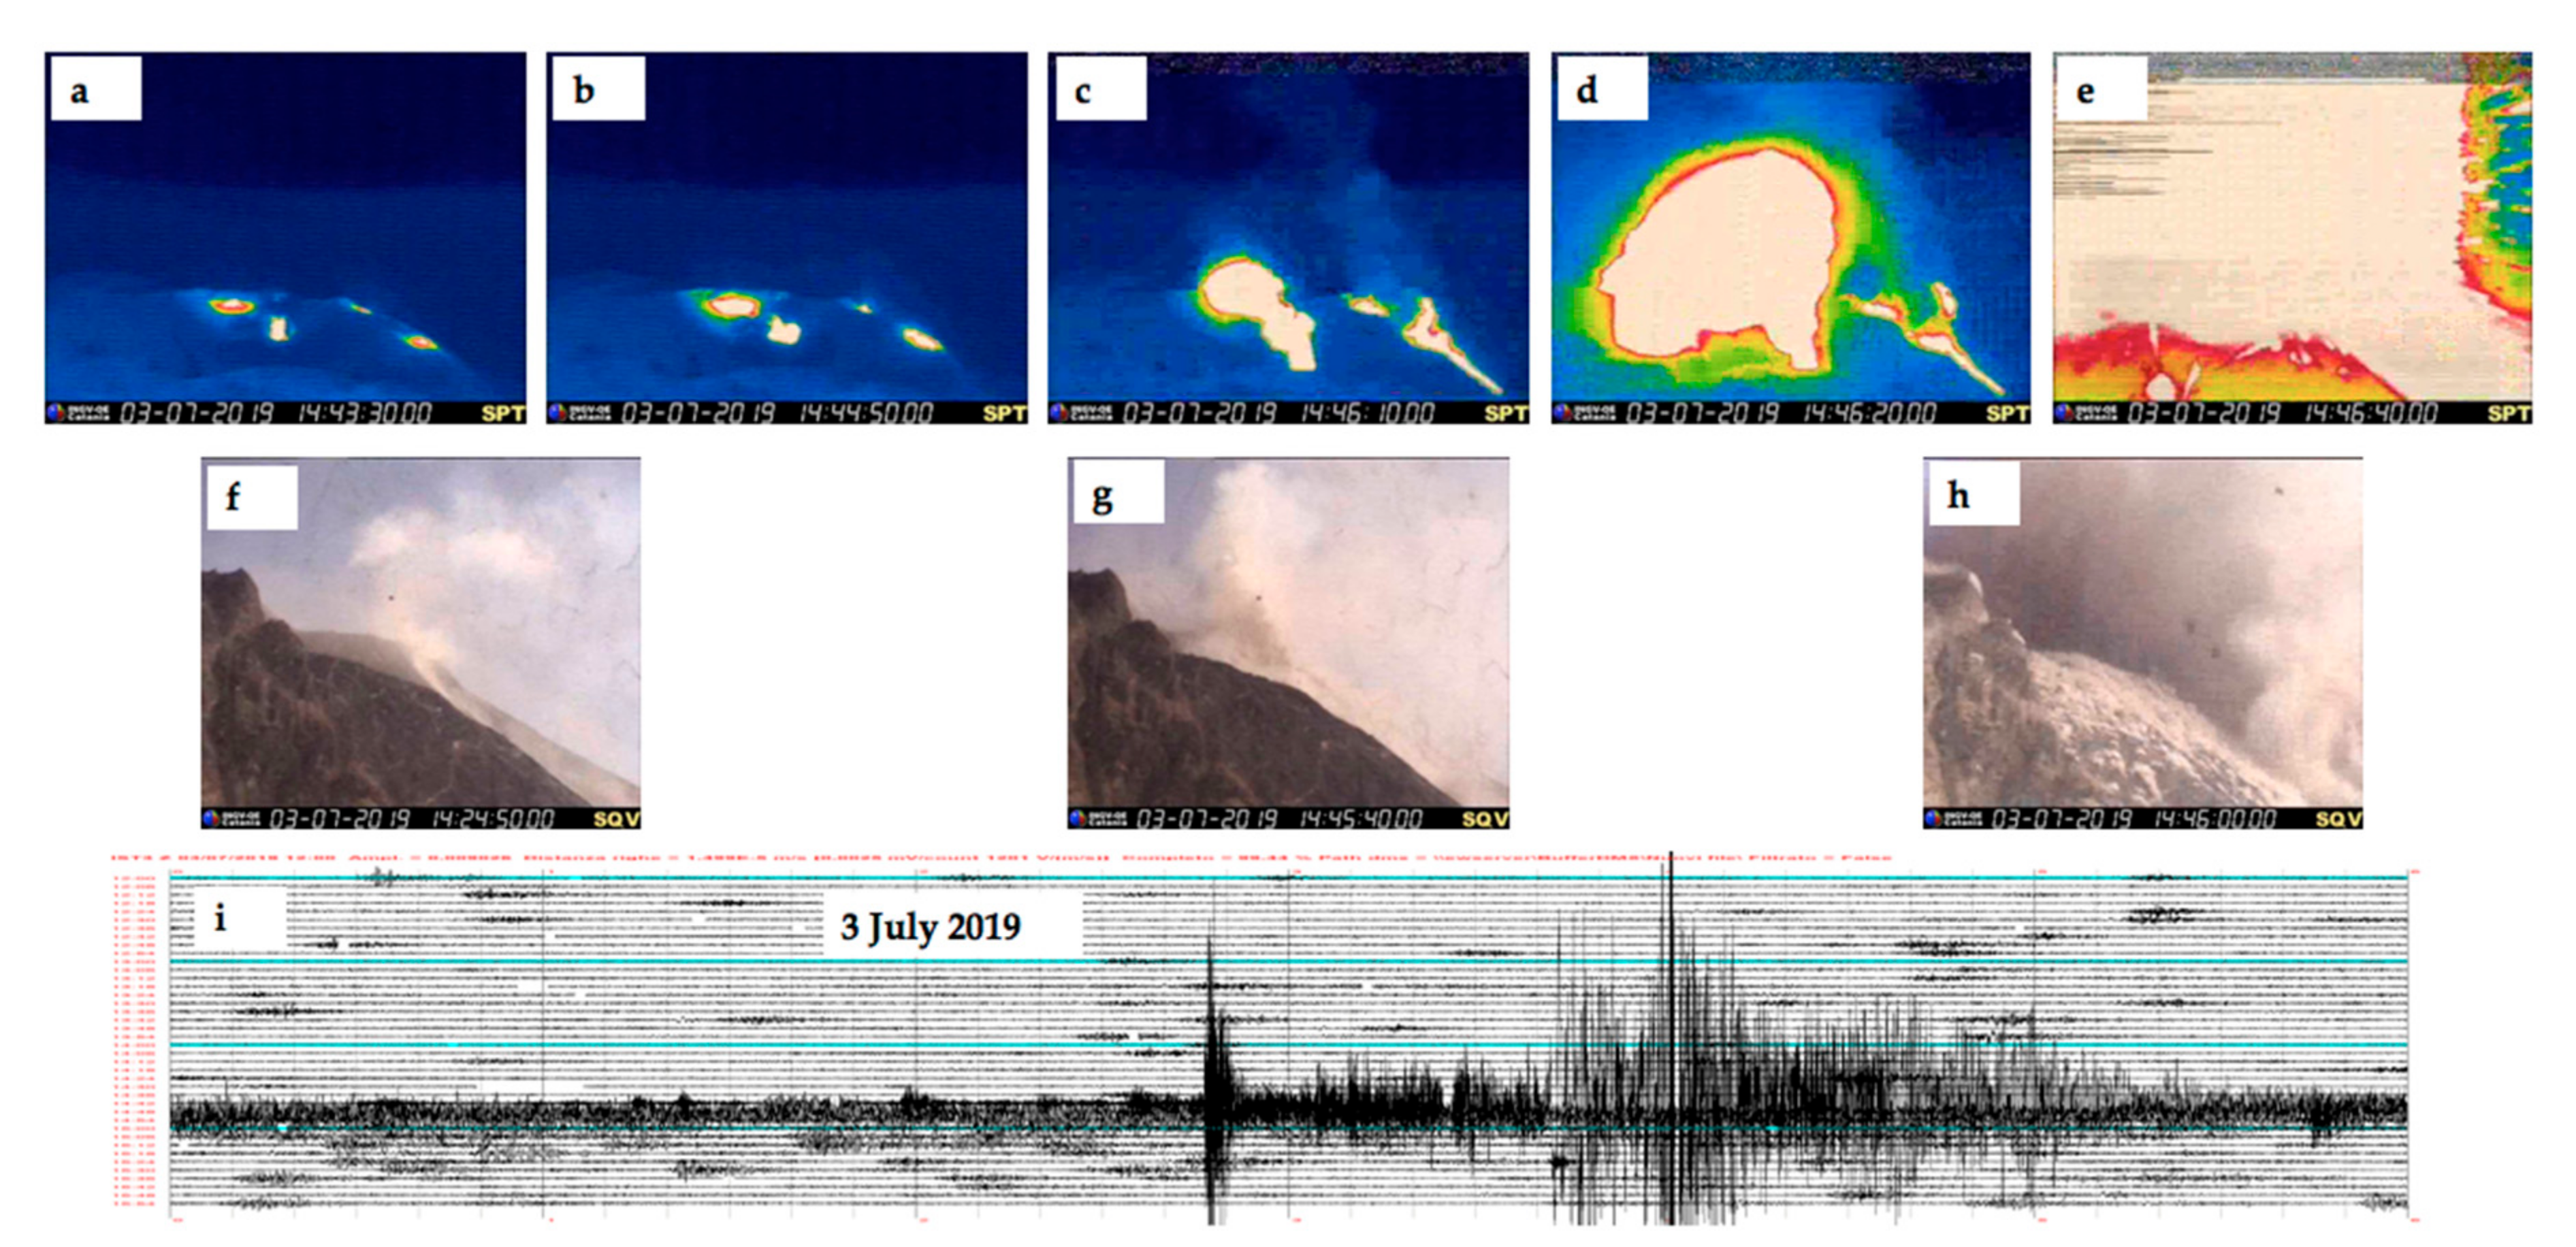
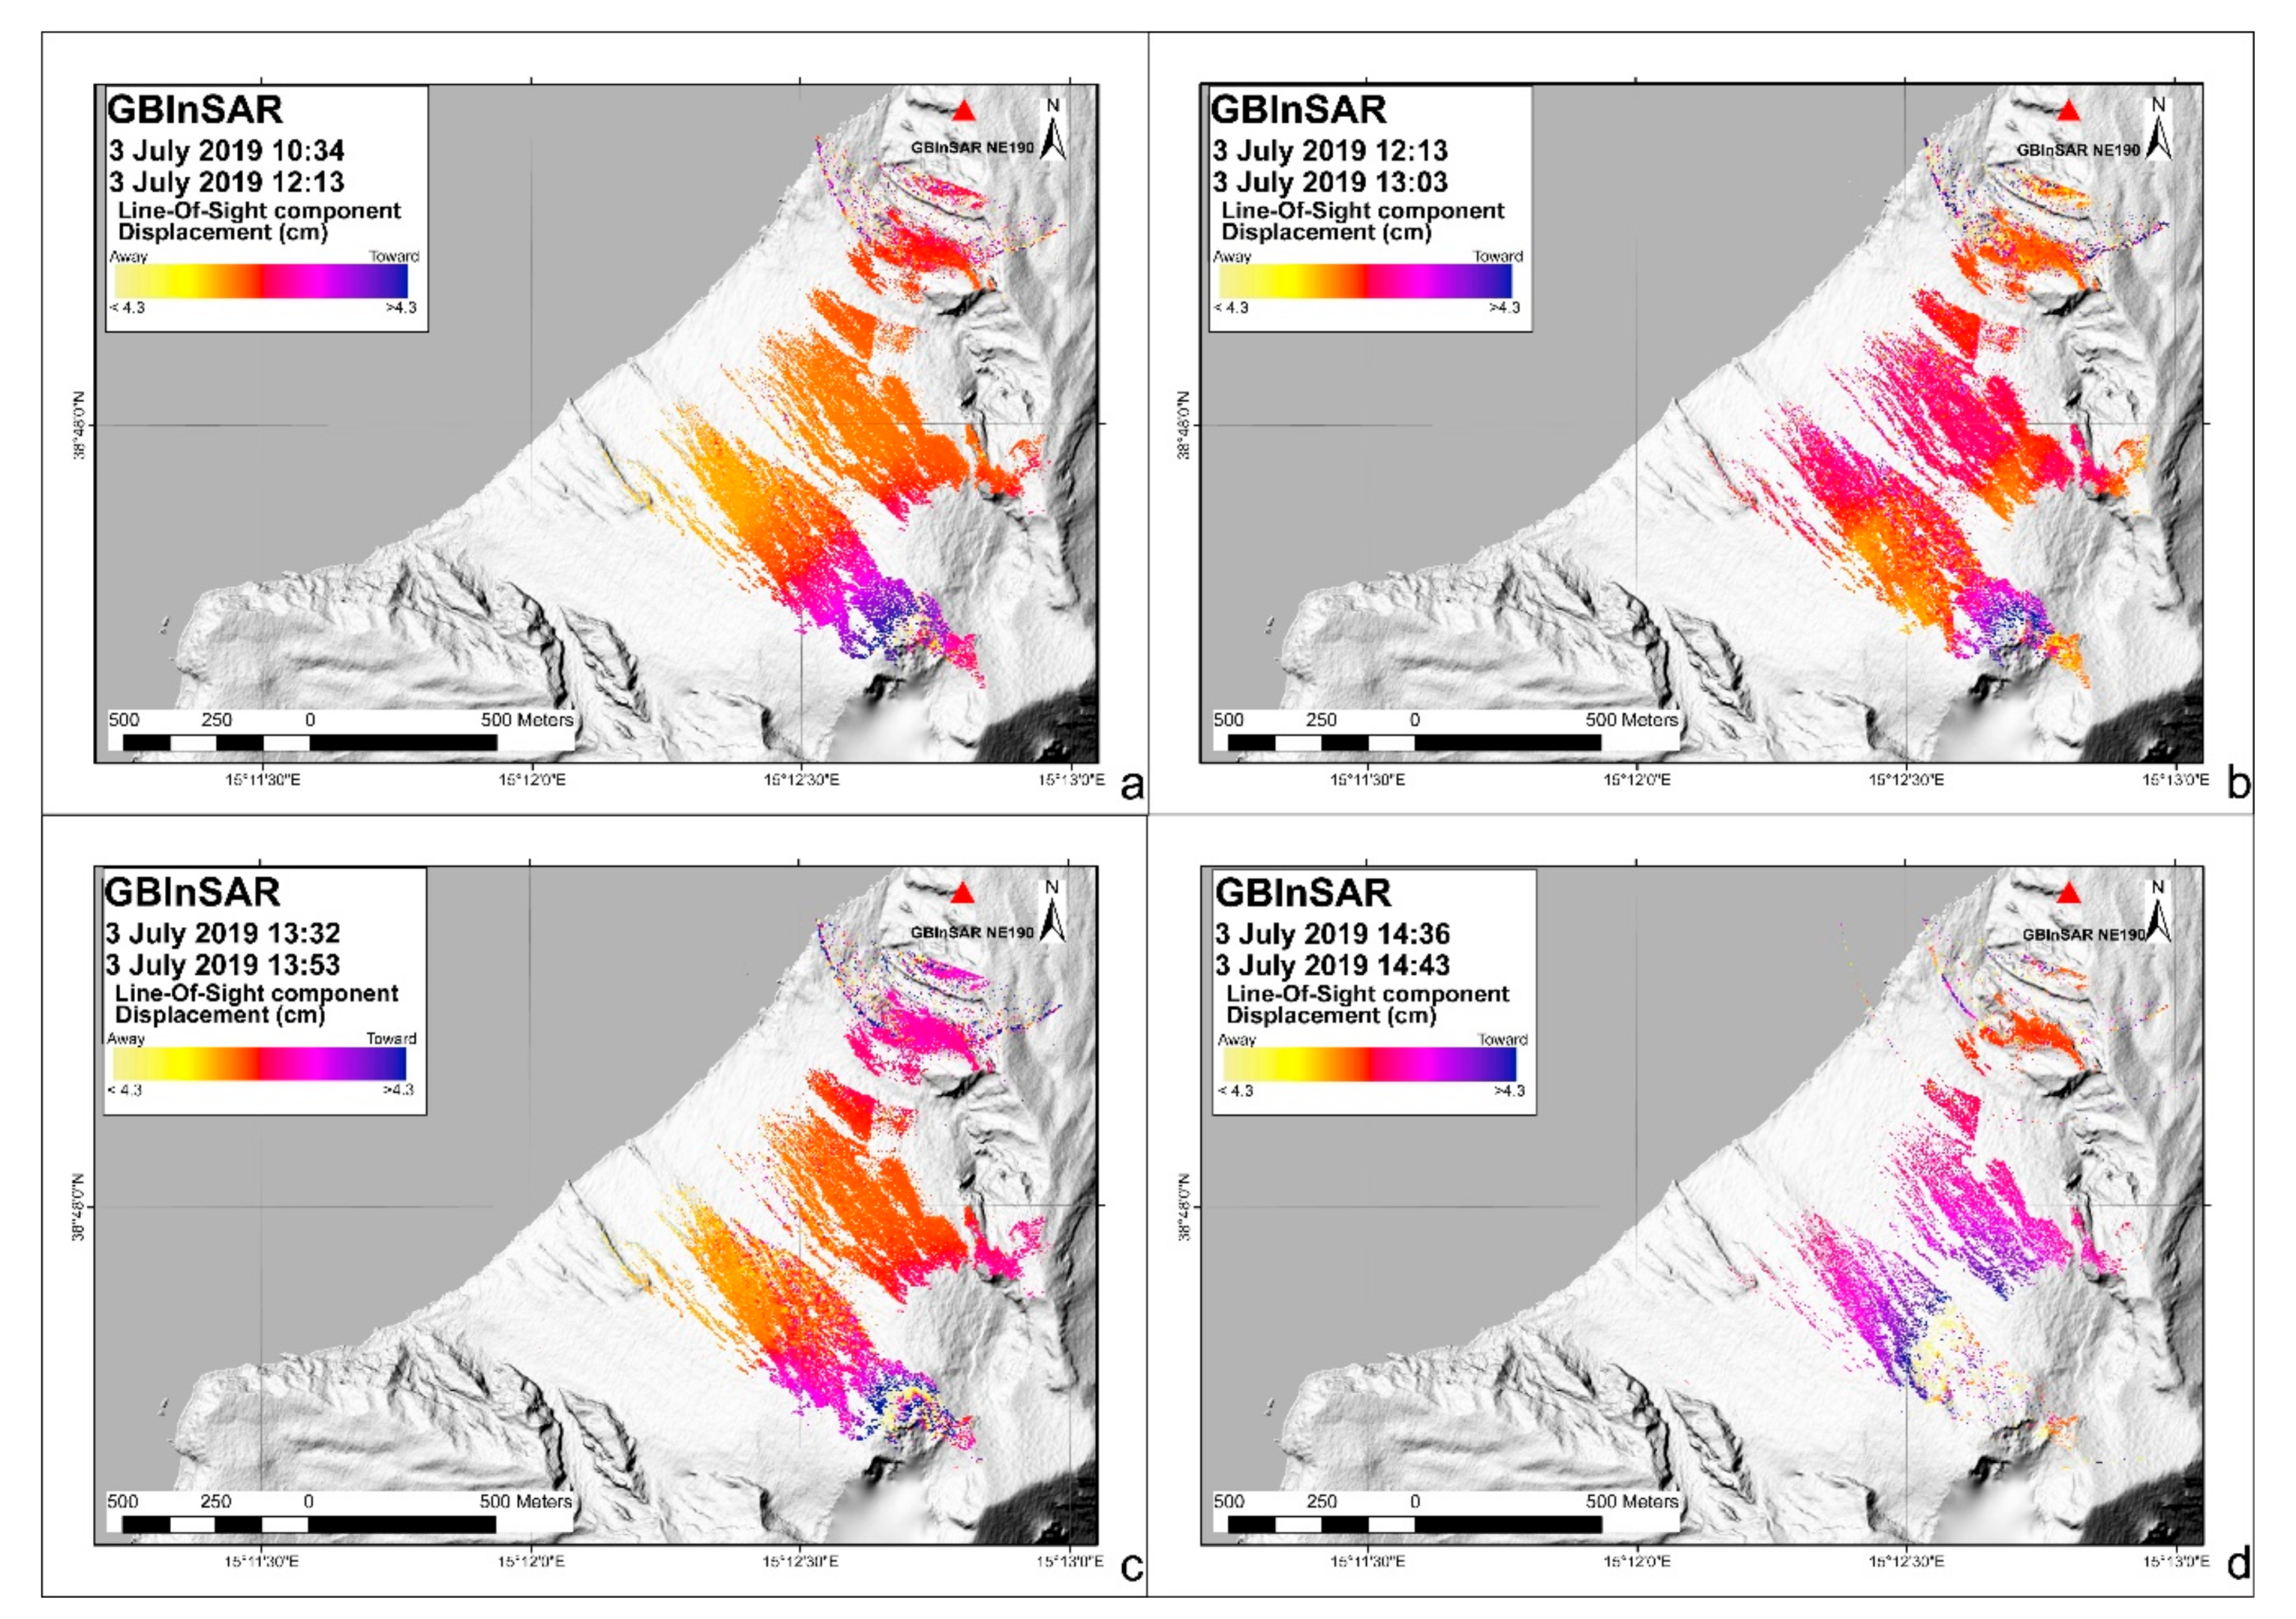
3.1.2. The 3 July 2019 Paroxysm

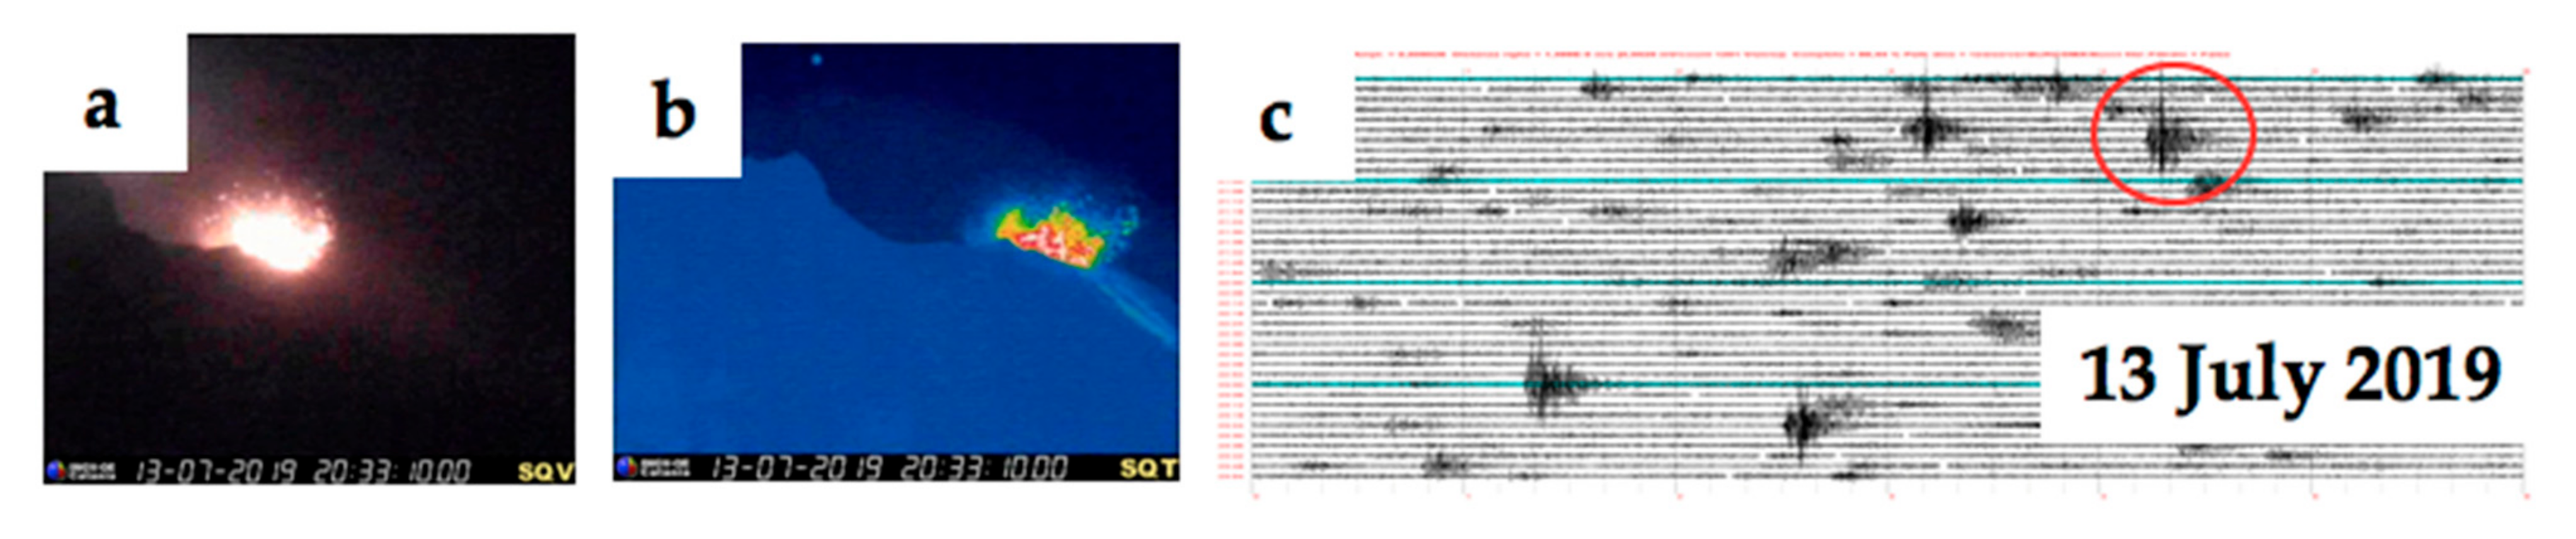
3.1.3. The 13 July 2019 Event

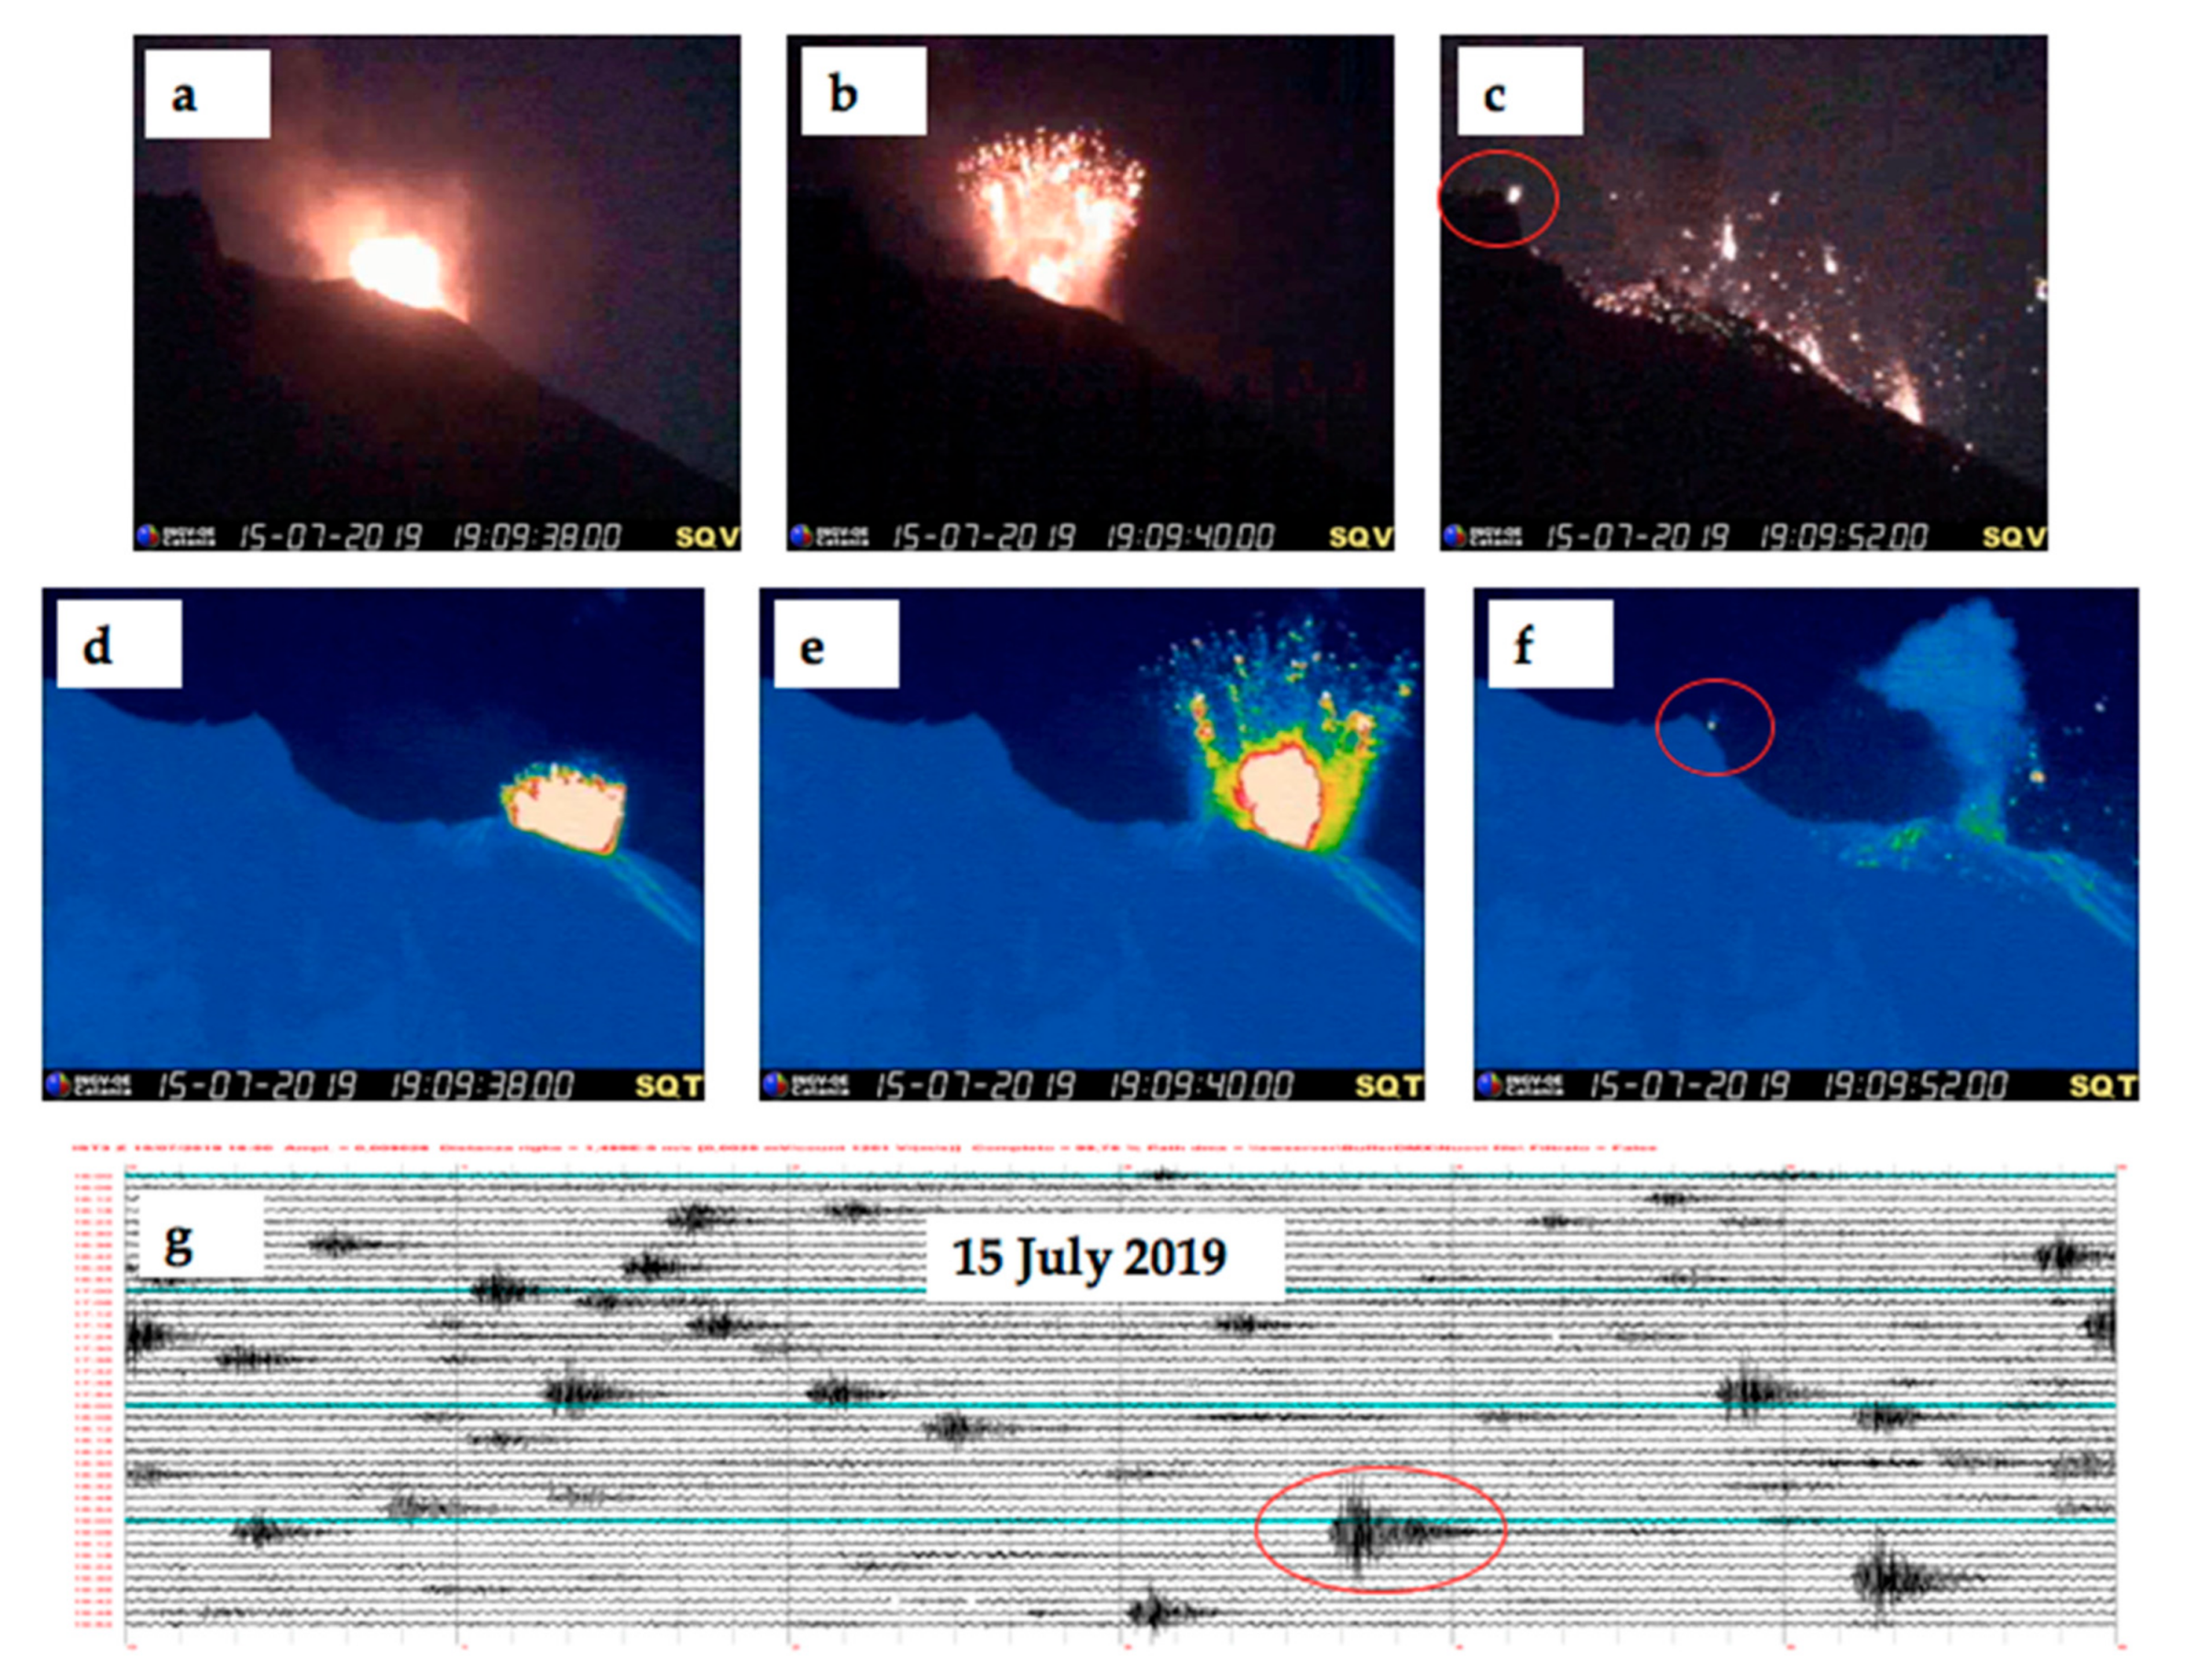
3.1.4. The 15 July 2019 Event

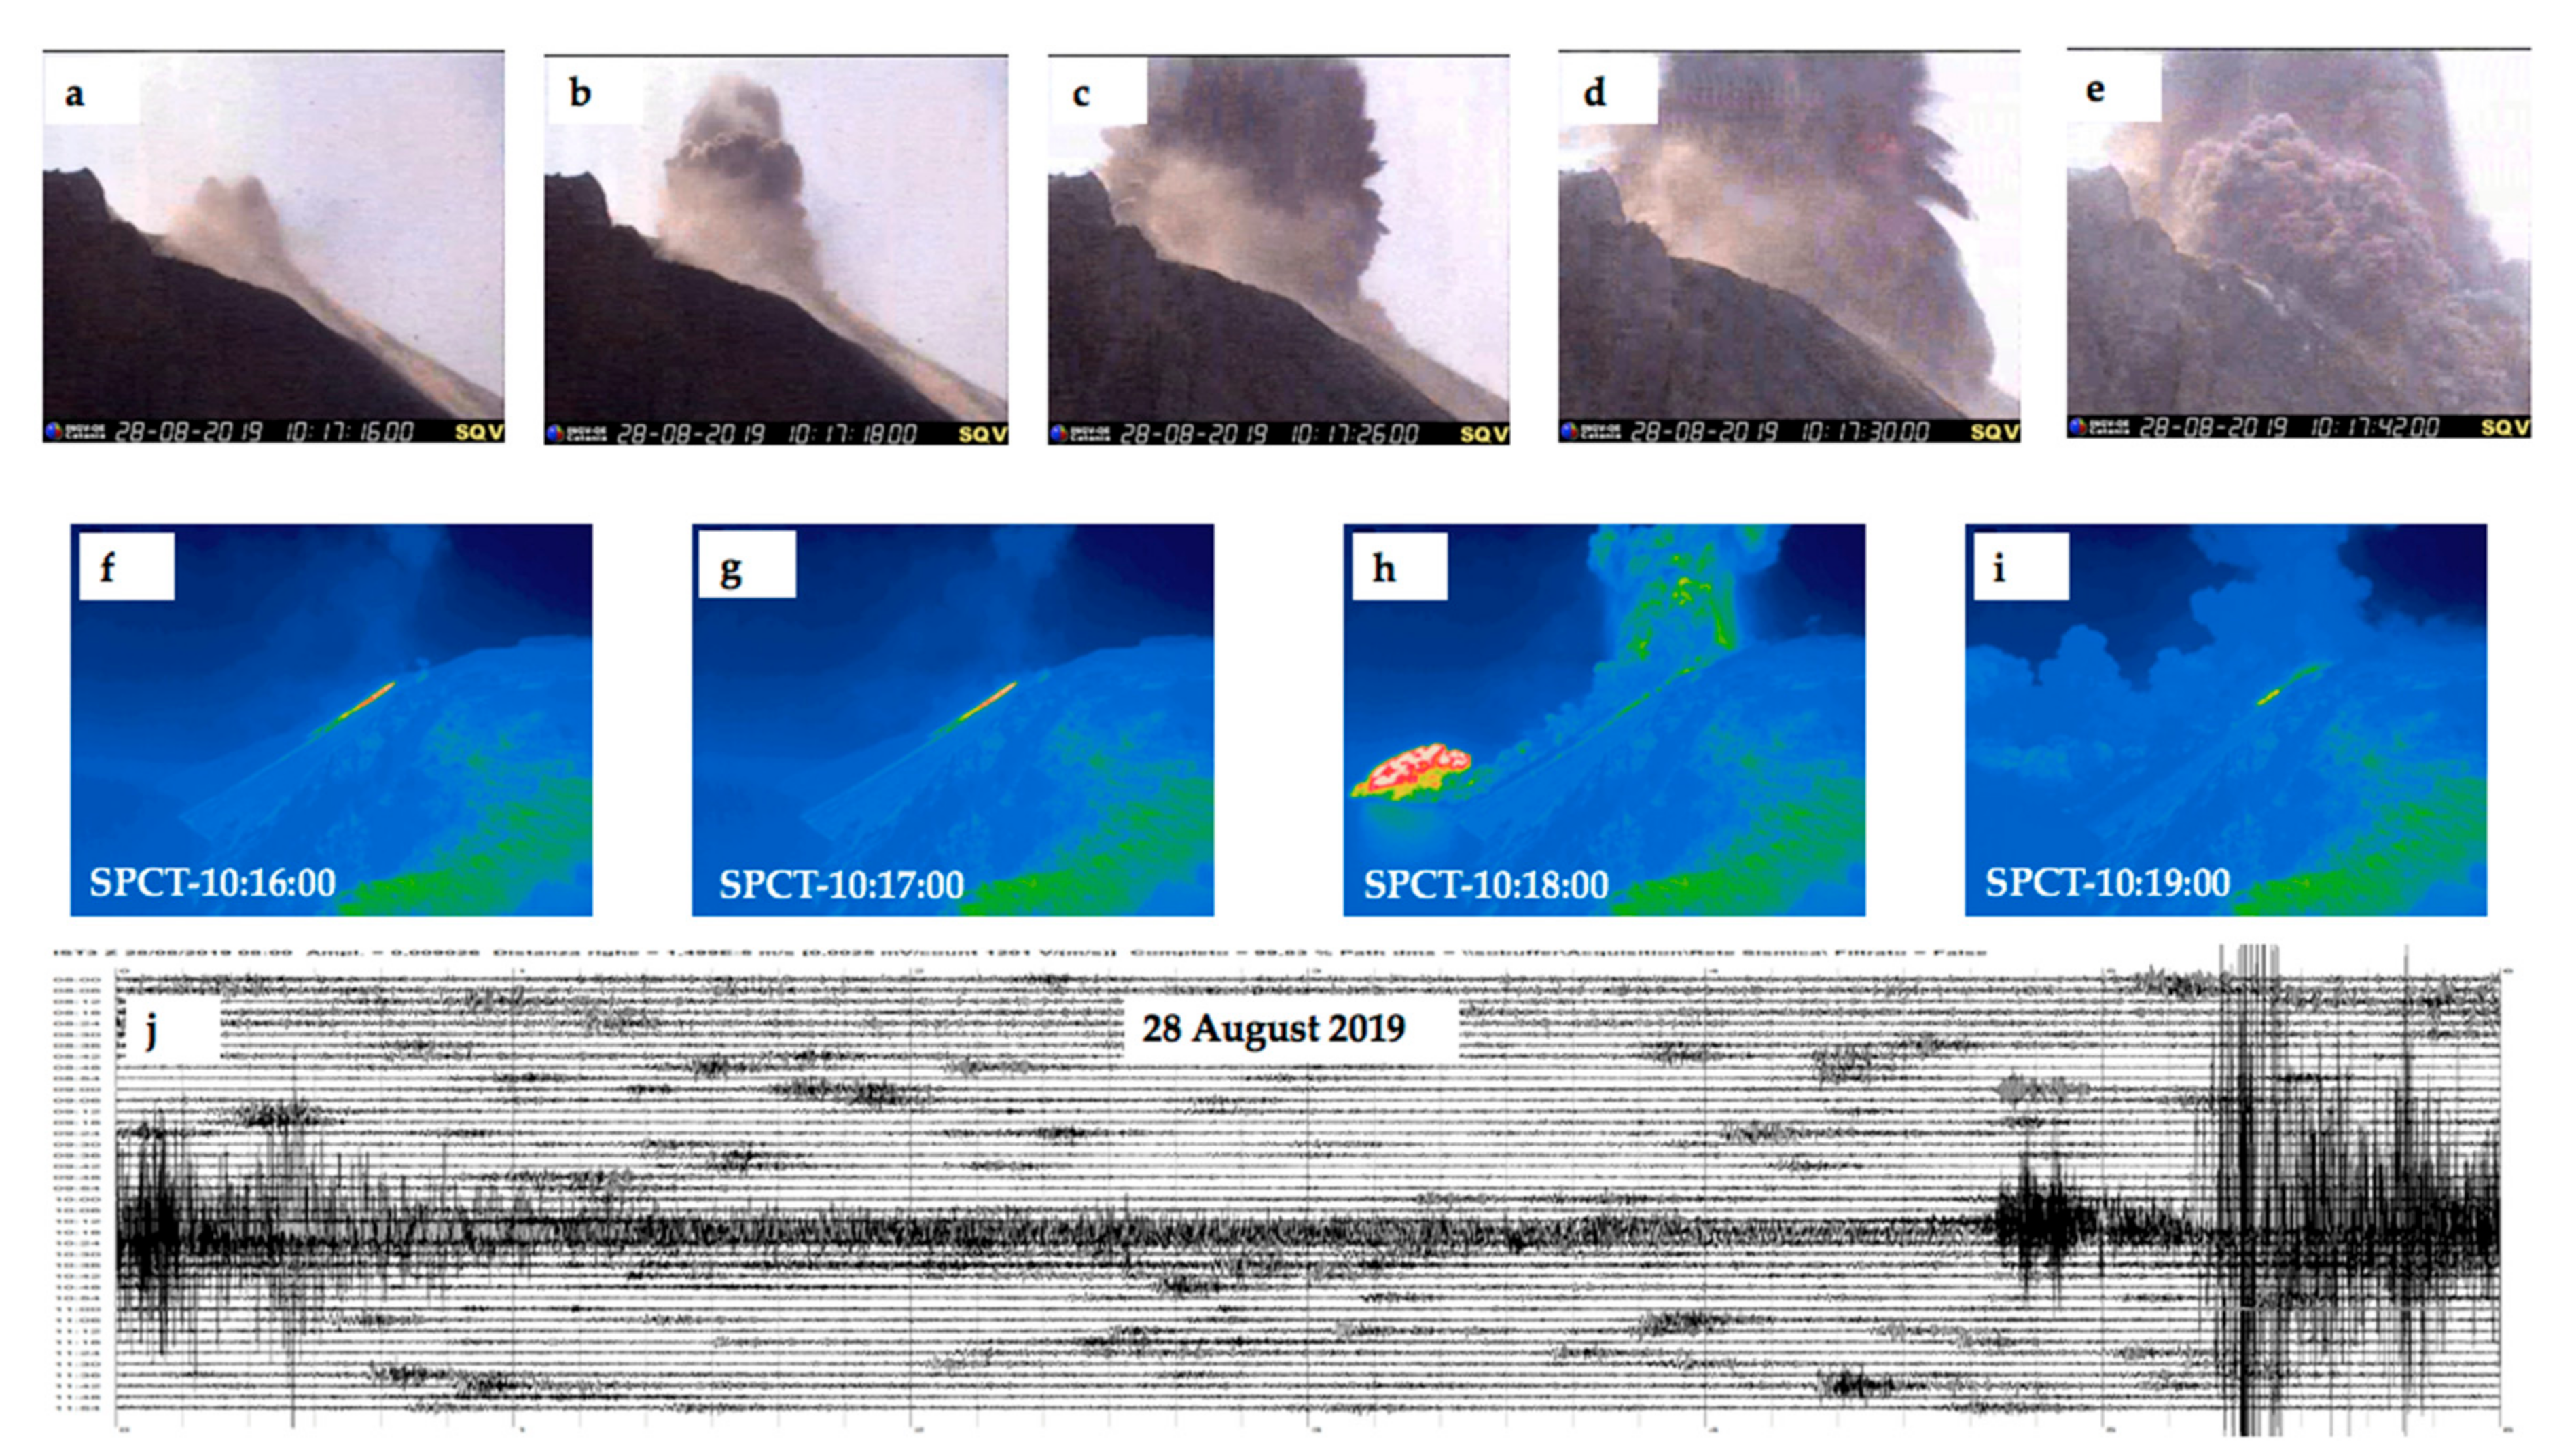
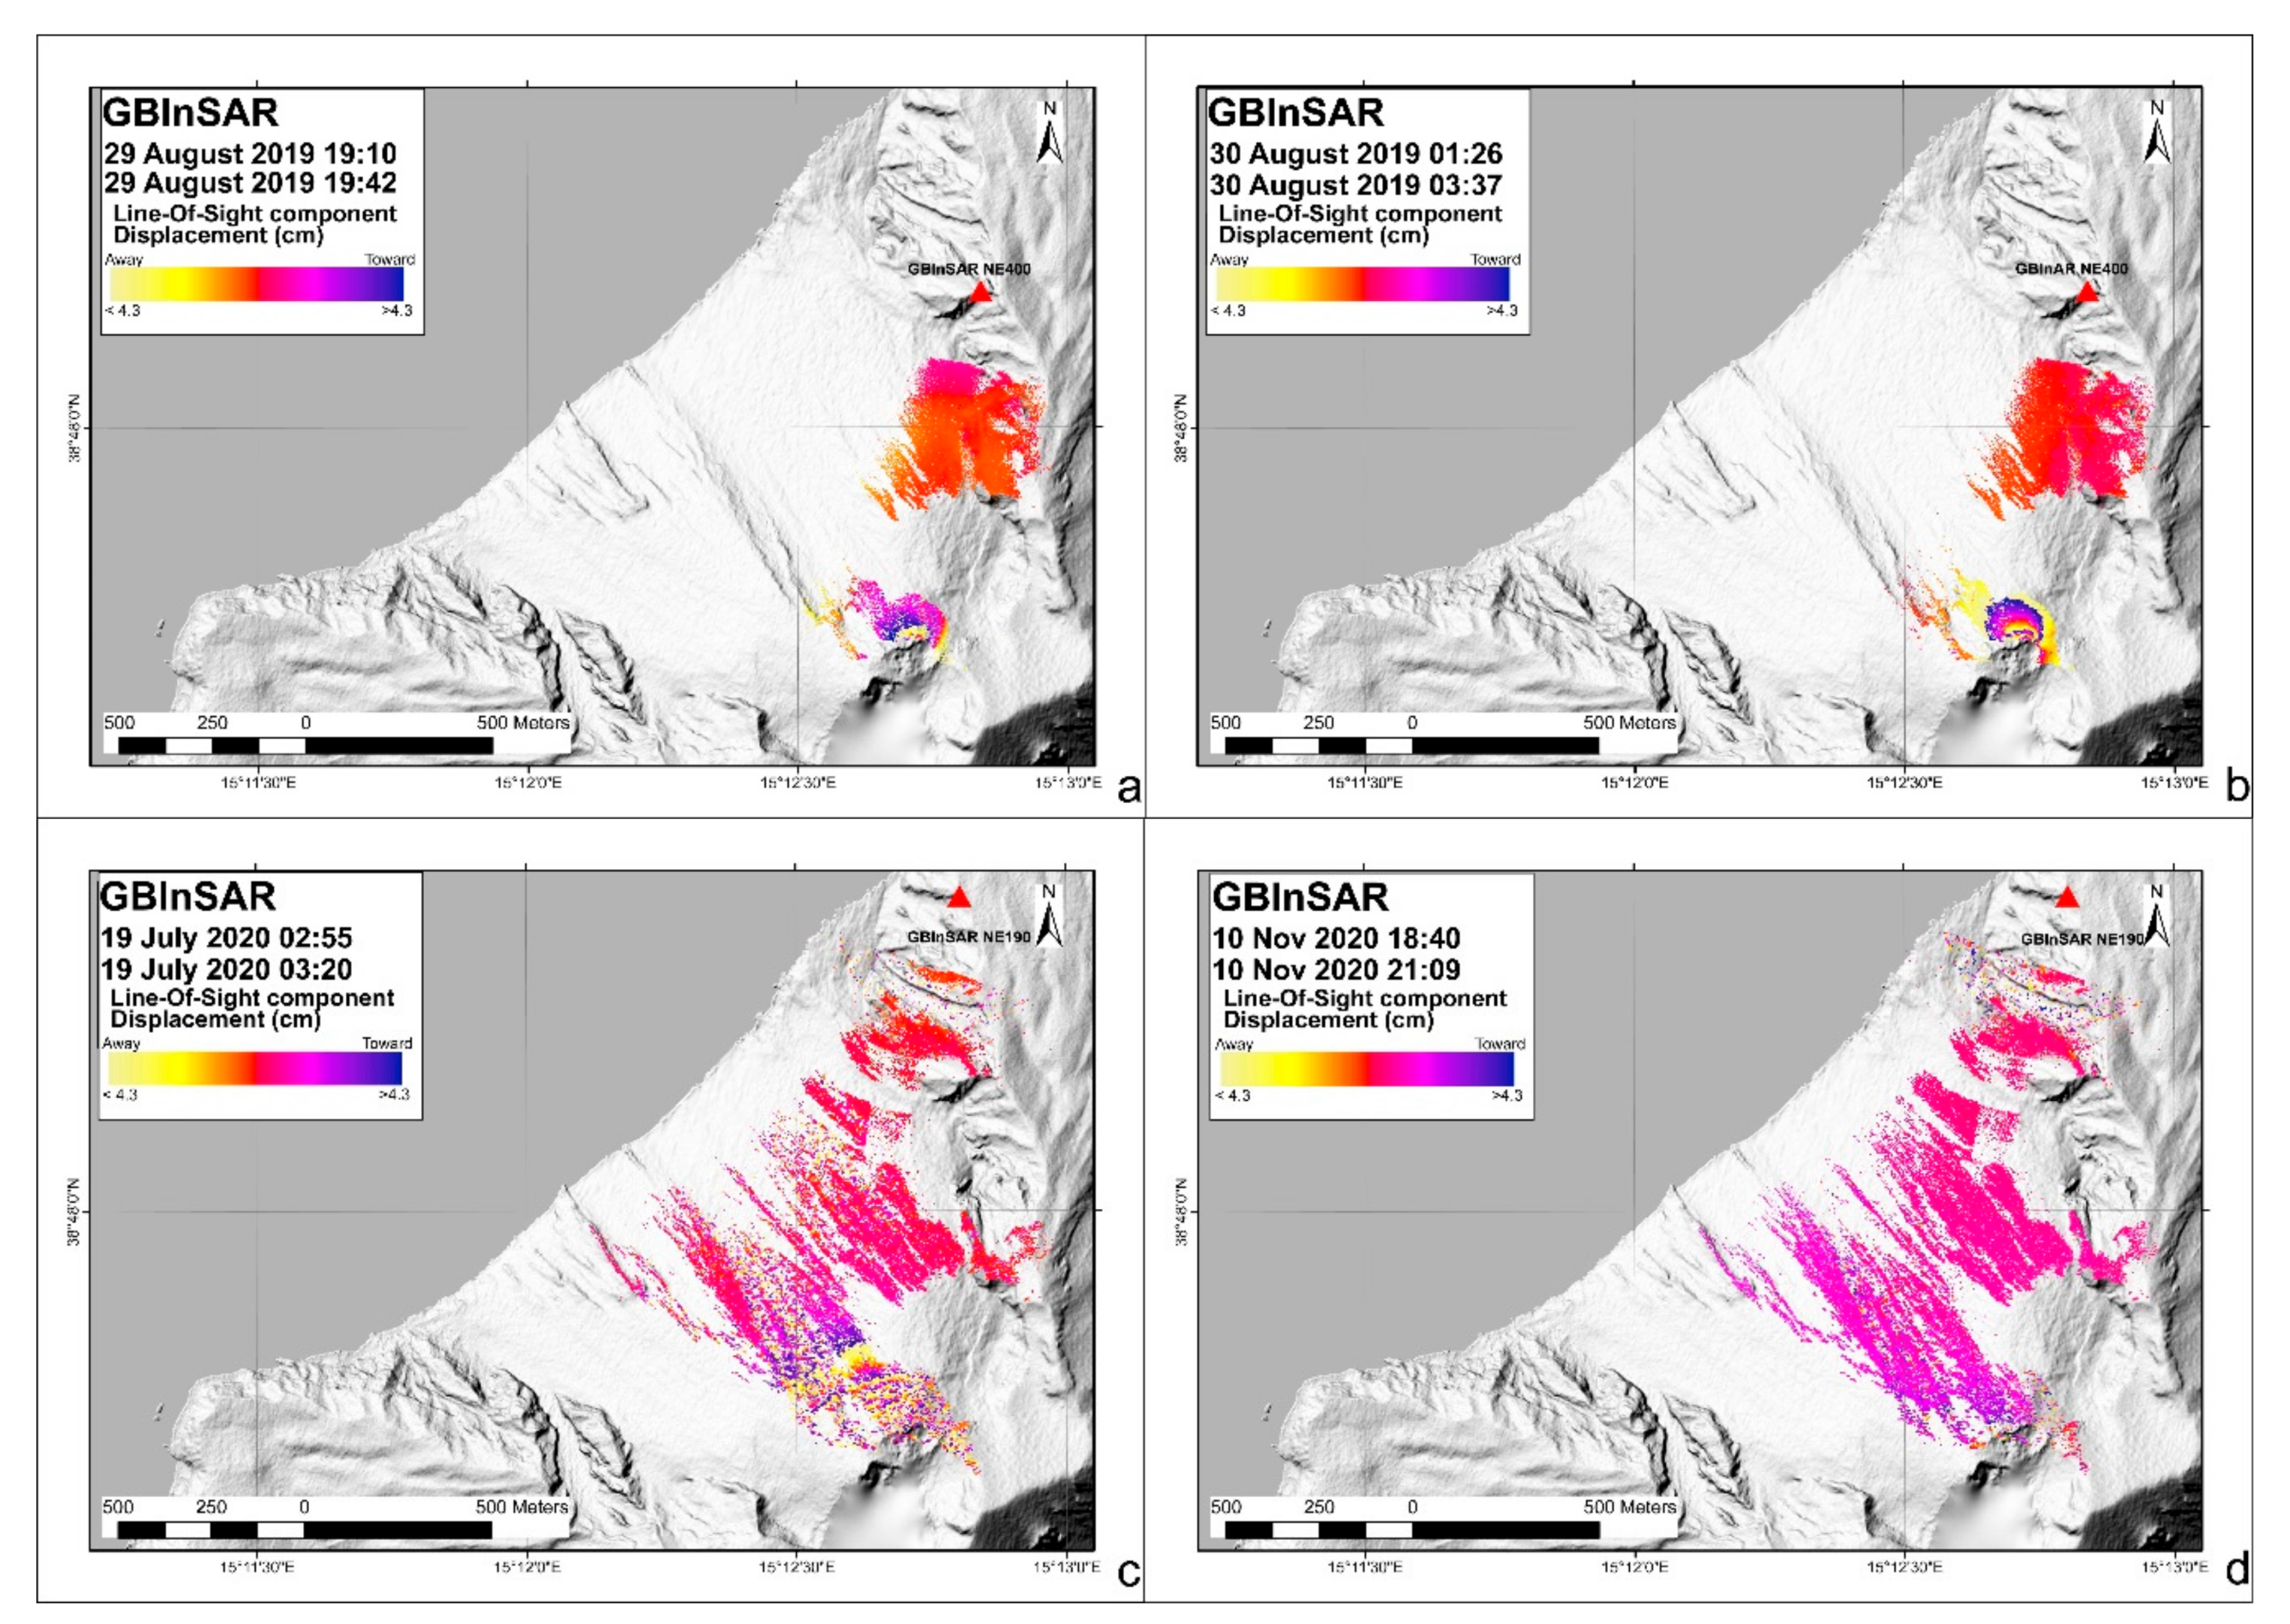
3.1.5. The 28 August 2019 Paroxysm

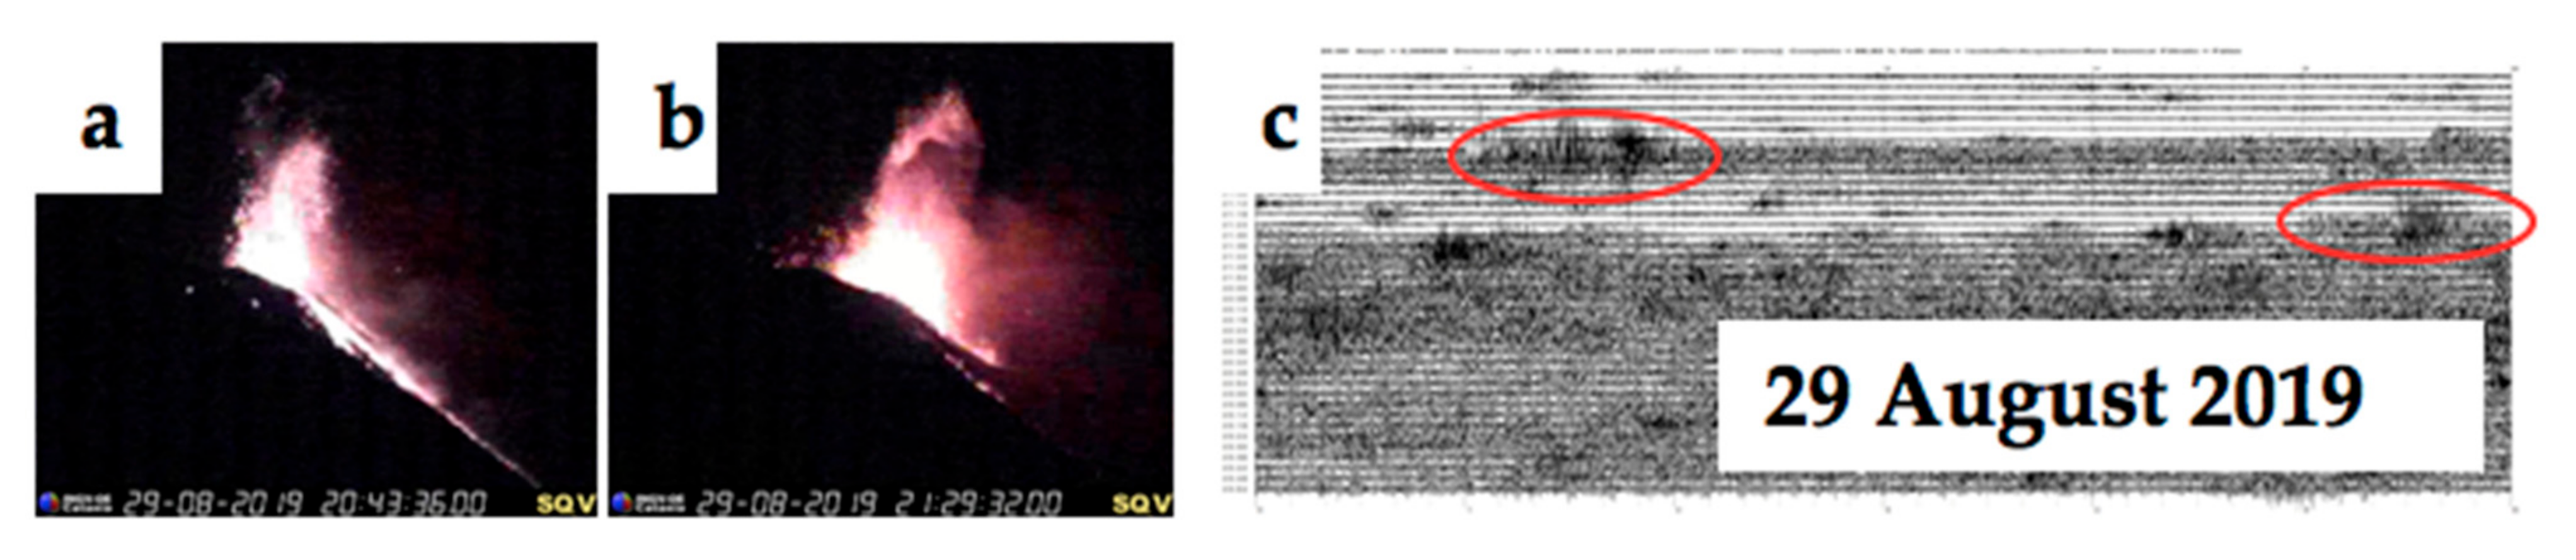
3.1.6. The 29 August 2019 Event

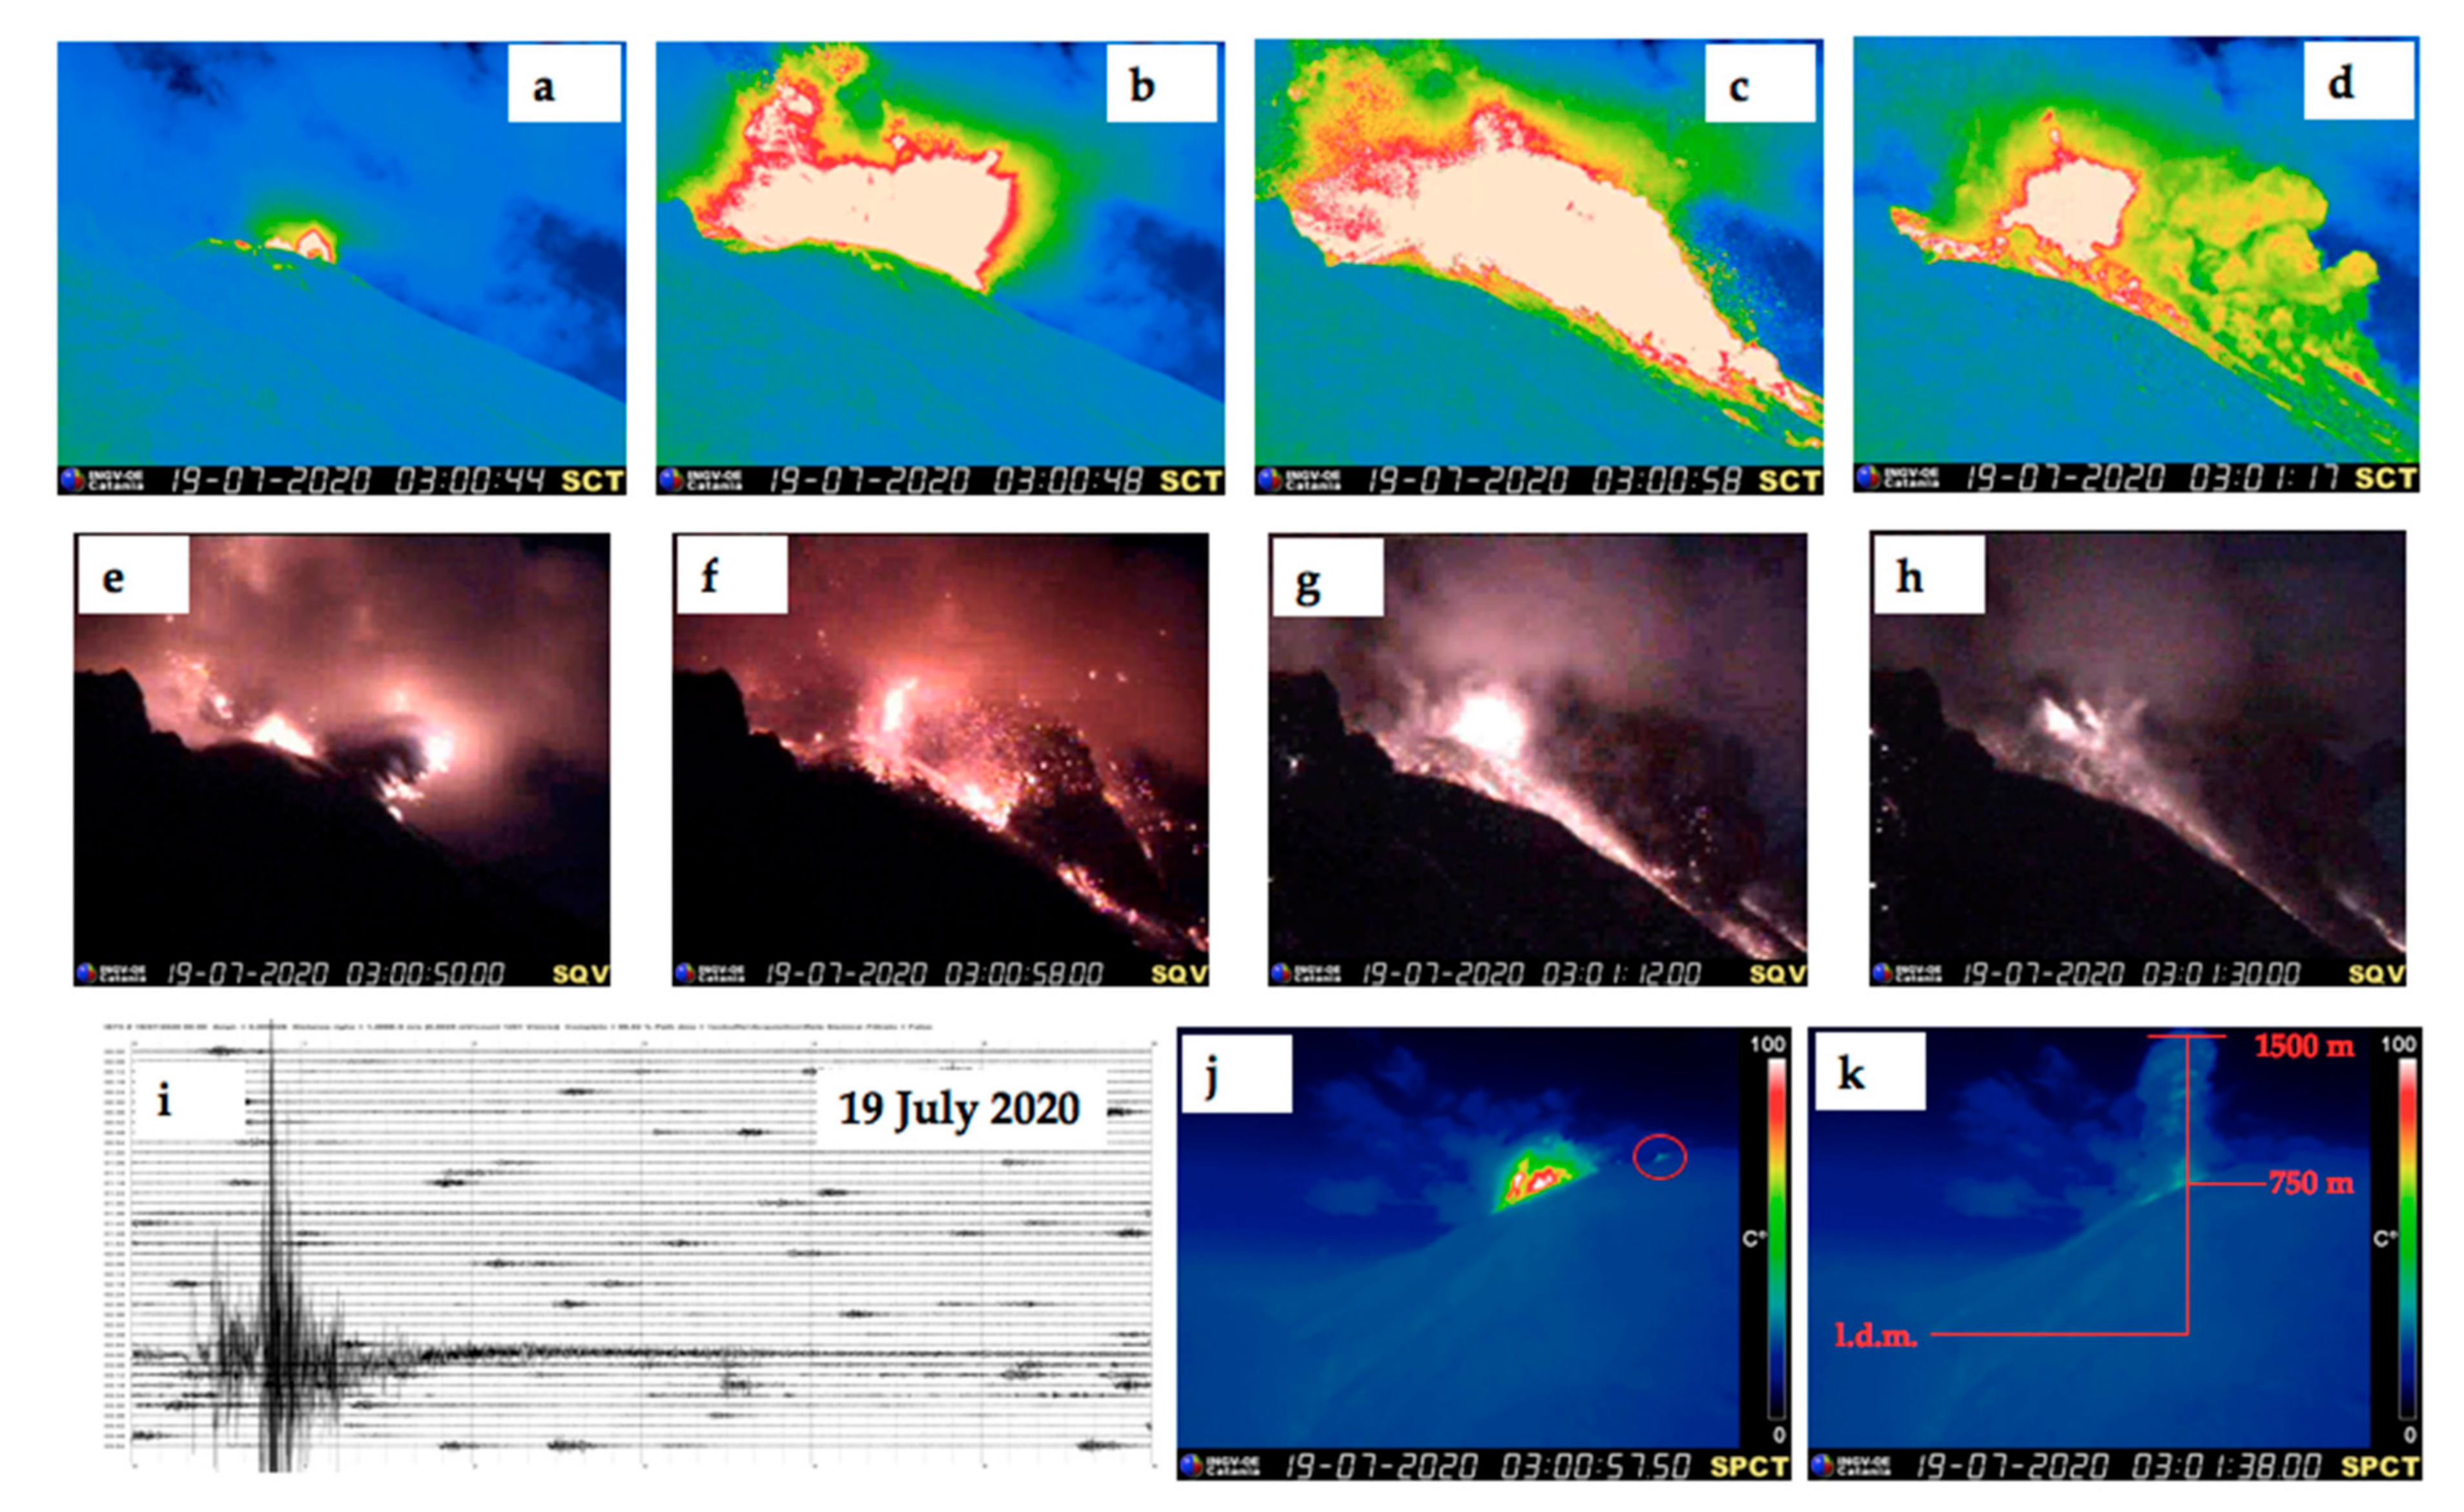
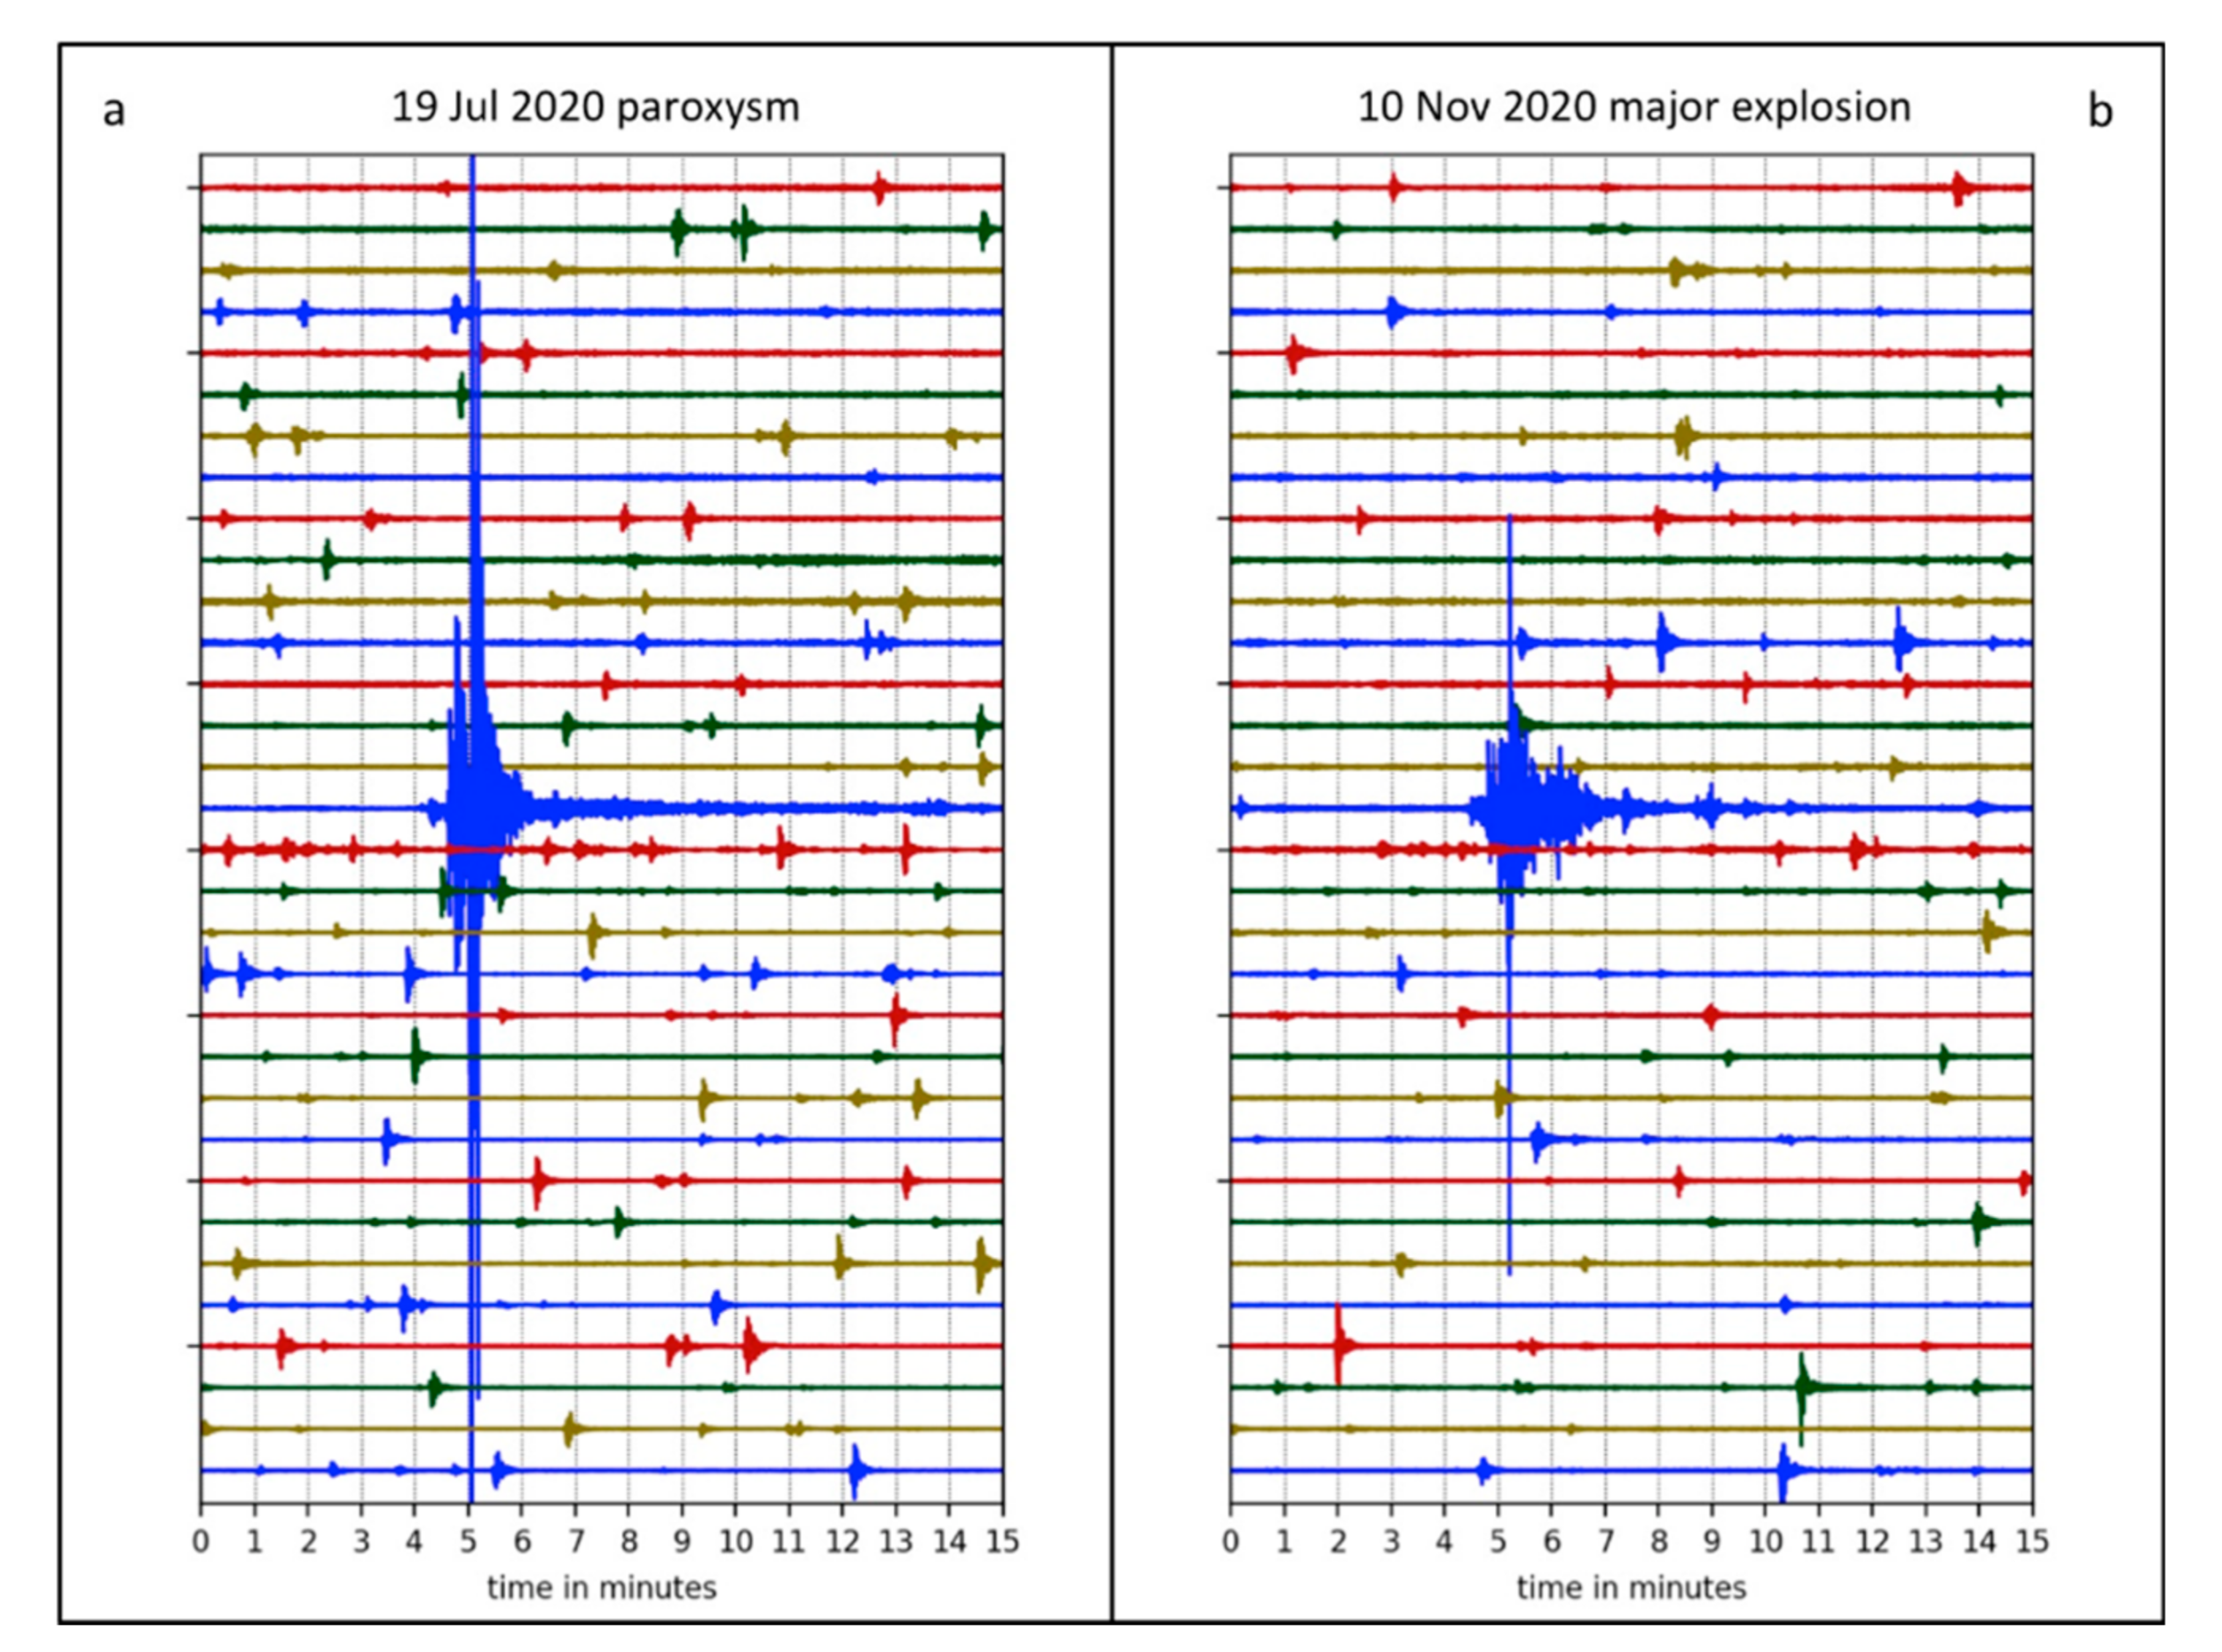
3.1.7. The 19 July 2020 Paroxysmal Event

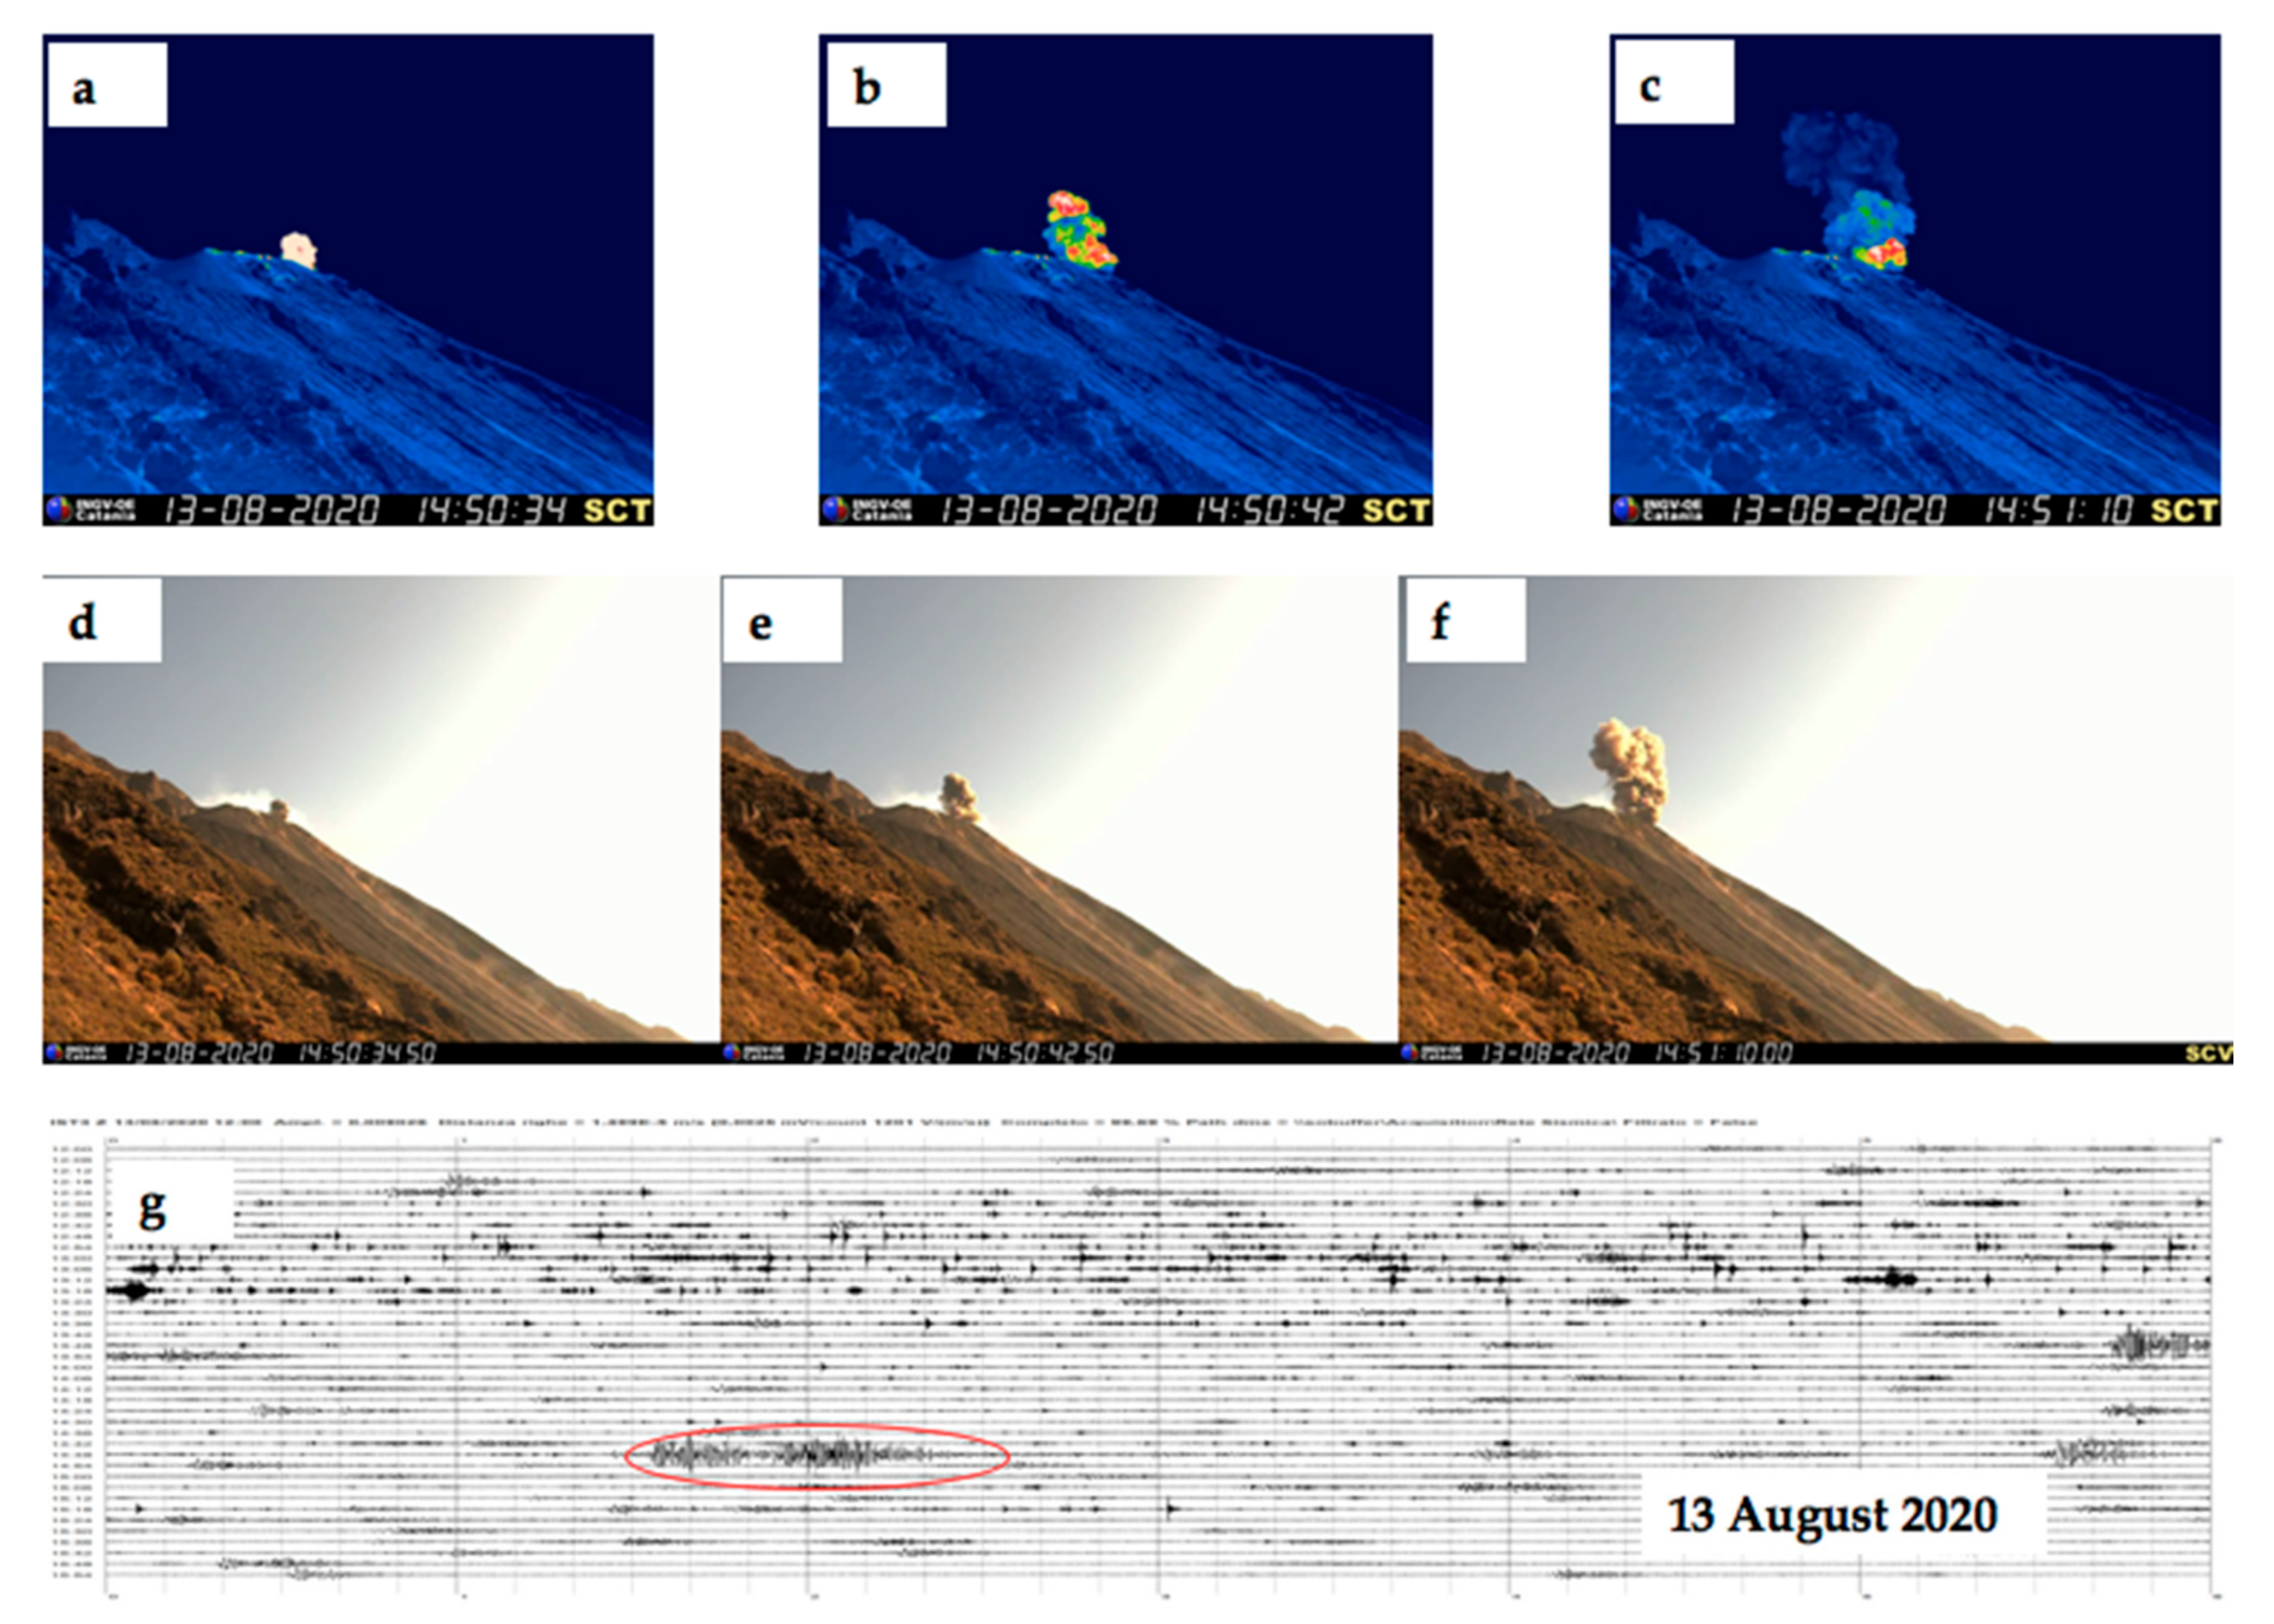
3.1.8. The 13 August 2020 Event

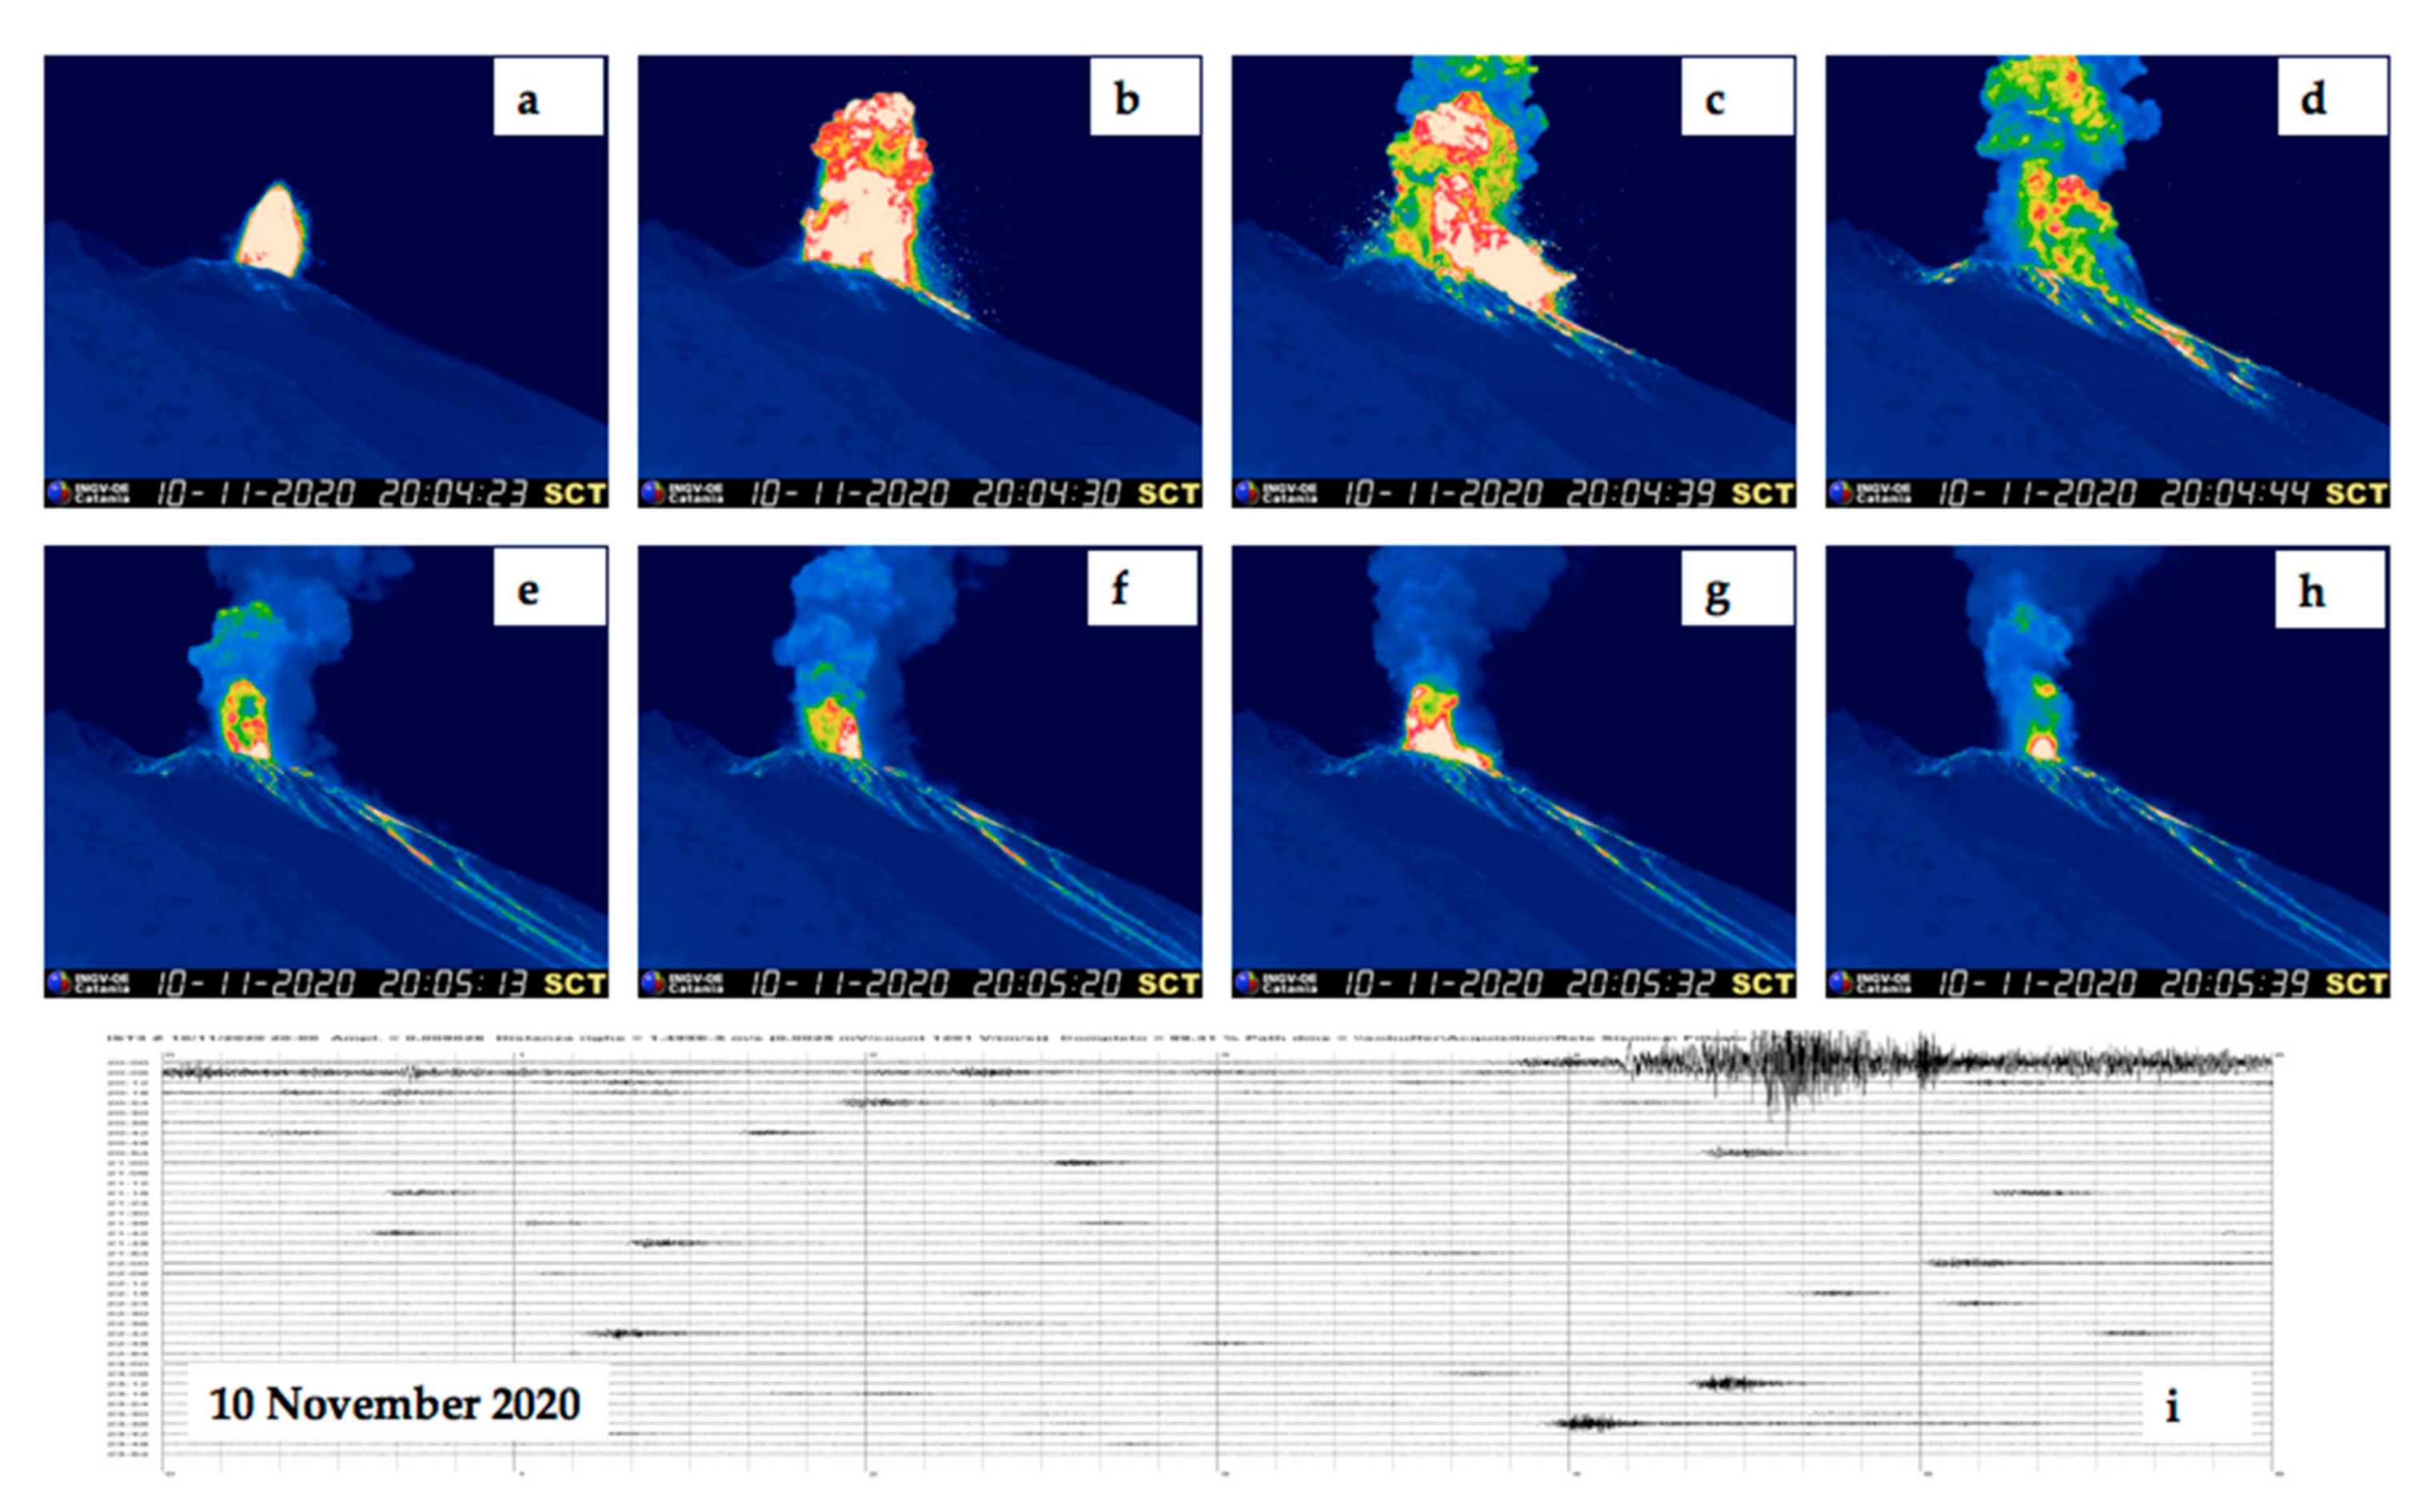
3.1.9. The 10 November 2020 Event

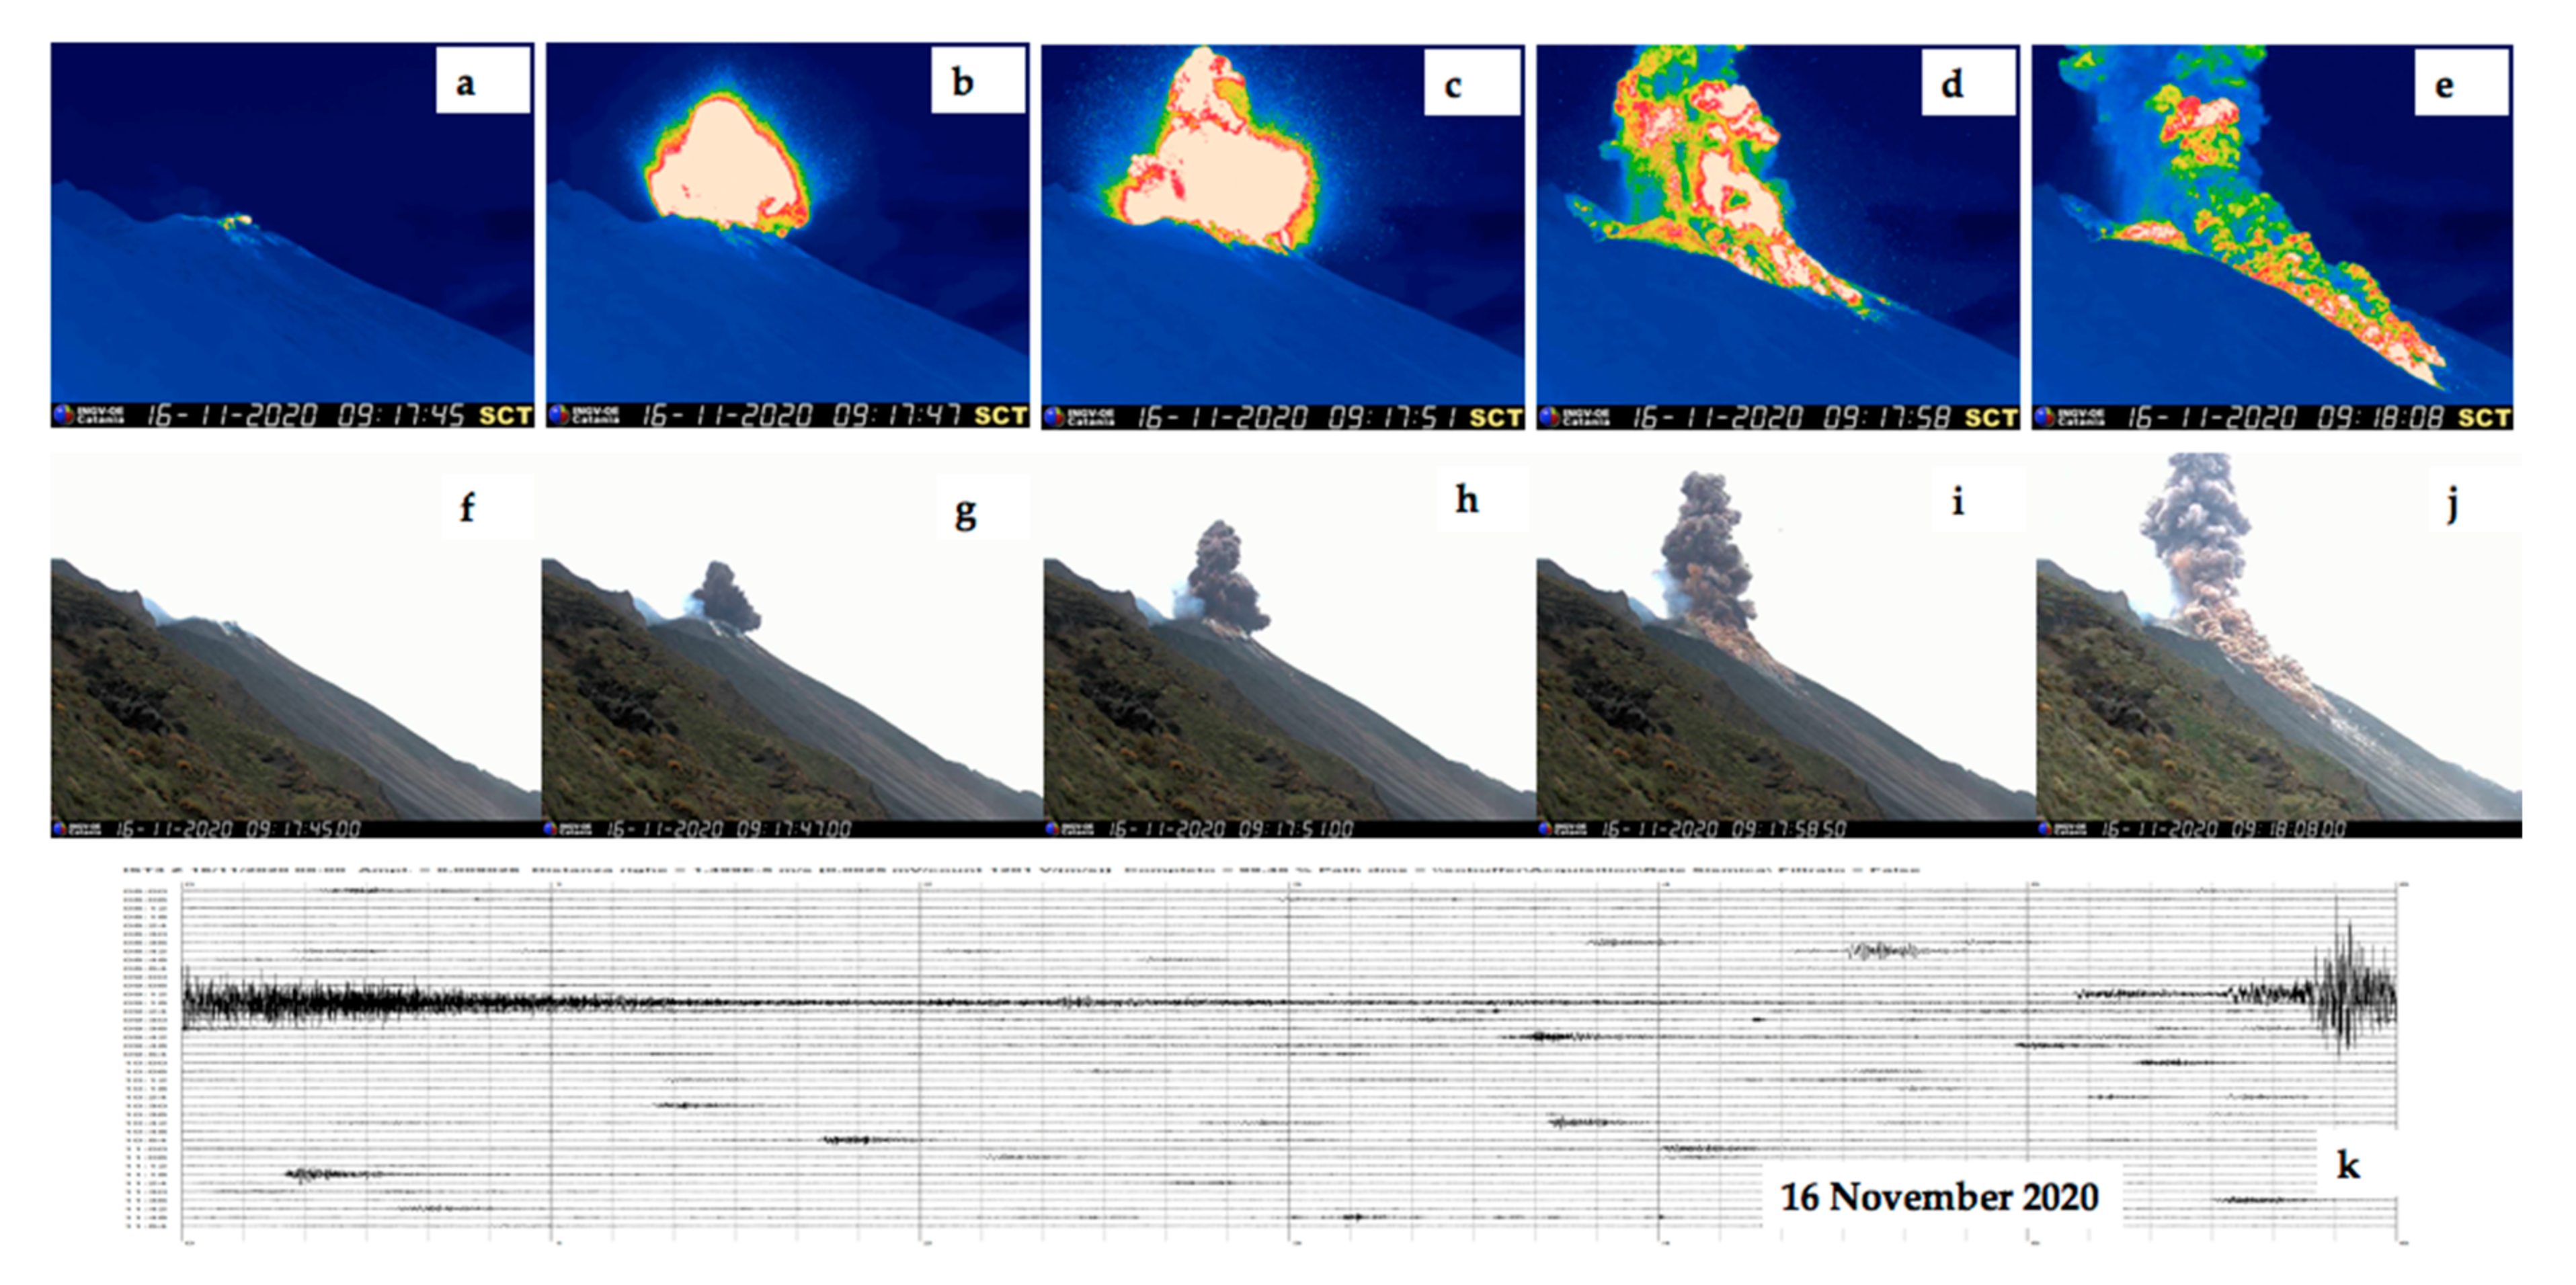
3.1.10. The 16 November 2020 Event

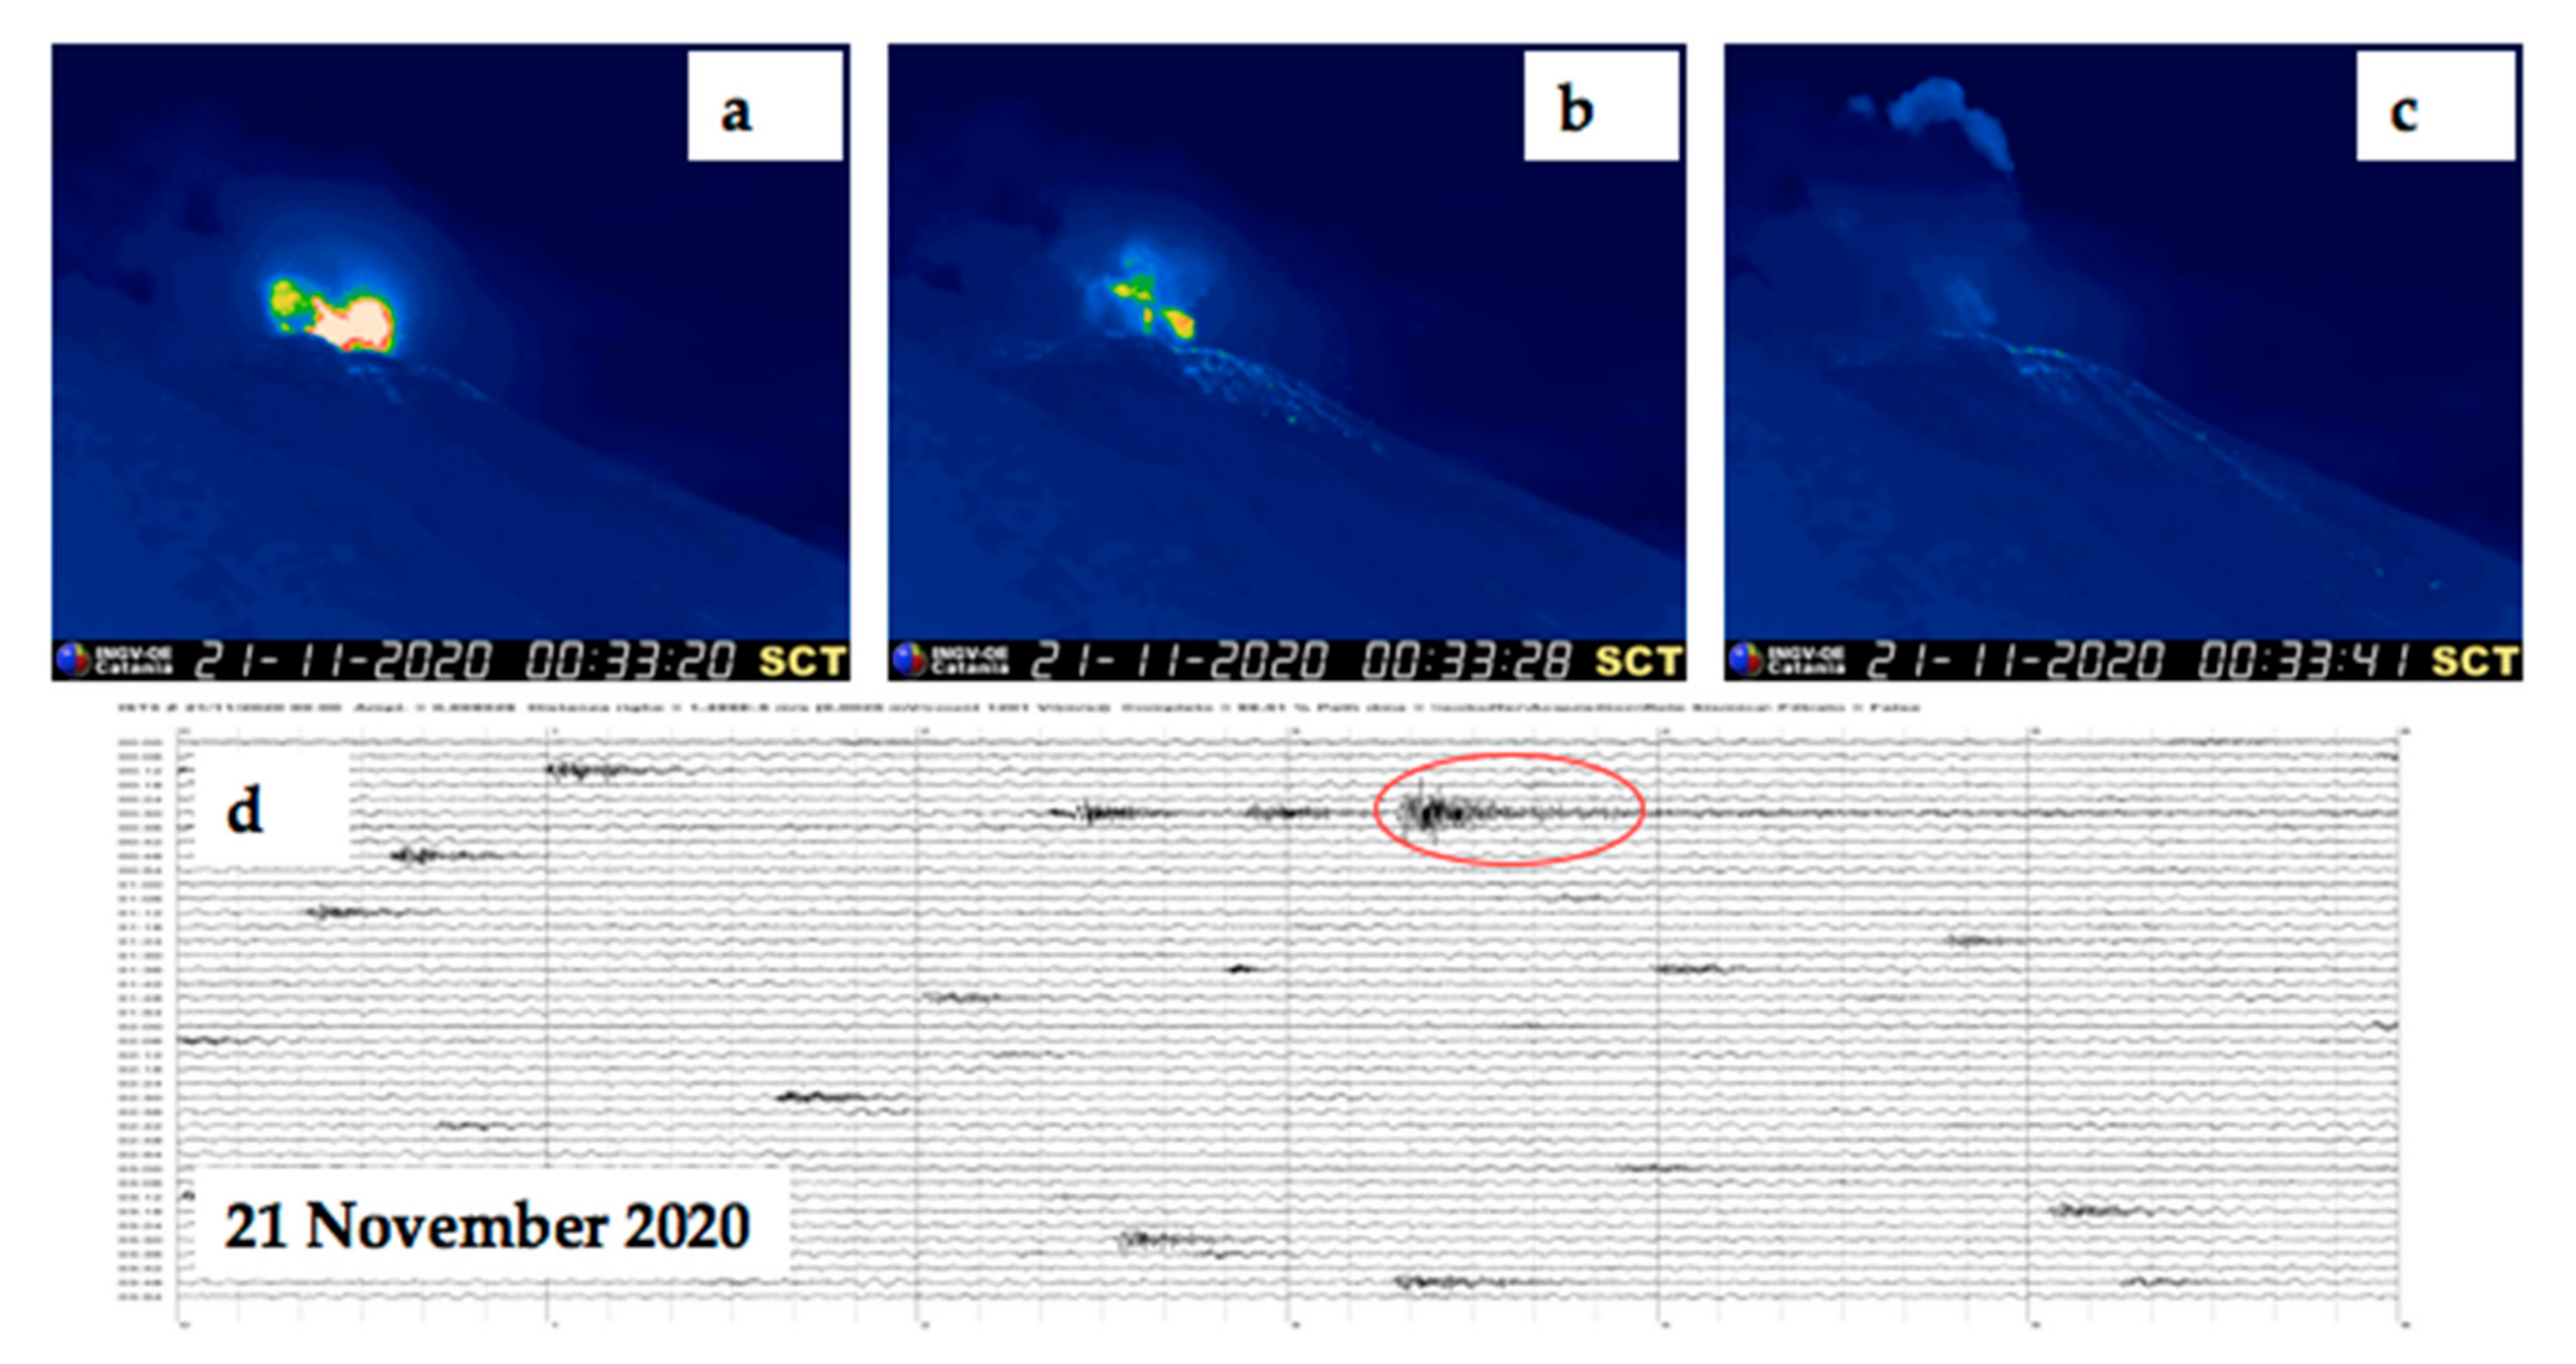
3.1.11. The 21 November 2020 Event

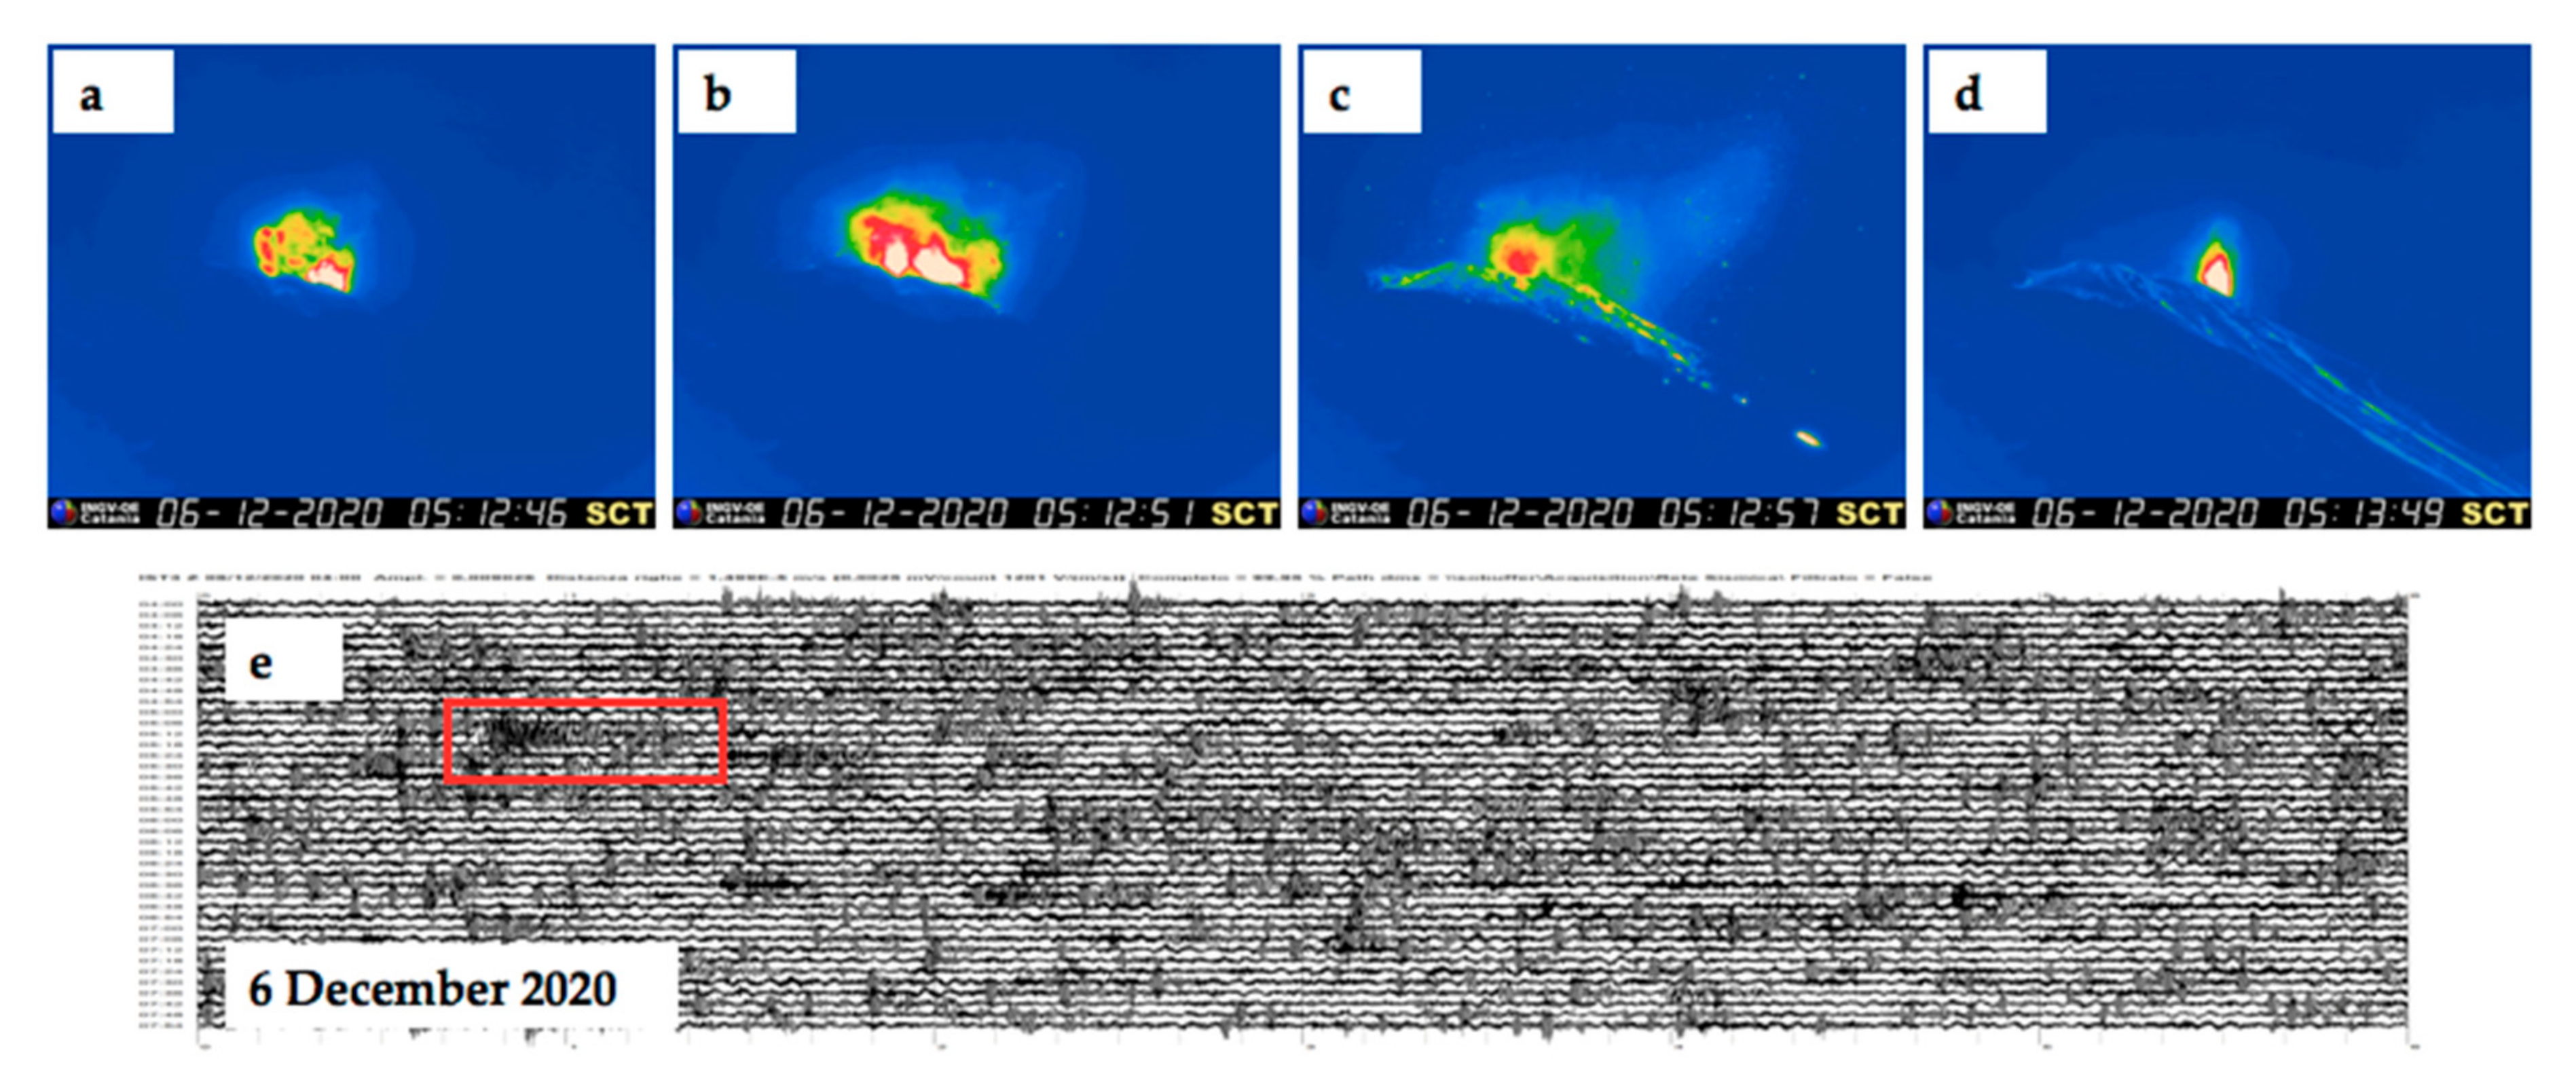
3.1.12. The 6 December 2020 Event

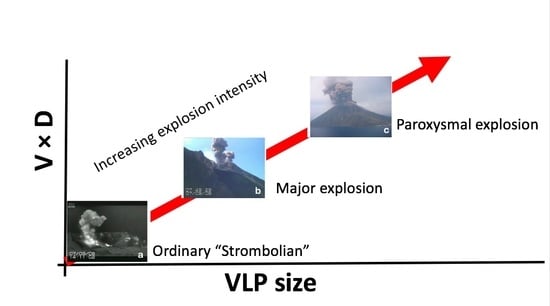
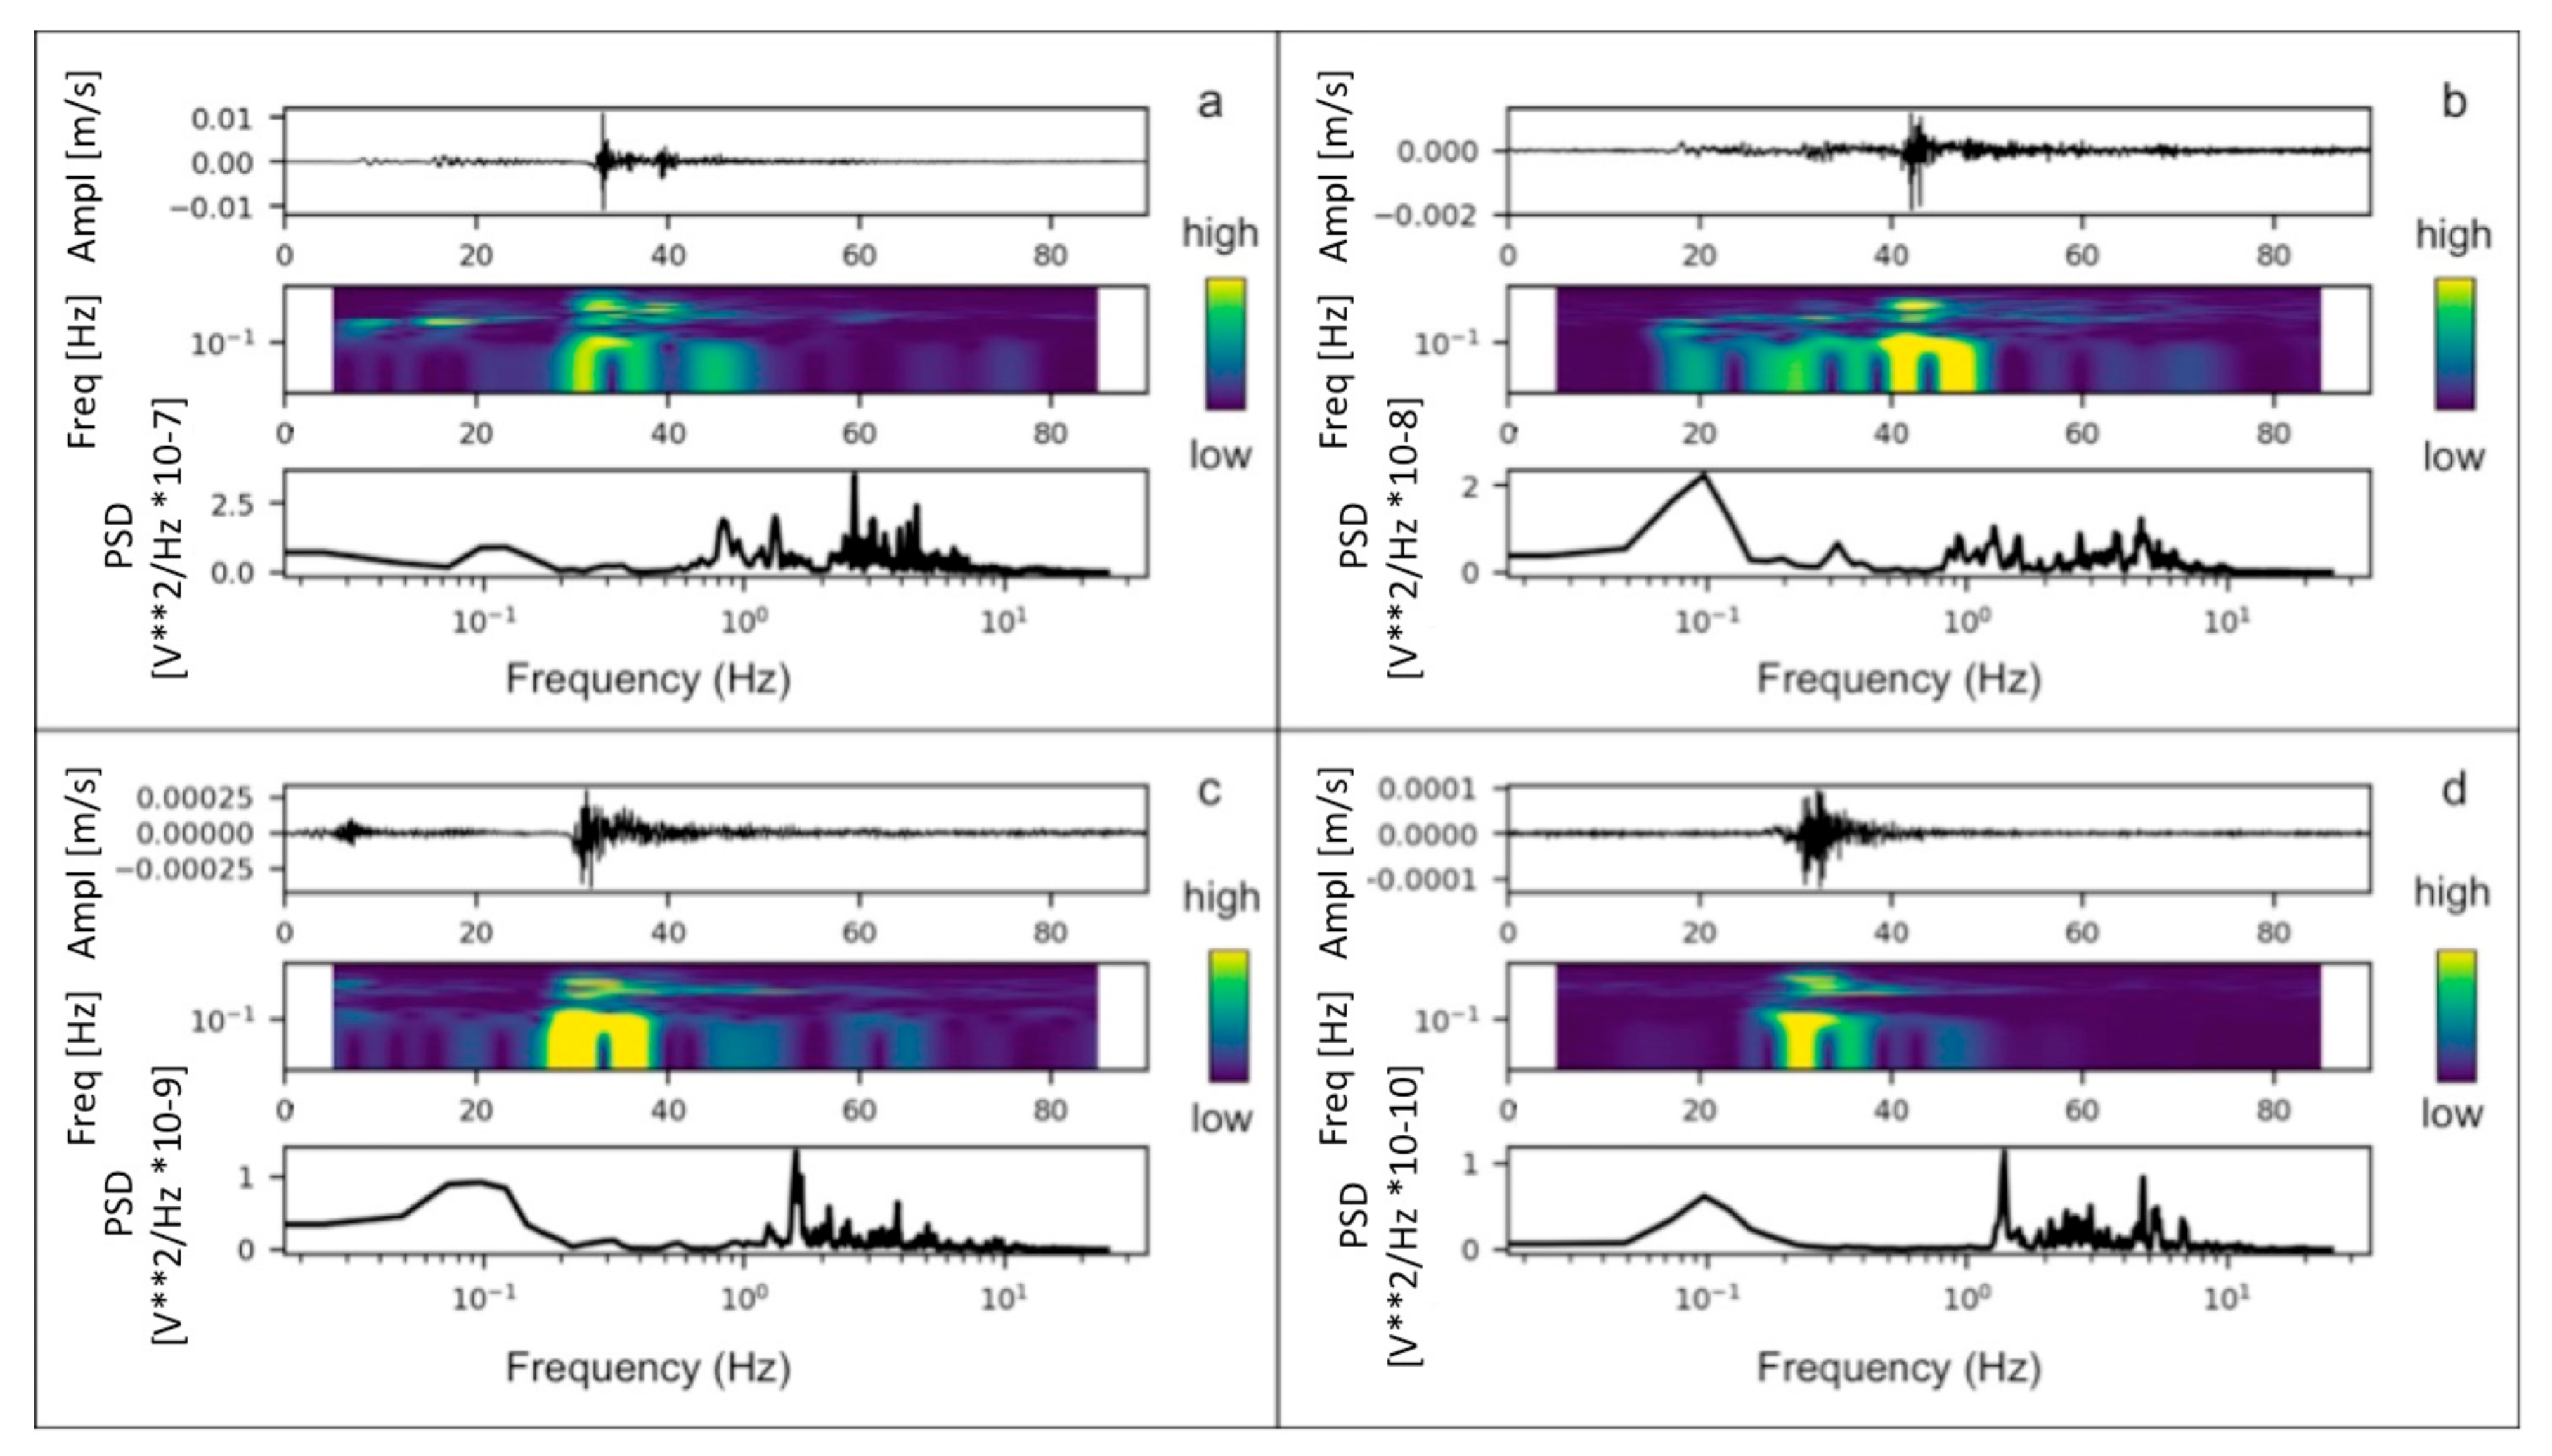
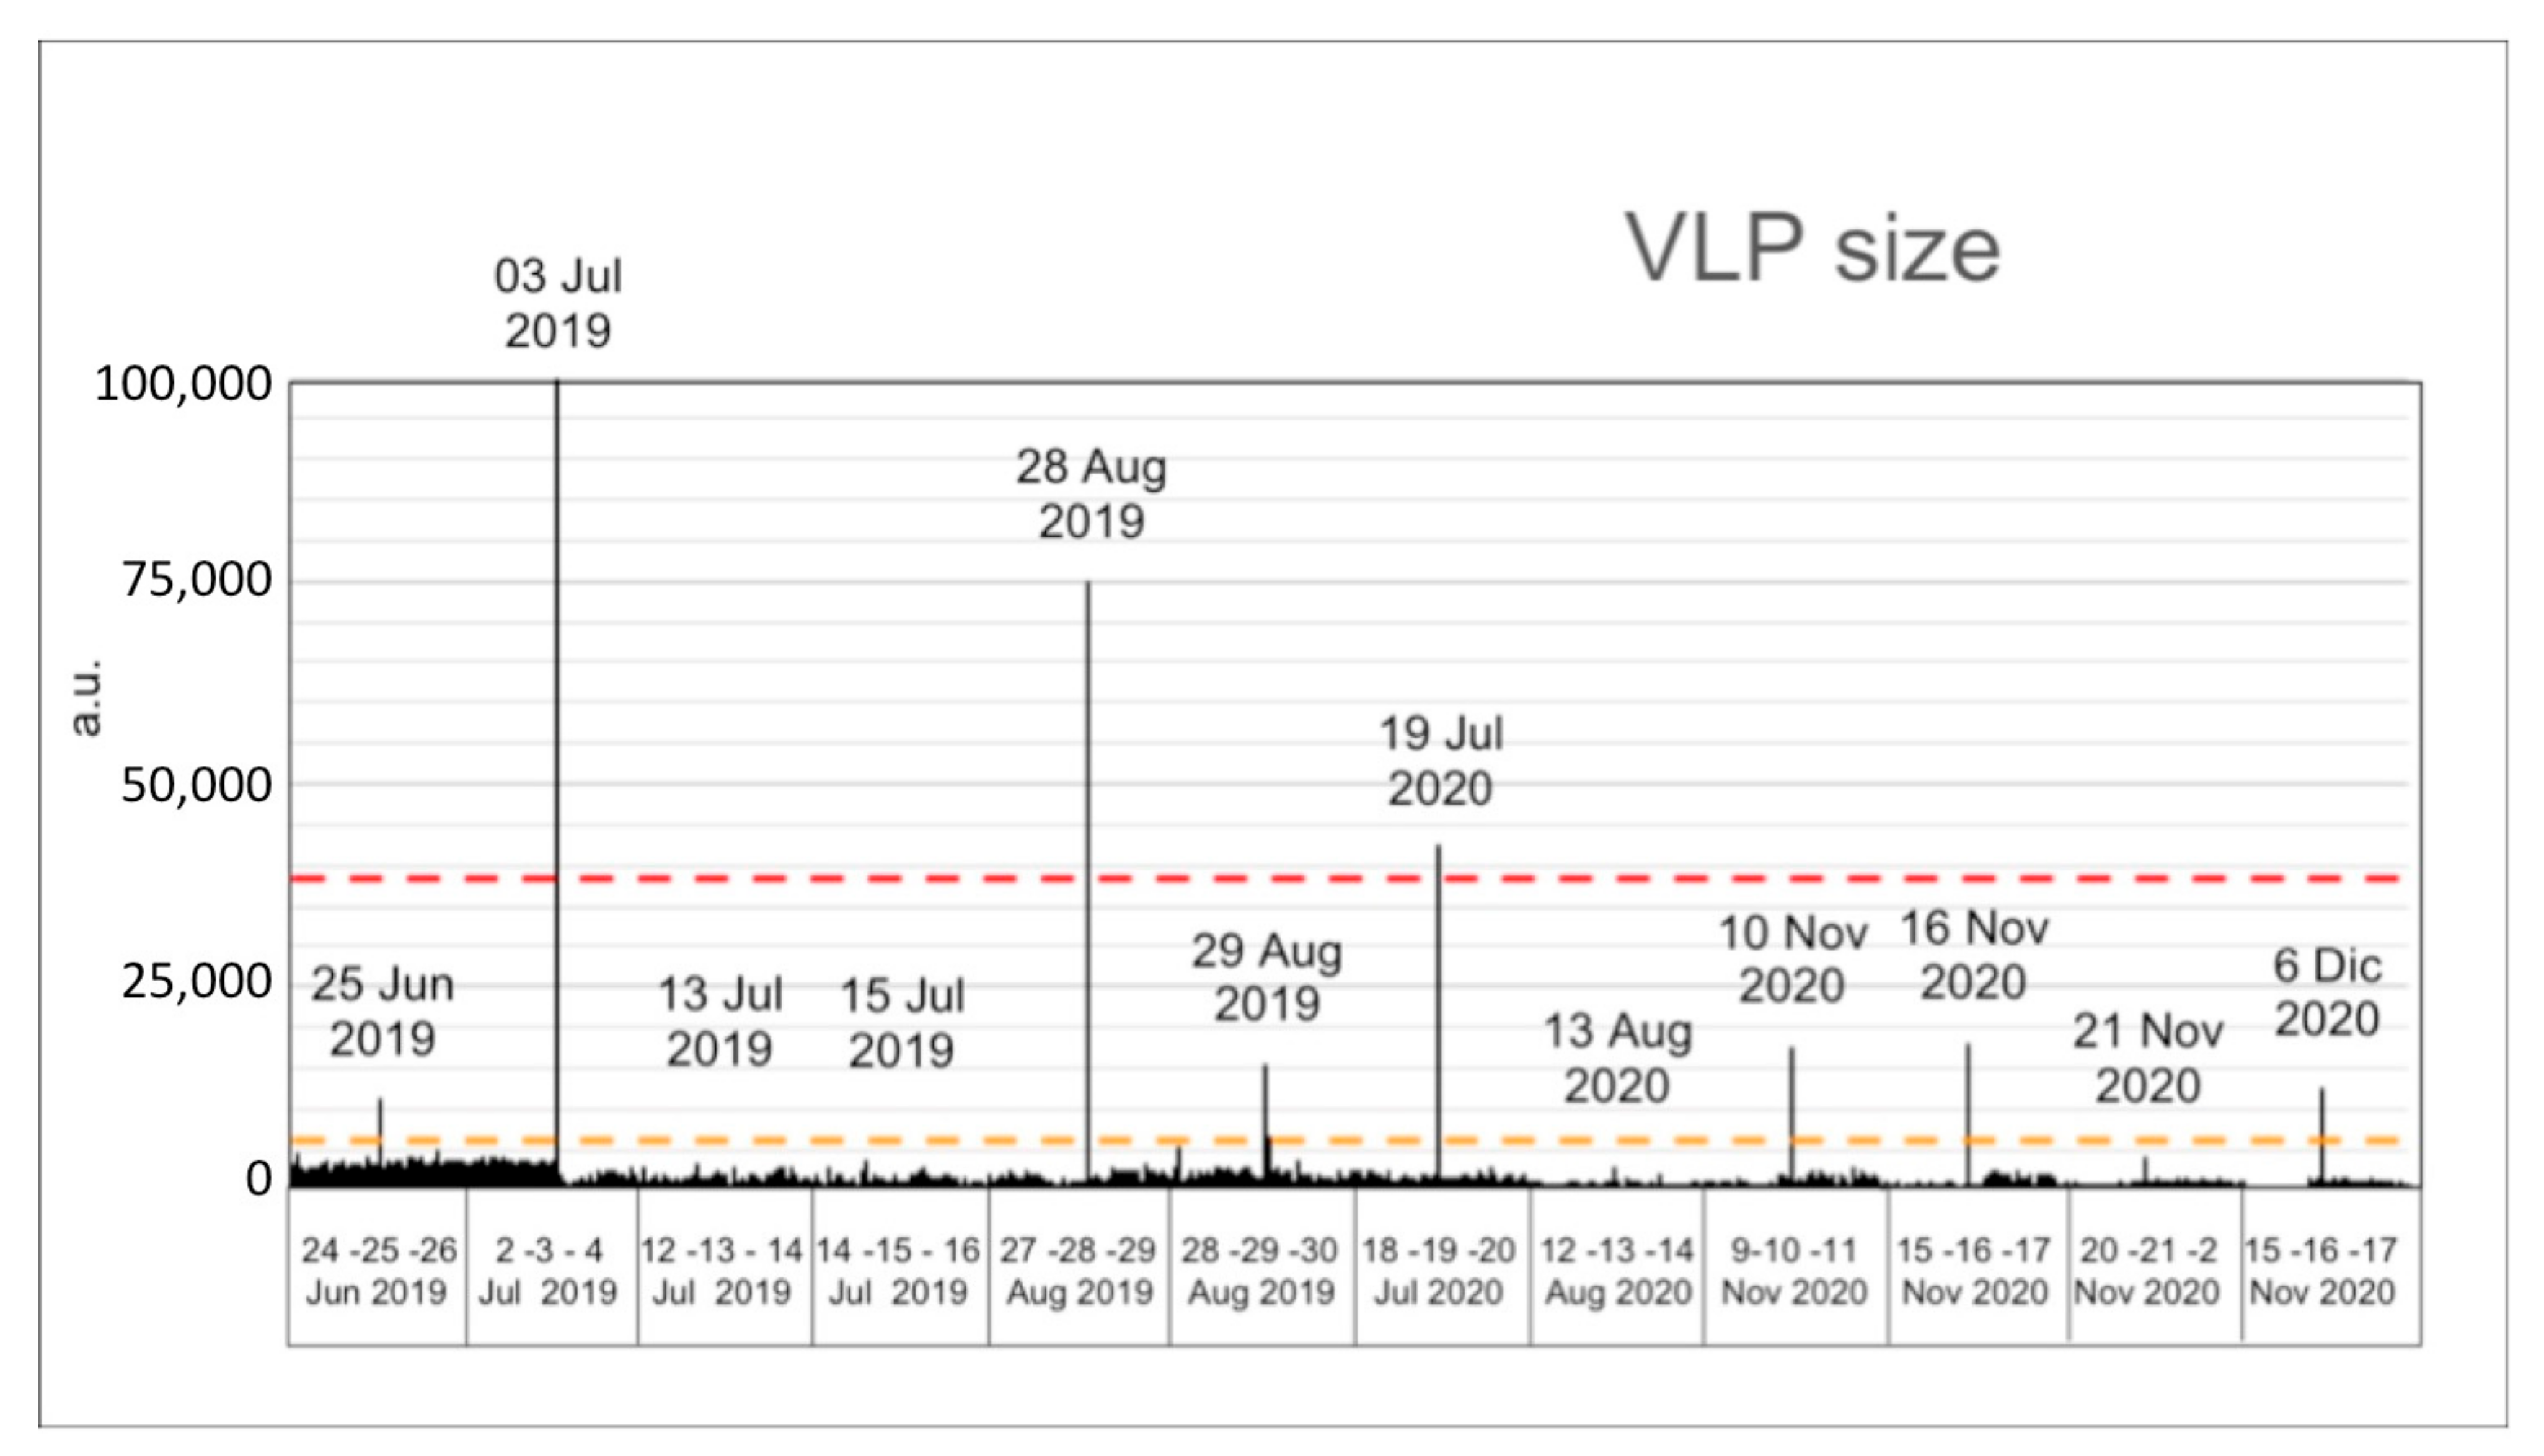
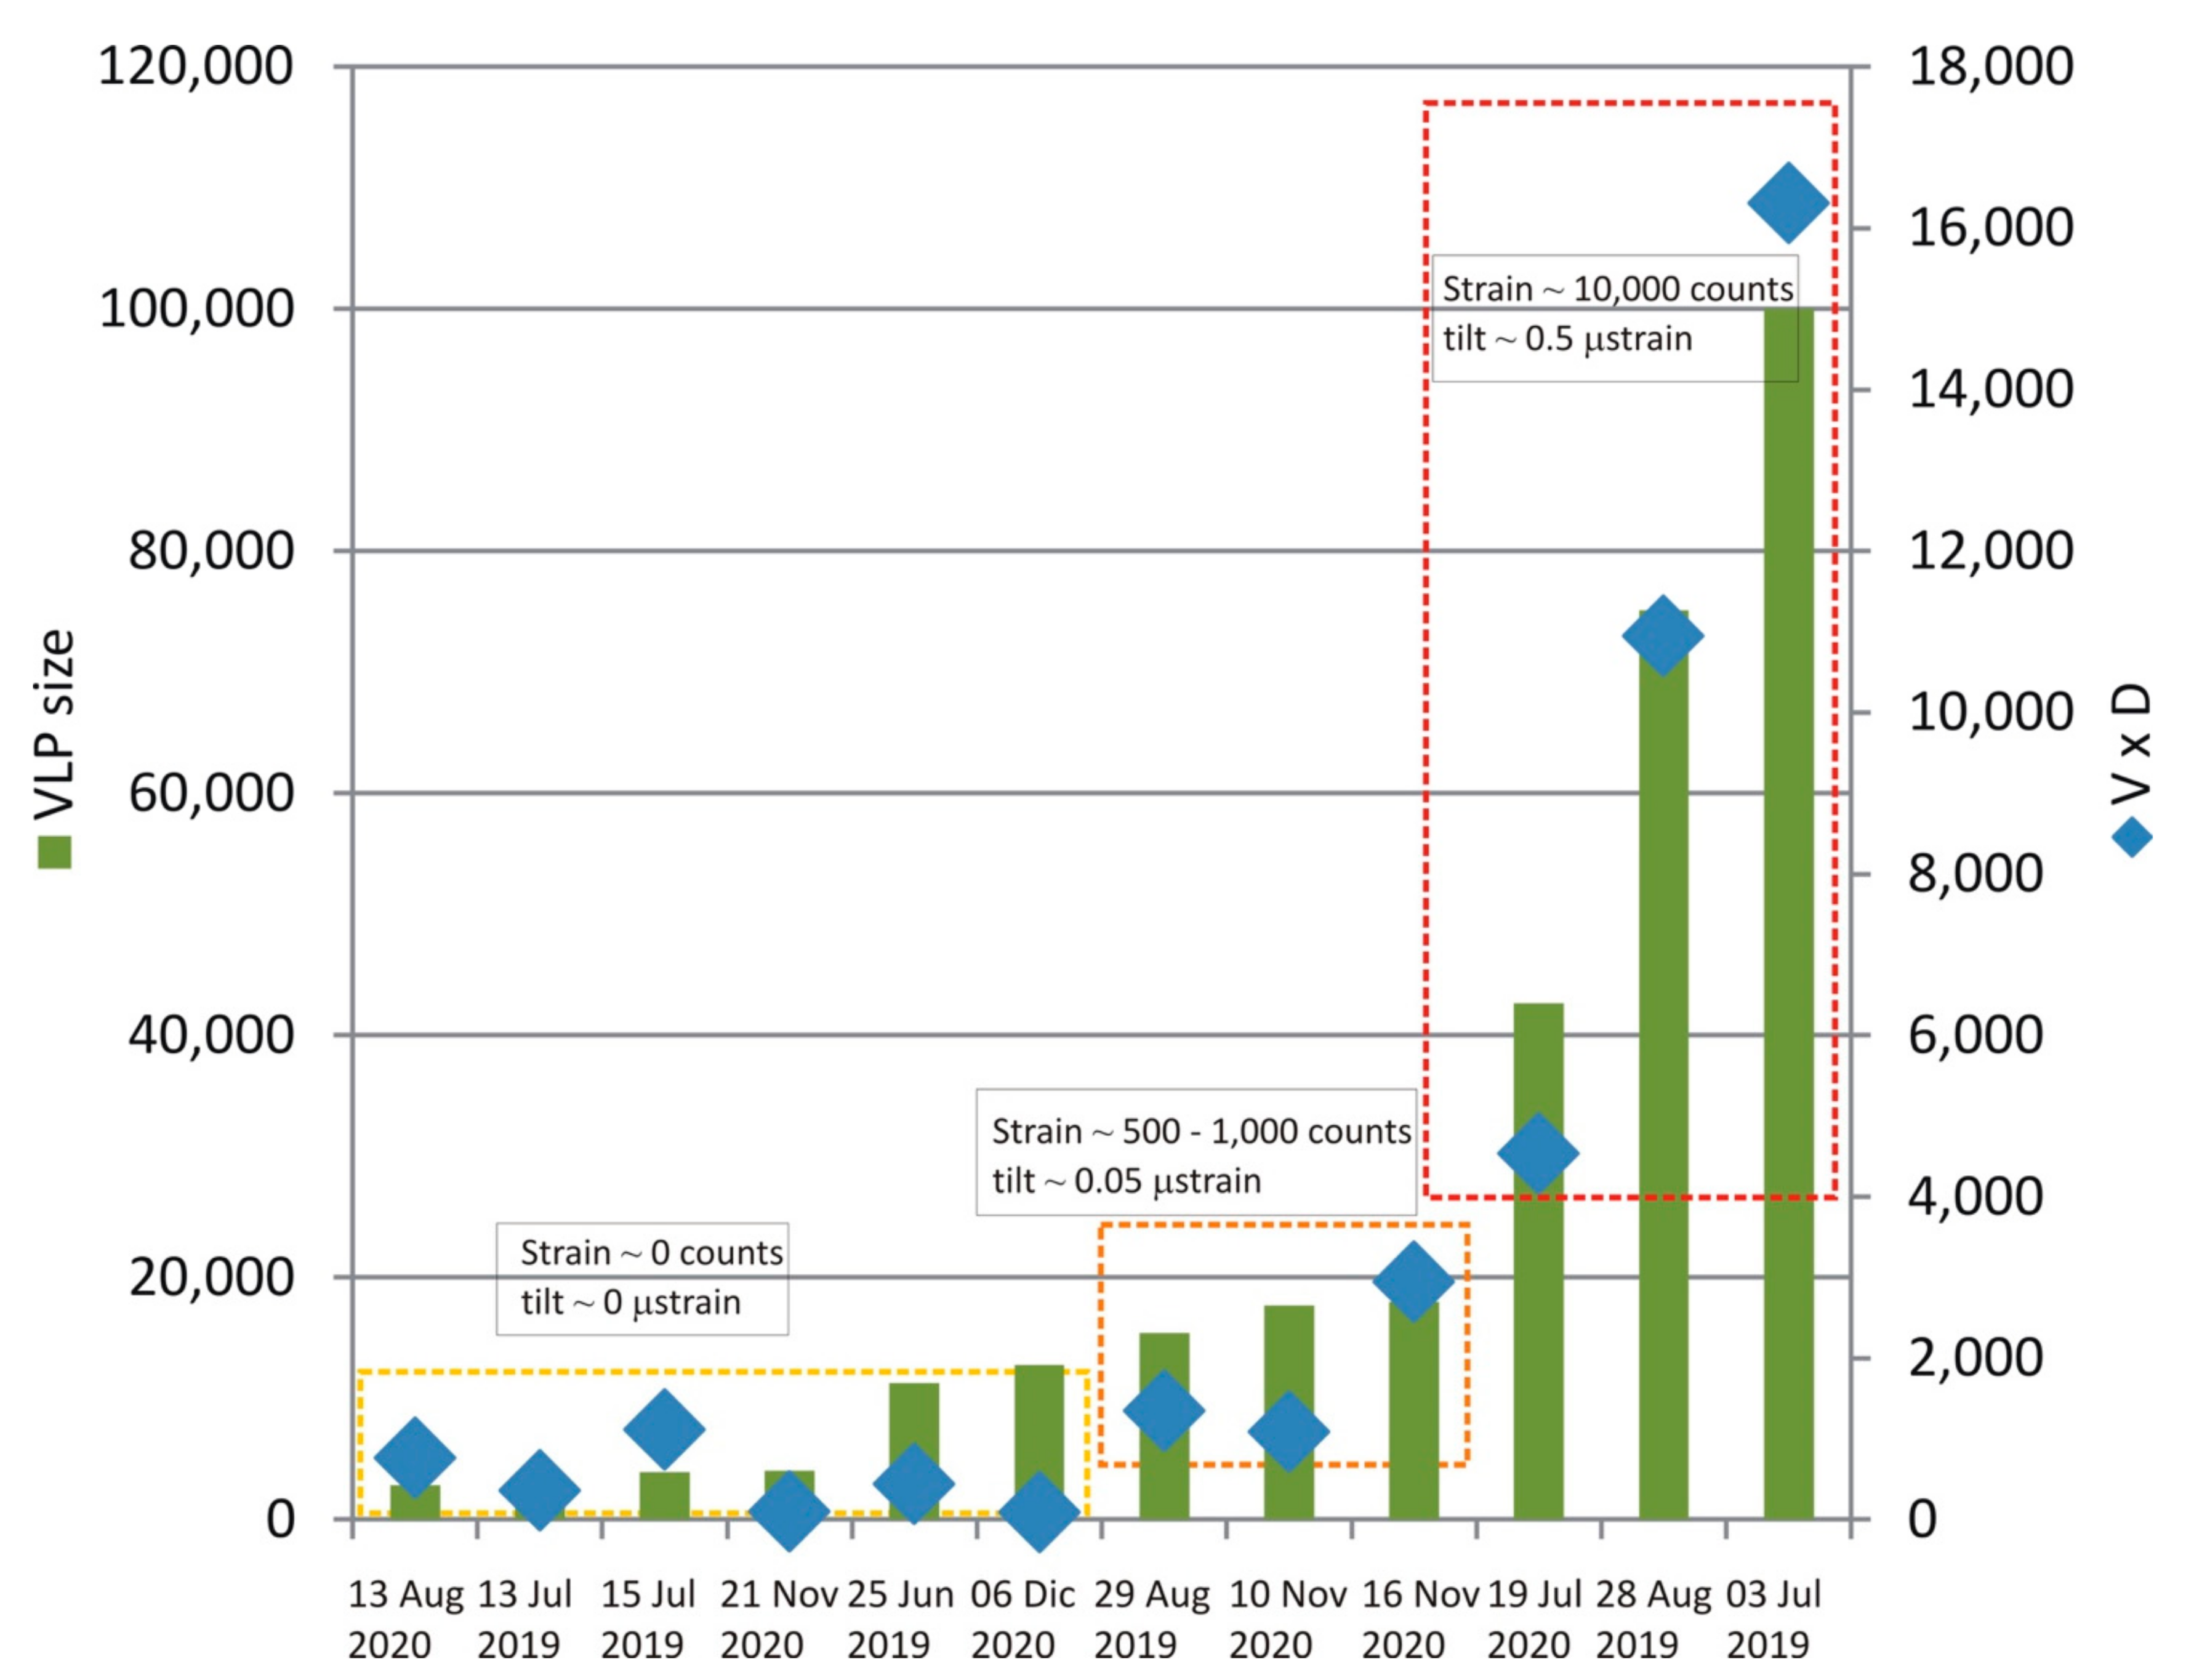
3.2. VLP Size
3.3. Borehole Geophysical Instruments (Tilt and Strain)

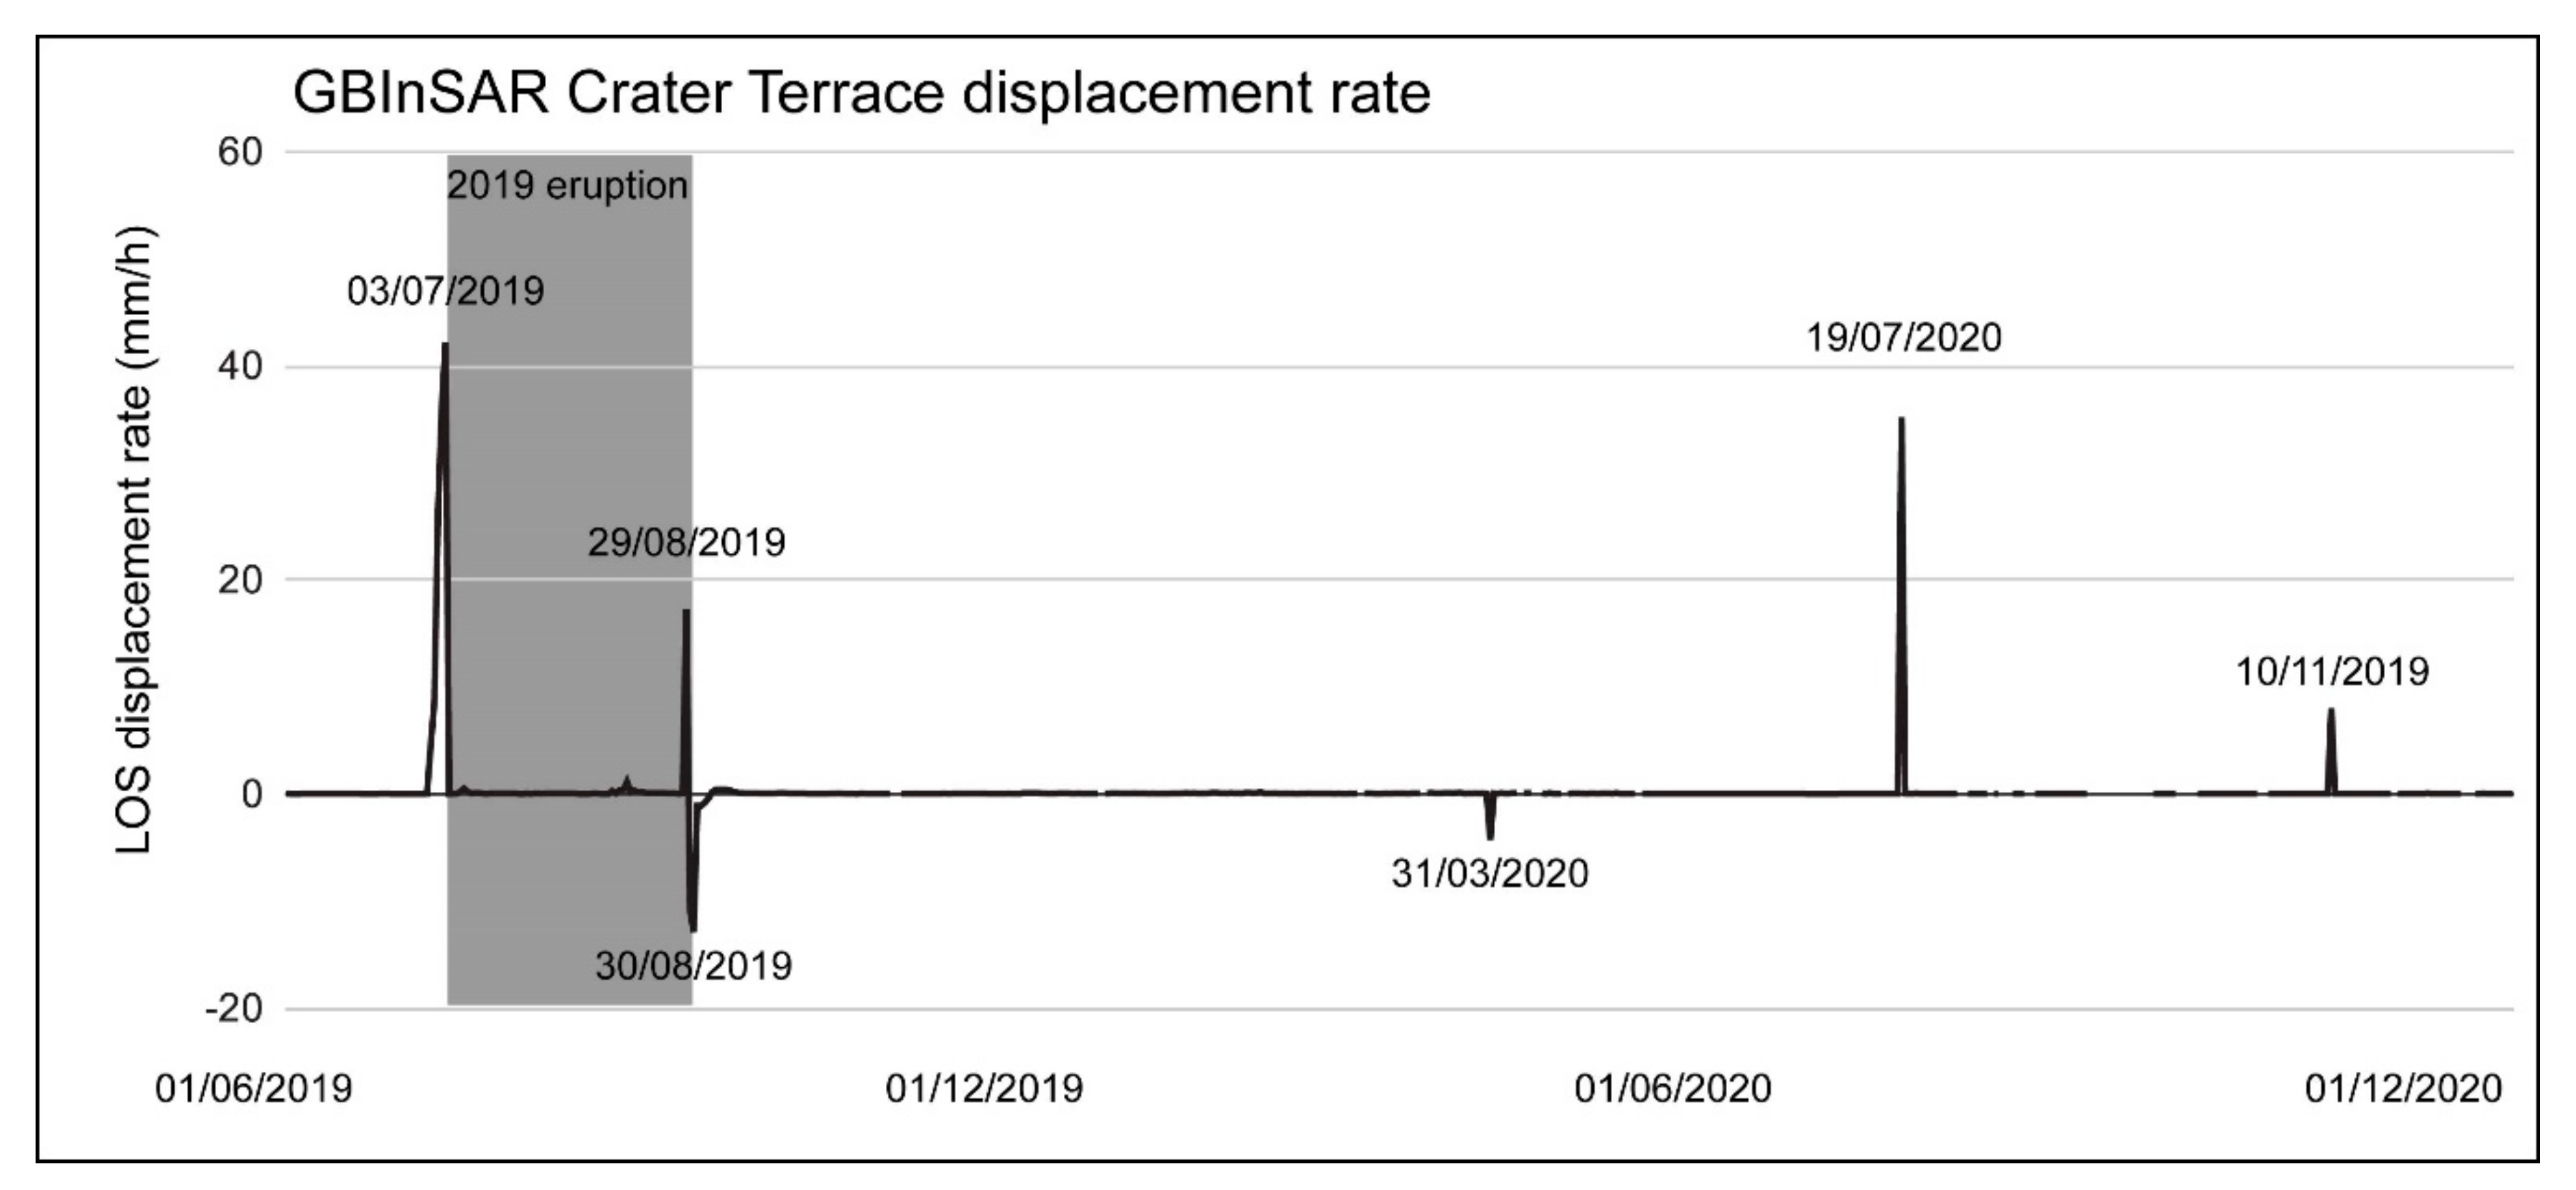
| Date Time (UT) | Muzzle Velocity (m s−1) | Plume H (m) | Duration (s) | VD Parameter | VLP Size (Normalized Counts) | Strain SVO (Counts) | Tilt STDF [x; y] (Micro-Strain) |
|---|---|---|---|---|---|---|---|
| 25 June 2019 23:03:08 | 54.41 | ~500 | 8 | 435 | 11,276 | ~600 1 | 0, 0 |
| 3 July 2019 14:45:43 | 101.92 | 8400 2 | 160 | 16,307 | 100,000 | ~8000 1 | ~0.4; ~0.45 |
| 13 July 2019 20:33 | 29.63 | 110 | 12 | 356 | 3377 | 01 | 0; 0 |
| 15 July 2019 19:09 | 61.63 | 380 | 18 | 1109 | 3909 | 01 | 0; 0 |
| 28 August 2019 10:17:20 | 71.11 | 4000 1 6400 2 | 154 | 10,951 | 75,110 | ~8000 1 | No data |
| 29 August 2019 20:43:18 | 35.55 | 350 | 38 | 1351 | 15,437 | ~500 1 | No data |
| 19 July 2020 03:00:42 | 78.22 | > 750 | 58 | 4537 | 42,661 | ~2000 1 | ~0.4; ~0.05 |
| 13 August 2020 14:50:27 | 11.86 | 550 | 64 | 759 | 2866 | 01 | 0; 0 |
| 10 November 2020 20:04:21 | 54.50 | 600 | 20 | 1090 | 17,688 | ~300 1 | ~0.05; ~0.03 |
| 16 November 2020 09:17:45 | 54.51 | 1000 1 | 54 | 2944 | 18,006 | ~300 1 | ~0.05; ~0.04 |
| 21 November 2020 00:33:17 | 9.48 | 80 | 10 | 95 | 4029 | 0 1 | 0; 0 |
| 6 December 2020 05:12:44 | 11.52 | 300 | 8 | 92 | 12,778 | 0 1 | 0; 0 |
3.4. GBInSAR
4. Discussion
5. Conclusions
Author Contributions
Funding
Acknowledgments
Conflicts of Interest
References
- Parfitt, E.A. A discussion of the mechanisms of explosive basaltic eruptions. J. Volcanol. Geotherm. Res. 2004, 134, 77–107. [Google Scholar] [CrossRef]
- Harris, A.; Ripepe, M. Temperature and dynamics of degassing at Stromboli. J. Geophys. Res. 2007, 112, B03205. [Google Scholar] [CrossRef]
- Patrick, M.R. Dynamics of Strombolian ash plumes from thermal video: Motion, morphology, and air entrainment. J. Geophys. Res. 2007, 112, B06202. [Google Scholar] [CrossRef]
- Patrick, M.R.; Harris, A.J.L.; Ripepe, M.; Dehn, J.; Rothery, D.A.; Calvari, S. Strombolian explosive styles and source conditions: Insights from thermal (FLIR) video. Bull. Volcanol. 2007, 69, 769–784. [Google Scholar] [CrossRef]
- Leduc, L.; Gurioli, L.; Harris, A.; Colò, L.; Rose-Koga, E.F. Types and mechanisms of strombolian explosions: Characterization of a gas-dominated explosion at Stromboli. Bull. Volcanol. 2015, 77, 8. [Google Scholar] [CrossRef]
- Taddeucci, J.; Edmonds, M.; Houghton, B.; James, M.R.; Vergniolle, S. Hawaiian and Strombolian eruptions. In The Encyclopedia of Volcanoes; Elsevier: San Diego, CA, USA, 2015; pp. 485–503. [Google Scholar]
- Chouet, B.; Hamisevicz, N.; McGetchin, T.R. Photoballistics of volcanic jet activity at Stromboli, Italy. J. Geophys. Res. 1974, 79, 4961–4976. [Google Scholar] [CrossRef]
- Gurioli, L.; Harris, A.J.L.; Colò, L.; Bernard, J.; Favalli, M.; Ripepe, M.; Andronico, D. Classification, landing distribution, and associated flight parameters for a bomb field emplaced during a single major explosion at Stromboli, Italy. Geology 2013, 41, 559–562. [Google Scholar] [CrossRef]
- Taddeucci, J.; Alatorre-Ibargüengoitia, M.A.; Cruz-Vázquez, O.; Del Bello, E.; Scarlato, P.; Ricci, T. In-flight dynamics of volcanic ballistic projectiles. Rev. Geophys. 2017, 55, 675–718. [Google Scholar] [CrossRef]
- Romagnoli, C. Characteristics and morphological evolution of the Aeolian volcanoes from the study of submarine portions. Geol. Soc. Lond. Mem. 2013, 37, 13–26. [Google Scholar] [CrossRef]
- Taddeucci, J.; Palladino, D.M.; Sottili, G.; Bernini, D.; Andronico, D.; Cristaldi, A. Linked frequency and intensity of persistent volcanic activity at Stromboli (Italy). Geophys. Res. Lett. 2013, 40, 3384–3388. [Google Scholar] [CrossRef]
- Barberi, F.; Rosi, M.; Sodi, A. Volcanic hazard assessment at Stromboli based on review of historical data. Acta Vulcanol. 1993, 3, 173–187. [Google Scholar]
- Calvari, S.; Bonaccorso, A.; Madonia, P.; Neri, M.; Liuzzo, M.; Salerno, G.G.; Behncke, B.; Caltabiano, T.; Cristaldi, A.; Giuffrida, G.; et al. Major eruptive style changes induced by structural modifications of a shallow conduit system: The 2007–2012 Stromboli case. Bull. Volcanol. 2014, 76, 841. [Google Scholar] [CrossRef]
- Valade, S.; Lacanna, G.; Coppola, D.; Laiolo, M.; Pistolesi, M.; Delle Donne, D.; Genco, R.; Marchetti, E.; Ulivieri, G.; Allocca, C.; et al. Tracking dynamics of magma migration in open-conduit systems. Bull. Volcanol. 2016, 78, 78. [Google Scholar] [CrossRef]
- Aiuppa, A.; de Moor, J.M.; Arellano, S.; Coppola, D.; Francofonte, V.; Galle, B.; Giudice, G.; Liuzzo, M.; Mendoza, E.; Saballos, A.; et al. Tracking formation of a lava lake from ground and space: Masaya volcano (Nicaragua), 2014–2017. Geochem. Geophys. Geosyst. 2018, 19, 496–515. [Google Scholar] [CrossRef]
- Albert, H.; Costa, F.; Di Muro, A.; Herrin, J.; Métrich, N.; Deloule, E. Magma interactions, crystal mush formation, timescales, and unrest during caldera collapse and lateral eruption at ocean island basaltic volcanoes (Piton de la Fournaise, La Réunion). Earth Plan. Sci. Lett. 2019, 515, 187–199. [Google Scholar] [CrossRef]
- Albino, F.; Biggs, J.; Escobar-Wolf, R.; Naismith, A.; Watson, M.; Phillips, J.C.; Chigna Marroquin, G.A. Using TanDEM-X to measure pyroclastic flow source location, thickness and volume: Application to the 3rd June 2018 eruption of Fuego volcano, Guatemala. J. Volcanol. Geotherm. Res. 2020, 406, 107063. [Google Scholar] [CrossRef]
- Battaglia, J.; Métaxian, J.-P.; Garaebiti, E. Short term precursors of Strombolian explosions at Yasur volcano (Vanuatu). Geophys. Res. Lett. 2016, 43, 1960–1965. [Google Scholar] [CrossRef]
- Houghton, B.F.; Taddeucci, J.; Andronico, D.; Gonnermann, H.M.; Pistolesi, M.; Patrick, M.R.; Orr, T.R.; Swanson, D.A.; Edmonds, M.; Gaudin, D.; et al. Stronger or longer: Discriminating between Hawaiian and Strombolian eruption styles. Geology 2016, 44, 163–166. [Google Scholar] [CrossRef]
- Rüdiger, J.; Tirpitz, J.-L.; Maarten de Moor, J.; Bobrowski, N.; Gutmann, A.; Liuzzo, M.; Ibarra, M.; Hoffmann, T. Implementation of electrochemical, optical and denuder-based sensors and sampling techniques on UAV for volcanic gas measurements: Examples from Masaya, Turrialba and Stromboli volcanoes. Atmos. Meas. Tech. 2018, 11, 2441–2457. [Google Scholar] [CrossRef]
- Spampinato, L.; Ganci, G.; Hernandez, P.A.; Calvo, D.; Tedesco, D.; Perez, N.M.; Calvari, S.; Del Negro, C.; Yalire, M.M. Thermal insights into the dynamics of Nyiragongo lava lake from ground and satellite measurements. J. Geophys. Res. Solid Earth 2013, 118, 5771–5784. [Google Scholar] [CrossRef]
- Spampinato, L.; Oppenheimer, C.; Cannata, A.; Montalto, P.; Salerno, G.G.; Calvari, S. On the time-scale of thermal cycles associated with open-vent degassing. Bull. Volcanol. 2012, 74, 1281–1292. [Google Scholar] [CrossRef]
- Vergniolle, S.; Caplan-Auerbach, J. Basaltic thermals and Subplinian plumes: Constraints from acoustic measurements at Shishaldin volcano, Alaska. Bull. Volcanol. 2006, 68, 611–630. [Google Scholar] [CrossRef]
- Woitischek, J.; Woods, A.W.; Edmonds, M.; Oppenheimer, C.; Aiuppa, A.; Pering, T.D.; Ilanko, T.; D’Aleo, R.; Garaebiti, E. Strombolian eruptions and dynamics of magma degassing at Yasur Volcano (Vanuatu). J. Volcanol. Geotherm. Res. 2020, 398, 106869. [Google Scholar] [CrossRef]
- Pioli, L.; Pistolesi, M.; Rosi, M. Transient explosions at open-vent volcanoes: The case of Stromboli (Italy). Geology 2014, 42, 863–866. [Google Scholar] [CrossRef]
- Andronico, D.; Corsaro, R.A.; Cristaldi, A.; Polacci, M. Characterizing high energy explosive eruptions at Stromboli volcano using multidisciplinary data: An example from the 9 January 2005 explosion. J. Volcanol. Geotherm. Res. 2008, 176, 541–550. [Google Scholar] [CrossRef]
- Calvari, S.; Büttner, R.; Cristaldi, A.; Dellino, P.; Giudicepietro, F.; Orazi, M.; Peluso, R.; Spampinato, L.; Zimanowski, B.; Boschi, E. The 7 September 2008 Vulcanian explosion at Stromboli volcano: Multi-parametric characterisation of the event and quantification of the ejecta. J. Geophys. Res. Solid Earth 2012, 117, B05201. [Google Scholar] [CrossRef]
- Rittmann, A. Der ausbruch des Stromboli am 11 September 1930. Z. Vulkanol. 1931, 14, 47–77. [Google Scholar]
- Calvari, S.; Spampinato, L.; Lodato, L. The 5 April 2003 vulcanian paroxysmal explosion at Stromboli volcano (Italy) from field observations and thermal data. J. Volcanol. Geotherm. Res. 2006, 149, 160–175. [Google Scholar] [CrossRef]
- Calvari, S.; Lodato, L.; Steffke, A.; Cristaldi, A.; Harris, A.J.L.; Spampinato, L.; Boschi, E. The 2007 Stromboli flank eruption: Chronology of the events, and effusion rate measurements from thermal images and satellite data. J. Geophys. Res. Solid Earth 2010, 115, B04201. [Google Scholar] [CrossRef]
- Bonaccorso, A.; Calvari, S.; Linde, A.; Sacks, S.; Boschi, E. Dynamics of the shallow plumbing system investigated from borehole strainmeters and cameras during the 15 March 2007 Vulcanian paroxysm at Stromboli volcano. Earth Plan. Sci. Lett. 2012, 357–358, 249–256. [Google Scholar] [CrossRef]
- Giudicepietro, F.; Calvari, S.; Alparone, S.; Bianco, F.; Bonaccorso, A.; Bruno, V.; Caputo, T.; Cristaldi, A.; D’Auria, L.; De Cesare, W.; et al. Integration of Ground-Based Remote-Sensing and In Situ Multidisciplinary Monitoring Data to Analyze the Eruptive Activity of Stromboli Volcano in 2017–2018. Remote Sens. 2019, 11, 1813. [Google Scholar] [CrossRef]
- Giudicepietro, F.; Lopez, C.; Macedonio, G.; Alparone, S.; Bianco, F.; Calvari, S.; De Cesare, W.; Delle Donne, D.; Di Lieto, B.; Esposito, A.M.; et al. Geophysical precursors of the July-August 2019 paroxysmal eruptive phase and their implications for Stromboli volcano (Italy) monitoring. Sci. Rep. 2020, 10, 10296. [Google Scholar] [CrossRef]
- Pistolesi, M.; Delle Donne, D.; Pioli, L.; Rosi, M.; Ripepe, M. The 15 March 2007 explosive crisis at Stromboli volcano, Italy: Assessing physical parameters through a multidisciplinary approach. J. Geophys. Res. Solid Earth 2011, 116, B12206. [Google Scholar] [CrossRef]
- Pistolesi, M.; Rosi, M.; Pioli, L.; Renzulli, A.; Bertagnini, A.; Andronico, D. The paroxysmal event and its deposits. In The Stromboli Volcano: An Integrated Study of the 2002–2003 Eruption; Calvari, S., Inguaggiato, S., Puglisi, G., Ripepe, M., Rosi, M., Eds.; Geophysical Monograph Series; AGU: Washington, DC, USA, 2008; Volume 182, pp. 317–330. [Google Scholar]
- Rosi, M.; Bertagnini, A.; Landi, P. Onset of the persistent activity at Stromboli Volcano (Italy). Bull. Volcanol. 2000, 62, 294–300. [Google Scholar] [CrossRef]
- Lautze, N.C.; Houghton, B.F. Physical mingling of magma and complex eruption dynamics in the shallow conduit at Stromboli volcano, Italy. Geology 2005, 33, 425–428. [Google Scholar] [CrossRef]
- Métrich, N.; Bertagnini, A.; Landi, P.; Rosi, M.; Belhadj, O. Triggering mechanism at the origin of paroxysms at Stromboli (Aeolian Archipelago, Italy): The 5 April 2003 eruption. Geophys. Res. Lett. 2005, 32, L10305. [Google Scholar] [CrossRef]
- D’Oriano, C.; Bertagnini, A.; Pompilio, M. Ash erupted during normal activity at Stromboli (Aeolian Islands, Italy) raises questions on how the feeding system works. Bull. Volcanol. 2011, 73, 471–477. [Google Scholar] [CrossRef]
- Bertagnini, A.; Di Roberto, A.; Pompilio, M. Paroxysmal activity at Stromboli: Lessons from the past. Bull. Volcanol. 2011, 73, 1229–1243. [Google Scholar] [CrossRef]
- Giordano, G.; De Astis, G. The summer 2019 basaltic Vulcanian eruptions (paroxysms) of Stromboli. Bull. Volcanol. 2021, 83, 1. [Google Scholar] [CrossRef]
- Calvari, S.; Spampinato, L.; Lodato, L.; Harris, A.J.L.; Patrick, M.R.; Dehn, J.; Burton, M.R.; Andronico, D. Chronology and complex volcanic processes during the 2002–2003 flank eruption at Stromboli volcano (Italy) reconstructed from direct observations and surveys with a handheld thermal camera. J. Geophys. Res. Solid Earth 2005, 110, B02201. [Google Scholar] [CrossRef]
- Calvari, S.; Spampinato, L.; Bonaccorso, A.; Oppenheimer, C.; Rivalta, E.; Boschi, E. Lava effusion—A slow fuse for paroxysms at Stromboli volcano? Earth Plan. Sci. Lett. 2011, 301, 317–323. [Google Scholar] [CrossRef]
- Calvari, S.; Di Traglia, F.; Ganci, G.; Giudicepietro, F.; Macedonio, G.; Cappello, A.; Nolesini, T.; Pecora, E.; Bilotta, G.; Centorrino, V.; et al. Overflows and Pyroclastic Density Currents in March-April 2020 at Stromboli Volcano Detected by Remote Sensing and Seismic Monitoring Data. Remote Sens. 2020, 12, 3010. [Google Scholar] [CrossRef]
- Di Traglia, F.; Nolesini, T.; Intrieri, E.; Mugnai, F.; Leva, D.; Rosi, M.; Casagli, N. Review of ten years of volcano deformations recorded by the ground-based InSAR monitoring system at Stromboli volcano: A tool to mitigate volcano flank dynamics and intense volcanic activity. Earth Sci. Rev. 2014, 139, 317–335. [Google Scholar] [CrossRef]
- Di Roberto, A.; Bertagnini, A.; Pompilio, M.; Bisson, M. Pyroclastic density currents at Stromboli volcano (Aeolian Islands, Italy): A case study of the 1930 eruption. Bull. Volcanol. 2014, 76, 827. [Google Scholar] [CrossRef]
- Lodato, L.; Spampinato, L.; Harris, A.J.L.; Calvari, S.; Dehn, J.; Patrick, M. The Morphology and Evolution of the Stromboli 2002-03 Lava Flow Field: An Example of Basaltic Flow Field Emplaced on a Steep Slope. Bull. Volcanol. 2007, 69, 661–679. [Google Scholar] [CrossRef]
- Pioli, L.; Rosi, M.; Calvari, S.; Spampinato, L.; Renzulli, A.; Di Roberto, A. The eruptive activity of 28 and 29 December 2002. In The Stromboli Volcano: An Integrated Study of the 2002–2003 Eruption; American Geophysical Union, Geophysical Monograph Series; Calvari, S., Inguaggiato, S., Puglisi, G., Ripepe, M., Rosi, M., Eds.; AGU: Washington, DC, USA, 2008; Volume 182, pp. 105–116. [Google Scholar] [CrossRef]
- Di Traglia, F.; Calvari, S.; D’Auria, L.; Nolesini, T.; Bonaccorso, A.; Fornaciai, A.; Esposito, A.; Cristaldi, A.; Favalli, M.; Casagli, N. The 2014 effusive eruption at Stromboli: New insights from in-situ and remote sensing measurements. Remote Sens. 2018, 10, 2035. [Google Scholar] [CrossRef]
- Bonaccorso, A.; Calvari, S.; Garfì, G.; Lodato, L.; Patané, D. December 2002 flank failure and tsunami at Stromboli volcano inferred by volcanological and geophysical observations. Geophys. Res. Lett. 2003, 30, 1941–1944. [Google Scholar] [CrossRef]
- D’Auria, L.; Giudicepietro, F.; Martini, M.; Peluso, R. Seismological insight into the kinematics of the 5 April 2003 vulcanian explosion at Stromboli volcano (southern Italy). Geophys. Res. Lett. 2006, 33, L08308. [Google Scholar] [CrossRef]
- Di Lieto, B.; Romano, P.; Scarpa, R.; Linde, A.T. Strain signals before and during paroxysmal activity at Stromboli volcano, Italy. Geophys. Res. Lett. 2020, 47, e2020GL088521. [Google Scholar] [CrossRef]
- Landi, P.; Métrich, N.; Bertagnini, A.; Rosi, M. Recycling and “re-hydration” of degassed magma inducing transient dissolution/crystallization events at Stromboli (Italy). J. Volcanol. Geotherm. Res. 2008, 174, 325–336. [Google Scholar] [CrossRef]
- Morrissey, M.M.; Mastin, L.G. Vulcanian Eruptions. In Encyclopedia of Volcanoes; Academic Press: San Diego, CA, USA, 1999; pp. 463–475. [Google Scholar]
- Walker, G.P.L. Explosive volcanic eruptions—A new classification scheme. Geol. Rudsch. 1973, 62, 431–446. [Google Scholar] [CrossRef]
- Sparks, R.S.J.; Bursik, M.I.; Carey, S.N.; Gilbert, J.S.; Glaze, L.S.; Sigurdsson, H.; Woods, A.V. Volcanic Plumes; John Wiley & Sons: Chichester, UK, 1997. [Google Scholar]
- Calvari, S.; Cannavò, F.; Bonaccorso, A.; Spampinato, L.; Pellegrino, A.G. Paroxysmal Explosions, Lava Fountains and Ash Plumes at Etna Volcano: Eruptive Processes and Hazard Implications. Front. Earth Sci. 2018, 6, 107. [Google Scholar] [CrossRef]
- Bonadonna, C.; Pistolesi, M.; Cioni, R.; Degruyter, W.; Elissondo, M.; Baumann, V. Dynamics of wind-affected volcanic plumes: The example of the 2011 Cordón Caulle eruption, Chile. J. Geophys. Res. 2015, 120, 1–20. [Google Scholar] [CrossRef]
- Gaudin, D.; Taddeucci, J.; Scarlato, P.; Del Bello, E.; Ricci, T.; Orr, T.; Houghton, B.; Harris, A.; Rao, S.; Bucci, A. Integrating puffing and explosions in a general scheme for Strombolian-style activity. J. Geophys. Res. Solid Earth 2017, 122, 1860–1875. [Google Scholar] [CrossRef]
- Newhall, C.G.; Self, S. The Volcanic Explosivity Index (VEI): An Estimate of Explosive Magnitude for Historical Volcanism. J. Geophys. Res. 1982, 87, 1231–1238. [Google Scholar] [CrossRef]
- Houghton, B.F.; Swanson, D.A.; Rausch, J.; Carey, R.J.; Fagents, S.A.; Orr, T.R. Pushing the Volcanic Explosivity Index to its limit and beyond: Constraints from exceptionally weak explosive eruptions at Kīlauea in 2008. Geology 2013, 41, 627–630. [Google Scholar] [CrossRef]
- Zanon, V.; Neri, M.; Pecora, E. Interpretation of data from the monitoring thermal camera of Stromboli volcano (Aeolian Islands, Italy). Geol. Mag. 2009, 146, 591–601. [Google Scholar] [CrossRef]
- Salvatore, V.; Silleni, A.; Corneli, D.; Taddeucci, J.; Palladino, D.M.; Sottili, G.; Bernini, D.; Andronico, D.; Cristaldi, A. Parameterizing multi-vent activity at Stromboli Volcano (Aeolian Islands, Italy). Bull. Volcanol. 2018, 80, 64. [Google Scholar] [CrossRef]
- Schmid, M.; Kueppers, U.; Cigala, V.; Sesterhenn, J.; Dingwell, D.B. Release characteristics of overpressurised gas from complex vents: Implications for volcanic hazards. Bull. Volcanol. 2020, 82, 68. [Google Scholar] [CrossRef]
- Mills, D.; Martin, J.; Burbank, J.; Kasch, W. Network Time Protocol Version 4: Protocol and Algorithms Specification. RFC 5905. June 2010. Available online: https://www.rfc-editor.org/info/rfc5905 (accessed on 20 January 2021). [CrossRef]
- De Cesare, W.; Orazi, M.; Peluso, R.; Scarpato, G.; Caputo, A.; D’Auria, L.; Giudicepietro, F.; Martini, M.; Buonocunto, C.; Capello, M.; et al. The Broadband Seismic Network of Stromboli Volcano, Italy. Seismol. Res. Lett. 2009, 80, 435–439. [Google Scholar] [CrossRef]
- Orazi, M.; Martini, M.; Peluso, R. Data acquisition for volcano monitoring. Eos Trans. Am. Geophys. Union 2006, 87, 385–392. [Google Scholar] [CrossRef]
- Bonaccorso, A. Evidence of a dyke-sheet intrusion at Stromboli volcano inferred through continuous tilt. Geophys. Res. Lett. 1998, 25, 4225–4228. [Google Scholar] [CrossRef]
- Bonaccorso, A.; Falzone, G.; Gambino, S. An investigation into shallow borehole tiltmeters. Geophys. Res. Lett. 1999, 26, 1637–1640. [Google Scholar] [CrossRef]
- Gambino, S.; Falzone, G.; Ferro, A.; Laudani, G. Volcanic processes detected by tiltmeters: A review of experience on Sicilian volcanoes. J. Volcanol. Geotherm. Res. 2014, 271, 43–54. [Google Scholar] [CrossRef]
- Sacks, I.S.; Suyehiro, S.; Evertson, D.W. Sacks-Evertson strainmeter, its installation in Japan and some preliminary results concerning strain steps. Proc. Jpn. Acad. 1971, 47, 707–712. [Google Scholar] [CrossRef]
- Martini, M.; Giudicepietro, F.; D’Auria, L.; Esposito, A.M.; Caputo, T.; Curciotti, R.; De Cesare, W.; Orazi, M.; Scarpato, G.; Caputo, A.; et al. Seismological monitoring of the February 2007 effusive eruption of the Stromboli volcano. Ann. Geophys. 2007, 50, 775–788. [Google Scholar]
- Antonello, G.; Casagli, N.; Farina, P.; Leva, D.; Nico, G.; Sieber, A.J.; Tarchi, D. Ground-based SAR interferometry for monitoring mass movements. Landslides 2004, 1, 21–28. [Google Scholar] [CrossRef]
- Di Traglia, F.; Battaglia, M.; Nolesini, T.; Lagomarsino, D.; Casagli, N. Shifts in the eruptive styles at Stromboli in 2010–2014 revealed by ground-based InSAR data. Sci. Rep. 2015, 5, 13569. [Google Scholar] [CrossRef]
- Rudolf, H.; Leva, D.; Tarchi, D.; Sieber, A.J. A mobile and versatile SAR system. In Proceedings of the IEEE 1999 International Geoscience and Remote Sensing Symposium, IGARSS’99 (Cat. No.99CH36293), Hamburg, Germany, 28 June–2 July 1999; pp. 592–594. [Google Scholar]
- Monserrat, O.; Crosetto, M.; Luzi, G. A review of ground-based SAR interferometry for deformation measurement. ISPRS J. Photogramm. Remote Sens. 2014, 93, 40–48. [Google Scholar] [CrossRef]
- Calvari, S.; Intrieri, E.; Di Traglia, F.; Bonaccorso, A.; Casagli, N.; Cristaldi, A. Monitoring crater-wall collapse at active volcanoes: A study of the 12 January 2013 event at Stromboli. Bull. Volcanol. 2016, 78, 1–16. [Google Scholar] [CrossRef]
- Casagli, N.; Tibaldi, A.; Merri, A.; Del Ventisette, C.; Apuani, T.; Guerri, L.; Fortuny-Guasch, J.; Tarchi, D. Deformation of Stromboli Volcano (Italy) during the 2007 eruption revealed by radar interferometry, numerical modelling and structural geological field data. J. Volcanol. Geotherm. Res. 2009, 182, 182–200. [Google Scholar] [CrossRef]
- Schaefer, L.N.; Di Traglia, F.; Chaussard, E.; Lu, Z.; Nolesini, T.; Casagli, N. Monitoring volcano slope instability with Synthetic Aperture Radar: A review and new data from Pacaya (Guatemala) and Stromboli (Italy) volcanoes. Earth Sci. Rev. 2019, 192, 236–257. [Google Scholar] [CrossRef]
- Marchese, F.; Genzano, N.; Neri, M.; Falconieri, A.; Mazzeo, G.; Pergola, N. A Multi-Channel Algorithm for Mapping Volcanic Thermal Anomalies by Means of Sentinel-2 MSI and Landsat-8 OLI Data. Remote Sens. 2019, 11, 2876. [Google Scholar] [CrossRef]
- Genzano, N.; Pergola, N.; Marchese, F. A Google Earth Engine Tool to Investigate, Map and Monitor Volcanic Thermal Anomalies at Global Scale by Means of Mid-High Spatial Resolution Satellite Data. Remote Sens. 2020, 12, 3232. [Google Scholar] [CrossRef]
- Carey, S.N.; Sparks, R.S.J. Quantitative models of the fallout and dispersal of tephra from volcanic eruption columns. Bull. Volcanol. 1986, 48, 109–125. [Google Scholar] [CrossRef]
- Neuberg, J.; Luckett, R.; Ripepe, M.; Braun, T. Highlights from a seismic broadband array on Stromboli volcano. Geophys. Res. Lett. 1994, 21, 749–752. [Google Scholar] [CrossRef]
- Chouet, B.; Dawson, P.; Ohminato, T.; Martini, M.; Saccorotti, G.; Giudicepietro, F.; De Luca, G.; Milana, G.; Scarpa, R. Source mechanisms of explosions at Stromboli volcano, Italy, determined from moment-tensor inversions of very- long-period data. J. Geophys. Res. 2003, 108, 2019. [Google Scholar] [CrossRef]
- Giudicepietro, F.; Auria, L.D.; Martini, M.; Caputo, T.; Peluso, R.; de Cesare, W.; Orazi, M.; Scarpato, G. Changes in the VLP seismic source during the 2007 Stromboli eruption. J. Volcanol. Geotherm. Res. 2009, 182, 162–171. [Google Scholar] [CrossRef]
- Bonaccorso, A.; Gambino, S.; Guglielmino, F.; Mattia, M.; Puglisi, G.; Boschi, E. Stromboli 2007 eruption: Deflation modeling to infer shallow-intermediate plumbing system. Geophys. Res. Lett. 2008, 35, L06311. [Google Scholar] [CrossRef]
- Bevilacqua, A.; Bertagnini, A.; Pompilio, M.; Landi, P.; Del Carlo, P.; Di Roberto, A.; Aspinal, W.; Neri, A. Major explosions and paroxysms at Stromboli (Italy): A new historical catalog and temporal models of occurrence with uncertainty quantification. Sci. Rep. 2020, 10, 17357. [Google Scholar] [CrossRef]
- Bertolaso, G.; Bonaccorso, A.; Boschi, E. Scientific Community and Civil Protection Synergy during the Stromboli 2002–2003 Eruption. In The Stromboli Volcano: An Integrated Study of the 2002–2003 Eruption; AGU Geophysical Monograph Series; AGU: Washington, DC, USA, 2008; pp. 387–397. [Google Scholar] [CrossRef]
- McBirney, A.R. Factors Governing the Intensity of Explosive Andesitic Eruptions. Bull. Volcanol. 1973, 37, 443–453. [Google Scholar] [CrossRef]


| Label | Type | Location | Distance from the Craters (m) | Frame Rate (hz) | Field of View (m) |
|---|---|---|---|---|---|
| SPT | Thermal FLIR A310 | Pizzo Sopra La Fossa 890 m a.s.l. | 250 | 2 | 500 × 370 |
| SPCT | Thermal FLIR A320 | West SdF flank 85 m a.s.l. | 1698 | 2 | 2150 × 1613 |
| SCT | Thermal FLIR A655sc | East SdF flank 165 m a.s.l. | 1538 | 2 | 807 × 605 |
| SQT | Thermal FLIR A320 | East SdF flank 390 m a.s.l. | 1027 | 0.5 | 455 × 340 |
| SQV | Visual Sony FCB-EX480CP | East SdF flank, 390 m a.s.l. | 1027 | 0.5 | 657 × 493 |
| SCV | Visual Mobotix M26 | East SdF flank 163 m a.s.l. | 1538 | 2 | 1776 × 1274 |
| System | Model | Band | Revisiting Time [min] | Averaging Interval [min] | Look Angle [deg] | Heading Angle [deg] |
|---|---|---|---|---|---|---|
| GBInSAR NE400 * | GBInSAR LiSAmobile k09 | Ku | 11 (until November 2017) 6 (since November 2017) | 33 | from 63.8° to 90.0° | from 143° to 217° |
| GBInSAR NE190 ** | GBInSAR LiSAmobile k09 | Ku | 2 | 30 | from 65.0° to 113.5° | from 115° to 245° |
| Date | ME/PA | Time (UT) | Main Features | References and Notes |
|---|---|---|---|---|
| 25 June 2019 | ME | 23:03:08 | CC crater zone widened after the explosive event. | INGV weekly report 27/2019 1 |
| 3 July 2019 | PA | 14:45:43 | Lava flow within the crater. Blast starting from SWC and NEC. The N rim of the crater terrace was blown away. Two PDCs along the SdF and several small lava flows. | INGV weekly report 28/2019 1 |
| 13 July 2019 | ME | 20:33 | Intense event detected from seismicity. | INGV weekly report 29/2019 1 |
| 15 July 2019 | ME | 19:09 | Intense event detected from seismicity. | INGV weekly report 29/2019 1 |
| 28 August 2019 | PA | 10:17:20 | Paroxysm comprising 3 pulses from SWC and NEC. PDC along SdF, NEC crater rim eroded by the blast. | INGV special report 35/2019 1 |
| 29 August 2019 | ME | 20:43:18 | Two fountaining during lava flow output with fallout on Ginostra. | INGV daily report n. 32, 30 August 2019 1 |
| 19 July 2020 | PA | 03:00:42 03:01:11 03:01:28 | Explosive sequence in 3 pulses from CC and SWC, with fallout of bombs to Il Pizzo and down to 500 m asl. | INGV weekly report 30/2020 1 |
| 13 August 2020 | ME | 14:50:28 | Explosive sequence from SWC. No fallout. | INGV weekly report 34/2020 1 |
| 10 November 2020 | ME | 20:04:21 20:04:51 | Explosive sequence from SWC followed by several pulses at NEC and CC. | INGV weekly report 47/2020 1 |
| 16 November 2020 | ME | 09:17:45 | SWC, CC and NEC produced a blast expanding horizontally like a rose. PDC along the SdF that spread over the sea surface for ~250 m. Fallout at Il Pizzo. | INGV weekly reports 47/2020, 48/2020 1 |
| 21 November 2020 | ME | 00:33:17 | Sequence of 3 explosive events from NEC and CC. | INGV weekly report 48/2020 1 |
| 6 December 2020 | ME | 05:12:44 | Two pulses. Ballistics to 300 m height, ash plume, 2 PDCs along SdF. | INGV weekly report 50/2020 1 |
| Classification Scheme of Strombolian Explosions | ||||
|---|---|---|---|---|
| Explosion Class | 0 | 1 | 2 | 3 |
| Local explosion classification | Ordinary | Intermediate | Major | Paroxysmal |
| Effect/dispersal area | Crater terrace | Crater terrace/rarely top of the volcano | Top of the volcano/rarely island sectors | Island sectors/rarely more distal areas (other islands or the surrounding coasts) |
| Jet/plume height (m) | <100 | 100–300 | 300–1000 | >1000 |
| Duration (s) | <20 | 20–30 | 30–100 | >100 |
| Max. speed (m/s) | <10 | 10–30 | 30–70 | >70 |
| VLP size | <2000 | 2000–12,000 | 12,000–18,000 | > 18,000 |
| VD parameter | <90 | 90–1000 | 1000–4000 | >4000 |
| Tilt SVO (microstrain) | ~0 | ~0 | ~0.05 × 10⁻⁶ | ~0.5 × 10⁻⁶ |
| Strain STDF (counts) | ~0 | ~0 | 5000–1000 | 2000–10,000 |
Publisher’s Note: MDPI stays neutral with regard to jurisdictional claims in published maps and institutional affiliations. |
© 2021 by the authors. Licensee MDPI, Basel, Switzerland. This article is an open access article distributed under the terms and conditions of the Creative Commons Attribution (CC BY) license (http://creativecommons.org/licenses/by/4.0/).
Share and Cite
Calvari, S.; Giudicepietro, F.; Di Traglia, F.; Bonaccorso, A.; Macedonio, G.; Casagli, N. Variable Magnitude and Intensity of Strombolian Explosions: Focus on the Eruptive Processes for a First Classification Scheme for Stromboli Volcano (Italy). Remote Sens. 2021, 13, 944. https://0-doi-org.brum.beds.ac.uk/10.3390/rs13050944
Calvari S, Giudicepietro F, Di Traglia F, Bonaccorso A, Macedonio G, Casagli N. Variable Magnitude and Intensity of Strombolian Explosions: Focus on the Eruptive Processes for a First Classification Scheme for Stromboli Volcano (Italy). Remote Sensing. 2021; 13(5):944. https://0-doi-org.brum.beds.ac.uk/10.3390/rs13050944
Chicago/Turabian StyleCalvari, Sonia, Flora Giudicepietro, Federico Di Traglia, Alessandro Bonaccorso, Giovanni Macedonio, and Nicola Casagli. 2021. "Variable Magnitude and Intensity of Strombolian Explosions: Focus on the Eruptive Processes for a First Classification Scheme for Stromboli Volcano (Italy)" Remote Sensing 13, no. 5: 944. https://0-doi-org.brum.beds.ac.uk/10.3390/rs13050944