
S-NPP VIIRS Day Night Band On-Board Solar Diffuser Calibration Validation Using the Scheduled Lunar Collections


1
Global Science & Technology (GST), College Park, MD 20740, USA
2
NOAA NESDIS/STAR/SMCD, College Park, MD 20740, USA
*
Author to whom correspondence should be addressed.
Remote Sens. 2021, 13(6), 1093; https://0-doi-org.brum.beds.ac.uk/10.3390/rs13061093
Submission received: 2 February 2021
/
Revised: 8 March 2021
/
Accepted: 10 March 2021
/
Published: 13 March 2021
(This article belongs to the Special Issue Frontiers in Remote Sensing Techniques and Applications Using Visible Infrared Imaging Radiometer Suites)
Abstract
:Similar to the Reflective Solar Band (RSB) calibration, Suomi-National Polar-orbiting Partnership (S-NPP) Visible Infrared Imaging Radiometer Suite (VIIRS) on-board calibration of Day Night Band (DNB) is based on the Solar Diffuser (SD) observations in the Low Gain State (LGS). DNB has a broad spectral response covering a wavelength range roughly from 500 nm to 900 nm with a large dynamic range from three different gain states called High Gain State (HGS), Mid Gain State (MGS), and LGS. The calibration of MGS and HGS is also dependent on the LGS gain estimation with the gain ratios for each gain state. Over the lifetime of S-NPP VIIRS operations, the LGS gains have been derived from the on-board SD observations since its launch in October 2011. In this study, the lifetime LGS gains are validated by the lunar calibration coefficients (defined as F-factors) using a lunar irradiance model called Global Space-based Inter-Calibration System (GSICS) Implementation of RObotic Lunar Observatory (ROLO) (GIRO). Using the moon as an independent on-orbit calibration source, the S-NPP VIIRS DNB on-board SD based radiometric calibration is validated by the lunar F-factors within two percent of the lunar F-factors in terms of the standard deviation in the long-term trends over nine years of the S-NPP VIIRS operation.
1. Introduction
The Suomi-National Polar-orbiting Partnership (S-NPP) satellite was launched on October 28, 2011 including Visible Infrared Imaging Radiometer Suite (VIIRS) sensor to provide continuous global observations following the legacy imaging instruments such as National Aeronautics and Space Administration’s (NASA) Moderate Resolution Imaging Spectroradiometer (MODIS) and National Oceanic and Atmospheric Administration’s (NOAA) Advanced Very-High Resolution Radiometer (AVHRR) [1,2]. The VIIRS was designed to have similar spectral responses and on-board calibration systems following the historical MODIS instrument. The VIIRS has 14 Reflective Solar Bands (RSBs) and 7 Thermal Emissive Bands (TEBs) and a Day Night Band (DNB) covering a spectral range from 400 nm to 12,322 nm with spatial resolution of 750 m for medium resolution (M) bands and 350 m for Imaging resolution (I) bands with nadir observations. In addition to the RSBs and TEBs, DNB is a unique panchromatic band approximately covering 500 nm to 900 nm with capability of day and night observations from its Low Gain State (LGS), Mid Gain State (MGS), and High Gain States (HGS). The three gain states cover a radiometric dynamic range from 3 nano Watts to 2 × 10⁻² W/cm2, which is wide enough for the day and night observations.
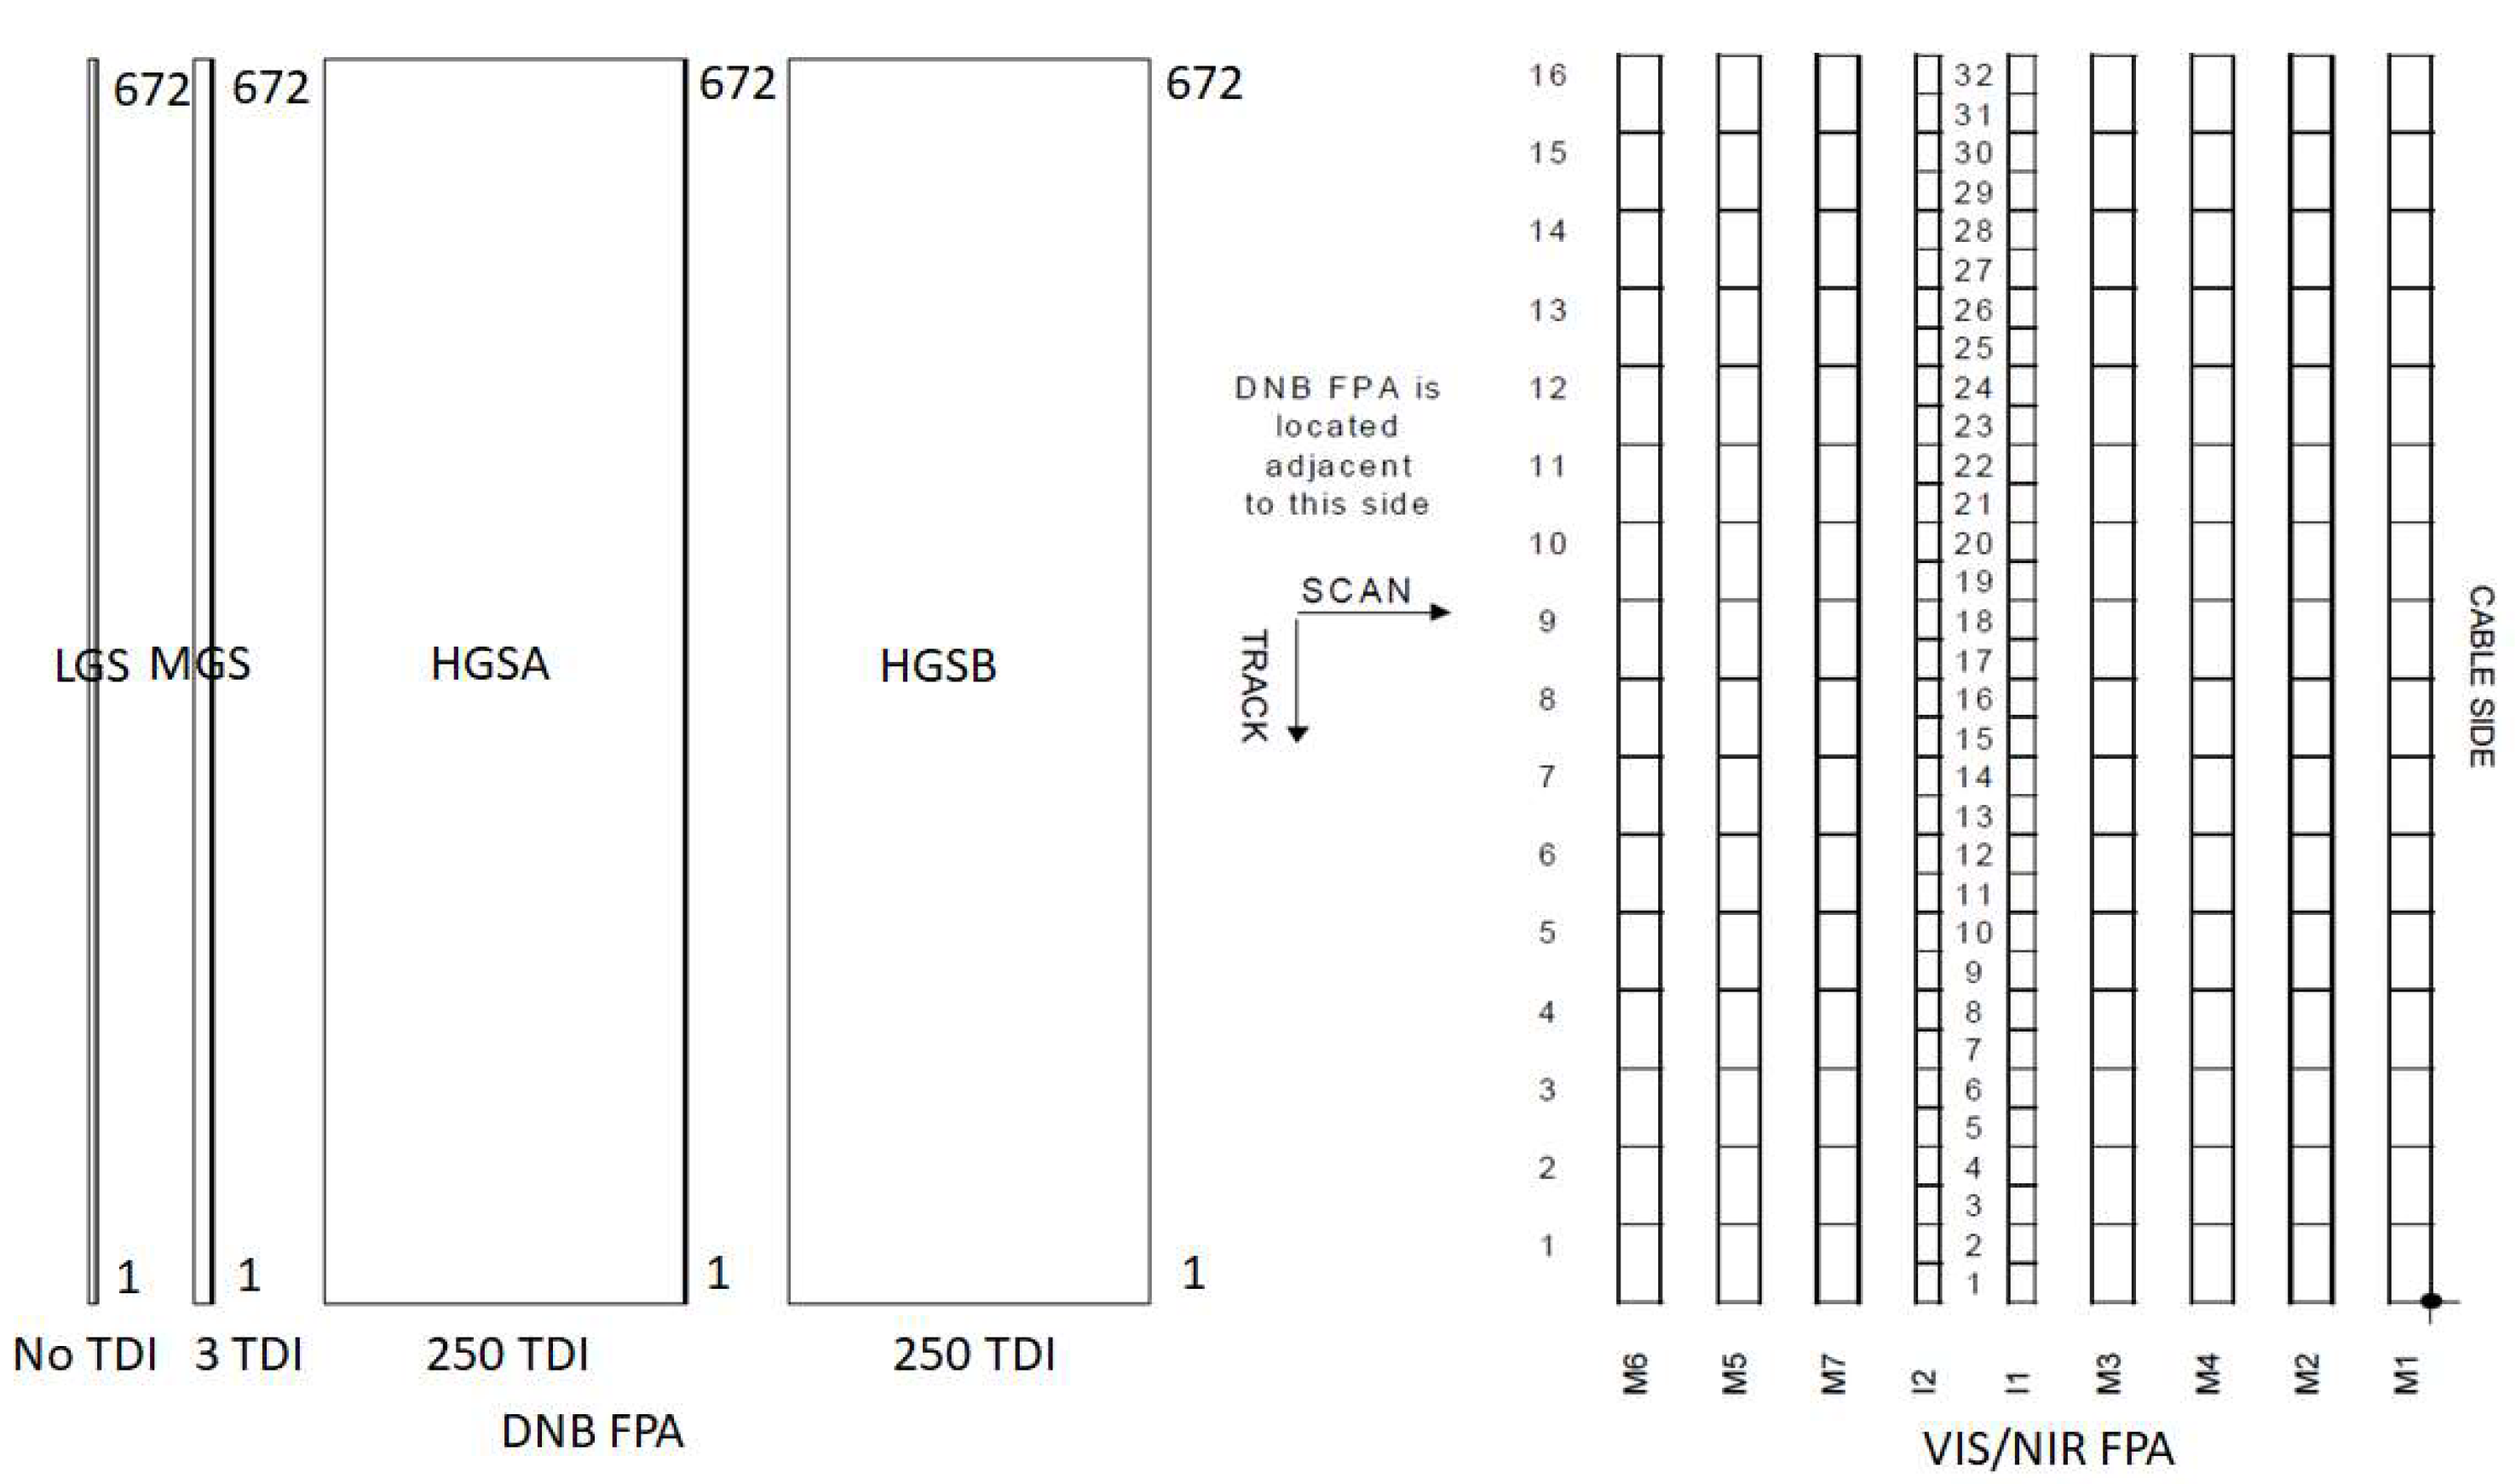
DNB is on a temperature controlled Focal Plane Assembly (FPA) at a nominal temperature of 253 K and it has a backside-illuminated Charge-Coupled Device (CCD) detector chip with four different sets of sub-pixel detectors as shown in Figure 1. The DNB FPA is located adjacent to the Visible and Near Infrared (VIS/NIR) FPA. There are 672 sub-pixels in along-track direction and three different Time Delay Integration (TDI) configurations for each gain state. The LGS detector array has no TDI whereas MGS and HGS has 3 and 250 TDIs, respectively. The 250 TDI and the two identical HGSA and HGSB reduce noise and radiation impacts in data by averaging the multiple observations and detectors. The signals from all four detector arrays are digitized and an appropriate gain state is selected by logic on the DNB Timing card in the VIIRS Electronics Module (EM) for the best representation of the EV scene [3]. The 672 sub-pixel responses are aggregated to 16 representative pixels with the 32 aggregation zones. The aggregation zones are determined by the scan angles to compensate for the bow-tie effects. Details of the VIIRS DNB operations are well described in the Joint Polar Satellite System (JPSS) VIIRS Radiometric Calibration Algorithm Theoretical Basis Document (ATBD) [3].
Similar to RSB calibration, DNB on-board calibration is based on the Solar Diffuser (SD) and corresponding Space View (SV) observations in the LGS. The SD degradation, which is estimated by the Solar Diffuser Stability Monitor (SDSM) collections, compensates the time-dependent reduction of SD surface reflectance of the prelaunch Bidirectional Reflectance Distribution Function (BRDF) [4,5]. The ratio between the estimated radiance from the Sun and the biased removed SD Digital Number (DN) is the on-orbit gain factor in the LGS [6]. When deriving the estimated radiance of the SD from the Sun, the spectral response of the Rotating Telescope Assembly (RTA) needs to be considered. Since there was continuous RTA mirror darkening due to the Tungsten contamination on the surface of the mirror [7,8], the contamination of the mirror was modeled and applied to get time-dependent modulated Relative Spectral Response (RSR) in the LGS gain estimation.
As an alternative source of calibration, scheduled lunar observations has been used to validate the on-orbit calibration for the earth observing sensors like SeaWifs, Terra and Aqua MODIS, Landsat-8 Operational Land Imager (OLI), and Geostationary Operational Environmental Satellite (GOES)-10 visible imager channels [9,10,11,12,13]. Previously, the lunar collections were used only for the RSB bands of VIIRS and the lunar calibration coefficients were compared with the SD based calibration coefficients (called F-factors) [4,5,14]. In this work, we provide descriptions of current DNB lunar calibration algorithm used by NOAA radiance team validating the on-orbit SD calibration by the lunar calibration results. For accurate estimation of lunar calibration, we present detailed steps of the on-orbit modulated RSRs modeling, the lunar irradiance model called GIRO, verified Raw Data Record (vRDR) pixel count conversions, radiance to irradiance conversion using lunar phase angles and distance, and long-term DNB calibration stabilities in comparisons with the DNB radiometric calibration uncertainty requirements.
2. On-orbit DNB Calibration
2.1. Primary On-Orbit DNB Calibration Using SD
As a sun-synchronous, polar orbiting and scanning radiometer, S-NPP VIIRS provides four different on-orbit data sets of Space View (SV), Earth View (EV), Blackbody (BB), and SD and SDSM views in order of the RTA scan direction as shown in Figure 2. The BB, SD, and SDSM view data sets are used for on-orbit calibration for TEB and RSB calibration along with the SV data, which provides detector bias at the zero signal [14,15,16,17]. The BB is temperature controlled at 292.5 K with a very high emissivity and the on-orbit BB observations are used as a reference for the TEB calibration.
For RSB calibration, the SD BRDF provides the prelaunch calibration traceability to the National Institute of Standards and Technology (NIST) standard. When VIIRS is on-orbit, the SD gets illuminated by the Sun and starts reflectance degradation especially in the short wavelengths due to exposure to solar UltraViolet (UV) and energetic particle radiation [18,19]. The estimation of SD degradation is one of the key factors of on-orbit calibration and it is called H-factor. The H-factor is also used for DNB on-orbit calibration in following Equation (1).
In Equation (1), G is named as gain (but actually it is 1/gain), h is Half Angle Mirror (HAM) side, d is DNB detector, Ag is aggregation zone, θSD is solar incident angle to the SD screen, RVSSD is Response Versus Scan angle (RVS) at the SD angle, is the solar irradiance value at the a wavelength λ, d is the distance between the Sun and sensor, is the BRDF combined with SD transmittance function, H is the SD degradation, and dnSD(h,d,Ag) is bias removed (denoted as lower case) DN. The detector bias removal of the SD observation is performed by removing zero signal from the SV observation in the same scan of RTA.
In the early lifetime of S-NPP VIIRS, significant optical degradation was reported in the SD signal due to an unexpected RTA mirror darkening [7]. An anomaly investigation team was formed and concluded that it was caused by the deposition of a thin layer of tungsten oxide (WOx). With UV exposure, the thin layers of the WOx on the surface of the mirrors darken the reflectance of the mirrors mostly 500 nm to 2500 nm range with a peak value at 1000 nm. The RTA degradation significantly modified the shape of RSR, and the changes were included in the DNB calibration as shown in Equation (1). The RTA degradation model and its parameters were adapted from a NASA team’s study [20].
2.2. Scheduled Lunar Collection
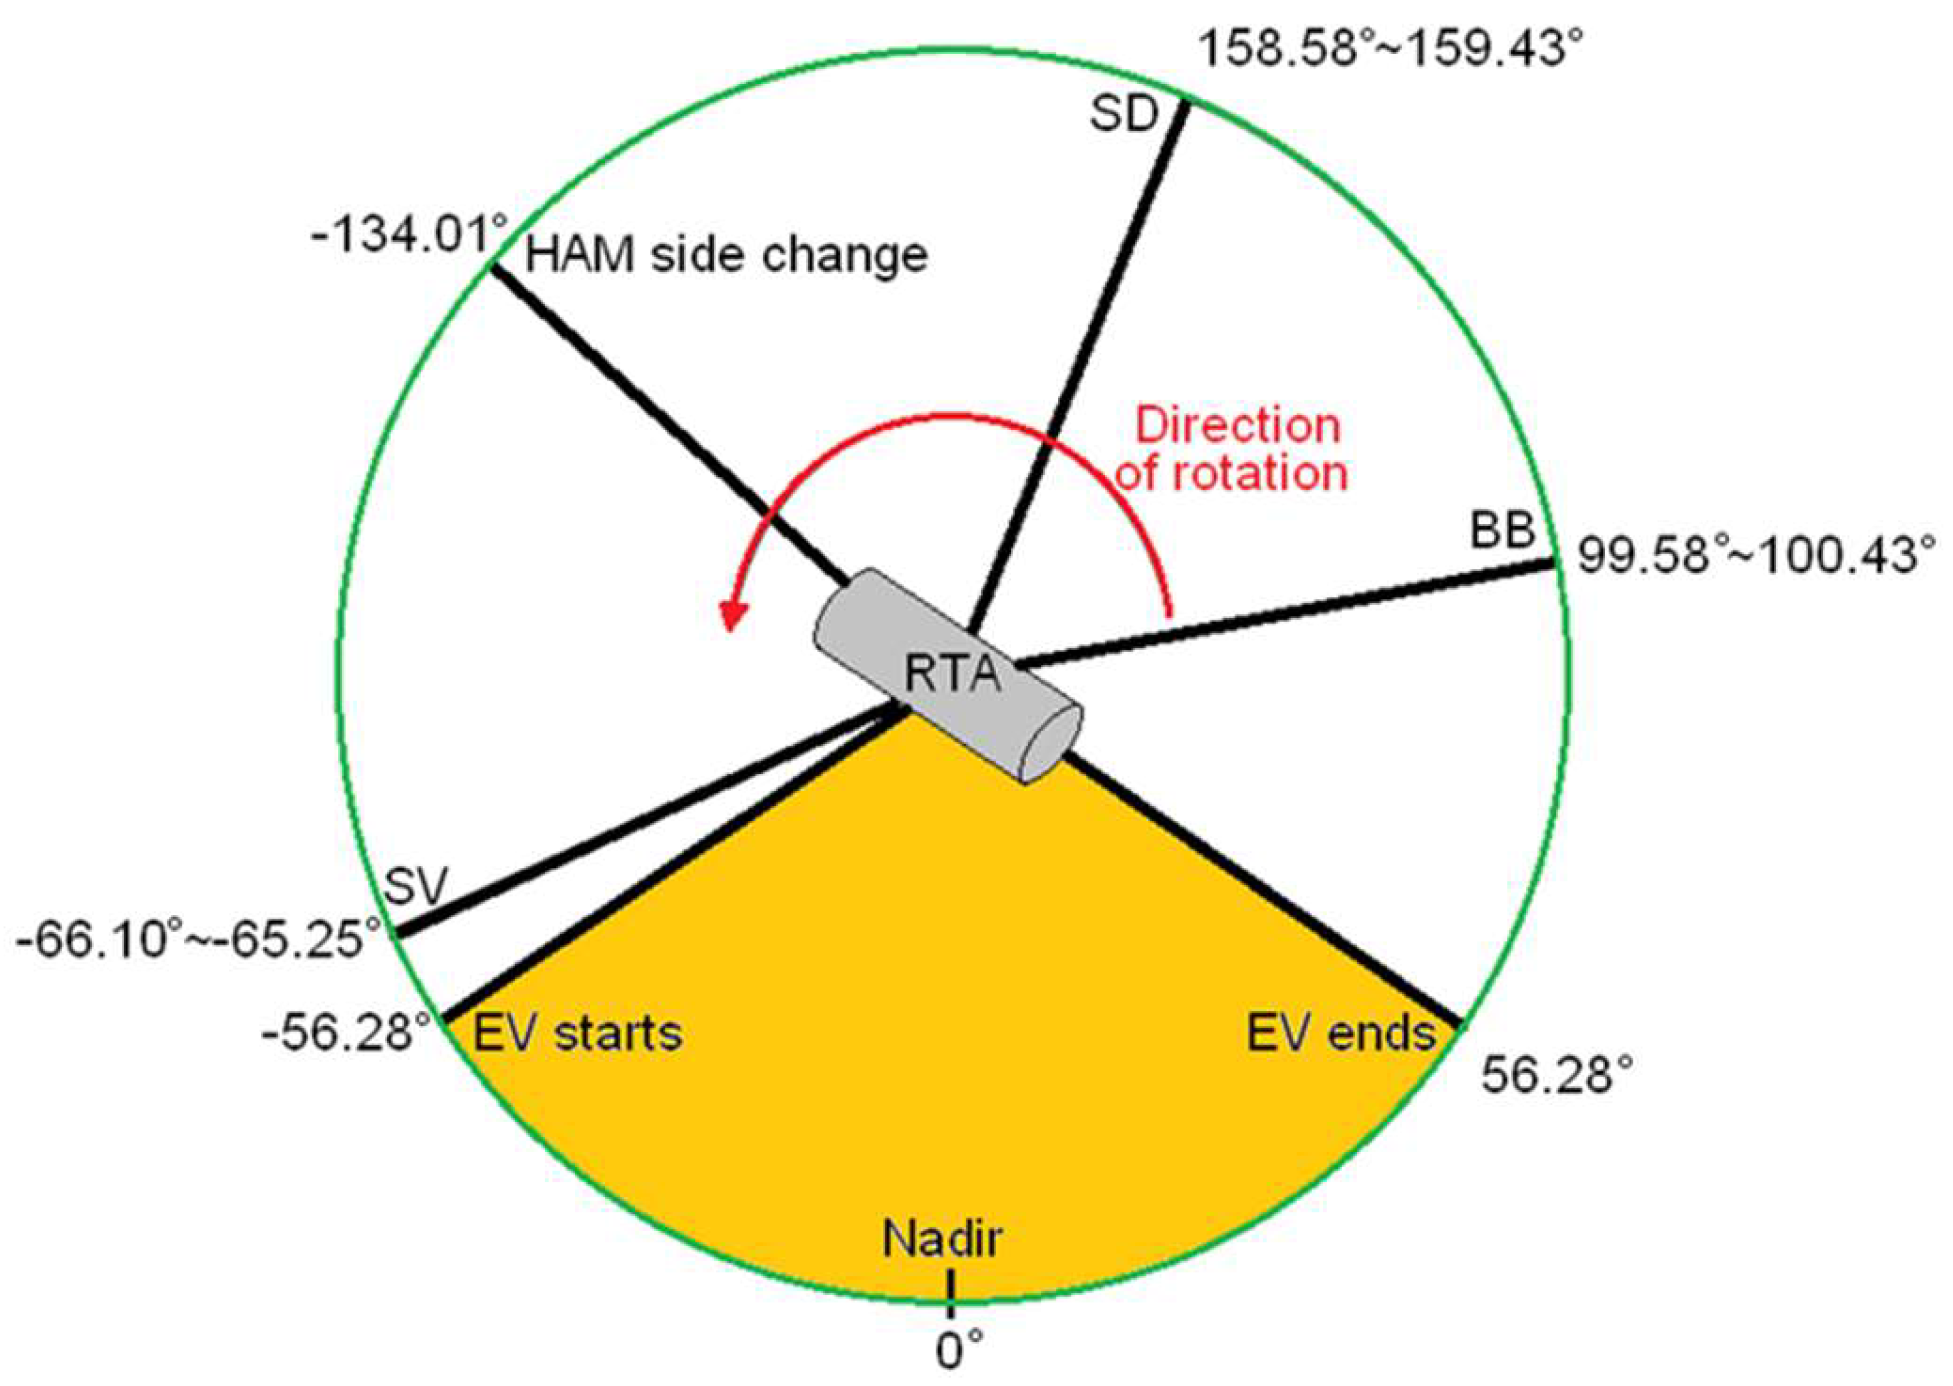
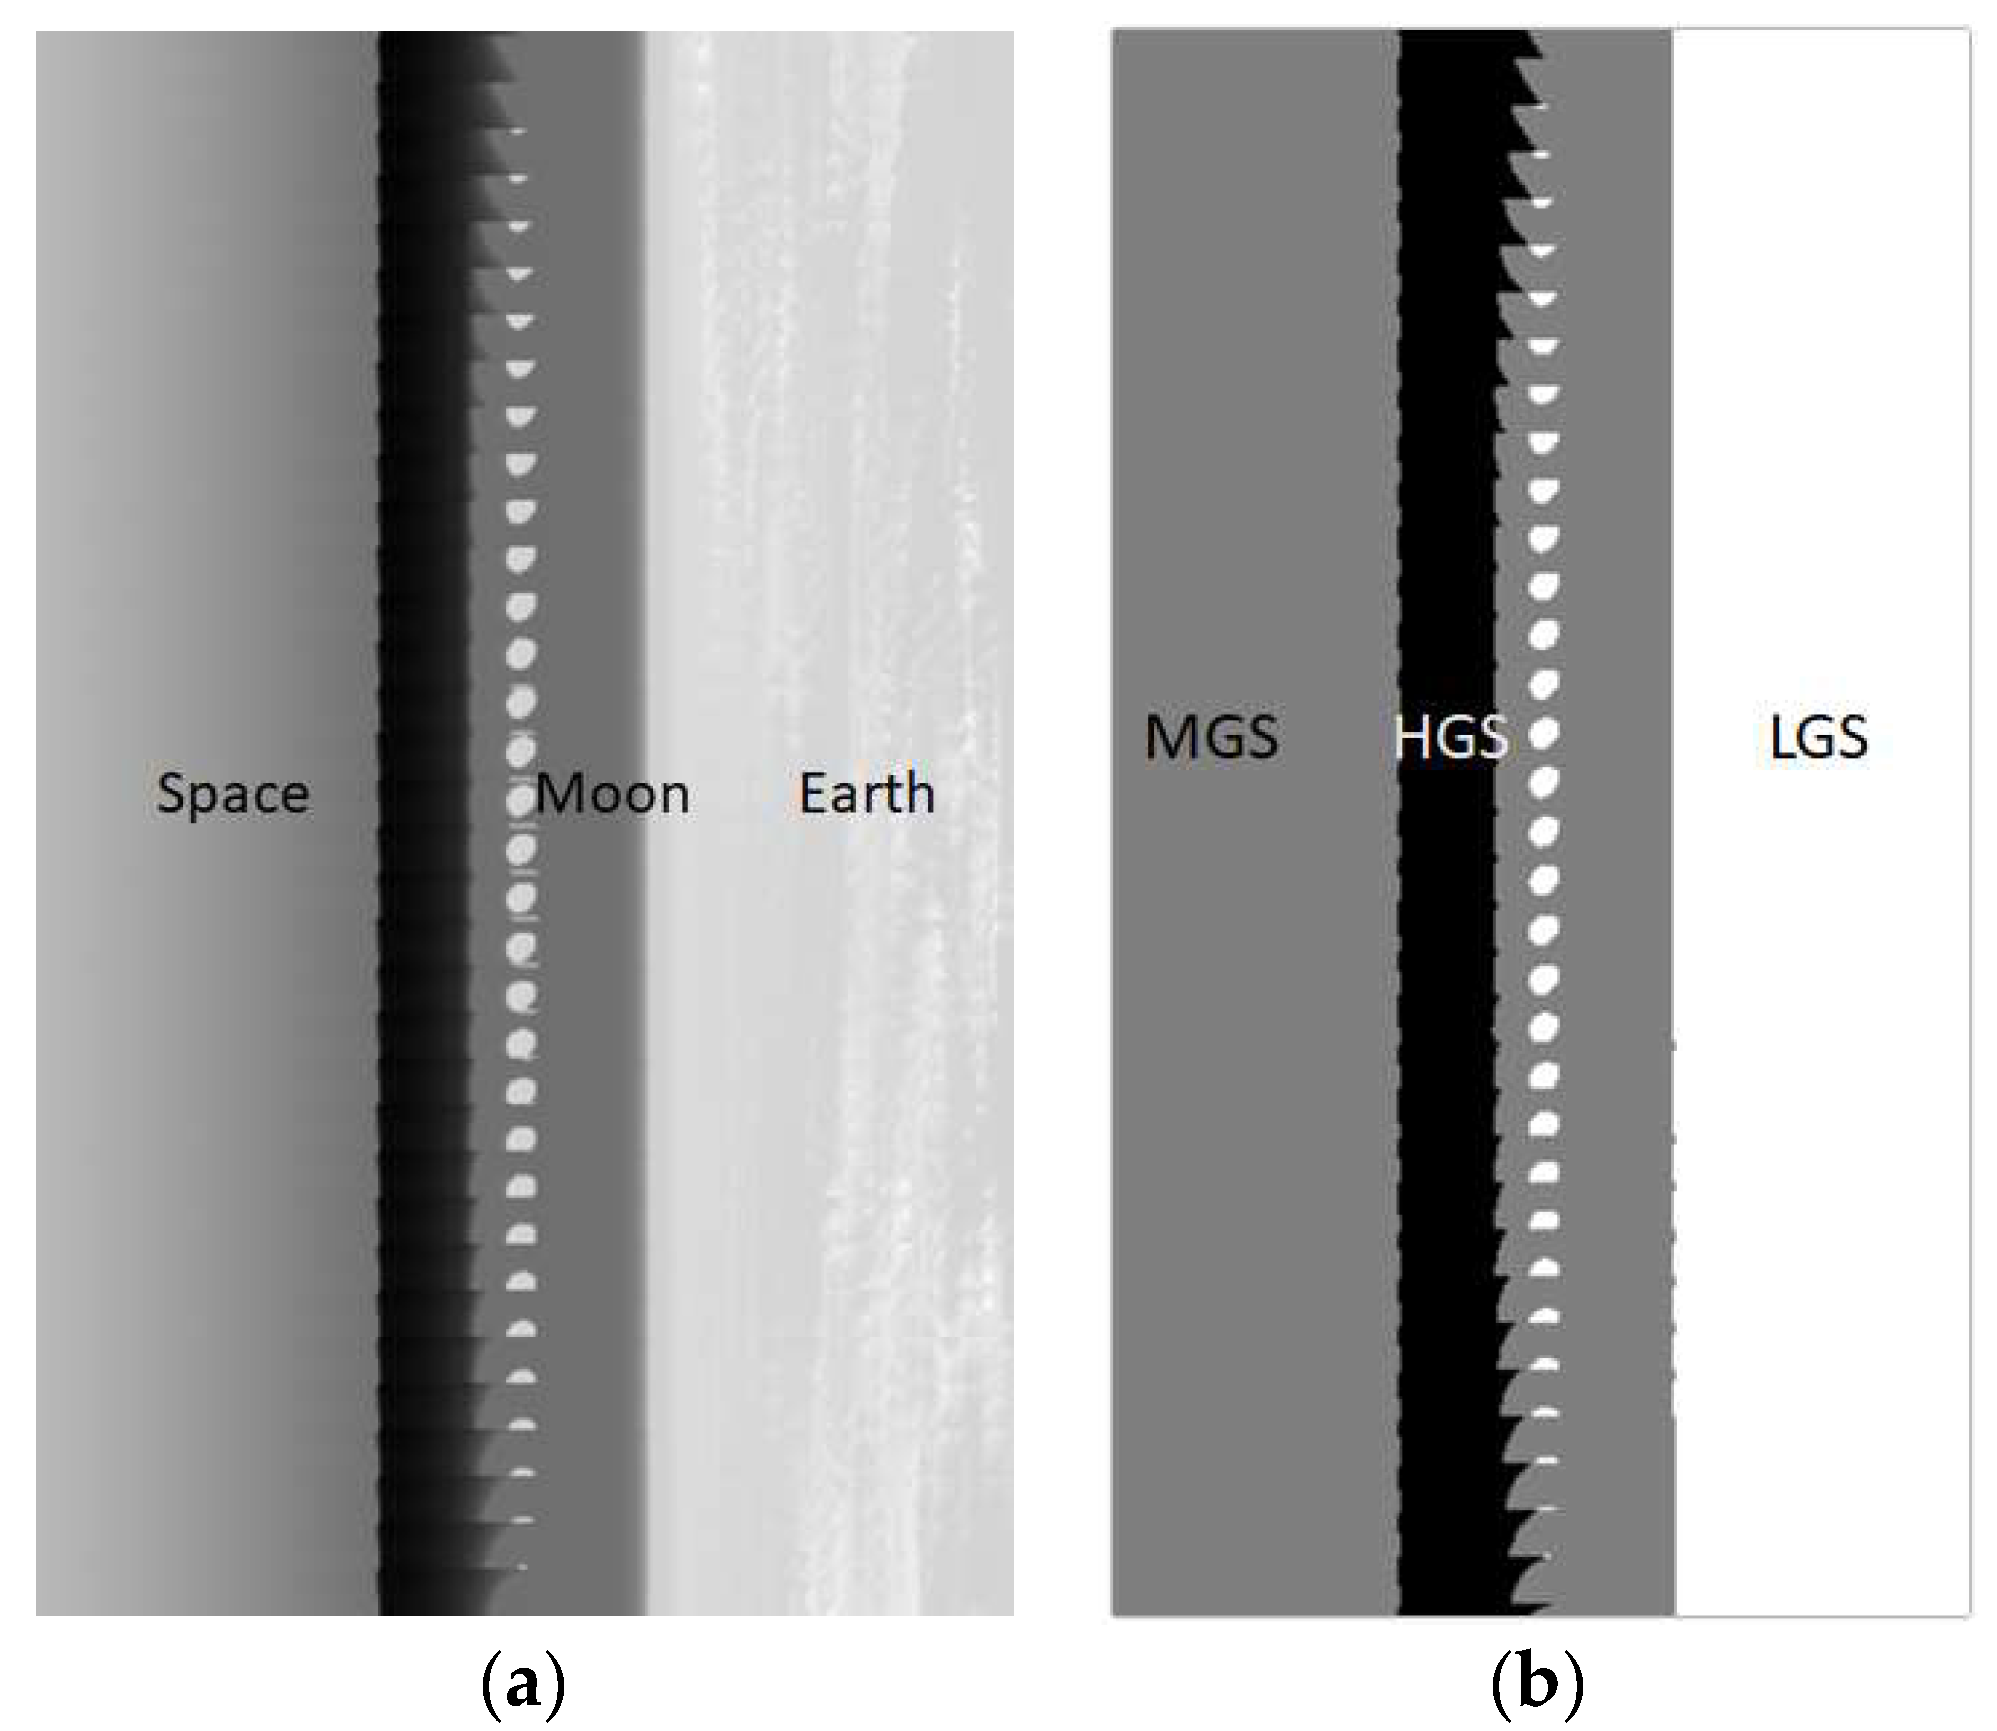
VIIRS can view the moon through the SV port with the RTA scan angles from −66.1 to −65.25 degrees just before the start of Earth View (EV) scans in the direction of rotation as shown in Figure 3. A lunar roll maneuver is predicted and performed at the time of scheduled lunar collection to place the moon at the center of SV port. During the roll maneuver, a sector rotation is also applied to put the SV port at the center of EV frame. The sector rotation is necessary because it expends the availability of dark space pixel frames to estimate the detector bias in each scan. The sector rotation also corrects the Band-to-Band Registrations (BBR) differences, which exist in the SV observations [21]. In the RSB and TEB bands, the gain state is forced to be in the high gain state for dual gain bands but DNB gain selection was not affected by this operational command. Figure 4a shows a raw Digital Number (DN) image of the scheduled lunar collection on 4 April 2020. The corresponding pixel based gain states are shown in Figure 4b. The DNB on-board processor selects LGS for the bright earth and moon pixels, MGS for around and left side of space pixels and HGS for the left side of the moon.
Since 2 April 2012, there are 64 scheduled lunar collections over the nine years of operation as of 5 May 2020. In one year cycle, there are months where the scheduled lunar observations are not possible from June to September (or October), because the moon goes below the Earth limb [22]. In this study, all the moon collections are used and derived the lunar calibration coefficients called lunar F-factors.
2.3. Lunar Radiance and Irradaince Calculation
For a scheduled lunar collection, the normal NOAA Science Data Record (SDR) granules does not provide any image data but the EV data are populated with a fill value during the lunar roll maneuver. To get the raw EV image like Figure 4a, a software tool called ADL (Algorithm Development Library) is used converting the Raw Data Record (RDR) to verified-RDR (vRDR) as an intermediate file before generating a normal SDR [16,23]. In the vRDR file, the DNB pixels include gain information and DN values are mixed in the 16 bits. The first three bits are assigned for gain state and the numbers in the three bits indicate different gain states. The gain number one for high gain, two for mid gain, and three for low gain pixels. The rest of 13 bits are assigned for the EV DN responses. Figure 4a shows raw DN image before the decoding of the gain and DN information segregation. Once the normal DN values are retrieved, the right detector bias values need to be found from a LUT and removed in each gain state. Because of the automatic gain selection process, there are all three gain states around the moon observations as shown in Figure 4b.
The detector bias values are read from the DN0 Look-Up-Table (LUT) to get the right bias values for each detector and aggregation zone one where the moon is located during the scheduled lunar collections. In addition to the gain estimation, the determination of the dark bias is one of the key steps, because any error in the bias estimation will propagate to the final radiance value through the DNB calibration equation. To determine the dark offset in the three different gain states, there have been monthly special acquisitions known as the VIIRS recommended operating procedures (VROPs) during a new moon dark night over the Pacific Ocean [6,24,25]. Especially for HGS, dark offset estimation is very sensitive to the stray light. An improved algorithm for determining the DNB HGS dark offset was proposed and improved HGS dark offset estimation by combining the DNB BB data and the VROP data sets [26]. Once the dark offset is correctly removed from EV DN in each pixel from the DN0 LUT as indicated by Equation (2), a bias removed DN (indicated in the lower case letters) can be used for further radiance calculation.
In Equation (2), h represents the ham side, g is gain in each pixel, d is detector number, and fr is frame number of the pixel. For the LGS pixels, the EV radiance is simply multiplied by LGS gain and divided by the RVS as shown in Equation (3).
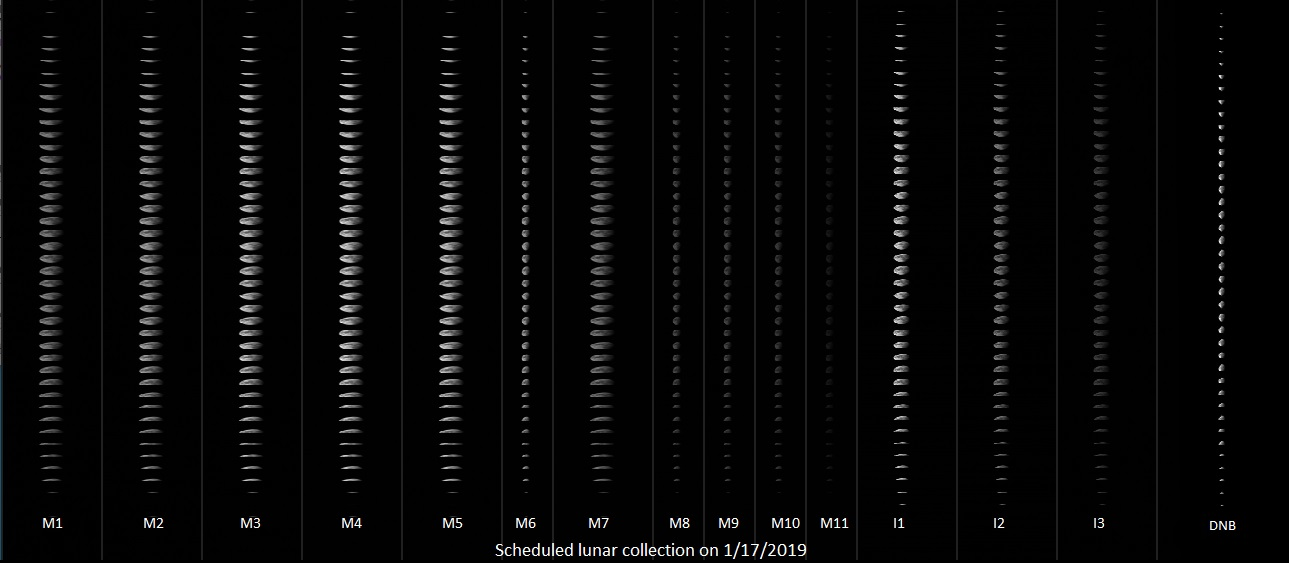
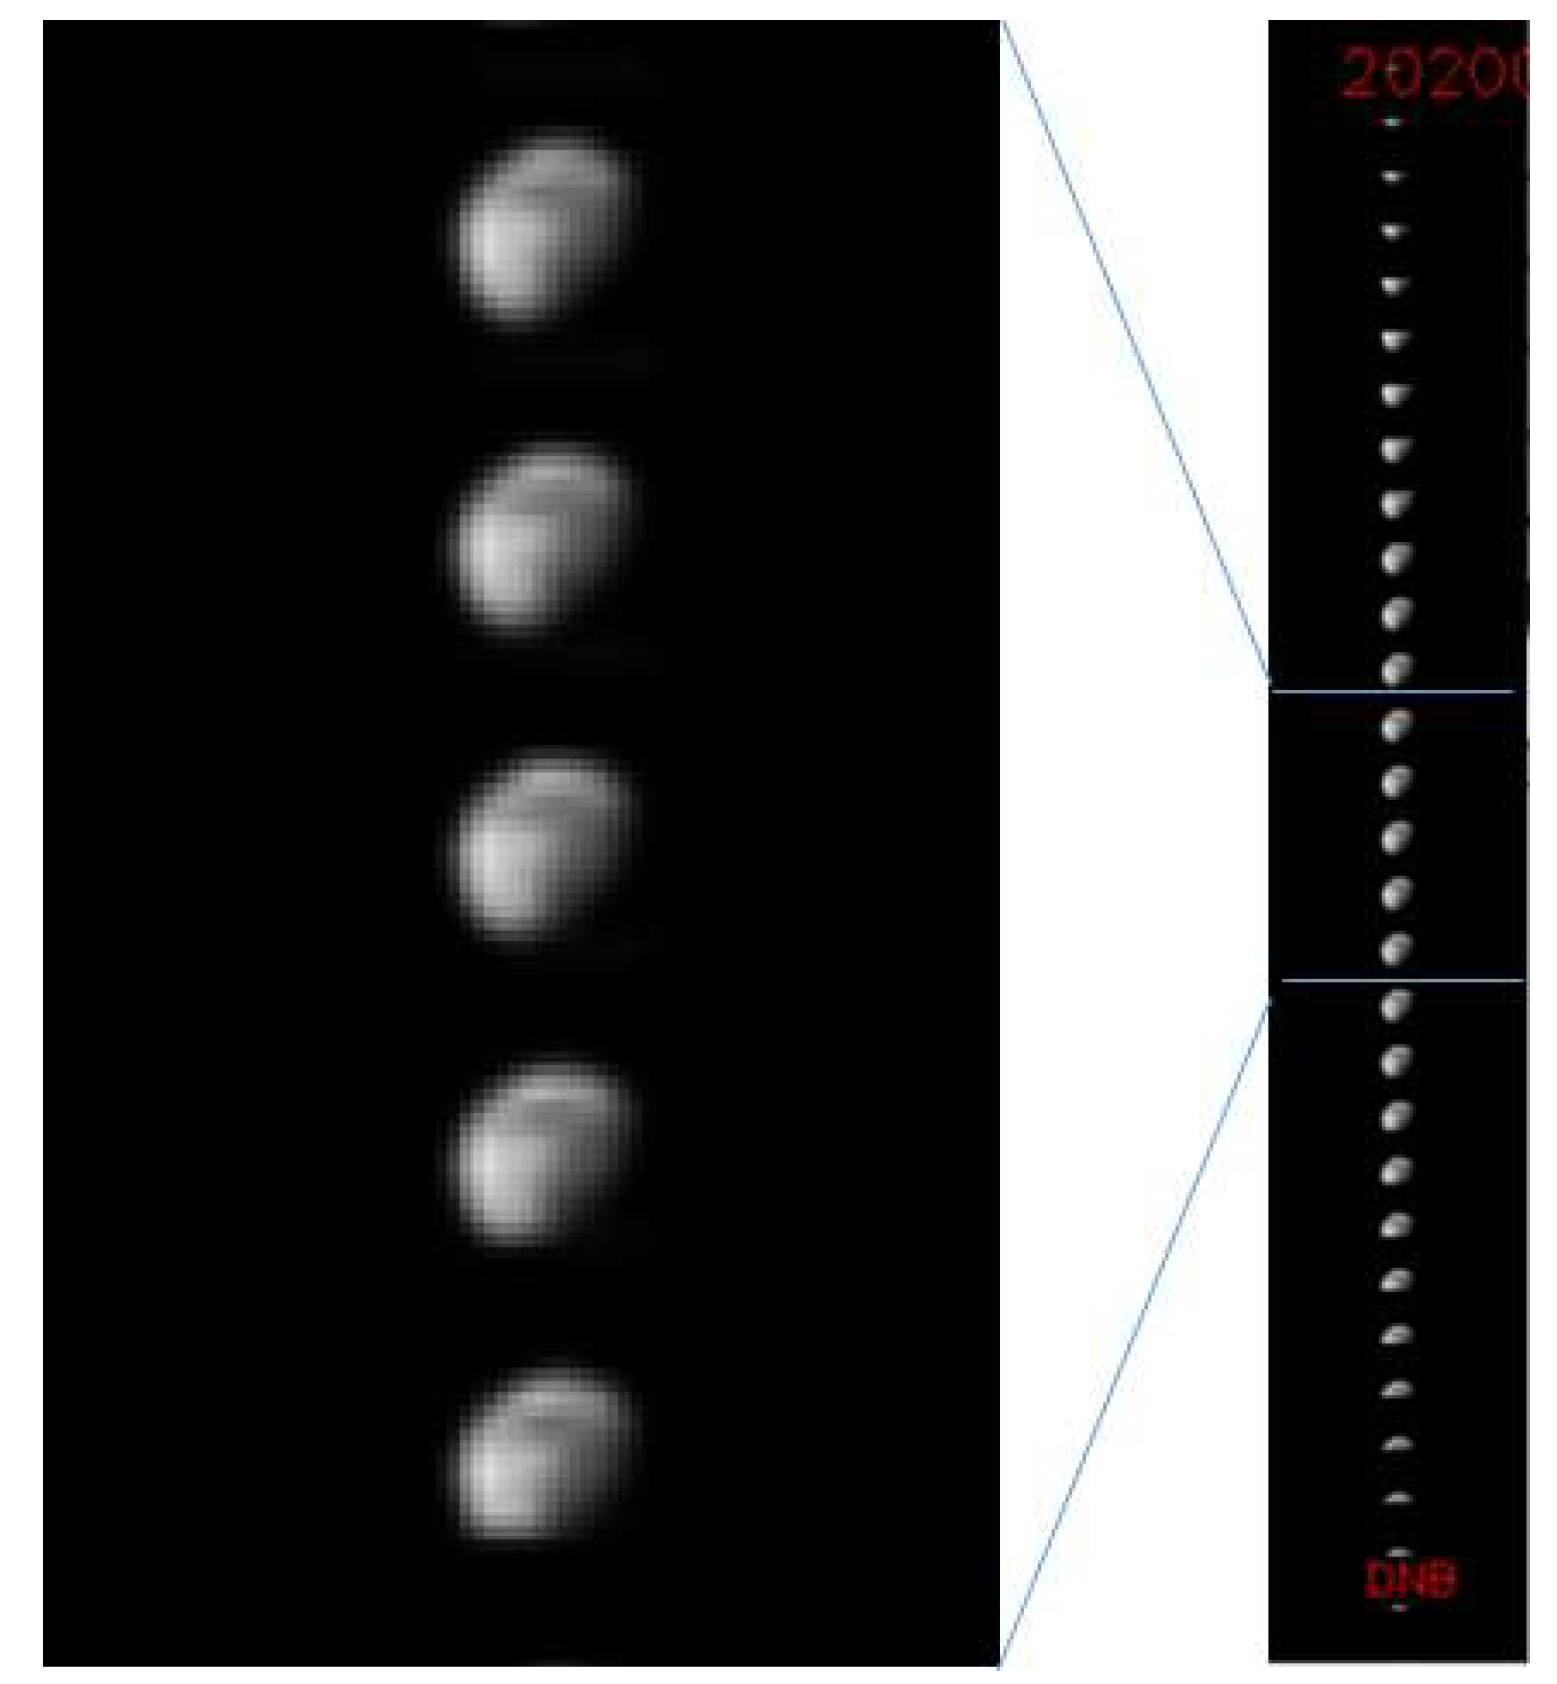
In Equation (3), the G is LGS gain, which is determined by Equation (1), Ag is aggregation zone determined by the frame number in the DNB EV image and RVSEV is EV dependent RVS specified in each aggregation zone. Actually, the RVS at SV is used instead of nadir (aggregation zone 1) in Equation (3), since the scheduled lunar data is sector rotated to locate the SV frame to be at the center of EV fame. For LGS state R is one, whereas the MGS or HGS EV pixel radiance is calculated by applying the correct ratio for the gain state. The ratio LUT indicated by R in Equation (3) is derived from the SD observations in each aggregation zone which transfers gain from LGS to MGS or LGS to HGS according to the gain state information in each pixel. These two ratios are quite stable over the lifetime of S-NPP VIIRS operation according to the NOAA Integrated Calibration Validation System (ICVS) Webpage at http://www.star.nesdis.noaa.gov/icvs/status_NPP_VIIRS.php (accessed on 11 March 2021). Figure 5 shows scheduled lunar collection near the center of the EV frame at aggregation zone 1 after the detector offset and gain corrections. Compared to the raw DN image in Figure 4a, the lunar radiance image in Figure 5 provides the true shape and intensity of the moon in the DNB.
Since GIRO provides irradiance, the observed lunar radiance needs to be converted to irradiance value to match the units. Once lunar radiance values are ready, the observed lunar irradiance can be calculated by using satellite-moon distance and lunar phase angle information as shown in Equation (4). The LAvg in Equation (5) is the mean radiance of the Moon pixels after the summation over all the detectors and frames over the number of effective lunar pixels (N).
In Equation (4), Rmoon is radius of moon, DSat_Moon is distance between satellite and moon, θ is phase angle of the moon. All the moon pixels are accumulated and divided by the number of pixels in Equation (5). The FWHMRSR is the time-dependent Full-Width at Half-Maximum (FWHM) of the RSR at the time of scheduled lunar observation. The current DNB radiance unit is per centimeter square Steradian. To match up with the lunar irradiance model unit of per meter square Steradian micrometer, the FWHMRSR needs to be divided in Equation (4). Since the RSR changes over time because of the RTA degradation, the RSR FWHM also needs to be accurately estimated for the observed irradiance calculation. The number of effective pixels is determined by a threshold of the 6 percent of maximum height of the lunar radiance. A threshold based method is selected to find the number of effective pixels (N), because (1) there are some bright and dark spots on the moon surface as shown in Figure 5; (2) there are some topographic features near the termination line of the shadow (not near the circular edge part of the moon); and (3) GIRO irradiance takes into account on these features.
2.4. Lunar Irradiance from the GIRO and Lunar F-Factor
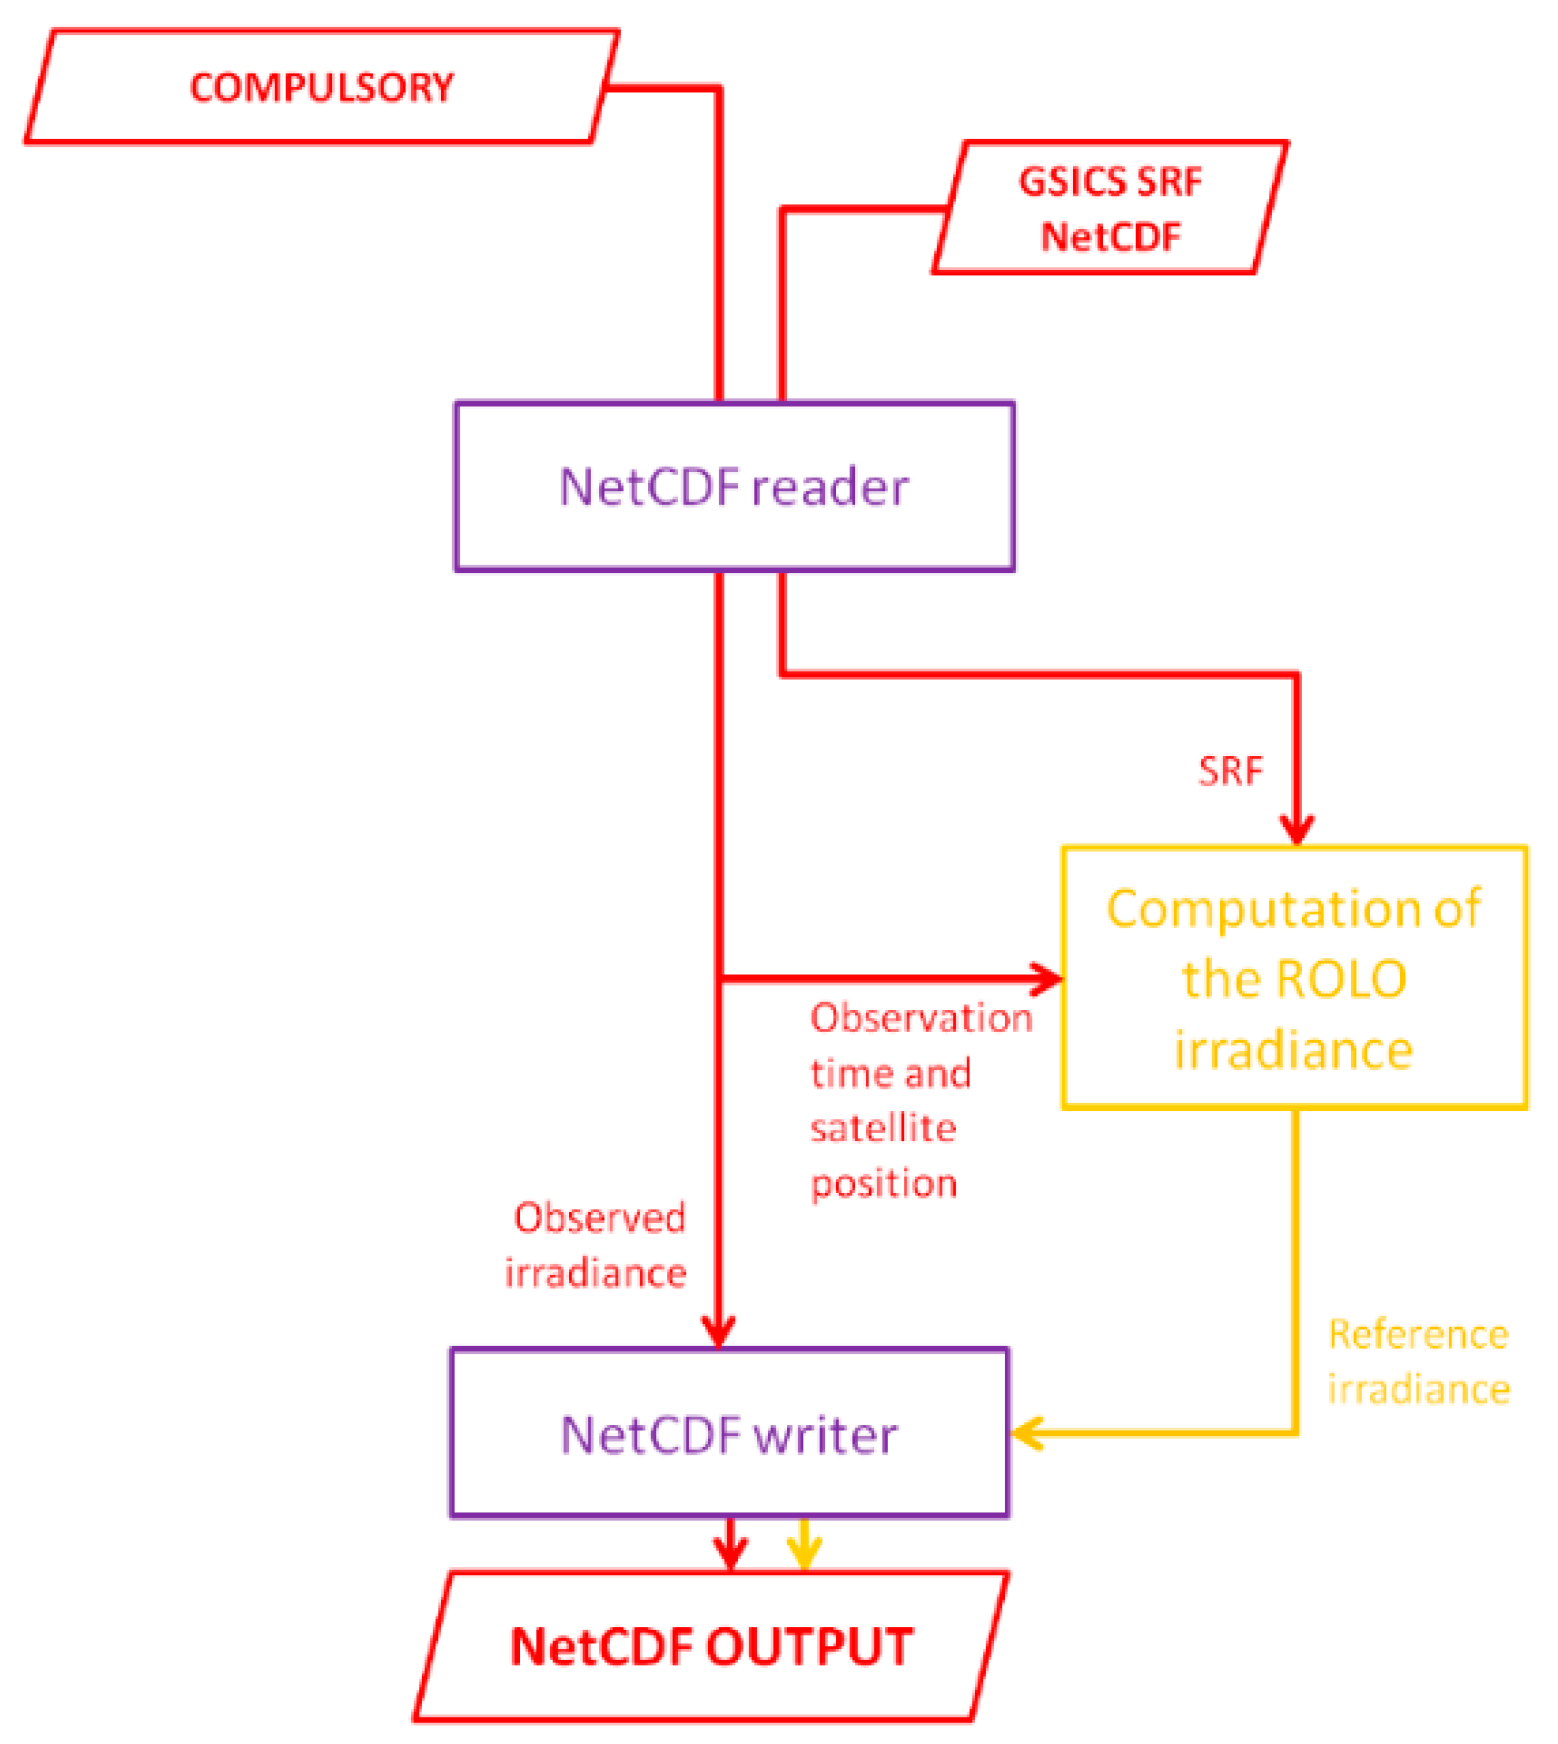
The USGS ROLO model provides lunar irradiance over the VIS/NIR spectrum range accounting geometric dependences to the lunar phase angle which is the angle between Moon–Sun and Moon–Earth vectors, Earth–Sun distance, Moon–Earth distance and libration angle [27,28,29,30]. Using more than 1000 ground based telescope collections over 10 years, ROLO can provide estimated lunar irradiance at the time of satellite collection covering a spectral range from 350 nm to 2450 nm. The atmospheric correction and the radiometric reference of ROLO was based on the simultaneous measurements of Vega which caused absolute scale biases. However with the absolute scale problems, the ROLO model has been routinely used for relative radiometric calibrations of the Terra and Aqua MODIS and SeaWiFS [31,32]. Because of the frequent use of the moon for on-orbit calibrations and inter-calibrations, an international collaboration group called European Organization for the Exploitation of Meteorological Satellites (EUMETSAT) implemented the ROLO model as a standard lunar calibration tool for the GSICS community in collaborations with USGS, NASA, Centre National d’Etudes Spatiales (CNES) and Japan Aerospace Exploration Agency (JAXA). The GIRO provides unified lunar irradiance value under the framework of GSICS and the required input and output formats are well documented in the GSICS Lunar Calibration website (http://gsics.atmos.umd.edu/bin/view/Development/LunarWorkArea accessed on 12 March 2021). For current lunar calibration, we used the “compulsory” option, which requires satellite position, observation time, and band RSR information to the GIRO model. In the output NetCDF file, the model provides the lunar irradiance over the provided sensor RSR at the specific satellite position and collection time. The unit of output lunar irradiance is in Watts per meter square per micrometer (Wm−2µm−1). The diagram of GIRO compulsory option is shown in Figure 6.
As discussed in Section 2.1, DNB is a spectrally broad band and the on-orbit VIIRS RSRs have been continuously changed due to the RTA mirror darkening. As a result, the RSR input definition file also needs to be changed at the time of observation for each scheduled lunar collection. This is a unique situation for S-NPP VIIRS especially for DNB calibration as a spectrally broad band. To get the accurate GIRO lunar irradiances, new sets of input files with observation time, satellite position and the DNB RSR at the time of lunar collection are generated and processed.
Once the lunar irradiance from the GIRO model and the observed lunar irradiance values are ready, the lunar F-factor can be calculated by the ratio between the irradiance values as shown in Equation (6).
3. Results
3.1. The S-NPP VIIRS DNB RSR
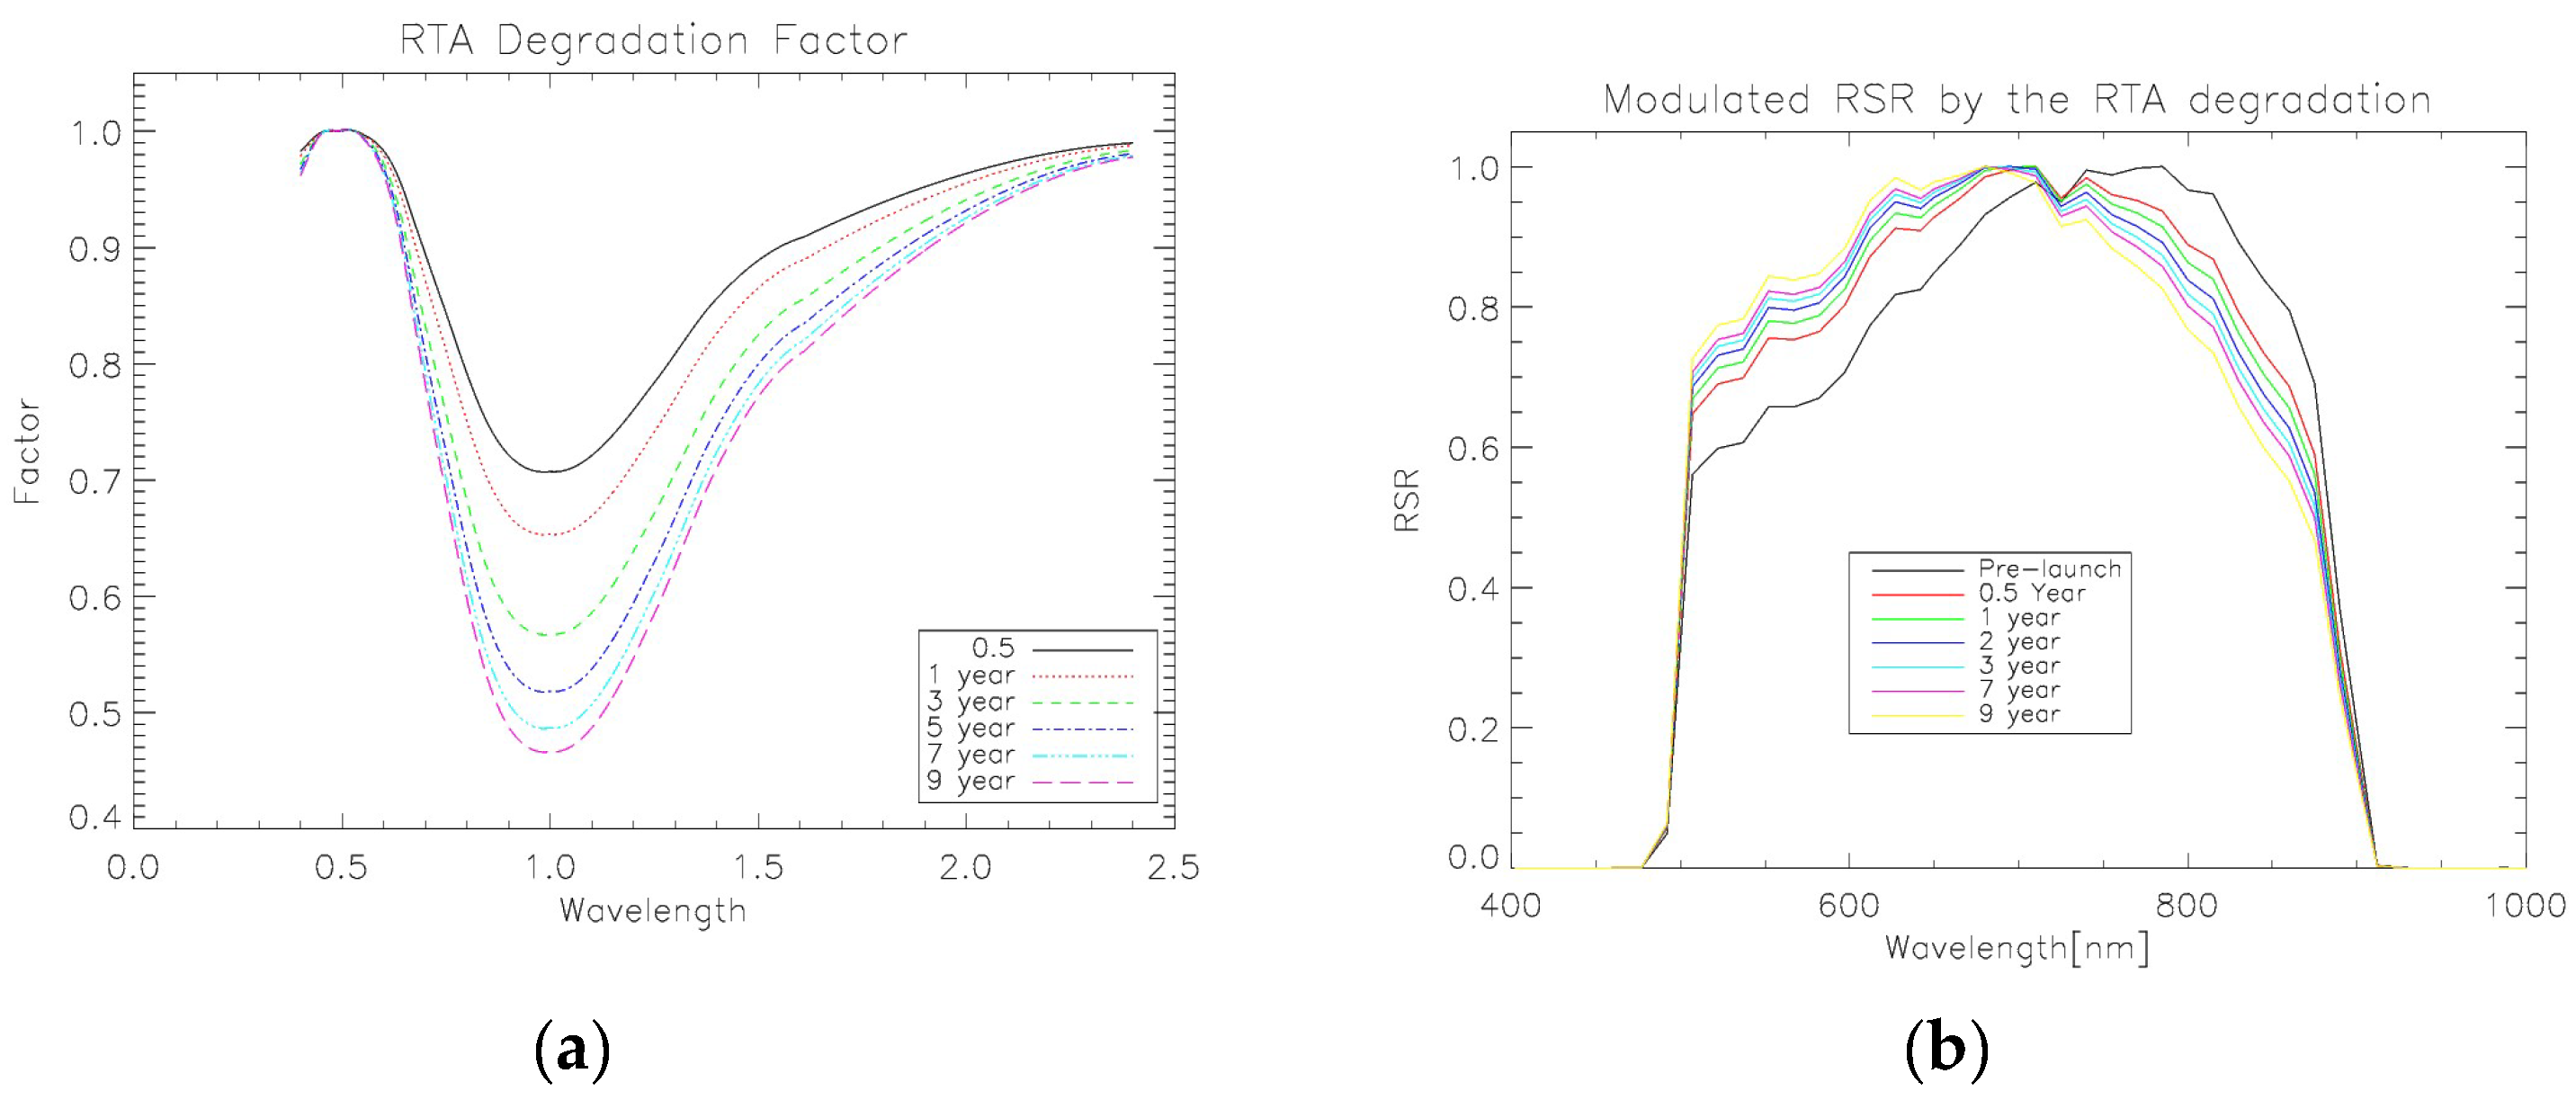
As mentioned in Section 2.1, the S-NPP VIIRS have experienced spectral band response changes over time due to the Tungsten oxides film deposition on the RTA mirrors. The wavelength and time dependent RTA degradation effects and the modulated RSRs are shown in Figure 7a. For accurate DNB calibration, time-dependent RSR changes need to be tracked and applied which will affect the total radiance at each spectral wavelength as shown in Figure 7b. The DNB RSR is greatly affected by the RTA degradation, especially below 1 µm range and the yearly RSRs showed the differences after 0.5, 1, 2, 3, and 7 years of operation. The RTA degradation was greatly affected in early lifetime and it gradually slowed down in the later part of operations. We used NASA team’s RSR degradation model by Ning Lei [33] in this work. According to the DNB calibration in Equations (1) and (3), the modulated RSR information should be used in the observed lunar radiance and irradiance estimations.
3.2. VIIRS Observed Lunar Radiance
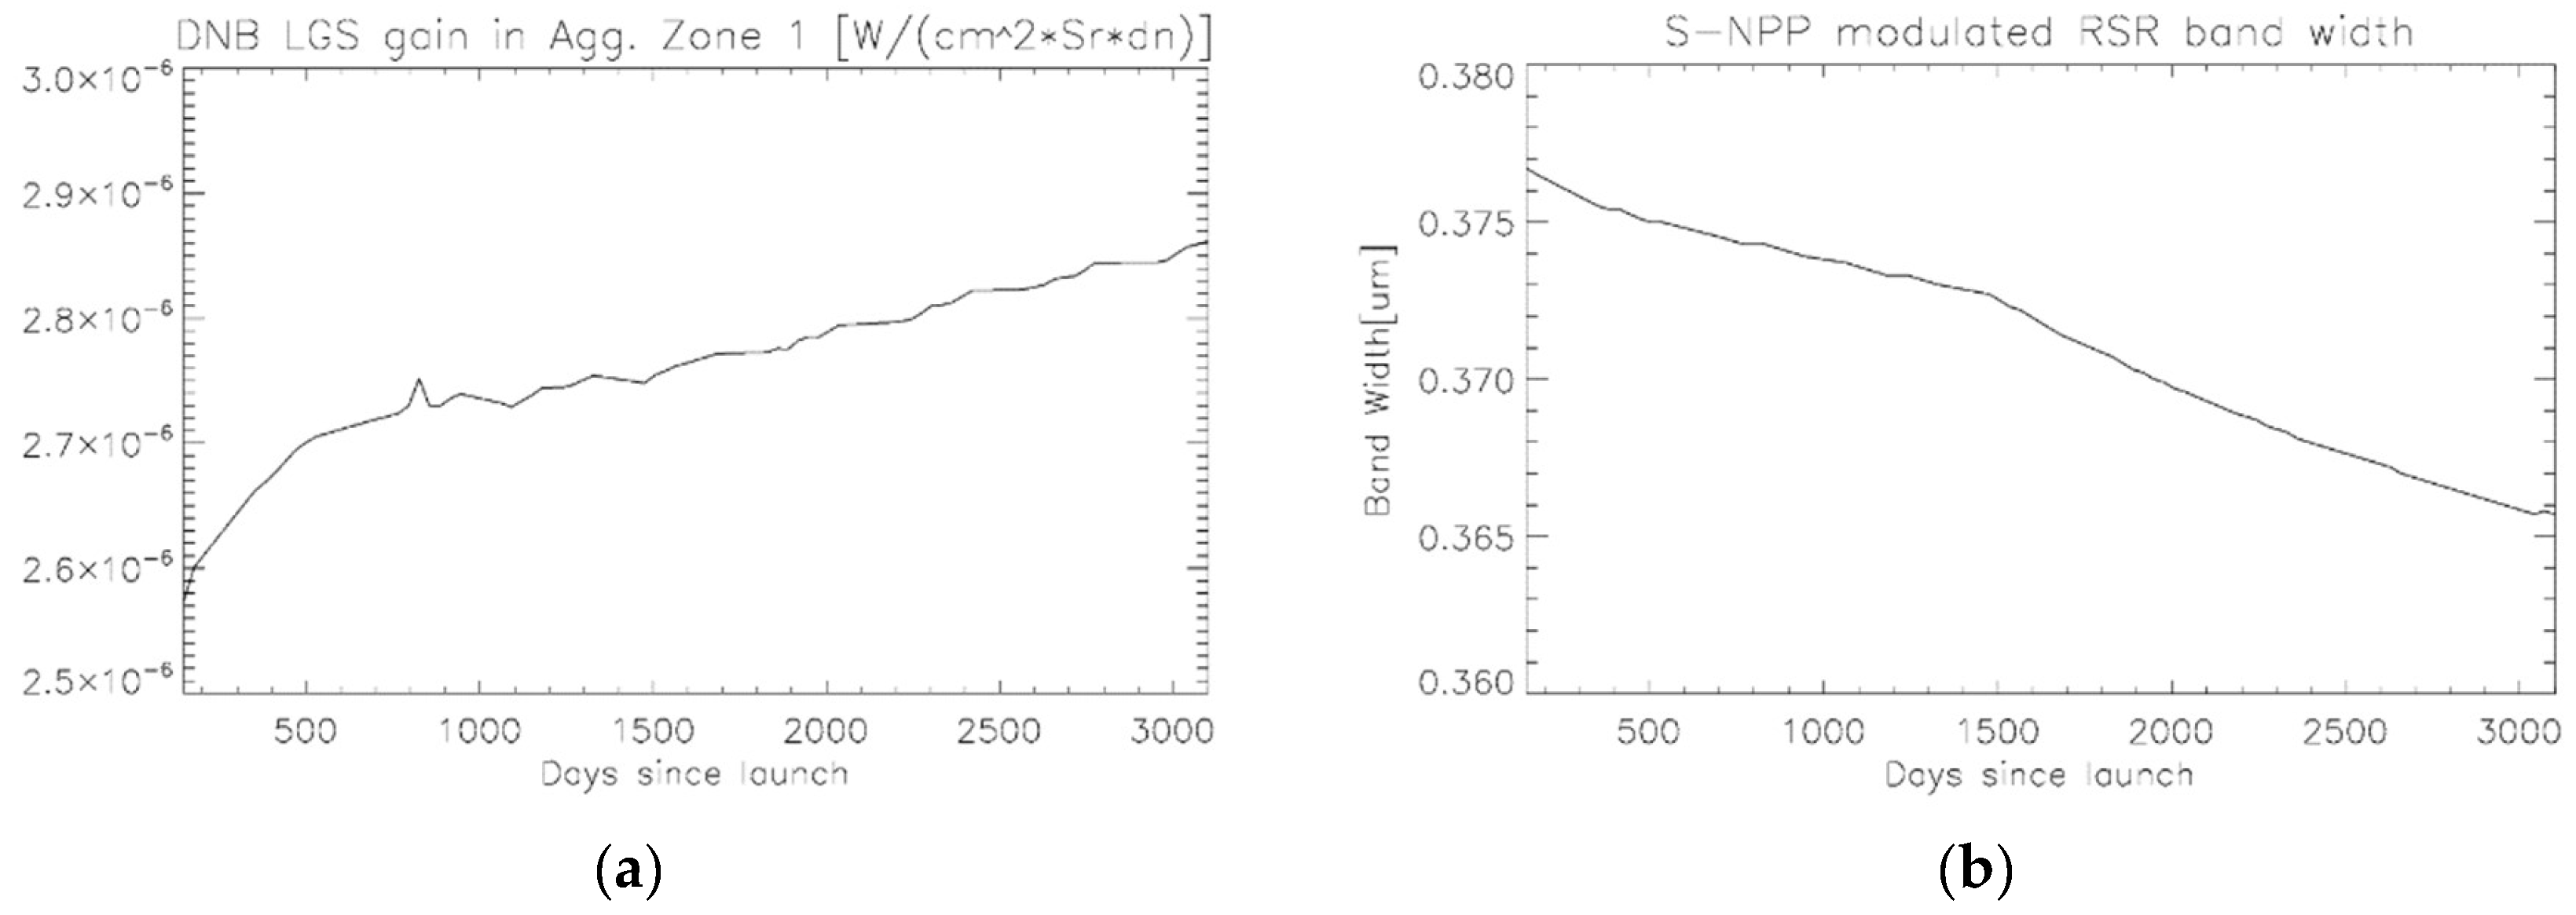
In each scheduled lunar collection, the center aggregation zone image is properly trimmed around the moon and the raw pixels are converted to pixel DN and gain information. The lifetime operational LGS gains that are calculated from the SD observations are shown in Figure 8a. In each gain state of the pixel, the radiance values are found after removing the corresponding bias value. Once the radiance of all the lunar pixels are calculated the irradiance can be derived by applying Equation (4). When the satellite position and observation time are given to the GIRO model, it provides the phase angle of the moon and the distance between satellite and moon for the lunar irradiance calculation in Equation (4). Another input parameter called FWHM is shown in Figure 8b from the RTA simulation and provided to Equation (4) using linear interpolation at the lunar collection time.
The FWHM of the modulated RSR has been reduced over the lifetime. The RTA darkening did not affect the shape of the RSR near the left side lobe near 500 nm in Figure 7a. However, on the right side of RSR around 900 nm, there was significant RTA darkening, gradually reducing the response over time as shown in Figure 7b. As a result of the RSR degradation on the right side of the RSR, the FWHM values are also reduced as shown in Figure 8b.
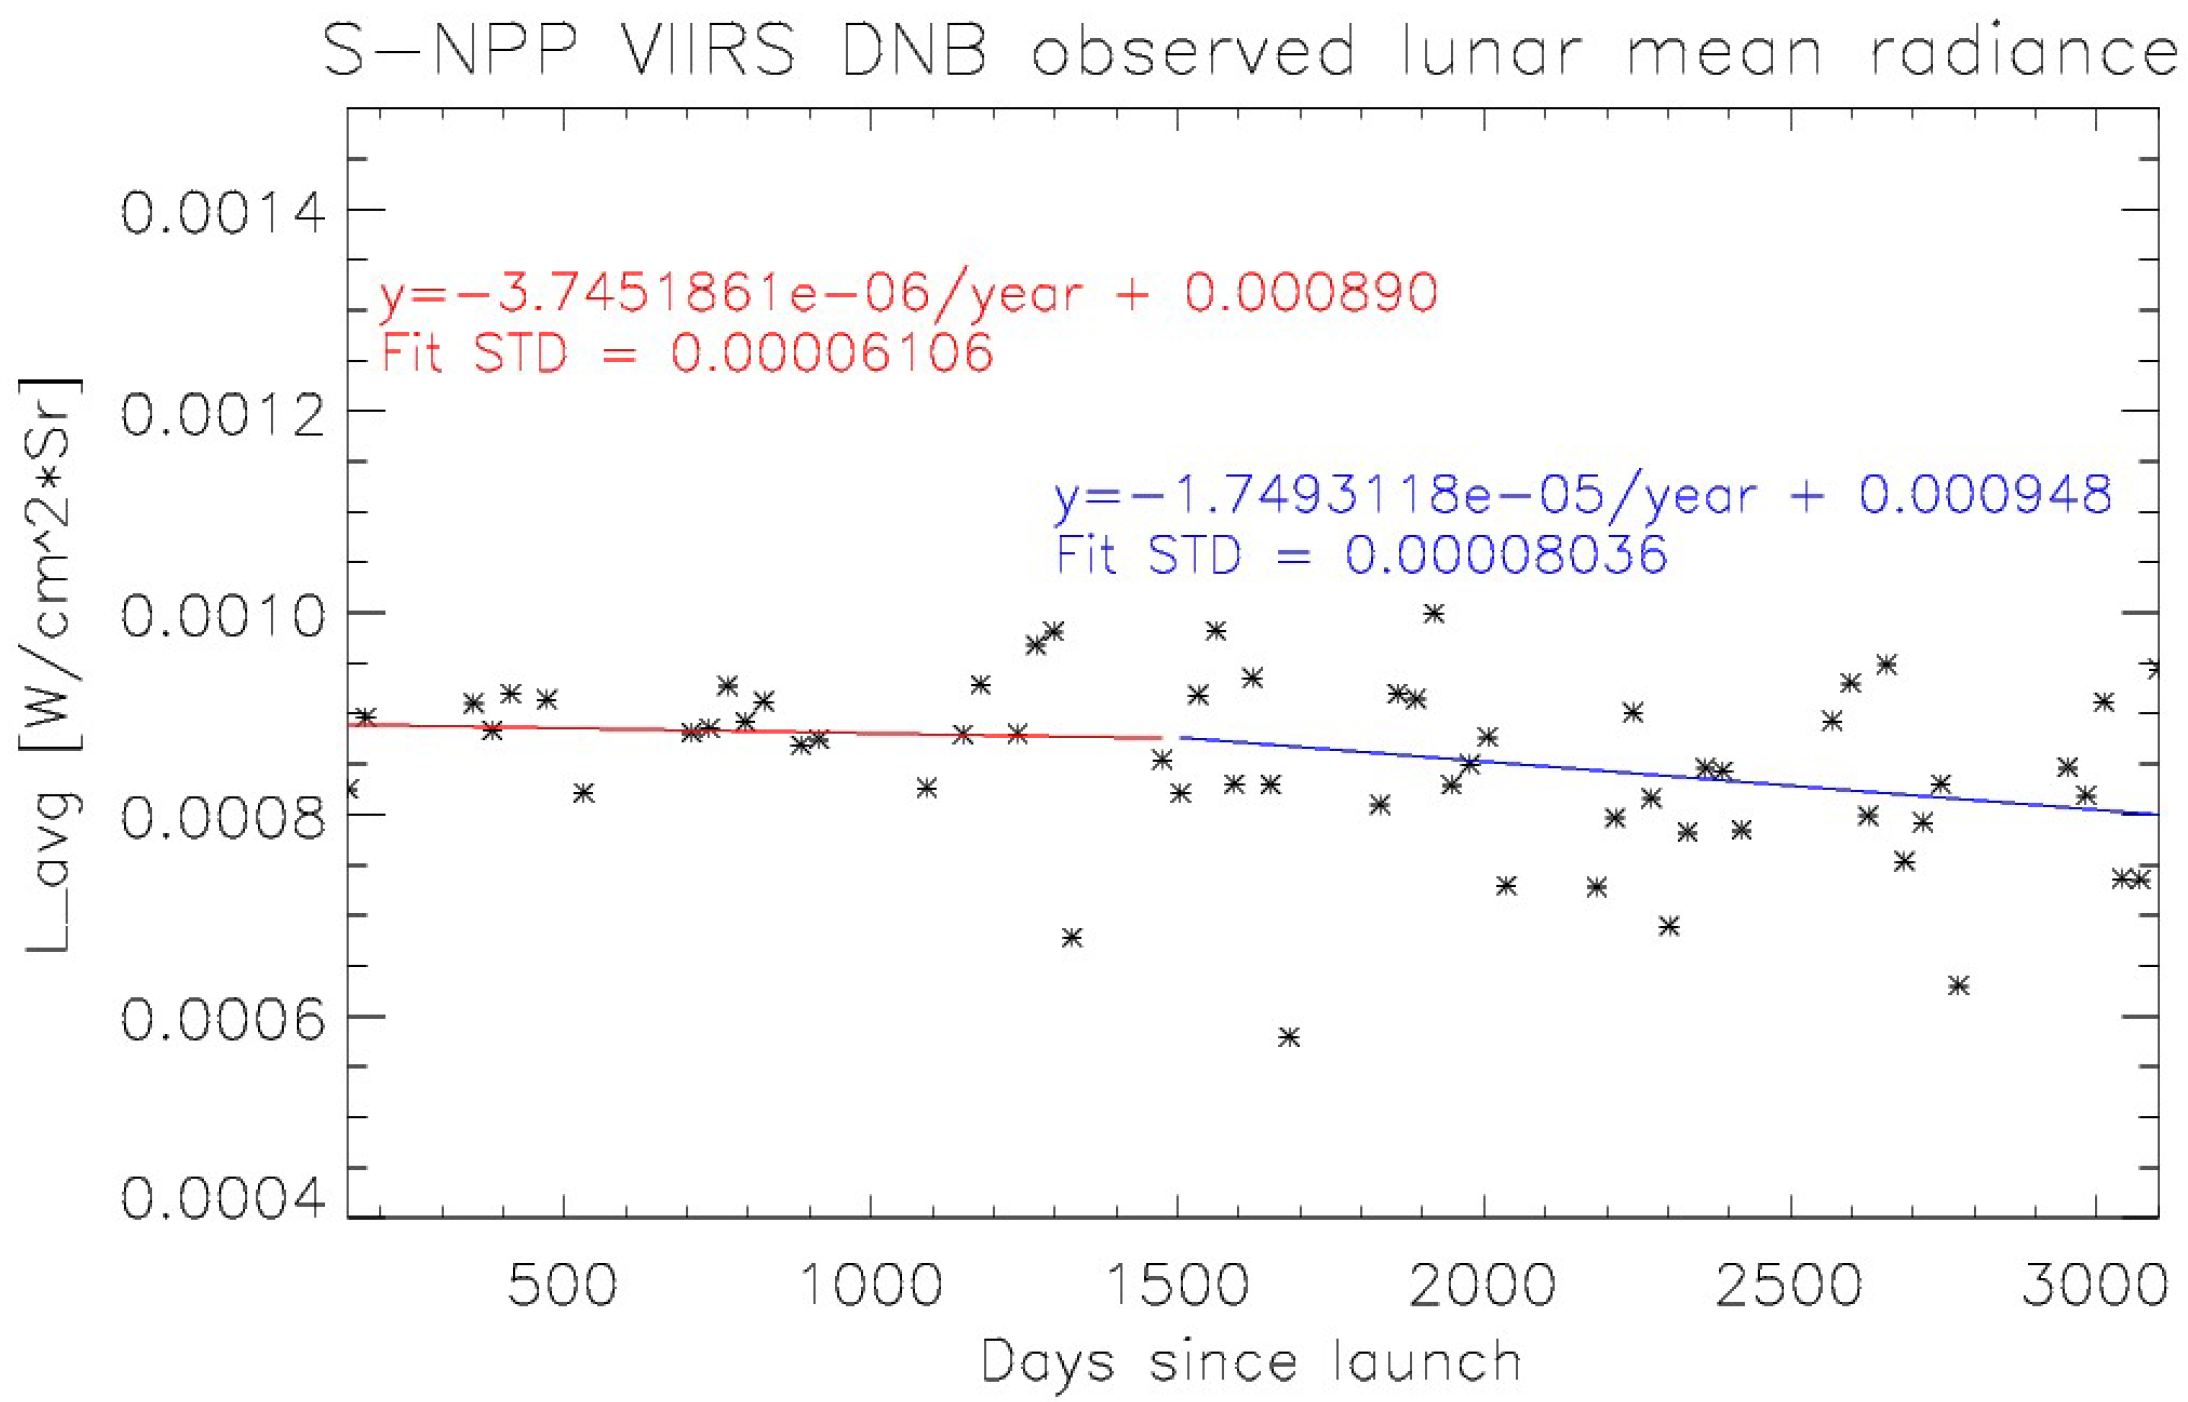
In each pixel of the moon, the right detector bias value is found from the DN0 LUT. If the pixel is HGS or MGS, the gain ratio of the detector is chosen from the gain ratio LUTs. The corresponding LGS gain is interpolated from the LGS gain LUTs as shown in Figure 8a. The mean lunar radiance is measured and shown in Figure 9.
The mean radiance trend is quite noisy around 0.009 Watts per centimeter square Steradian with annual oscillations over the 9 years of S-NPP operation. The mean radiance value seems to degrade to 0.008 starting from 1500 days in Figure 9. Independent linear fits are applied before and after the 1500 Days Since Launch (DSL) and a steeper negative slope is observed in the latter part of VIIRS mission compared to the initial period.
3.3. VIIRS Observed Lunar Irradiance and Lunar F-Factor
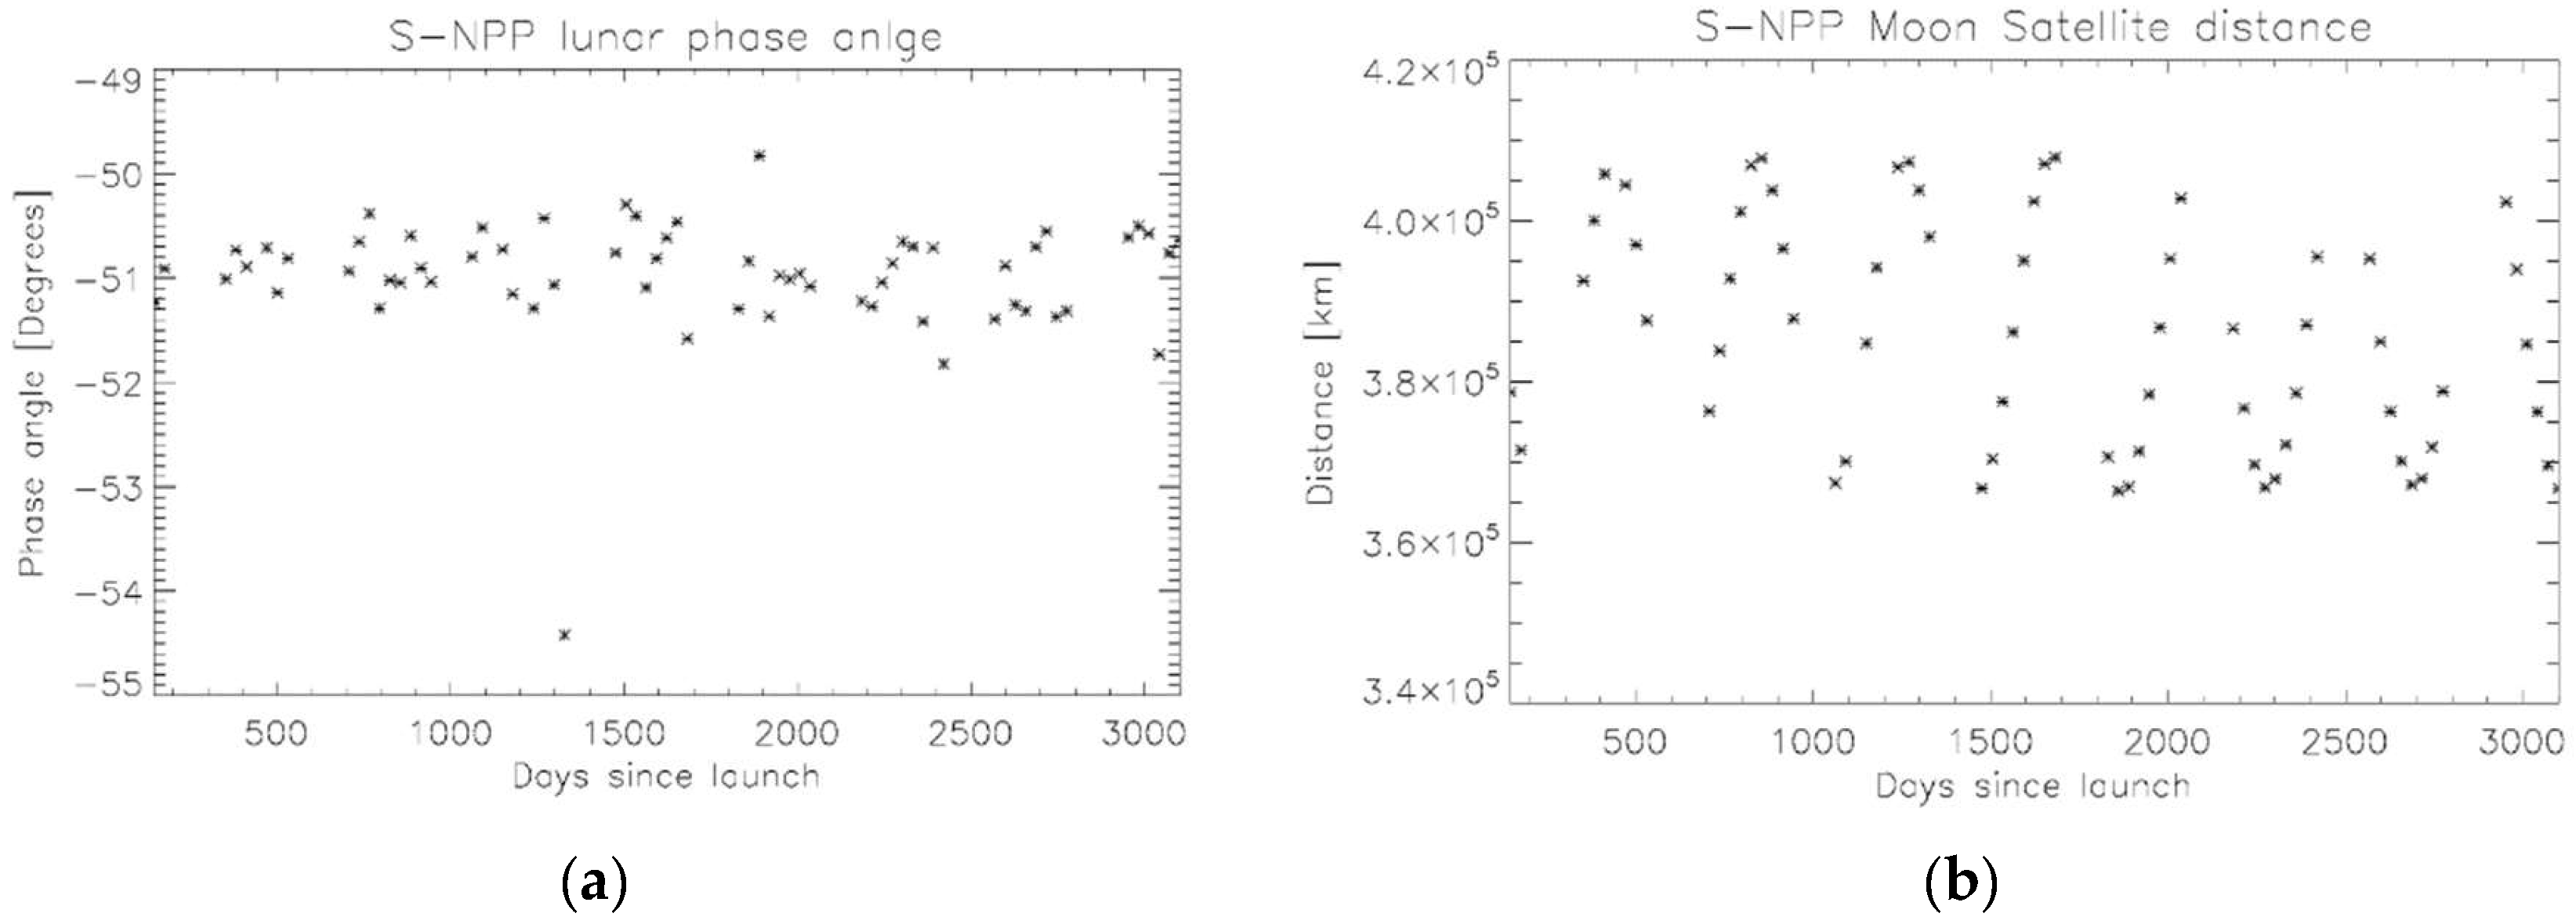
These radiance values are converted irradiance using phase angle, distance between moon and satellite, and FWHM. Figure 10a,b show the phase angle and the distance between moon and satellite. The lunar phase angle has been maintained around −51 degrees to mitigate additional uncertainty from the lunar model by keeping it at a stable level. Near the months when scheduled lunar observations are out of range, there are lunar roll maneuver free collections because of the constraints of the positive satellite roll angle. With the no roll maneuver collections, the location of the moon can be closer to the earth limb than normal collections as shown in Figure 4, which also increases uncertainties of lunar calibration.
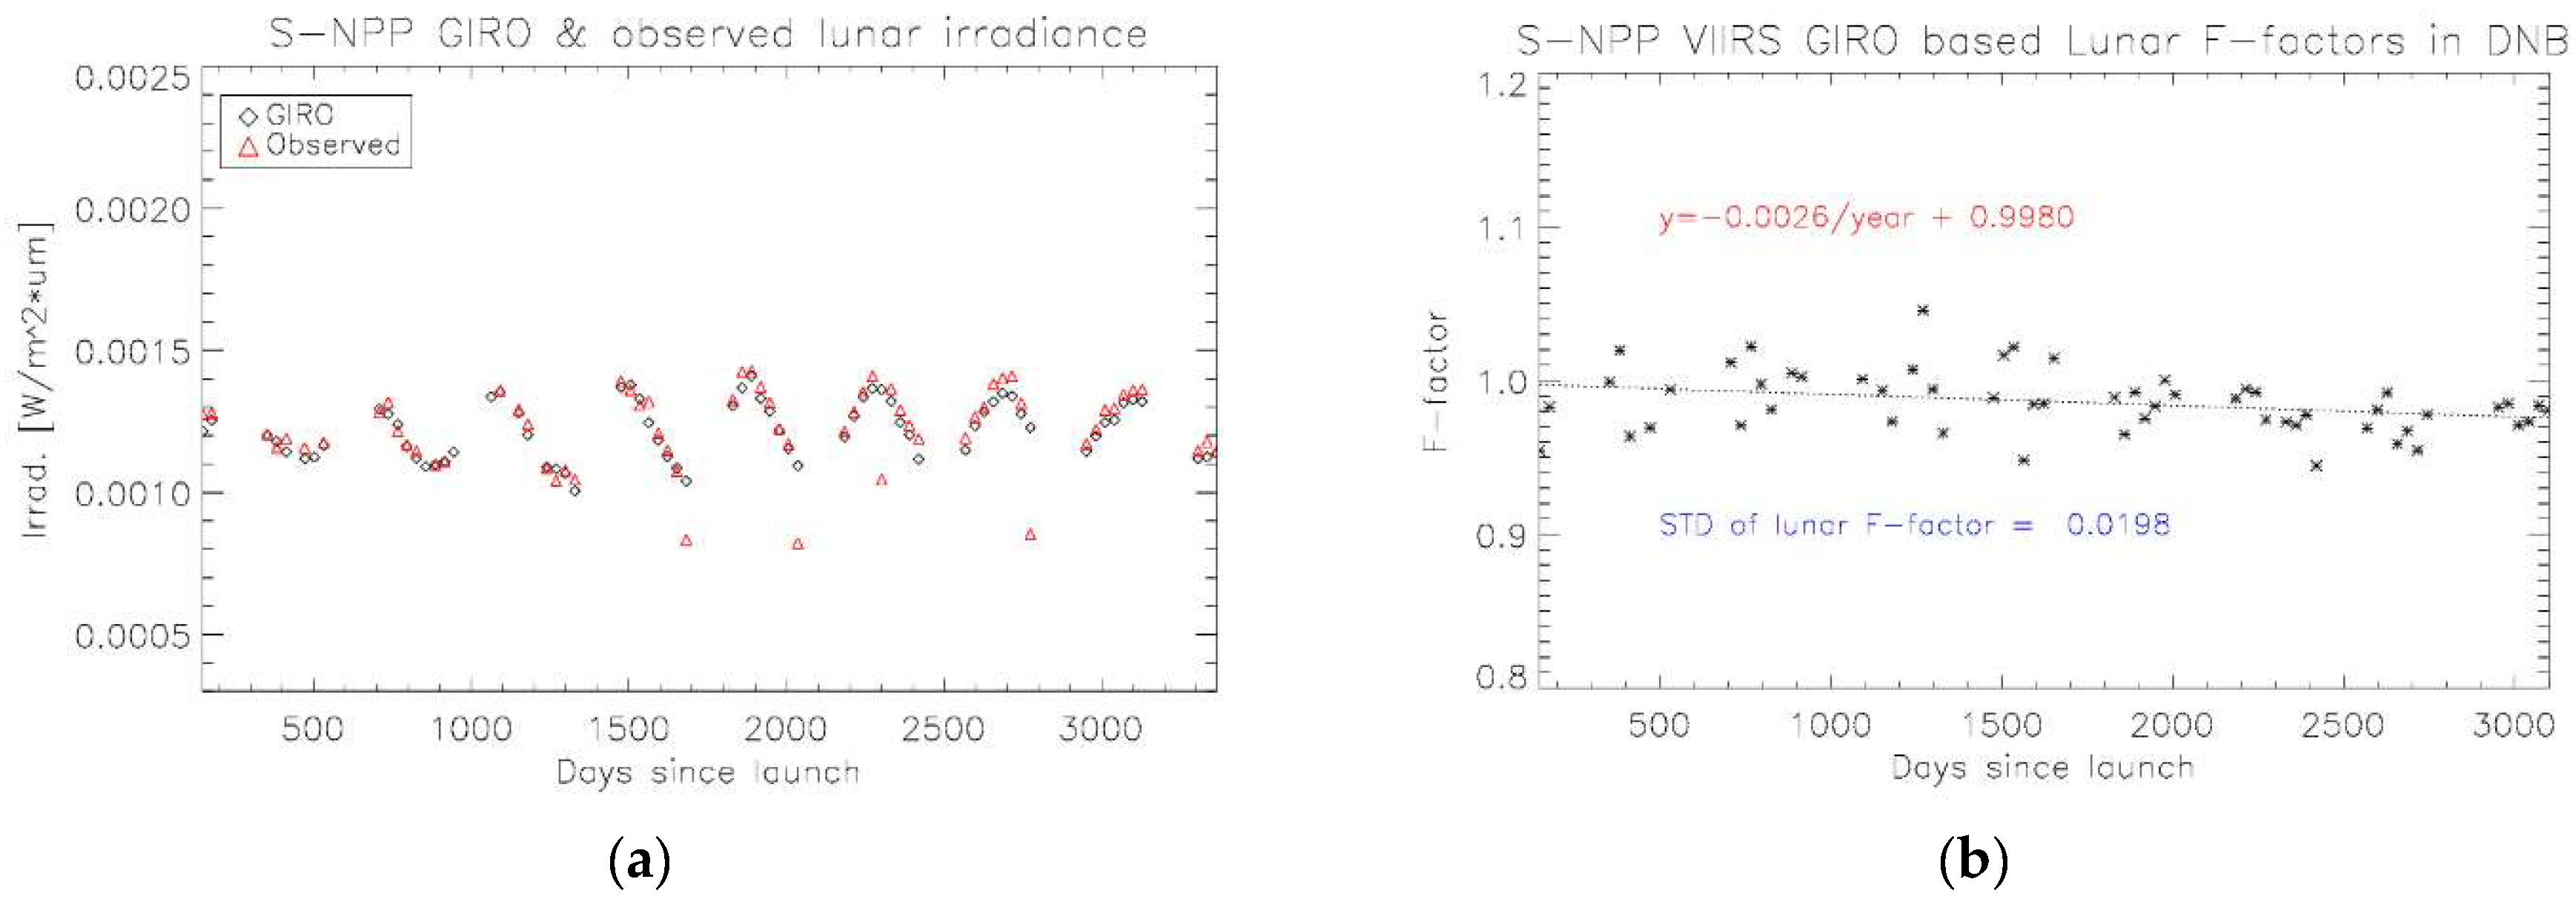
Figure 11a shows observed lunar irradiance in red triangles and GIRO model irradiance in black diamonds. The GIRO and observed irradiances are matching very well but GIRO irradiance values are slightly lower than observed lunar irradiance, since GIRO has absolute calibration uncertainty issues from the radiometric calibration reference Vega and atmospheric corrections for the ROLO model. The GIRO and observed lunar irradiance are mostly matching within five percent level of VIIRS DNB radiometric uncertainty requirements. There are some observation points that are quite different from the GIRO irradiance values in Figure 11a. It usually happens with the no-roll maneuver collection before and after the annual gaps. These extreme points are not considered in the final lunar F-factor plot in Figure 11b. GIRO can be used to check the long-term relative stability of a lunar imaging sensor. Figure 11b shows the lunar F-factors and it is quite stable over time within two percent level over the nine years with the standard deviation of 0.0198. In an ideal case, the lunar F-factors should be near unity, but there is a small long-term downward trend in the F-factors with a slope of 0.0026 per year. Since the measured long-term trend slope of 0.0026 (0.26%) per year is larger than the suggested instrument precision of 0.1% from SeaWiFS [34], this indicates that the SD LGS gain may over estimated aggregation zone 1 LGS gains, and it reduces the lunar F-factors in Figure 11b.
According to the VIIRS requirements, DNB radiance for a uniform scene shall have calibration uncertainty of 5 percent at the half maximum radiance and 10 percent at the minimum radiance for the LGS [3]. The lunar F-factors proves the DNB on-orbit SD based radiometric calibration uncertainty requirements within five percent level compared to the GIRO lunar irradiance model. This study uses a unique irradiance method by using the whole moon based solid angle calculation with the phase angle consideration. On top of it, the simulated FWHM correction is applied to the observed lunar irradiance calculation from the RTA Tungsten oxide-darkening model. In the lunar F-factor plot Figure 11b, the trend is mostly flat until day 1500 but it shows slight downward degradation about two percent until recent collection. NOAA VIIRS SDR team is closely monitoring this long-term F-factor trend to investigate the possible sources of calibration error in the DNB LGS gain calculations.
4. Conclusions
This study presented the on-orbit S-NPP VIIRS DNB radiometric calibration comparison results between the primary SD observations and alternative monthly scheduled lunar collections. Initially, the time-dependent RSRs are calculated from the tungsten oxide thin film model and applied to the SD LGS gain estimations. The lifetime SD LGS gains are interpolated to calculate the observed lunar radiance along with the detector bias (called DN0) and gain ratio LUTs. In each scheduled lunar collection, the observed lunar radiance is converted to lunar irradiance using the satellite-moon distance, phase angle of the moon, and the FWHM of the modulated RSR. Along with the observed lunar irradiance, the GIRO model provides lunar irradiance from the inputs of lunar observation time, satellite location, and the modulated DNB RSR at the lunar observation time. Finally, the lunar F-factors are calculated from the irradiance ratio between the GIRO and VIIRS observation. In an ideal case, the lunar F-factors are expected to be near unity. The overall on-orbit DNB SD LGS gains showed very stable responses compared to the GIRO lunar irradiance model meeting the S-NPP VIIRS product specification of five percent. The current on-orbit DNB calibration showed expected stability with a large margin; however, the calculated lunar F-factors showed a slight linear downward trend of −0.26 percent per year over the nine years operations. These calibration differences can be used for the future S-NPP recalibration for the better quality of VIIRS DNB products.
Author Contributions
T.C. collected and prepared the lunar data, developed the processing code, analyzed the results and wrote the manuscript. C.C. provided technical guidance and directions of the study. Both authors have read and agreed to the published version of the manuscript.
Funding
This research was funded by the PROTECH contract awarded to Global Science & Technology (GST) by NOAA/National Environmental Satellite, Data, and Information Service (NESDIS).
Acknowledgments
The authors thank EUMETSAT for sharing the GIRO lunar irradiance model (version 1.0).
Conflicts of Interest
The authors declare no conflict of interest.
Disclaimer
The scientific results and conclusions, as well as any views or opinions expressed herein, are those of the author(s) and do not necessarily reflect those of NOAA or the Department of Commerce.
References
- Cao, C.; Xiong, J.; Blonski, S.; Liu, Q.; Uprety, S.; Shao, X.; Bai, Y.; Weng, F. Suomi NPP VIIRS sensor data record verification, validation, and long-term performance monitoring. J. Geophys. Res. Atmos. 2013, 118, 664–678. [Google Scholar] [CrossRef]
- Cao, C.; De Luccia, F.J.; Xiong, X.; Wolfe, R.; Weng, F. Early On-Orbit Performance of the Visible Infrared Imaging Radiometer Suite Onboard the Suomi National Polar-Orbiting Partnership (S-NPP) Satellite. IEEE Trans. Geosci. Remote Sens. 2014, 52, 1142–1156. [Google Scholar] [CrossRef] [Green Version]
- Baker, N.; Kilcoyne, H. Joint Polar Satellite System (JPSS) VIIRS Radiometric Calibration Algorithm Theoretical Basis Document (ATBD); NASA: Greenbelt, MD, USA, 2011.
- Choi, T.; Shao, X.; Cao, C. On-orbit radiometric calibration of Suomi NPP VIIRS reflective solar bands using the Moon and solar diffuser. Appl. Opt. 2018, 57, 9533–9542. [Google Scholar] [CrossRef]
- Choi, T.; Shao, X.; Cao, C.; Weng, F. Radiometric Stability Monitoring of the Suomi NPP Visible Infrared Imaging Radiometer Suite (VIIRS) Reflective Solar Bands Using the Moon. Remote Sens. 2016, 8, 15. [Google Scholar] [CrossRef] [Green Version]
- Lee, S.; Chiang, K.; Xiong, X.; Sun, C.; Anderson, S. The S-NPP VIIRS Day-Night Band On-Orbit Calibration/Characterization and Current State of SDR Products. Remote Sens. 2014, 6, 12427–12446. [Google Scholar] [CrossRef] [Green Version]
- Barrie, J.D.; Xiong, X.; Fuqua, P.D.; Meshishnek, M.J.; Gu, X.; Ciofalo, M.R.; Chu, C.T.; Chaney, J.A.; Moision, R.M.; Graziani, L. Root cause determination of on-orbit degradation of the VIIRS rotating telescope assembly. In Proceedings of the Earth Observing Systems XVII, San Diego, CA, USA, 15 October 2012. [Google Scholar]
- Lei, N.; Wang, Z.; Guenther, B.; Xiong, X.; Gleason, J. Modeling the detector radiometric response gains of the Suomi NPP VIIRS reflective solar bands. SPIE Remote Sens. 2012, 8533. [Google Scholar] [CrossRef]
- Sun, J.; Xiong, J.; Eplee, J.R.E.; Xiong, X.; Stone, T.; Meister, G.; McClain, C.R. MODIS and Seawifs on-Orbit Lunar Calibration. In Proceedings of the Earth Observing Systems XIII, San Diego, CA, USA, 11–13 August 2008. [Google Scholar]
- Sun, J.-Q.; Xiong, X.; Barnes, W.L.; Guenther, B. MODIS Reflective Solar Bands On-Orbit Lunar Calibration. IEEE Trans. Geosci. Remote Sens. 2007, 45, 2383–2393. [Google Scholar] [CrossRef]
- Xiong, X.; Sun, J.; Barnes, W. Intercomparison of On-Orbit Calibration Consistency Between Terra and Aqua MODIS Reflective Solar Bands Using the Moon. IEEE Geosci. Remote Sens. Lett. 2008, 5, 778–782. [Google Scholar] [CrossRef]
- Morfitt, R.; Barsi, J.; Levy, R.; Markham, B.; Micijevic, E.; Ong, L.; Scaramuzza, P.; Vanderwerff, K. Landsat-8 Operational Land Imager (OLI) Radiometric Performance On-Orbit. Remote Sens. 2015, 7, 2208–2237. [Google Scholar] [CrossRef] [Green Version]
- Wu, X.; Stone, T.C.; Yu, F.; Han, D. Vicarious calibration of GOES Imager visible channel using the Moon. SPIE Opt. Photonics 2006, 6296. [Google Scholar] [CrossRef]
- Choi, T.; Cao, C.; Weng, F. Radiometric Stability Monitoring of the S-Npp Viirs Ocean Color Bands Using the Moon. In Proceedings of the International Symposium on Remote Sensing (ISRS), Jeju, Korea, 20 April 2016; pp. 1–4. [Google Scholar]
- Wang, W.; Cao, C.; Ignatov, A.; Liang, X.; Li, Z.; Wang, L.; Zhang, B.; Blonski, S.; Li, J. Improving the Calibration of Suomi NPP VIIRS Thermal Emissive Bands During Blackbody Warm-Up/Cool-Down. IEEE Trans. Geosci. Remote Sens. 2019, 57, 1977–1994. [Google Scholar] [CrossRef]
- Taeyoung, C.; Junqiang, S.; Zhang, B.; Wang, Z.; Cao, C.; Weng, F.; Wang, M. Suomi-NPP VIIRS Initial Reprocessing Improvements and Validations in the Reflective Solar Bands. SPIE Opt. Eng. Appl. 2017, 10402. [Google Scholar] [CrossRef]
- Choi, T.; Cao, C. S-NPP VIIRS On-Orbit Calibration Coefficient Improvements with Yaw Maneuver Reanalysis. IEEE Trans. Geosci. Remote Sens. 2019, 57, 7460–7465. [Google Scholar] [CrossRef]
- Shao, X.; Liu, T.-C.; Xiong, X.; Cao, C.; Choi, T.; Angal, A. Surface Roughness-Induced Spectral Degradation of Multi-Spaceborne Solar Diffusers Due to Space Radiation Exposure. IEEE Trans. Geosci. Remote Sens. 2019, 57, 1–14. [Google Scholar] [CrossRef]
- Shao, X.; Cao, C.; Liu, T.-C. Spectral Dependent Degradation of the Solar Diffuser on Suomi-NPP VIIRS Due to Surface Roughness-Induced Rayleigh Scattering. Remote Sens. 2016, 8, 254. [Google Scholar] [CrossRef] [Green Version]
- Lei, N.; Guenther, B.; Wang, Z.; Xiong, X.; Xiong, X. Modeling SNPP VIIRS reflective solar bands optical throughput degradation and its impacts on the relative spectral response. SPIE Opt. Eng. Appl. 2013, 8866. [Google Scholar] [CrossRef]
- Wang, Z.; Xiong, X.; Fulbright, J.P. Suomi-NPP VIIRS unscheduled lunar observations. SPIE Remote Sens. 2016, 1000. [Google Scholar] [CrossRef]
- Patt, F.S.; Butler, J.J.; Eplee, R.E.; Barnes, R.A.; Meister, G.; Butler, J.J. Use of the moon as a calibration reference for NPP VIIRS. Opt. Photonics 2005, 5882. [Google Scholar] [CrossRef]
- Blonski, S.; Cao, C. Suomi NPP VIIRS Reflective Solar Bands Operational Calibration Reprocessing. Remote Sens. 2015, 7, 16131–16149. [Google Scholar] [CrossRef] [Green Version]
- Geis, J.; Florio, C.; Moyer, D.; Gu, X.; Rausch, K.; De Luccia, F.J. VIIRS day-night band gain and offset determination and performance. SPIE Opt. Eng. Appl. 2012, 8510. [Google Scholar] [CrossRef]
- Liao, L.B.; Weiss, S.; Mills, S.; Hauss, B. Suomi NPP VIIRS day-night band on-orbit performance. J. Geophys. Res. Atmos. 2013, 118, 705–718. [Google Scholar] [CrossRef]
- Gu, Y.; Uprety, S.; Blonski, S.; Zhang, B.; Cao, C. Improved algorithm for determining the Visible Infrared Imaging Radiometer Suite Day/Night Band high-gain stage dark offset free from light contamination. Appl. Opt. 2019, 58, 1400–1407. [Google Scholar] [CrossRef] [PubMed]
- Kieffer, H.H.; Stone, T. The Spectral Irradiance of the Moon. Astron. J. 2005, 129, 2887–2901. [Google Scholar] [CrossRef] [Green Version]
- Hapke, B. A Theoretical Photometric Function for the Lunar Surface. J. Geophys. Res. 1963, 68, 4571–4586. [Google Scholar] [CrossRef]
- Stone, T.; Kieffer, H.H. Absolute irradiance of the moon for on-orbit calibration. In Proceedings of the SPIE—The International Society for Optical Engineering, Seattle, WA, USA, 7–10 July 2002; pp. 211–221. [Google Scholar]
- Kieffer, H.H. Photometric Stability of the Lunar Surface-annotated. ICARUS 1997, 130, 323–327. [Google Scholar] [CrossRef]
- Xiong, X.; Geng, X.; Angal, A.; Sun, J.; Barnes, W. Using the Moon to track MODIS reflective solar bands calibration stability. SPIE Remote Sens. 2011, 8176. [Google Scholar] [CrossRef]
- Eplee, J.R.E.; Xiong, X.; Sun, J.-Q.; Meister, G.; McClain, C.R. The cross calibration of SeaWiFS and MODIS using on-orbit observations of the Moon. Appl. Opt. 2011, 50, 120–133. [Google Scholar] [CrossRef] [Green Version]
- Lei, N.; Xiong, X.; Guenther, B. Modeling the Detector Radiometric Gains of the Suomi NPP VIIRS Reflective Solar Bands. IEEE Trans. Geosci. Remote Sens. 2015, 53, 1565–1573. [Google Scholar] [CrossRef]
- Stone, T.C.; Kieffer, H.H. Assessment of uncertainty in ROLO lunar irradiance for on-orbit calibration. In Proceedings of the Optical Science and Technology, the SPIE 49th Annual Meeting, Denver, CO, USA, 2–6 August 2004. [Google Scholar]
Figure 1.
S-NPP VIIRS DNB and visible (VIS)/near-infrared (NIR) Focal Plane Assembly (FPA) sub-detector and detector layout [3].
Figure 1.
S-NPP VIIRS DNB and visible (VIS)/near-infrared (NIR) Focal Plane Assembly (FPA) sub-detector and detector layout [3].

Figure 2.
A simplified schematic of S-NPP VIIRS and on-board calibrators [3].
Figure 2.
A simplified schematic of S-NPP VIIRS and on-board calibrators [3].

Figure 3.
A simplified Rotating Telescope Assembly (RTA) scan angle at each view [3].
Figure 3.
A simplified Rotating Telescope Assembly (RTA) scan angle at each view [3].

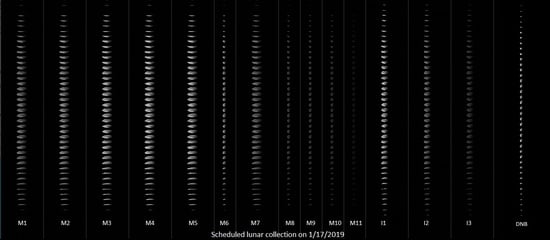
Figure 4.
A scheduled lunar collection on 4 April 2020. (a) shows the raw Digital Number (DN) image and (b) shows the pixel gain states selected by the on-board DNB processor. The black, gray, and white areas represent HGS, MGS, and LGS, respectively.
Figure 4.
A scheduled lunar collection on 4 April 2020. (a) shows the raw Digital Number (DN) image and (b) shows the pixel gain states selected by the on-board DNB processor. The black, gray, and white areas represent HGS, MGS, and LGS, respectively.

Figure 5.
Radiance image of the scheduled lunar collection on 4 April 2020.

Figure 6.
The GIRO compulsory option diagram described in the GSICS Lunar Calibration website at (http://gsics.atmos.umd.edu/bin/view/Development/LunarWorkArea) (accessed on 11 March 2021).
Figure 6.
The GIRO compulsory option diagram described in the GSICS Lunar Calibration website at (http://gsics.atmos.umd.edu/bin/view/Development/LunarWorkArea) (accessed on 11 March 2021).

Figure 7.
Time-dependent RTA darkening due to Tungsten oxides on the mirror surface (a) and corresponding modulated Relative Spectral Response (RSR) (b).
Figure 7.
Time-dependent RTA darkening due to Tungsten oxides on the mirror surface (a) and corresponding modulated Relative Spectral Response (RSR) (b).

Figure 8.
DNB LGS gain from the SD observations (a) and The DNB RSR FWHM change over time (b).

Figure 9.
The VIIRS observed mean lunar radiance. Independent linear fits are performed before and after the 1500 Days Since Launch (DSL).
Figure 9.
The VIIRS observed mean lunar radiance. Independent linear fits are performed before and after the 1500 Days Since Launch (DSL).

Figure 10.
Lunar phase angles (a) and the distance between moon and satellite (b) for the scheduled lunar collections.
Figure 10.
Lunar phase angles (a) and the distance between moon and satellite (b) for the scheduled lunar collections.

Figure 11.
Lunar observed and GIRO irradiances (a) and the corresponding lunar F-factors (b).

Publisher’s Note: MDPI stays neutral with regard to jurisdictional claims in published maps and institutional affiliations. |
© 2021 by the authors. Licensee MDPI, Basel, Switzerland. This article is an open access article distributed under the terms and conditions of the Creative Commons Attribution (CC BY) license (http://creativecommons.org/licenses/by/4.0/).
Share and Cite
MDPI and ACS Style
Choi, T.; Cao, C. S-NPP VIIRS Day Night Band On-Board Solar Diffuser Calibration Validation Using the Scheduled Lunar Collections. Remote Sens. 2021, 13, 1093. https://0-doi-org.brum.beds.ac.uk/10.3390/rs13061093
AMA Style
Choi T, Cao C. S-NPP VIIRS Day Night Band On-Board Solar Diffuser Calibration Validation Using the Scheduled Lunar Collections. Remote Sensing. 2021; 13(6):1093. https://0-doi-org.brum.beds.ac.uk/10.3390/rs13061093
Chicago/Turabian StyleChoi, Taeyoung, and Changyong Cao. 2021. "S-NPP VIIRS Day Night Band On-Board Solar Diffuser Calibration Validation Using the Scheduled Lunar Collections" Remote Sensing 13, no. 6: 1093. https://0-doi-org.brum.beds.ac.uk/10.3390/rs13061093
Note that from the first issue of 2016, this journal uses article numbers instead of page numbers. See further details here.