
Reverse Thinking: A New Method from the Graph Perspective for Evaluating and Mitigating Regional Surface Heat Islands


Abstract
:1. Introduction
2. Methodology
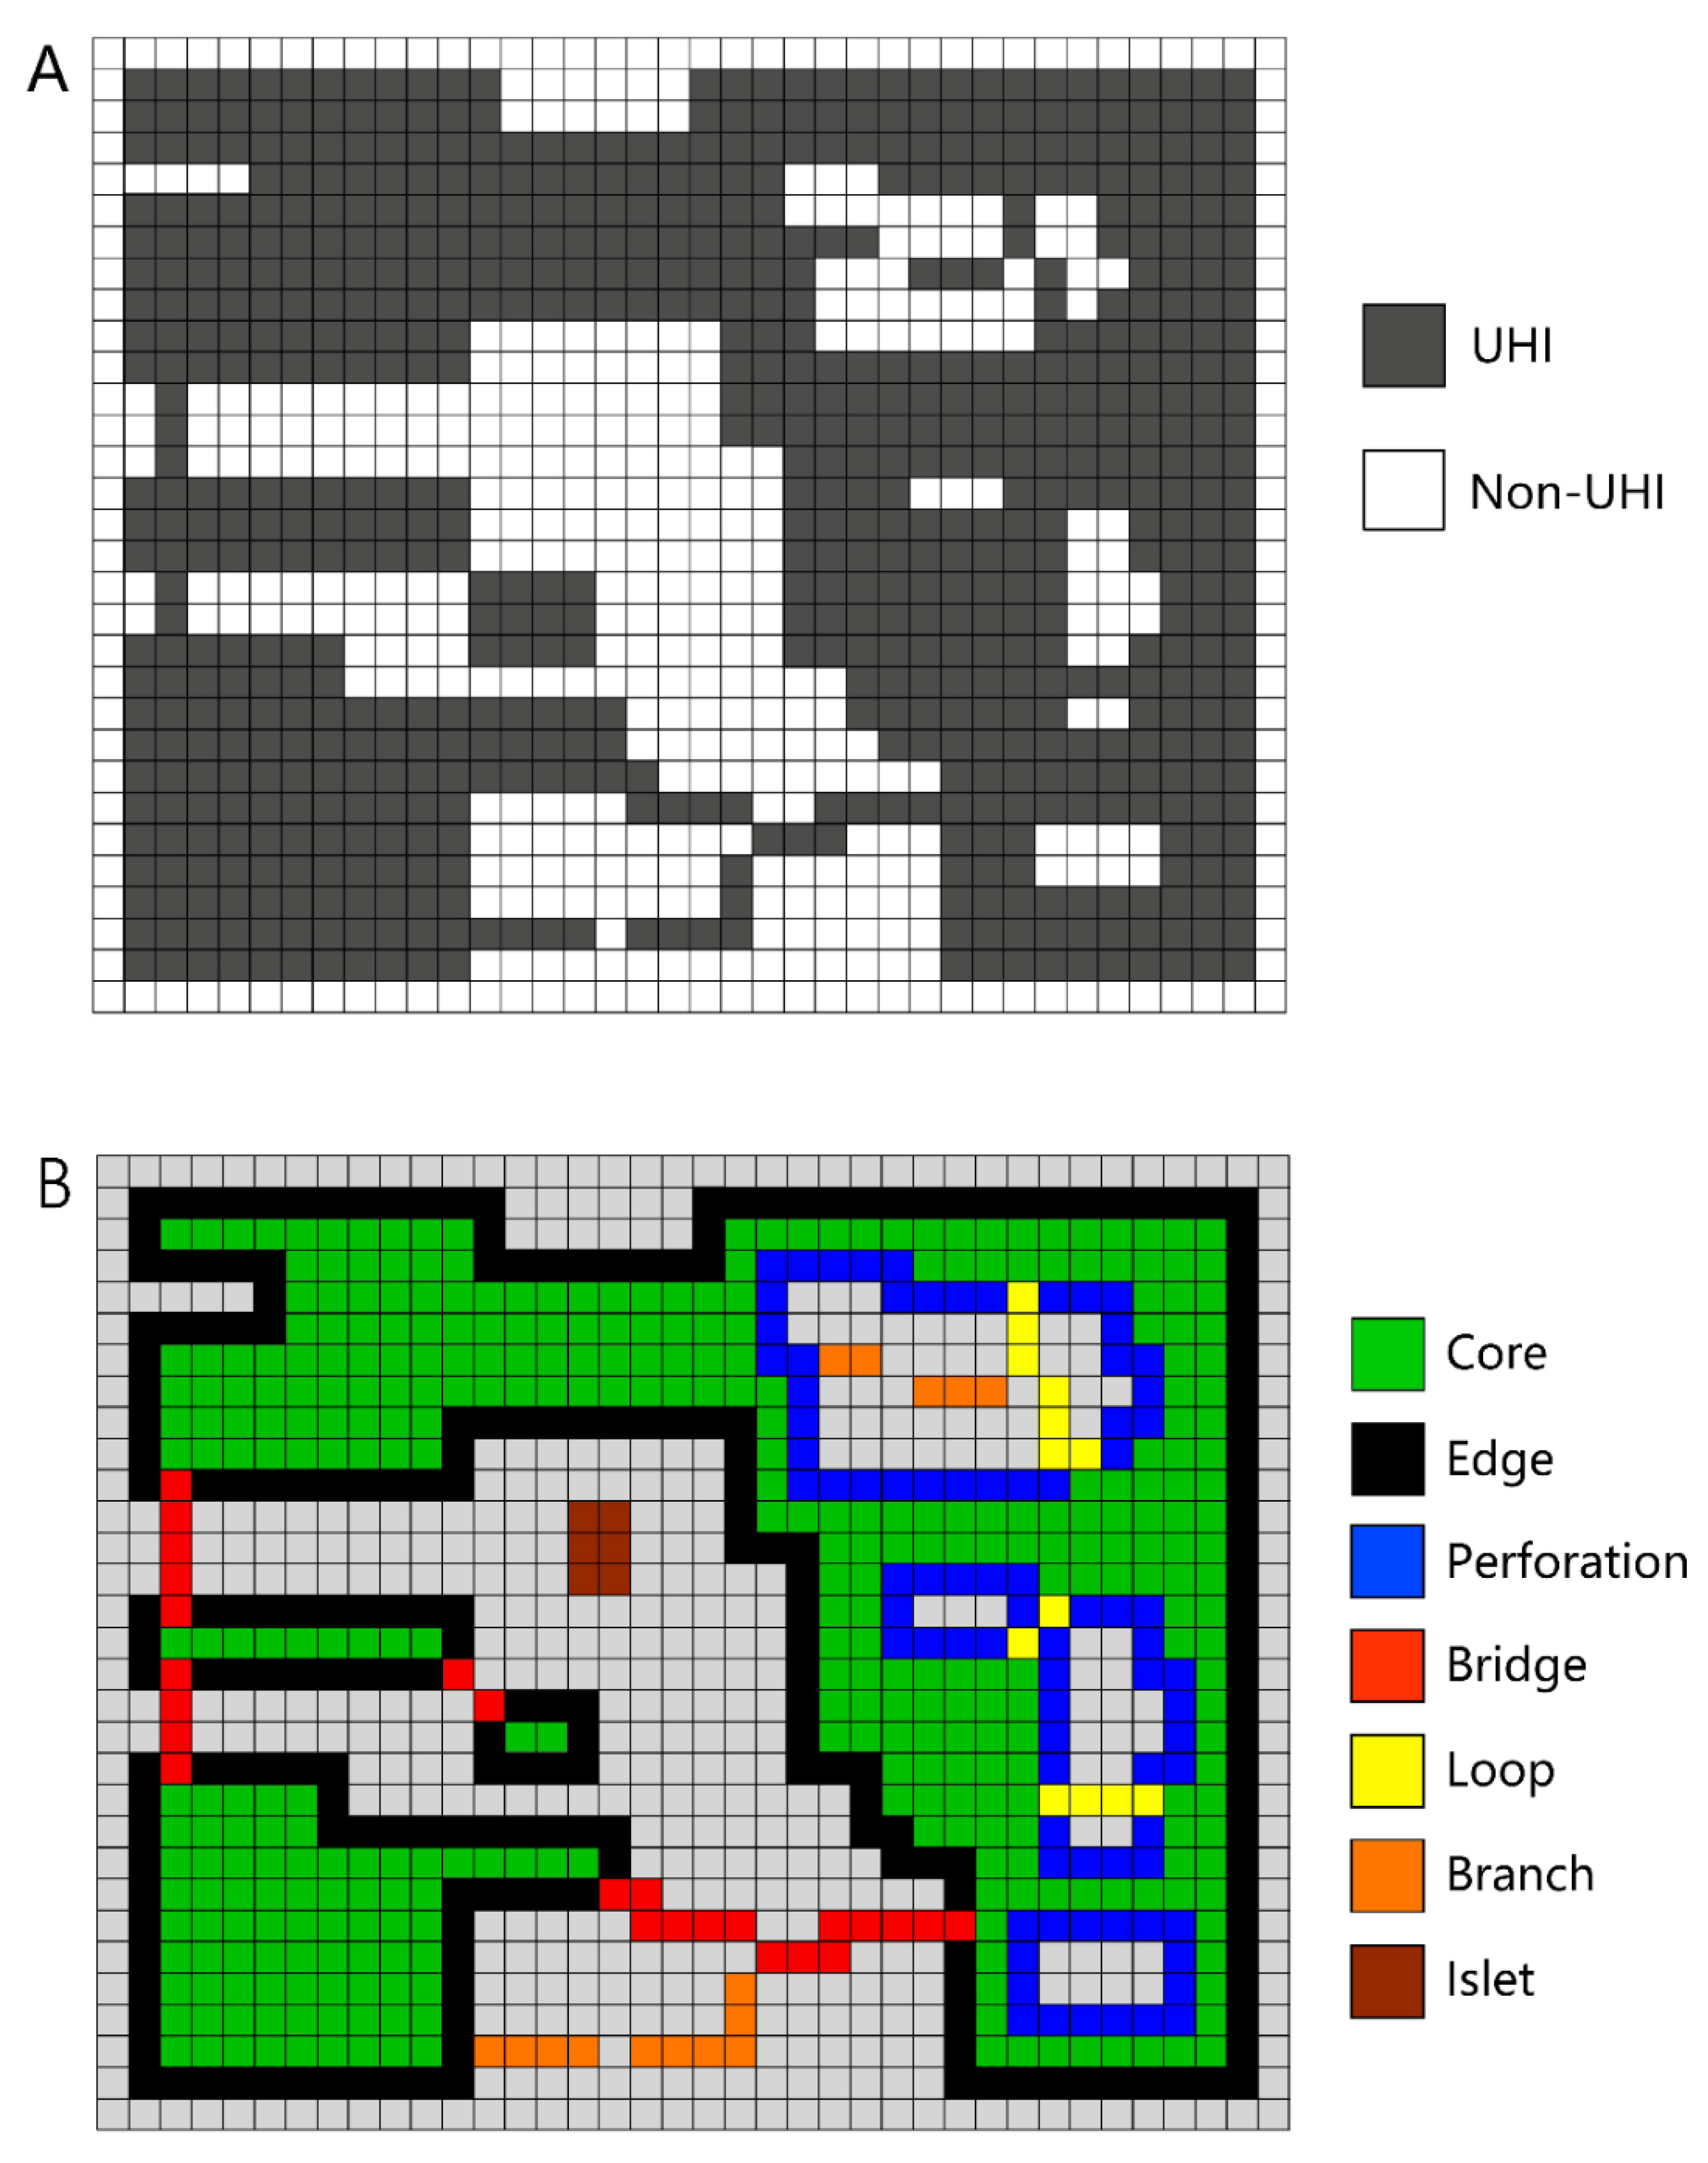
2.1. MSPA Model
2.2. Habitat Availability Indices
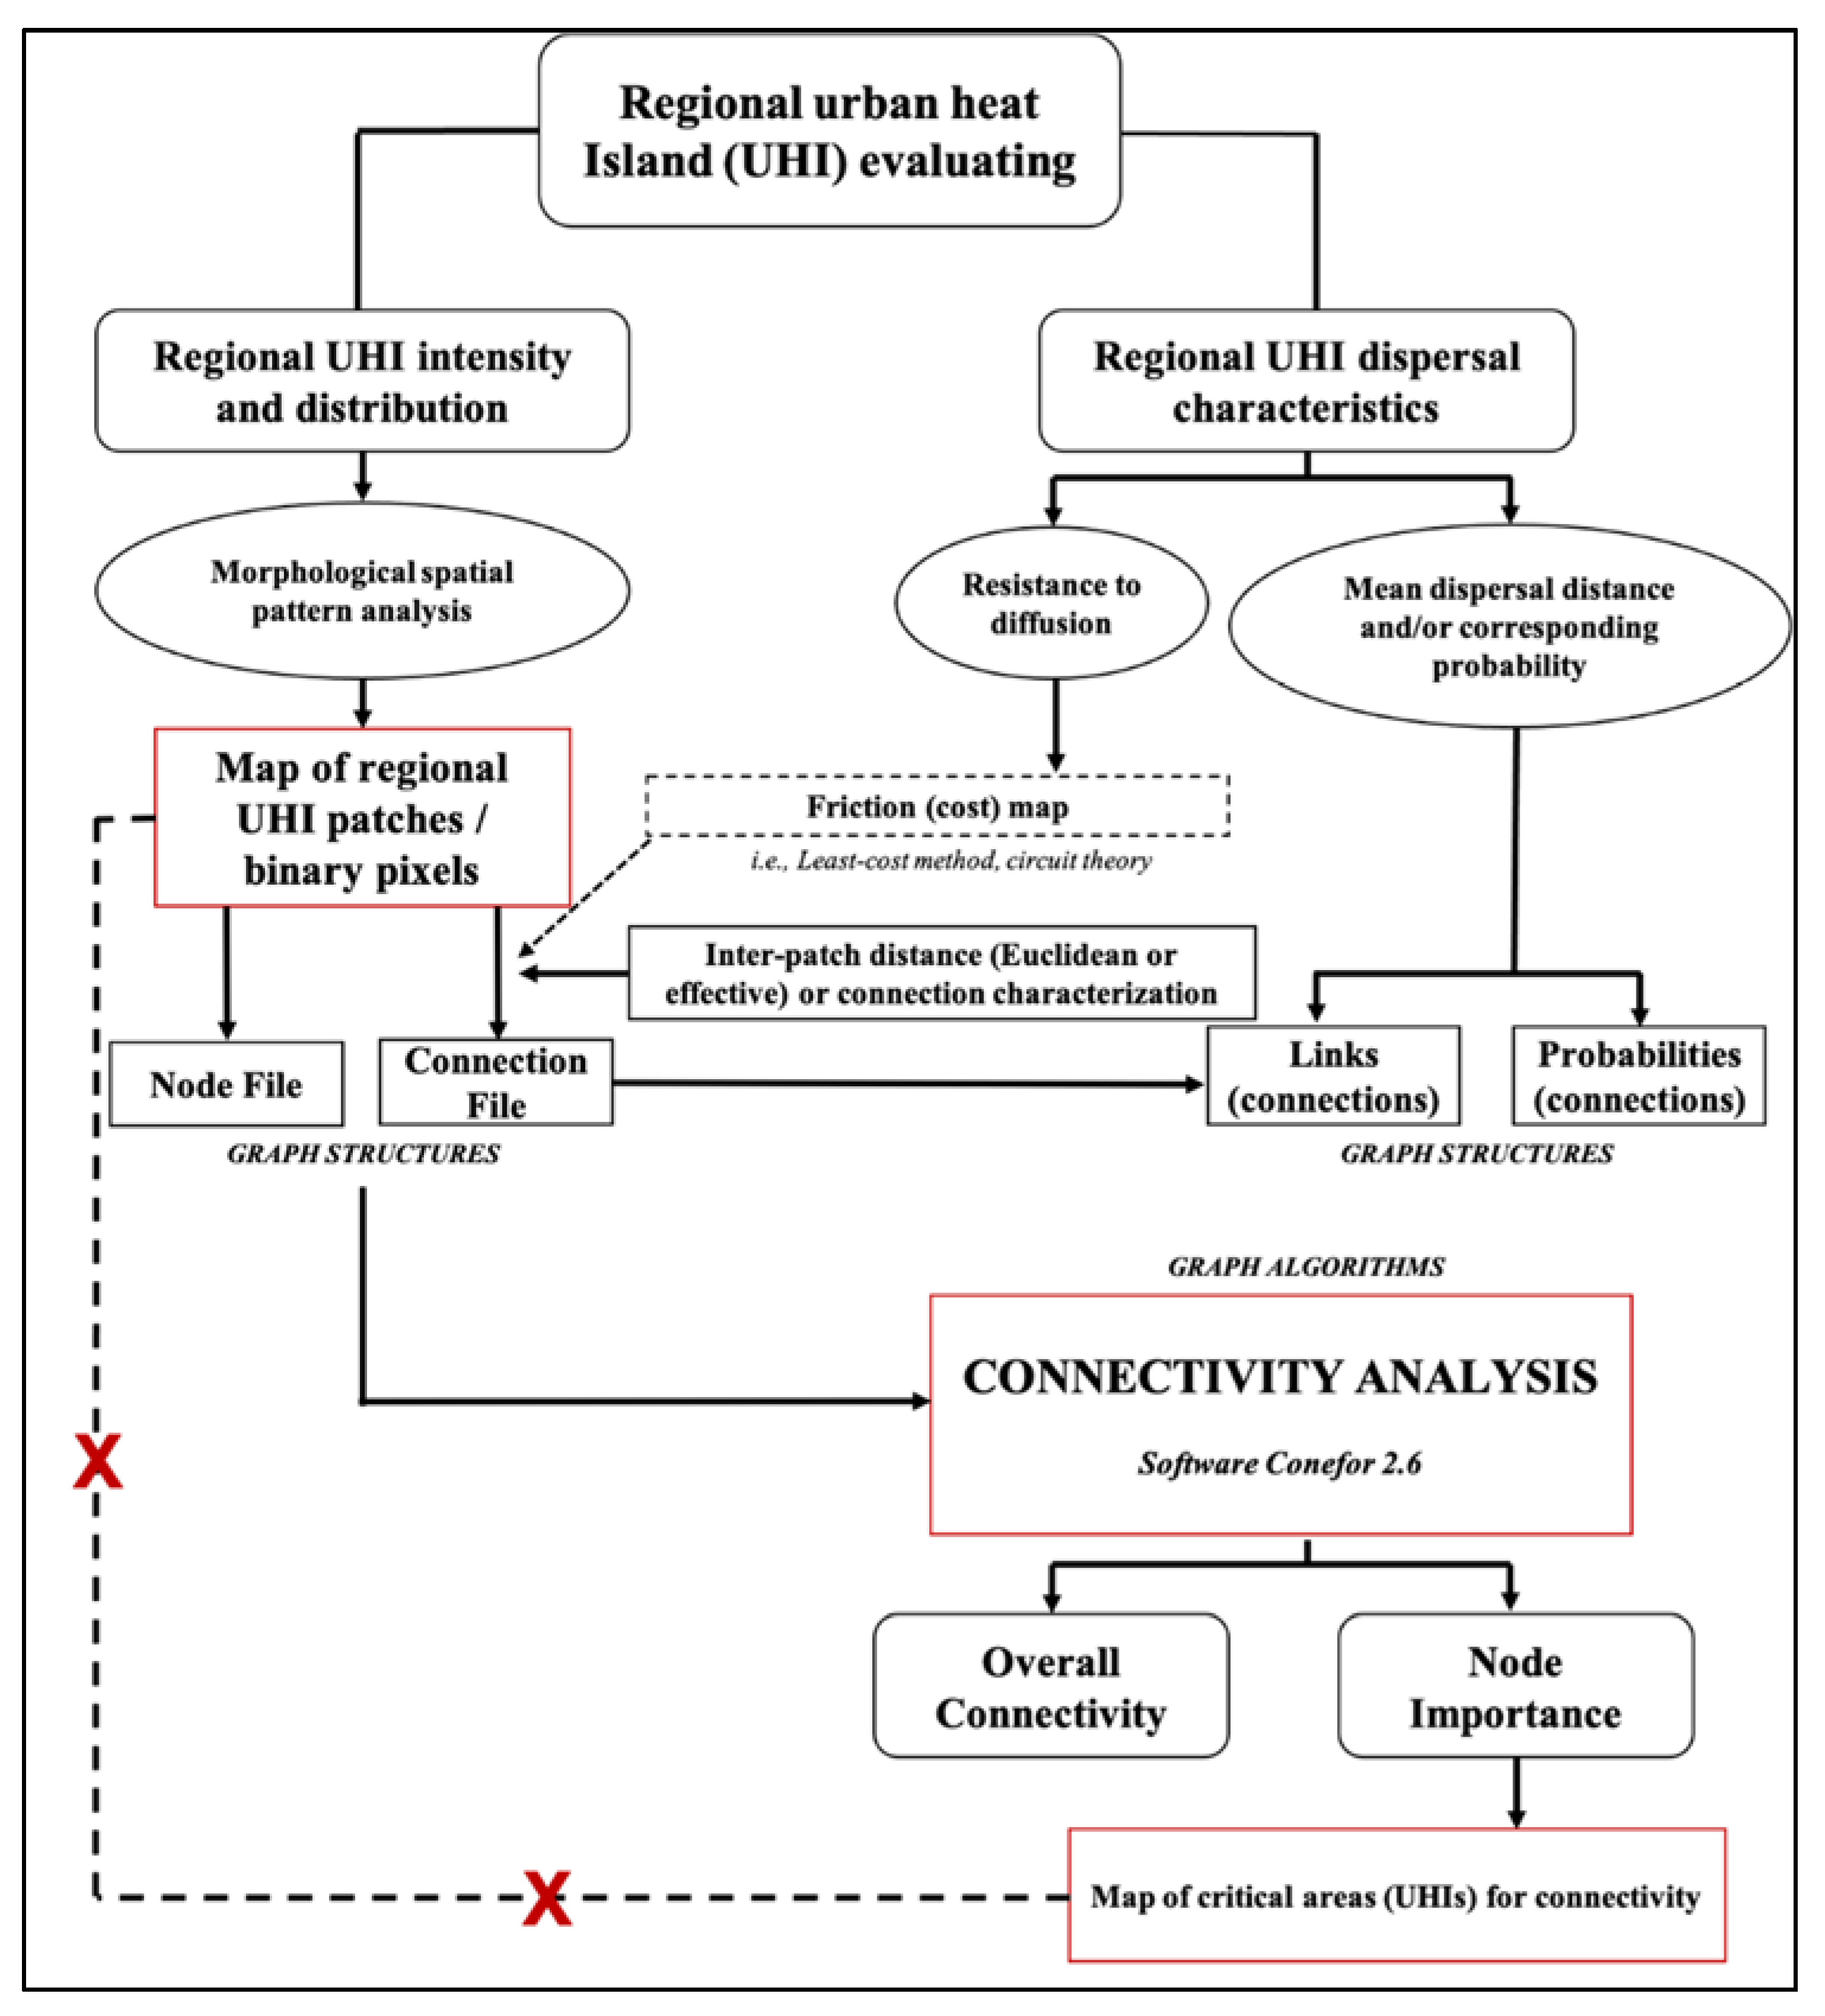
2.3. Framework of the Method
3. Case Study
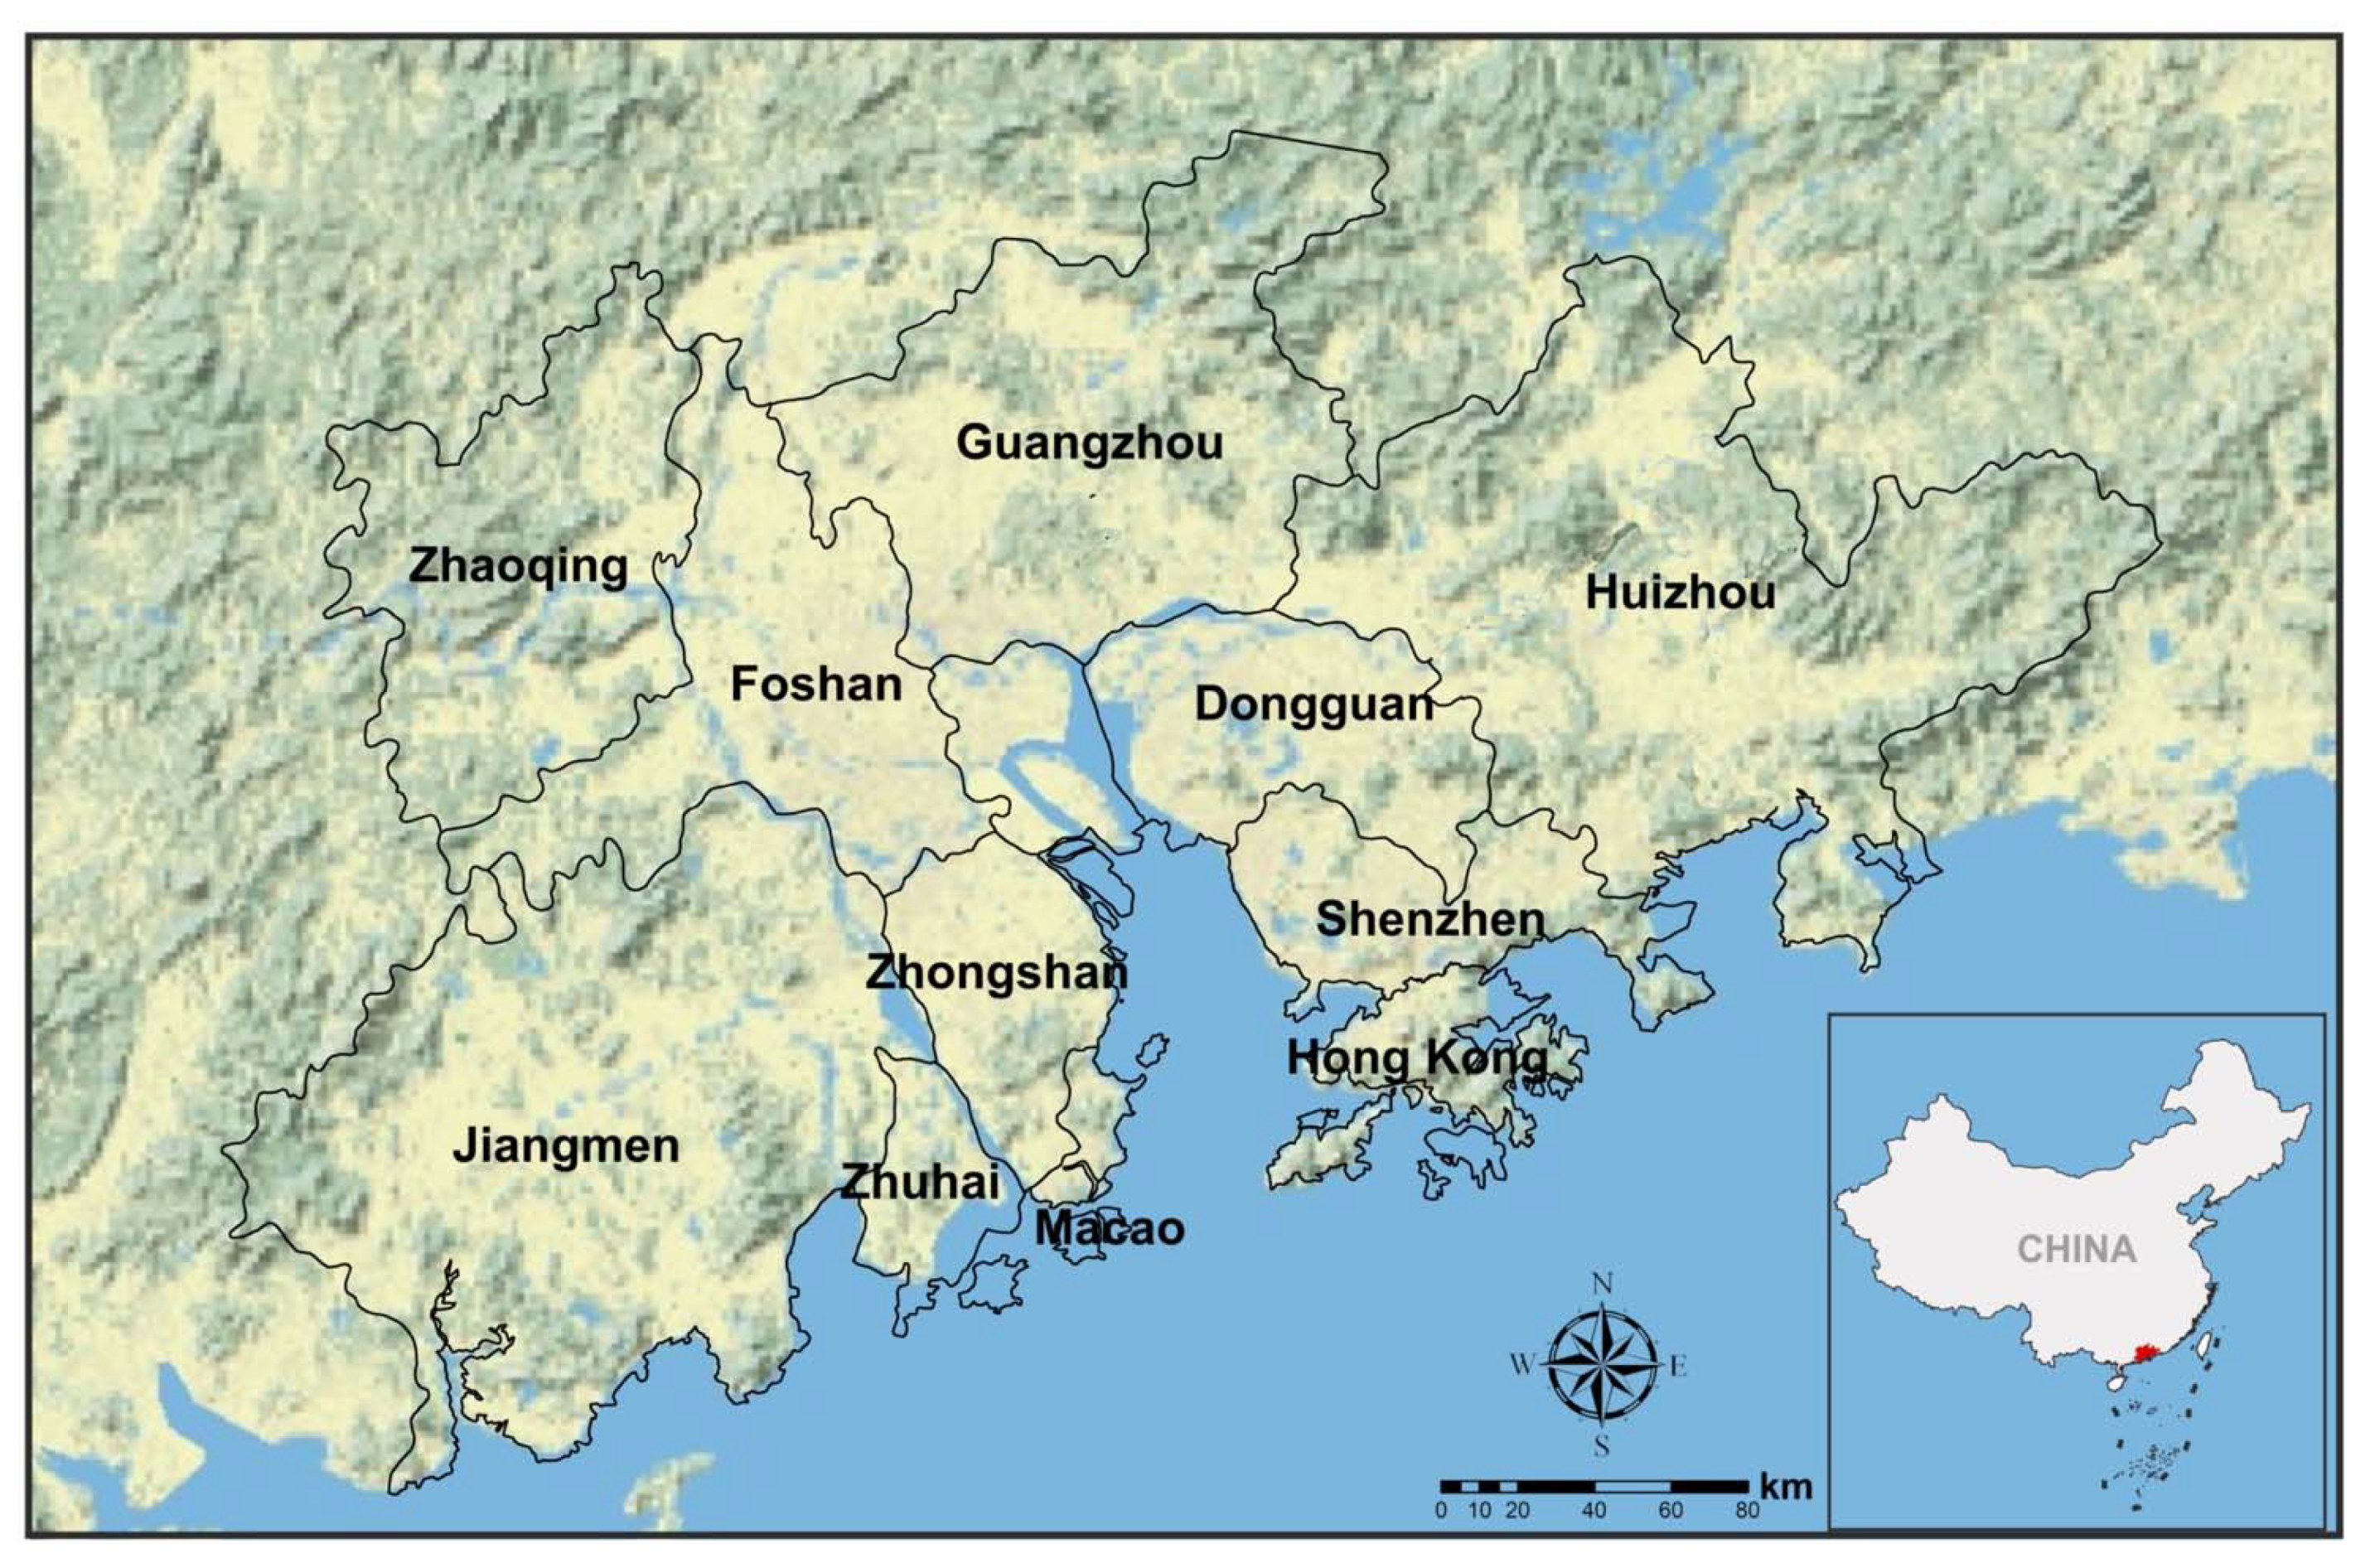
3.1. Study Area
3.2. Data Preprocessing
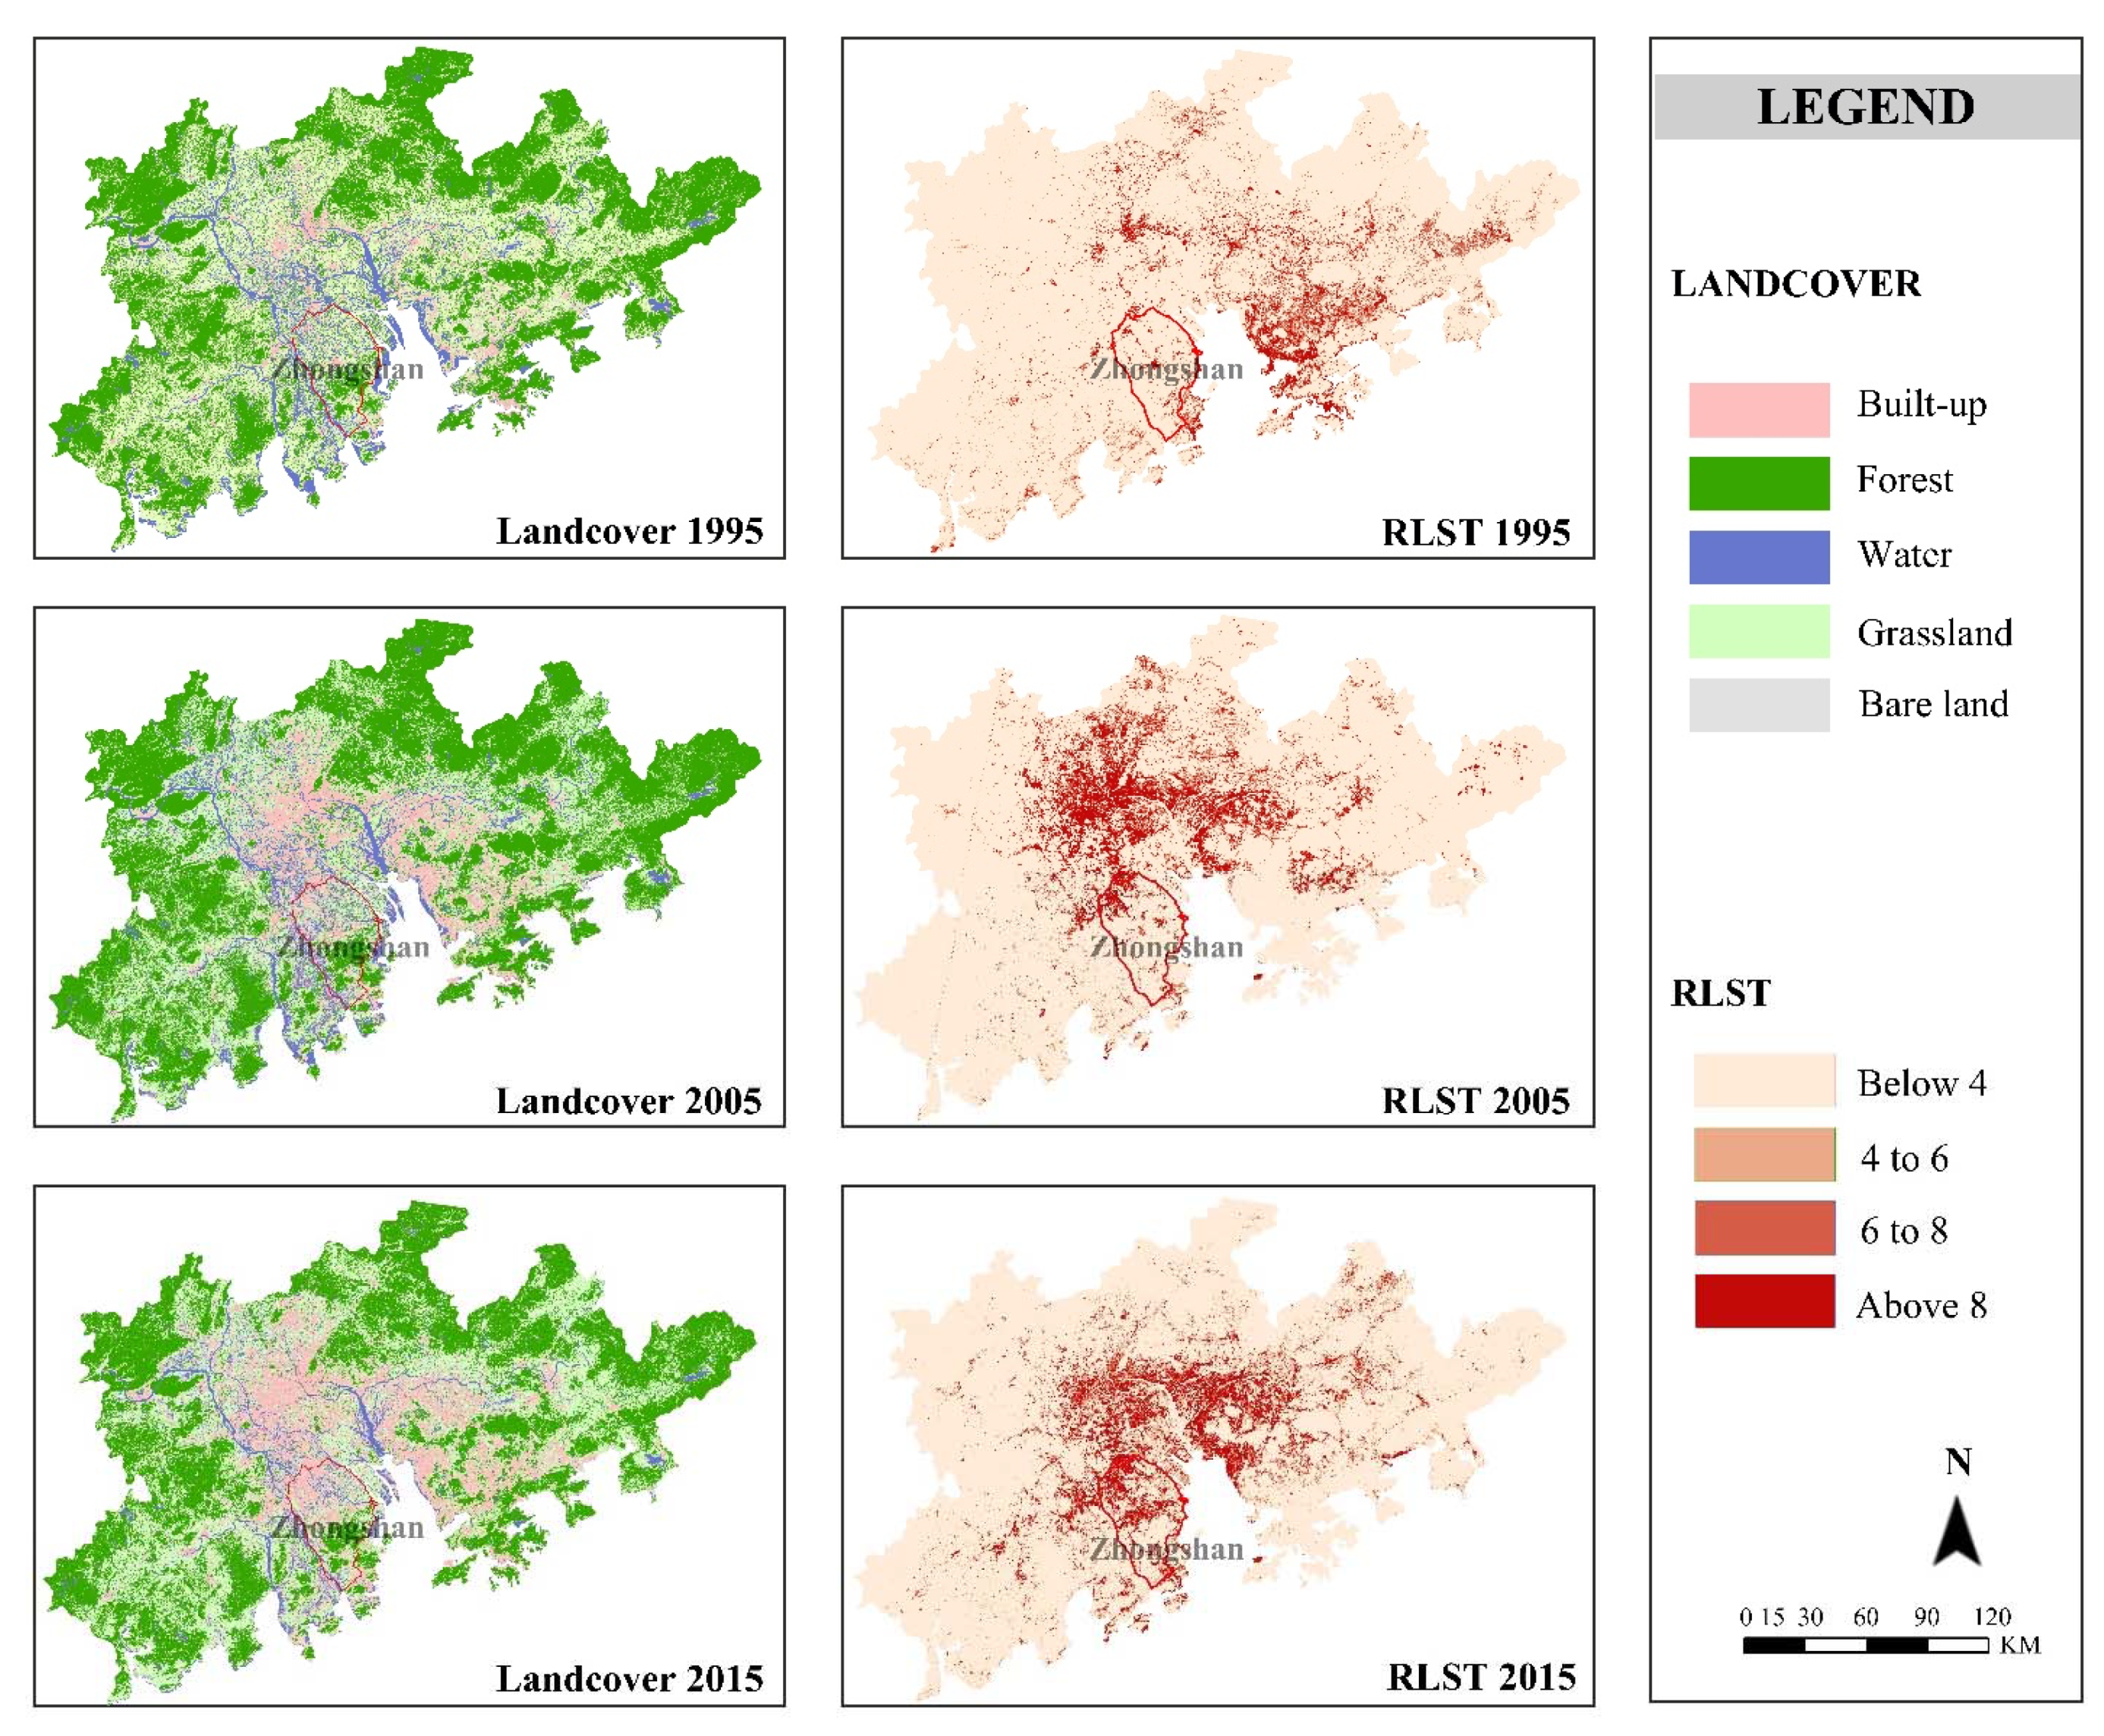
3.2.1. LST and Relative LST Calculation
3.2.2. Land Cover Mapping from 1995 to 2015
3.2.3. Analysis Process
4. Results
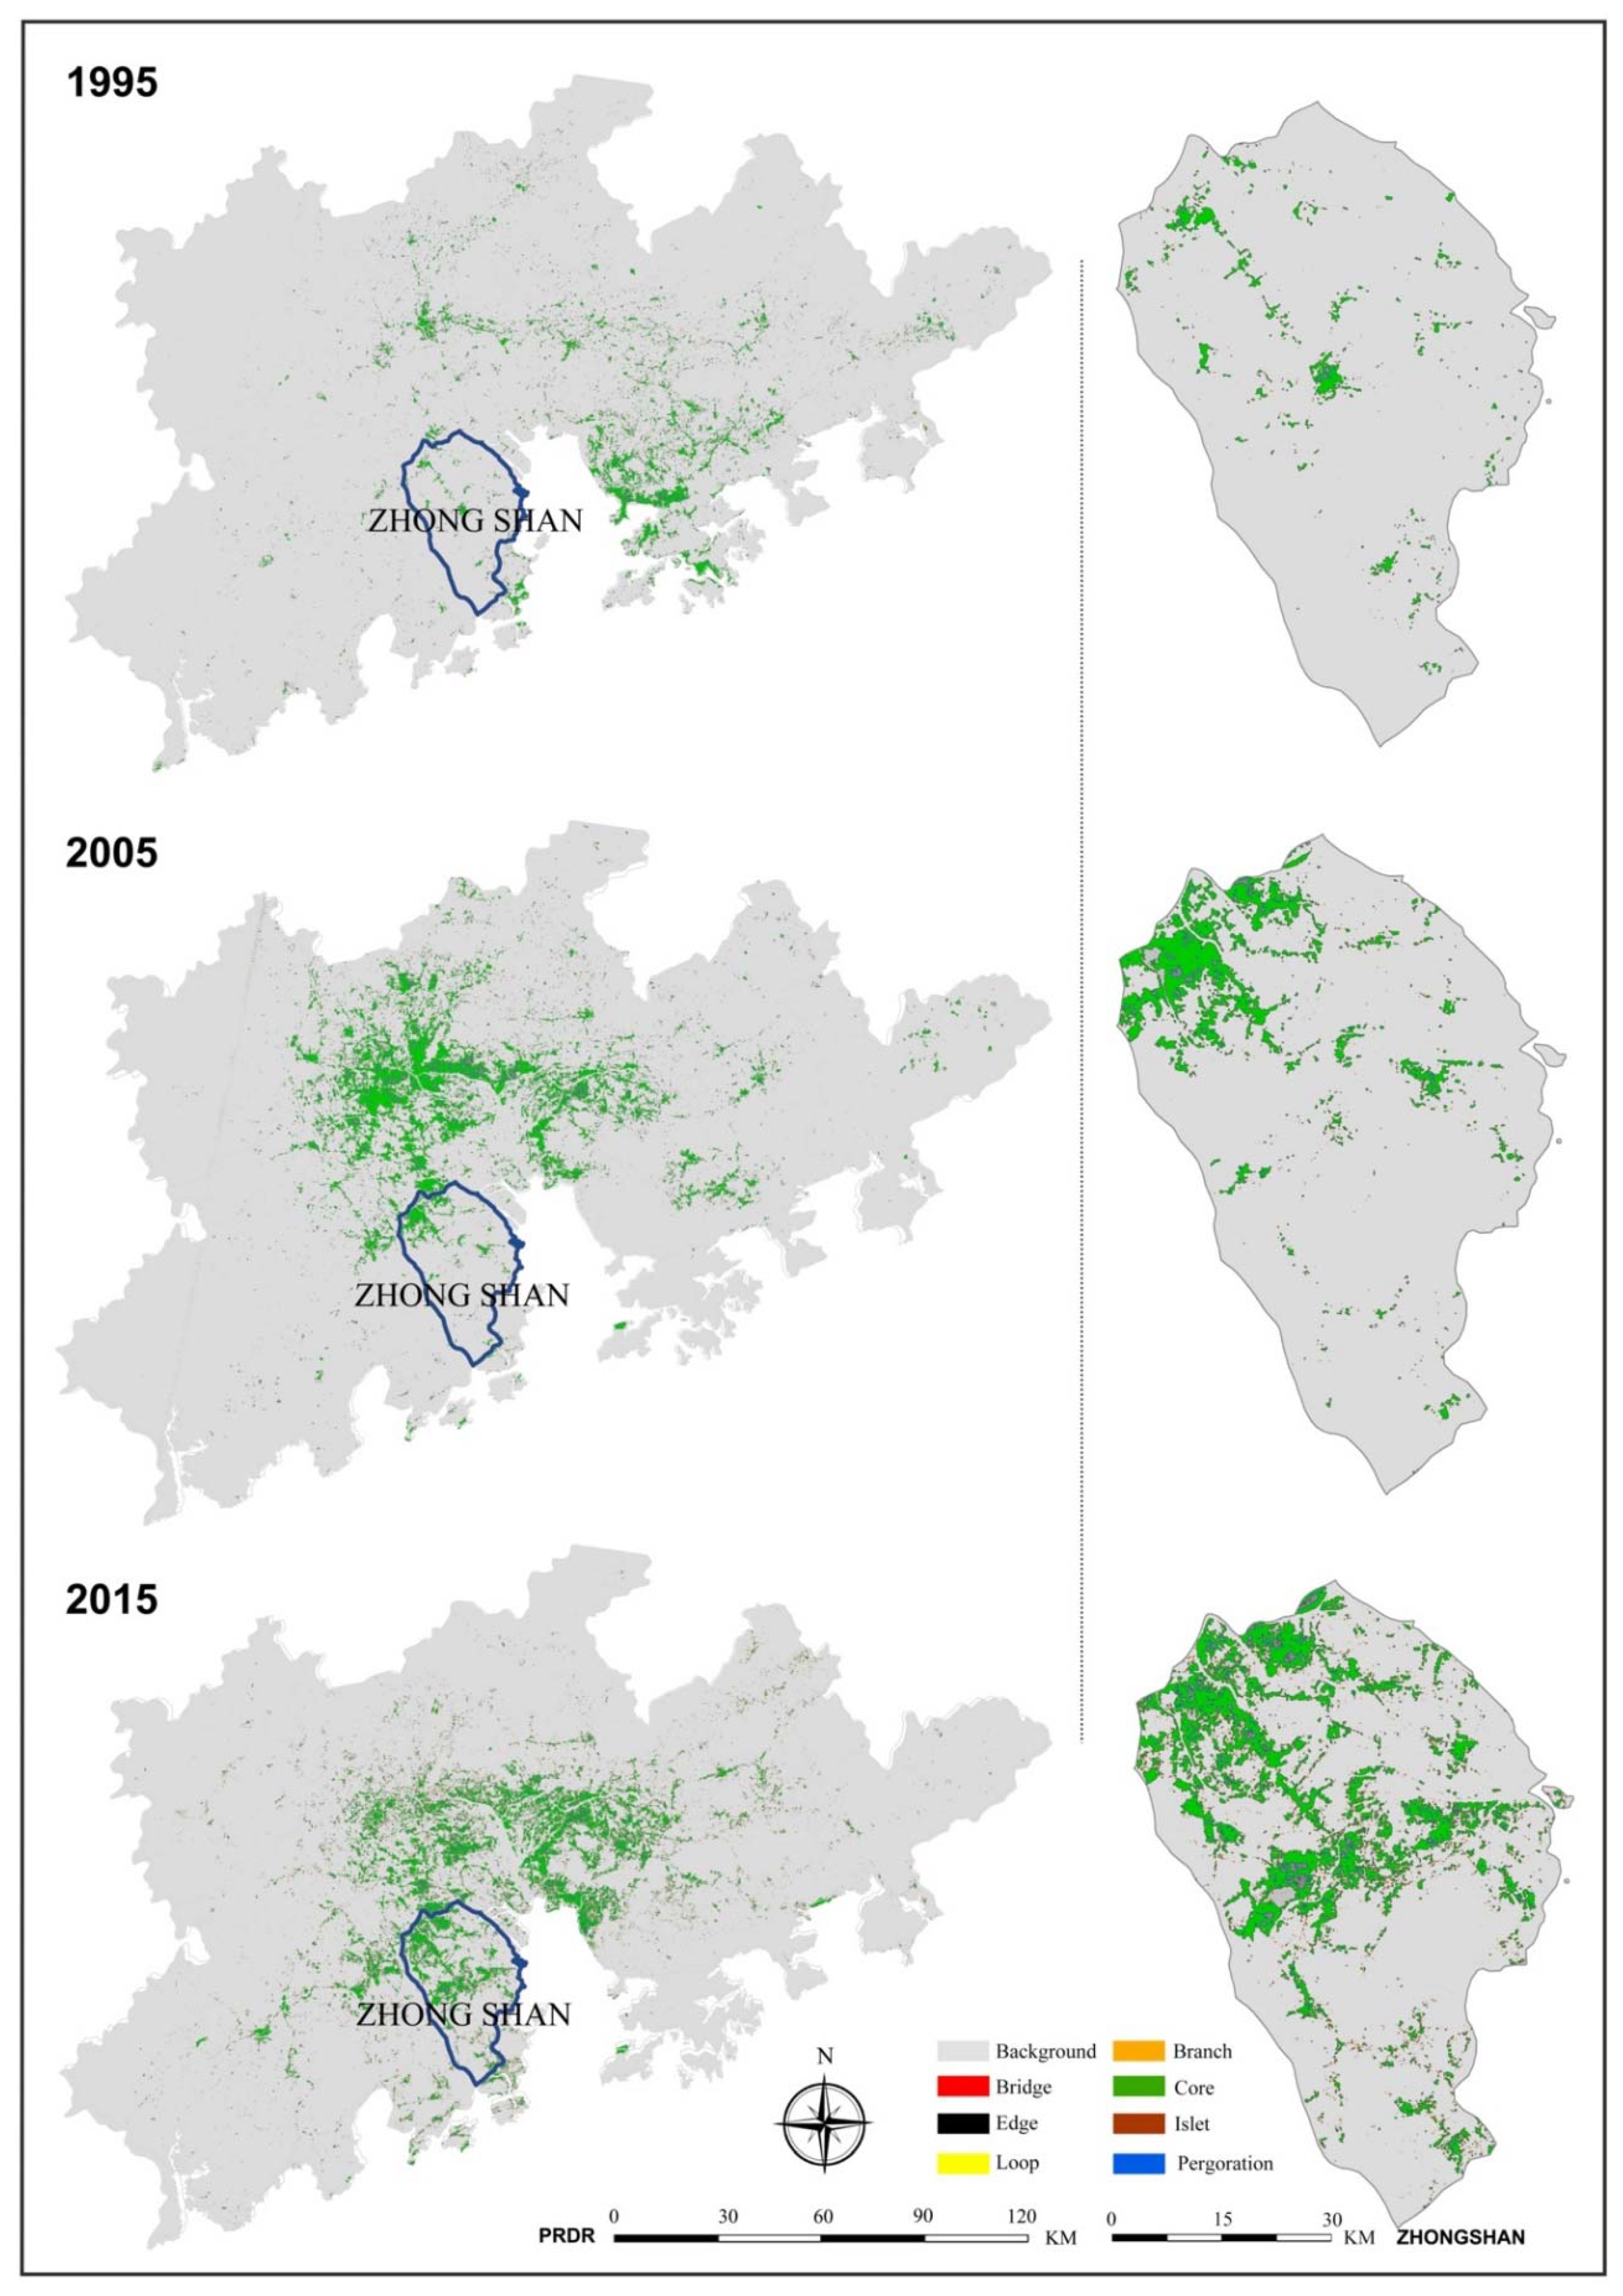
4.1. Results of MSPA-Based Surface UHI Pattern Evaluation
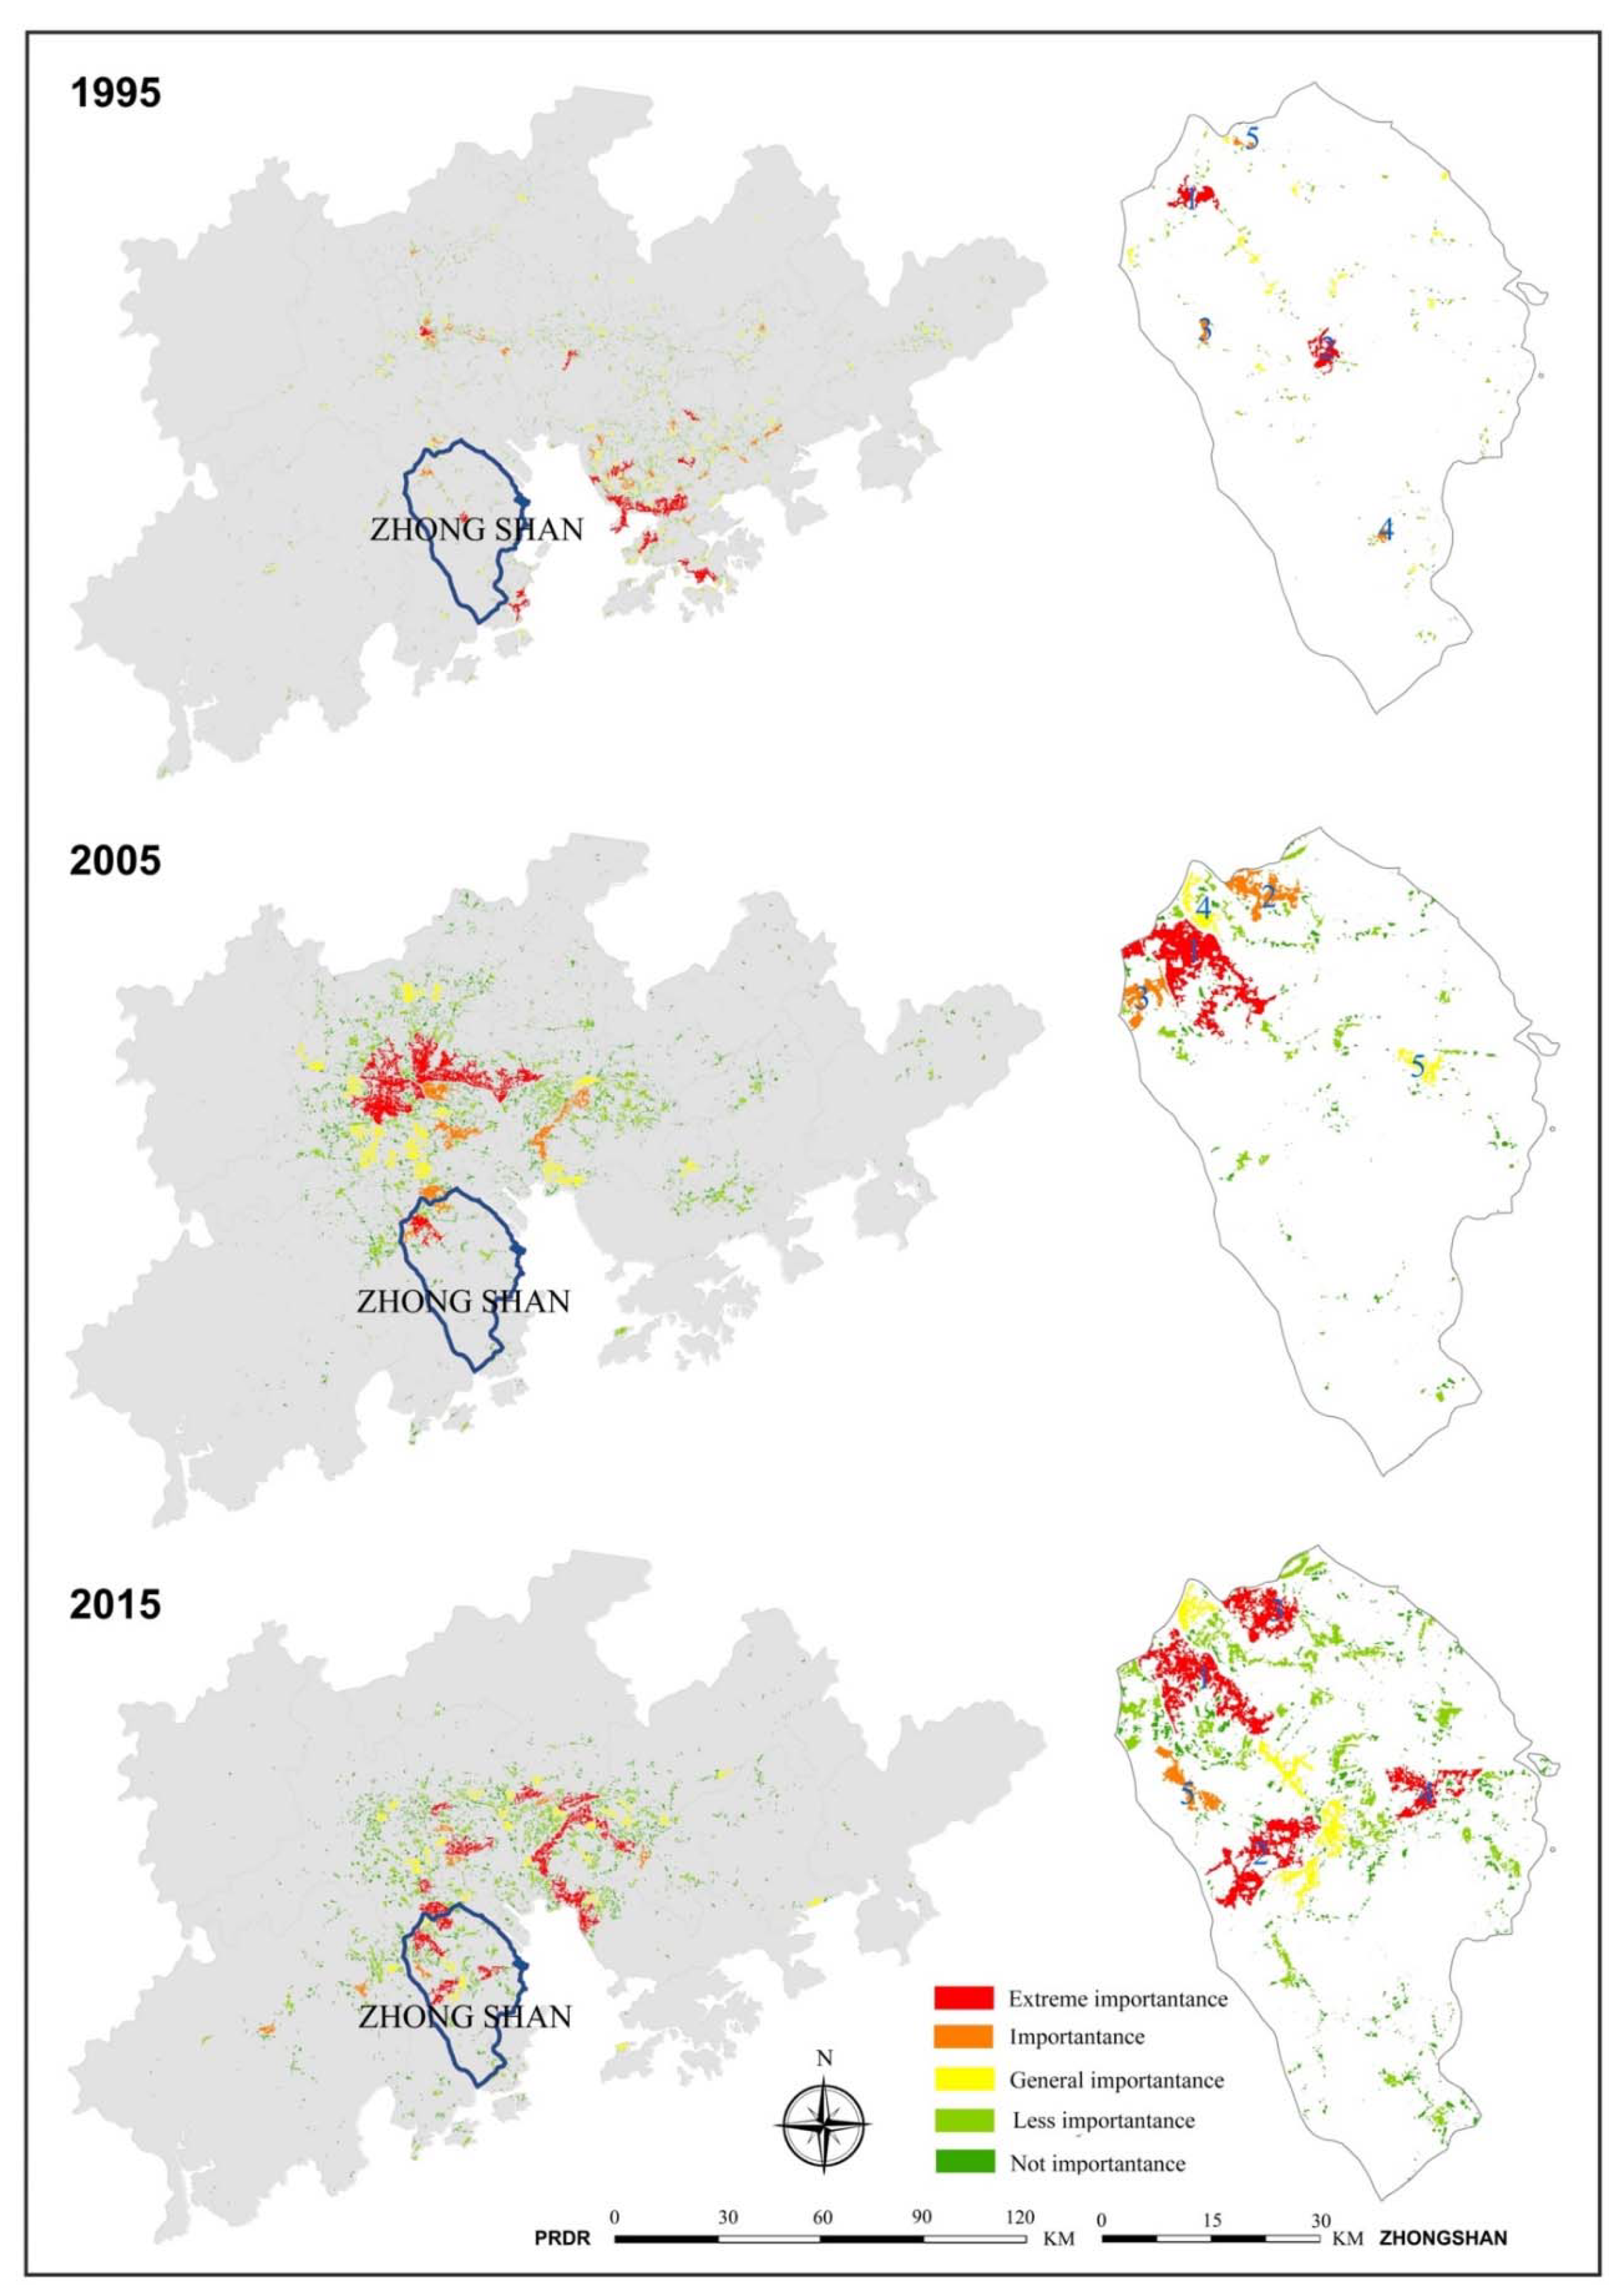
4.2. Results of Surface UHI Connectivity Analysis
5. Discussion
5.1. Theoretical and Practical Implications
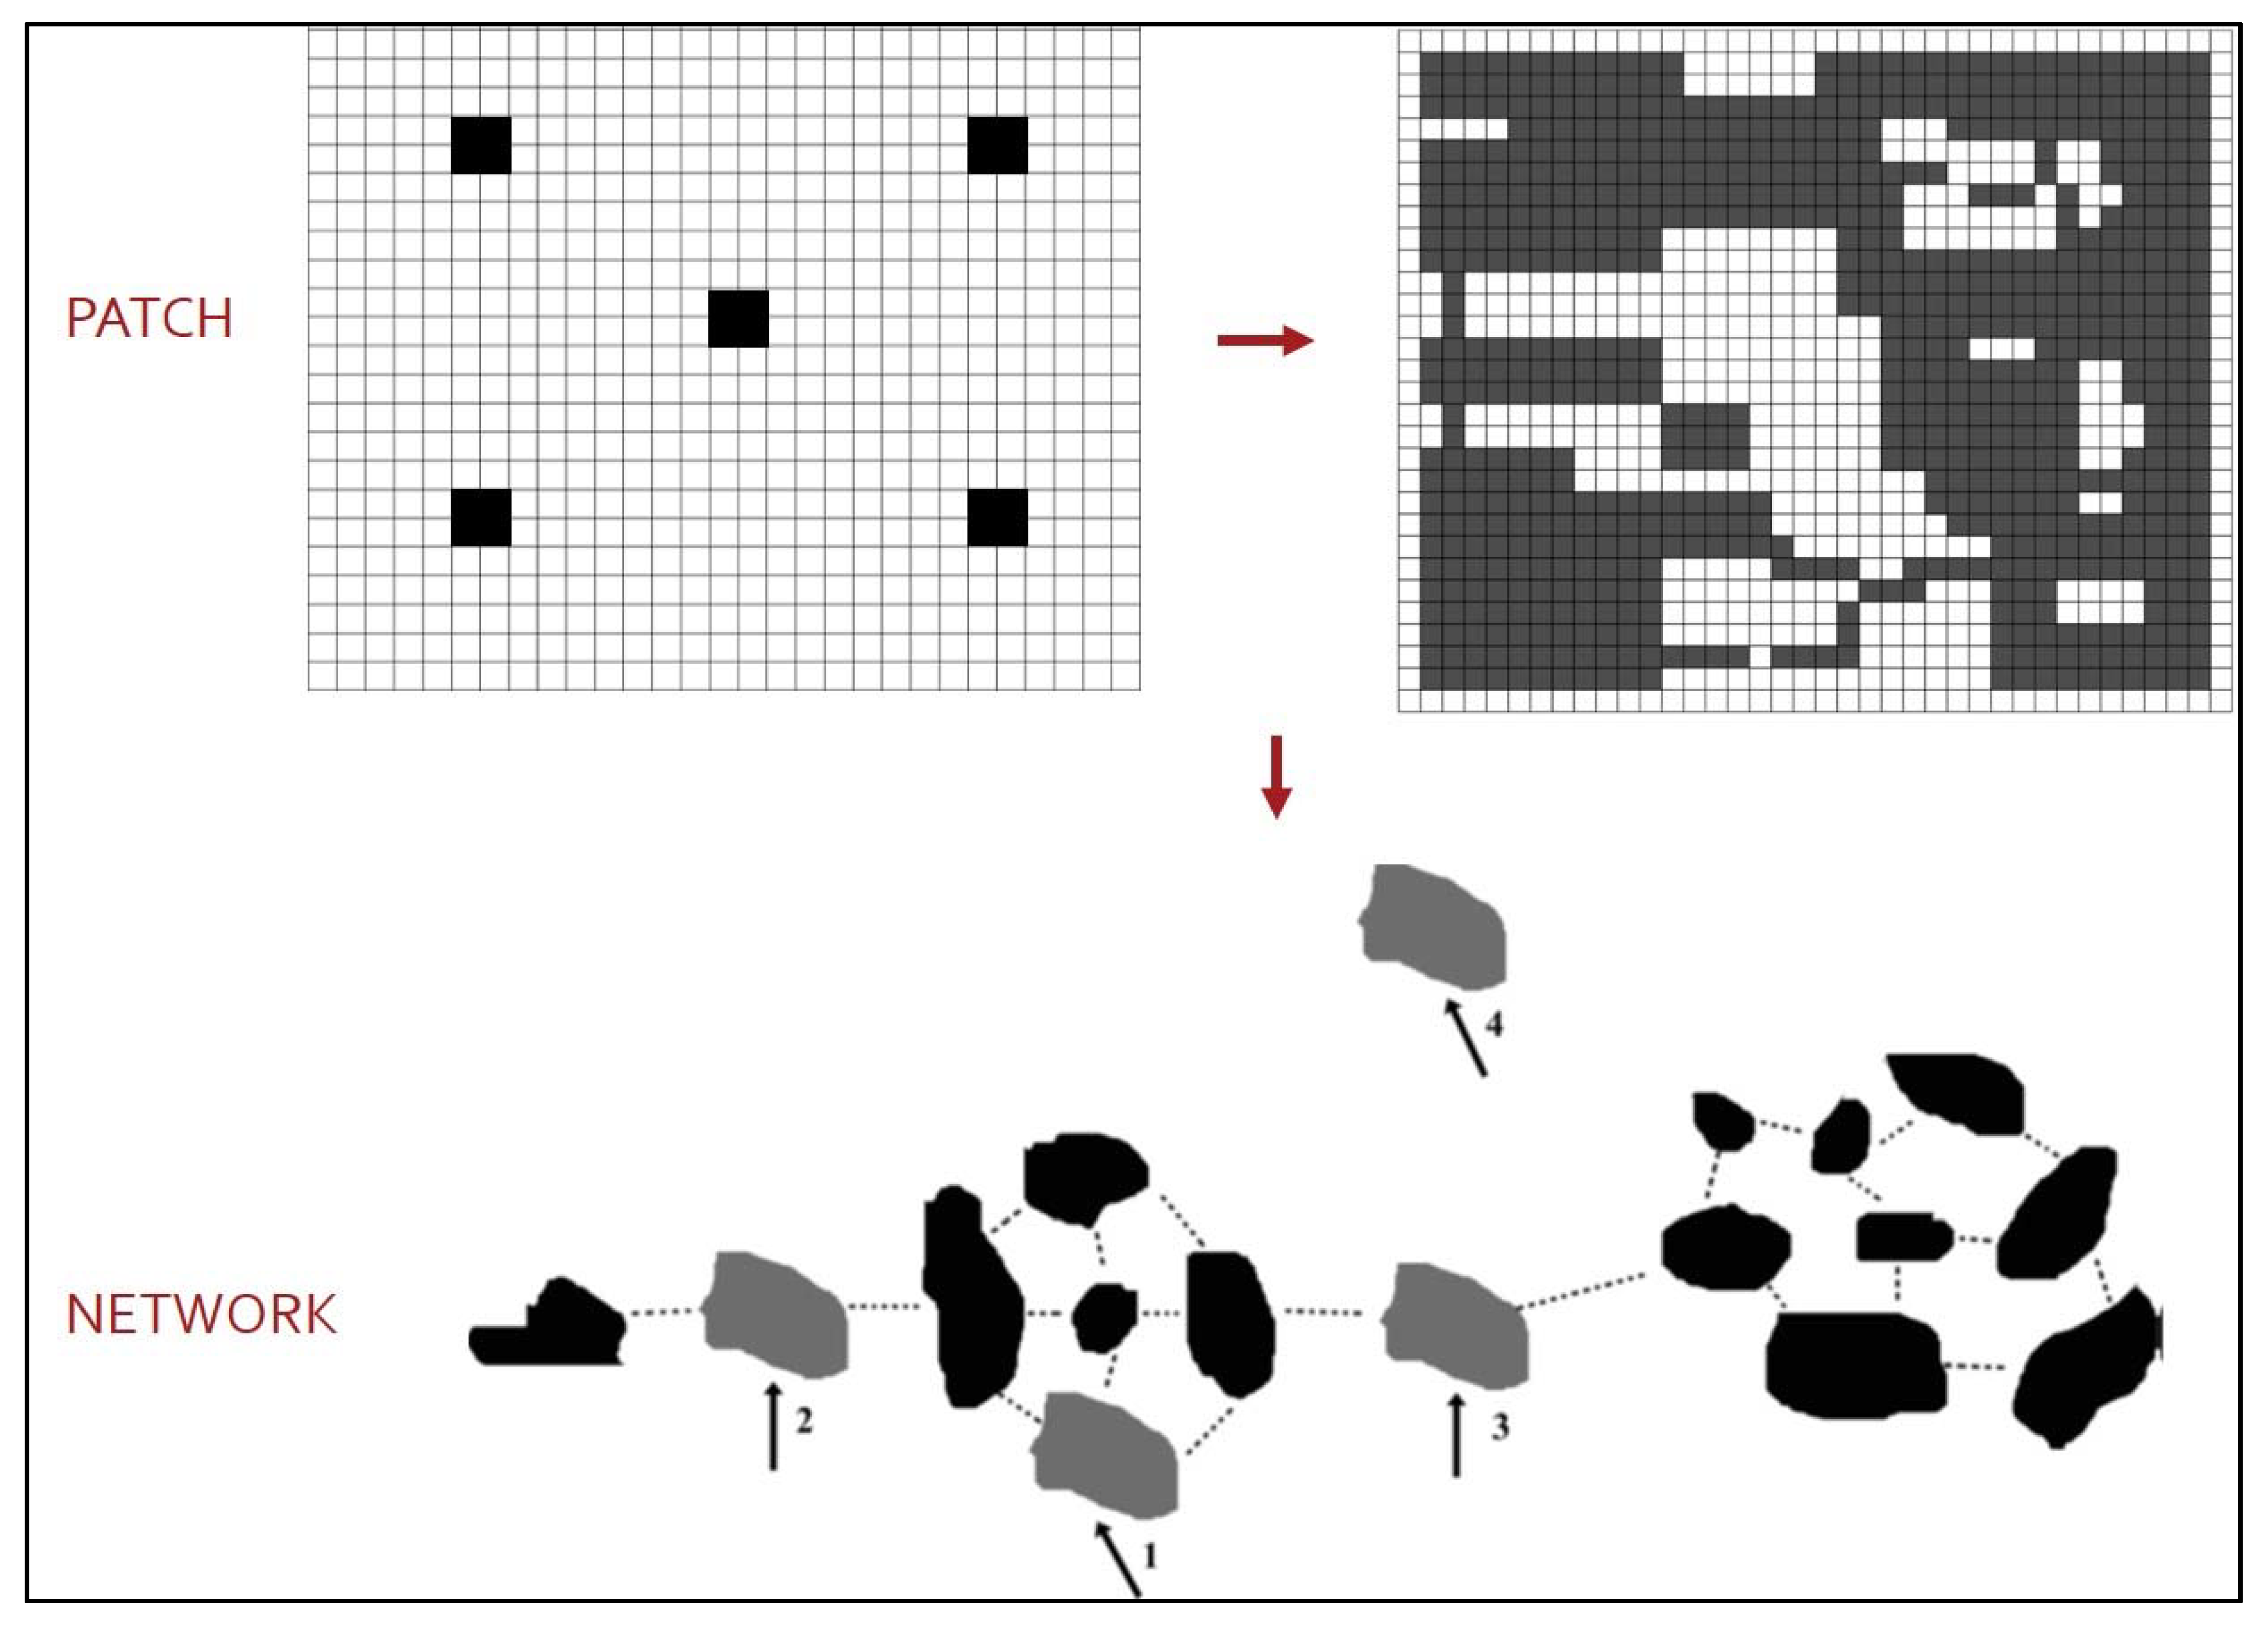
5.1.1. Theoretical Implication: From Patch to Network
5.1.2. Practical Implication: Regional Surface UHI Mitigation
5.2. Limitations and Further Study
6. Conclusions
Supplementary Materials
Author Contributions
Funding
Institutional Review Board Statement
Informed Consent Statement
Data Availability Statement
Acknowledgments
Conflicts of Interest
References
- Oke, T.; Mills, G.; Christen, A.; Voogt, J. Urban Climates; Cambridge University Press: Cambridge, UK, 2017. [Google Scholar]
- Akbari, H.; Kolokotsa, D. Three decades of urban heat islands and mitigation technologies research. Energy Build. 2016, 133, 834–842. [Google Scholar] [CrossRef]
- Yu, Z.; Guo, X.; Zeng, Y.; Koga, M.; Vejre, H. Variations in land surface temperature and cooling efficiency of green space in rapid urbanization: The case of Fuzhou city, China. Urban For. Urban Green. 2018, 29, 113–121. [Google Scholar] [CrossRef]
- Sun, R.; Wang, Y.; Chen, L. A distributed model for quantifying temporal-spatial patterns of anthropogenic heat based on energy consumption. J. Clean. Prod. 2018, 170, 601–609. [Google Scholar] [CrossRef]
- Hoag, H. How cities can beat the heat. Nat. Cell Biol. 2015, 524, 402–404. [Google Scholar] [CrossRef] [Green Version]
- Santamouris, M. Cooling the cities–A review of reflective and green roof mitigation technologies to fight heat island and improve comfort in urban environments. Sol. Energy 2014, 103, 682–703. [Google Scholar] [CrossRef]
- Fan, H.; Yu, Z.; Yang, G.; Liu, T.Y.; Liu, T.Y.; Hung, C.H.; Vejre, H. How to cool hot-humid (Asian) cities with urban trees? An optimal landscape size perspective. Agric. For. Meteorol. 2019, 265, 338–348. [Google Scholar] [CrossRef]
- Yang, G.; Yu, Z.; Jørgensen, G.; Vejre, H. How can urban blue-green space be planned for climate adaption in high-latitude cities? A seasonal perspective. Sustain. Cities Soc. 2020, 53, 101932. [Google Scholar] [CrossRef]
- Deilami, K.; Kamruzzaman, M.; Liu, Y. Urban heat island effect: A systematic review of spatio-temporal factors, data, methods, and mitigation measures. Int. J. Appl. Earth Obs. Geoinf. 2018, 67, 30–42. [Google Scholar] [CrossRef]
- Luan, X.; Yu, Z.; Zhang, Y.; Wei, S.; Miao, X.; Huang, Z.Y.X.; Teng, S.N.; Xu, C. Remote sensing and social sensing data reveal scale-dependent and system-specific strengths of urban Heat island determinants. Remote Sens. 2020, 12, 391. [Google Scholar] [CrossRef] [Green Version]
- Estoque, R.C.; Murayama, Y.; Myint, S.W. Effects of landscape composition and pattern on land surface temperature: An urban heat island study in the megacities of Southeast Asia. Sci. Total Environ. 2017, 577, 349–359. [Google Scholar] [CrossRef] [PubMed]
- Churkina, G.; Kuik, F.; Bonn, B.; Lauer, A.; Grote, R.; Tomiak, K.; Butler, T.M. Effect of VOC emissions from vegetation on air quality in Berlin during a heatwave. Environ. Sci. Technol. 2017, 51, 6120–6130. [Google Scholar] [CrossRef] [Green Version]
- Santamouris, M.; Kolokotsa, D. On the impact of urban overheating and extreme climatic conditions on housing, energy, comfort and environmental quality of vulnerable population in Europe. Energy Build. 2015, 98, 125–133. [Google Scholar] [CrossRef]
- Sun, Y.; Zhang, X.; Zwiers, F.W.; Song, L.; Wan, H.; Hu, T.; Yin, H.; Ren, G. Rapid increase in the risk of extreme summer heat in Eastern China. Nat. Clim. Chang. 2014, 4, 1082–1085. [Google Scholar] [CrossRef]
- Seto, K.C.; Güneralp, B.; Hutyra, L.R. Global forecasts of urban expansion to 2030 and direct impacts on biodiversity and carbon pools. Proc. Natl. Acad. Sci. USA 2012, 109, 16083–16088. [Google Scholar] [CrossRef] [PubMed] [Green Version]
- Ward, K.; Lauf, S.; Kleinschmit, B.; Endlicher, W. Heat waves and urban heat islands in Europe: A review of relevant drivers. Sci. Total Environ. 2016, 569, 527–539. [Google Scholar] [CrossRef] [PubMed]
- Zhou, D.; Zhao, S.; Zhang, L.; Sun, G.; Liu, Y. The footprint of urban heat island effect in China. Sci. Rep. 2015, 5, 11160. [Google Scholar] [CrossRef] [PubMed]
- Zhou, D.; Xiao, J.; Bonafoni, S.; Berger, C.; Deilami, K.; Zhou, Y.; Frolking, S.; Yao, R.; Qiao, Z.; Sobrino, J.A. Satellite remote sensing of surface urban Heat islands: Progress, challenges, and perspectives. Remote Sens. 2018, 11, 48. [Google Scholar] [CrossRef] [Green Version]
- Forman, R.T. Urban Ecology: Science of Cities; Cambridge University Press: Cambridge, UK, 2014. [Google Scholar]
- Stewart, I.D.; Oke, T.R. Local climate zones for urban temperature studies. Bull. Am. Meteorol. Soc. 2012, 93, 1879–1900. [Google Scholar] [CrossRef]
- Upmanis, H.; Eliasson, I.; Lindqvist, S. The influence of green areas on nocturnal temperatures in a high latitude city (Göteborg, Sweden). Int. J. Clim. 1998, 18, 681–700. [Google Scholar] [CrossRef]
- Sobstyl, J.M.; Emig, T.; Qomi, M.J.A.; Ulm, F.-J.; Pellenq, R.J.-M. Role of city texture in urban Heat islands at nighttime. Phys. Rev. Lett. 2018, 120, 108701. [Google Scholar] [CrossRef] [PubMed] [Green Version]
- Bechtel, B.; Alexander, P.J.; Böhner, J.; Ching, J.; Conrad, O.; Feddema, J.; Mills, G.; See, L.; Stewart, I. Mapping local climate zones for a worldwide database of the form and function of cities. ISPRS Int. J. GeoInfo. 2015, 4, 199–219. [Google Scholar] [CrossRef] [Green Version]
- Montgomery, M.R. The urban transformation of the developing world. Science 2008, 319, 761–764. [Google Scholar] [CrossRef] [PubMed] [Green Version]
- Yu, Z.; Yao, Y.; Yang, G.; Wang, X.; Vejre, H. Spatiotemporal patterns and characteristics of remotely sensed region heat islands during the rapid urbanization (1995–2015) of Southern China. Sci. Total Environ. 2019, 674, 242–254. [Google Scholar] [CrossRef] [PubMed]
- Zhou, W.; Huang, G.; Cadenasso, M.L. Does spatial configuration matter? Understanding the effects of land cover pattern on land surface temperature in urban landscapes. Landsc. Urban Plan. 2011, 102, 54–63. [Google Scholar] [CrossRef]
- Sun, R.; Xie, W.; Chen, L. A landscape connectivity model to quantify contributions of heat sources and sinks in urban regions. Landsc. Urban Plan. 2018, 178, 43–50. [Google Scholar] [CrossRef]
- Zhou, D.; Bonafoni, S.; Zhang, L.; Wang, R. Remote sensing of the urban heat island effect in a highly populated urban agglomeration area in East China. Sci. Total Environ. 2018, 628, 415–429. [Google Scholar] [CrossRef]
- Chen, L.; Sun, R.; Lu, Y. A conceptual model for a process-oriented landscape pattern analysis. Sci. China Earth Sci. 2019, 62, 2050–2057. [Google Scholar] [CrossRef]
- Zhou, W.; Wang, J.; Cadenasso, M.L. Effects of the spatial configuration of trees on urban heat mitigation: A comparative study. Remote Sens. Environ. 2017, 195, 1–12. [Google Scholar] [CrossRef]
- Santamouris, M.; Ban-Weiss, G.; Tan, Z.; Takebayashi, H.; Sailor, D.; Crank, P.; Taha, H.; Pisello, A.L.; Rossi, F.; Zhang, J.; et al. Progress in urban greenery mitigation science – assessment methodologies advanced technologies and impact on cities. J. Civ. Eng. Manag. 2018, 24, 638–671. [Google Scholar] [CrossRef] [Green Version]
- Zhang, Y.; Murray, A.T.; Turner, B. Optimizing green space locations to reduce daytime and nighttime urban heat island effects in Phoenix, Arizona. Landsc. Urban Plan. 2017, 165, 162–171. [Google Scholar] [CrossRef]
- Saura, S.; Pascual-Hortal, L. A new habitat availability index to integrate connectivity in landscape conservation planning: Comparison with existing indices and application to a case study. Landsc. Urban Plan. 2007, 83, 91–103. [Google Scholar] [CrossRef]
- Taylor, P.D.; Fahrig, L.; Henein, K.; Merriam, G. Connectivity is a vital element of landscape structure. Oikos 1993, 68, 571. [Google Scholar] [CrossRef] [Green Version]
- Fang, C.; Zhou, C.; Gu, C.; Chen, L.; Li, S. A proposal for the theoretical analysis of the interactive coupled effects between urbanization and the eco-environment in mega-urban agglomerations. J. Geogr. Sci. 2017, 27, 1431–1449. [Google Scholar] [CrossRef]
- Zeng, C.; Zhang, A.; Xu, S. Urbanization and administrative restructuring: A case study on the Wuhan urban agglomeration. Habitat Int. 2016, 55, 46–57. [Google Scholar] [CrossRef]
- Li, H.; Zhou, Y.; Li, X.; Meng, L.; Wang, X.; Wu, S.; Sodoudi, S. A new method to quantify surface urban heat island intensity. Sci. Total Environ. 2018, 624, 262–272. [Google Scholar] [CrossRef] [PubMed]
- Manoli, G.; Fatichi, S.; Schläpfer, M.; Yu, K.; Crowther, T.W.; Meili, N.; Burlando, P.; Katul, G.G.; Bou-Zeid, E. Magnitude of urban heat islands largely explained by climate and population. Nat. Cell Biol. 2019, 573, 55–60. [Google Scholar] [CrossRef]
- Yu, Z.; Xu, S.; Zhang, Y.; Jørgensen, G.; Vejre, H. Strong contributions of local background climate to the cooling effect of urban green vegetation. Sci. Rep. 2018, 8, 1–9. [Google Scholar] [CrossRef] [PubMed]
- Gao, J.; Yu, Z.; Wang, L.; Vejre, H. Suitability of regional development based on ecosystem service benefits and losses: A case study of the Yangtze River Delta urban agglomeration, China. Ecol. Indic. 2019, 107, 105579. [Google Scholar] [CrossRef]
- Soille, P.; Vogt, P. Morphological segmentation of binary patterns. Pattern Recognit. Lett. 2009, 30, 456–459. [Google Scholar] [CrossRef]
- Saura, S.; Vogt, P.; Velázquez, J.; Hernando, A.; Tejera, R. Key structural forest connectors can be identified by combining landscape spatial pattern and network analyses. For. Ecol. Manag. 2011, 262, 150–160. [Google Scholar] [CrossRef]
- Saura, S.; Torné, J. Conefor Sensinode 2.2: A software package for quantifying the importance of habitat patches for landscape connectivity. Environ. Model. Softw. 2009, 24, 135–139. [Google Scholar] [CrossRef]
- Carlier, J.; Moran, J. Landscape typology and ecological connectivity assessment to inform Greenway design. Sci. Total Environ. 2019, 651, 3241–3252. [Google Scholar] [CrossRef]
- Vogt, P.; Riitters, K.H.; Estreguil, C.; Kozak, J.; Wade, T.G.; Wickham, J.D. Mapping spatial patterns with morphological image processing. Landsc. Ecol. 2007, 22, 171–177. [Google Scholar] [CrossRef]
- Wickham, J.D.; Riitters, K.H.; Wade, T.G.; Vogt, P. A national assessment of green infrastructure and change for the conterminous United States using morphological image processing. Landsc. Urban Plan. 2010, 94, 186–195. [Google Scholar] [CrossRef]
- Shi, X.; Qin, M. Research on the optimization of regional green infrastructure network. Sustain. J. Rec. 2018, 10, 4649. [Google Scholar] [CrossRef] [Green Version]
- Pascual-Hortal, L.; Saura, S. Integrating landscape connectivity in broad-scale forest planning through a new graph-based habitat availability methodology: Application to capercaillie (Tetrao urogallus) in Catalonia (NE Spain). Eur. J. For. Res. 2007, 127, 23–31. [Google Scholar] [CrossRef]
- Pascual-Hortal, L.; Saura, S. Comparison and development of new graph-based landscape connectivity indices: Towards the priorization of habitat patches and corridors for conservation. Landsc. Ecol. 2006, 21, 959–967. [Google Scholar] [CrossRef]
- Yu, W.; Zhou, W. The spatiotemporal pattern of urban expansion in China: A comparison study of three urban megaregions. Remote Sens. 2017, 9, 45. [Google Scholar] [CrossRef] [Green Version]
- Yu, Z.; Yao, Y.; Yang, G.; Wang, X.; Vejre, H. Strong contribution of rapid urbanization and urban agglomeration development to regional thermal environment dynamics and evolution. For. Ecol. Manag. 2019, 446, 214–225. [Google Scholar] [CrossRef]
- Xiong, Y.; Huang, S.; Chen, F.; Ye, H.; Wang, C.; Zhu, C. The impacts of rapid urbanization on the thermal environment: A remote sensing study of Guangzhou, South China. Remote Sens. 2012, 4, 2033–2056. [Google Scholar] [CrossRef] [Green Version]
- Yu, X.; Guo, X.; Wu, Z. Land surface temperature retrieval from landsat 8 TIRS-comparison between radiative transfer equation-based method, split window algorithm and single channel method. Remote Sens. 2014, 6, 9829–9852. [Google Scholar] [CrossRef] [Green Version]
- Jiménez-Muñoz, J.C.; Sobrino, J.A.; Skoković, D.; Mattar, C.; Cristóbal, J.J.I.G.; Letters, R.S. Land surface temperature retrieval methods from landsat-8 thermal infrared sensor data. IEEE Geosci. Remote Sens. Lett. 2014, 11, 1840–1843. [Google Scholar] [CrossRef]
- Sun, R.; Chen, L. Effects of green space dynamics on urban heat islands: Mitigation and diversification. Ecosyst. Serv. 2017, 23, 38–46. [Google Scholar] [CrossRef]
- Gorelick, N.; Hancher, M.; Dixon, M.; Ilyushchenko, S.; Thau, D.; Moore, R. Google Earth Engine: Planetary-scale geospatial analysis for everyone. Remote Sens. Environ 2017, 202, 18–27. [Google Scholar] [CrossRef]
- Liu, J.; Zhang, Z.; Xu, X.; Kuang, W.; Zhou, W.; Zhang, S.; Li, R.; Yan, C.; Yu, D.; Wu, S.; et al. Spatial patterns and driving forces of land use change in China during the early 21st century. J. Geogr. Sci. 2010, 20, 483–494. [Google Scholar] [CrossRef]
- Yu, Z.; Yang, G.; Zuo, S.; Jørgensen, G.; Koga, M.; Vejre, H. Critical review on the cooling effect of urban blue-green space: A threshold-size perspective. Urban For. Urban Green. 2020, 49, 126630. [Google Scholar] [CrossRef]
- Peng, J.; Xie, P.; Liu, Y.; Ma, J. Urban thermal environment dynamics and associated landscape pattern factors: A case study in the Beijing metropolitan region. Remote Sens. Environ. 2016, 173, 145–155. [Google Scholar] [CrossRef]
- Peng, J.; Yang, Y.; Liu, Y.; Hu, Y.; Du, Y.; Meersmans, J.; Qiu, S. Linking ecosystem services and circuit theory to identify ecological security patterns. Sci. Total Environ. 2018, 644, 781–790. [Google Scholar] [CrossRef] [PubMed] [Green Version]
- Yu, Z.; Chen, T.; Yang, G.; Sun, R.; Xie, W.; Vejre, H. Quantifying seasonal and diurnal contributions of urban landscapes to heat energy dynamics. Appl. Energy 2020, 264, 114724. [Google Scholar] [CrossRef]


| Class | Definition | Meaning in Surface UHI Context |
|---|---|---|
| Core | Foreground pixels surrounded on all sides by foreground pixels and greater than the specified edge width distance from the background. | Core is defined as those UHI pixels whose distance to the non-UHI areas is greater than the given edge width. |
| Bridge | Foreground pixels that connect two or more disjunct areas of the core. | Bridge defined as sets of contiguous non-core UHI pixels that connect at least two different core areas at their ends. They correspond to structural connectors or corridors that link different UHI core areas. |
| Islet | Foreground pixels that do not contain a core. The islet is the only unconnected class. | Islet defined as the isolated UHI patches that are too small to contain core pixels. |
| Loop | Foreground pixels that connect an area of the core to itself. | Loop similar to bridges but with the ends of the element connecting to different parts of the same core (UHI) area. |
| Edge | Pixels that form the transition zone between the foreground and background. | Edge defined a set of UHI pixels whose distance to the patch edge is lower than or equal to the given edge width and corresponds to the outer boundary of a core area. |
| Perforation | Pixels that form the transition zone between the foreground and background for the interior regions of the foreground. The pixels forming the inner edge would be classified as perforations, whereas those forming the outer edge would be classified as the edge. | Perforation similar to the edge but corresponding to the inner boundary of a core (UHI) area. |
| Branch | Foreground pixels that extend from an area of the core, but do not connect to another area of the core. | Branch defined as the pixels that do not correspond to any of the previous six categories. It typically corresponds to an elongated set of consecutive UHI pixels that emanate from a UHI area and that do not reach any other UHI area at the other end. |
| 1995 | 2005 | 2015 | ||||||||
|---|---|---|---|---|---|---|---|---|---|---|
| Types | RLST Class | Area (km2) | Accounting for the Total Area of UHI Patches (%) | Accounting for the Total Area (%) | Area (km2) | Accounting for the Total Area of UHI Patches (%) | Accounting for the Total Area (%) | Area (km2) | Accounting for the Total Area of UHI Patches (%) | Accounting for the Total Area (%) |
| Branch | 4 < RLST ≤ 6 | 335.38 | 6.70 | 0.81 | 359.06 | 5.56 | 0.871 | 618.91 | 8.48 | 1.50 |
| 6 < RLST ≤ 8 | 207.87 | 4.15 | 0.50 | 234.56 | 3.63 | 0.569 | 395.52 | 5.42 | 0.96 | |
| >8 | 39.05 | 0.78 | 0.10 | 43.94 | 0.68 | 0.107 | 146.11 | 2.00 | 0.36 | |
| Bridge | 4 < RLST ≤ 6 | 249.99 | 4.99 | 0.61 | 296.18 | 4.59 | 0.719 | 512.84 | 7.02 | 1.24 |
| 6 < RLST ≤ 8 | 268.07 | 5.36 | 0.65 | 363.57 | 5.63 | 0.882 | 288.65 | 3.95 | 0.70 | |
| >8 | 6.46 | 0.13 | 0.02 | 9.21 | 0.14 | 0.022 | 43.25 | 0.59 | 0.11 | |
| Core | 4 < RLST ≤ 6 | 307.24 | 6.14 | 0.75 | 271.06 | 4.20 | 0.658 | 356.54 | 4.88 | 0.87 |
| 6 < RLST ≤ 8 | 535.42 | 10.70 | 1.20 | 590.76 | 9.15 | 1.434 | 168.97 | 2.31 | 0.41 | |
| >8 | 739.40 | 14.77 | 1.79 | 1876.44 | 29.07 | 4.553 | 1640.95 | 22.47 | 3.98 | |
| Edge | 4 < RLST ≤ 6 | 460.70 | 9.20 | 1.12 | 423.63 | 6.56 | 1.028 | 608.05 | 8.33 | 1.48 |
| 6 < RLST ≤ 8 | 653.82 | 13.06 | 1.59 | 703.27 | 10.89 | 1.707 | 314.61 | 4.31 | 0.76 | |
| >8 | 376.02 | 7.51 | 0.91 | 548.58 | 8.50 | 1.331 | 716.72 | 9.82 | 1.74 | |
| Islet | 4 < RLST ≤ 6 | 451.47 | 9.02 | 1.10 | 370.65 | 5.74 | 0.899 | 573.53 | 7.85 | 1.39 |
| 6 < RLST ≤ 8 | 151.49 | 3.03 | 0.37 | 105.65 | 1.64 | 0.256 | 517.09 | 7.08 | 1.26 | |
| >8 | 31.19 | 0.63 | 0.08 | 29.13 | 0.45 | 0.071 | 99.44 | 1.36 | 0.24 | |
| Loop | 4 < RLST ≤ 6 | 93.33 | 1.86 | 0.23 | 87.22 | 1.35 | 0.212 | 125.89 | 1.72 | 0.31 |
| 6 < RLST ≤ 8 | 72.76 | 1.45 | 0.18 | 68.34 | 1.06 | 0.166 | 84.77 | 1.16 | 0.21 | |
| >8 | 1.46 | 0.03 | 0.00 | 3.12 | 0.05 | 0.008 | 19.34 | 0.26 | 0.05 | |
| Perforation | 4 < RLST ≤ 6 | 2.12 | 0.04 | 0.01 | 1.79 | 0.03 | 0.004 | 1.20 | 0.03 | 0.00 |
| 6 < RLST ≤ 8 | 6.16 | 0.12 | 0.02 | 6.82 | 0.10 | 0.017 | 0.29 | 0.01 | 0.00 | |
| >8 | 16.36 | 0.33 | 0.04 | 62.99 | 0.98 | 0.153 | 69.16 | 0.95 | 0.17 | |
| 1995 | 2005 | 2015 | |||||||
|---|---|---|---|---|---|---|---|---|---|
| Number | dA | dIIC | dPC | dA | dIIC | dPC | dA | dIIC | dPC |
| 1 | 16.93 | 35.91 | 37.41 | 14.26 | 29.57 | 29.94 | 5.11 | 10.66 | 11.28 |
| 2 | 4.11 | 8.10 | 7.92 | 13.33 | 27.04 | 27.65 | 3.03 | 6.40 | 6.56 |
| 3 | 2.86 | 6.02 | 6.60 | 2.93 | 6.20 | 6.64 | 2.66 | 5.84 | 6.02 |
| 4 | 2.24 | 3.64 | 3.47 | 2.86 | 5.32 | 5.18 | 2.31 | 4.63 | 4.84 |
| 5 | 1.47 | 2.28 | 2.02 | 2.29 | 4.83 | 5.39 | 2.15 | 4.51 | 4.78 |
| 6 | 1.38 | 2.59 | 2.56 | 2.07 | 3.96 | 4.06 | 1.93 | 3.92 | 3.91 |
| 7 | 1.30 | 2.79 | 3.05 | 1.92 | 3.55 | 3.54 | 1.77 | 3.38 | 3.30 |
| 8 | 1.23 | 2.67 | 3.01 | 1.83 | 3.71 | 3.74 | 1.65 | 3.34 | 3.42 |
| 9 | 1.22 | 2.63 | 2.96 | 1.36 | 2.53 | 2.48 | 1.41 | 2.93 | 3.02 |
| 10 | 1.09 | 1.85 | 1.79 | 1.22 | 2.48 | 2.62 | 1.31 | 2.75 | 2.91 |
| 11 | 1.08 | 1.82 | 1.70 | 1.10 | 2.10 | 2.02 | 1.12 | 2.196 | 2.22 |
| 12 | 1.02 | 2.15 | 2.19 | 1.10 | 1.91 | 1.88 | 0.97 | 1.97 | 1.98 |
| 13 | 0.97 | 2.05 | 2.26 | 1.10 | 2.19 | 2.25 | 0.87 | 1.73 | 1.81 |
| 14 | 0.92 | 1.86 | 1.95 | 1.10 | 1.91 | 1.88 | 0.74 | 1.50 | 1.55 |
| 15 | 0.80 | 1.40 | 1.40 | 1.08 | 2.12 | 2.23 | 0.73 | 1.51 | 1.63 |
| 16 | 0.78 | 1.66 | 1.78 | 0.91 | 1.90 | 2.09 | 0.70 | 1.28 | 1.16 |
| 17 | 0.68 | 1.18 | 1.07 | 0.91 | 1.82 | 1.96 | 0.66 | 1.43 | 1.51 |
| 18 | 0.68 | 1.48 | 1.54 | 0.90 | 1.65 | 1.62 | 0.64 | 1.26 | 1.28 |
| 19 | 0.65 | 0.99 | 0.89 | 0.86 | 1.72 | 1.70 | 0.61 | 0.91 | 0.68 |
| 20 | 0.64 | 1.16 | 1.08 | 0.75 | 1.50 | 1.56 | 0.61 | 1.19 | 1.14 |
| 1995 | 2005 | 2015 | |||||||
|---|---|---|---|---|---|---|---|---|---|
| Number | dA | dIIC | dPC | dA | dIIC | dPC | dA | dIIC | dPC |
| 1 | 18.21 | 38.64 | 41.36 | 39.33 | 78.79 | 81.71 | 18.21 | 38.64 | 41.36 |
| 2 | 9.68 | 23.89 | 22.60 | 11.83 | 14.21 | 10.96 | 9.68 | 23.89 | 22.60 |
| 3 | 9.05 | 28.05 | 22.05 | 7.64 | 7.59 | 6.56 | 9.05 | 28.05 | 22.05 |
| 4 | 4.91 | 2.88 | 4.07 | 4.37 | 2.26 | 1.27 | 4.91 | 2.88 | 4.07 |
| 5 | 3.46 | 2.33 | 2.38 | 2.90 | 2.51 | 4.48 | 3.46 | 2.33 | 2.38 |
| 6 | 2.63 | 4.52 | 2.86 | 2.17 | 1.71 | 1.68 | 2.63 | 4.52 | 2.86 |
| 7 | 1.97 | 6.20 | 2.40 | 1.11 | 1.03 | 0.83 | 1.9 | 6.20 | 2.40 |
| 8 | 1.80 | 2.22 | 1.26 | 1.09 | 0.10 | 0.12 | 1.80 | 2.22 | 1.26 |
| 9 | 1.64 | 3.13 | 2.38 | 1.08 | 1.01 | 0.41 | 1.64 | 3.13 | 2.38 |
| 10 | 1.41 | 0.35 | 0.71 | 1.04 | 0.85 | 0.42 | 1.41 | 0.35 | 0.71 |
Publisher’s Note: MDPI stays neutral with regard to jurisdictional claims in published maps and institutional affiliations. |
© 2021 by the authors. Licensee MDPI, Basel, Switzerland. This article is an open access article distributed under the terms and conditions of the Creative Commons Attribution (CC BY) license (http://creativecommons.org/licenses/by/4.0/).
Share and Cite
Yu, Z.; Zhang, J.; Yang, G.; Schlaberg, J. Reverse Thinking: A New Method from the Graph Perspective for Evaluating and Mitigating Regional Surface Heat Islands. Remote Sens. 2021, 13, 1127. https://0-doi-org.brum.beds.ac.uk/10.3390/rs13061127
Yu Z, Zhang J, Yang G, Schlaberg J. Reverse Thinking: A New Method from the Graph Perspective for Evaluating and Mitigating Regional Surface Heat Islands. Remote Sensing. 2021; 13(6):1127. https://0-doi-org.brum.beds.ac.uk/10.3390/rs13061127
Chicago/Turabian StyleYu, Zhaowu, Jinguang Zhang, Gaoyuan Yang, and Juliana Schlaberg. 2021. "Reverse Thinking: A New Method from the Graph Perspective for Evaluating and Mitigating Regional Surface Heat Islands" Remote Sensing 13, no. 6: 1127. https://0-doi-org.brum.beds.ac.uk/10.3390/rs13061127