
Mapping the Dynamics of Winter Wheat in the North China Plain from Dense Landsat Time Series (1999 to 2019)

 , , and
Abstract
:
1. Introduction
2. Materials and Methods
2.1. Materials
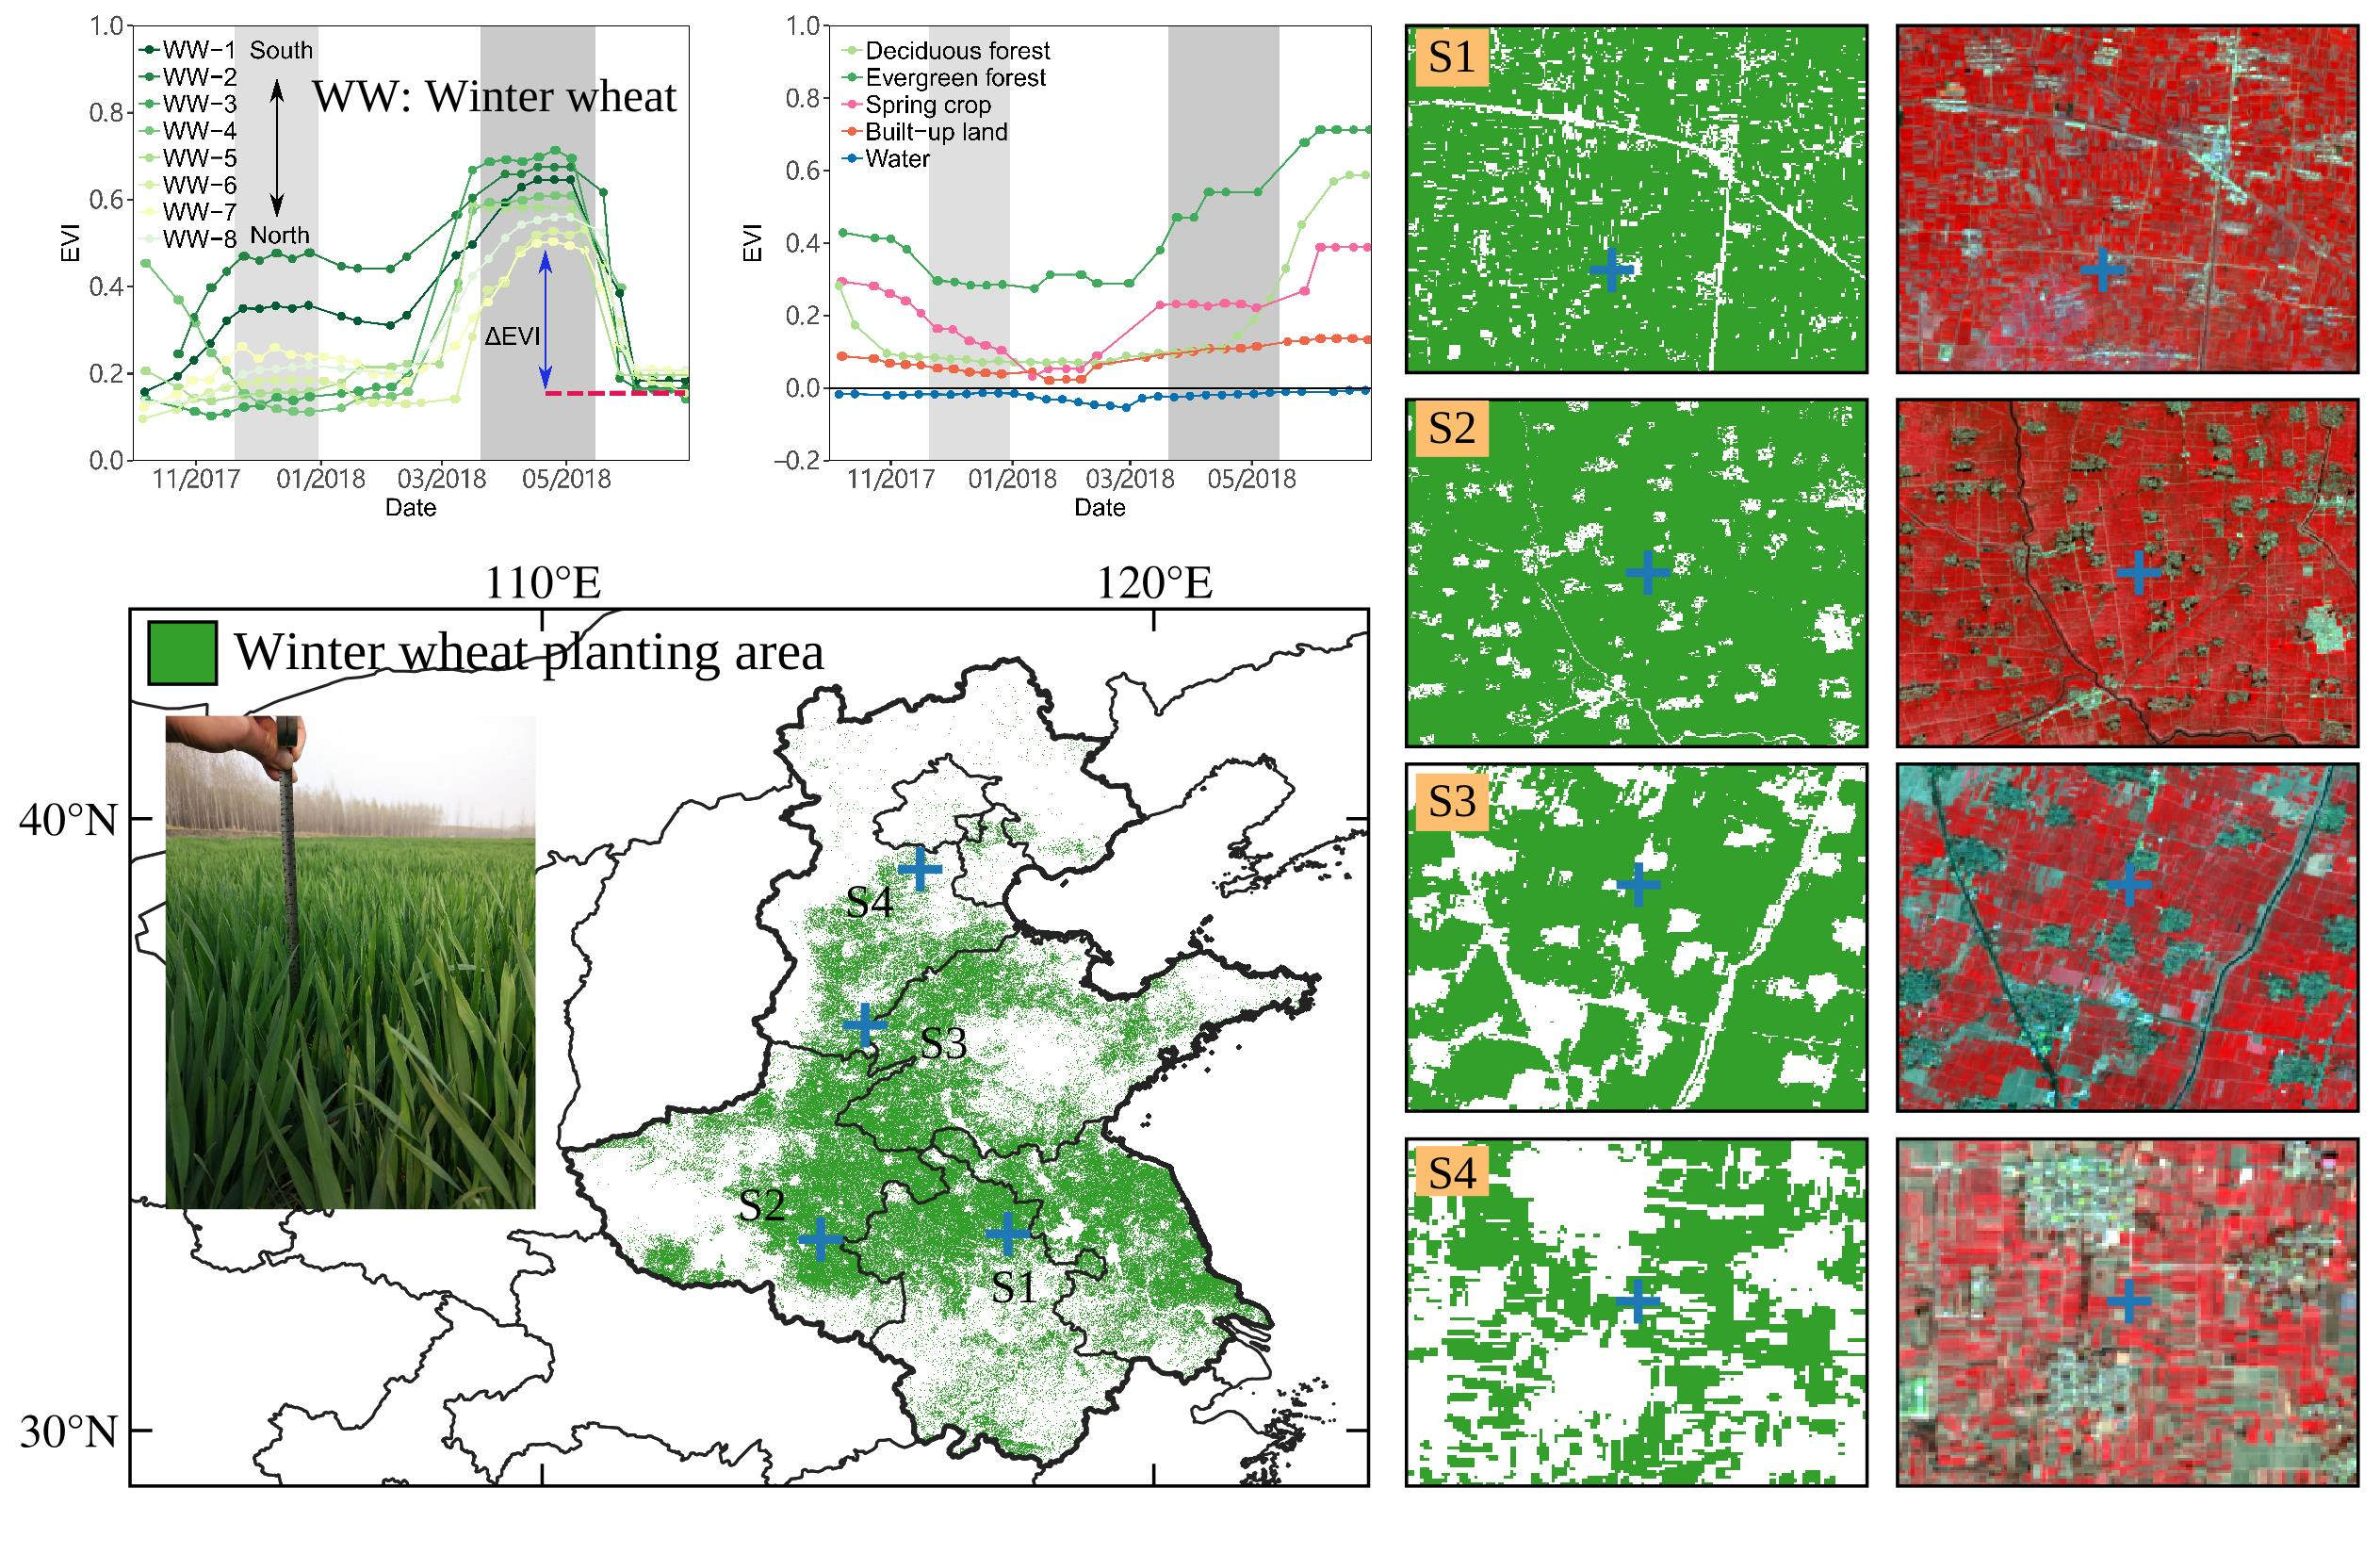
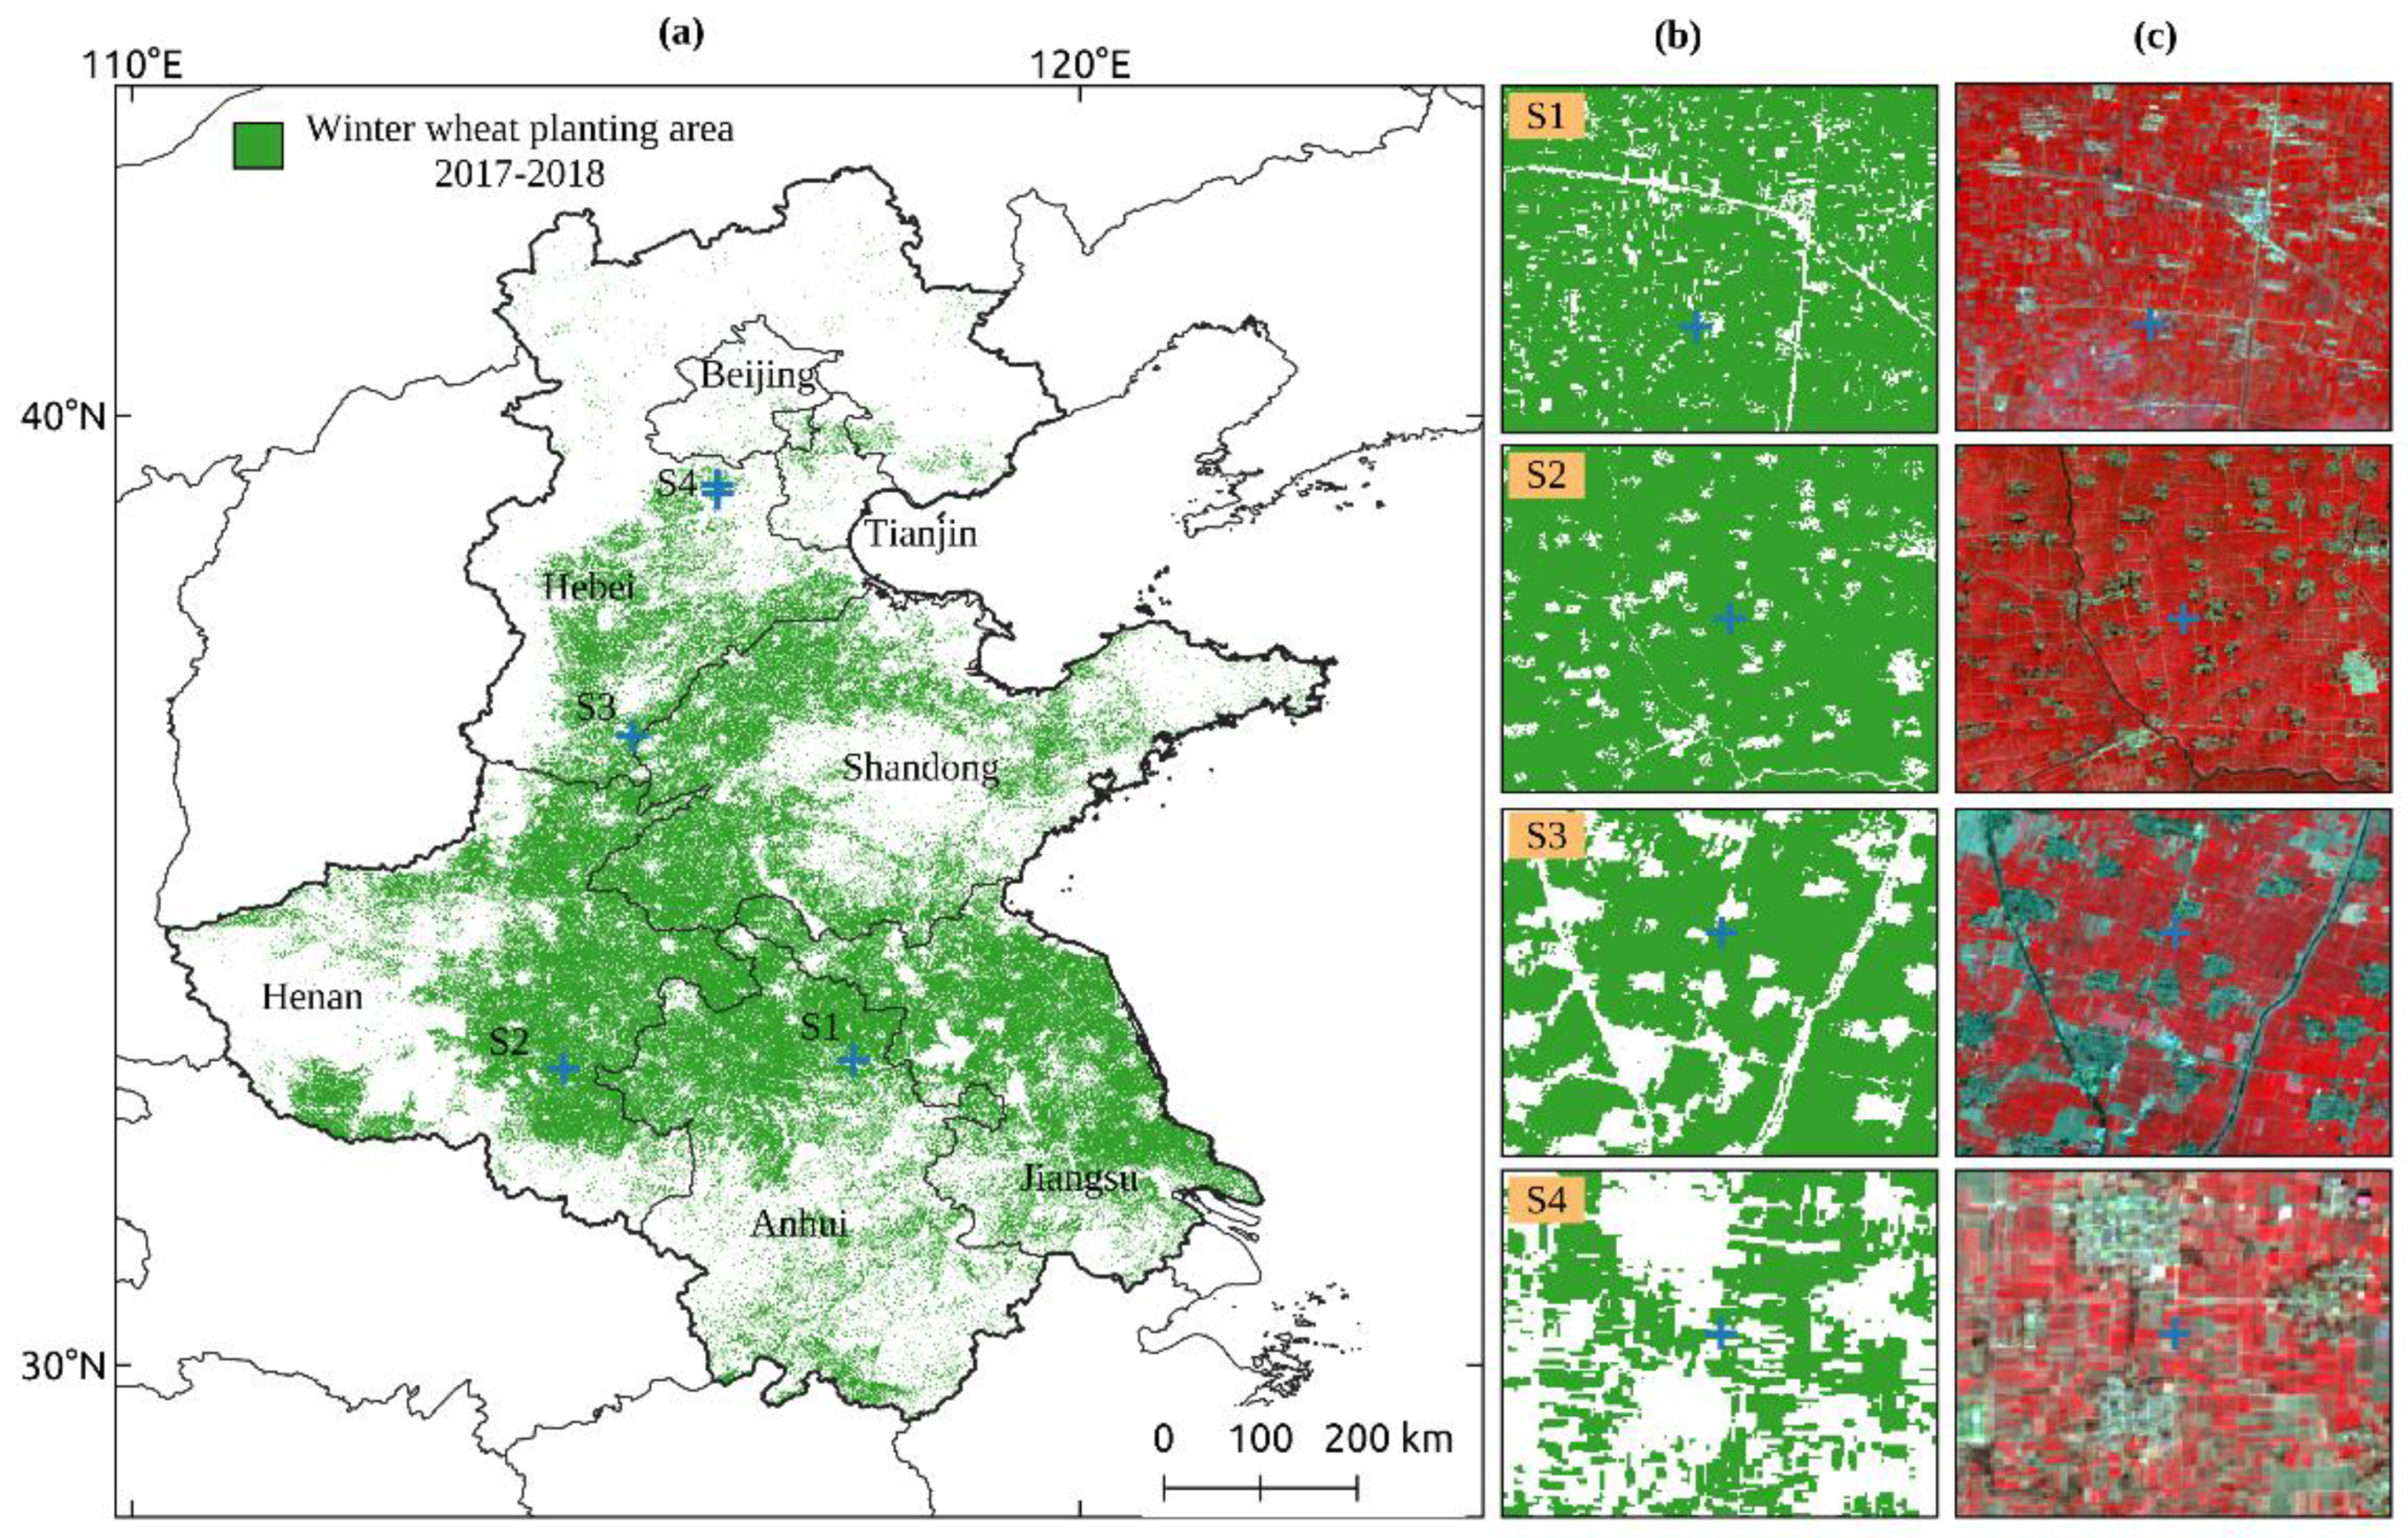
2.1.1. Study Area
2.1.2. Landsat Data Processing
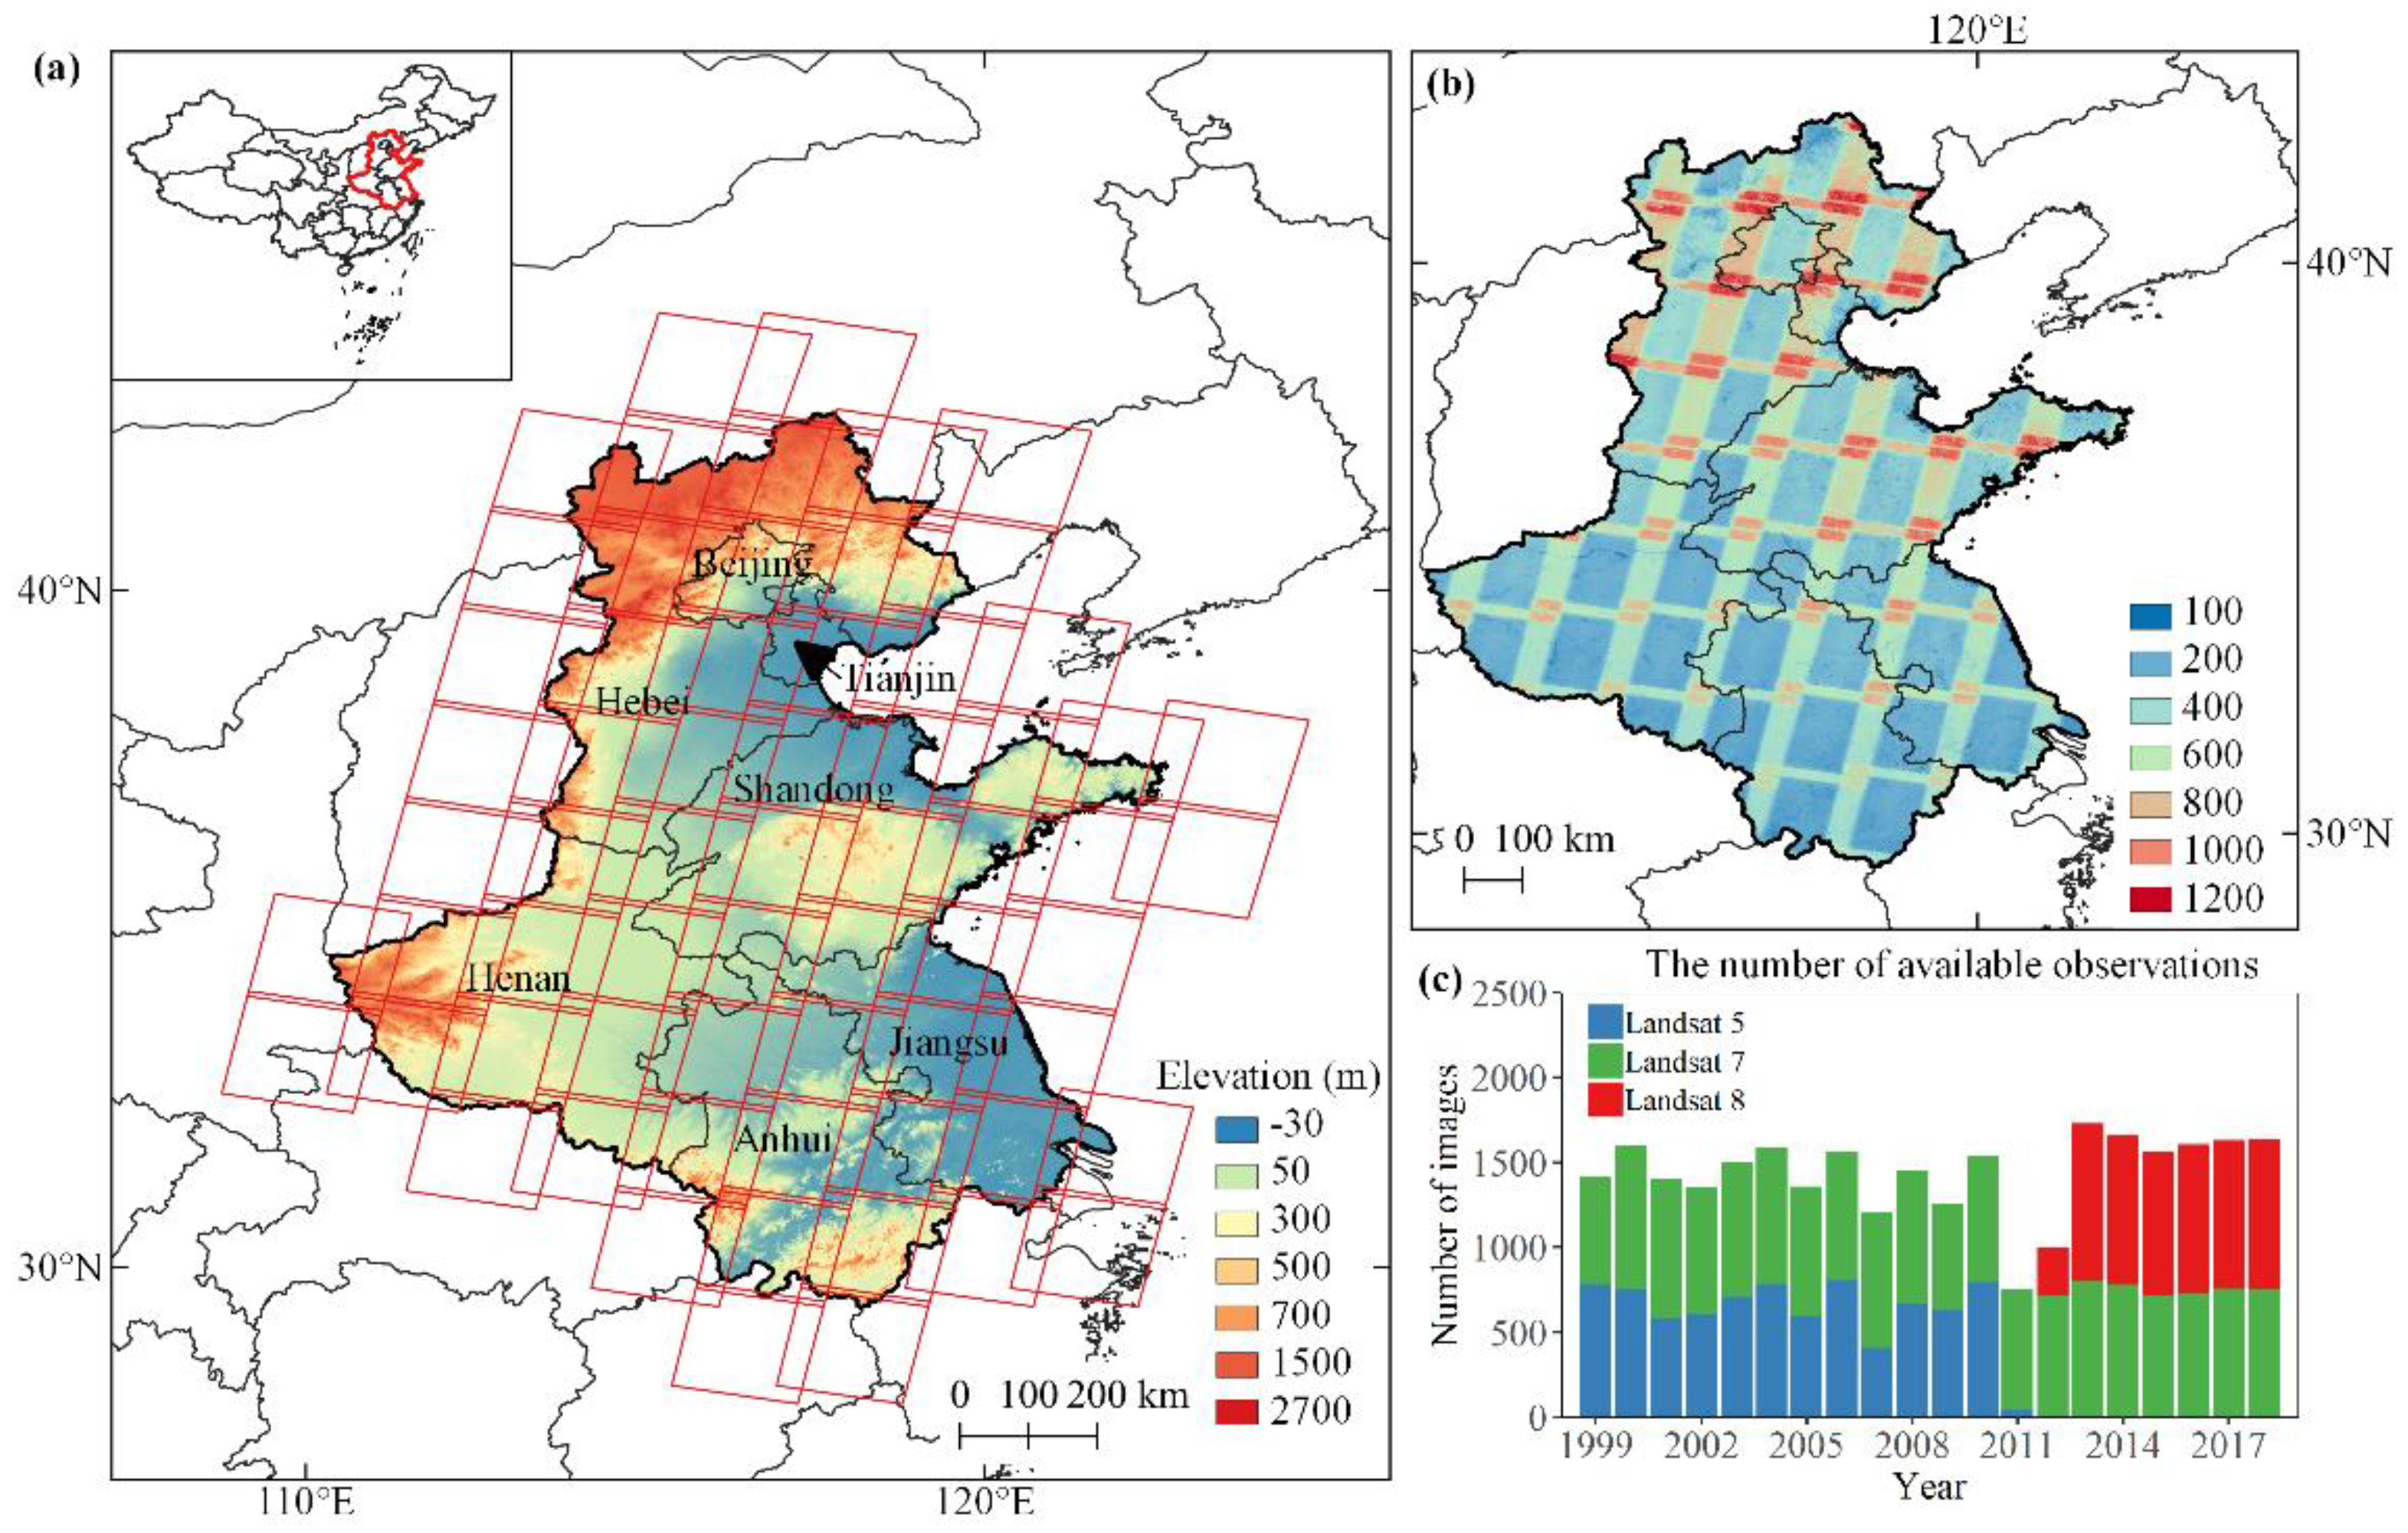
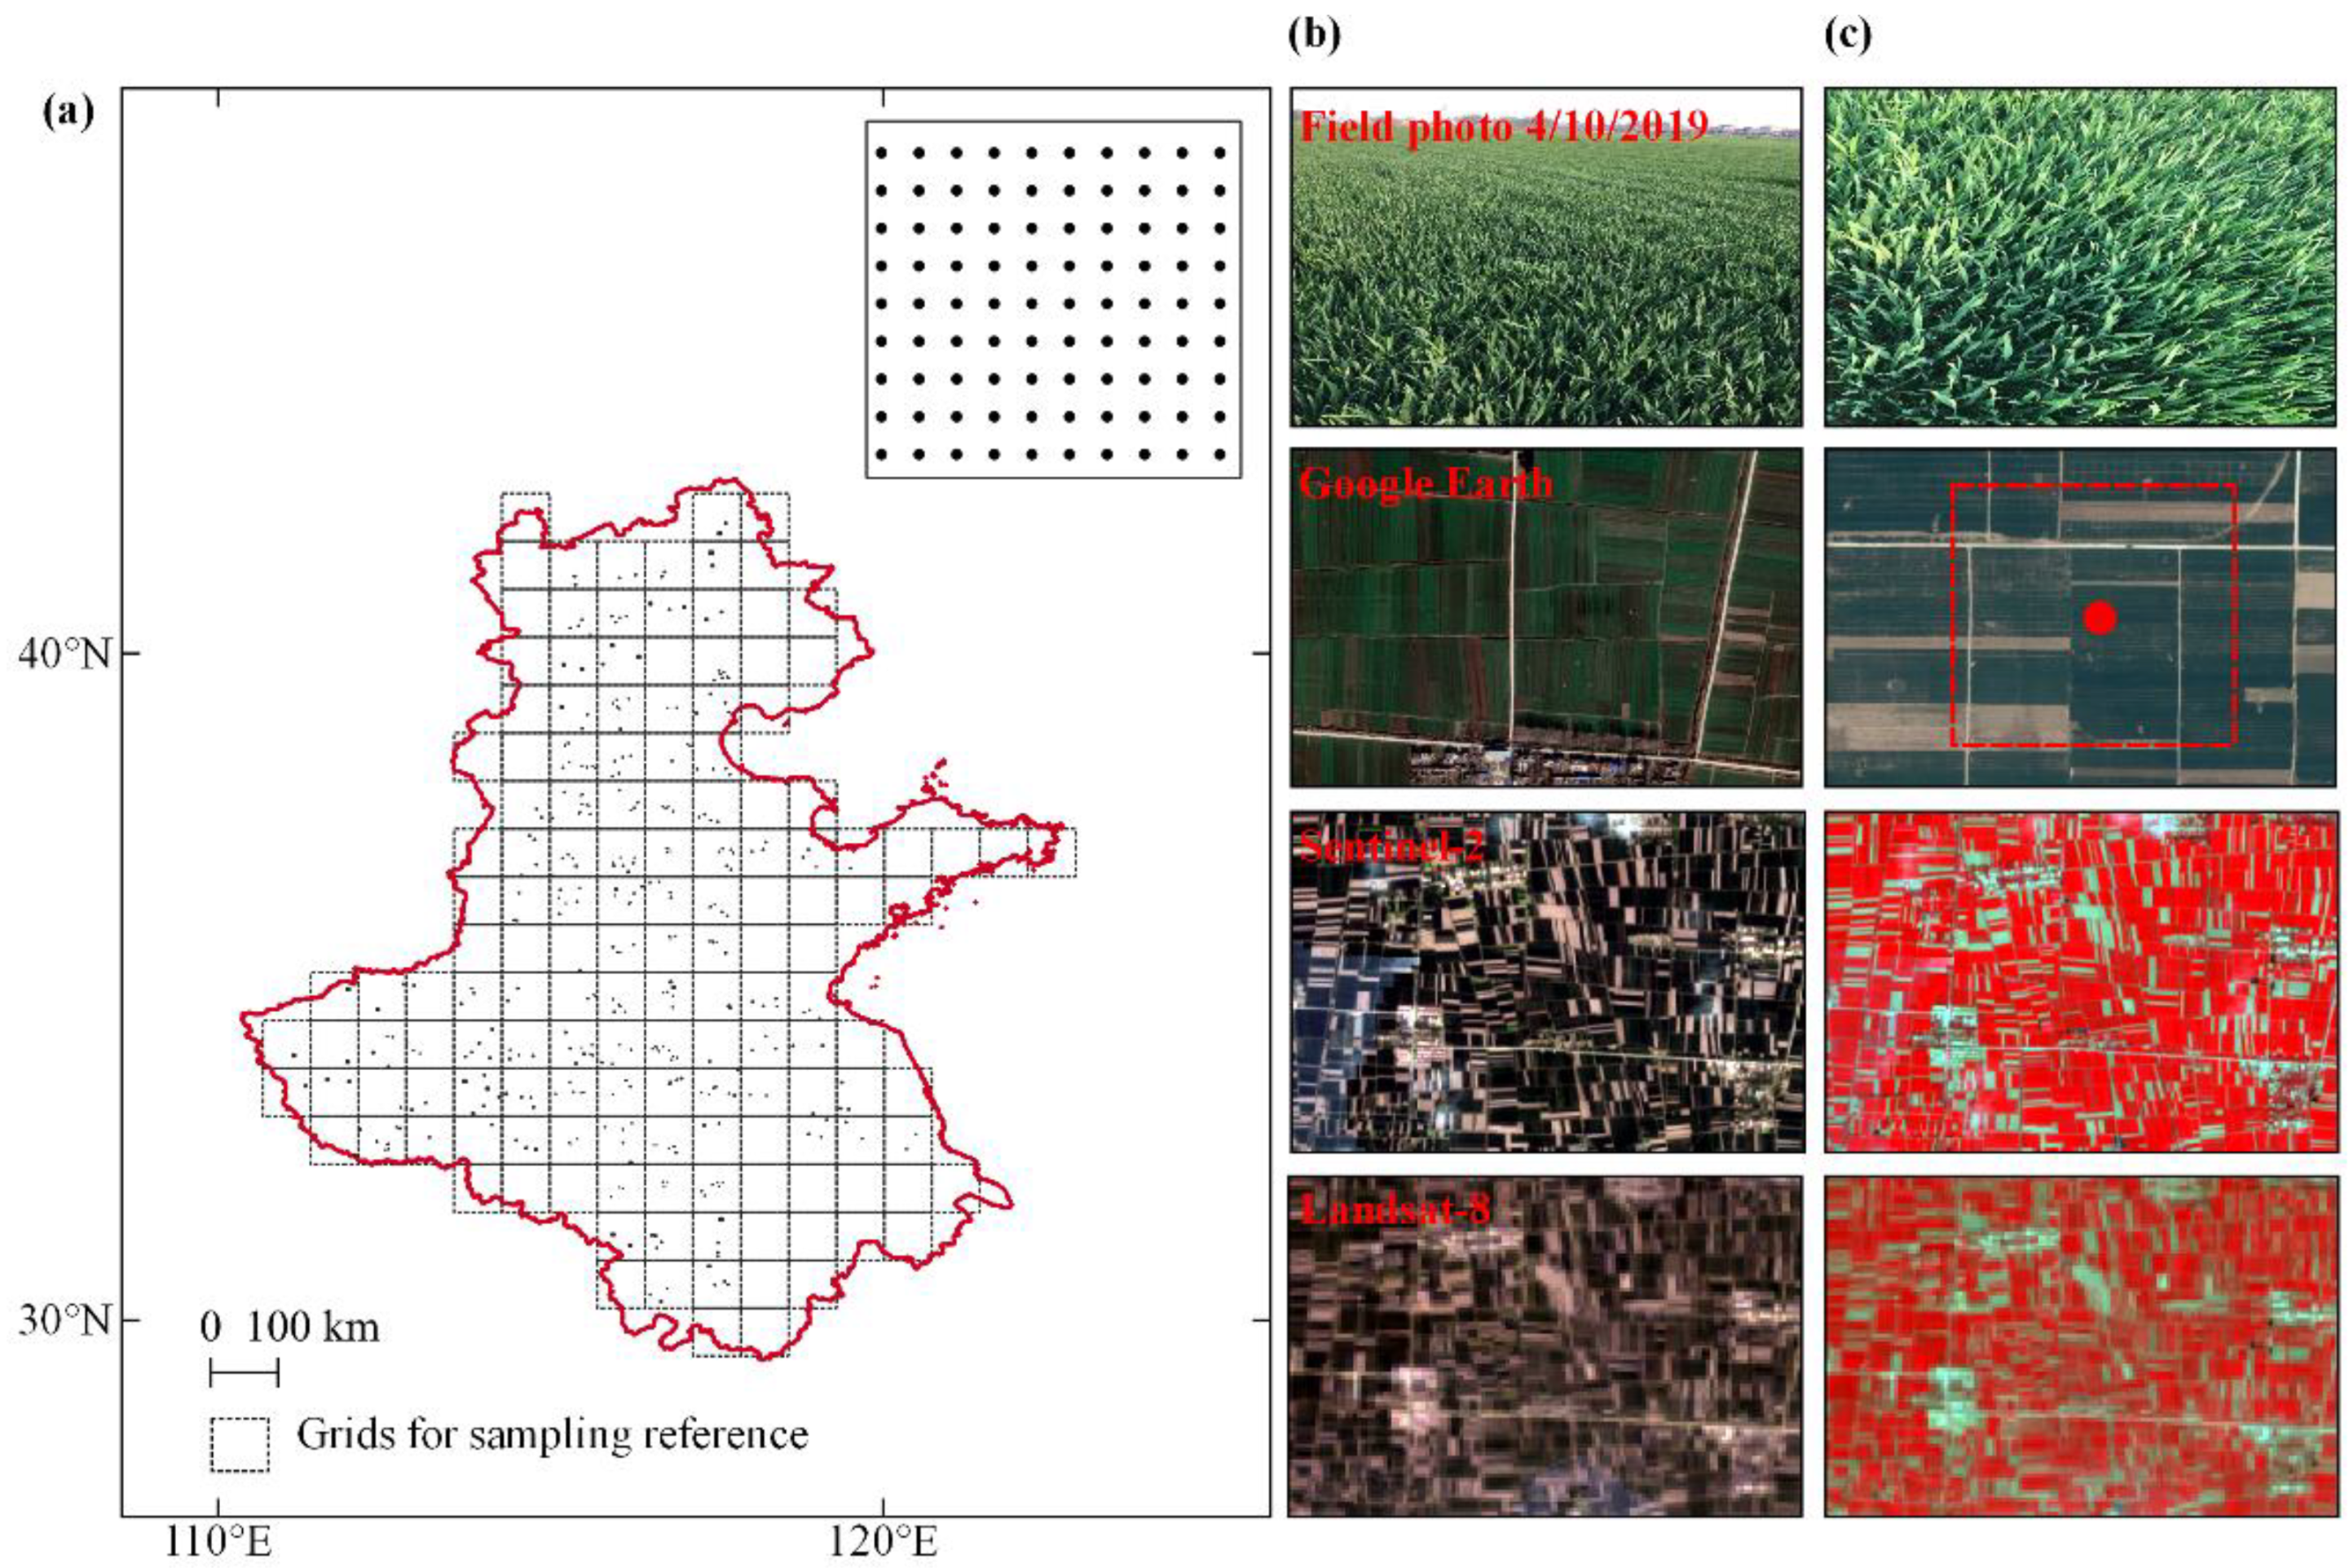
2.1.3. Training/Validation Sample from Google Earth™ (GE), Sentinel-2 and Landsat
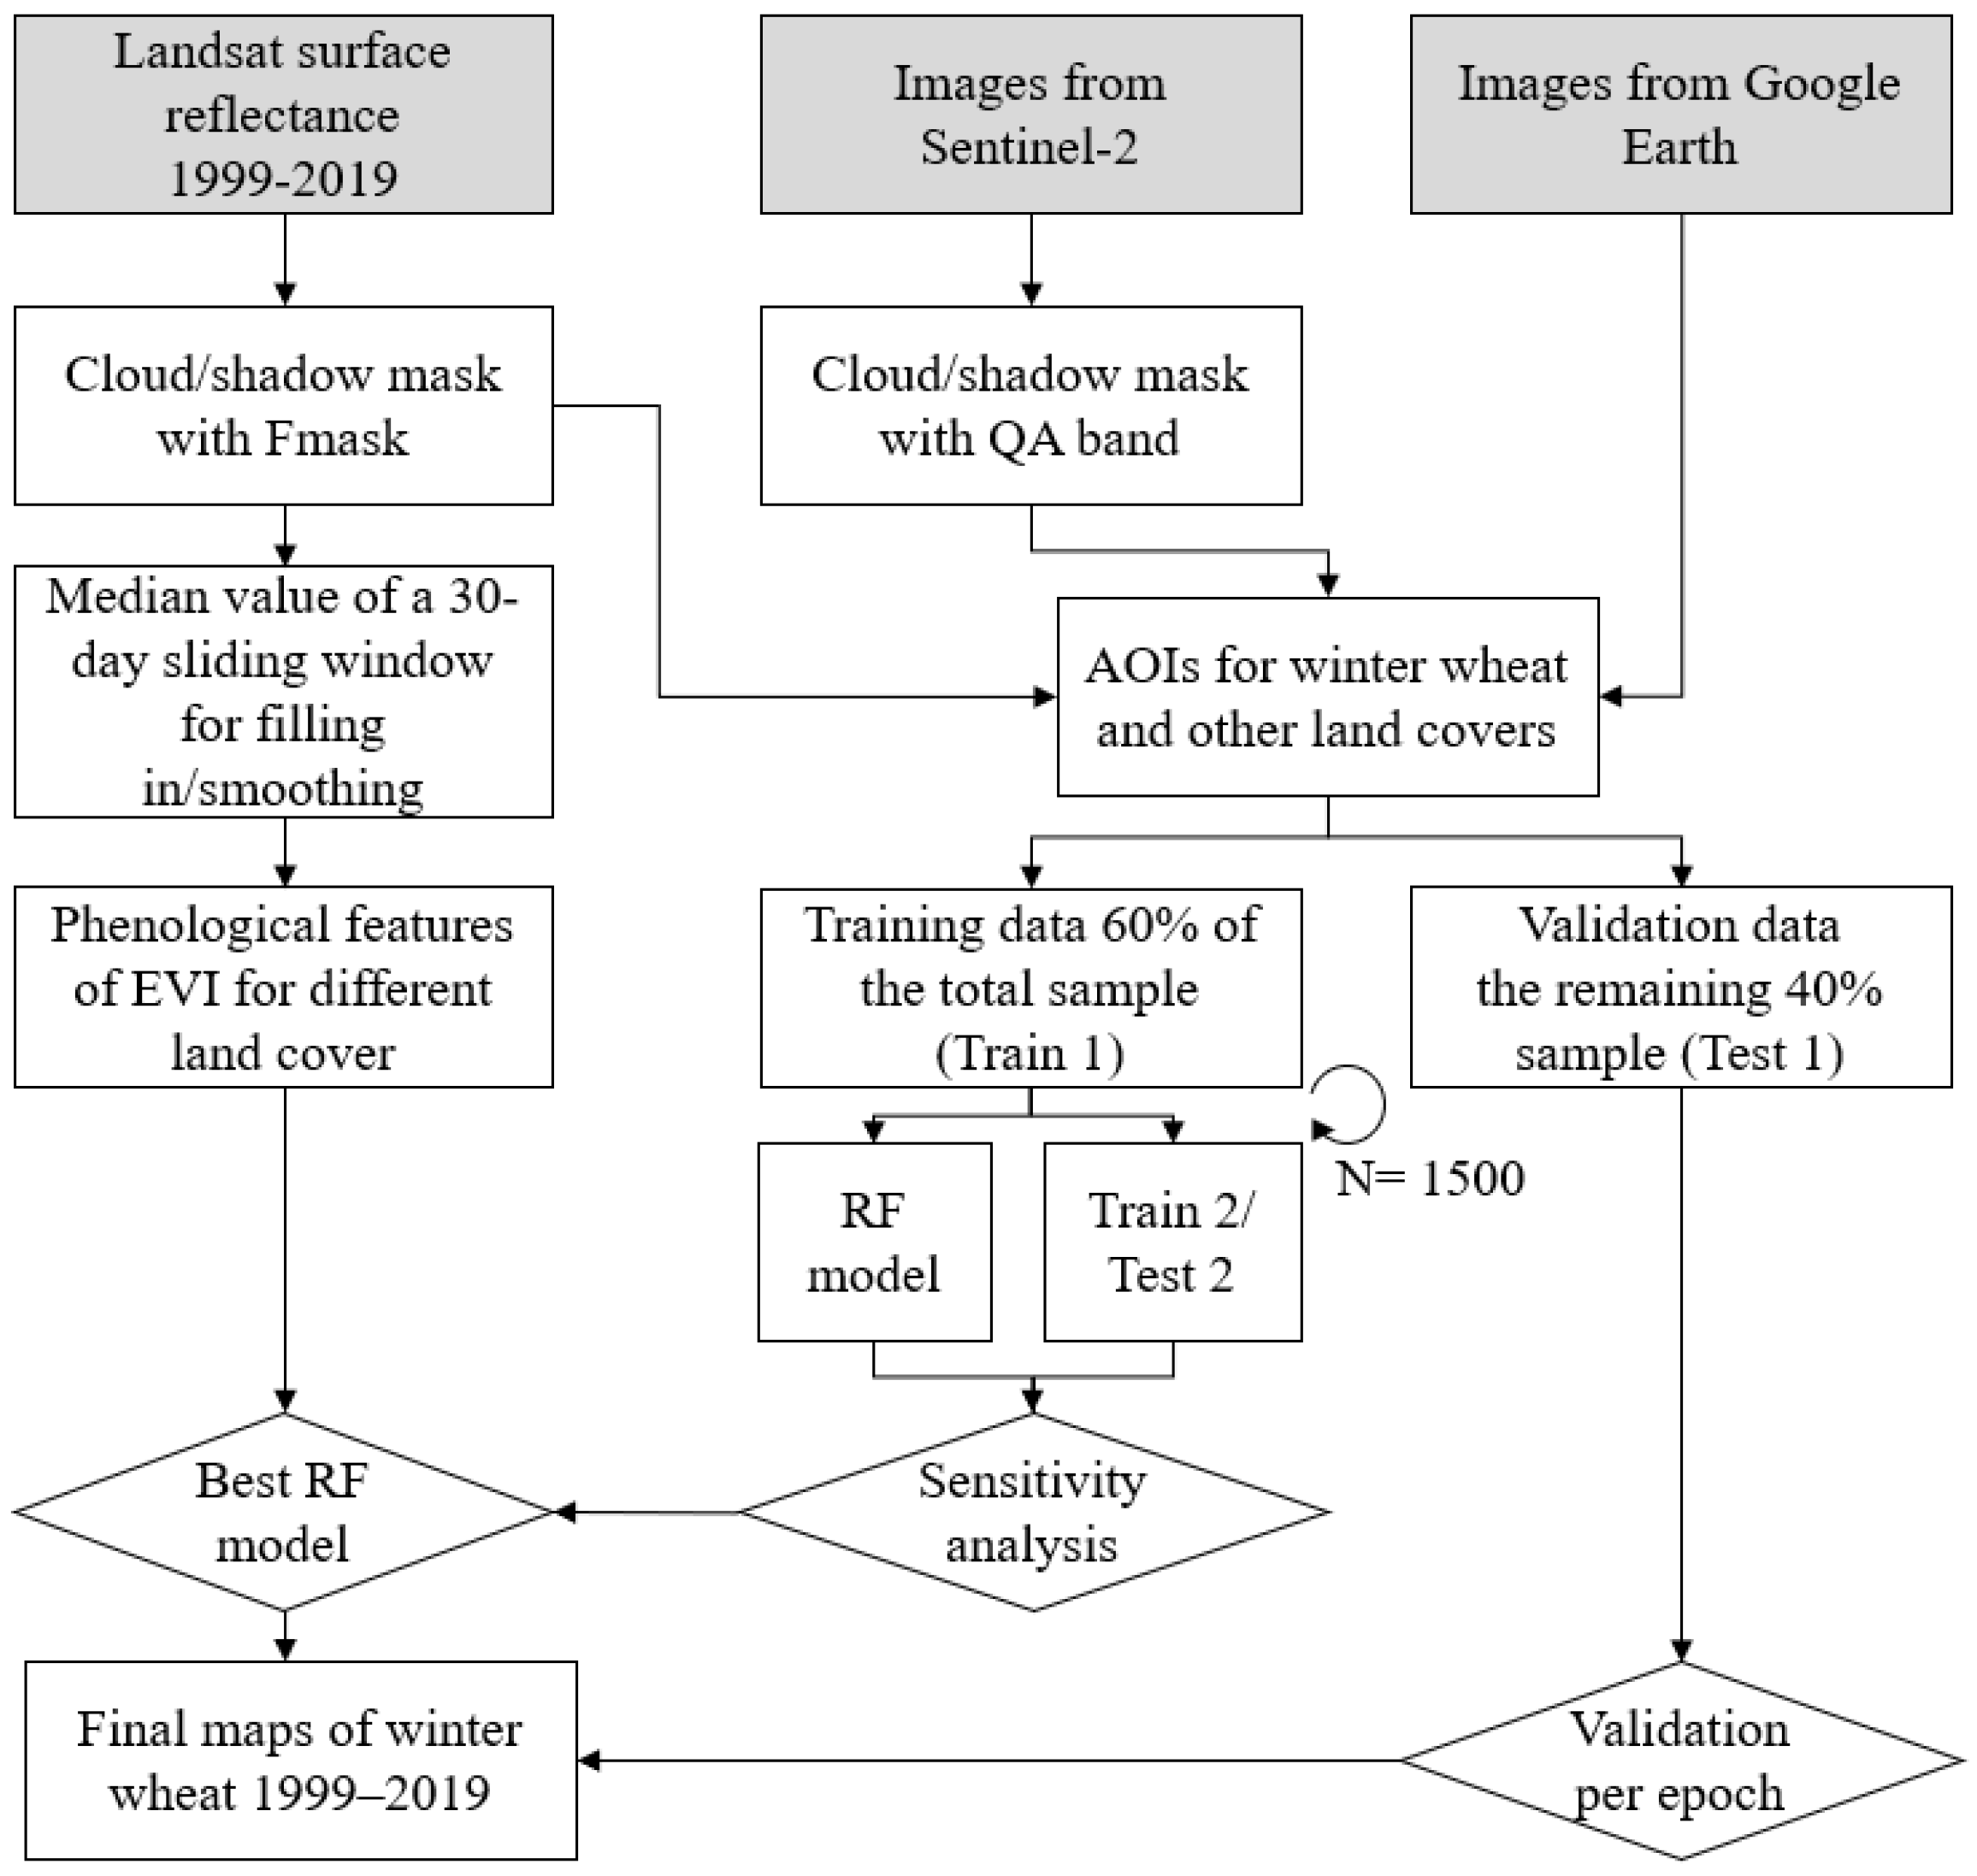
2.2. Method
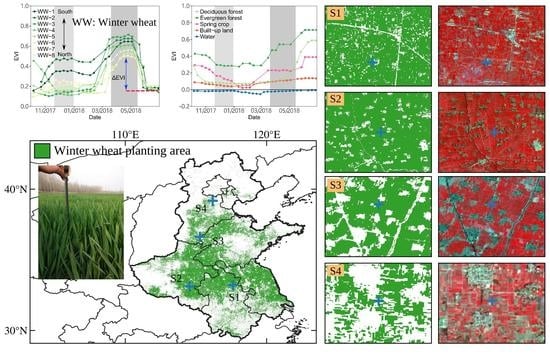
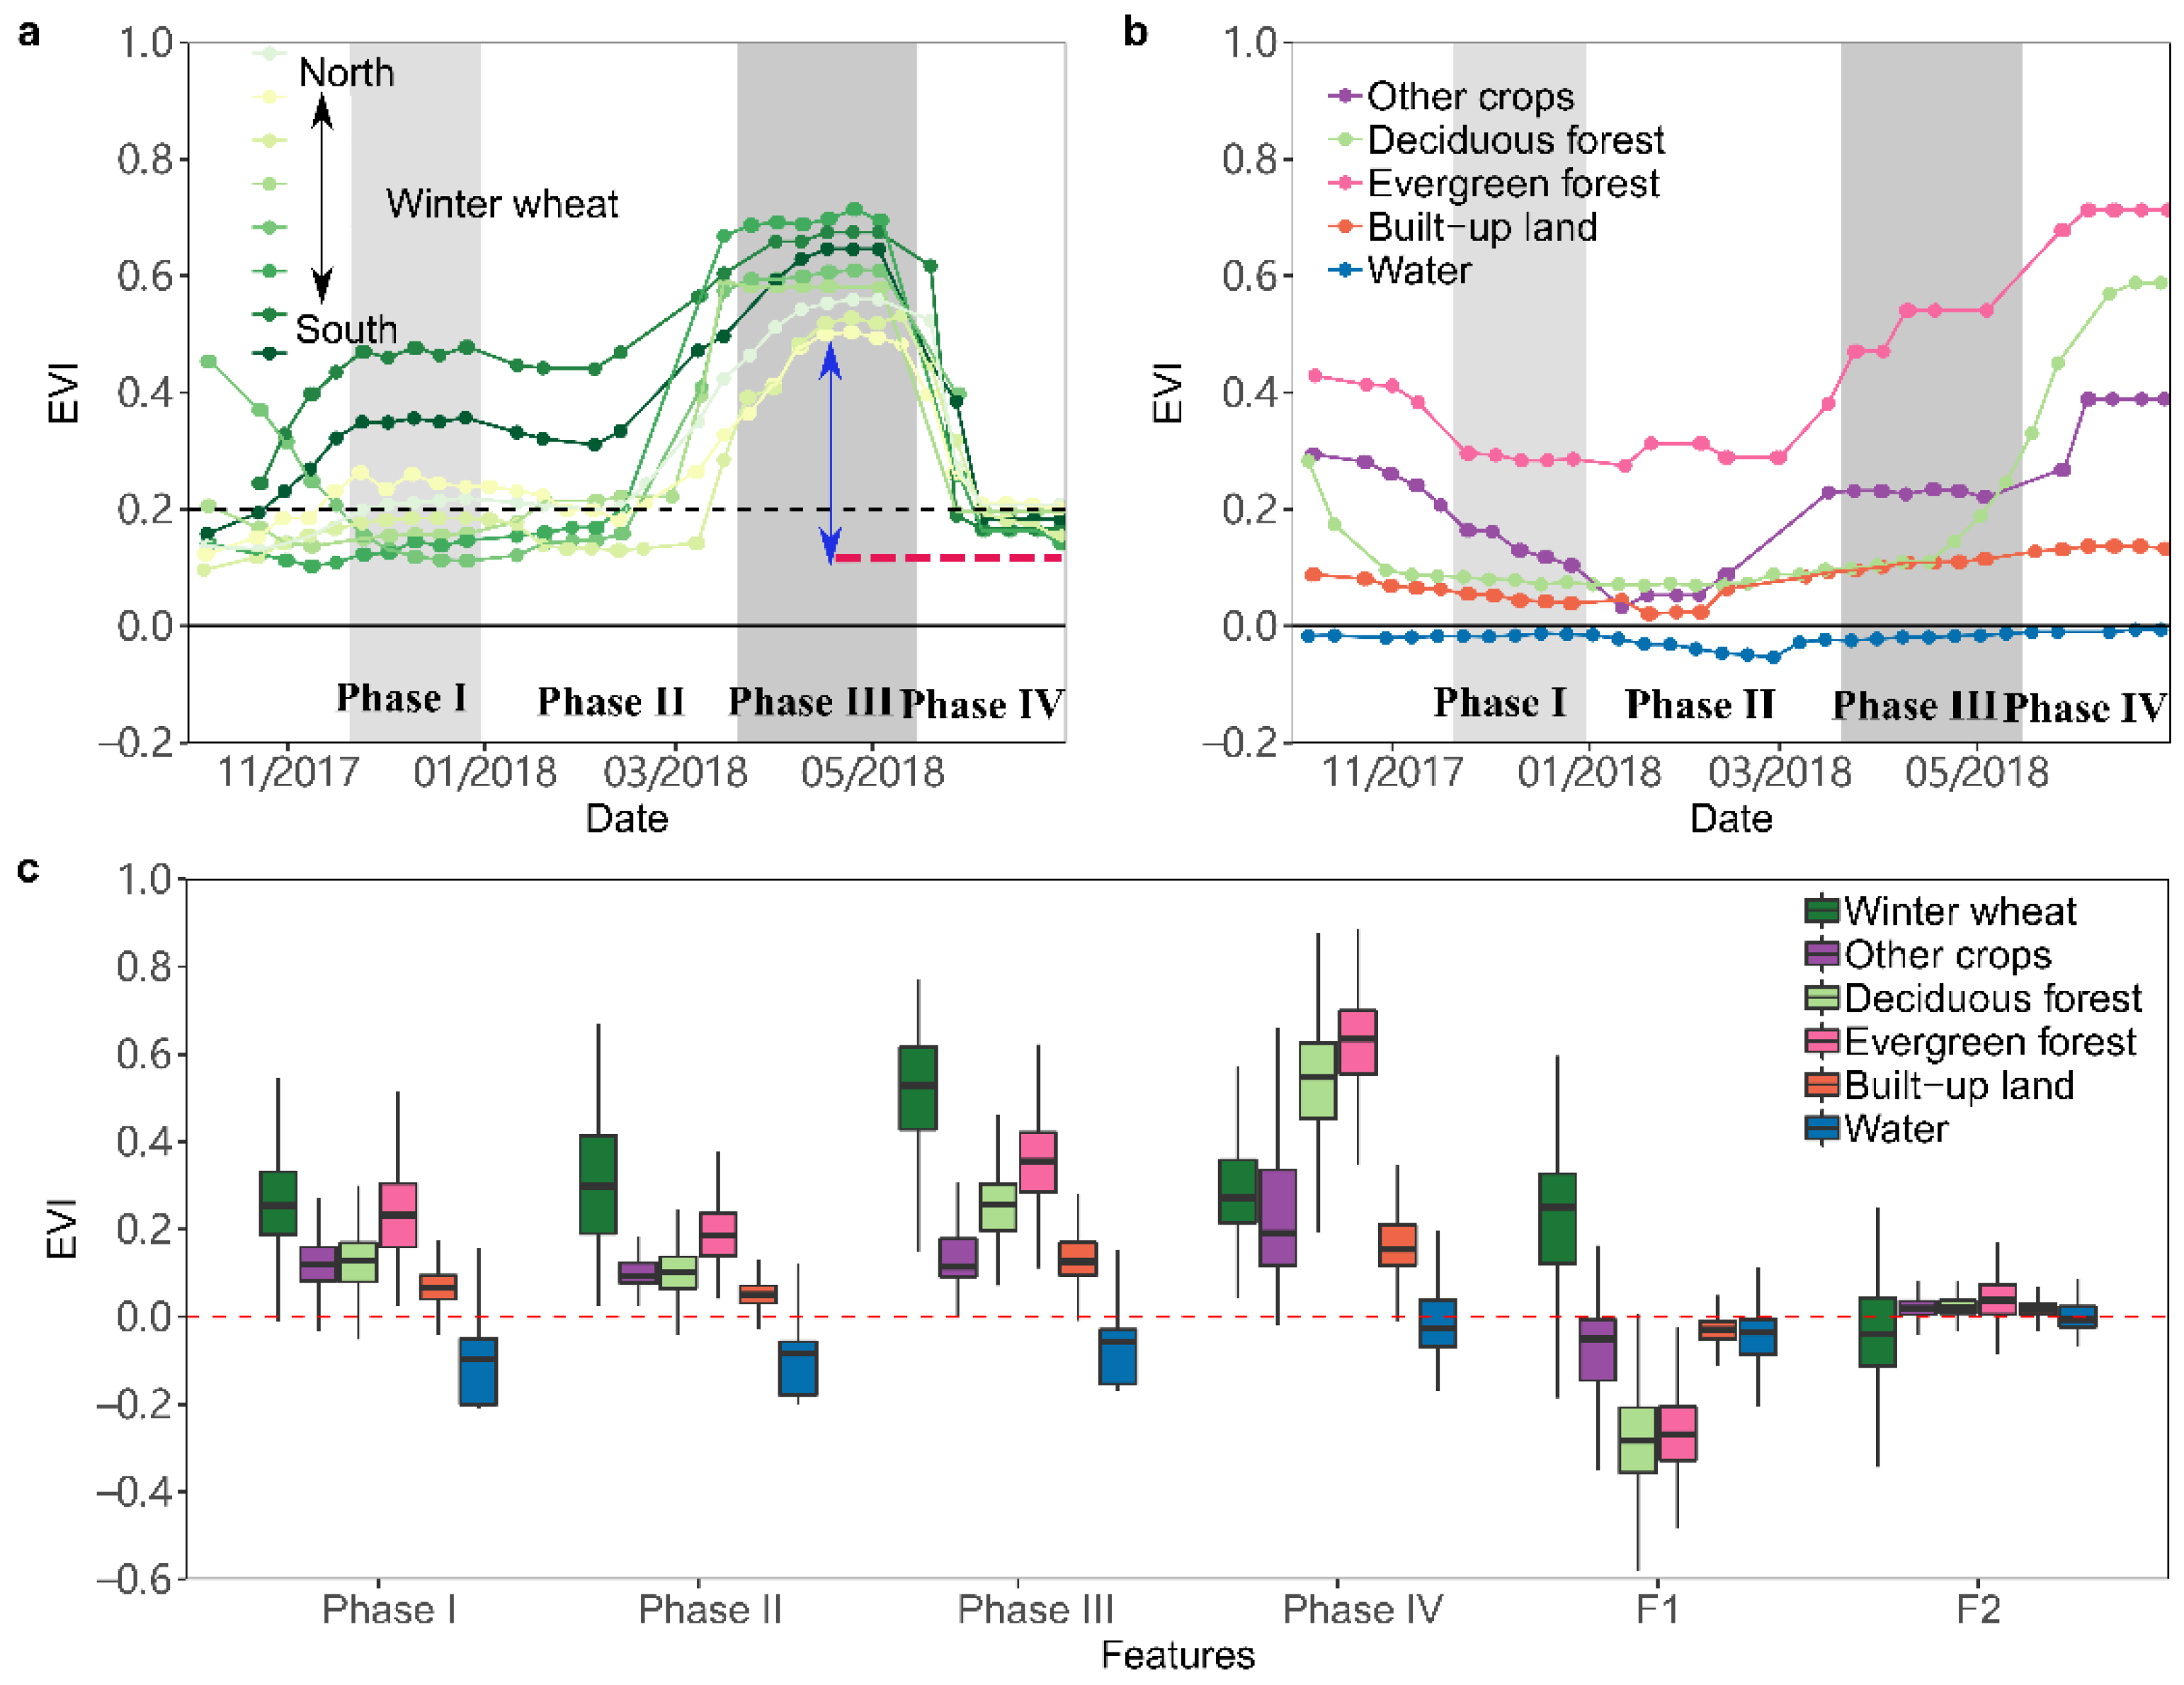
2.2.1. Metrics Derived for Classification
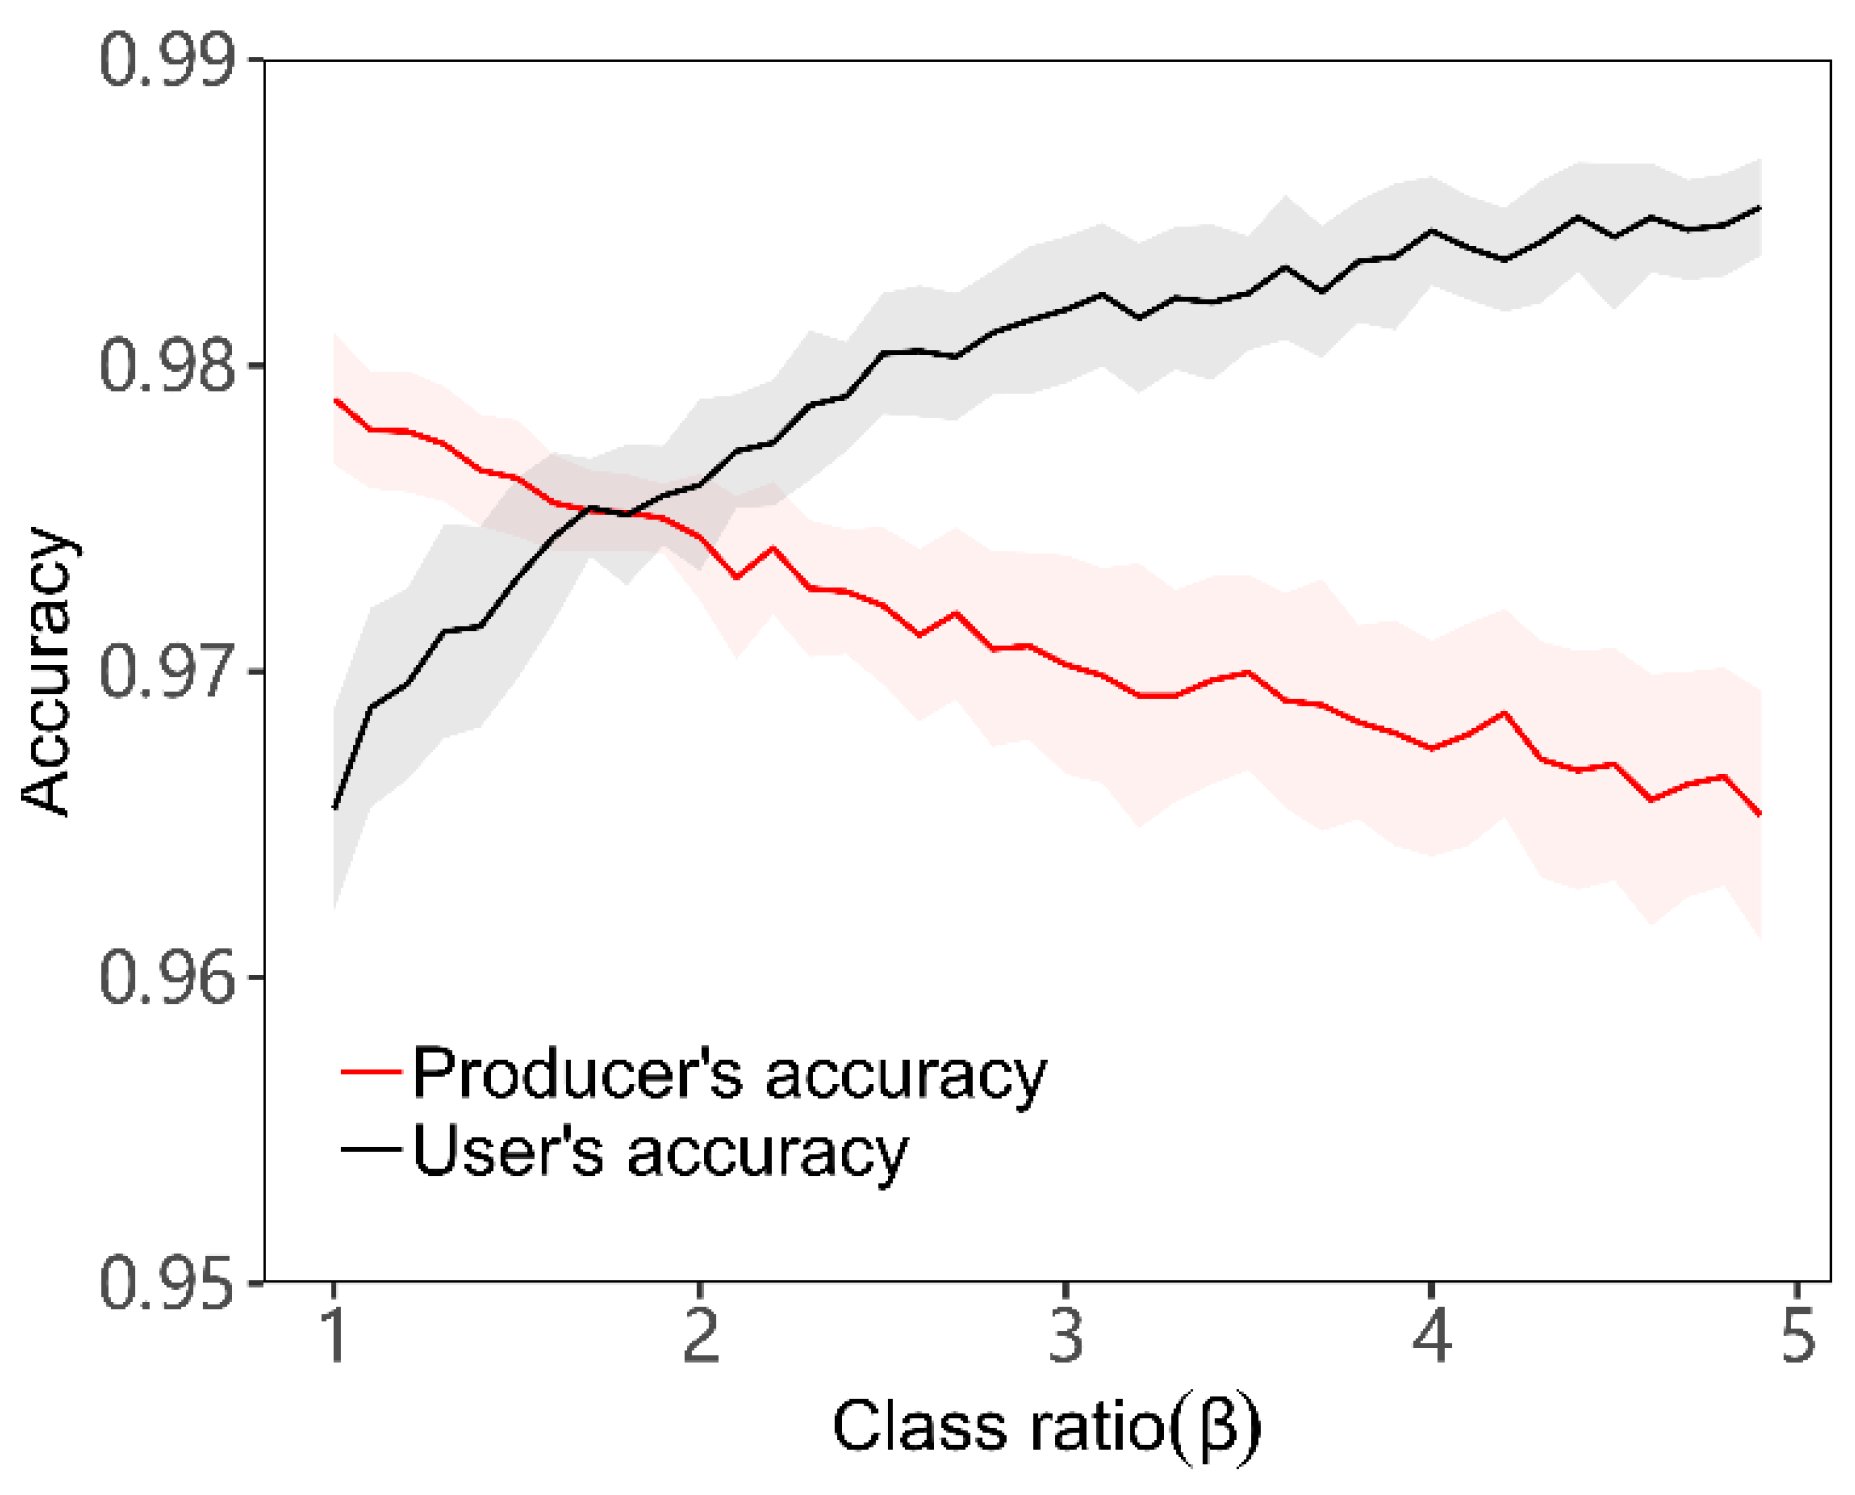
2.2.2. Sensitivity Analysis of Sampled Training Data
2.2.3. Classification and Accuracy Assessment
2.2.4. Analysis of Spatio-Temporal Patterns of Winter Wheat Planting Areas
3. Results
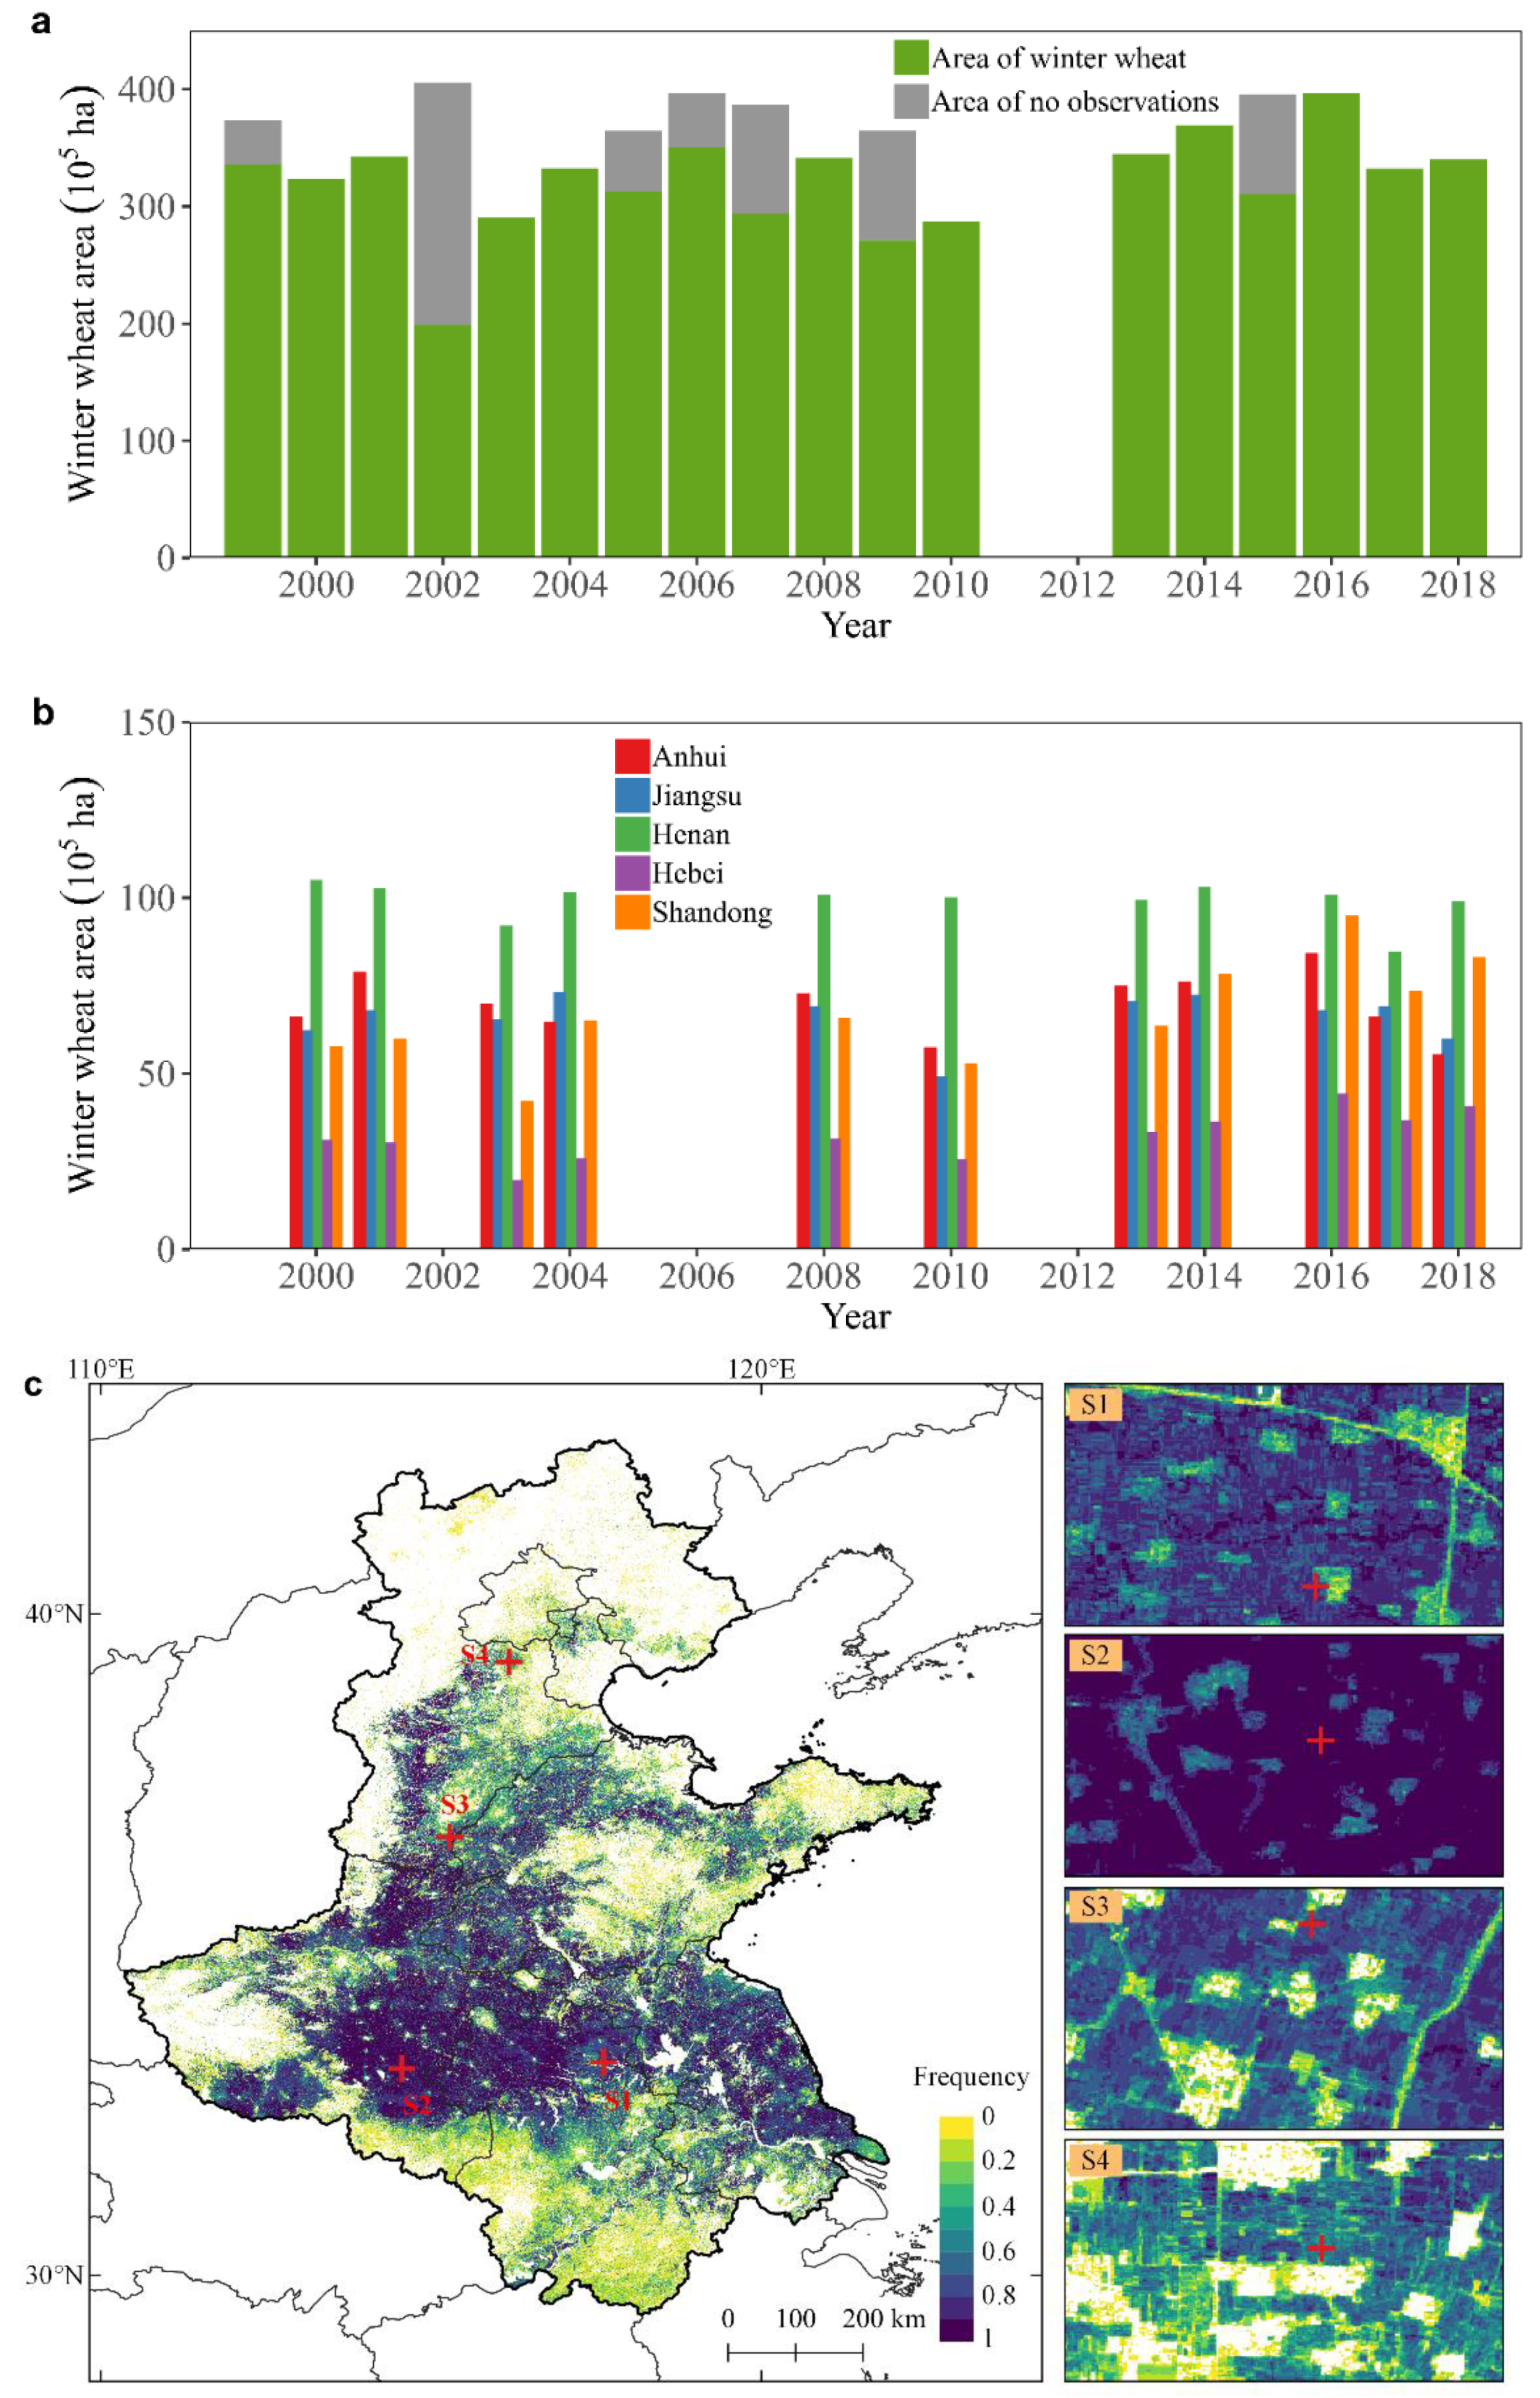
3.1. Winter Wheat Area Mapping Using Landsat Time Series
3.2. Accuracy Assessment of Landsat-Based Winter Wheat Area Maps
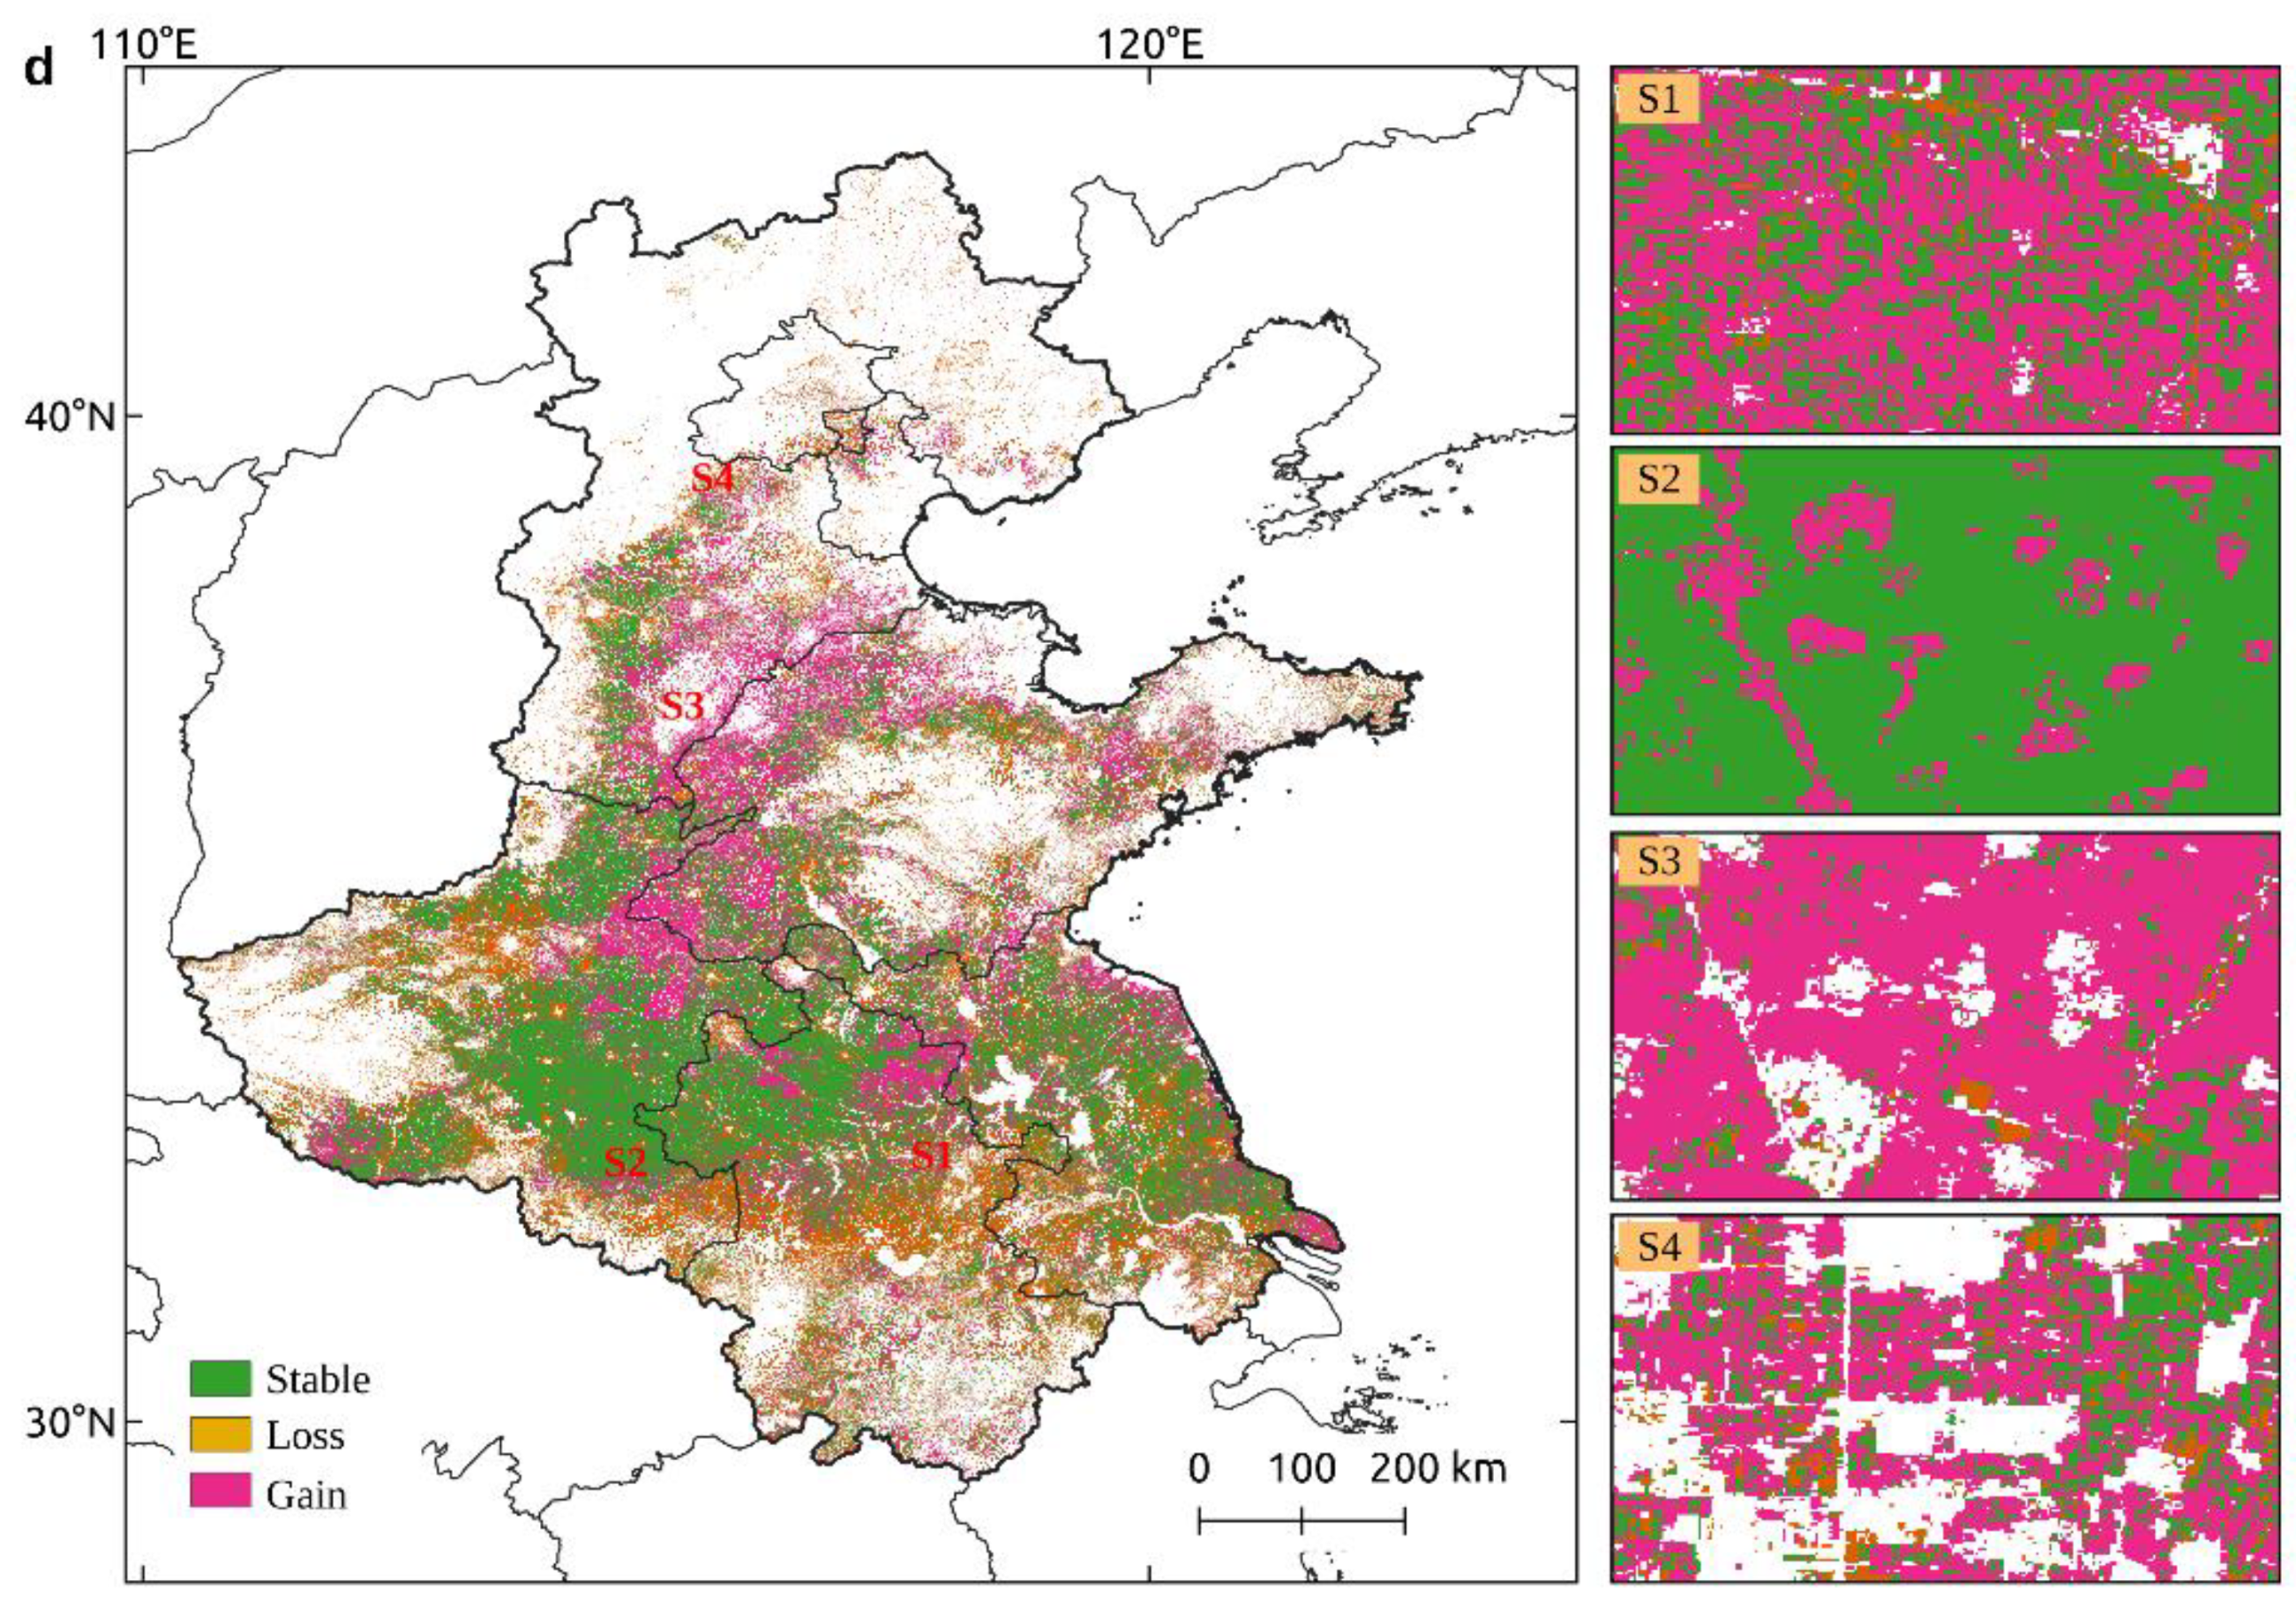
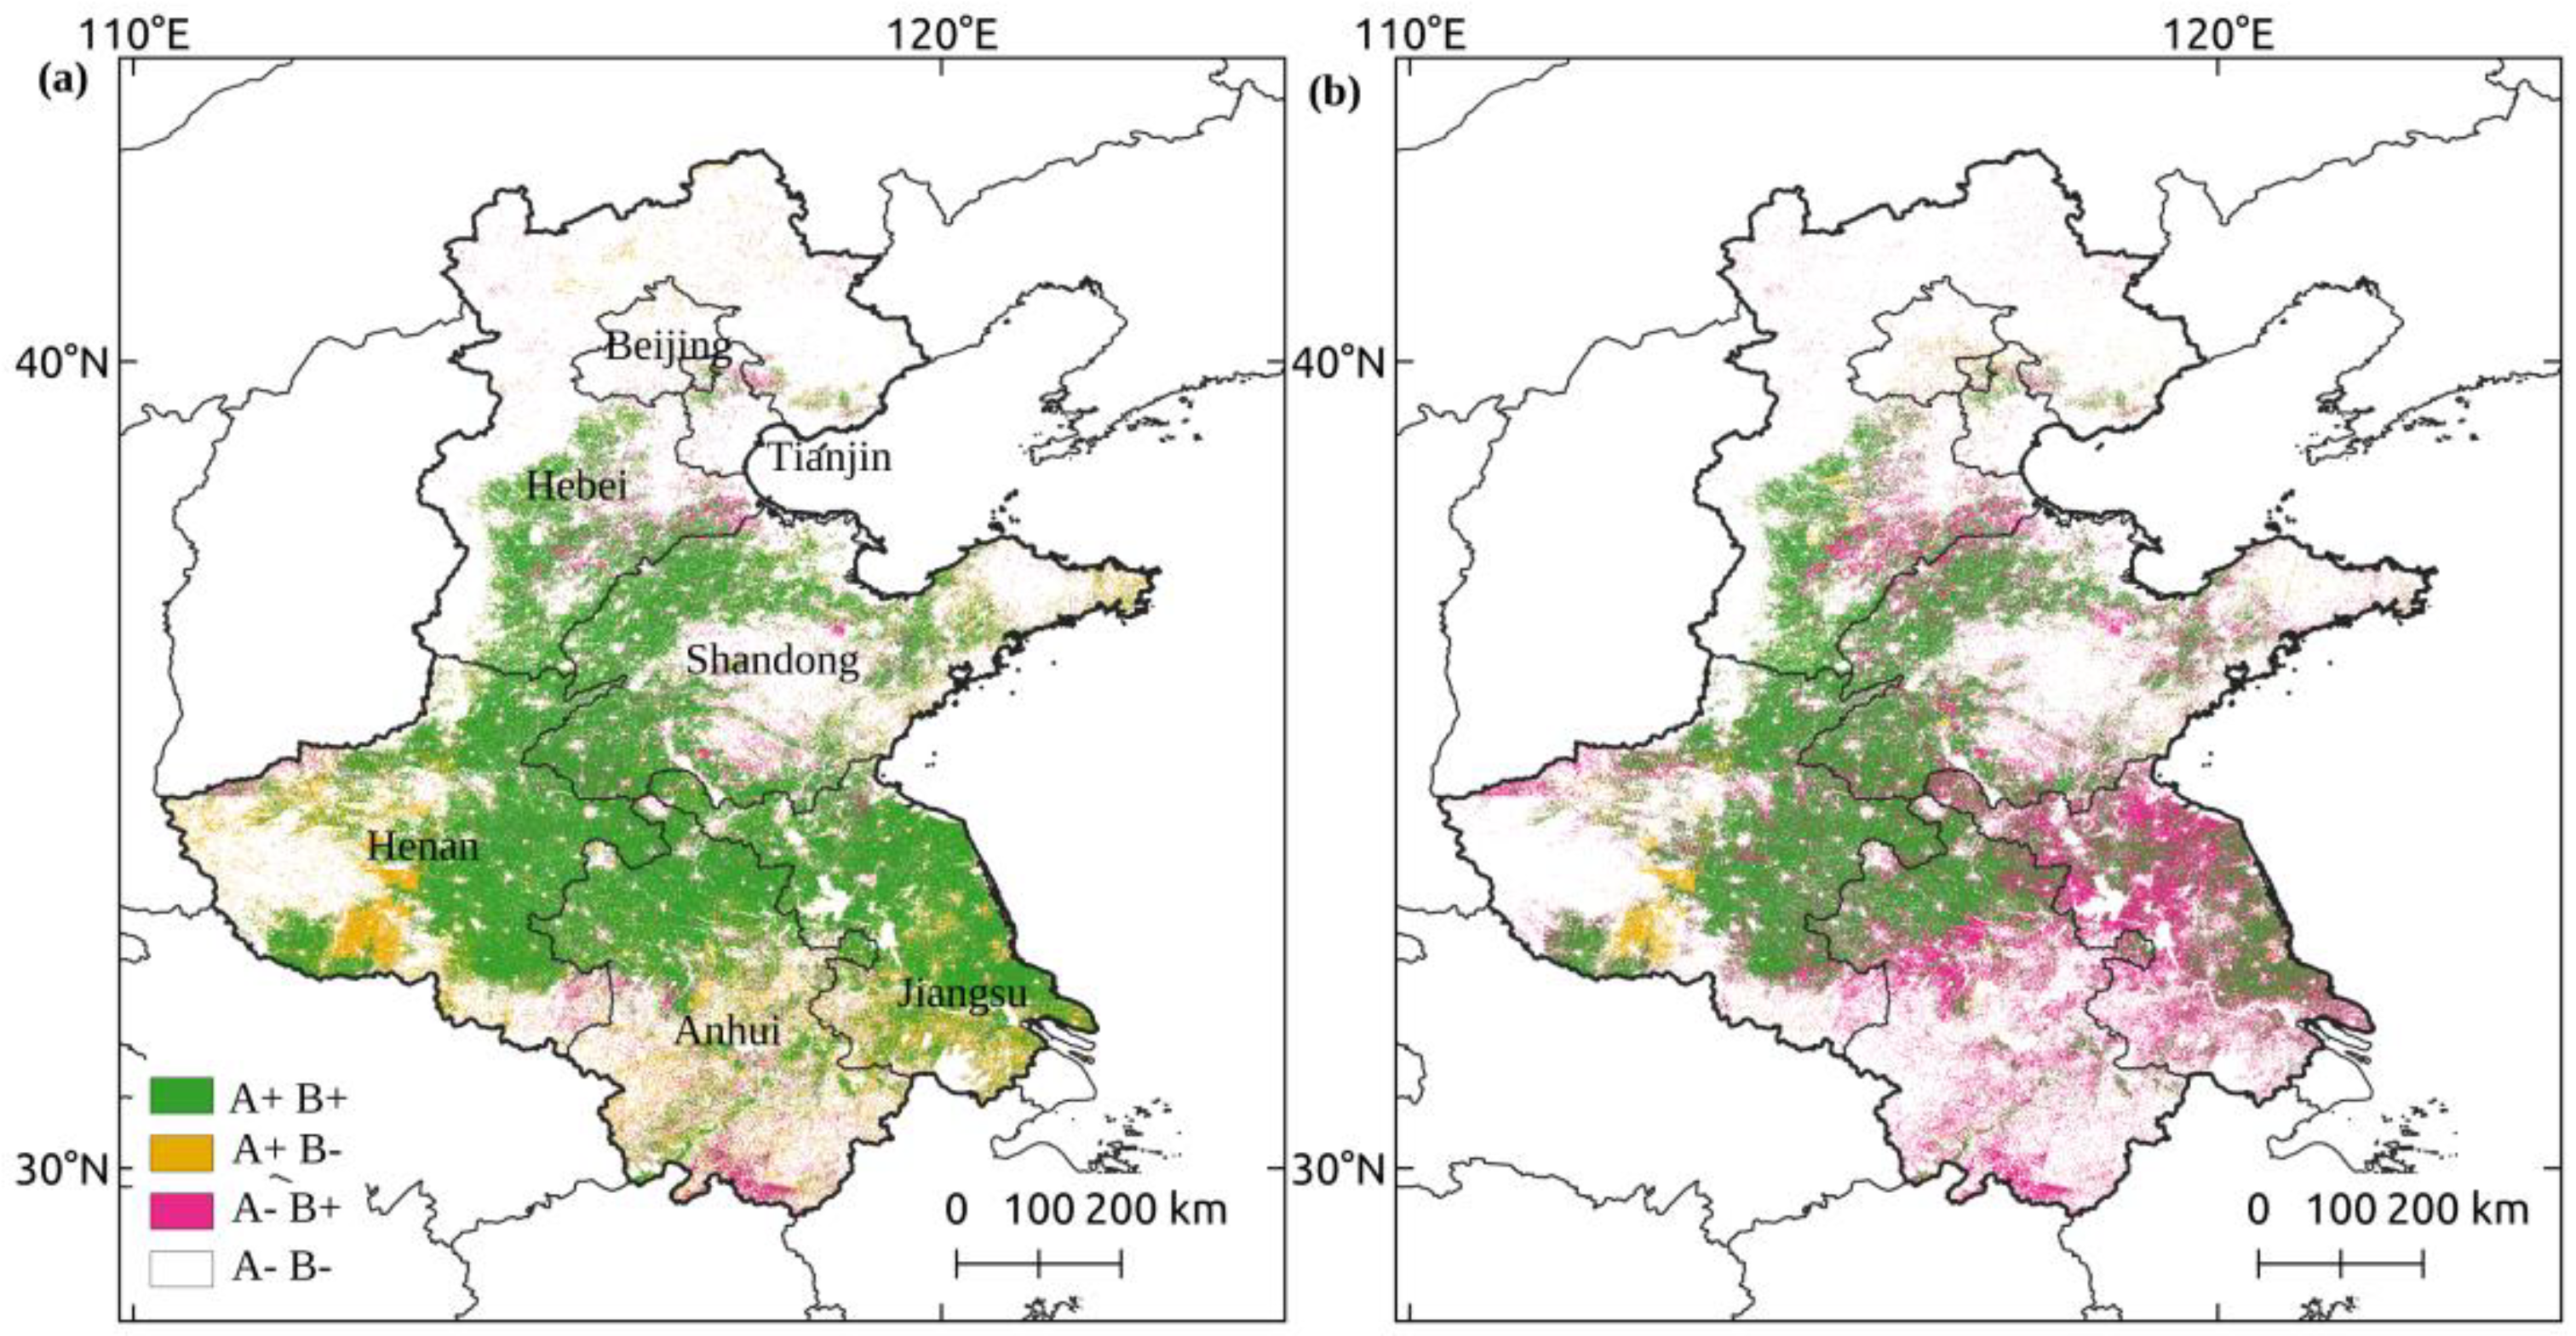
3.3. Spatio-Temporal Patterns of Landsat Based Winter Wheat Areas for 1999–2018
4. Discussion
4.1. Landsat Images for Phenology-Based Winter Wheat Planting Area Mapping
4.2. Uncertainty in Winter Wheat Mapping
4.3. Dynamics of Winter Wheat
4.4. Implication and Future Development of Winter Wheat Mapping
5. Conclusions
Supplementary Materials
Author Contributions
Funding
Data Availability Statement
Acknowledgments
Conflicts of Interest
References
- Tilman, D.; Balzer, C.; Hill, J.; Befort, B.L. Global food demand and the sustainable intensification of agriculture. Proc. Natl. Acad. Sci. USA 2011, 108, 20260–20264. [Google Scholar] [CrossRef] [PubMed] [Green Version]
- Song, X.-P.; Hansen, M.C.; Stehman, S.V.; Potapov, P.V.; Tyukavina, A.; Vermote, E.F.; Townshend, J.R. Global land change from 1982 to 2016. Nat. Cell Biol. 2018, 560, 639–643. [Google Scholar] [CrossRef] [PubMed]
- Foley, J.A.; DeFries, R.; Asner, G.P.; Barford, C.; Bonan, G.; Carpenter, S.R.; Chapin, F.S.; Coe, M.T.; Daily, G.C.; Gibbs, H.K.; et al. Global consequences of land use. Science 2005, 309, 570–574. [Google Scholar] [CrossRef] [PubMed] [Green Version]
- Trnka, M.; Rötter, R.P.; Ruiz-Ramos, M.; Kersebaum, K.C.; Olesen, J.E.; Žalud, Z.; Semenov, M.A. Adverse weather conditions for European wheat production will become more frequent with climate change. Nat. Clim. Chang. 2014, 4, 637–643. [Google Scholar] [CrossRef]
- United States Department of Agriculture National Agricultural Statistics Service. Available online: https://0-www-statista-com.brum.beds.ac.uk/statistics/267268/production-of-wheat-worldwide-since-1990/ (accessed on 10 December 2020).
- Ray, D.K.; Ramankutty, N.; Mueller, N.D.; West, P.C.; Foley, J.A. Recent patterns of crop yield growth and stagnation. Nat. Commun. 2012, 3, 1293. [Google Scholar] [CrossRef] [PubMed] [Green Version]
- Atzberger, C. Advances in remote sensing of agriculture: Context description, existing operational monitoring systems and major information needs. Remote Sens. 2013, 5, 949–981. [Google Scholar] [CrossRef] [Green Version]
- Fritz, S.; See, L.; Bayas, J.C.L.; Waldner, F.; Jacques, D.; Becker-Reshef, I.; Whitcraft, A.; Baruth, B.; Bonifacio, R.; Crutchfield, J.; et al. A comparison of global agricultural monitoring systems and current gaps. Agric. Syst. 2019, 168, 258–272. [Google Scholar] [CrossRef]
- Rapsomanikis, G. The Economic Lives of Smallholder Farmers: An Analysis Based on Household Data from Nine Countries; Food and Agriculture Organization of the United Nations: Rome, Italy, 2015. [Google Scholar]
- Xu, M.; He, C.; Liu, Z.; Dou, Y. How did urban land expand in China between 1992 and 2015? A multi-scale landscape analysis. PLoS ONE 2016, 11, e0154839. [Google Scholar] [CrossRef] [Green Version]
- Liu, Z.; Yang, P.; Wu, W.; You, L. Spatiotemporal changes of cropping structure in China during 1980–2011. J. Geogr. Sci. 2018, 28, 1659–1671. [Google Scholar] [CrossRef] [Green Version]
- Liu, B.; Liu, L.; Tian, L.; Cao, W.; Zhu, Y.; Asseng, S. Post-heading heat stress and yield impact in winter wheat of China. Glob. Chang. Biol. 2014, 20, 372–381. [Google Scholar] [CrossRef]
- Ortiz, R.; Sayre, K.D.; Govaerts, B.; Gupta, R.; Subbarao, G.; Ban, T.; Hodson, D.; Dixon, J.M.; Ortiz-Monasterio, J.I.; Reynolds, M. Climate change: Can wheat beat the heat? Agric. Ecosyst. Environ. 2008, 126, 46–58. [Google Scholar] [CrossRef]
- Chen, J.; Chen, J.; Liao, A.; Cao, X.; Chen, L.; Chen, X. Global land cover mapping at 30 m resolution: A POK-based operational approach. ISPRS J. Photogramm. Remote Sens. 2014, 103, 7–27. [Google Scholar] [CrossRef] [Green Version]
- Gong, P.; Liu, H.; Zhang, M.; Li, C.; Wang, J.; Huang, H.; Clinton, N.; Ji, L.; Li, W.; Bai, Y.; et al. Stable classification with limited sample: Transferring a 30-m resolution sample set collected in 2015 to mapping 10-m resolution global land cover in 2017. Sci. Bull. 2019, 64, 370–373. [Google Scholar] [CrossRef] [Green Version]
- Xu, F.; Li, Z.; Zhang, S.; Huang, N.; Quan, Z.; Zhang, W. Mapping winter wheat with combinations of temporally aggregated Sentinel-2 and Landsat-8 data in Shan-dong Province, China. Remote Sens. 2020, 12, 2065. [Google Scholar] [CrossRef]
- Pan, Y.; Li, L.; Zhang, J.; Liang, S.; Zhu, X.; Sulla-Menashe, D. Winter wheat area estimation from MODIS-EVI time series data using the Crop Proportion Phenology Index. Remote Sens. Environ. 2012, 119, 232–242. [Google Scholar] [CrossRef]
- Cai, Y.; Guan, K.; Peng, J.; Wang, S.; Seifert, C.; Wardlow, B.; Li, Z. A high-performance and in-season classification system of field-level crop types using time-series Landsat data and a machine learning approach. Remote Sens. Environ. 2018, 210, 35–47. [Google Scholar] [CrossRef]
- Daughtry, C.; Hunt, E.; Doraiswamy, P.; McMurtrey, J.; Russ, A. Remote sensing of crop residue cover and soil tillage intensity. Soil Tillage Res. 2006, 91, 101–108. [Google Scholar] [CrossRef]
- Paloscia, S.; Pettinato, S.; Santi, E.; Notarnicola, C.; Pasolli, L.; Reppucci, A.J.R.S.O.E. Soil moisture mapping using Sentinel-1 imag-es: Algorithm and preliminary validation. Remote Sens. Environ. 2013, 134, 234–248. [Google Scholar] [CrossRef]
- Wang, S.; Azzari, G.; Lobell, D.B. Crop type mapping without field-level labels: Random forest transfer and unsuper-vised clustering techniques. Remote Sens. Environ. 2019, 222, 303–317. [Google Scholar] [CrossRef]
- Wei, M.; Qiao, B.; Zhao, J.; Zuo, X. The area extraction of winter wheat in mixed planting area based on Sentinel-2 a re-mote sensing satellite images. Int. J. Parallel Emergent Distrib. Syst. 2020, 35, 297–308. [Google Scholar] [CrossRef]
- Sui, X.; Zhang, X.; Li, S.; Zhu, Z.; Ming, B.; Sun, X. Extracting winter wheat planting area based on cropping system with remote sensing. Lect. Notes Control Inf. Sci. 2011, 345, 691–699. [Google Scholar] [CrossRef] [Green Version]
- Ozdogan, M.; Woodcock, C.E. Resolution dependent errors in remote sensing of cultivated areas. Remote Sens. Environ. 2006, 103, 203–217. [Google Scholar] [CrossRef]
- Löw, F.; Prishchepov, A.V.; Waldner, F.; Dubovyk, O.; Akramkhanov, A.; Biradar, C.; Lamers, J.P.A. Mapping cropland abandonment in the Aral Sea Basin with MODIS time series. Remote Sens. 2018, 10, 159. [Google Scholar] [CrossRef] [Green Version]
- Yang, Y.; Tao, B.; Ren, W.; Zourarakis, D.P.; El Masri, B.; Sun, Z.; Tian, Q. An improved approach considering intraclass variability for mapping winter wheat using multitemporal MODIS EVI images. Remote Sens. 2019, 11, 1191. [Google Scholar] [CrossRef] [Green Version]
- Qiu, B.; Luo, Y.; Tang, Z.; Chen, C.; Lu, D.; Huang, H.; Chen, Y.; Chen, N.; Xu, W. Winter wheat mapping combining variations before and after estimated heading dates. ISPRS J. Photogramm. Remote Sens. 2017, 123, 35–46. [Google Scholar] [CrossRef]
- Lhermitte, S.; Verbesselt, J.; Verstraeten, W.W.; Coppin, P. A comparison of time series similarity measures for classifi-cation and change detection of ecosystem dynamics. Remote Sens. Environ. 2011, 115, 3129–3152. [Google Scholar] [CrossRef]
- Guerschman, J.P.; Paruelo, J.M.; Di Bella, C.; Giallorenzi, M.C.; Pacin, F. Land cover classification in the Argentine Pampas using multi-temporal Landsat TM data. Int. J. Remote Sens. 2003, 24, 3381–3402. [Google Scholar] [CrossRef]
- Belgiu, M.; Csillik, O. Sentinel-2 cropland mapping using pixel-based and object-based time-weighted dynamic time warping analysis. Remote Sens. Environ. 2018, 204, 509–523. [Google Scholar] [CrossRef]
- Dong, Q.; Chen, X.; Chen, J.; Zhang, C.; Liu, L.; Cao, X.; Zang, Y.; Zhu, X.; Cui, X. Mapping winter wheat in North China using Sentinel 2A/B Data: A method based on Phenology-Time Weighted Dynamic Time Warping. Remote Sens. 2020, 12, 1274. [Google Scholar] [CrossRef] [Green Version]
- Dong, J.; Fu, Y.; Wang, J.; Tian, H.; Fu, S.; Niu, Z.; Han, W.; Zheng, Y.; Huang, J.; Yuan, W. Early-season mapping of winter wheat in China based on Landsat and Sentinel images. Earth Syst. Sci. Data 2020, 12, 3081–3095. [Google Scholar] [CrossRef]
- Zhong, L.; Hu, L.; Zhou, H.; Tao, X. Deep learning based winter wheat mapping using statistical data as ground refer-ences in Kansas and northern Texas, US. Remote Sens. Environ. 2019, 233, 111411. [Google Scholar] [CrossRef]
- Belgiu, M.; Drăguţ, L. Random forest in remote sensing: A review of applications and future directions. ISPRS J. Photogramm. Remote Sens. 2016, 114, 24–31. [Google Scholar] [CrossRef]
- Stumpf, A.; Kerle, N. Object-oriented mapping of landslides using Random Forests. Remote Sens. Environ. 2011, 115, 2564–2577. [Google Scholar] [CrossRef]
- Chen, T.-H.K.; Prishchepov, A.V.; Fensholt, R.; Sabel, C.E. Detecting and monitoring long-term landslides in urban-ized areas with nighttime light data and multi-seasonal Landsat imagery across Taiwan from 1998 to 2017. Remote Sens. Environ. 2019, 225, 317–327. [Google Scholar] [CrossRef]
- Gorelick, N.; Hancher, M.; Dixon, M.; Ilyushchenko, S.; Thau, D.; Moore, R. Google Earth Engine: Planetary-scale geospa-tial analysis for everyone. Remote Sens. Environ. 2017, 202, 18–27. [Google Scholar] [CrossRef]
- Liu, F.; Zhang, Z.; Zhao, X.; Wang, X.; Zuo, L.; Wen, Q.; Yi, L.; Xu, J.; Hu, S.; Liu, B. Chinese cropland losses due to urban expansion in the past four decades. Sci. Total. Environ. 2019, 650, 847–857. [Google Scholar] [CrossRef] [PubMed]
- Deng, X.; Huang, J.; Rozelle, S.; Zhang, J.; Li, Z. Impact of urbanization on cultivated land changes in China. Land Use Policy 2015, 45, 1–7. [Google Scholar] [CrossRef]
- Foga, S.; Scaramuzza, P.L.; Guo, S.; Zhu, Z.; Dilley, R.D.; Beckmann, T.; Schmidt, G.L.; Dwyer, J.L.; Hughes, M.J.; Laue, B. Cloud detection algorithm comparison and validation for operational Landsat data products. Remote Sens. Environ. 2017, 194, 379–390. [Google Scholar] [CrossRef] [Green Version]
- Olofsson, P.; Foody, G.M.; Herold, M.; Stehman, S.V.; Woodcock, C.E.; Wulder, M.A. Good practices for estimating area and assessing accuracy of land change. Remote Sens. Environ. 2014, 148, 42–57. [Google Scholar] [CrossRef]
- Pekel, J.-F.; Cottam, A.; Gorelick, N.; Belward, A.S. High-resolution mapping of global surface water and its long-term changes. Nature 2016, 540, 418–422. [Google Scholar] [CrossRef] [PubMed]
- Schneider, A.; Mertes, C.M. Expansion and growth in Chinese cities, 1978–2010. Environ. Res. Lett. 2014, 9, 024008. [Google Scholar] [CrossRef]
- Haas, J.; Ban, Y. Urban growth and environmental impacts in Jing-Jin-Ji, the Yangtze, River Delta and the Pearl River Delta. Int. J. Appl. Earth Obs. Geoinform. 2014, 30, 42–55. [Google Scholar] [CrossRef]
- Yuan, W.; Liu, S.; Liu, W.; Zhao, S.; Dong, W.; Tao, F. Opportunistic market-driven regional shifts of cropping practices reduce food production capacity of China. Earth’s Future 2018, 6, 634–642. [Google Scholar] [CrossRef] [Green Version]
- Sun, Y.; Zhang, X.; Zwiers, F.W.; Song, L.; Wan, H.; Hu, T.; Yin, H.; Ren, G. Rapid increase in the risk of extreme summer heat in Eastern China. Nat. Clim. Chang. 2014, 4, 1082–1085. [Google Scholar] [CrossRef]
- Tao, F.; Zhang, Z.; Xiao, D.; Zhang, S.; Rötter, R.P.; Shi, W.; Liu, Y.; Wang, M.; Liu, F.; Zhang, H. Responses of wheat growth and yield to climate change in different climate zones of China, 1981–2009. Agric. For. Meteorol. 2014, 189-190, 91–104. [Google Scholar] [CrossRef]
- Tao, F.; Zhang, Z.; Zhang, S.; Rötter, R.P. Heat stress impacts on wheat growth and yield were reduced in the Huang-Huai-Hai Plain of China in the past three decades. Eur. J. Agron. 2015, 71, 44–52. [Google Scholar] [CrossRef]
- Wu, X.; Qi, Y.; Shen, Y.; Yang, W.; Zhang, Y.; Kondoh, A. Change of winter wheat planting area and its impacts on groundwater depletion in the North China Plain. J. Geogr. Sci. 2019, 29, 891–908. [Google Scholar] [CrossRef] [Green Version]
- Chen, C.; Park, T.; Wang, X.; Piao, S.; Xu, B.; Chaturvedi, R.K.; Fuchs, R.; Brovkin, V.; Ciais, P.; Fensholt, R.; et al. China and India lead in greening of the world through land-use management. Nat. Sustain. 2019, 2, 122–129. [Google Scholar] [CrossRef] [PubMed]
- Rodell, M.; Famiglietti, J.S.; Wiese, D.N.; Reager, J.T.; Beaudoing, H.K.; Landerer, F.W.; Lo, M.-H. Emerging trends in global freshwater availability. Nat. Cell Biol. 2018, 557, 651–659. [Google Scholar] [CrossRef]


| Epoch | Land Cover (Pixels) | Reference | |||||
|---|---|---|---|---|---|---|---|
| Winter Wheat | Other Crops | Deciduous Forest | Evergreen Forest | Built-Up Land | Water | Sources | |
| 1999–2000 | 1547 | - | - | - | - | - | Landsat-5/7GE |
| 2004–2005 | 535 | - | - | - | - | - | Landsat-5/7/GE |
| 2009–2010 | 858 | - | - | - | - | - | Landsat-5/7/GE |
| 2013–2014 | 1547 | - | - | - | - | - | Landsat-8/GE |
| 2014–2015 | 611 | - | 903 | - | 567 | - | Landsat-8/GE |
| 2015–2016 | 381 | 348 | 640 | - | 382 | 90 | Sentinel-2/GE |
| 2016–2017 | 743 | 485 | 625 | 690 | 918 | 388 | Sentinel-2/GE |
| 2017–2018 | 288 | 102 | 508 | 320 | 190 | 837 | Sentinel-2/ GE |
| 2018–2019 | 745 | 447 | 1936 | 154 | 427 | 221 | Sentinel-2/ GE |
| Total | 7255 | 1382 | 4612 | 1164 | 2484 | 1536 | |
| Epodes | Winter Wheat | Non-Winter Wheat | Overall Accuracy | Kappa |
|---|---|---|---|---|
| User’s Accuracy/Producer’s Accuracy | User’s Accuracy/Producer’s Accuracy | |||
| 2014–2015 | 0.979/0.996 | 0.983/0.877 | 0.915 | 0.874 |
| 2015–2016 | 0.988/0.982 | 0.940/0.933 | 0.942 | 0.992 |
| 2016–2017 | 0.930/0.979 | 0.836/0.772 | 0.824 | 0.784 |
| 2017–2018 | 0.900/0.992 | 0.868/0.768 | 0.917 | 0.891 |
| 2018–2019 | 0.958/0.977 | 0.829/0.852 | 0.898 | 0.856 |
Publisher’s Note: MDPI stays neutral with regard to jurisdictional claims in published maps and institutional affiliations. |
© 2021 by the authors. Licensee MDPI, Basel, Switzerland. This article is an open access article distributed under the terms and conditions of the Creative Commons Attribution (CC BY) license (http://creativecommons.org/licenses/by/4.0/).
Share and Cite
Zhang, W.; Brandt, M.; Prishchepov, A.V.; Li, Z.; Lyu, C.; Fensholt, R. Mapping the Dynamics of Winter Wheat in the North China Plain from Dense Landsat Time Series (1999 to 2019). Remote Sens. 2021, 13, 1170. https://0-doi-org.brum.beds.ac.uk/10.3390/rs13061170
Zhang W, Brandt M, Prishchepov AV, Li Z, Lyu C, Fensholt R. Mapping the Dynamics of Winter Wheat in the North China Plain from Dense Landsat Time Series (1999 to 2019). Remote Sensing. 2021; 13(6):1170. https://0-doi-org.brum.beds.ac.uk/10.3390/rs13061170
Chicago/Turabian StyleZhang, Wenmin, Martin Brandt, Alexander V. Prishchepov, Zhaofu Li, Chunguang Lyu, and Rasmus Fensholt. 2021. "Mapping the Dynamics of Winter Wheat in the North China Plain from Dense Landsat Time Series (1999 to 2019)" Remote Sensing 13, no. 6: 1170. https://0-doi-org.brum.beds.ac.uk/10.3390/rs13061170