Article

Contribution of Snow-Melt Water to the Streamflow over the Three-River Headwater Region, China

1
Key Research Institute of Yellow River Civilization and Sustainable Development & Collaborative Innovation Center on Yellow River Civilization Jointly Built by Henan Province and Ministry of Education, Henan University, Kaifeng 475001, China
2
Department of Civil and Environmental Engineering, Washington State University, Pullman, WA 99164, USA
3
Key Laboratory of Tibetan Environment Changes and Land Surface Processes, Institute of Tibetan Plateau Research, Chinese Academy of Sciences, Beijing 100101, China
4
Department of Geography, University of California, Los Angeles, CA 90095, USA
5
Institute of Geographic Sciences and Natural Resources Research, Chinese Academy of Sciences, Beijing 100101, China
*
Author to whom correspondence should be addressed.
These authors contributed equally to this work.
Submission received: 22 March 2021 / Revised: 15 April 2021 / Accepted: 16 April 2021 / Published: 19 April 2021
(This article belongs to the Special Issue Remote Sensing for Streamflow Simulation)

Abstract

:
Snowmelt water is essential to the water resources management over the Three-River Headwater Region (TRHR), where hydrological processes are influenced by snowmelt runoff and sensitive to climate change. The objectives of this study were to analyse the contribution of snowmelt water to the total streamflow (fQ,snow) in the TRHR by applying a snowmelt tracking algorithm and Variable Infiltration Capacity (VIC) model. The ratio of snowfall to precipitation, and the variation of the April 1 snow water equivalent (SWE) associated with fQ,snow, were identified to analyse the role of snowpack in the hydrological cycle. Prior to the simulation, the VIC model was validated based on the observed streamflow data to recognize its adequacy in the region. In order to improve the VIC model in snow hydrology simulation, Advanced Scanning Microwave Radiometer E (ASMR-E) SWE product data was used to compare with VIC output SWE to adjust the snow parameters. From 1971 to 2007, the averaged fQ,snow was 19.9% with a significant decreasing trend over entire TRHR (p < 0.05).The influence factor resulted in the rate of change in fQ,snow which were different for each sub-basin TRHR. The decreasing rate of fQ,snow was highest of 0.24%/year for S_Lantsang, which should be due to the increasing streamflow and the decreasing snowmelt water. For the S_Yangtze, the increasing streamflow contributed more than the stable change of snowmelt water to the decreasing fQ,snow with a rate of 0.1%/year. The April 1 SWE with the minimum value appearing after 2000 and the decreased ratio of snowfall to precipitation during the study period, suggested the snow solid water resource over the TRHR was shrinking. Our results imply that the role of snow in the snow-hydrological regime is weakening in the TRHR in terms of water supplement and runoff regulation due to the decreased fQ,snow and snowfall.

1. Introduction

Seasonal snowpack accumulation in the cold season and ablation on warm days are considered bridge among the cryosphere, climate system, and surface energy and water balance; and snowpack supply a large amount of freshwater to surface and groundwater reservoirs, which are valuable for water resource utilization such as agricultural irrigation, hydroelectric generation, eco-hydrological utility, and urban economic activities [1,2,3,4,5,6,7]. Snowpack also functions as a vital regulator for the inter-annual and intra-annual variation of streamflow by releasing and storing water in dry and wet years/seasons, respectively [8,9]. Globally, on average, 5% of precipitation falls as snowfall; the snow cover in the northern hemisphere can reach 4.6 × 10⁷ km2, approximately 50% of its total land area [10,11]. More than one-sixth of the world’s population is dependent on glacier and seasonal snowmelt water, and one-quarter of livestock products are produced in snow-dominated mountainous regions [2]. The characteristics of snowmelt are an important component in hydrological process simulation, especially at high-altitude and arid areas, where snowmelt water is considered to be a dominant resource [12]. However, the floods caused by extensive snowmelt may destroy transportation infrastructure, buildings, and agriculture lands [13,14].
Snow is extremely sensitive to temperature and precipitation variation and therefore, it functions as an indicator of climate change. With increasing temperature, the melting of snow accelerates, resulting in rapid loss of water storage in the form of snowpack or glacier. Additionally, more rainfall than snowfall in the winter can decrease snowpack accumulation and shrink available water in the coming summer season. With global warming, the variability in the volume, extent, and seasonality of snowpack, snowmelt runoff, and the influencing factors to the snow hydrology regime over most high elevation or mountainous regions is well documented. Partly due to differences in data sources and methodologies, a wide range of results in terms of snow hydrology have been reported over the last several decades. Li et al. [15] found that snow cover area declined by 0.970 (percent per pixel) globally, 1.064 (percent per pixel) over mid-latitude region, and 0.792 (percent per pixel) in higher latitudes based on MOD10CM from 2002 to 2016. Adam et al. [16] reported that both snow accumulation in winter and snowmelt in spring sharply decreased with projected warming at the global scale. Coppola [17] determined that the time of snowmelt-driven runoff would span one to three months with temperature increasing by up to 4 °C over the alpine region. Clow [3] indicated that the snowmelt shifted 2–3 weeks earlier in the year based on the daily SWE, as determined from snowpack telemetry in Colorado.
The contribution of snow to runoff was estimated using various methods and data including the ratio of snowfall to the total precipitation [18], snowfall to total runoff [2,18], SWE to precipitation [19], snowmelt runoff to total runoff [20], degree-day approaches [21,22,23]. Kang et al. [24] quantified the contribution of snow to runoff by using the ratio of the spatially averaged peak SWE to runoff and showed that the ratio was in decrease during the period 1949 to 2006 over Fraser River Basin. Islam [25] regarded the difference between SWEmax (maximum) and SWEmin (minimum) of the runoff as the contribution of snow to runoff generation and predicted a decrease of 15–30% across Fraser River Basin from 2040 to 2069. Grover et al. [22] adopted degree-day approaches of conceptual hydrological model to estimate the contribution of snow melt to the total runoff over Western Himalaya. However, these quantitative methods might overestimate the contribution of snowmelt to streamflow as the losses and exchanges of snowmelt to evapotranspiration and infiltration before water flows into river channels are overlooked. Compared with the previous studies, the snowmelt tracking system quantifies the contribution of snowmelt to streamflow by tracking the fate of snowmelt using modelled hydrologic influxes [4], which emphasizes the physical process affecting the transformation of snow to streamflow including evapotranspiration, infiltration, sublimation, and rainfall. Moreover, differences between snow-derived water and rainfall-derived water to streamflow could also be estimated.
Located in the Qinghai-Tibet Plateau, the Three-River Headwater Region (TRHR) is one of the largest nature reserves in China. Seasonal snow fluctuates widely in this region and accounts for approximately 20% of the area. The snowmelt in spring replenishes the rivers flowing from this region which offer considerable water resources to millions of people downstream. With obvious change in temperature and precipitation, the impacts of climate change on snow hydrology are already evident over the TRHR. The peak flow of spring occurred earlier by approximately 15 days because of the earlier snow melt over the source region of the Yellow River (S_Yellow) in the last three decades, as explained by Meng et al. [26]. Given the vital roles of snowmelt-derived runoff in supplying water resources during a low flow period, it is essential to quantify the amount of streamflow originated from snow and its variations with global warming. Han et al. [12] reported that snow and glacier melt water contributed 7% and 5% to the runoff, respectively, over the source region of the Yangtze River(S_Yangtze), by means of remote sensing data. Zhang et al. [27] estimated that the contribution of glaciers to runoff is minor for the S_Yellow and Lantsang River (S_Lantsang), and is moderate for the S_Yangtze, using a degree-day glacier melt scheme. Li et al. [28] investigated fraction of the glaciers snow meltwater to the river water at the Tuotuohe national hydrological station over the Yangtze river. These studies provided useful basic parameters for improving the hydrology model in alpine regions and valuable references for stakeholders to make informed decisions in water resource management. However, to our knowledge, detailed research on the regional difference of the fQ,snow over the TRHR is lacking. In addition, most previous studies neglected the physical processes of the snowmelt transformation to the streamflow such as evapotranspiration, sublimation, infiltration, and rainfall, which may have important impacts on the snowmelt water before it flows into the river channel.
Thus, the objectives of this study were to analyse the fQ,snow based on a snowmelt tracking algorithm and by the simulated variable infiltration capacity (VIC) model results over the TRHR. Our analysis was performed using daily data over three major sub-basins of the TRHR during the period of 1971 to 2007. We aim to (1) track the snowmelt water and quantify the fQ,snow (2) investigate seasonal snow accumulation and the ratio of snowfall and rainfall to precipitation; and (3) spatially explore the regional difference of snow hydrology variables over the TRHR. This study is expected to improve our understanding on the response of regional snow hydrological processes to global warming, therefore assisting decision-making for water resource management and ecological restoration.

2. Materials and Methods
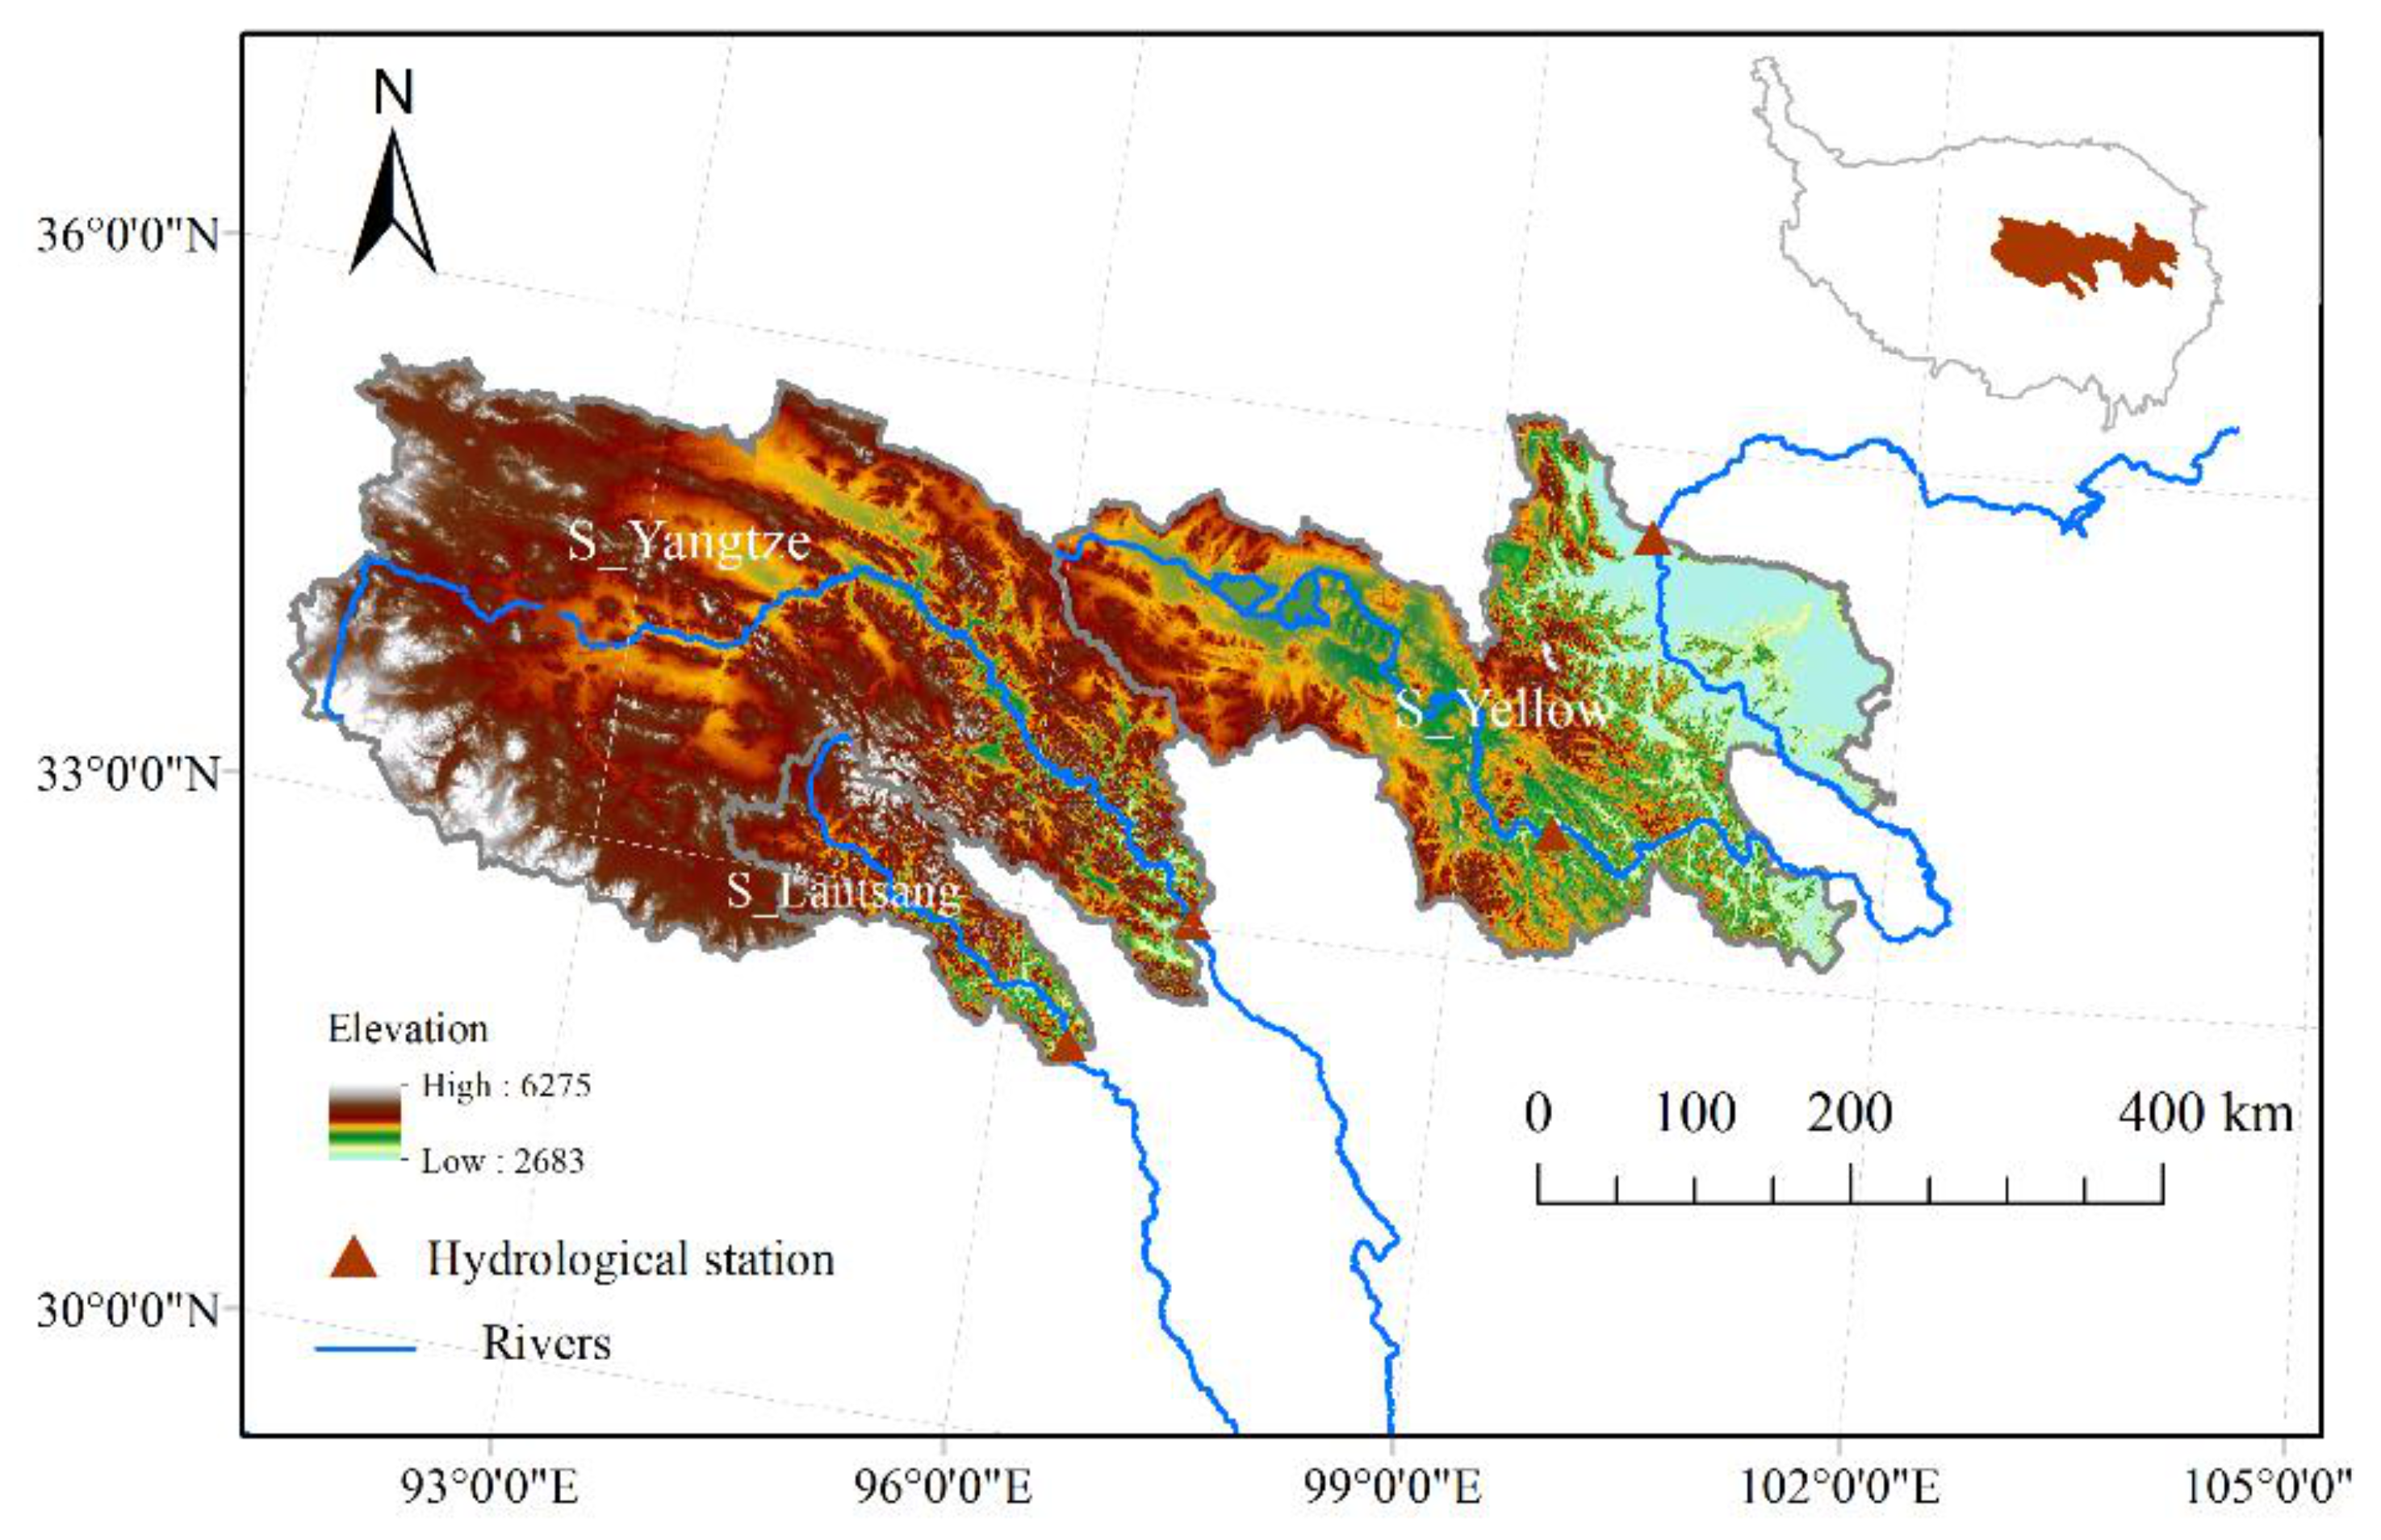
2.1. Study Area

Covering 302,500 km2 and holding the headwaters of the Yangtze, Yellow, and Lantsang rivers, the TRHR is referred to as China’s “water tower”. It contains three sub-basins, namely, the S_Yellow, S_Lantsang, and S_Yangzte (Figure 1). The average elevation is higher than 4000 m, with terrain sloping from the west to the east. Mountains with an elevation of 5000–6000 m run through the TRHR and have the characteristics of mountain ranges, complex topography, and perennial snow distribution. The annual average precipitation is approximately 423 mm and it shows a significantly increasing trend [29]. The precipitation shows a southeast-northwest negative gradient because of mountains in the southeast, which block the moisture from flowing to the northwest, and the S_lantsang is wetter than the other two sub-basins [30]. The annual average temperature ranges from −5.6 °C to −3.8 °C, and the average temperature of July and January is from 6.4 °C to 13.2 °C and −6.6 °C to −13.8 °C, respectively [31]. The alternation of dry and wet seasons is a common phenomenon over the entire TRHR.
The TRHR is at the highest altitude and has the largest natural ecological reserve in China, with a wetland area of 73,300 km2 and abundant wildlife diversity. Seasonal snow and permanent glaciers in the TRHR play important roles in recharging rivers. The glaciers and snow cover an area of approximately 2400 km2. Recently, under the context of global warming, glacier and snow cover area have shown obvious changes [32]. Moreover, some rivers and lakes have tended to become dry and the degradation of wetlands has been estimated to prevail in the mid-21st century [33]. This process adds more pressure on local people and regions facing existing desertification and grassland degradation problems.

2.2. VIC Model and Setup

The original VIC model was developed by Wood [34,35]; however, only one soil layer was considered in their study. With the continuous improvement of the VIC model, VIC-3L, i.e., with three soil layers, was established [36]. This model not only incorporates the cohort structure of land surface in terms of water and energy balance for each land cover type over each single grid cell but also includes the dynamic diffusion of soil moisture between soil layers. It has already been used widely in various aspects of research, such as hydrological regime simulation, water resource assessment, and land-atmosphere interactions [37,38,39,40].
In this study, we employed the VIC-3L, which is a large-scale, semi-distributed hydrological model, and the simulation domain is normally divided into multiple rectangular grid cells, each one with its own meteorological data and underlying surface parameters. The following processes of water balance and energy balance items were simulated: soil evaporation and vegetation evapotranspiration, long wave and short-wave radiation, sensible and lateral heat flux, infiltration, surface runoff, and baseflow. These simulated processes in each gird cell are independent with respect to neighbouring grid cells. The VIC model adopted different approaches to simulate surface runoff and baseflow. For the runoff generation, the saturated capacity curve method for runoff generation was used, which considers the effects of soil saturated water capacity distribution to runoff. Subsurface runoff uses the Arno model. Runoff at the basin outlet was routed with a post-process routing model, where after-surface runoff and baseflow in each grid cell were simulated [41,42]. Snow accumulation and ablation at the snow surface in the VIC model were simulated with a two-layer energy-balance model [43,44]. The rain or snow fraction calculated by the model is added to the snowpack.
In this study, the TRHR contained 7398 grid cells with a spatial resolution of 5 min (or 1/12°) in latitude and longitude. Each grid cell displayed its soil, vegetation mix, meteorological, and elevation. The observed soil and vegetation types in each cell must match the VIC model soil and vegetation databases. Soil types that characterized the TRHR were derived from the Harmonized World Soil Database version (HWSD). The VIC soil database includes over 20 typical soil types and their corresponding soil properties (e.g., soil bulk density, soil particle density, surface roughness, etc.), which affect the simulation [24,45]. Vegetation type characterized in the TRHR were derived from University of Maryland’s 1 km Global Land cover product [46]. It was composed of 14 land cover classes among which, there are 11 vegetation types and 3 non-vegetation classes i.e., water body, urban, and bare land. Details on the soil and vegetation parameters can be found in Zhang et al. [27].
The VIC model was run at 1/12° spatial resolution at a daily time step. The time period from 1971 to 1980 was used for calibration and that from 1981 to 1990 was used for validation. The Nash-Sutcliffe coefficient (NSE) and index of agreement of D were used to evaluate the result of calibration and validation by minimizing the difference between simulated and observed streamflow [47,48]. The value of the NSE ranges from negative infinity to 1. When the value is close to 1, a good agreement between simulated and observation values is suggested. If NSE is significantly less than 0, the simulation result is poor. D ranges from 0 (the worst performance) to 1 (best performance). NSE and D were calculated as:
D = 1 i = 1 N P i M i 2 i = 1 N P i M ¯ + M i M ¯ 2
N S E = 1 i = 1 N P i M i 2 i = 1 N M i M ¯ 2
where Mi and Pi are the simulated and measured values, respectively; M ¯ is the average measured value; and N is the number of measurements and simulations.
Over the three sub-basins, six soil properties that control surface runoff and baseflow were calibrated against observations to determine the optimal parameters. They included D2 and D3 (the depths of the second and third soil layers, respectively), Dsmax (the maximum velocity of baseflow for each grid cell), Ds (the fraction of the Dsmax parameter at which nonlinear baseflow occurs), Ws (the fraction of maximum soil moisture where nonlinear baseflow occurs), and b_infilt (a parameter of the variable infiltration curve). The final value of the optimized six parameters was evaluated by minimizing the differences between simulated and observed discharge records.
Table 1 lists the definitions, ranges, and final value of these six optimized parameters by comprehensive comparative analysis at the chosen hydrologic stations across the TRHR.

2.3. Forcing Dataset

In this study, the VIC model was driven by the daily maximum and minimum temperature, daily average wind speed at a height of 2 m, and daily precipitation from 1971 to 2007 at a 1/12° horizontal resolution. The forcing data of maximum and minimum temperature and wind speed were obtained from the National Meteorological Information Center of China and interpolated using the thin plate spline method based on the basic meteorological factors of 2472 meteorological stations.
For the precipitation, Asian Precipitation-Highly Resolved Observational Data Integration Towards Evaluation of Water Resources (APHRODITE) was adopted and it was developed by the University of Tsukuba and Japan Meteorological Agency/Akiyo. It has already been widely used in the study of regional hydrology cycle and climate change because of its wide scope of coverage and high resolution [27,49]. The APHRODITE precipitation data (with 0.25º resolution) and the NMIC data were resampled using bilinear interpolation for the resolution of 1/12° before being used. During the interpolation, the temperature was adjusted with estimated uniform monthly mean lapse rate and elevation (daily maximum and minimum temperature are conducted separately).

2.4. Observed Hydrological Data

Streamflow of five hydrologic stations (acquired from the Hydrology Bureau of Qinghai) over the TRHR were used to calibrate and validate the VIC model. Zhimenda and Tuotuohe stations are located in the S_Yangtze; Xiangda station in the S_Lantsang; and Jimai and Tangnaihai in the S_Yellow (Table 2).

2.5. AMSR SWE

Reliable remote sensing SWE is crucial to understand the evolution of cryosphere for improving the hydrological models [50]. Advanced Scanning Microwave Radiometer E (ASMR-E), boarded on the NASA EOS Aqua satellite, provide almost global coverage for SWE estimation. AMSR-E/Aqua Monthly L3 Global Snow Water Equivalent EASE-Grids, Version 2 (https://nsidc.org/data/AE_MoSno/versions/2, accessed on 6 August 2019) derived from National Snow & Ice Data Center, was used to compared with VIC model output SWE to adjust the snow parameters in this study.

2.6. Snowmelt Tracking Algorithm

To quantify the contribution of snow-melt water to the streamflow, a snowmelt tracking algorithm was adopted [4]. The fQ,w was calculated based on the modelled surface and sub-surface runoff fluxes, meteorological data, and water balance equations. The fQ,snow was calculated as follows:
f Q , s n o w = Q s n o w / Q
where Qsnow is the streamflow that originates as snow, and Q is the total streamflow. In the VIC model, streamflow at each time step t is equal to the sum of baseflow Bt, and surface runoff, Rt. The contribution of snowmelt water to streamflow at each time step t could be calculated from the following equation:
f Q , s n o w = R s n o w , t + B s n o w , t R t + B t
In Equation (4), Rsnow,t and Bsnow,t are the surface runoff and baseflow derived from snow, respectively. The snowmelt tracking algorithm tracks the snowmelt water in surface water, soil, and the atmosphere. In addition, before snowmelt water flows into river channels, the losses and exchanges were both considered. By calculating the weighted average of fQ,snow of every grid, we estimated the average contribution of snowmelt water from 1971 to 2007 over the TRHR.

3. Results and Discussion

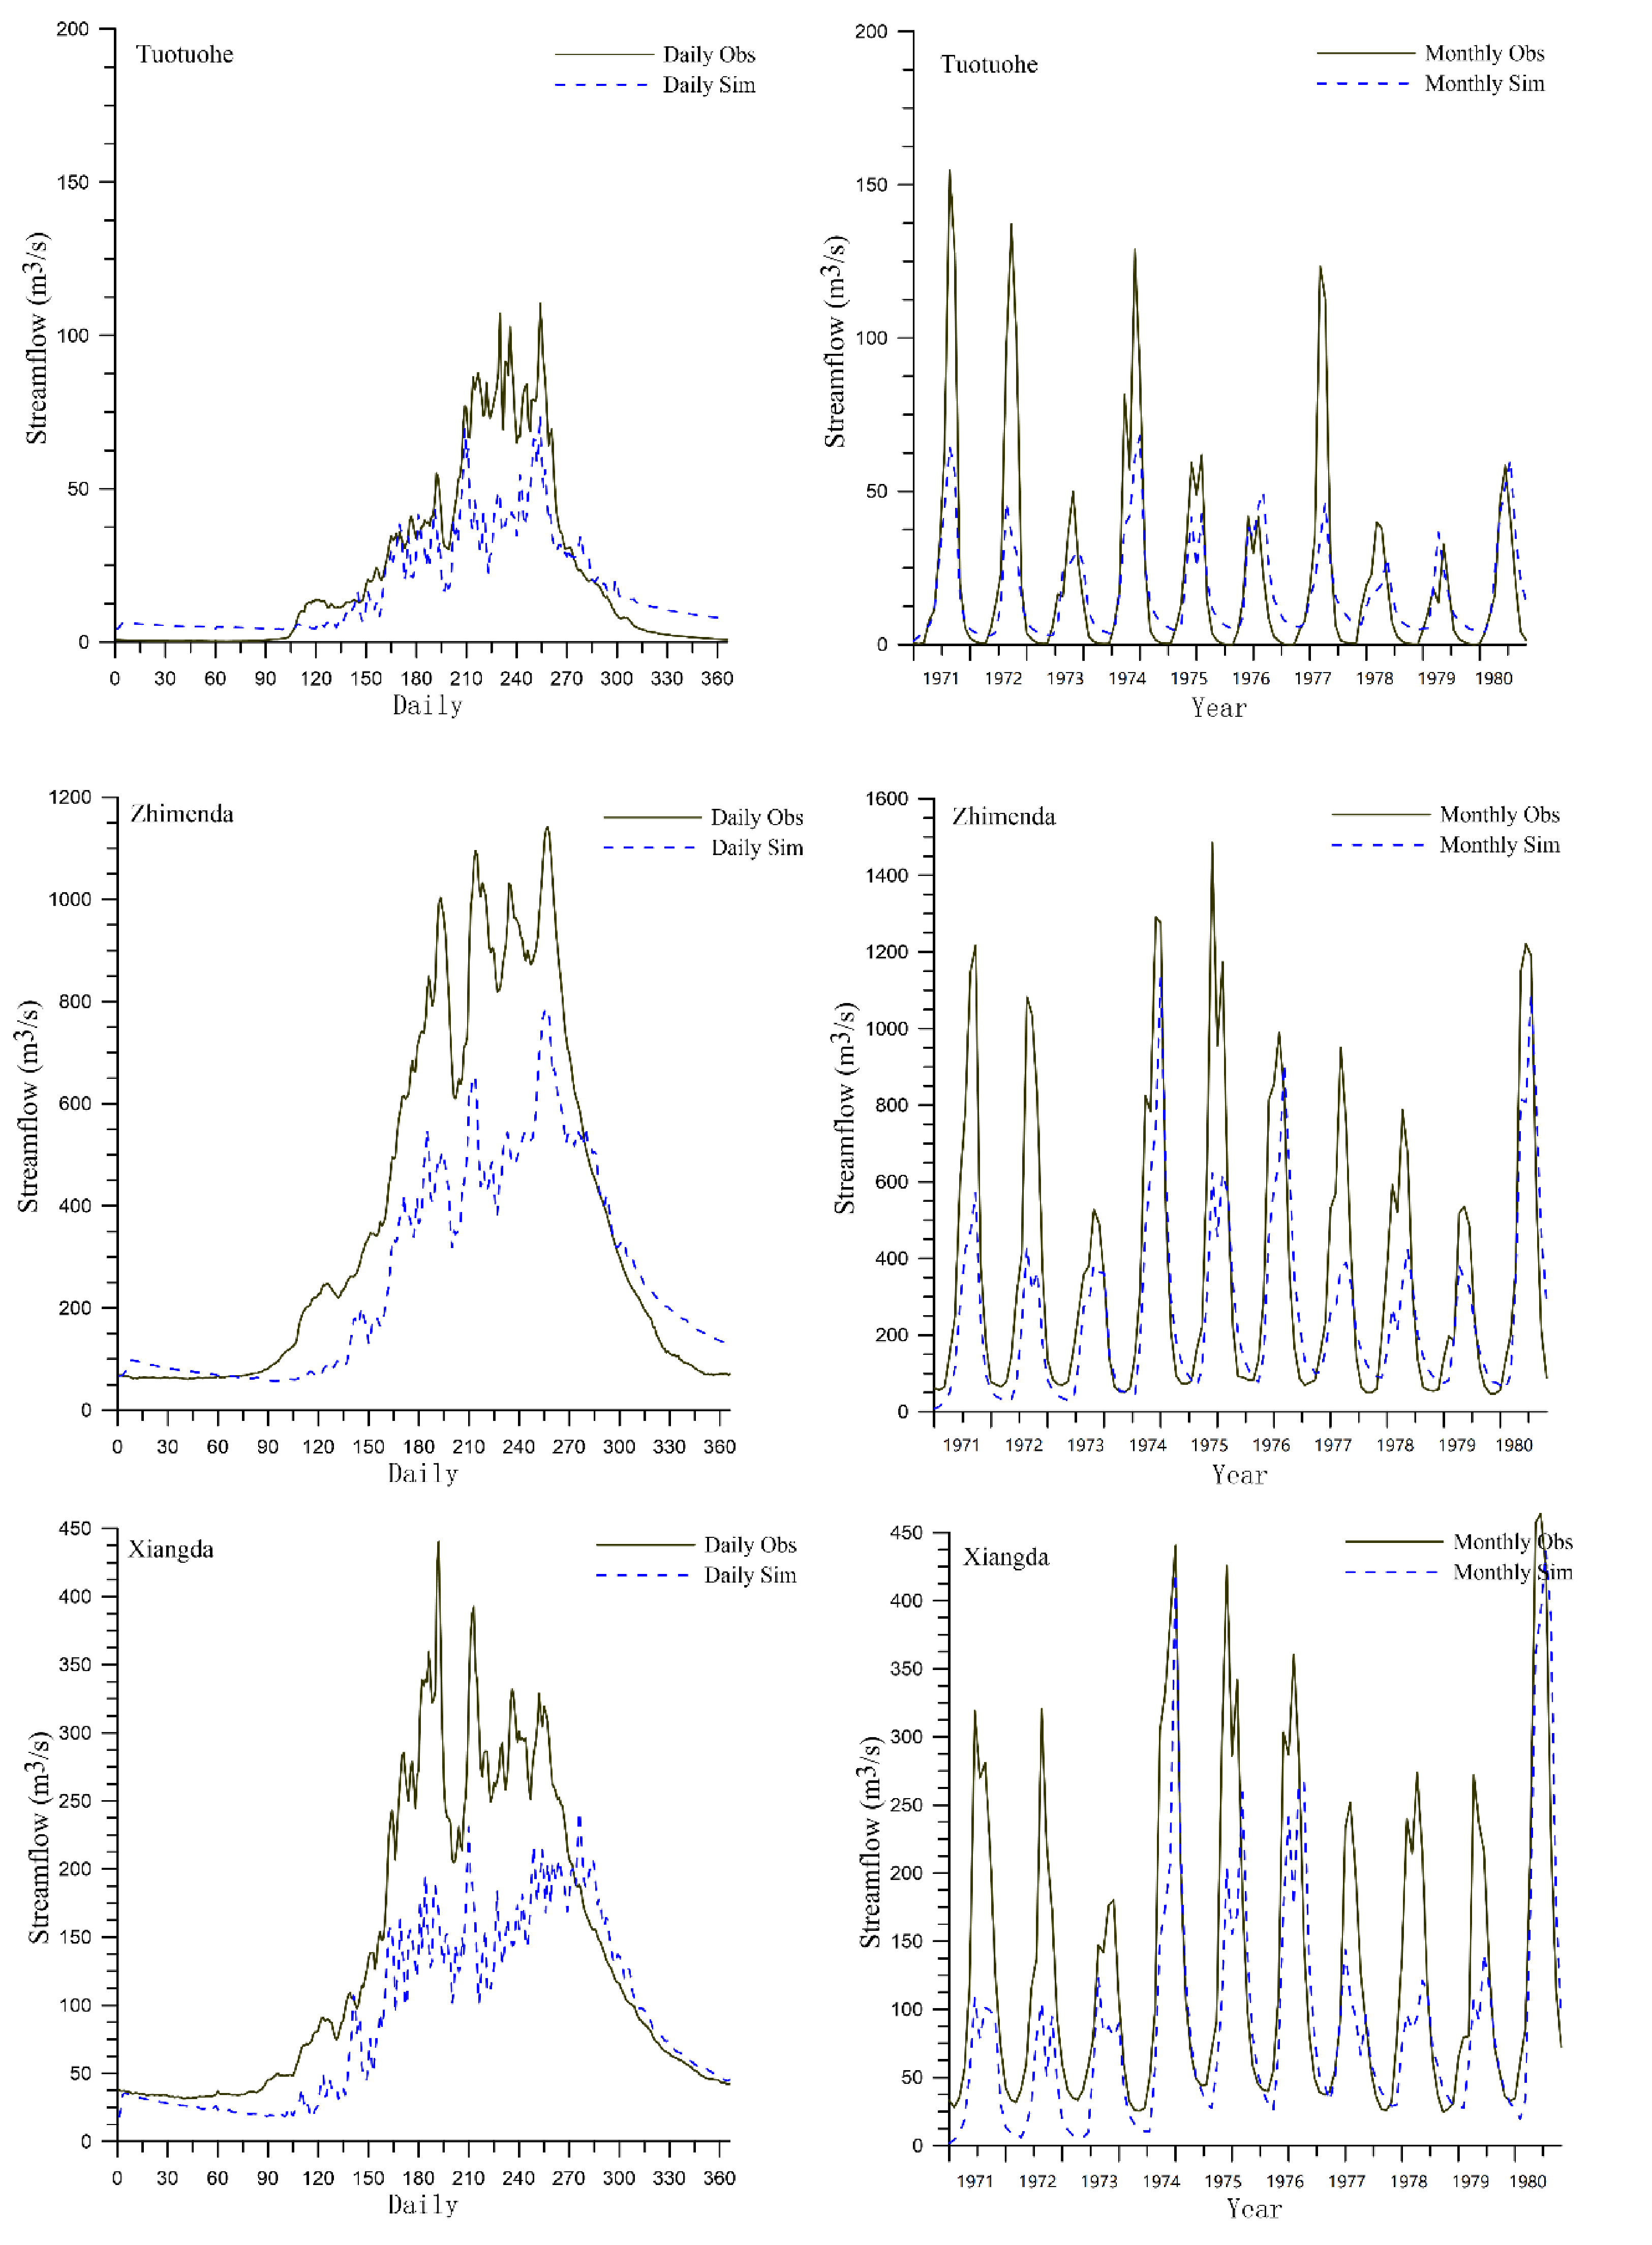
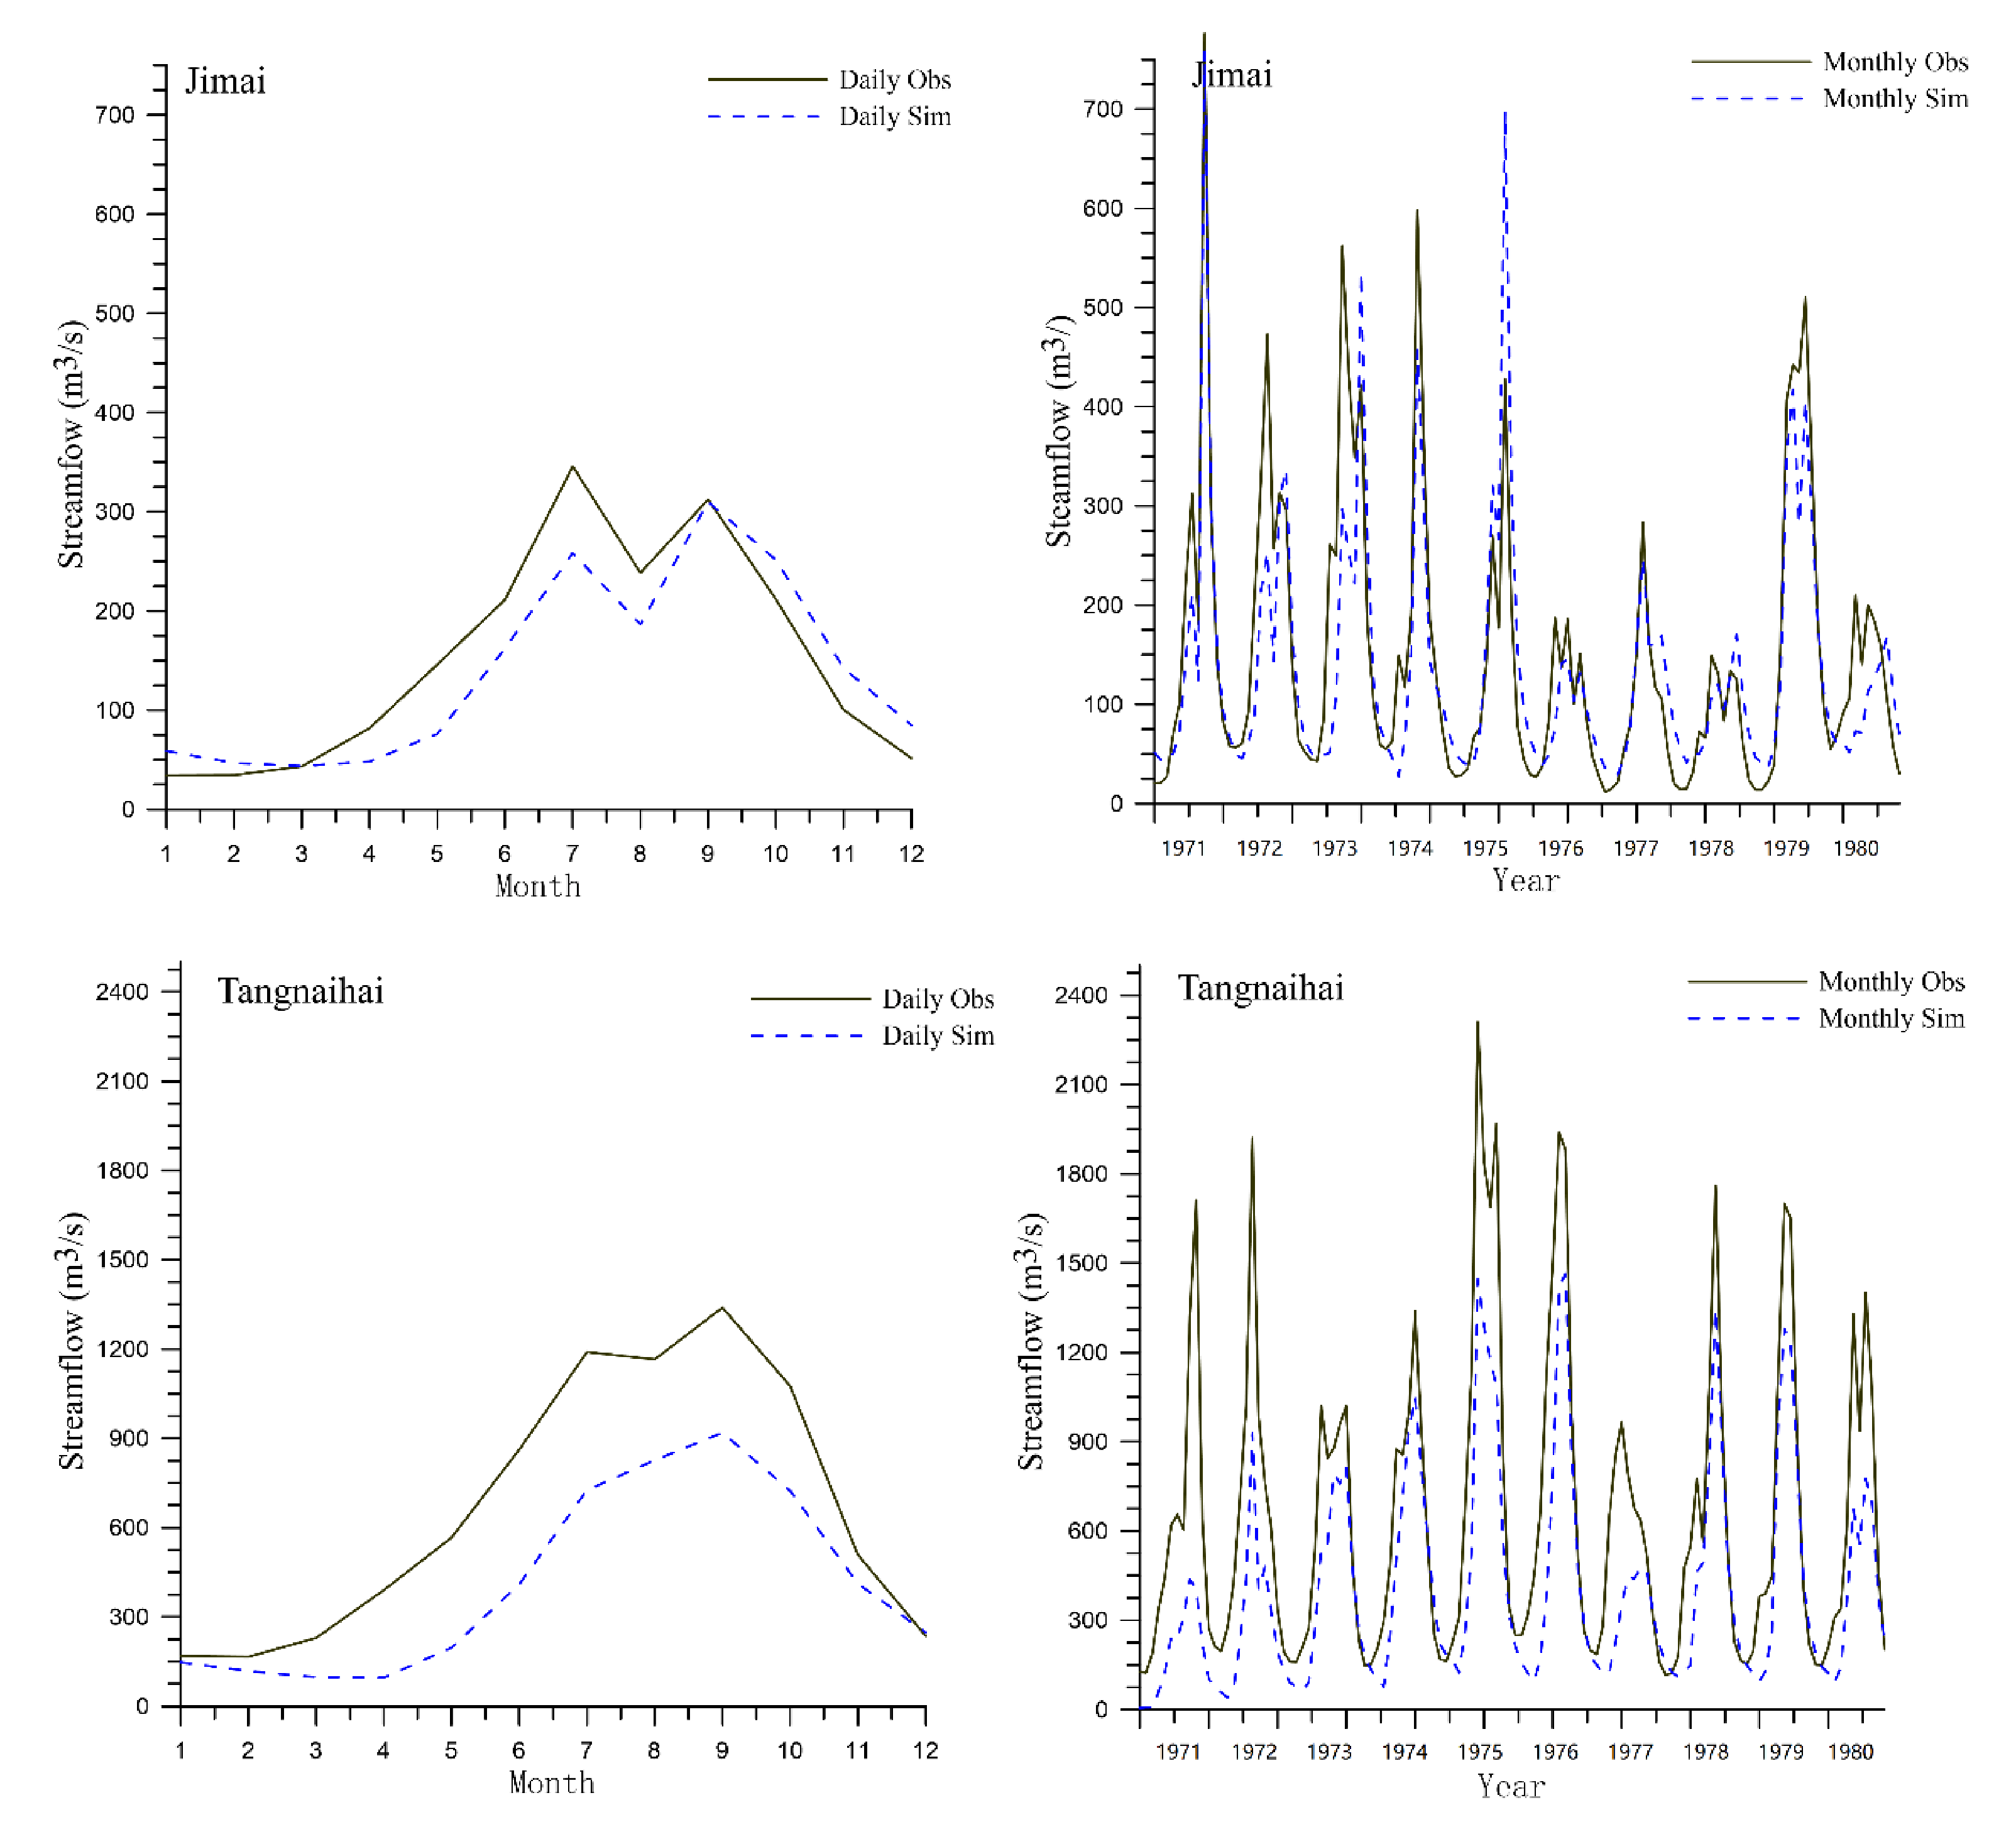
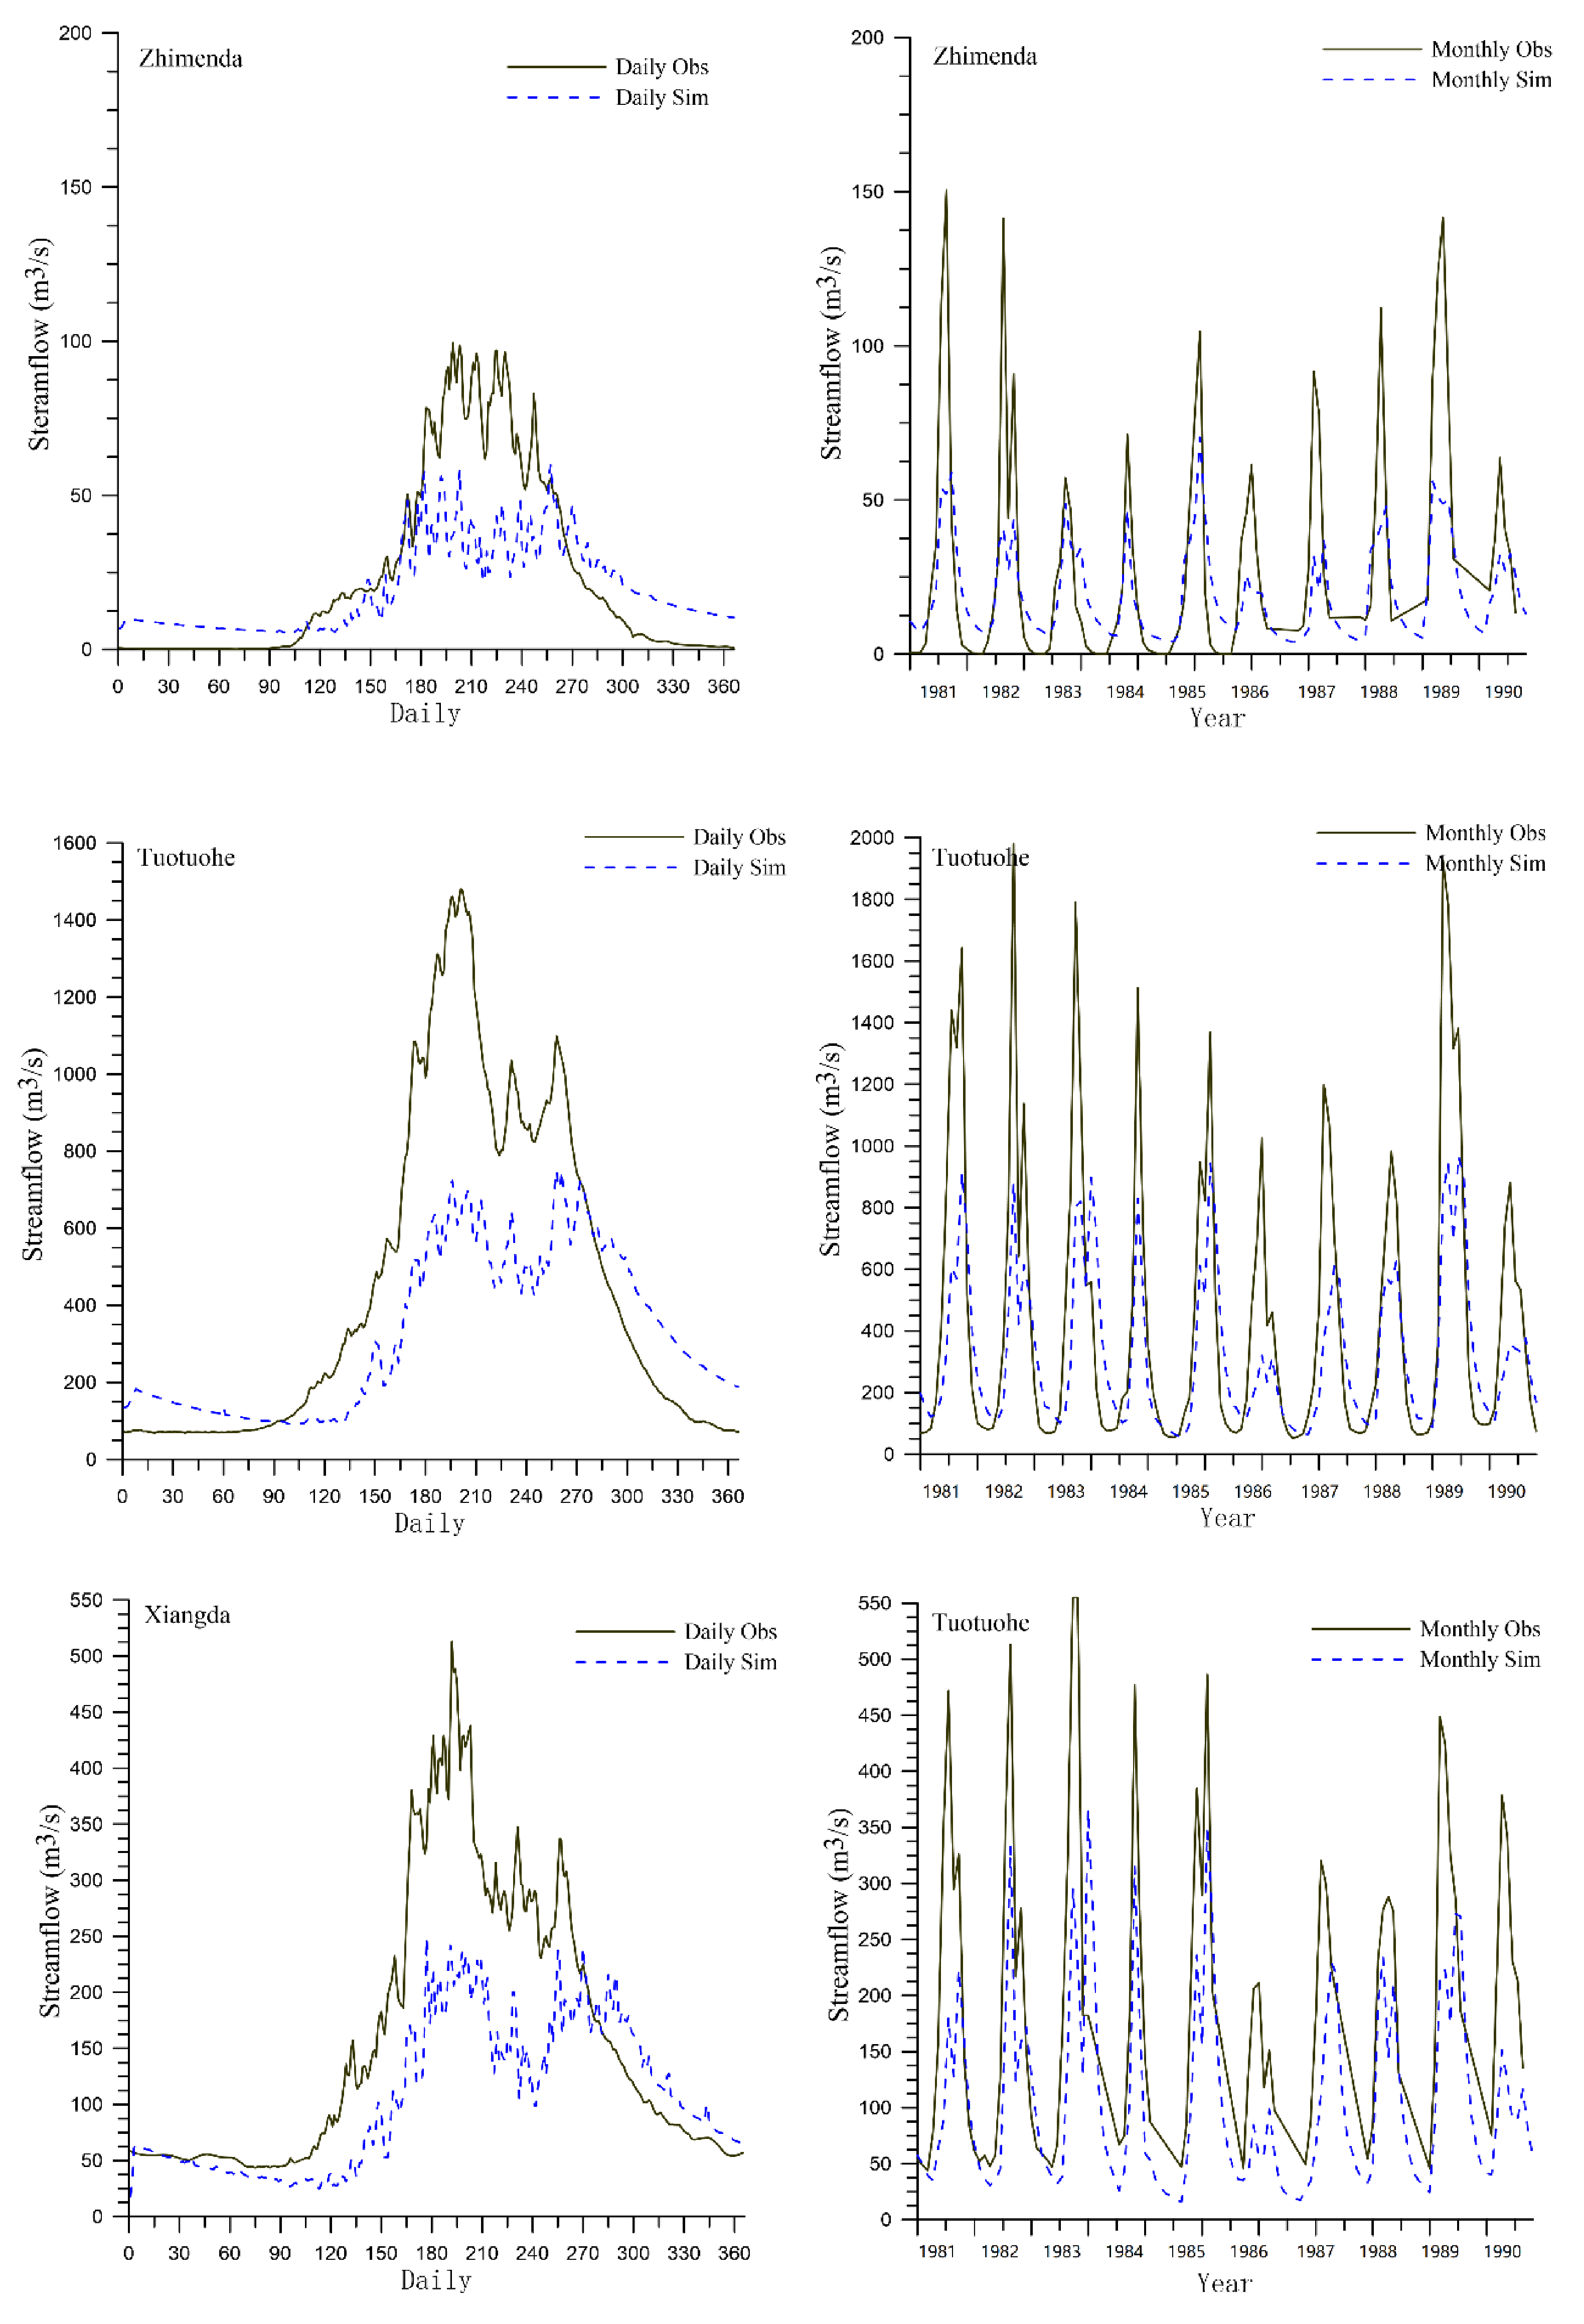
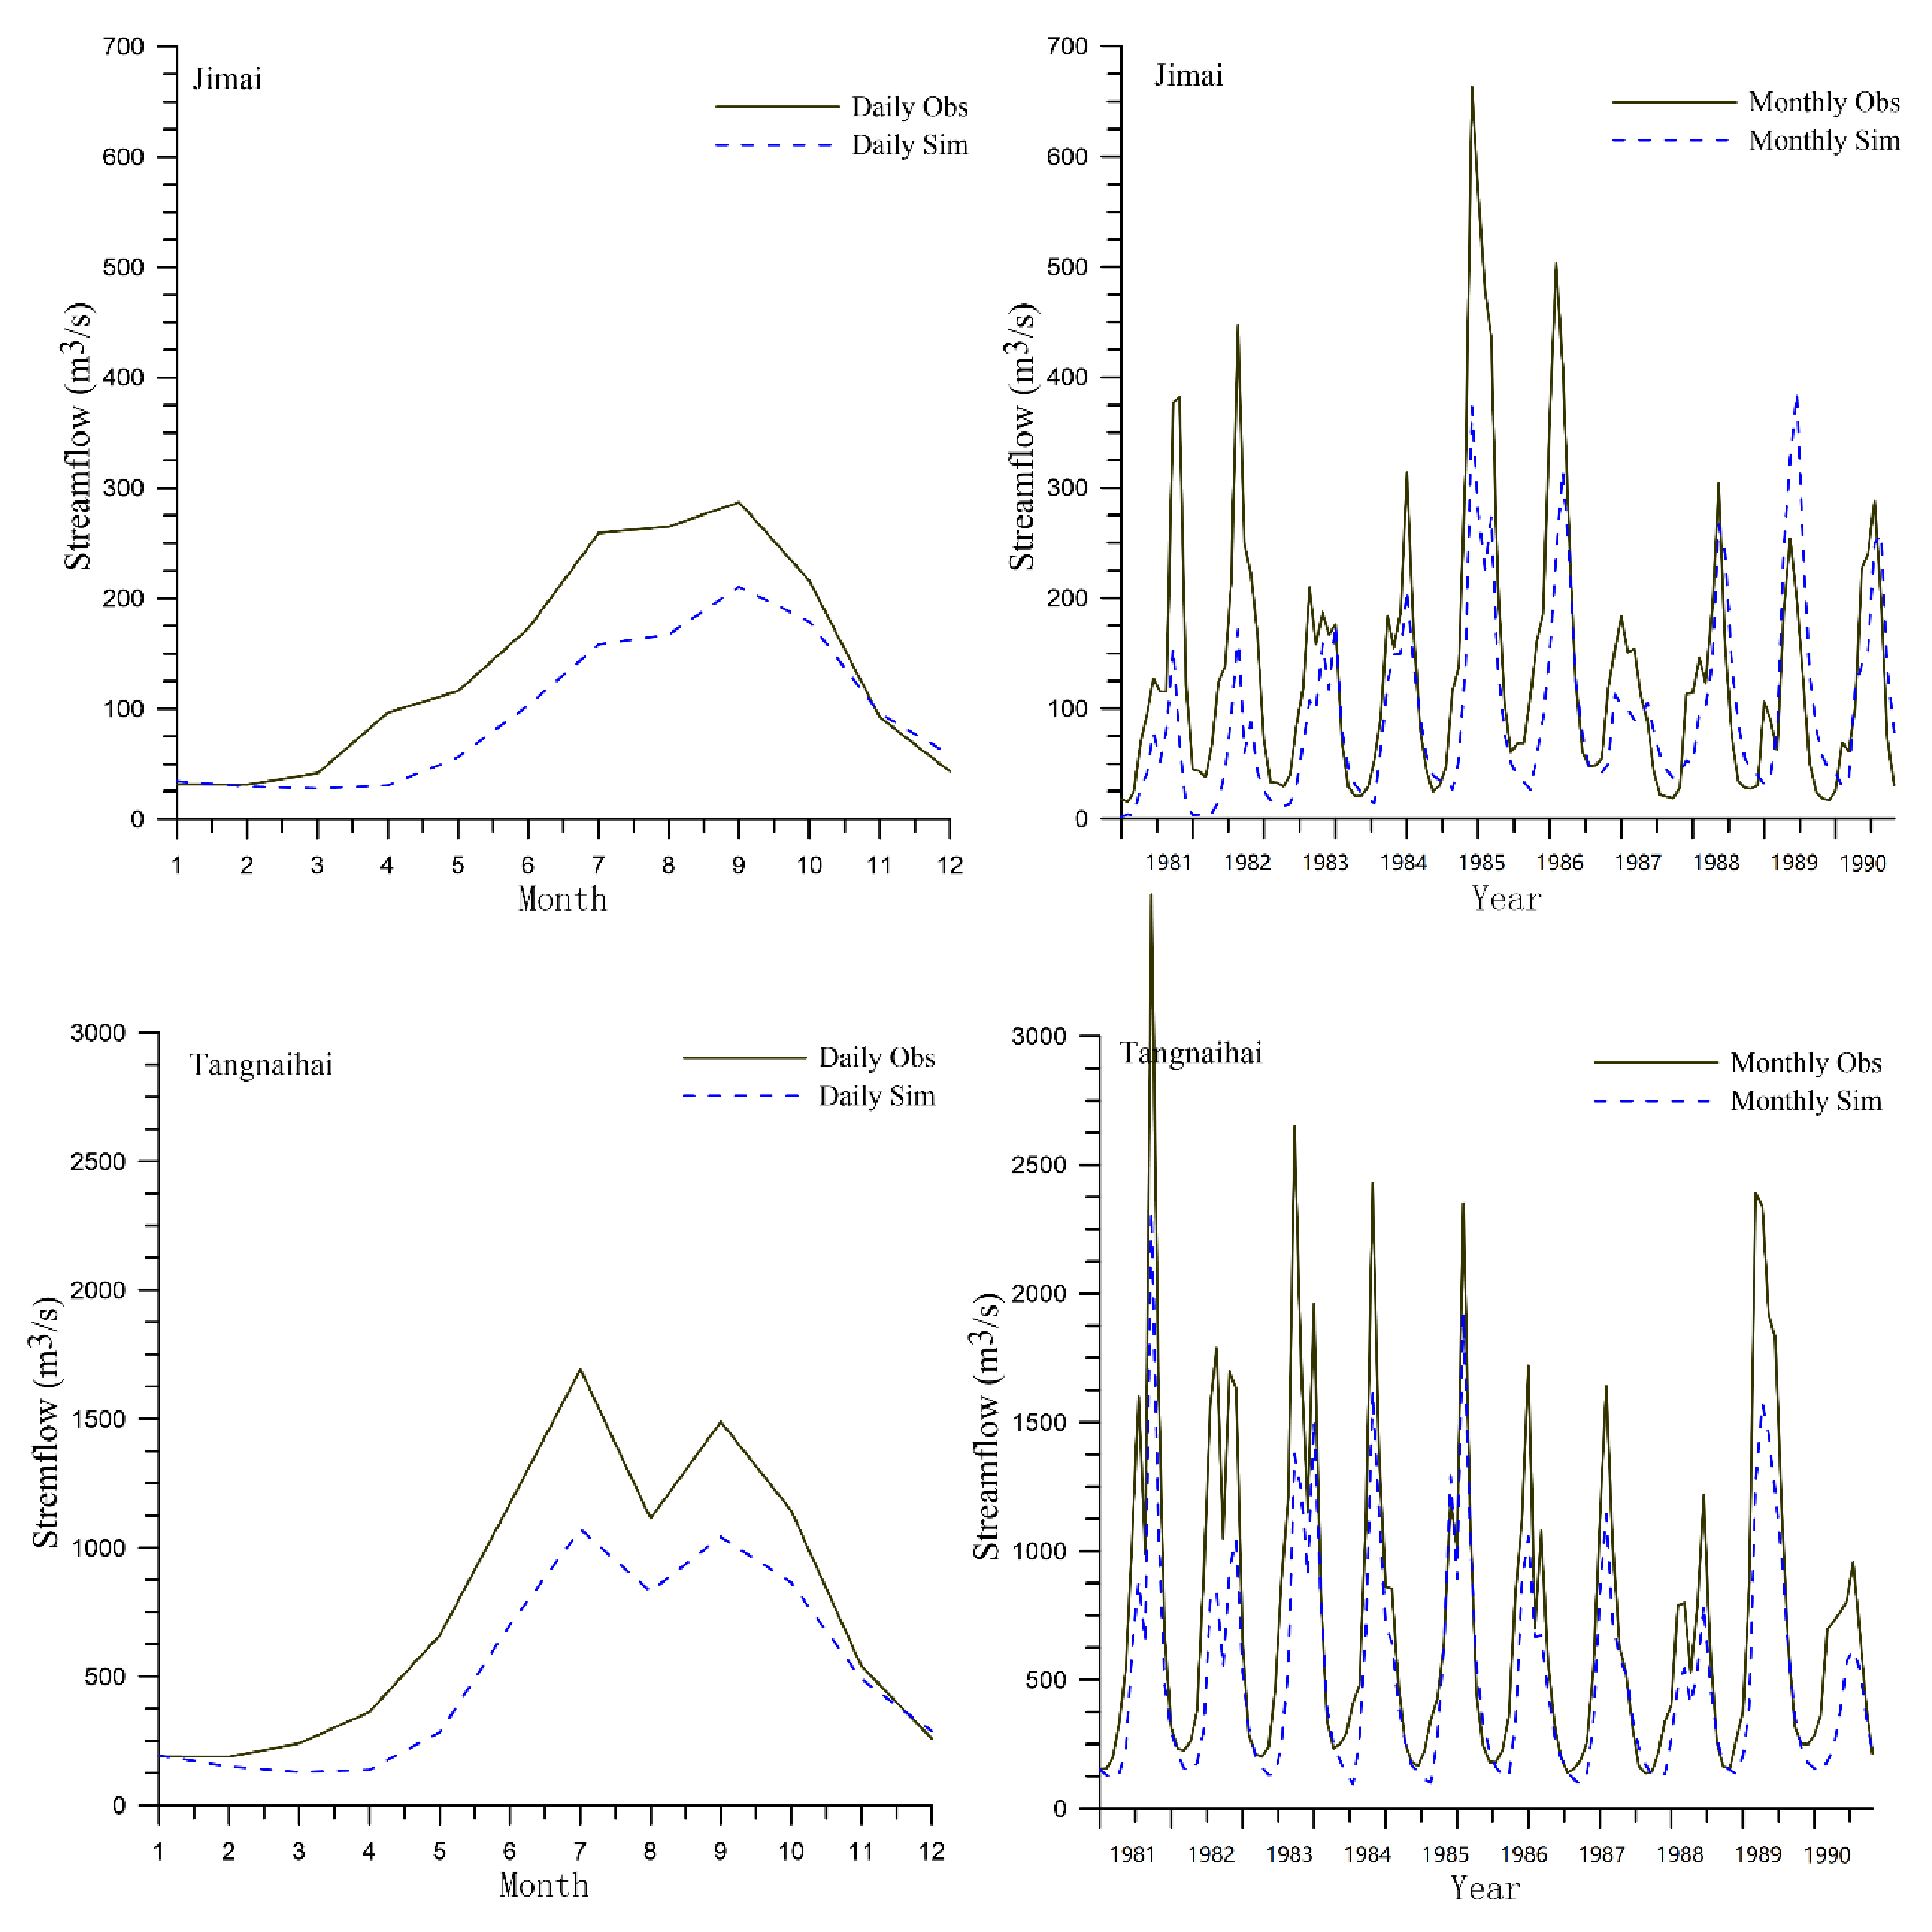
3.1. VIC Performance

Figure 2 and Figure 3 depict the comparison between simulated streamflow and observations over these five hydrologic stations during calibration and validation periods, respectively. Table 3 lists the evaluation metrics of these stations.
In general, the simulated streamflow was determined to be smaller than the observations; this might be attributed to the routed catchment area being smaller than the actual one. Nevertheless, the variation of characters and the time of peak flow were accurately captured during the calibration and validation period (Figure 2 and Figure 3), with a D value greater than 0.70 and an NSE value ranging from 0.40 to 0.94. Moreover, with larger drainage area, the model performance during calibration and validation period were more acceptable. For example, the NSE and D values at Zhimenda were higher than at Tuotuohe over the S_Yangtze during the validation and calibration period (Table 3). In 1984, 1985, and 1988 the simulated streamflow at Zhimenda fitted better with the measurement, and the agreement D values were all more than 0.85. Over the S_Lantsang, the simulated streamflow at Xiangda reasonably estimated the peak time and magnitude of seasonal variation but estimated lower values than observations during the validation period. The model performance over the S_Yellow was the best (the highest NSE and D values) (Table 3; Figure 2 and Figure 3). During the calibration period, eight years showed a D value higher than 0.8, and during the validation period, the D and NSE values over the 10-year study period were higher than 0.85 and 0.65, respectively.
The TRHR has numerous large lakes and is surrounded by glaciers in some marginal areas. As a result, the effects of lakes and glaciers on the hydrological regimes may be significant in this region. In this study, we did not operate the lake model or track the glacier’s dynamics, which may contribute to the discrepancies between simulated and measured values. For example, since the glacier area over the S_Yellow is much smaller than that over the S_Yangtze and S_Lantsang, the simulated results over the S_Yellow are better than those of the S_Yangtze and S_Lantsang.
The performance of the VIC model varies based on quality of forcing data, the study area, and the time scale. For example, to assess the impacts of climate change on snow and water resources over the Fraser River Basin, Islam et al. [25] calibrated the VIC model and reported that the NSE ranged from 0.62 to 0.97 [22]. Similar research over the Fraser River Basin by Kang et al. reported that NSE was within 0.37–0.87 [25]. Zhang et al. [27] reported that the NSE of the simulated monthly streamflow could reach up to 0.88 or fall to 0.38 for major rivers over the Tibetan Plateau [27]. Compared with these previous studies on the VIC model, the validation results in this study of the TRHR indicated that this model is robust for evaluating the changes in the snow hydrology regime.

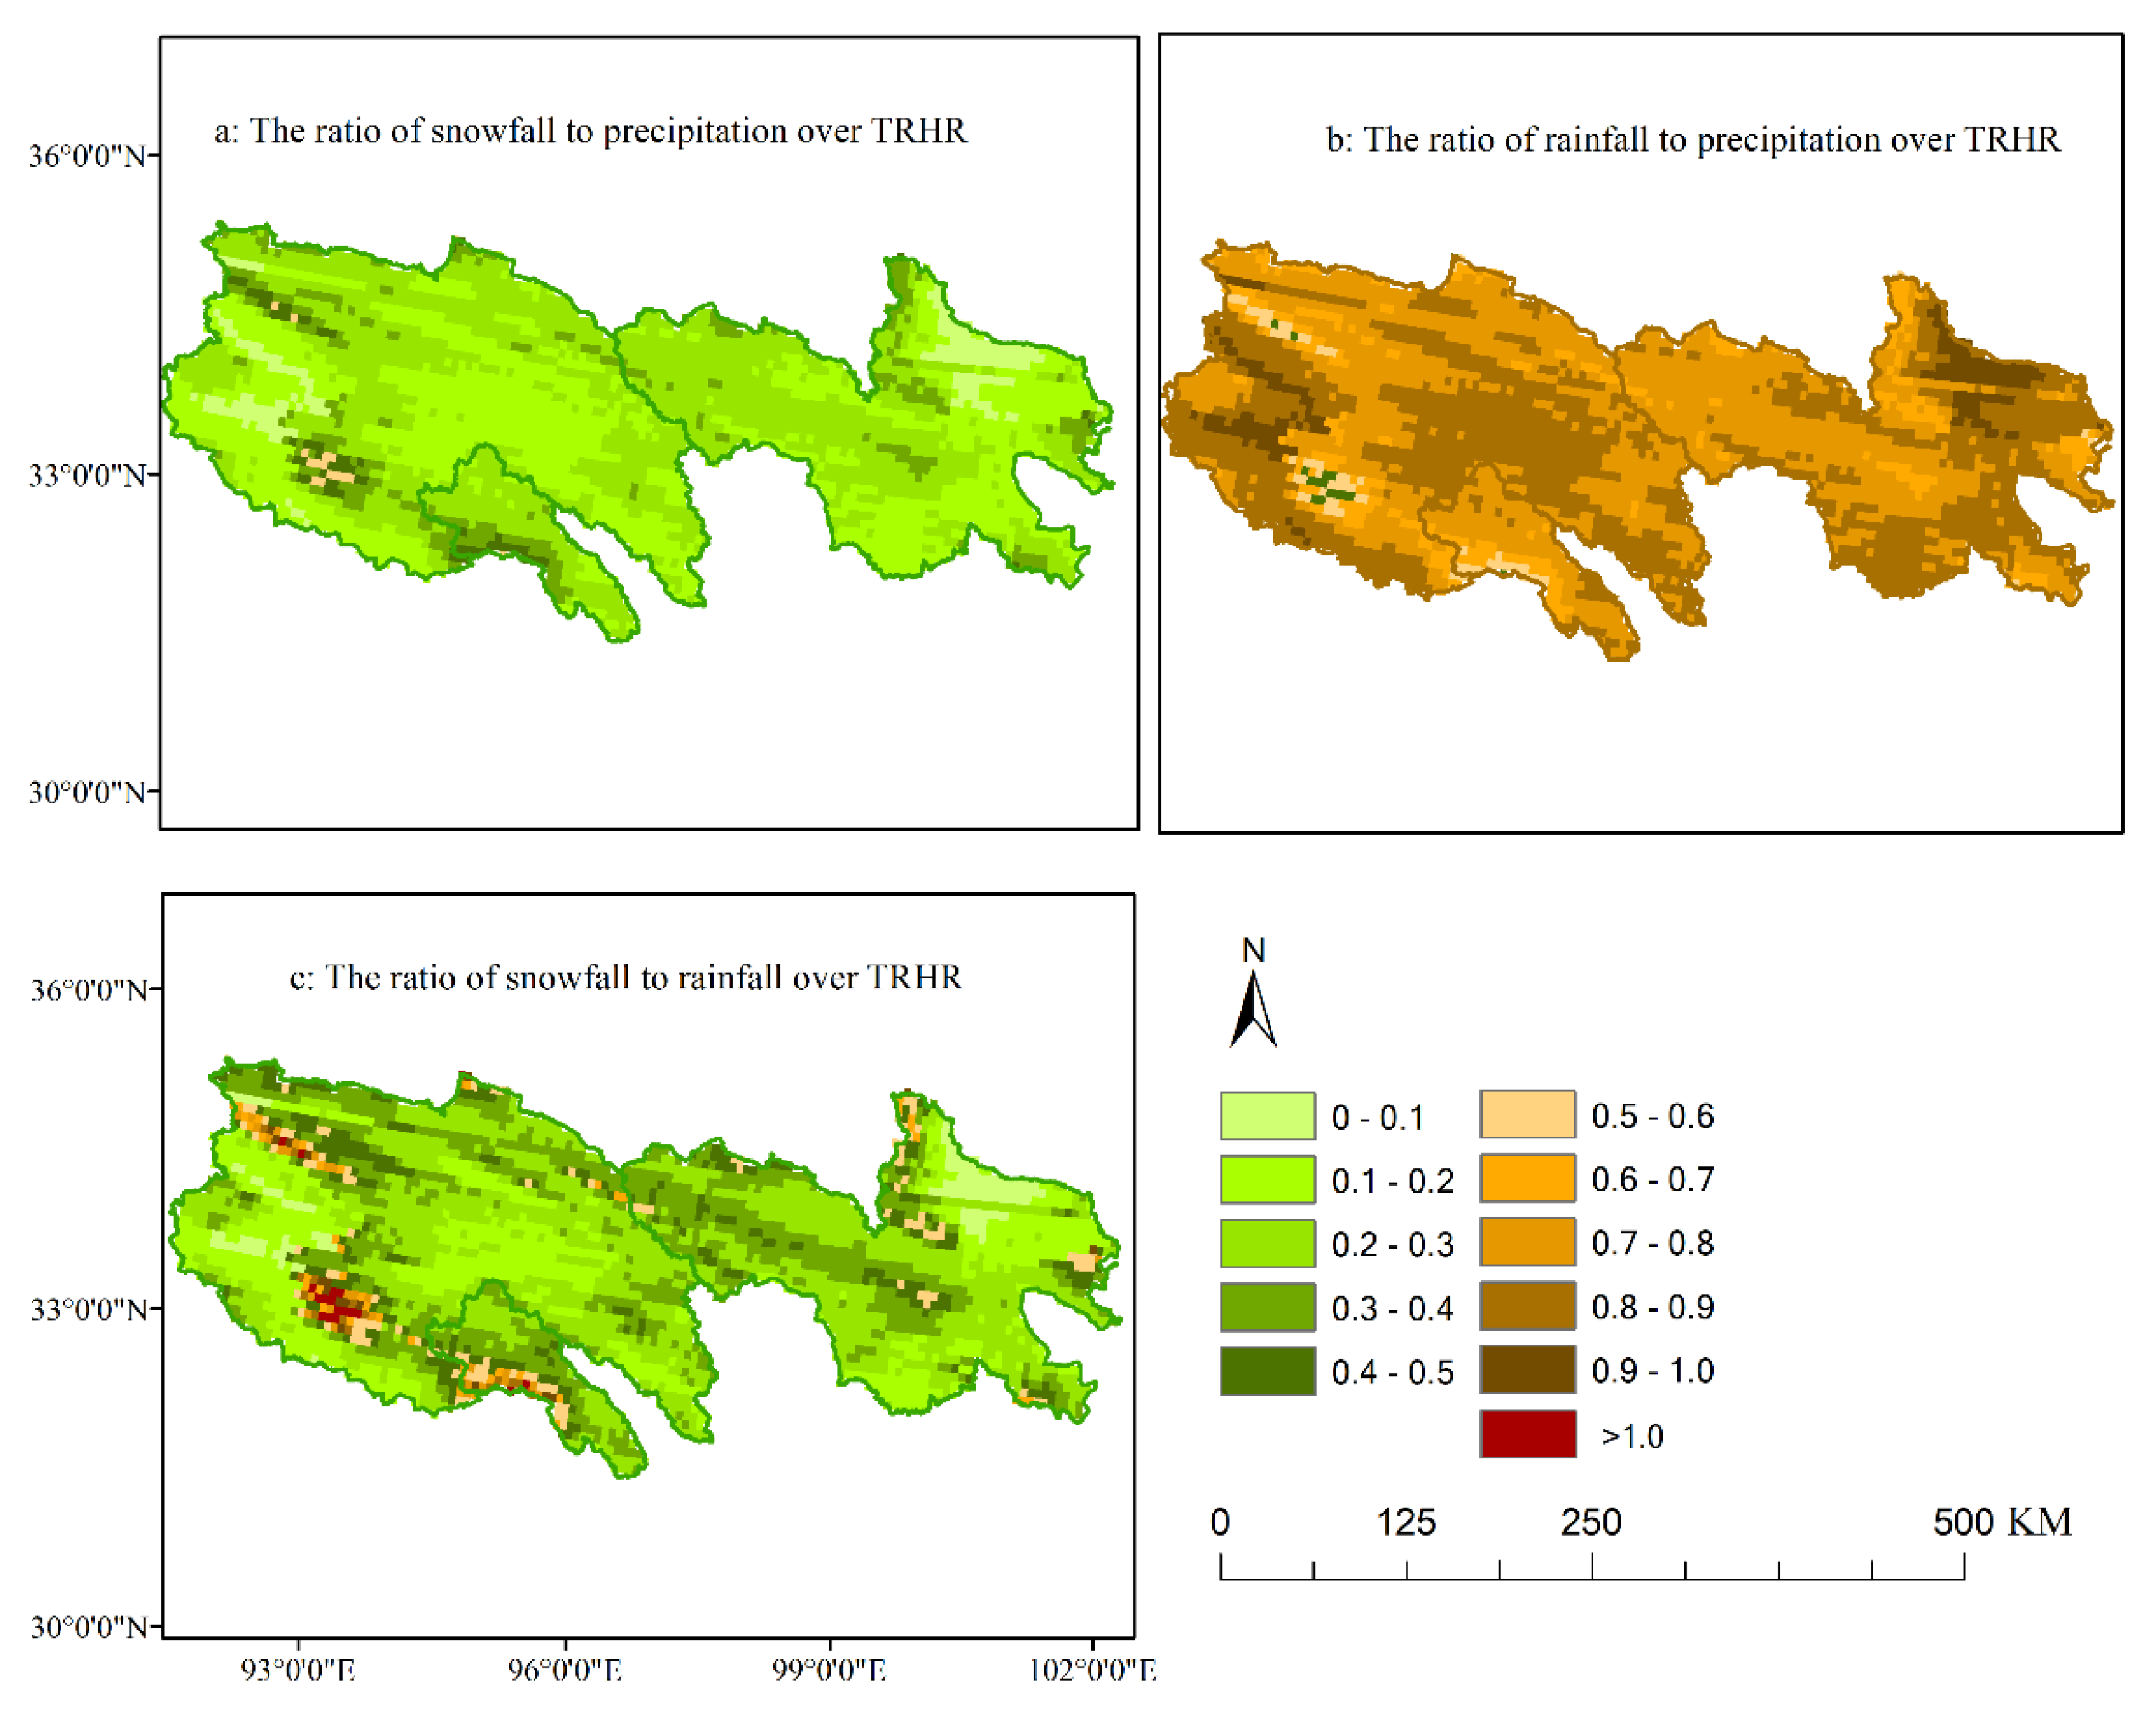
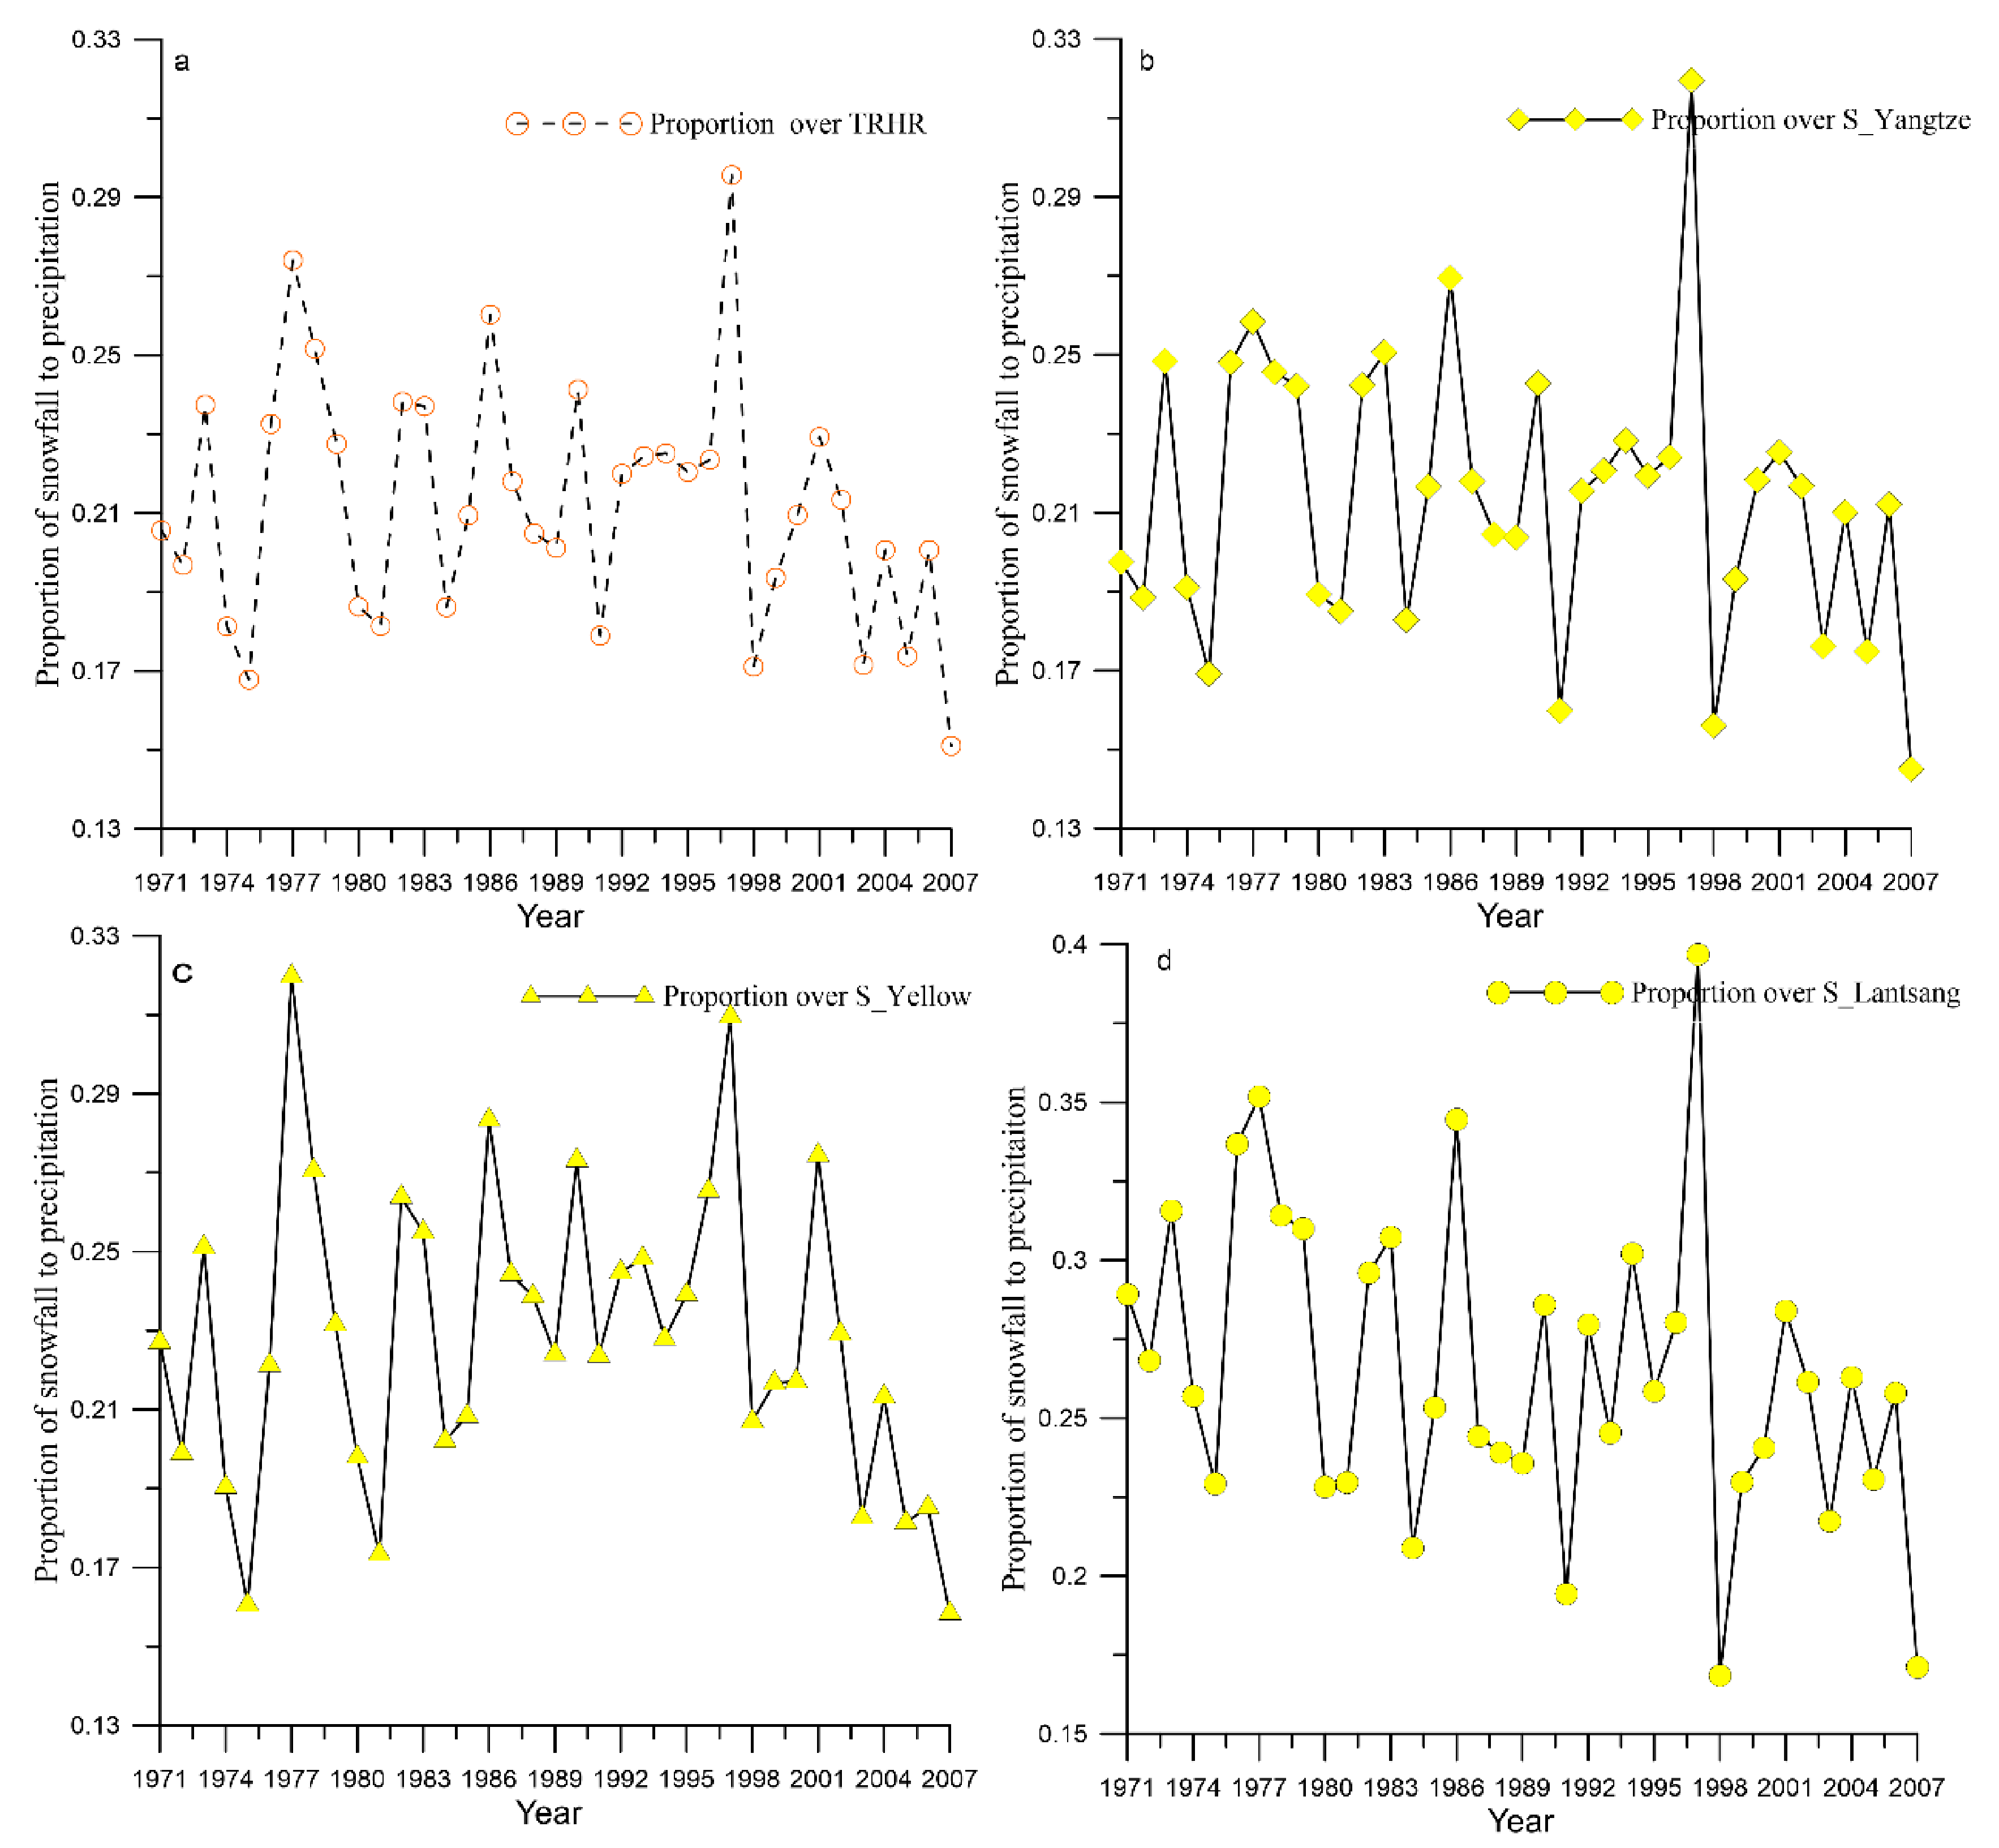
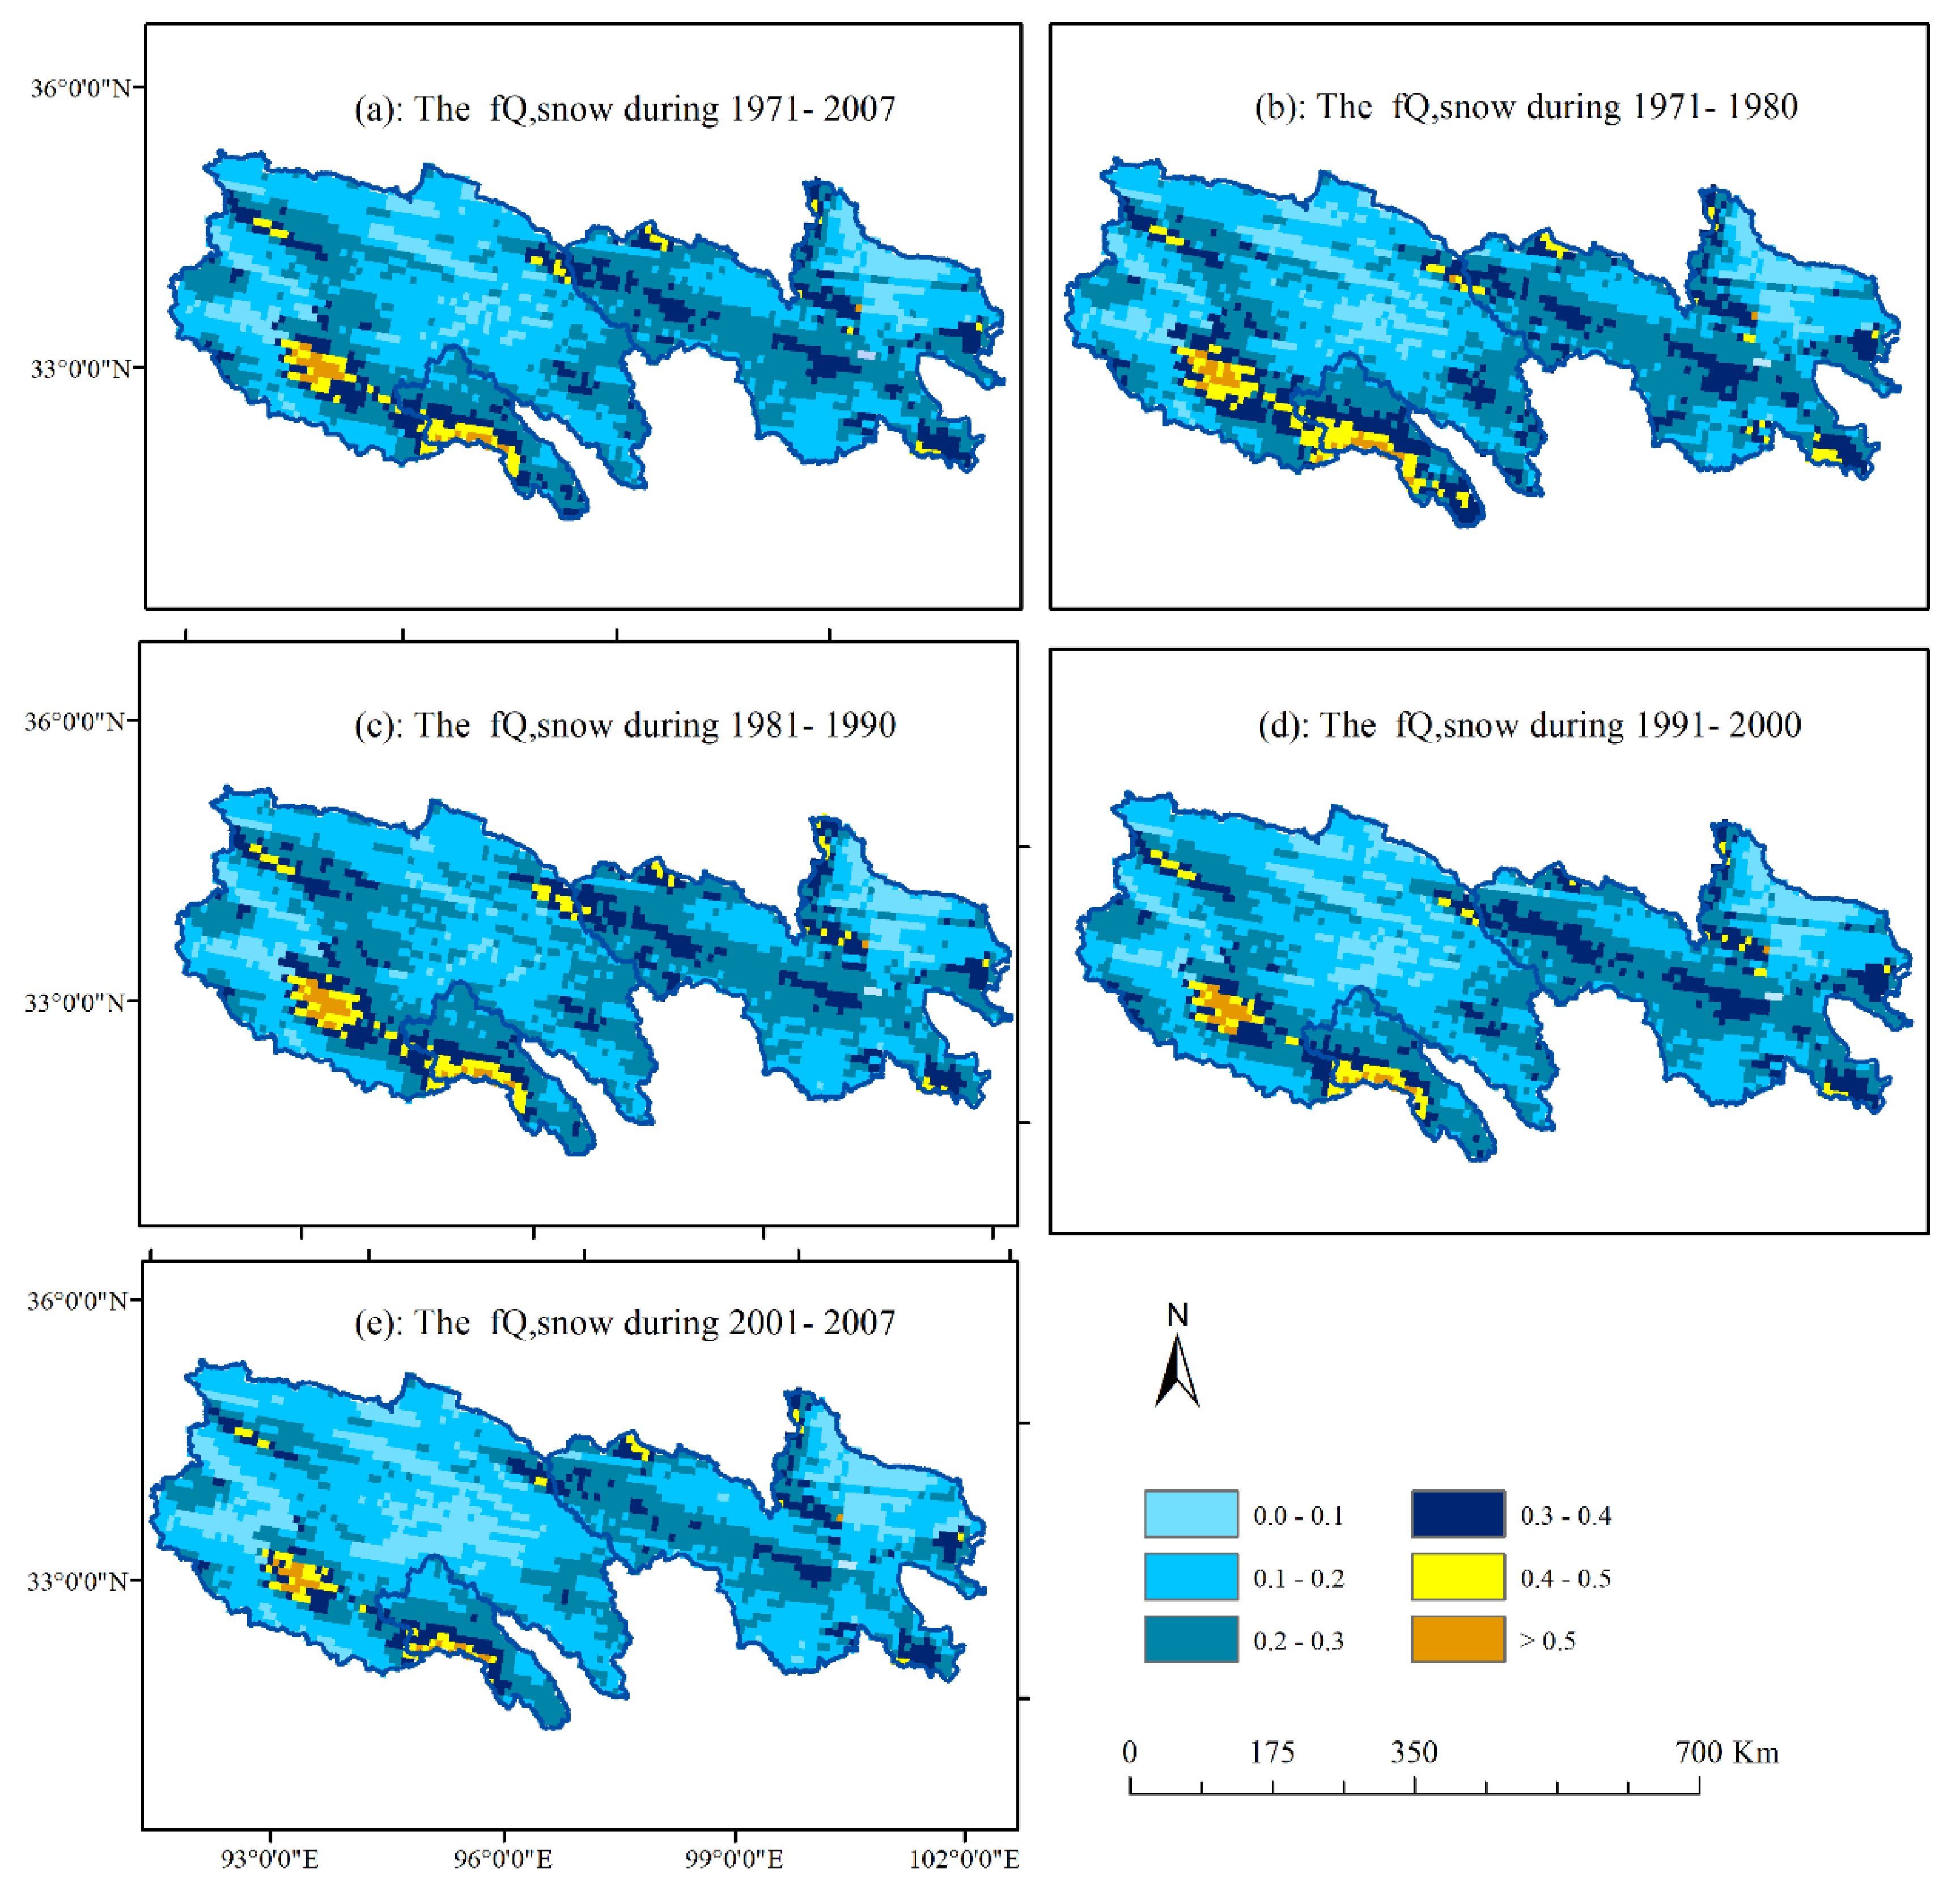
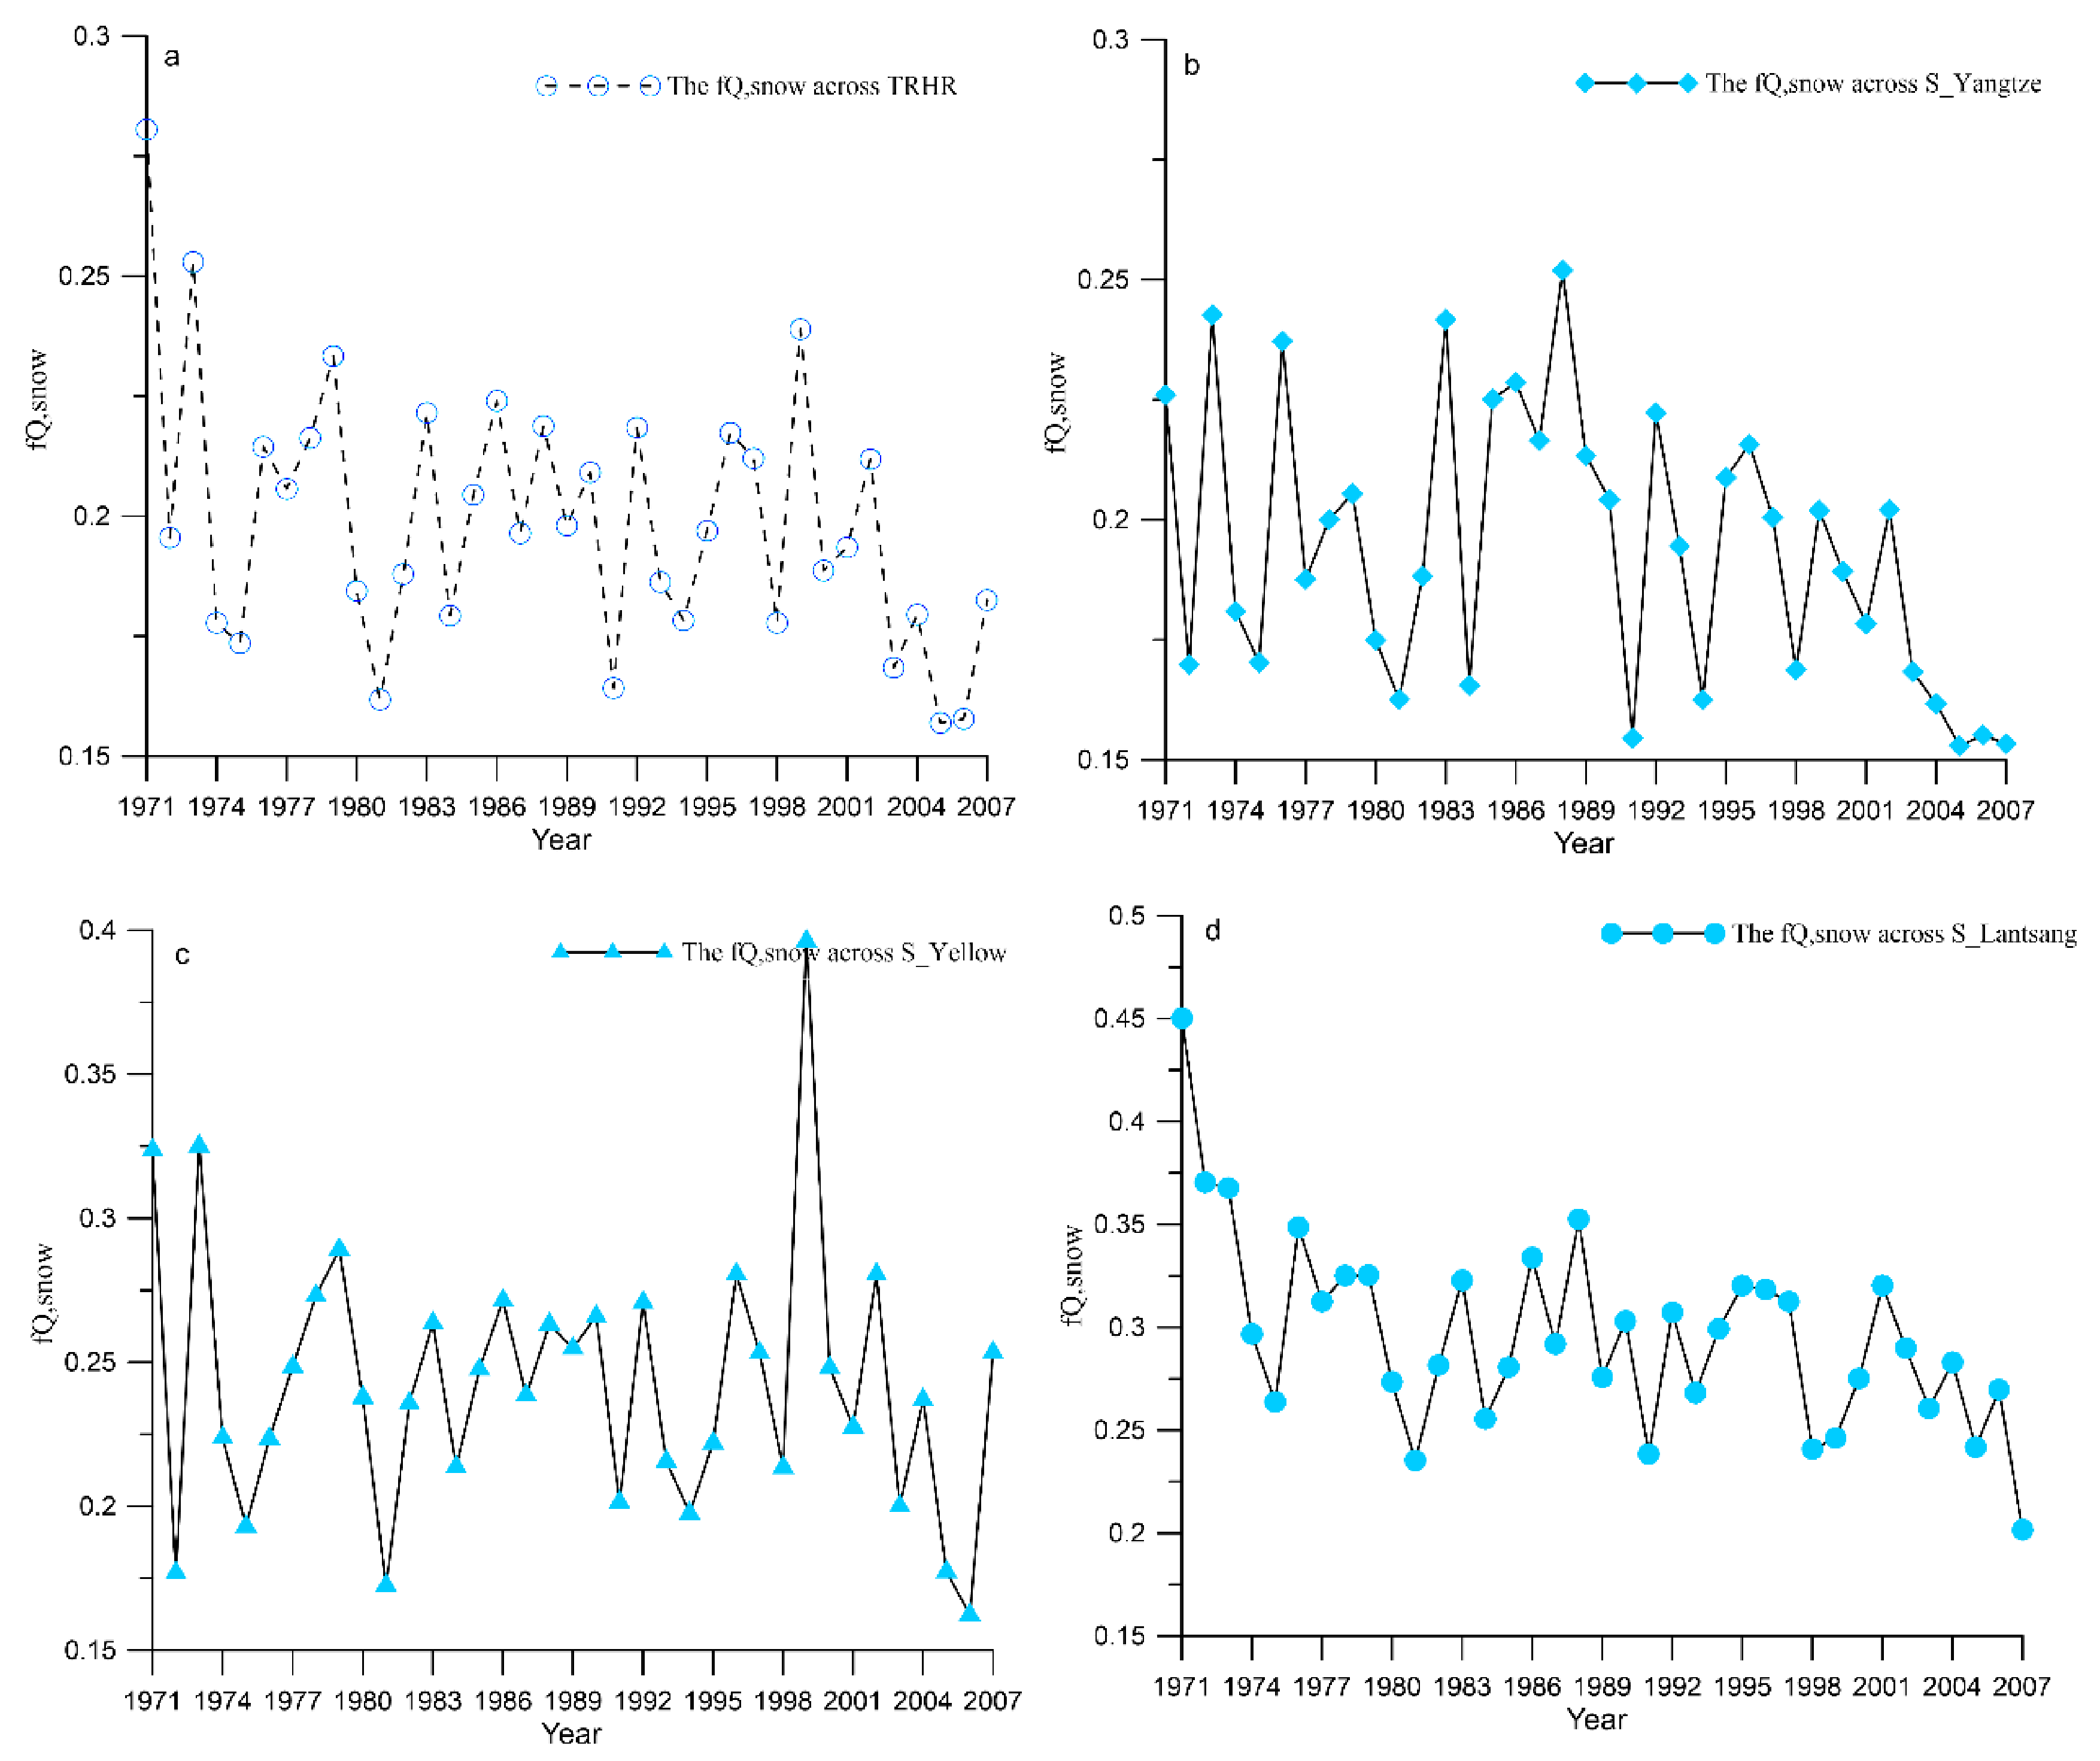
3.2. Ratio of Rainfall and Snowfall to Precipitation

Figure 4 depicts the average ratio of rainfall and snowfall to the precipitation from 1971 to 2007 over the TRHR (Figure 4). Generally, the rainfall was higher than the snowfall and the ratio of snowfall to precipitation ranged from 0 to 0.5, and rainfall to precipitation ranged from 0.5 to 1.0. The ratio of snowfall and rainfall to precipitation exhibited considerable spatiotemporal heterogeneity. The average ratio of snowfall to the precipitation over the S_Lantsang was 26.6%, which was higher than that of the S_Yangtze (21.4%) and S_Yellow (22.9%) from 1971 to 2007. The spatial pattern of the ratios, such as strip belts or gobbets, mainly followed the topographical relief, i.e., the z-shaped pattern in the western part of the TRHR (Figure 4c).
Figure 5 shows the inter-annual variations of the ratio of snowfall to precipitation from 1971 to 2007 (Figure 5a). The proportion of snowfall to the precipitation over the TRHR decreased by 6%/year from 1971 to 2007. Over the S_Lantsang, the ratio significantly decreased by 16%/year (p < 0.05) (Figure 5d). The S_Yangtze has the same large inter-annual variation as the entire TRHR and the highest variation occurred in 1997. Inter-annual variation in the ratio of snowfall to the precipitation over the S_Yellow showed, with periodic features, an increasing and decreasing trend of the ratios from 1971 to 1997 and after 1997, respectively.
The increasing temperature drives the shift of snowfall to rainfall which would bring earlier spring runoff, less snow cover and SWE in the cold season, and less streamflow and storage in surface reservoirs during the warm season, which may trigger floods in spring and droughts in summertime [51,52,53,54,55]. Recent studies have documented the significantly increasing temperature over the Qinghai-Tibet Plateau, especially in the high elevation areas [56,57]. The decreasing ratio of snowfall to precipitation is mostly driven by the increasing temperature. The decreasing ratio of snowfall to precipitation was also found over the Tibetan Plateau, western US, New England, and Tianshan Mountains [51,58]. Thus, the decreasing ratio of snowfall to precipitation is a global issue and a consequence of global warming which is thought to be closely correlated with large-scale atmospheric circulation, such as El Niño-Southern Oscillation (ENSO), North Atlantic Oscillation (NAO), and Pacific decadal Oscillation (PDO) [51,53].

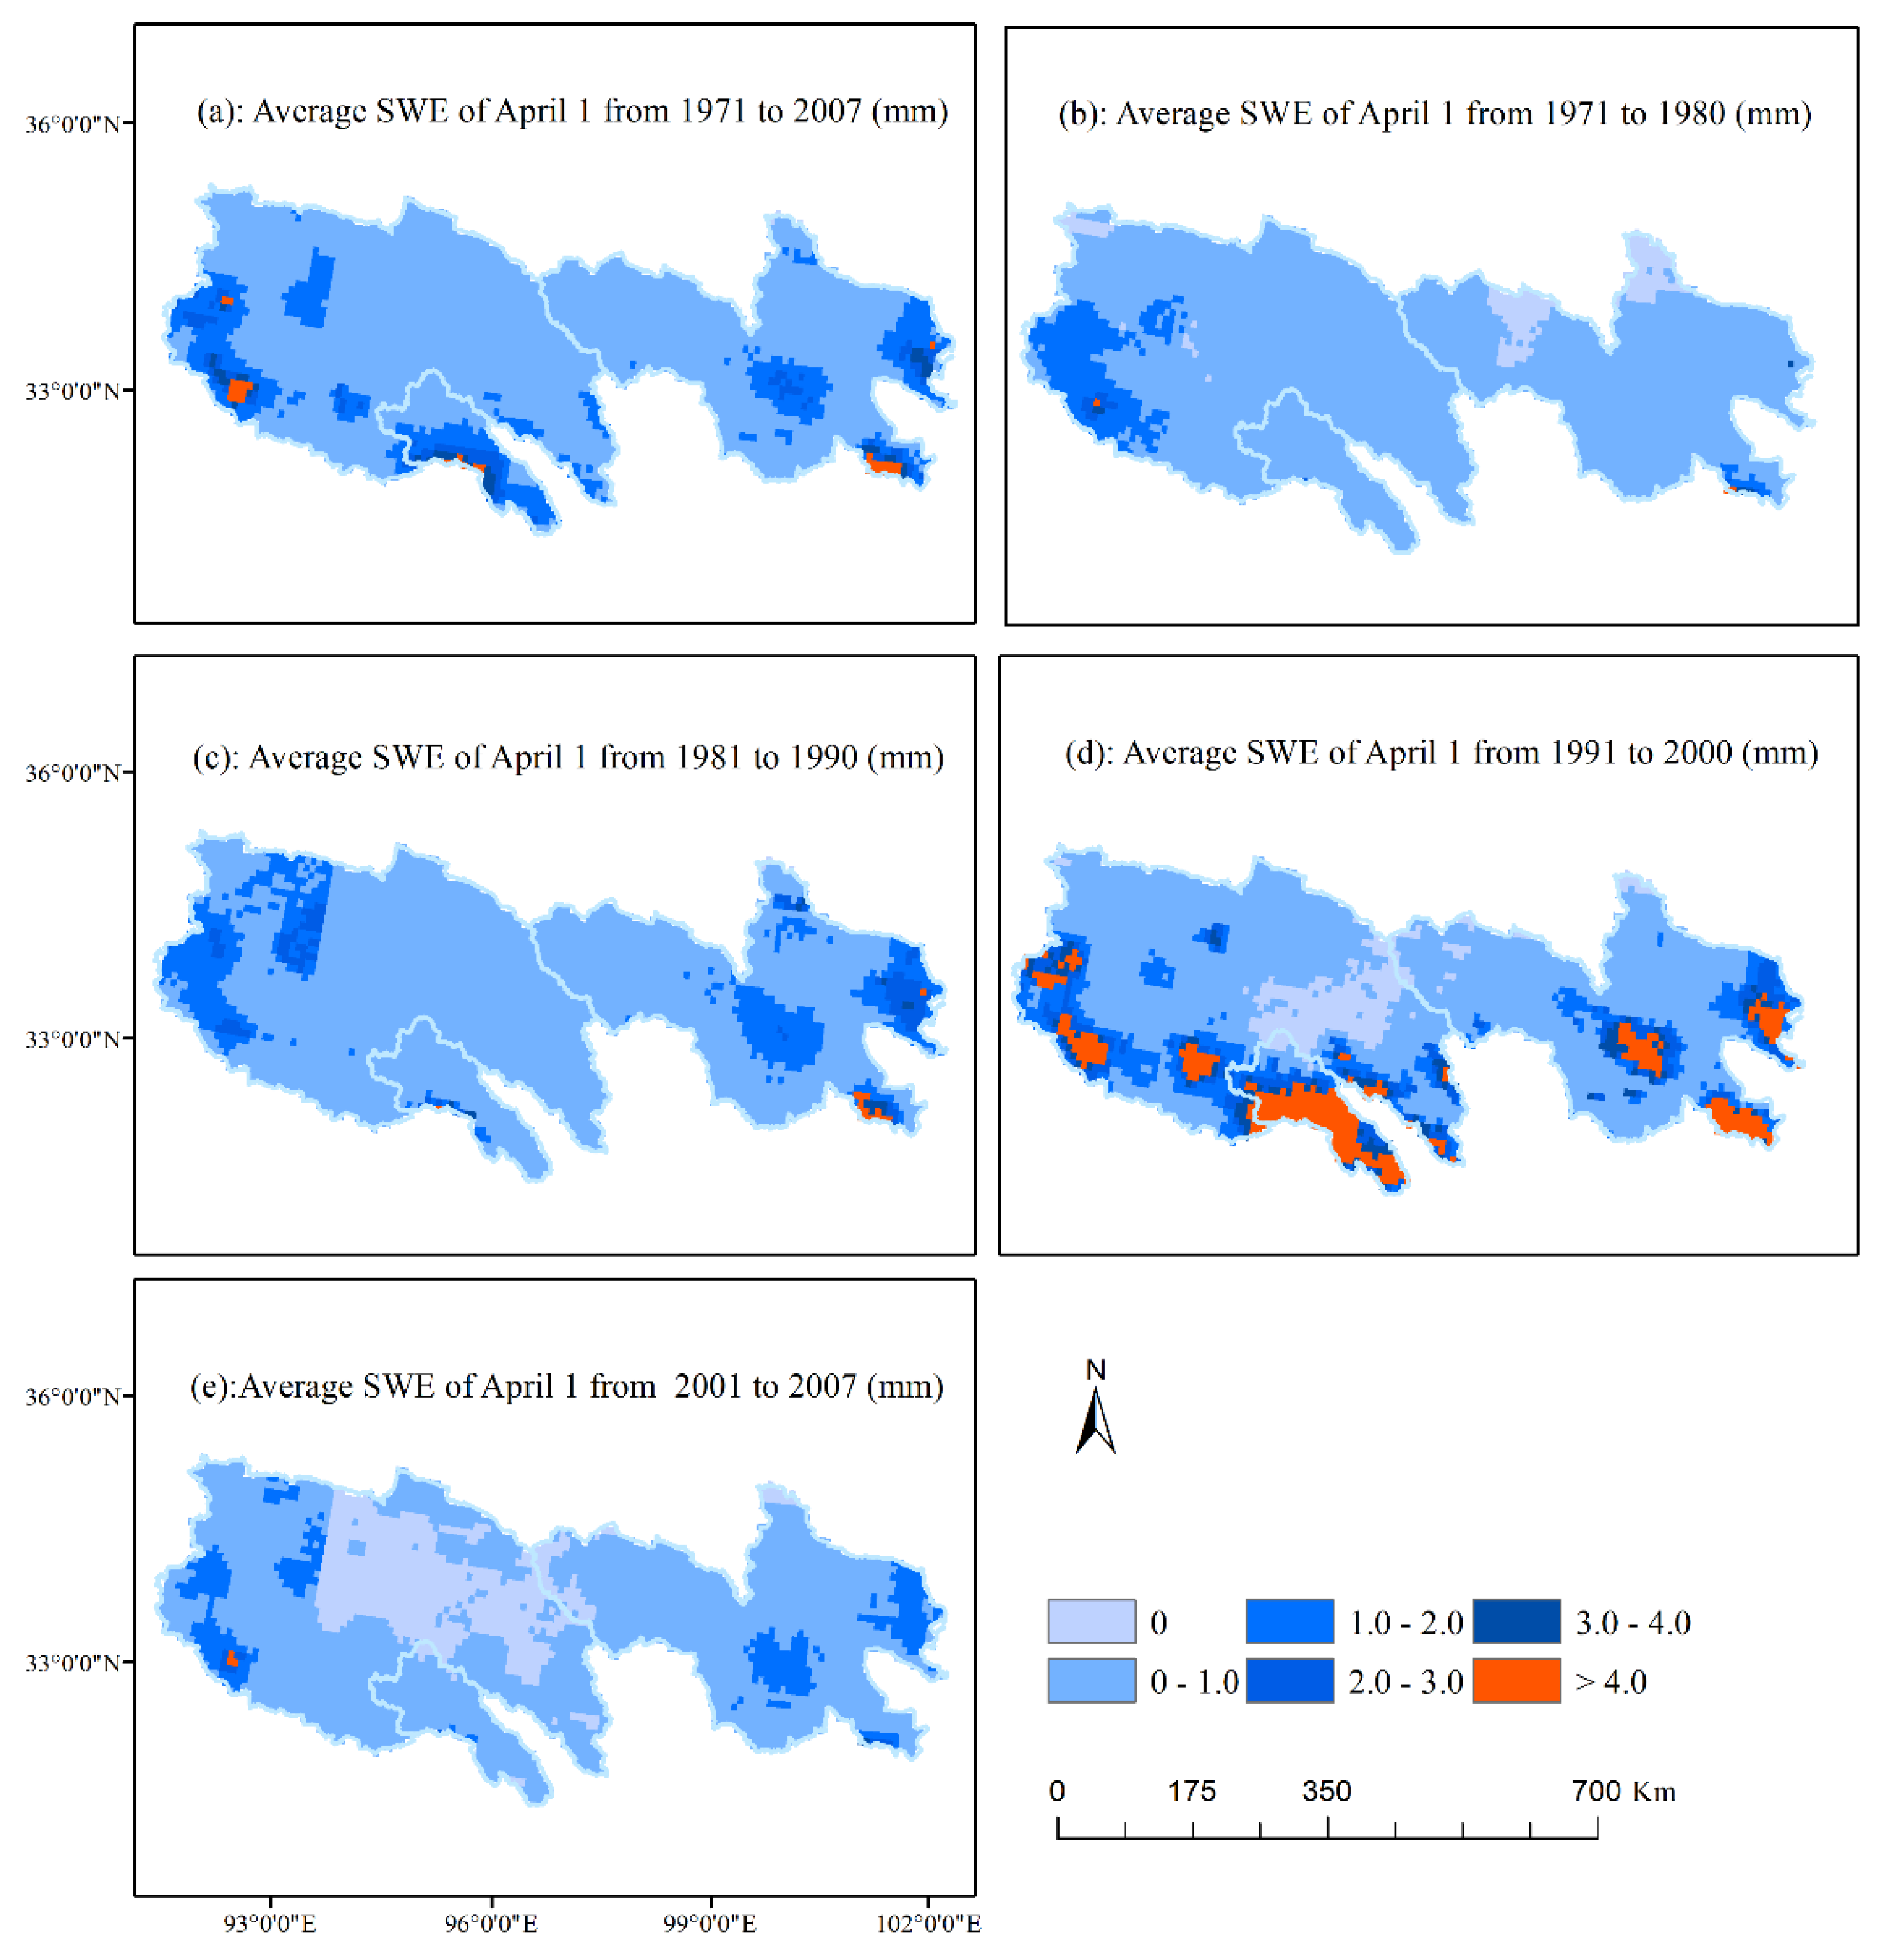
3.3. Variation of SWE

Figure 6 shows the spatial distribution of annual average April 1 SWE (Figure 6a) and the inter-decadal variation of the April 1 SWE (Figure 6b–e) from 1971 to 2007 across the TRHR.
The April 1 SWE has large spatial variations and higher values were found over the S_Lantsang, the eastern part of the S_Yellow, and the western part of the S_Yangtze (Figure 6a). The S_lantsang had a larger fractional area (i.e., 1.7%) with the April 1 SWE above 4 mm than that of the S_Yangtze (0.6%) and S_Yellow (1.1%) (Table 4). It indirectly revealed high snow water yield per unit over the S_Lantsang, even though the total amount of SWE might be smaller compared with the S_Yangtze and S_Yellow.
Over the entire TRHR and its three sub-basins, the April 1 SWE showed characteristics with inter-decadal variations and the highest value occurred in the 1990s (figure b–e). In the 1990s, half of the area of the S_lantsang was covered by at least 4 mm of SWE on April 1. After 2000, there was no April 1 SWE over 3 mm, and the April 1 SWE between 2–3 mm accounted for 0.4%, 0.3%, and 0.4% over the S_Yangtze, S_Yellow, and S_Lantsang, respectively, which suggested a lower SWE than the earlier time period.
To obtain SWE, most studies focused on the passive microwave remote sensing data which are advantageous in that they are unaffected by cloud cover and have high time precision [59,60]. In this study, a comparison between SWE from the VIC model simulation and SWE obtained from AMSR-E was conducted, then the snow parameters of VIC model were adjusted. The difference between annual SWE from VIC model simulation and AMSR-E ranged from 2% to 23% during the 2003–2007 period. The satellite radiometric measurements of ASMR-E SWE offered an indispensable validation for the VIC snow hydrology simulation. SWE acquired from the VIC model simulation and ASMR_E uncovered the long-term time series SWE over high altitude localities. This reveals valuable information for the evaluation of terrestrial water storage and has significant implications for water resource managers.

3.4. Contribution of Snowmelt Water to Streamflow

By integrating the VIC model and snowmelt tracking algorithm, the spatial-temporal characteristics of the fQ,snow were analysed from 1971 to 2007 over the TRHR (Figure 7).
According to the model estimation, 19.9% of streamflow originated from snowmelt water from 1971 to 2007, while its proportion varied in space. For example, the S_Lantsang snowmelt water contributed 29.6% to streamflow, and the S_Yangtze and S_Yellow contributed 19.4% and 24.3%, respectively. More snowmelt derived streamflow was generated in the surrounding areas of the TRHR, compared with a lower proportion of snowmelt water to streamflow in internal areas over the S_Yangtze.
The distinction between the fQ,snow and the ratio of snowfall to precipitation is region-specific. For example, the fQ,snow is higher than the ratio of snowfall to the precipitation over the S_Lantsang, while it is the opposite over the S_Yellow. Higher fQ,snow than the ratio of snowfall to precipitation over the S_Lantsang indicates that the ability of snow in generated runoff is significantly efficient.
The fQ,snow decreased significantly from 1971 to 2007 by a total of 0.1%/year (p < 0.05) over the entire TRHR (Figure 8). After 2000, the rate of the proportion of snowmelt water to overall streamflow decreased faster than in earlier decades. For example, during 2001–2007, snowmelt water contributed only 17.8% to the total streamflow, lower than that in the 1990s at 19.8%.
For each sub-basin, the variation characteristic of fQ,snow depended on different inducements. A significant decreasing rate of fQ,snow over the S_Lantsang was the highest at 0.24%/year from 1971 to 2007 among the three sub-basins which could be attributed to the increasing streamflow and the decreasing snowmelt water. Over the S_Yangtze, the increasing streamflow accounted more for the decreasing fQ,snow, and the stable change of snowmelt water was not attributed to this decrease. The decrease in fQ,snow, over the S_Yellow after 2000 was closely related to snow accumulation, melting, and the streamflow. There was more streamflow after 2000 compared with in the 1990s, and the increased ratio of the streamflow was much higher than the increased ratio of snowmelt water which was the main reason leading to lower fQ,snow after 2000. Additionally, the larger SWE and higher ratio of snowfall to precipitation did not correspond to the higher fQ,snow in the 1990s, even with the considerably lower streamflow over the S_Yangtze and S_Yellow, which may be caused by higher loss of snowmelt water through evaporation and infiltration to the soil.
Variation in SWE and the ratio of snowfall to precipitation indicated the shrinking freshwater resources in the form of solid snow. In addition, the decreased fQ,snow and larger ratio of the rain to precipitation implied the role of rain was stronger over the TRHR. As a snowpack decreases, its role in stabilizing the climate is reduced. As a result, the direct and indirect consequences of a snowpack on the water resources and regional climate system have significant uncertainties over the TRHR. Higher probability of the spring flood and summer drought events could be triggered with snowmelt water increase and precipitation system change during the early spring season.

4. Conclusions

This study sought to identify the contribution of snowmelt water to the total streamflow in the TRHR. The snowmelt water contributed 19.9% to the streamflow from 1971 to 2007. The variation characteristic of fQ,snow varied among each sub-basins due to different inducements. During the study period, the fQ,snow and the ratio of snowfall to precipitation decreased by 0.1%/year (p < 0.05) and 6%/year, respectively, a decreasing trend was also found for SWE, though the precipitation appeared to increase in some regions. Climate change impacts climatic drivers that regulate the snowmelt water and streamflow, then the fQ,snow in TRHR. Characterizing the trend of the fQ,snow will provide insights into potential future shifts in hydrological processes as climate changes. Snowmelt runoff is expected to shift under strong climate change scenarios as a result of their sensitivity to temperature and precipitation. Future work should evaluate the impact of climatic variables on snowmelt runoff related to water resource management by characterizing the main variables determining snowmelt runoff and their properties in response to current and future climate.

Author Contributions

Conceptualization, J.C.A., and H.P.; Data curation, M.L. and F.S.; Methodology, D.L.; Writing-original draft, S.L.; Writing—review & editing, Z.Y. And Z.L. All authors have read and agreed to the published version of the manuscript.

Funding

This study was supported and funded by the “Strategic Priority Research Program” of the Chinese Academy of Sciences (XDA20060202), and the National Natural Science Foundation of China (41661144030).

Institutional Review Board Statement

Not applicable.

Informed Consent Statement

Not applicable.

Data Availability Statement

The daily maximum and minimum temperature, daily average wind speed and daily precipitation were obtained from the National Meteorological Information Center of China (http://www.nmic.cn/data/cdcindex/cid/0b9164954813c573.html). The Asian Precipitation-Highly Resolved Observational Data Integration Towards Evaluation of Water Resources (APHRODITE) is released by the University of Tsukuba and Japan Meteorological Agency/Akiyo (http://aphrodite.st.hirosaki-u.ac.jp/download/). AMSR-E/Aqua Monthly L3 Global Snow Water Equivalent EASE-Grids, Version 2 (https://nsidc.org/data/AE_MoSno/versions/2) derived from National Snow & Ice Data Center.

Acknowledgments

Thanks to Fengge Su for providing the soil and vegetation parameters for the VIC model application. Thanks for the continued support from Jennifer Adam and the Hydro Lab at Washington State University in running the VIC model.

Conflicts of Interest

The authors declare no conflict of interest.

References

  1. Barnhart, T.B.; Molotch, N.P.; Livneh, B.; Harpold, A.A.; Knowles, J.F.; Schneider, D. Snowmelt rate dictates streamflow. Geophys. Res. Lett. 2016, 43, 8006–8016. [Google Scholar] [CrossRef]
  2. Barnett, T.P.; Adam, J.C.; Lettenmaier, D.P. Potential impacts of a warming climate on water availability in snow-dominated regions. Nature 2005, 438, 303. [Google Scholar] [CrossRef] [PubMed]
  3. Clow, D.W. Changes in the timing of snowmelt and streamflow in Colorado: A response to recent warming. J. Clim. 2010, 23, 2293–2306. [Google Scholar] [CrossRef]
  4. Li, D.; Wrzesien, M.L.; Durand, M.; Adam, J.; Lettenmaier, D.P. How much runoff originates as snow in the western United States, and how will That change in the future? Geophys. Res. Lett. 2017, 44, 6163–6172. [Google Scholar] [CrossRef] [Green Version]
  5. McCabe, G.J.; Wolock, D.M.; Valentin, M. Warming Is driving decreases in snow fractions while runoff efficiency remains mostly unchanged in snow-covered areas of the western United States. J. Hydrometeorol. 2018, 19, 803–814. [Google Scholar] [CrossRef]
  6. Mote, P.W.; Hamlet, A.F.; Clark, M.P.; Lettenmaier, D.P. Declining mountain snowpack in western North America. Bull. Am. Meteorol. Soc. 2005, 86, 39–50. [Google Scholar] [CrossRef]
  7. Musselman, K.N.; Clark, M.P.; Liu, C.; Ikeda, K.; Rasmussen, R. Slower snowmelt in a warmer world. Nat. Clim. Chang. 2017, 7, 214. [Google Scholar] [CrossRef]
  8. Painter, T.H.; Rittger, K.; McKenzie, C.; Slaughter, P.; Davis, R.E.; Dozier, J. Retrieval of subpixel snow covered area, grain size, and albedo from MODIS. Remote Sens. Environ. 2009, 113, 868–879. [Google Scholar] [CrossRef] [Green Version]
  9. Armstrong, R.L.; Rittger, K.; Brodzik, M.J.; Racoviteanu, A.; Barrett, A.P.; Khalsa, S.-J.S.; Raup, B.; Hill, A.F.; Khan, A.L.; Wilson, A.M.; et al. Runoff from glacier ice and seasonal snow in high Asia: Separating melt water sources in river flow. Reg. Environ. Chang. 2018, 19, 1–13. [Google Scholar] [CrossRef] [Green Version]
  10. Robinson, D.A.; Dewey, K.F.; Heim, R.R., Jr. Global snow cover monitoring: An update. Bull. Am. Meteorol. Soc. 1993, 74, 1689–1696. [Google Scholar] [CrossRef] [Green Version]
  11. Frei, A.; Robinson, D.A. Northern hemisphere snow extent: Regional variability 1972–1994. Int. J. Climatol. 1999, 19, 1535–1560. [Google Scholar] [CrossRef]
  12. Han, P.; Long, D.; Han, Z.; Du, M.; Dai, L.; Hao, X. Improved understanding of snowmelt runoff from the headwaters of China’s Yangtze river using remotely sensed snow products and hydrological modeling. Remote Sens. Environ. 2019, 224, 44–59. [Google Scholar] [CrossRef]
  13. Chen, X.; Long, D.; Hong, Y.; Liang, S.; Hou, A. Observed radiative cooling over the Tibetan plateau for the past three decades driven by snow cover-induced surface albedo anomaly. J. Geophys. Res. Atmos. 2017, 122, 6170–6185. [Google Scholar] [CrossRef]
  14. Chen, X.; Long, D.; Hong, Y.; Zeng, C.; Yan, D. Improved modeling of snow and glacier melting by a progressive two-stage calibration strategy with GRACE and multisource data: How snow and glacier meltwater contributes to the runoff of the upper Brahmaputra river basin? Water Resour. Res. 2017, 53, 2431–2466. [Google Scholar] [CrossRef]
  15. Li, Q.; Ma, M.; Wu, X.; Yang, H. Snow cover and vegetation-induced decrease in global albedo from 2002 to 2016. J. Geophys. Res. Atmos. 2018, 123, 124–138. [Google Scholar] [CrossRef] [Green Version]
  16. Adam, J.C.; Hamlet, A.F.; Lettenmaier, D.P. Implications of global climate change for snowmelt hydrology in the twenty-first century. Hydrol. Process. Int. J. 2009, 23, 962–972. [Google Scholar] [CrossRef]
  17. Coppola, E.; Raffaele, F.; Giorgi, F. Impact of climate change on snow melt driven runoff timing over the alpine region. Clim. Dyn. 2018, 51, 1259–1273. [Google Scholar] [CrossRef]
  18. Kapnick, S.B.; Delworth, T.L. Controls of global snow under a changed climate. J. Clim. 2013, 26, 5537–5562. [Google Scholar] [CrossRef]
  19. Serreze, M.C.; Clark, M.P.; Armstrong, R.L.; McGinnis, D.A.; Pulwarty, R.S. Characteristics of the western United States snowpack from snowpack telemetry (SNO℡) data. Water Resour. Res. 1999, 35, 2145–2160. [Google Scholar] [CrossRef] [Green Version]
  20. Stewart, I.T.; Cayan, D.R.; Dettinger, M.D. Changes toward earlier streamflow timing across western north America. J. Clim. 2005, 18, 1136–1155. [Google Scholar] [CrossRef]
  21. Latif, Y.; Ma, Y.; Ma, W.; Muhammad, S.; Adnan, M.; Yaseen, M.; Fealy, R. Differentiating Snow and Glacier Melt Contribution to Runoff in the Gilgit River Basin via Degree-Day Modelling Approach. Atmosphere 2020, 11, 1023. [Google Scholar] [CrossRef]
  22. Grover, S.; Tayal, S.; Beldring, S.; Li, H. Modeling Hydrological Processes in Ungauged Snow-Fed Catchment of Western Himalaya. Water Resour. 2020, 47, 987–995. [Google Scholar] [CrossRef]
  23. Pangali Sharma, T.P.; Zhang, J.; Khanal, N.R.; Prodhan, A.P.; Paudel, B.; Shi, L.; Nepal, N. Assimilation of snowmelt runoff model (SRM) using satellite remote sensing data in Budhi Gandaki River Basin, Nepal. Remote Sens. 2020, 12, 1951. [Google Scholar] [CrossRef]
  24. Kang, D.H.; Shi, X.; Gao, H.; Déry, S.J. On the changing contribution of snow to the hydrology of the Fraser river basin, Canada. J. Hydrometeorol. 2014, 15, 1344–1365. [Google Scholar] [CrossRef]
  25. Islam, S.U.; Déry, S.J.; Werner, A.T. Future climate change impacts on snow and water resources of the Fraser river basin, British Columbia. J. Hydrometeorol. 2017, 18, 473–496. [Google Scholar] [CrossRef]
  26. Meng, F.; Su, F.; Yang, D.; Tong, K.; Hao, Z. Impacts of recent climate change on the hydrology in the source region of the Yellow river basin. J. Hydrol. Reg. Stud. 2016, 6, 66–81. [Google Scholar] [CrossRef] [Green Version]
  27. Zhang, L.; Su, F.; Yang, D.; Hao, Z.; Tong, K. Discharge regime and simulation for the upstream of major rivers over Tibetan plateau. J. Geophys. Res. Atmos. 2013, 118, 8500–8518. [Google Scholar] [CrossRef]
  28. Li, Z.; Li, Z.; Feng, Q.; Zhang, B.; Gui, J.; Xue, J.; Gao, W. Runoff dominated by supra-permafrost water in the source region of the Yangtze river using environmental isotopes. J. Hydrol. 2020, 582, 10–1016. [Google Scholar] [CrossRef]
  29. Shi, H.; Li, T.; Wei, J. Evaluation of the gridded CRU TS precipitation dataset with the point raingauge records over the three-river headwaters region. J. Hydrol. 2017, 548, 322–332. [Google Scholar] [CrossRef] [Green Version]
  30. Shi, H.; Li, T.; Wei, J.; Fu, W.; Wang, G. Spatial and temporal characteristics of precipitation over the three-river headwaters region during 1961–2014. J. Hydrol. Reg. Stud. 2016, 6, 52–65. [Google Scholar] [CrossRef] [Green Version]
  31. Xiong, Q.; Xiao, Y.; Halmy, M.W.A.; Dakhil, M.A.; Liang, P.; Liu, C.; Zhang, L.; Pandey, B.; Pan, K.; El Kafraway, S.B.; et al. Monitoring the impact of climate change and human activities on grassland vegetation dynamics in the northeastern Qinghai-Tibet plateau of China during 2000–2015. J. Arid Land. 2019, 11, 637–651. [Google Scholar] [CrossRef] [Green Version]
  32. Li, C.; Su, F.; Yang, D.; Tong, K.; Meng, F.; Kan, B. Spatiotemporal variation of snow cover over the Tibetan Plateau based on MODIS snow product, 2001–2014. Int. J. Climatol. 2018, 38, 708–728. [Google Scholar] [CrossRef]
  33. Xue, Z.; Zhang, Z.; Lu, X.; Zou, Y.; Lu, Y.; Jiang, M.; Tong, S.; Zhang, K. Predicted areas of potential distributions of alpine wetlands under different scenarios in the Qinghai-Tibetan plateau, China. Glob. Planet. Chang. 2014, 123, 77–85. [Google Scholar] [CrossRef]
  34. Wood, E.F. Global scale hydrology: Advances in land surface modeling. Rev. Geophys. 1991, 29, 193–201. [Google Scholar] [CrossRef]
  35. Wood, E.F.; Lettenmaier, D.P.; Zartarian, V.G. A land-surface hydrology parameterization with subgrid variability for general circulation models. J. Geophys. Res. Atmos. 1992, 97, 2717–2728. [Google Scholar] [CrossRef]
  36. Liang, X.; Lettenmaier, D.P.; Wood, E.F.; Burges, S.J. A simple hydrologically based model of land surface water and energy fluxes for general circulation models. J. Geophys. Res. Atmos. 1994, 99, 14415–14428. [Google Scholar] [CrossRef]
  37. Nijssen, B.; Lettenmaier, D.P.; Liang, X.; Wetzel, S.W.; Wood, E.F. Streamflow simulation for continental-scale river basins. Water Resour. Res. 1997, 33, 711–724. [Google Scholar] [CrossRef]
  38. Abdulla, F.A.; Lettenmaier, D.P.; Wood, E.F.; Smith, J.A. Application of a macroscale hydrologic model to estimate the water balance of the Arkansas-Red river basin. J. Geophys. Res. Atmos. 1996, 101, 7449–7459. [Google Scholar] [CrossRef]
  39. Nijssen, B.; O’Donnell, G.M.; Hamlet, A.F.; Lettenmaier, D.P. Hydrologic sensitivity of global rivers to climate change. Clim. Chang. 2001, 50, 143–175. [Google Scholar] [CrossRef]
  40. Haddeland, I.; Lettenmaier, D.P.; Skaugen, T. Effects of irrigation on the water and energy balances of the Colorado and Mekong river basins. J. Hydrol. 2006, 324, 210–223. [Google Scholar] [CrossRef]
  41. Lohmann, D.; Nolte-Holube, R.; Raschke, E. A large-scale horizontal routing model to be coupled to land surface parametrization schemes. Tellus A 1996, 48, 708–721. [Google Scholar] [CrossRef]
  42. Lohmann, D.; Raschke, E.; Nijssen, B.; Lettenmaier, D. Regional scale hydrology: I. formulation of the VIC-2L model coupled to a routing model. Hydrol. Sci. J. 1998, 43, 131–141. [Google Scholar] [CrossRef]
  43. Anderson, E.A. Development and testing of snow-pack energy balance equations. Water Resour. Res. 1968, 4, 19–37. [Google Scholar] [CrossRef]
  44. Andreadis, K.M.; Storck, P.; Lettenmaier, D.P. Modeling snow accumulation and ablation processes in forested environments. Water Resour. Res. 2009, 45, 10–1029. [Google Scholar] [CrossRef]
  45. Mitchell, K.E.; Lohmann, D.; Houser, P.R.; Wood, E.F.; Schaake, J.C.; Robock, A.; Cosgrove, B.A.; Sheffield, J.; Duan, Q.; Luo, L.; et al. The multi-institution north American land data assimilation system (NLDAS): Utilizing multiple GCIP products and partners in a continental distributed hydrological modeling system. J. Geophys. Res. Atmos. 2004, 109. [Google Scholar] [CrossRef] [Green Version]
  46. Hansen, M.C.; Fries, D.R.S.; Townshend, J.R.; Sohlberg, R. Global land cover classification at 1 km spatial resolution using a classification tree approach. Int. J. Remote Sens. 2000, 21, 1331–1364. [Google Scholar] [CrossRef]
  47. Nash, J.E.; Sutcliffe, J.V. River flow forecasting through conceptual models, part I—A discussion of principles. J. Hydrol. 1970, 10, 282–290. [Google Scholar] [CrossRef]
  48. Legates, D.R.; McCabe, G.J. Evaluating the use of “goodness-of-fit” measures in hydrologic and hydroclimatic model validation. Water Resour. Res. 1999, 35, 233–241. [Google Scholar] [CrossRef]
  49. Yatagai, A.; Kamiguchi, K.; Arakawa, O.; Hamada, A.; Yasutomi, N.; Kitoh, A. Aphrodite: Constructing a long-term daily gridded precipitation dataset for Asia based on a dense network of rain gauges. Bull. Am. Meteorol. Soc. 2012, 93, 1401–1415. [Google Scholar] [CrossRef]
  50. Wang, J.R.; Tedesco, M. Identification of atmospheric influences on the estimation of snow water equivalent from AMSR-E measurements. Remote Sens. Environ. 2007, 111, 398–408. [Google Scholar] [CrossRef]
  51. Feng, S.; Hu, Q. Changes in winter snowfall/precipitation ratio in the contiguous United States. J. Geophys. Res. Atmos. 2007, 112. [Google Scholar] [CrossRef]
  52. Karl, T.R.; Groisman, P.Y.; Knight, R.W.; Heim, R.R., Jr. Recent variations of snow cover and snowfall in north America and their relation to precipitation and temperature variations. J. Clim. 1993, 6, 1327–1344. [Google Scholar] [CrossRef] [Green Version]
  53. Knowles, N.; Dettinger, M.D.; Cayan, D.R. Trends in snowfall versus rainfall in the western United States. J. Clim. 2006, 19, 4545–4559. [Google Scholar] [CrossRef] [Green Version]
  54. Giorgi, F.; Coppola, E.; Raffaele, F.; Diro, G.T.; Fuentes-Franco, R.; Giuliani, G.; Mamgain, A.; Llopart, M.P.; Mariotti, L.; Torma, C. Changes in extremes and hydroclimatic regimes in the CREMA ensemble projections. Clim. Chang. 2014, 125, 39–51. [Google Scholar] [CrossRef]
  55. Musselman, K.N.; Lehner, F.; Ikeda, K.; Clark, M.P.; Prein, A.F.; Liu, C.; Barlage, M.; Rasmussen, R. Projected increases and shifts in rain-on-snow flood risk over western north America. Nat. Clim. Chang. 2018, 8, 808. [Google Scholar] [CrossRef]
  56. Wang, J.; Zhang, M.; Wang, S.; Ren, Z.; Che, Y.; Qiang, F.; Qu, D. Decrease in snowfall/rainfall ratio in the Tibetan plateau from 1961 to 2013. J. Geogr. Sci. 2016, 26, 1277–1288. [Google Scholar] [CrossRef]
  57. Yan, L.; Liu, X. Has climatic warming over the Tibetan plateau paused or continued in recent years. Earth Ocean Atmos. Sci. 2014, 1, 13–28. [Google Scholar]
  58. Huntington, T.G.; Hodgkins, G.A.; Keim, B.D.; Dudley, R.W. Changes in the proportion of precipitation occurring as snow in New England (1949–2000). J. Clim. 2004, 17, 2626–2636. [Google Scholar] [CrossRef]
  59. Mortimer, C.; Mudryk, L.; Derksen, C.; Luojus, K.; Brown, R.; Kelly, R.; Tedesco, M. Evaluation of long-term Northern Hemisphere snow water equivalent products. Cryosphere 2020, 14, 1579–1594. [Google Scholar] [CrossRef]
  60. Gan, Y.; Zhang, Y.; Kongoli, C.; Grassotti, C. Evaluation and blending of ATMS and AMSR2 snow water equivalent retrievals over the conterminous United States. Remote Sens. Environ. 2021, 254. [Google Scholar] [CrossRef]
Figure 1. Location of the 5 hydrological stations across TRHR.
Remotesensing 13 01585 g001
Figure 2. Simulated (sim) and observed (obs) streamflow for the three sub-basins of TRHR during the calibration period (1971–1980).
Remotesensing 13 01585 g002aRemotesensing 13 01585 g002b
Figure 3. Simulated (sim) and observed (obs) streamflow for the three sub-basins of TRHR during the validation period (1981–1990).
Remotesensing 13 01585 g003aRemotesensing 13 01585 g003b
Figure 4. Spatial distribution of (a) ratio of snowfall to precipitation; (b) ratio of rainfall to precipitation; (c) ratio of snowfall to rainfall from 1971 to 2007 across TRHR.
Remotesensing 13 01585 g004
Figure 5. Annual variation of the ratio of snowfall to precipitation from 1971 to 2007 (a) over TRHR (b) S_Yangtze; (c) S_Yellow; (d) S_Lantsang.
Remotesensing 13 01585 g005
Figure 6. Spatial variation of annual average April 1 SWE: (a) from 1971 to 2007; (b) 1970s; (c) 1980s; (d) 1990s; and (e) 2001 to 2007 over TRHR.
Remotesensing 13 01585 g006
Figure 7. Spatial variation of the fQ,snow: (a) from 1971 to 2007; (b) 1970s; (c) 1980s; (d)1990s; and (e) 2001 to 2007 over TRHR.
Remotesensing 13 01585 g007
Figure 8. Annual variation of the fQ,snow from 1971 to 2007: (a) over TRHR (b) S_Yangtze; (c) S_Yellow; (d) S_Lantsang.
Remotesensing 13 01585 g008
Table 1. Ranges and final values of VIC calibration parameters.
UnitDefinitionRangeFinal Value
D2mDepth of second soil layer0.7–1.01.0
D3mDepth of third soil layer0.7–2.51.0
DsFractionThe fraction of the Dsmax parameter at which nonlinear base flow occurs0.00001–0.10.001
DsmaxMm/dayMaximum velocity of base flow for each grid cell12.0–18.010.0
InfiltDimensionlessA parameter of the variable infiltration curve0.00001–0.20.2
WsFractionThe fraction of maximum soil moisture where nonlinear base flow occurs0.2–0.90.9
Table 2. Hydrological stations across TRHR.
Sub-BasinHydrographic Station NameElevation
(m)
Drainage Area (km2)Latitude
(°N)
Longitude
(°E)
Years of Availability
/Time Scale
S_YangtzeZhimenda
Tuotuohee
3740
4560
137,704
1416
33.03
34.21
97.22
92.43
1971–2012/daily
1971–2014/daily
S_LantsangXiangda408917,90732.2596.471971–1992, 2007–2012/daily
S_Yellow Jimai
Tangnaihai
4375
2733
45,019
121,972
33.77
35.50
99.65
100.15
1971–2000/month
1971–2007/month
Table 3. NSE and D during the calibration and validation periods in VIC simulation in TRHR.
Sub-BasinHydrologic StationNSE
Daily/Month
D
Daily/Month
NSE
Daily/Month
D
Daily/Month
Calibration (1971–1980)Validation (1981–1990)
S_YangtzeZhimenda
Tuotuohe
0.54/0.57
0.42/0.54
0.82/0.84
0.73/0.78
0.49/0.52
0.36/0.52
0.78/0.79
0.71/0.77
S_LantsangXiangda0.35/0.480.79/0.840.45/0.540.81/0.84
S_YellowJimai
Tangnaihai
--/0.45
--/0.77
--/0.79
--/0.91
--/0.75
--/0.83
--/0.93
--/0.94
Table 4. Mean proportion of area covered by various peak SWE depth from 1971-2007 over TRHR.
Sub-BasinProportion
0–1 mm1–2 mm2–3 mm3–4 mm>4 mm
S_Yangtze82.7%14.2%1.9%0.6%0.6%
S_Yellow81.0%13.9%2.7%1.3%1.1%
S_Lantsang43.1%36.1%12.9%6.2%1.7%
Publisher’s Note: MDPI stays neutral with regard to jurisdictional claims in published maps and institutional affiliations.

