Article

Combining Thermal and RGB Imaging Indices with Multivariate and Data-Driven Modeling to Estimate the Growth, Water Status, and Yield of Potato under Different Drip Irrigation Regimes

1
Agricultural Engineering, Evaluation of Natural Resources Department, Environmental Studies and Research Institute, University of Sadat City, Minufiya 32897, Egypt
2
Department of Plant Production, College of Food and Agriculture Sciences, King Saud University, KSA, P.O. Box 2460, Riyadh 11451, Saudi Arabia
3
Department of Agronomy, Faculty of Agriculture, Suez Canal University, Ismailia 41522, Egypt
4
Civil Engineering Department, College of Engineering, University of Bisha, Bisha 61922, Saudi Arabia
5
Irrigation and Hydraulics Department, Faculty of Engineering, Tanta University, Tanta 31734, Egypt
6
Agricultural Engineering Department, Faculty of Agriculture, Mansoura University, Mansoura 35516, Egypt
*
Author to whom correspondence should be addressed.
Submission received: 15 March 2021 / Revised: 21 April 2021 / Accepted: 22 April 2021 / Published: 27 April 2021
(This article belongs to the Special Issue Hyperspectral Remote Sensing of Vegetation Functions)

Abstract

:
Advances in proximal hyperspectral sensing tools, chemometric techniques, and data-driven modeling have enhanced precision irrigation management by facilitating the monitoring of several plant traits. This study investigated the performance of remote sensing indices derived from thermal and red-green-blue (RGB) images combined with stepwise multiple linear regression (SMLR) and an integrated adaptive neuro-fuzzy inference system with a genetic algorithm (ANFIS-GA) for monitoring the biomass fresh weight (BFW), biomass dry weight (BDW), biomass water content (BWC), and total tuber yield (TTY) of two potato varieties under 100%, 75%, and 50% of the estimated crop evapotranspiration (ETc). Results showed that the plant traits and indices varied significantly between the three irrigation regimes. Furthermore, all of the indices exhibited strong relationships with BFW, CWC, and TTY (R2 = 0.80–0.92) and moderate to weak relationships with BDW (R2 = 0.25–0.65) when considered for each variety across the irrigation regimes, for each season across the varieties and irrigation regimes, and across all data combined, but none of the indices successfully assessed any of the plant traits when considered for each irrigation regime across the two varieties. The SMLR and ANFIS-GA models gave the best predictions for the four plant traits in the calibration and testing stages, with the exception of the SMLR testing model for BDW. Thus, the use of thermal and RGB imaging indices with ANFIS-GA models could be a practical tool for managing the growth and production of potato crops under deficit irrigation regimes.

1. Introduction

Water shortage is one of the key challenges for sustainable agriculture in arid and semiarid countries, particularly under abrupt climate change, as the agricultural sector is highly vulnerable to continuously changing climatic patterns [1]. Dramatic climatic changes in the future are expected to increase water scarcity by approximately 20% globally [2]. Additionally, approximately 80% of the cultivated lands in arid and semiarid countries rely entirely on irrigation and consume approximately 75% of the renewable freshwater resources in these countries. Most importantly, these irrigated lands play an important direct role in global food security, contributing approximately 40% of the total food produced worldwide despite covering only 20% of the total cultivated land as well as it contribute as much as 80%, 70%, 50%, and 50% of food production in Pakistan, China, India, and Indonesia, respectively [3]. Increasing competition for available water resources will require as much as 25–40% of the water to be reallocated among competing sectors and, in most cases, this reallocation is expected to come from the agricultural sector due to its high share of water use. However, limited irrigation water supplies for this sector will pose a very serious threat to future global food security. Therefore, it is necessary to develop water-saving strategies that maximize crop production per unit of irrigation water supply rather than per unit of area [4,5].
Potato is one of the most efficient crops in terms of irrigation water use, producing the highest number of calories per unit of water applied [6]. However, it is also very sensitive to soil moisture stress due to its shallow root system, which extracts approximately 70% of the total water needed for growth from the upper 30 cm of the soil [7,8,9]. Potato is also a short-duration crop that produces large and sensitive foliage in response to soil moisture stress [10,11]. Several studies have confirmed that small errors in irrigation water management in potato production and exposure of potato plants to deficit irrigation, particularly during the sensitive growth stages, causes a tremendous reduction in the quantity and quality of tuber yield and the net economic return of the production system [12,13,14,15,16,17,18]. Consequently, correct irrigation water management is required to simultaneously maximize the yield and irrigation water use efficiency of potato under deficit irrigation conditions [18].
There are several plant traits, such as biomass accumulation, plant water status, stomatal conductance, canopy temperature depression, photosynthesis efficiency, transpiration rate, and grain yield can be exploited to effectively manage deficit irrigation regimes. Most of these plant traits are usually used to describe crop status under water deficit stress conditions. However, the practical value of these traits depends on real-time monitoring and accurate estimation of their responses to water deficit stress at frequent times [19,20,21,22,23,24]. Traditional methods for the assessment and monitoring of plant traits are generally time-consuming, cost-inefficient, tedious, and unfeasible on a large scale as they rely on the rigorous collection of field data through plant sampling. Therefore, the use of proximal remote sensing tools could provide an alternative method for properly managing deficit irrigation by allowing an integrated assessment of several plant traits in a quick, cheap, and non-destructive manner.
Thermal imaging is one of the most common proximal remote sensing techniques that can be used to effectively manage deficit irrigation through non-invasive monitoring of the canopy temperature [25,26]. This tool has the ability to detect the spatial distribution of canopy temperatures on a single plant or whole field traits, and can be applied several times over the growing season as it is both fast and non-destructive [26,27]. Interestingly, this tool has great potential over the use of conventional devices such as Scholander pressure chambers and portable gas exchange systems to provide information on water status and transpiration rates. This is because this tool has ability to include large area of crop or large numbers of individual plants in a single image. This means that this tool provides information on the status of plants under water deficit stress based on whole canopy, not on a single leaf.
Generally, thermal imaging is based on the fact that a plant’s first response to water deficit stress is stomatal closure to prevent excessive water loss through transpiration and to avoid plant dehydration [28,29,30,31]. Interestingly, Pirasteh-Anosheh et al. [32] reported that stomatal closure is more closely associated with the soil moisture content than the leaf water status. The resulting low transpiration rate and inhibition of water losses from the leaves lead to a substantial increase in the leaf temperature, allowing infrared thermal imaging to be effectively used to manage water deficit through time series monitoring of the whole-canopy temperature over the growing season.
Since the leaf surface temperature is associated with not only the transpirational cooling ability but also the ambient air temperature and air vapor pressure deficit, canopy temperature data have been used to calculate various thermal canopy temperature indices, such as the normalized relative canopy temperature (NRCT) index. The index was proposed by Elsayed et al. [33] and is based on the actual canopy temperature of the plants in each treatment group and the lowest (Tmin, lower baseline) and highest (Tmax, upper baseline) canopy temperature across the whole field trial. Several studies have used this thermal index to determine irrigation thresholds and to avoid yield losses under water deficit stress in a range of field crops, such as maize, cotton, barley, wheat, and soybean [23,25,34,35,36].
Red-green-blue (RGB) digital cameras can also be used as a proximal remote sensing tool for monitoring and assessing different plant traits under water deficit stress [37,38,39]. These cameras employ sensors to capture images of the plant canopy within the visible wavelength region at approximately 400–499 nm (maximum at 475 nm), 500–549 nm (maximum at 520 nm), and 550–750 nm (maximum at 650 nm), which correspond with the blue, green, and red regions of the light spectrum, respectively. Similar to spectral reflectance indices calculated from spectral reflectance data of a plant canopy, different indices can be also calculated from these three regions (red-green-blue). In general, the images obtained from RGB cameras provide sufficient information to successfully estimate various morpho-physiological properties of plants under different biotic and abiotic stresses [40,41,42]. Interestingly, although some plant properties, such as the chlorophyll content, green biomass accumulation, and nitrogen and water statuses, are difficult to accurately assess by the human eye, they can be easily detected through the variations in reflectance of the RGB light spectrum that are detected by RGB cameras [42,43,44,45,46,47]. Therefore, this tool can be used as a cost-effective way to retrieve different plant traits through obtaining images of a large number of plants with minimum effort. However, until now, using RGB images for estimating plant traits has not been common.
Wenting et al. [40] previously reported that RGB images of leaves can be used to measure the moisture content of detached leaves of heading-stage maize, while Elsayed et al. [42] found that green pixel digital analysis was strongly related to the fresh and dry aboveground biomasses and nitrogen uptake of a wheat cultivar. In addition, Petrozza et al. [41] used RGB imaging to monitor the status of the photosynthetic apparatus, biomass, plant water content, and plant health of tomato plants to determine their response to water deficit stress. However, few studies have used RGB image analysis techniques to estimate the response of different morpho-physiological parameters and tuber yield of potato plants to different irrigation regimes, especially under arid conditions.
The appropriate use of the data acquired from different proximal remote sensing tools requires careful attention because these data are typically broad and non-specific with extensive overlap. In the last decade, numerous chemometric approaches have been proposed as robust and precise solutions to this issue, such as multiple linear regression, partial least squares regression (PLSR), support vector machines, and artificial intelligence techniques, one example of which is the adaptive neuro-fuzzy inference system (ANFIS) approach [24,48,49,50,51]. The ANFIS approach combines fuzzy inference (FIS) with an artificial neural network (ANN) and inherits the advantages of each [52,53,54], which include avoiding the fundamental problem of defining membership function parameters and obtaining a set of fuzzy if-then rules [55,56] while also allowing all of the parameters to be trained within the framework of a fuzzy logic system as a neural network [57].
Another approach for dealing with the data obtained from different proximal remote sensing tools to improve the predictive power of estimating various plant traits is to apply a genetic algorithm (GA). A GA is an optimization algorithm that uses the concept of best survival to generate better estimates of the possible solutions in a population. In each generation, a set of estimates is generated by selecting and combining individuals according to their level of accuracy in the problem statement domain, using operators derived from natural genetics [58].
To the best of our knowledge, no previous study has applied the hybrid methodology of ANFIS-GA to thermal and RBG imaging indices to construct robust and predictive models for the accurate estimation and monitoring of the growth, water content status, and production of potato under different irrigation water regimes. Therefore, the present study aimed to (i) quantify the response of growth, water status, and production of potato crop to different irrigation regimes, (ii) examine the performance of thermal and RGB imaging indices for indirect assessment of different traits relating to the growth, water status, and production of each potato variety across all irrigation regimes, for each irrigation regime across potato varieties, and across all conditions (varieties, irrigation regimes and growing seasons); (iii) identify the thermal and RGB imagery indices that explain the most variability in the measured plant traits across all conditions via stepwise multiple linear regression (SMLR); and (iv) evaluate the performance of ANFIS-GA models based on NRCT and RGB indices to predict the different plant traits across all conditions.

2. Materials and Methods

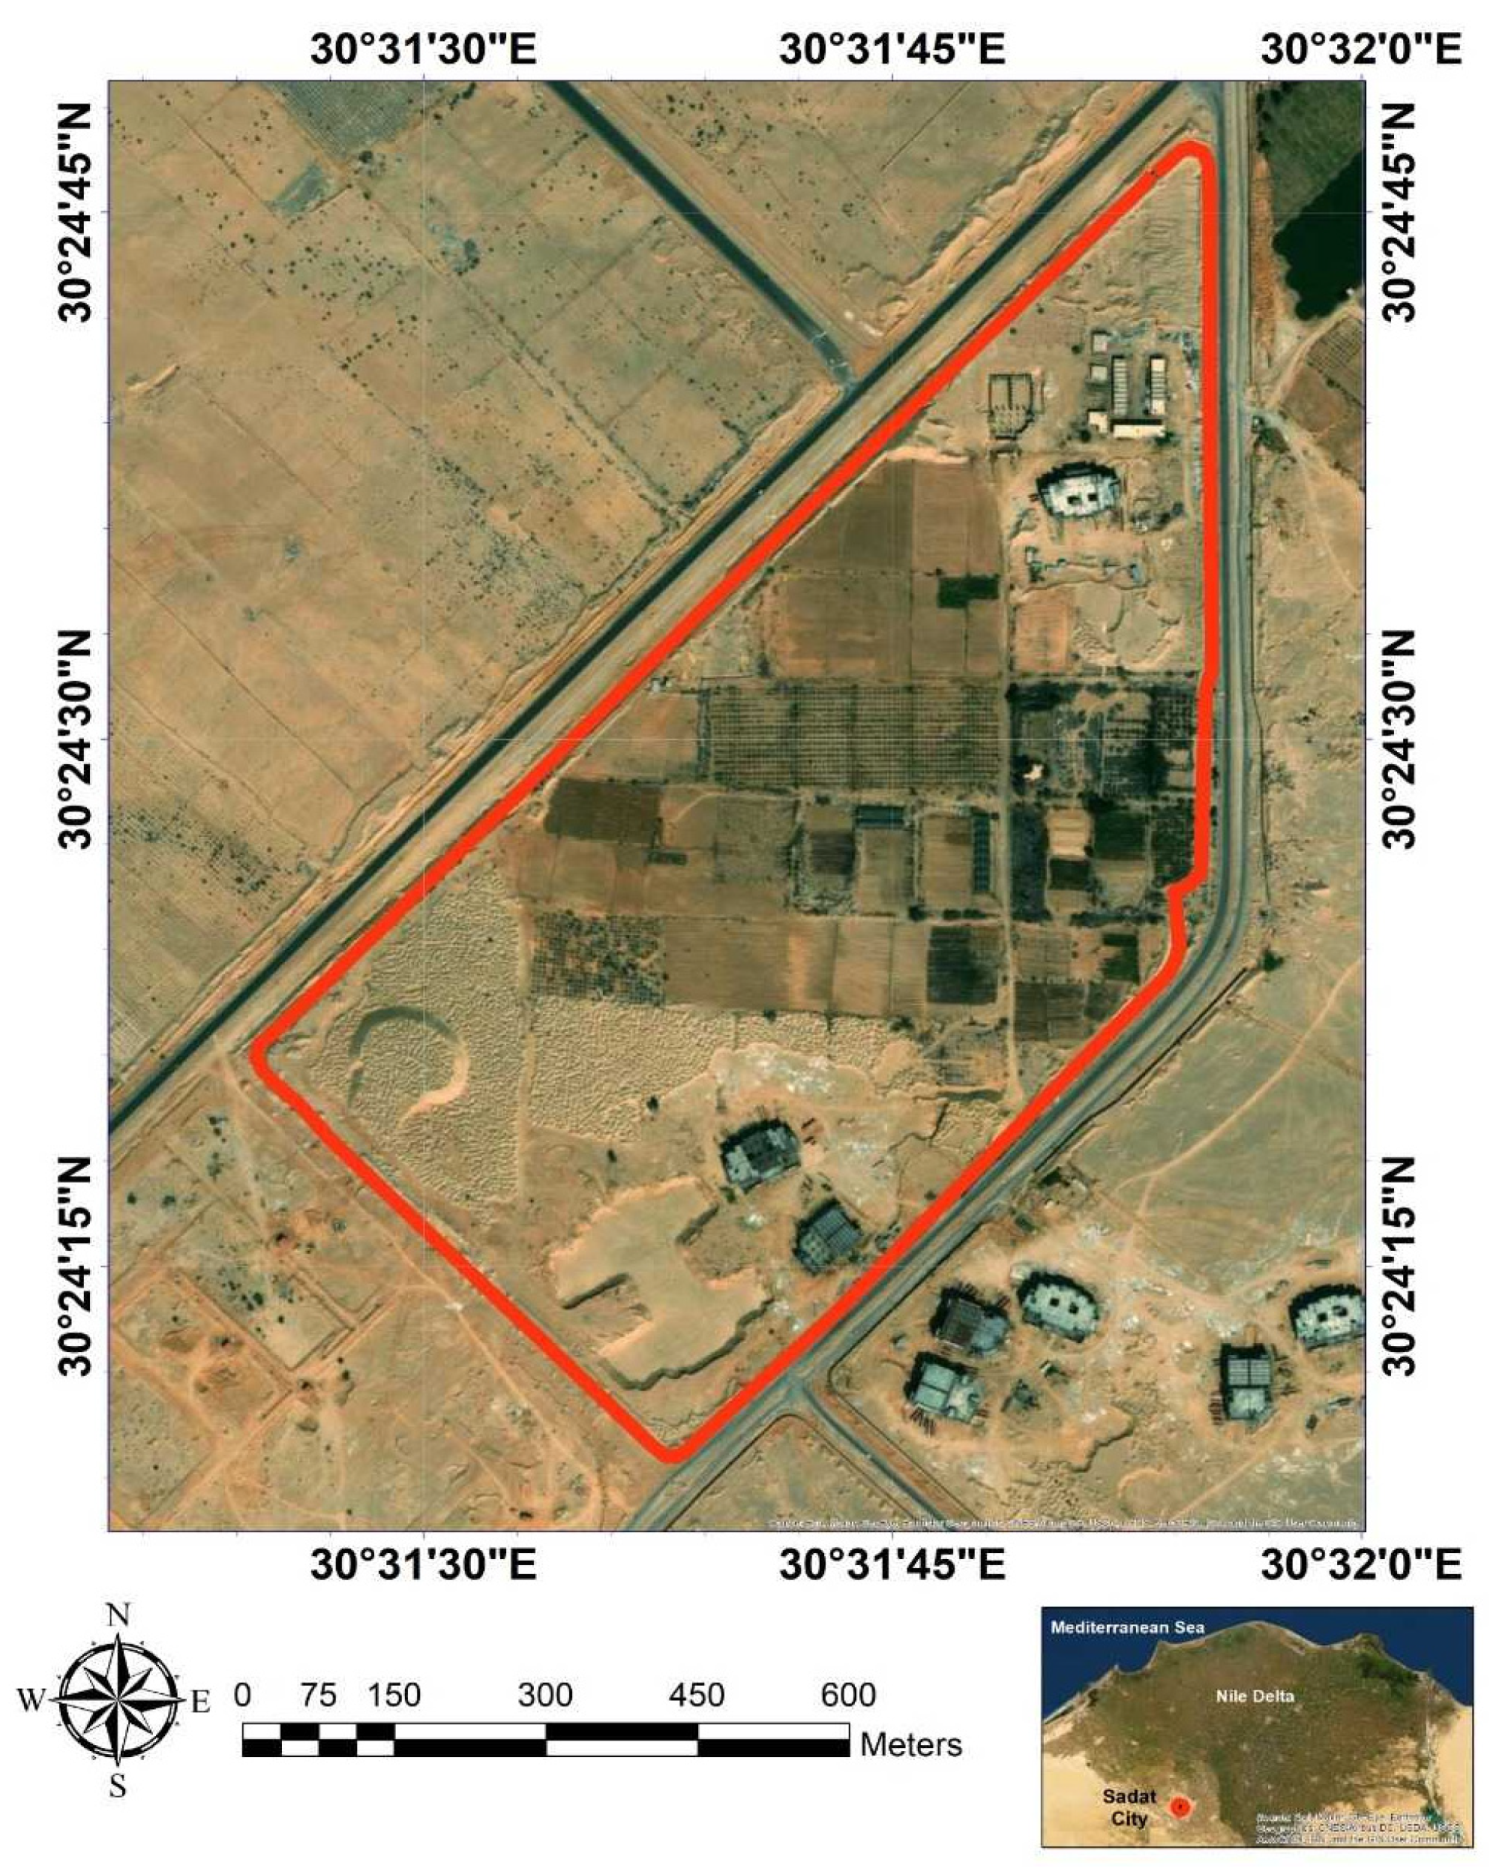
2.1. Experimental Site, Conditions, and Design

Two field experiments were conducted on drip-irrigated potato crops at the Research Station of the University of Sadat City, Egypt (Figure 1) during the spring growing seasons of 2019 and 2020.
The climate at the experimental site is characterized by warm summers and mild, cold winters with mean air temperatures of approximately 35.0 °C and 12.0 °C, respectively. During both growing seasons, there was very little rainfall and the rainwater did not contribute to the water requirements of the potato crops. The soil texture was sandy loam (69.8% sand, 22.3% silt, and 7.9% clay) with a bulk density of 1.45 g cm−3, a field capacity of 19.2%, and a wilting point of 10.1%. The electrical conductivity of the soil and irrigation water was approximately 1.20 dS m−1.
In both growing seasons, a split-plot experimental design was used with four replications. Three drip irrigation regimes [100%, 75%, and 50% of the estimated crop evapotranspiration (ETc)] were randomly assigned to the main plots, and two potato varieties (Bellini and Arizona) were randomly assigned to the sub-plots. The drip irrigation system was divided into four main sectors, each of which represented one replicate and consisted of eight polyethylene lateral drip lines (Twin-wall IV, 16 mm diameter) at the main plot level and four lateral drip lines assigned to each variety at the sub-plot level. Each lateral drip line was 30.0 m long, with a 0.30-m emitter spacing, and was laid out along each potato variety row at a distance of 0.75 m from adjacent lines. The lateral drip lines were connected to the sub-mainline (50 mm diameter) by T-shaped valves, which controlled the water flow to them. The drippers had a discharge rate of 4 L h−1.
Tubers of each variety that were a uniform and consistent size were planted alongside the drippers (one tuber per dripper) on 1 February 2019 and 30 January 2020 and were dug out on 10 May in both growing seasons. Composted animal manure (75 m3 ha−1), sulfur (300 kg ha−1 as elemental S), and phosphorus [200 kg ha−1 in the form of single furrow-banded calcium superphosphate (15.5% P2O5)] were applied basally during preparation of the soil for planting, while nitrogen [400 kg ha−1 as ammonium nitrate (33.5% N)] and potassium [100 kg ha−1 as potassium sulfate (50.0% K2O)] fertilizers were applied through the fertigation system in four and two equal doses, respectively, from the time of planting to 60 days after planting.

2.2. Irrigation Water Requirements

The Food and Agriculture Organization’s (FAO’s) CROPWAT software v.8 proposed by Smith [59] was used to calculate the amount of irrigation water and to determine the irrigation time for the three irrigation regimes. This software used the modified FAO Penman–Monteith equation reported by Allen et al. [60] and various daily climatic parameters collected from the nearest weather station to estimate the reference evapotranspiration (ETo). The water requirement for the 100% ETc regime was then calculated by multiplying ETo by the crop coefficient for potato (Kc). Because the FAO’s recommended values of Kc for potato crops must be adjusted when the minimum relative humidity (RHmin) differs from 45% and the wind speed is greater or less than 2 m s−1 at a height of 2 m, the Kc values were adjusted based on the RHmin and wind speed data for the study area. Based on the final calculations, the total amounts of irrigation water applied for the 100% ETc regime in the first and second seasons were approximately 592.0 and 606.0 mm ha−1, respectively. These amounts were then reduced by 25% and 50% for the 75% and 50% ETc regimes, respectively. To ensure full germination and good seedling establishment, the plants in each treatment group were irrigated regularly during the first 25 days after sowing, following which the irrigation water was applied according to the prescribed irrigation amount calculated for each irrigation regime.

2.3. Thermal Measurements

Thermal images of each sub-plot were captured at the bulking growth stage between 11:00 and 13:00 h using a handheld infrared thermal camera (Ti-32; Fluke Thermography, Glottertal, Germany) (Figure S1). This camera was equipped with a standard lens with a field of view of 23° × 17° and a 320 × 240 pixel micro-bolometer sensor, which detected infrared wavebands in a wavelength range of 7.5–14 µm, which is the optimal range for imaging applications that use heat signatures [61]. The camera had an accuracy of ±0.2 °C in the temperature range −20 °C to 600 °C and a thermal sensitivity of ≤0.05 °C at 30 °C. The emissivity for measurements of the plant canopy was set to 0.96 for the dry reference and 0.95 for the wet reference and the target leaves [30]. The thermal images were captured at a height of 0.80 m above the plant canopy in the nadir orientation. The average leaf temperature within each thermal image was calculated in the SmartView Fluke IR imaging software (version 3.2; Fluke Corporation, Plymouth, MN, USA) as the average values of 50 randomly selected leaves and a polygon area that was fitted around each leaf. These data were then applied to the following equation to calculate the NRCT [33]:
NRCT = T T min T max T min
where T, Tmin, and Tmax are the actual infrared temperature of the canopy of potato plants measured from each sub-plot, the lowest temperature measured during the whole field trial, and the highest temperature measured during the whole field trial, respectively.

2.4. Digital RGB Imaging

In parallel with measurement of thermal images, the canopy of potato plants within each sub-plot was also photographed between 11:00 and 13:00 h using a 14-megapixel digital camera (Kodak D5100 reflex; Tokyo, Japan) with a resolution of 2454 × 2056 pixels and 8-bit RGB images. The camera was held manually and oriented vertically downward toward the potato plants at a distance of 1 m. In order to minimize illumination discrepancies between images as well as to ensure homogeneous lightning conditions under clear sky conditions, an umbrella was always held above the camera to shade the area under the camera view. The flash of the camera was always kept off during measurements. The digital images were saved in the jpeg format and then analyzed using the Python software (Version 3.7.3). Because the images sometimes contained non-potato crop canopy features, such as soil, weeds, and straw, the images need to be segmented and extracted to eliminate interference by non-canopy information during feature extraction (Figure 2).
The RGB images were converted to the Hue, Saturation, Intensity color space to extract only the color components, and plant pixels were discriminated from background pixels using fixed thresholds. A binary image of the plant was then obtained by setting the background pixels to 0 and the plant pixels to 1 [62,63]. Thresholding technique is a process of image segmentation to convert the image to grayscale [63] and produce a binary image [63] which has two possible pixel values, namely the intensity value of the image that is more than or equal to the threshold value of 1 (white or foreground) and when it is less than the threshold value or value 0 (black or background) that can be removed. Each pixel in the binary image had a size of 1 bit.
RGB imagery consists of three bands, so the color of each pixel is broken down into three values [64]. The values of these RGB channels in plant canopies are affected by several factors, such as the area of green biomass and the chlorophyll content. The RGB color space percentage values were extracted as sample features using the following equations:
R   = 1 S num Σ i = 1 S num R i ,
G   = 1 S num Σ i = 1 S num G i ,
B   = 1 S num Σ i = 1 S num B i ,
where Ri, Gi, and Bi are the pixel values for the red, green, and blue bands, respectively, in the digital image; i and Snum are the first pixel and maximum number of pixels, respectively; R   ,   G , and B are the mean values of the red, green, and blue bands, respectively. The pseudo-code that was used to train each algorithm to extract the RGB color space is presented in Supplementary Materials File S1. The formula and references of the twelve RGB imagery indices that were tested in this study are presented in Table 1.

2.5. Plant Trait Measurements

After the thermal and RGB images of the potato plant canopies had been captured, 20 plants from within the imaged area of each sub-plot were randomly harvested from ground level and immediately weighed to determine the biomass fresh weight (BFW). The harvested plants were then cut into small parts, oven-dried to a constant weight at 70 °C, and weighed to determine the biomass dry weight (BDW). The BFW and BDW data were then applied to the following equation to calculate the percentage of biomass water content (BWC):
BWC   ( % ) = BFW BDW BFW
Tubers were harvested when the potato plants in each treatment group reached the onset of senescence. The tubers in each sub-plot were harvested by hand over an area of 22.5 m2 (two lateral drip lines, 15 m in length), and the total tuber yield (TTY) per ha was calculated and expressed as Mg ha−1.

2.6. Modeling

2.6.1. Stepwise Multiple Linear Regression (SMLR)

SMLR is used to analyze the response of a single dependent variable to two or more independent variables. This method uses forward selection and backward elimination approaches to choose the input (independent) variables (in this case the thermal and RGB imaging indices) for the regression equation in a multi-linear model based on their relative importance, which is determined by their influence, their distribution, and the significance of their effect on a target (dependent) variable (a given measured trait). At each step of the regression process, the input variables are inserted into the SMLR model and checked to distinguish indices that should be remove based on a significant probability level, which is generally set at 0.05 [72]. The process ends when no more indices can be removed or entered.
Extraction of the most influential thermal and RGB imaging indices that accounted for most of the variation in the measured traits (BFW, BDW, BWC, and TTY) using SMLR analysis was based on 75% of the datasets (n = 36). The best-fitting calibration equations for the distinct models with the lowest root mean square error (RMSE) values and highest coefficients of determination (R2) were then used to predict each measured trait based on the remaining 25% of datasets.

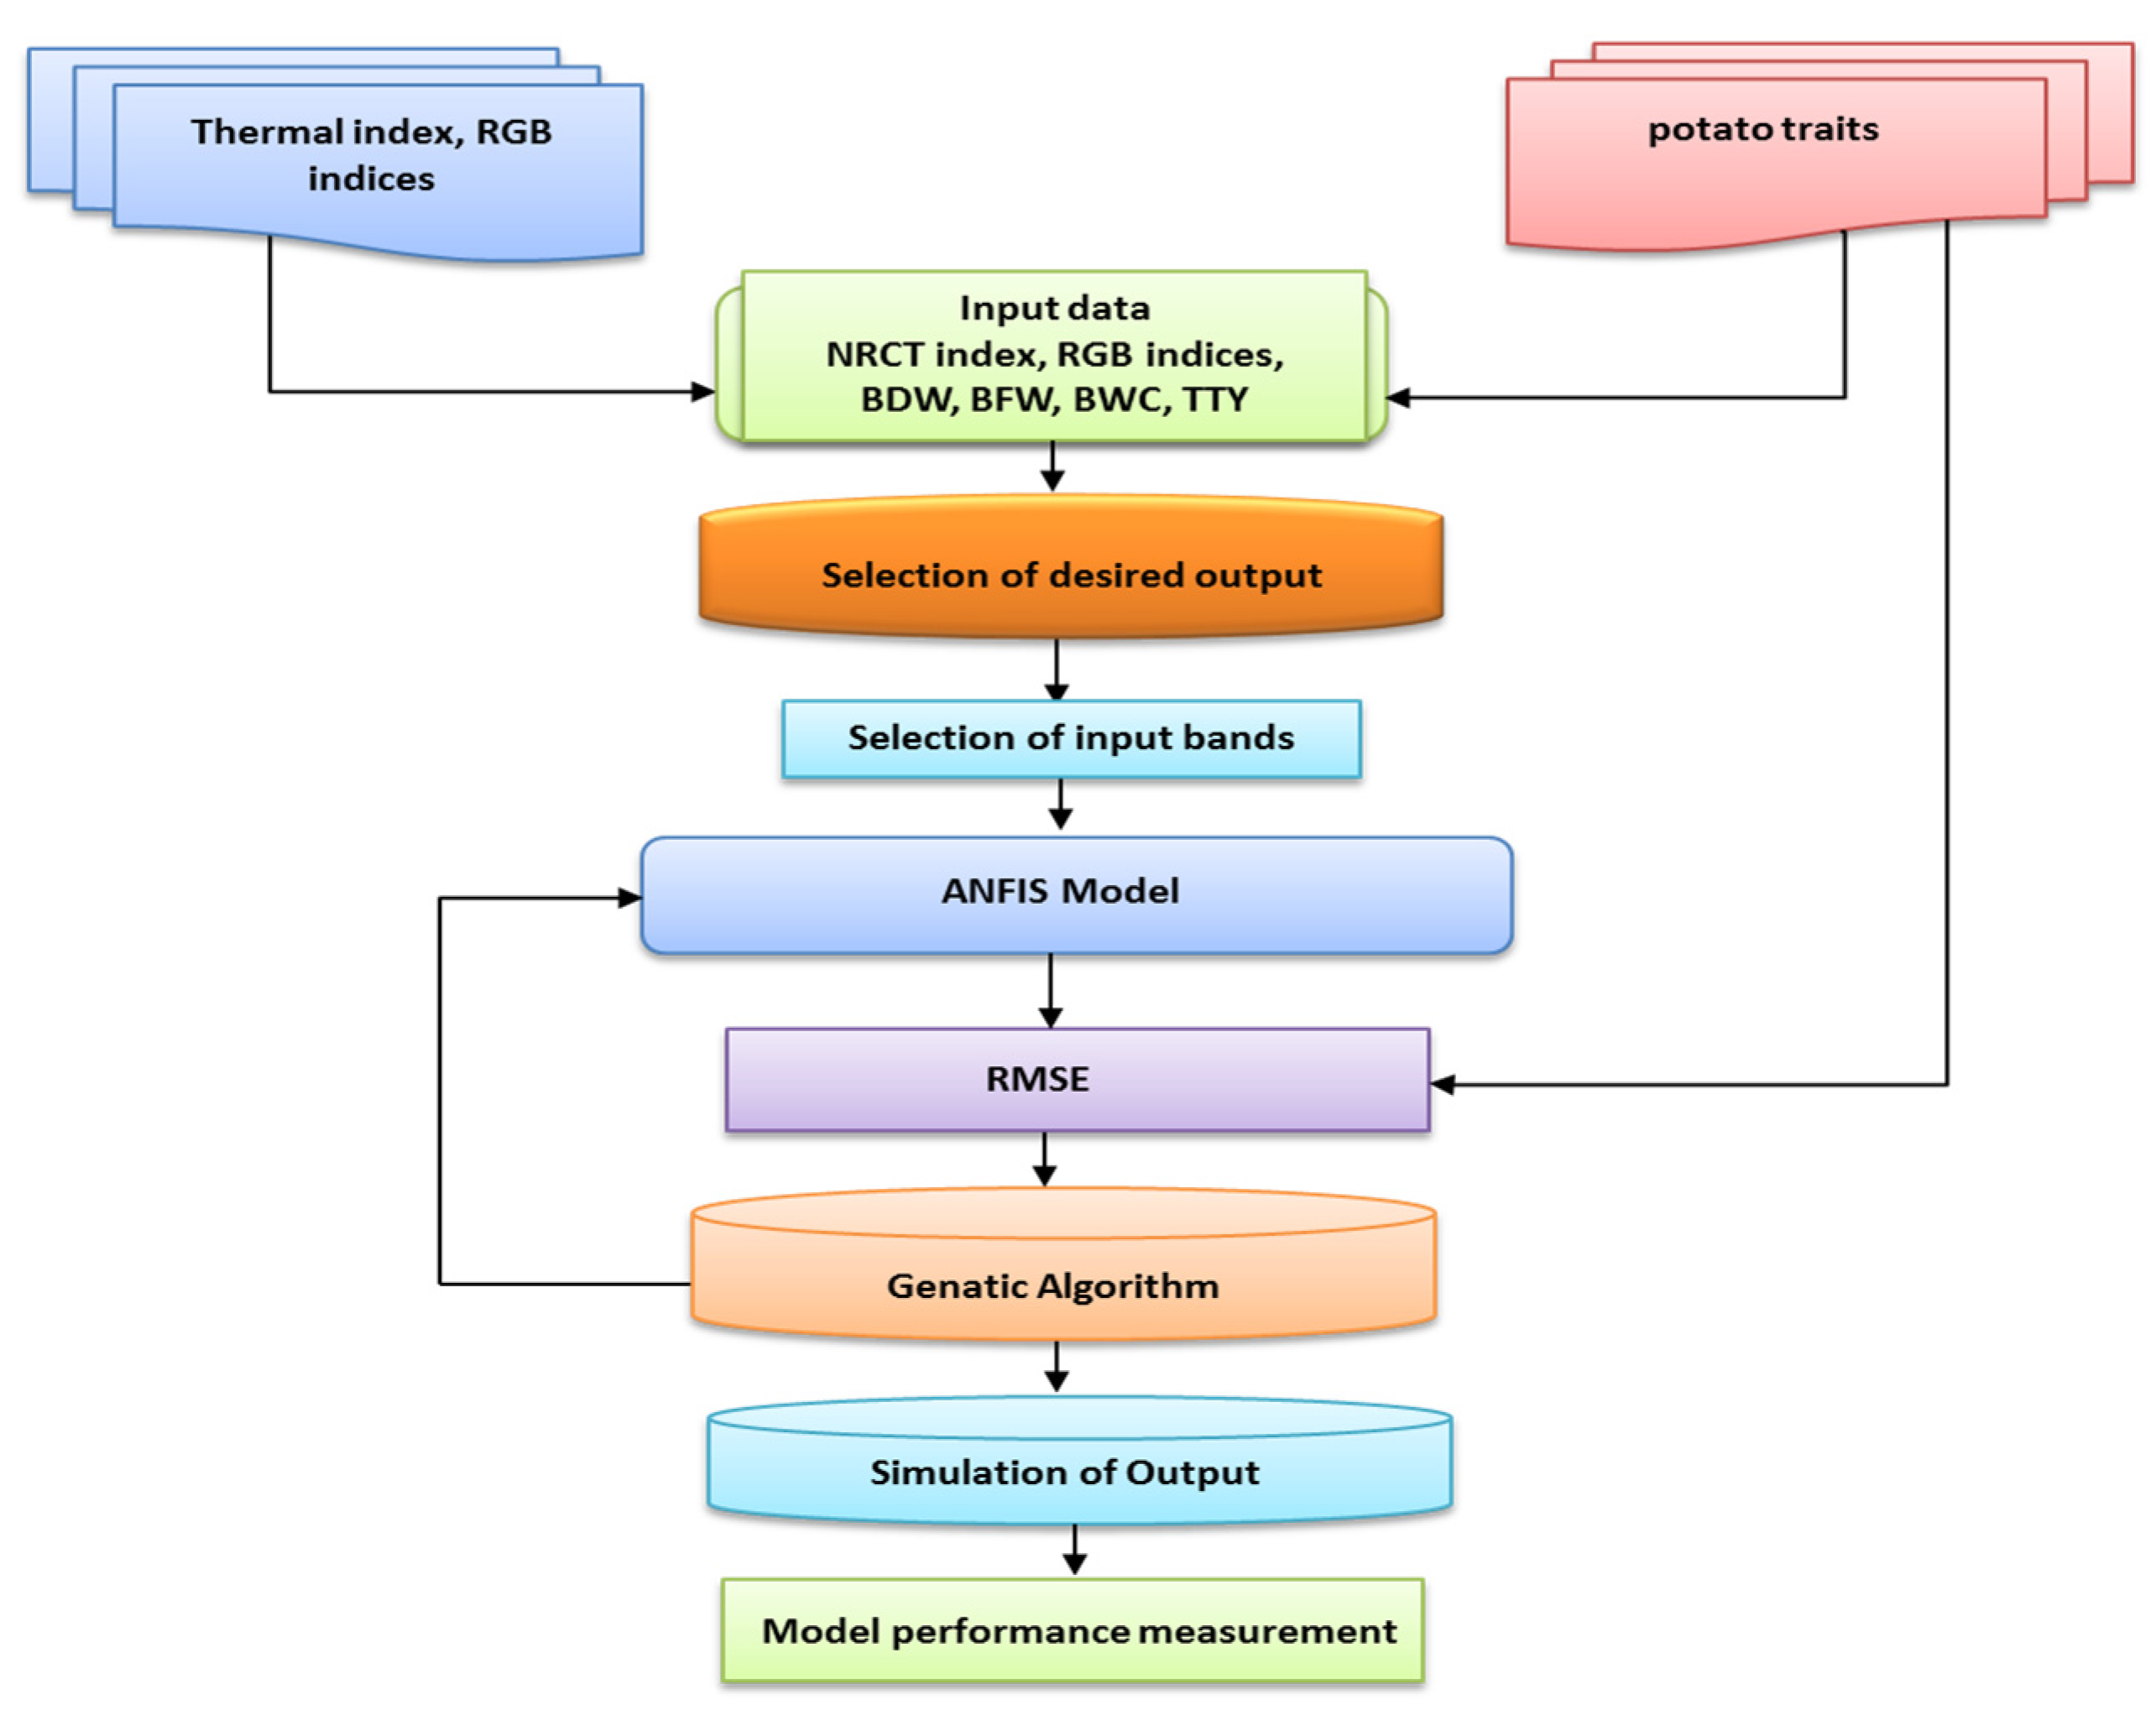
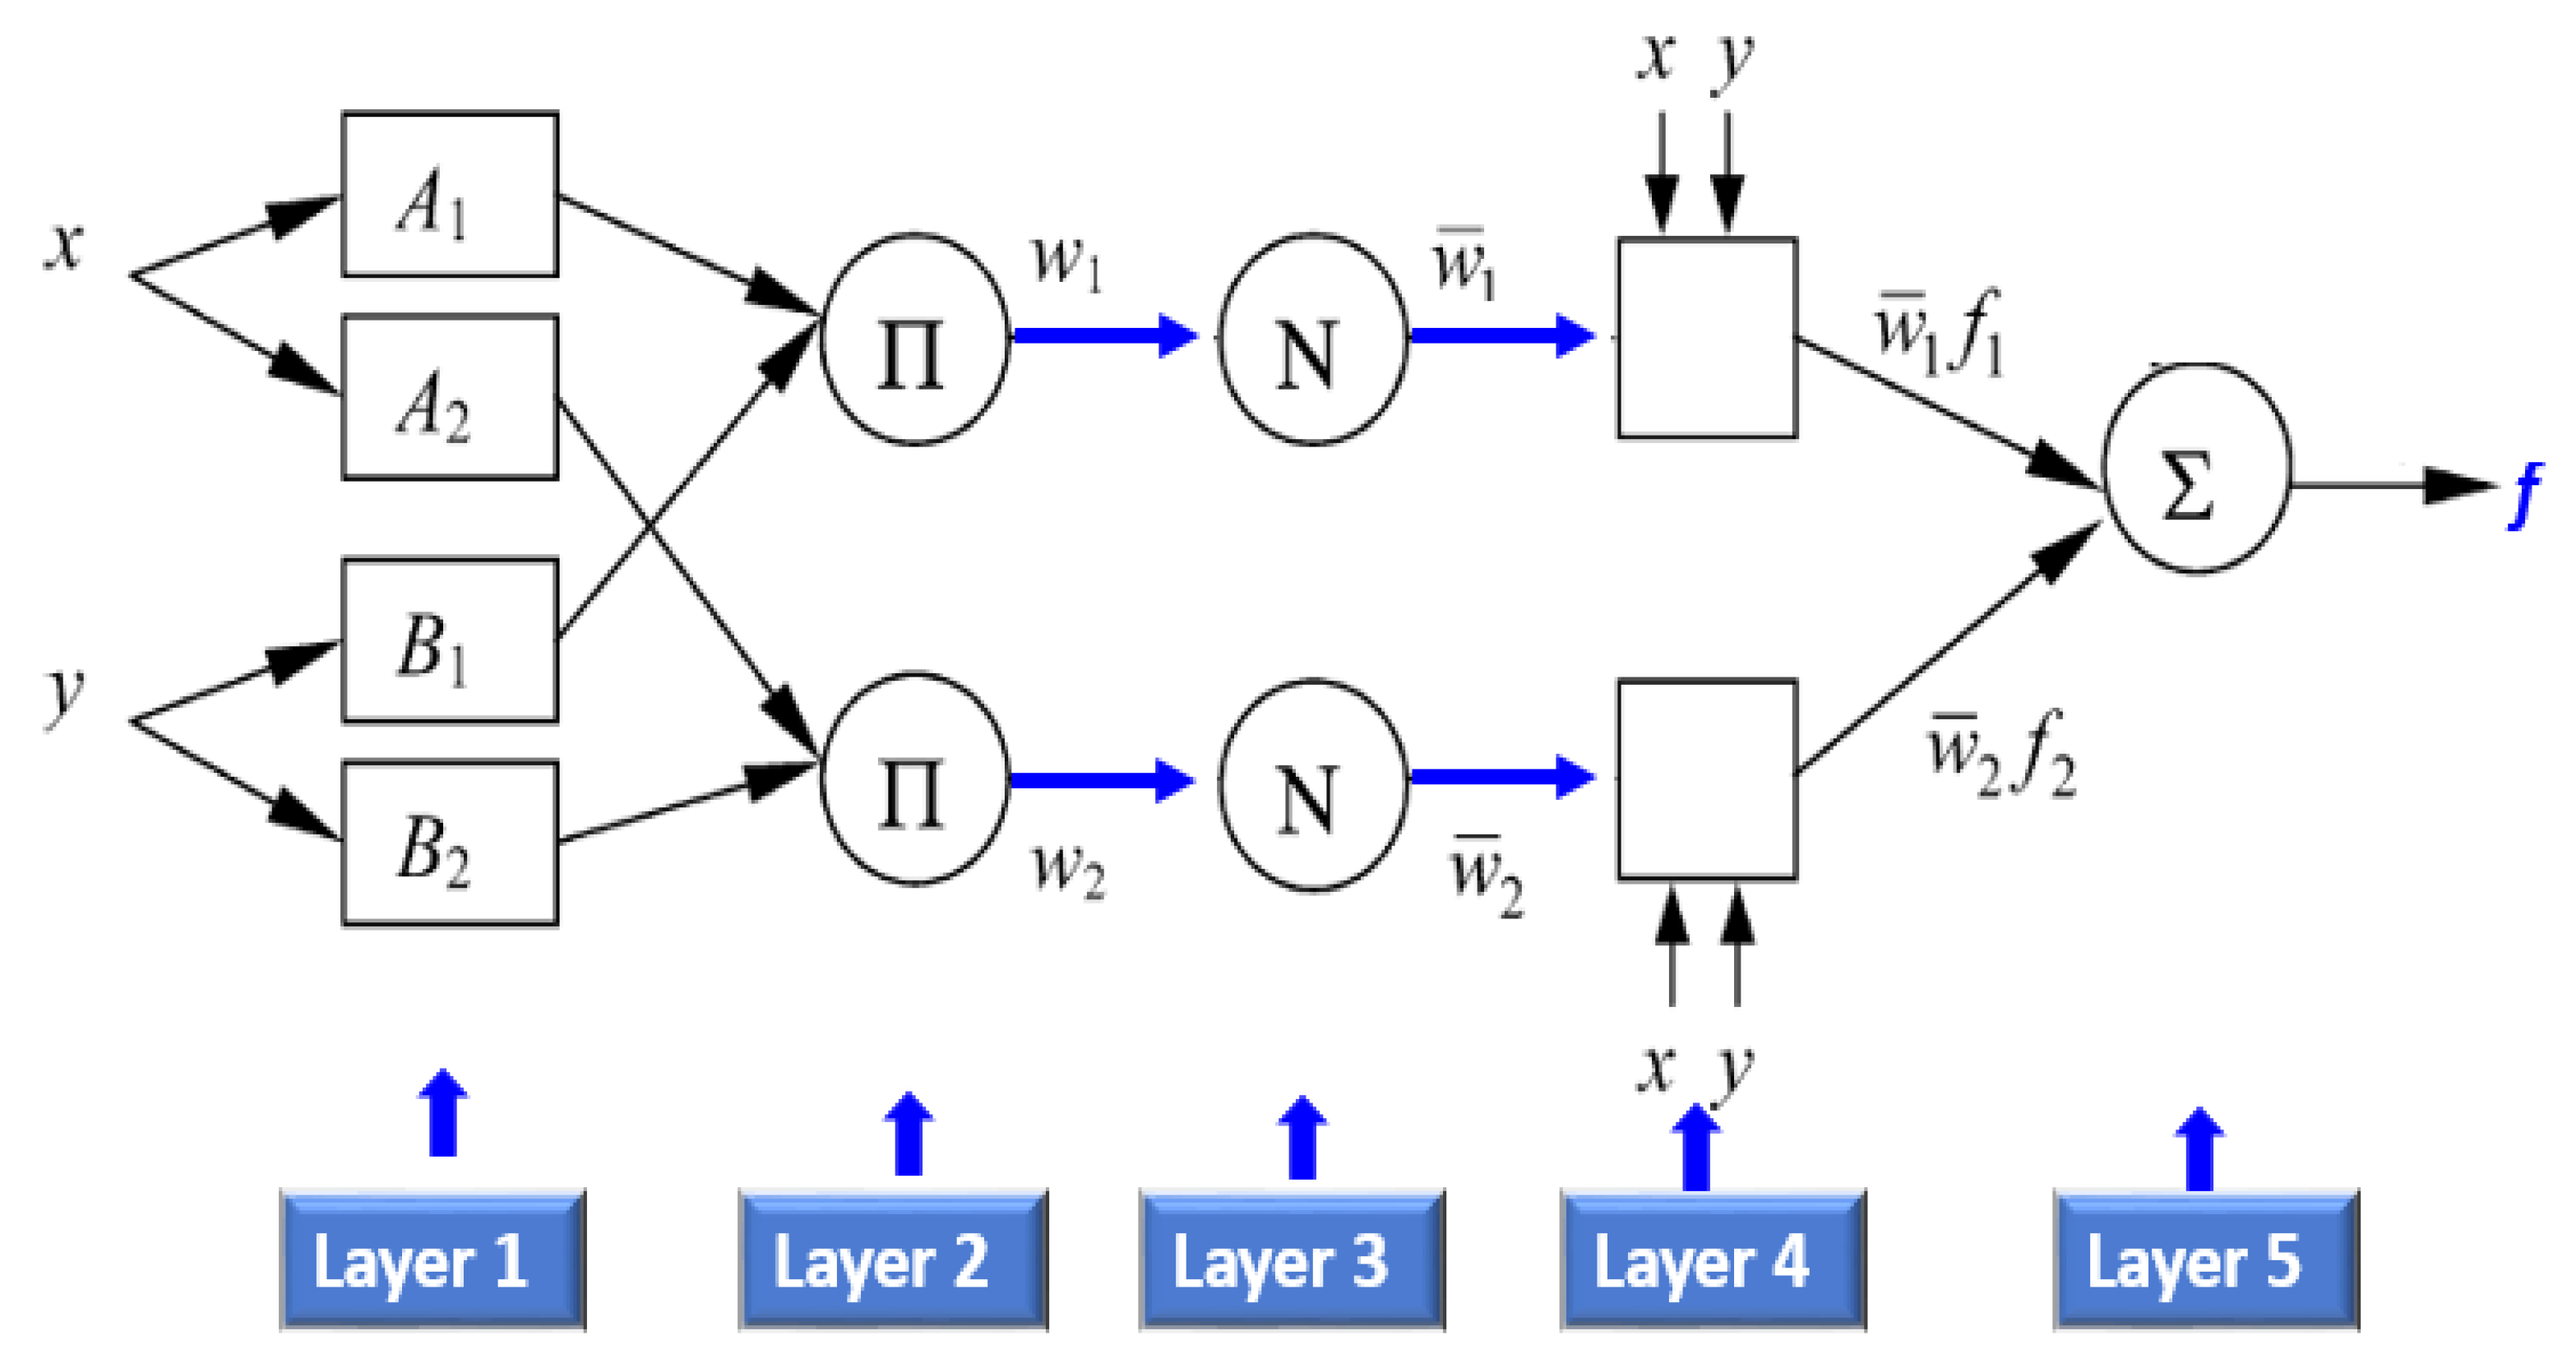
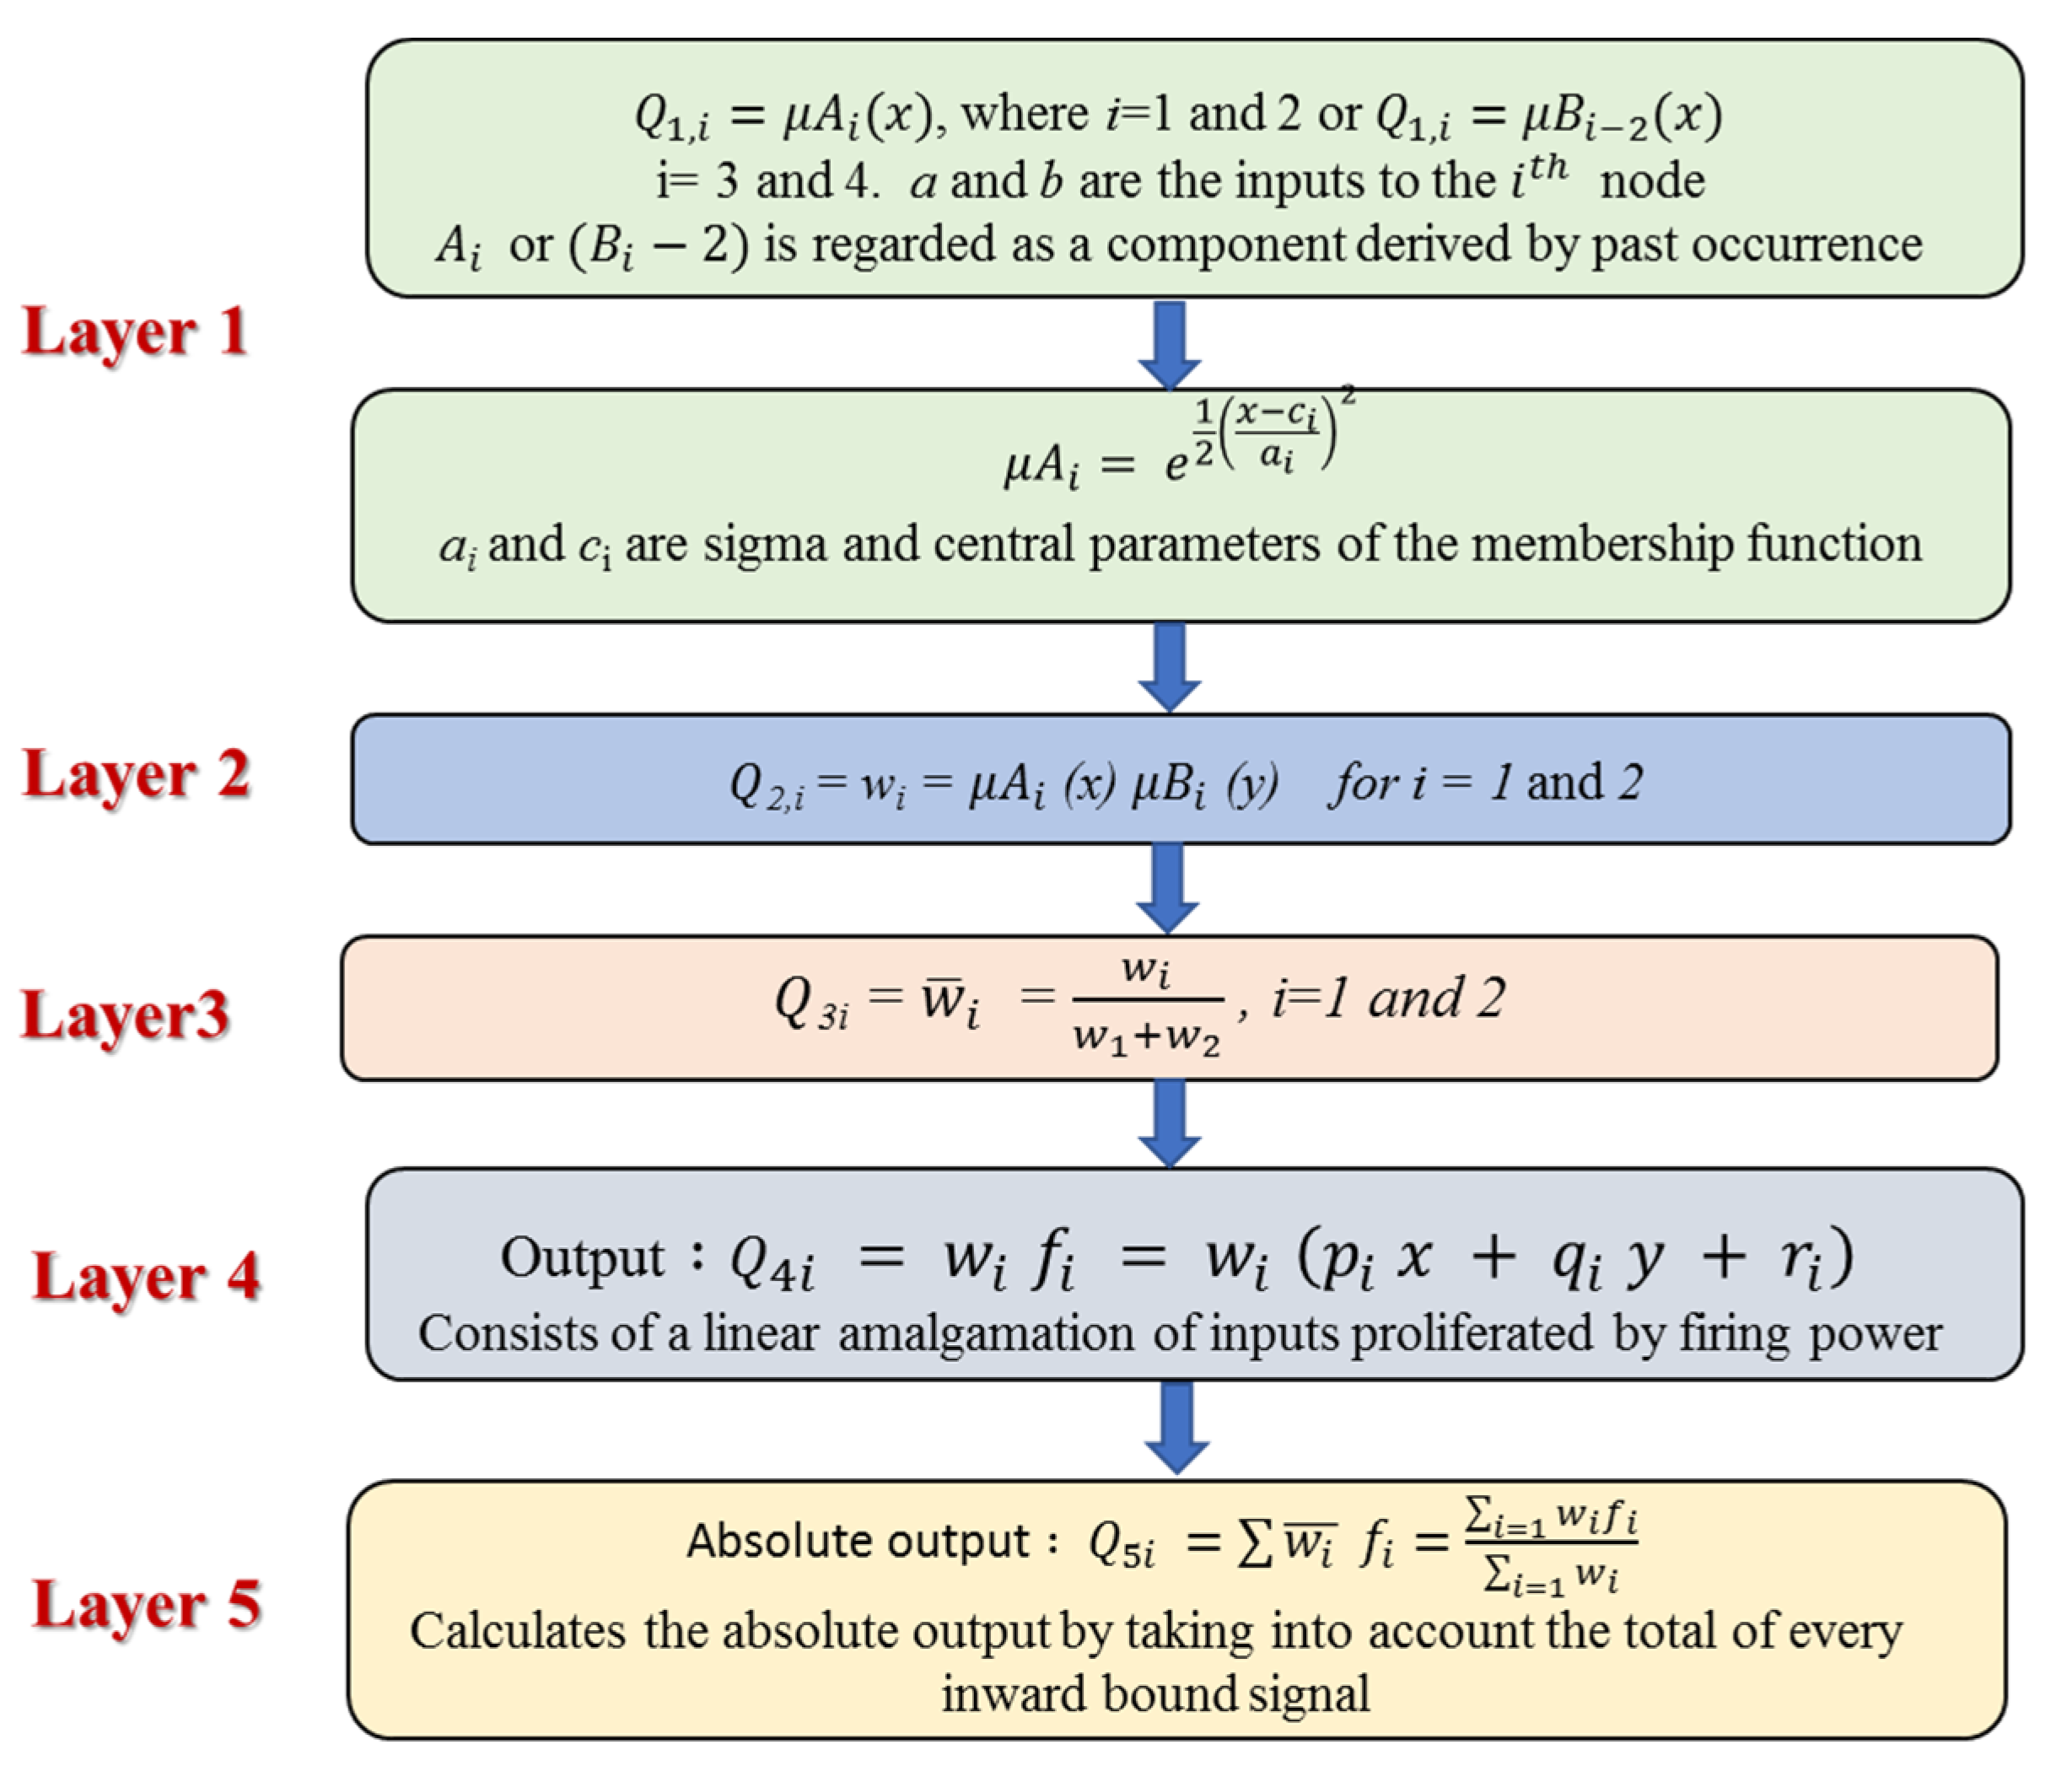
2.6.2. Adaptive Neuro-Fuzzy Inference System (ANFIS) Model

ANFIS was developed by Jang [55] by joining ANN with FIS to allow the advantages of a fuzzy system to be combined with a learning algorithm [73,74]. ANFIS uses various output or input data to hypothesize the FIS method and then generally updates its membership criteria by using a backpropagation algorithm. Figure 3 shows a schematic diagram of the ANFIS methodology that was used in this study to predict the various measured plant traits (BFW, BDW, BWC, and TTY).
The ANFIS model was integrated with the thermal and RGB indices to predict the measured plant traits and was developed and trained using a GA approach based on a population algorithm. Figure 4 illustrates the ANFIS structural design, which had a multilayered feed-forward configuration that was linked to an incoherent x and y input network.
It is essential to mention that the ANFIS model mainly consists of five functional blocks. The Sugeno model (Figure 4) has a rule base that takes the form shown below [75,76].
Through putting a = A1 and b = B1:
f 1 = p 1 × a + q 1 × b + r 1 ,  
while through putting a = A2 and b = B2:
f 2 = p 2   ×   a + q 2 × b + r 2 ,
where fi is the outputs within the inconsistent zone indicated by the fuzzy principle, Ai and Bi are the membership values, a and b are indirect identifying functions, and pi, qi, and ri are the consequential restrictions that are modified during the forward pass within the learning algorithm. If the membership functions for the fuzzy sets Ai and Bi are μAi and μBi respectively, the five layers that incorporate ANFIS are described in Figure 5. More details about ANFIS can be found in Khadr et al. [77].
In the present study, ANFIS was utilized to determine the relationships between the thermal and RGB indices and the measured plant traits and to characterize them as fuzzy “if-then” regulations. Thus, the premise segment of the fuzzy if-then rules included the thermal and RGB image data, while the consequent segment included the plant traits BFW, BDW, BWC, and TTY. The framework of the developed ANFIS archetype was composed of a Sugeno-type fuzzy system that had a linear output membership function and a typical bell-shaped input membership function.

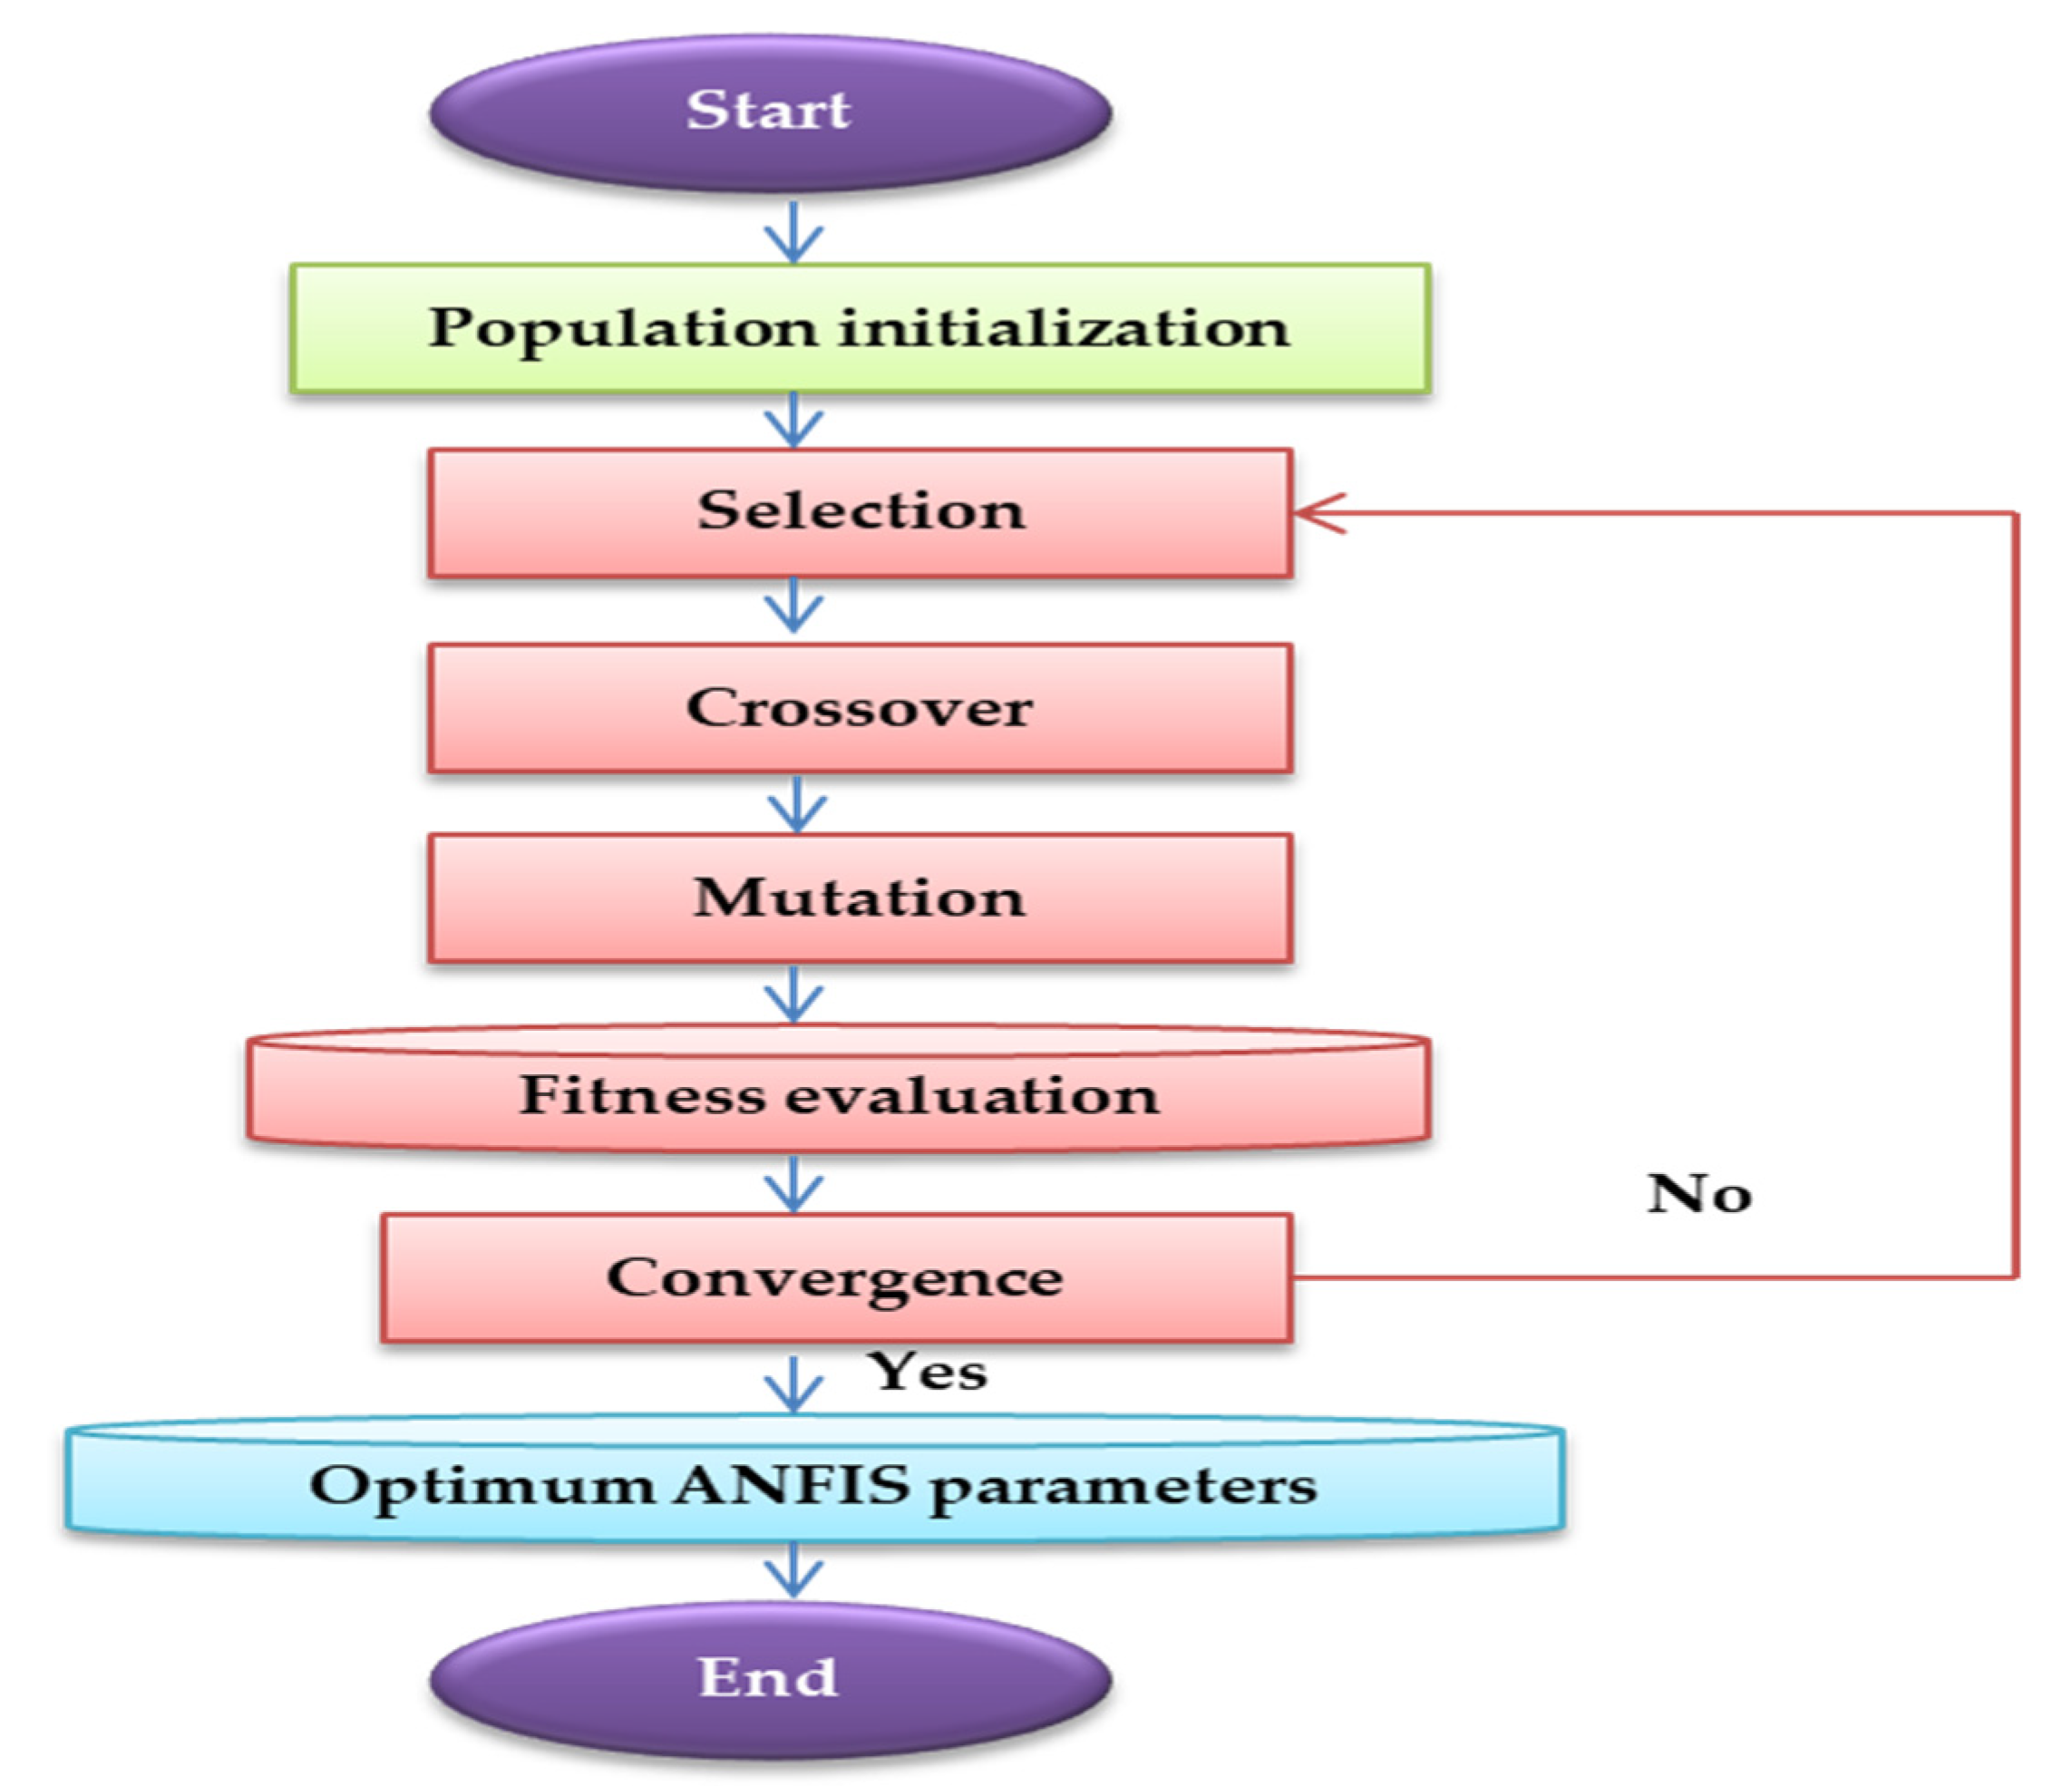
2.6.3. Genetic Algorithm (GA)

GAs are heuristic search approaches that are applicable to a wide range of practical optimization problems. The fundamental principles of GAs were proposed by John Holland in the 1970s and are based on the evolutionary principle of natural genetics. The algorithm starts with an arbitrarily generated population of chromosomes and then uses genetic operators (i.e., selection, crossover, and mutation) to generate iterations of fitter chromosomes to optimize the assessment of solutions [78]. Following fitness function evaluation, selection is accomplished via roulette wheel selection, which is analogous to the essential tool of the “survival of the fittest” principle, to form the next generation, with each portion of the roulette wheel being assigned a fitness value. This process is repeated until an acceptable compliance value or unique solution is reached.
In the present study, GA was employed to optimize ANFIS parameters. A basic flowchart describing the GA process is shown in Figure 6. ANFIS includes two parameter types (premise and consequent parameters) that need to be updated and optimized. Premise parameters belong to the Gaussian membership function, which is given as {ai} in Figure 5, and the total number of premise parameters is equal to the sum of the parameters in all membership functions. Consequent parameters are used in the defuzzification layer, which is shown as {pi, qi, ri} in Figure 5. To minimize the error value between the outputs obtained from ANFIS and the measured data, the ANFIS parameters were optimized with GA. The error value of the solution was determined as the RMSE, which demonstrates the fit (absolute) of the model to the data points (i.e., how close the experimental data are to the model’s projected values). Thus, a smaller RMSE value indicates a better fit. RMSE was calculated using the following Equation:
RMSE = Σ i = 1 n ( P o i P f i ) 2 n ,  
where Po is the observed parameter value, Pf is the predicted value, and n is the number of data points.
All thermal and RGB indices were applied as inputs to train the ANFIS-GA models to estimate the measured plant traits. To create the models, the measured datasets were randomly divided into two unequal sets–training datasets (75%) and testing datasets (25%). The performances of the developed models were then evaluated using several evaluation criteria, including R2, the Nash–Sutcliffe coefficient (E), the RMSE, and mean absolute deviations (MADs).

2.6.4. Data Analysis

The data of different destructively determined plant traits (BFW, BDW, BWC, and TTY) and the thermal and RGB imaging indices were subjected to analysis of variance (ANOVA) in order to examine the response of these measurements of the two varieties to the different irrigation water regimes. The ANOVA analysis for each season was appropriate for a randomized complete block design in split-plot arrangement, with the irrigation regimes and varieties as the main factor and sub factor, respectively. However, the data of two seasons were tested for homogeneity and normality before analysis using Bartlett’s test and the Shapiro–Wilk test, respectively. Because there is homogeneity of error variance for the different measurements, combined analysis of variance over two seasons of data was done. Variety, irrigation regime, and their interaction were considered a fixed effect, while growing season, replicate, and their interaction were considered a random effect. The significant differences between the mean values of the different plant traits and thermal and RGB imaging indices among the irrigation regimes for each variety were separated at the 0.05% probability level using Duncan’s multiple range test. These statistical analyses were performed using Statistical Product and Service Solutions (SPSS) Version 15.0 (SPSS Inc., Chicago, IL, USA). The relationships between the plant traits and the thermal and RGB imaging indices for each variety (n = 24), each irrigation regime (n = 16), each growing season (n = 24), and across all conditions (n = 48) were fitted by linear regression using Sigma Plot (v. 11.0; SPSS, Chicago, IL, USA), and the significance of these relationships was tested by calculating the R2 values. The significance level of R2 values for all relationships was set at the 0.05, 0.01, and 0.001 probability level.

3. Results and Discussion

3.1. Combined Analysis of Variance for Measured Plant Traits, and Thermal and RGB Imaging Indices

The results of combined analysis of variance for different measured traits (Figure 7) and thermal and RGB imaging indices (Table 2), after homogeneity test for error variance, showed non-significant differences between seasons. Additionally, the measured traits and indices were not affected by the 2-way interaction of season and irrigation regime or season and variety, or by the 3-way interaction of season, irrigation regime, and variety. The results of combined analysis of variance revealed highly significant differences (P ≤ 0.01) between irrigation regimes for all measured traits and indices. However, the variety main effect, as well as the interaction of irrigation regimes and varieties, was non-significant for all measured plant traits, except TTY, and for all thermal and RGB imaging indices, except NRCT, which both showed significant differences between varieties.

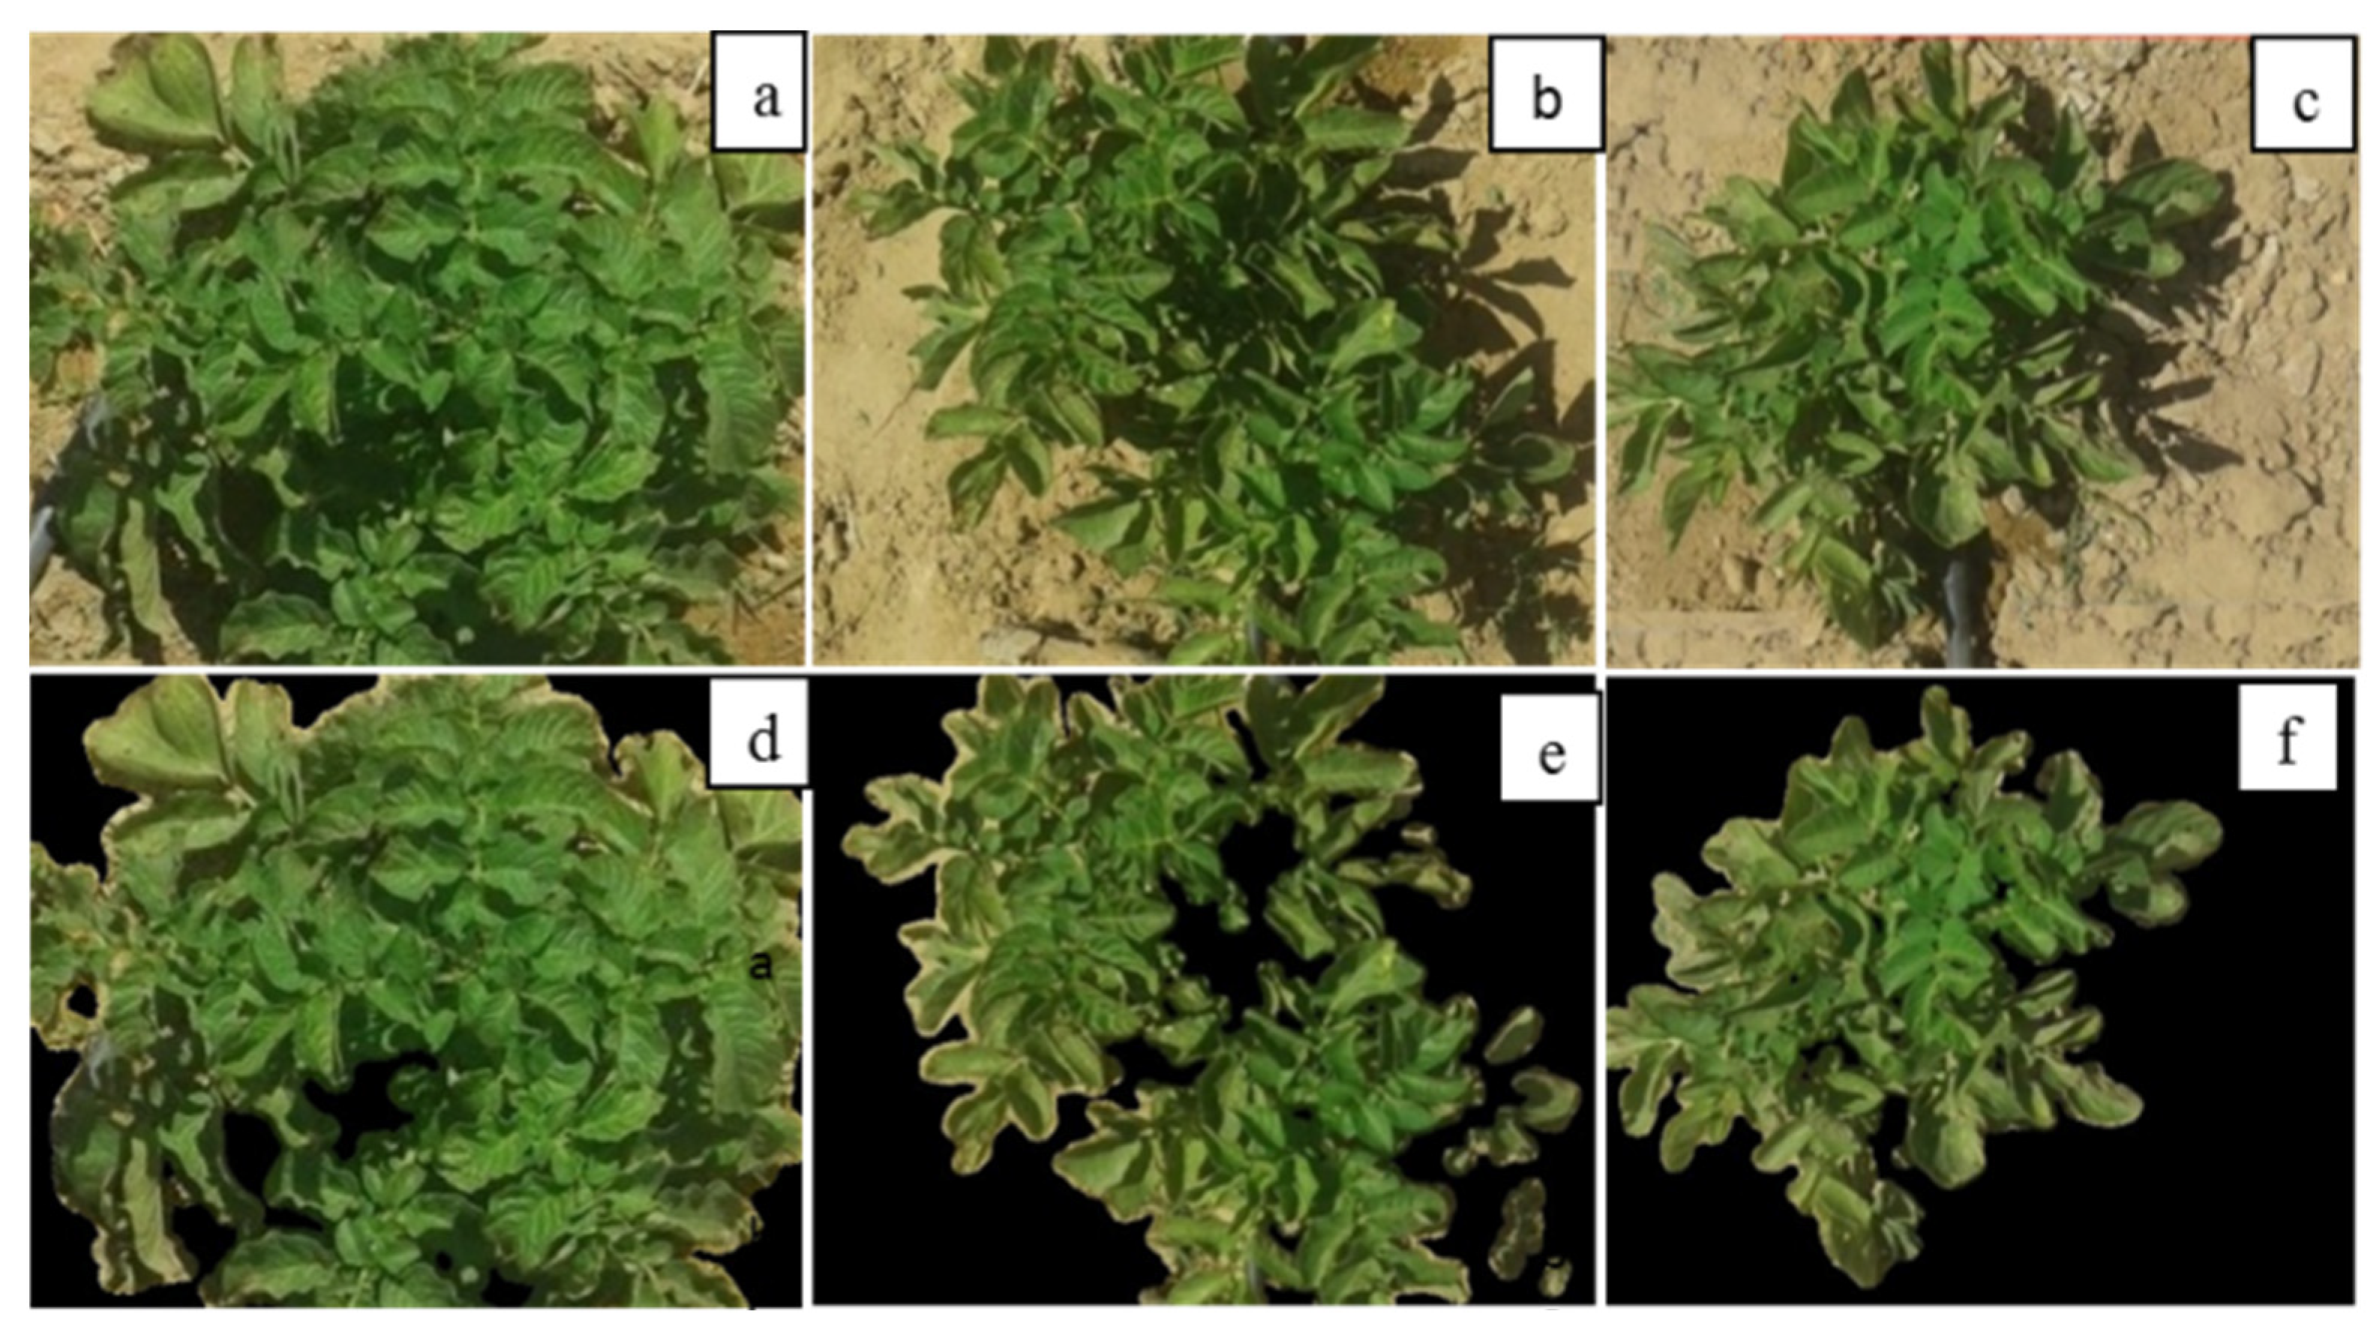
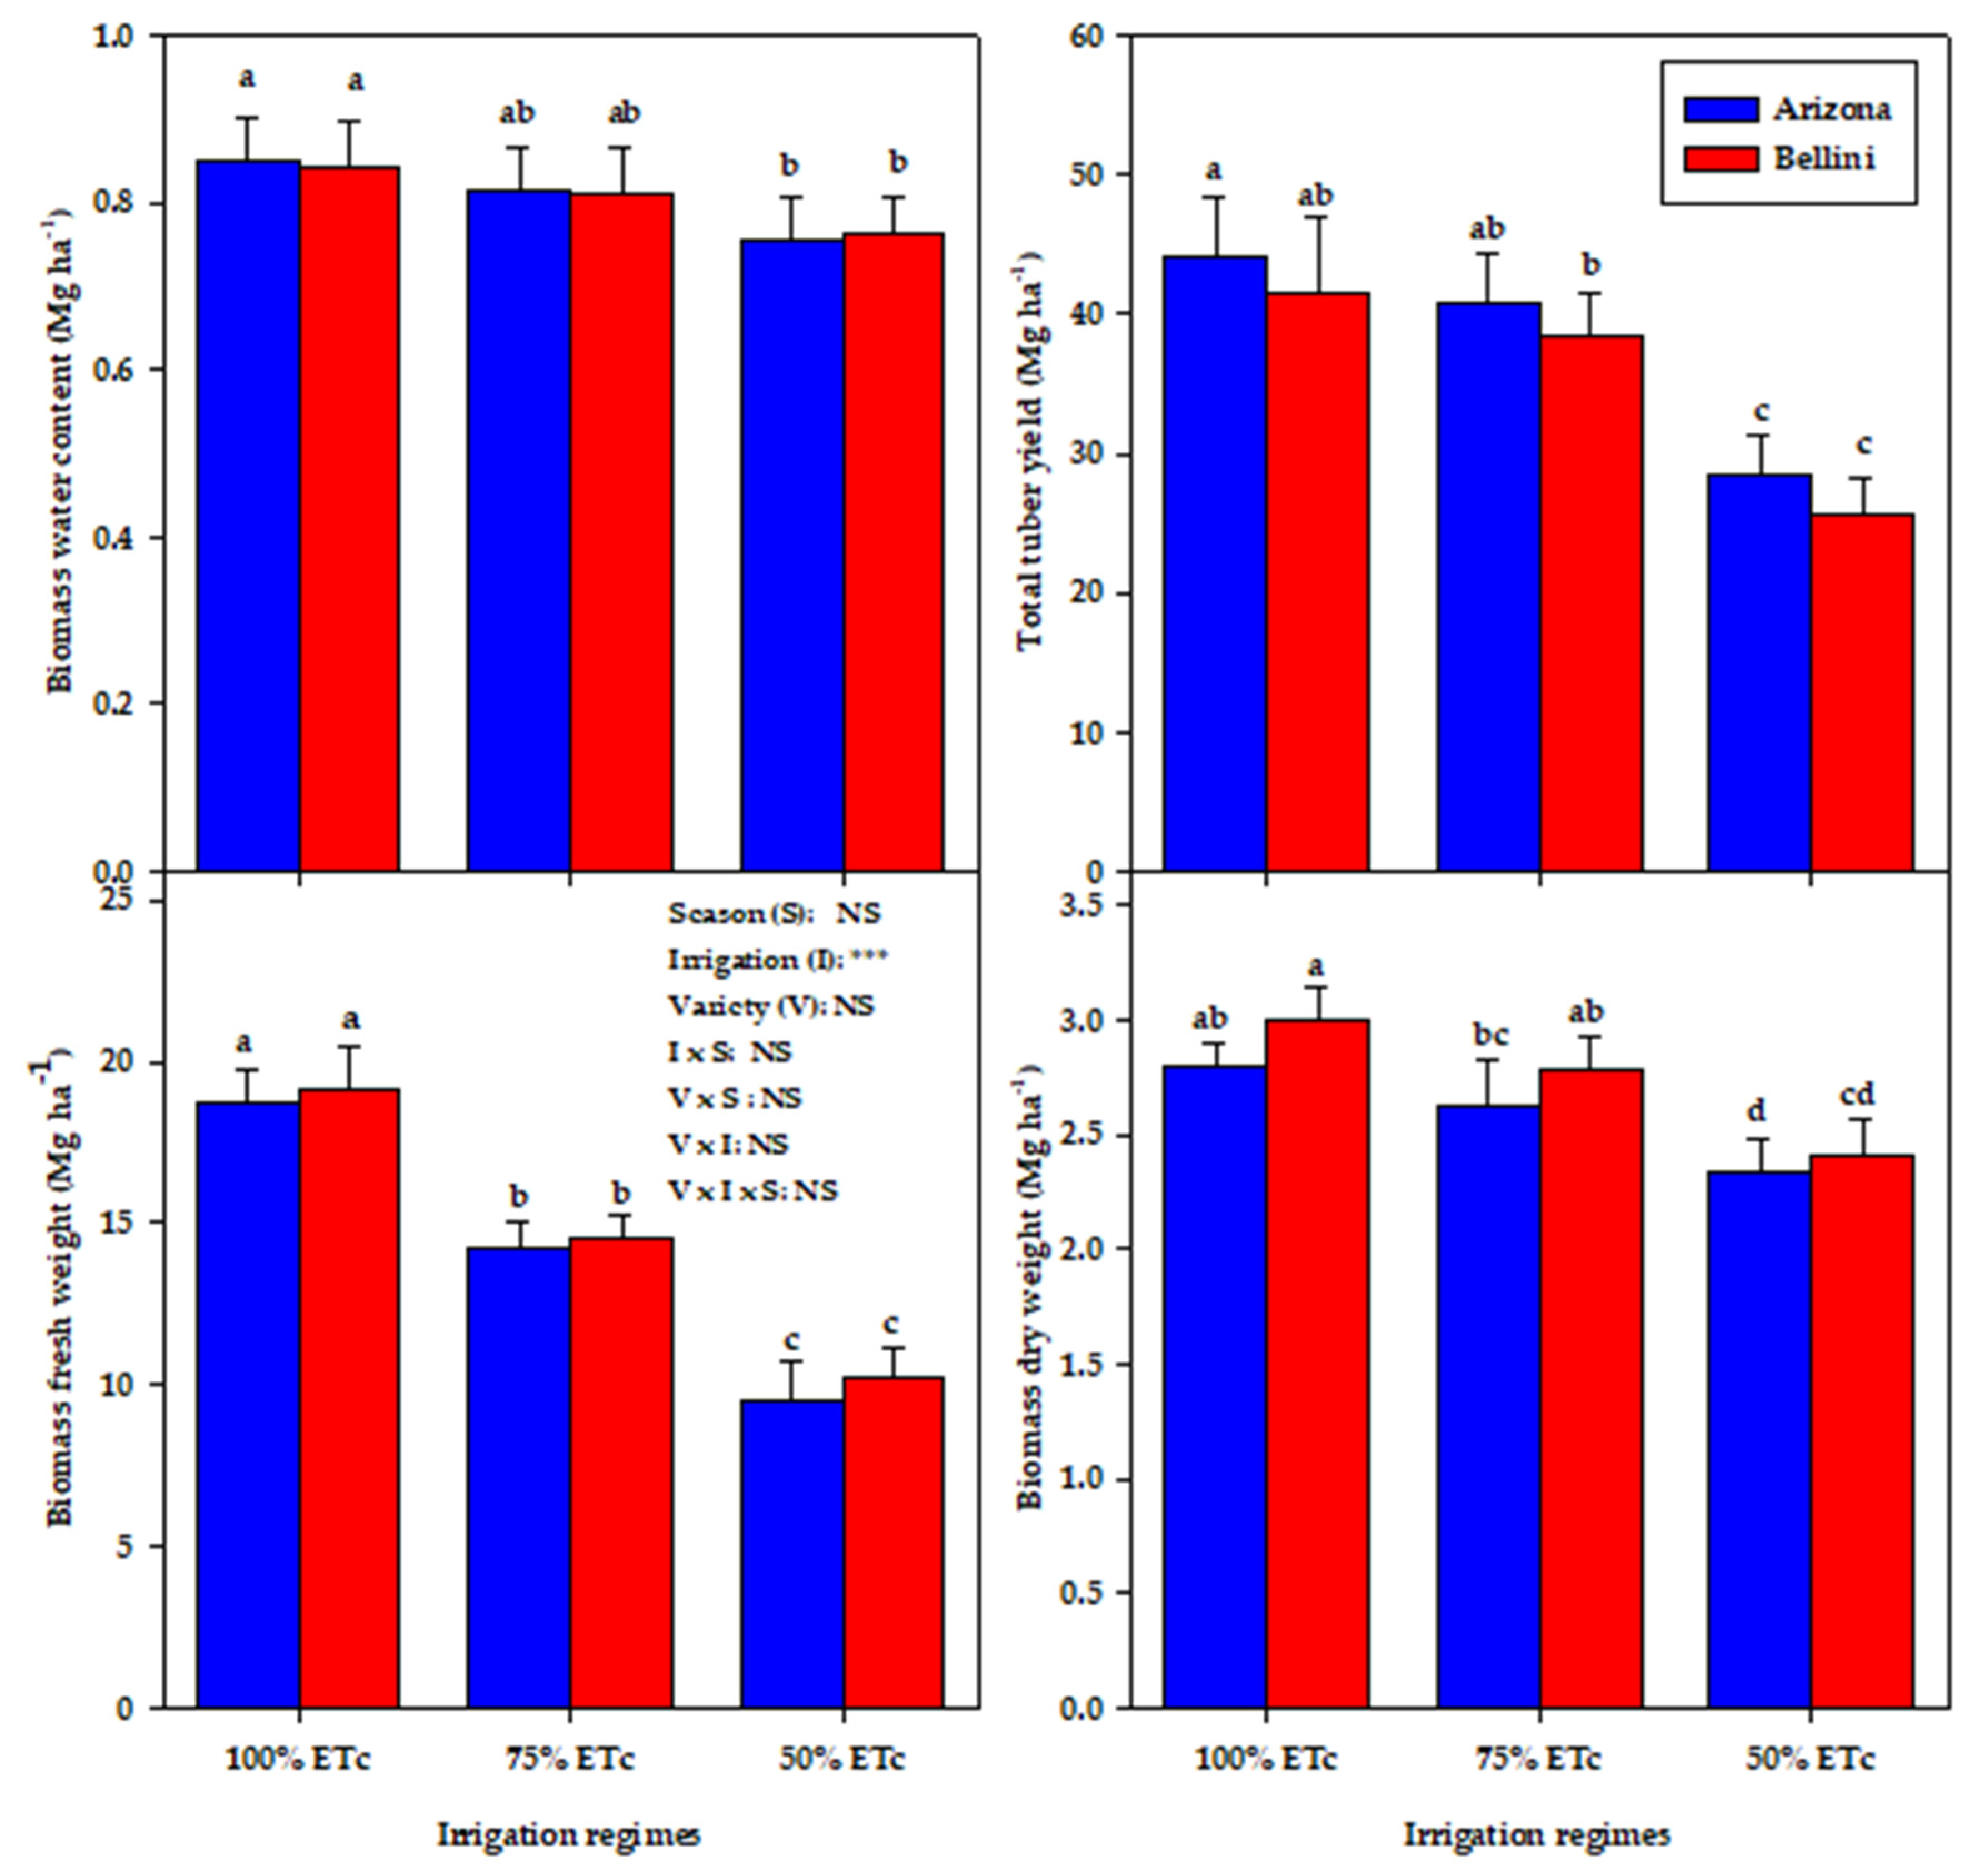
3.2. Impact of the Irrigation Regime on the Growth, Water Status, and Production of Potato

Potato plants are very sensitive to soil moisture stress because of their shallow root systems, low root length density, and the fact that they extract most of their water requirements from the upper 30 cm of the soil [7,9]. Therefore, proper irrigation water management is highly necessary to avoid deficit water stress in potato plants, making it very important that the response of potato crops to different irrigation regimes is known with a high level of accuracy. Camargo et al. [79] reported that potato crops growing in Aguas Nuevas, Spain, exhibited the highest biomass accumulation when irrigated with 80–100% ETc and achieved a comparable TTY when irrigated with 80%, 100%, and 120% ETc. Similarly, Foti et al. [80] found that there was no significant difference in the TTY of potato plants irrigated with 100% and 66% ETc, while irrigation with 133% ETc gave the highest TTY. However, several other studies have reported a significant reduction in the dry matter accumulation and TTY of potato crops with a reduction in the amount of irrigation water applied [81,82,83,84], and Cantore et al. [85] reported that 50% of the full irrigation treatment and rain-fed conditions decreased the TTY by 25.9% and 63.6%, respectively, compared with the full irrigation treatment.
In the present study, the 75% and 50% ETc regimes reduced BFW by 24.0% and 48.0%, BDW by 6.5% and 17.9%, BWC by 4.2% and 10.4%, and TTY by 7.5% and 36.8%, respectively, compared with the 100% ETc regime (Figure 7). Thus, it appears that monitoring the growth and water status of potato plants under deficit irrigation regimes could help growers to make better decisions about irrigation scheduling to manage deficit irrigation and enhance crop productivity, particularly under arid and semiarid conditions and in soil with a low water retention capacity as was used in the present study (sandy loam soil with 69.8% sand). As can be seen, the 75% ETc regime resulted in a similar BDW and BWC of the potato plants and only decreased the TTY by 7.5% compared with the 100% ETc regime, despite there being a 25% saving of irrigation water (Figure 7). However, increasing the deficit irrigation stress by irrigating with 50% ETc significantly reduced all of the measured plant traits in both varieties (Figure 5). This may be because increasing deficit irrigation stress, particularly during sensitive growth stages, significantly reduces the plant water status which, in turn, reduces the elongation and expansion of plant cells and photosynthesis efficiency and induces rapid leaf senescence [79,86]. All of these negative phenomena eventually result in a significant reduction in dry matter accumulation and final tuber yield.
Previous studies have reported that the optimum water requirements for achieving a high TTY in potato crops varies from 350 to 800 mm [15,18,87]. However, Ferreira and Carr [88] reported that the potato variety Desirée required 150–550 mm of irrigation water when growing under hot and dry climate conditions, while El-Abedin et al. [16] showed that the water requirement of potato reached 1505 mm in Saudi Arabia, which is a typical example of an arid country. In the present study, the optimum water requirements for achieving the highest TTY were 592.0 and 606 mm in the first and second growing seasons, respectively. Thus, it is clear that the water requirement for potato crops to reach the target yield can vary greatly depending on several factors, including the irrigation regime, irrigation method, climatic conditions, soil characteristics, and other management and environmental factors. This wide range of water requirements for potato crops between studies further confirms the importance of irrigation water management for enhancing crop productivity under deficit irrigation stress.

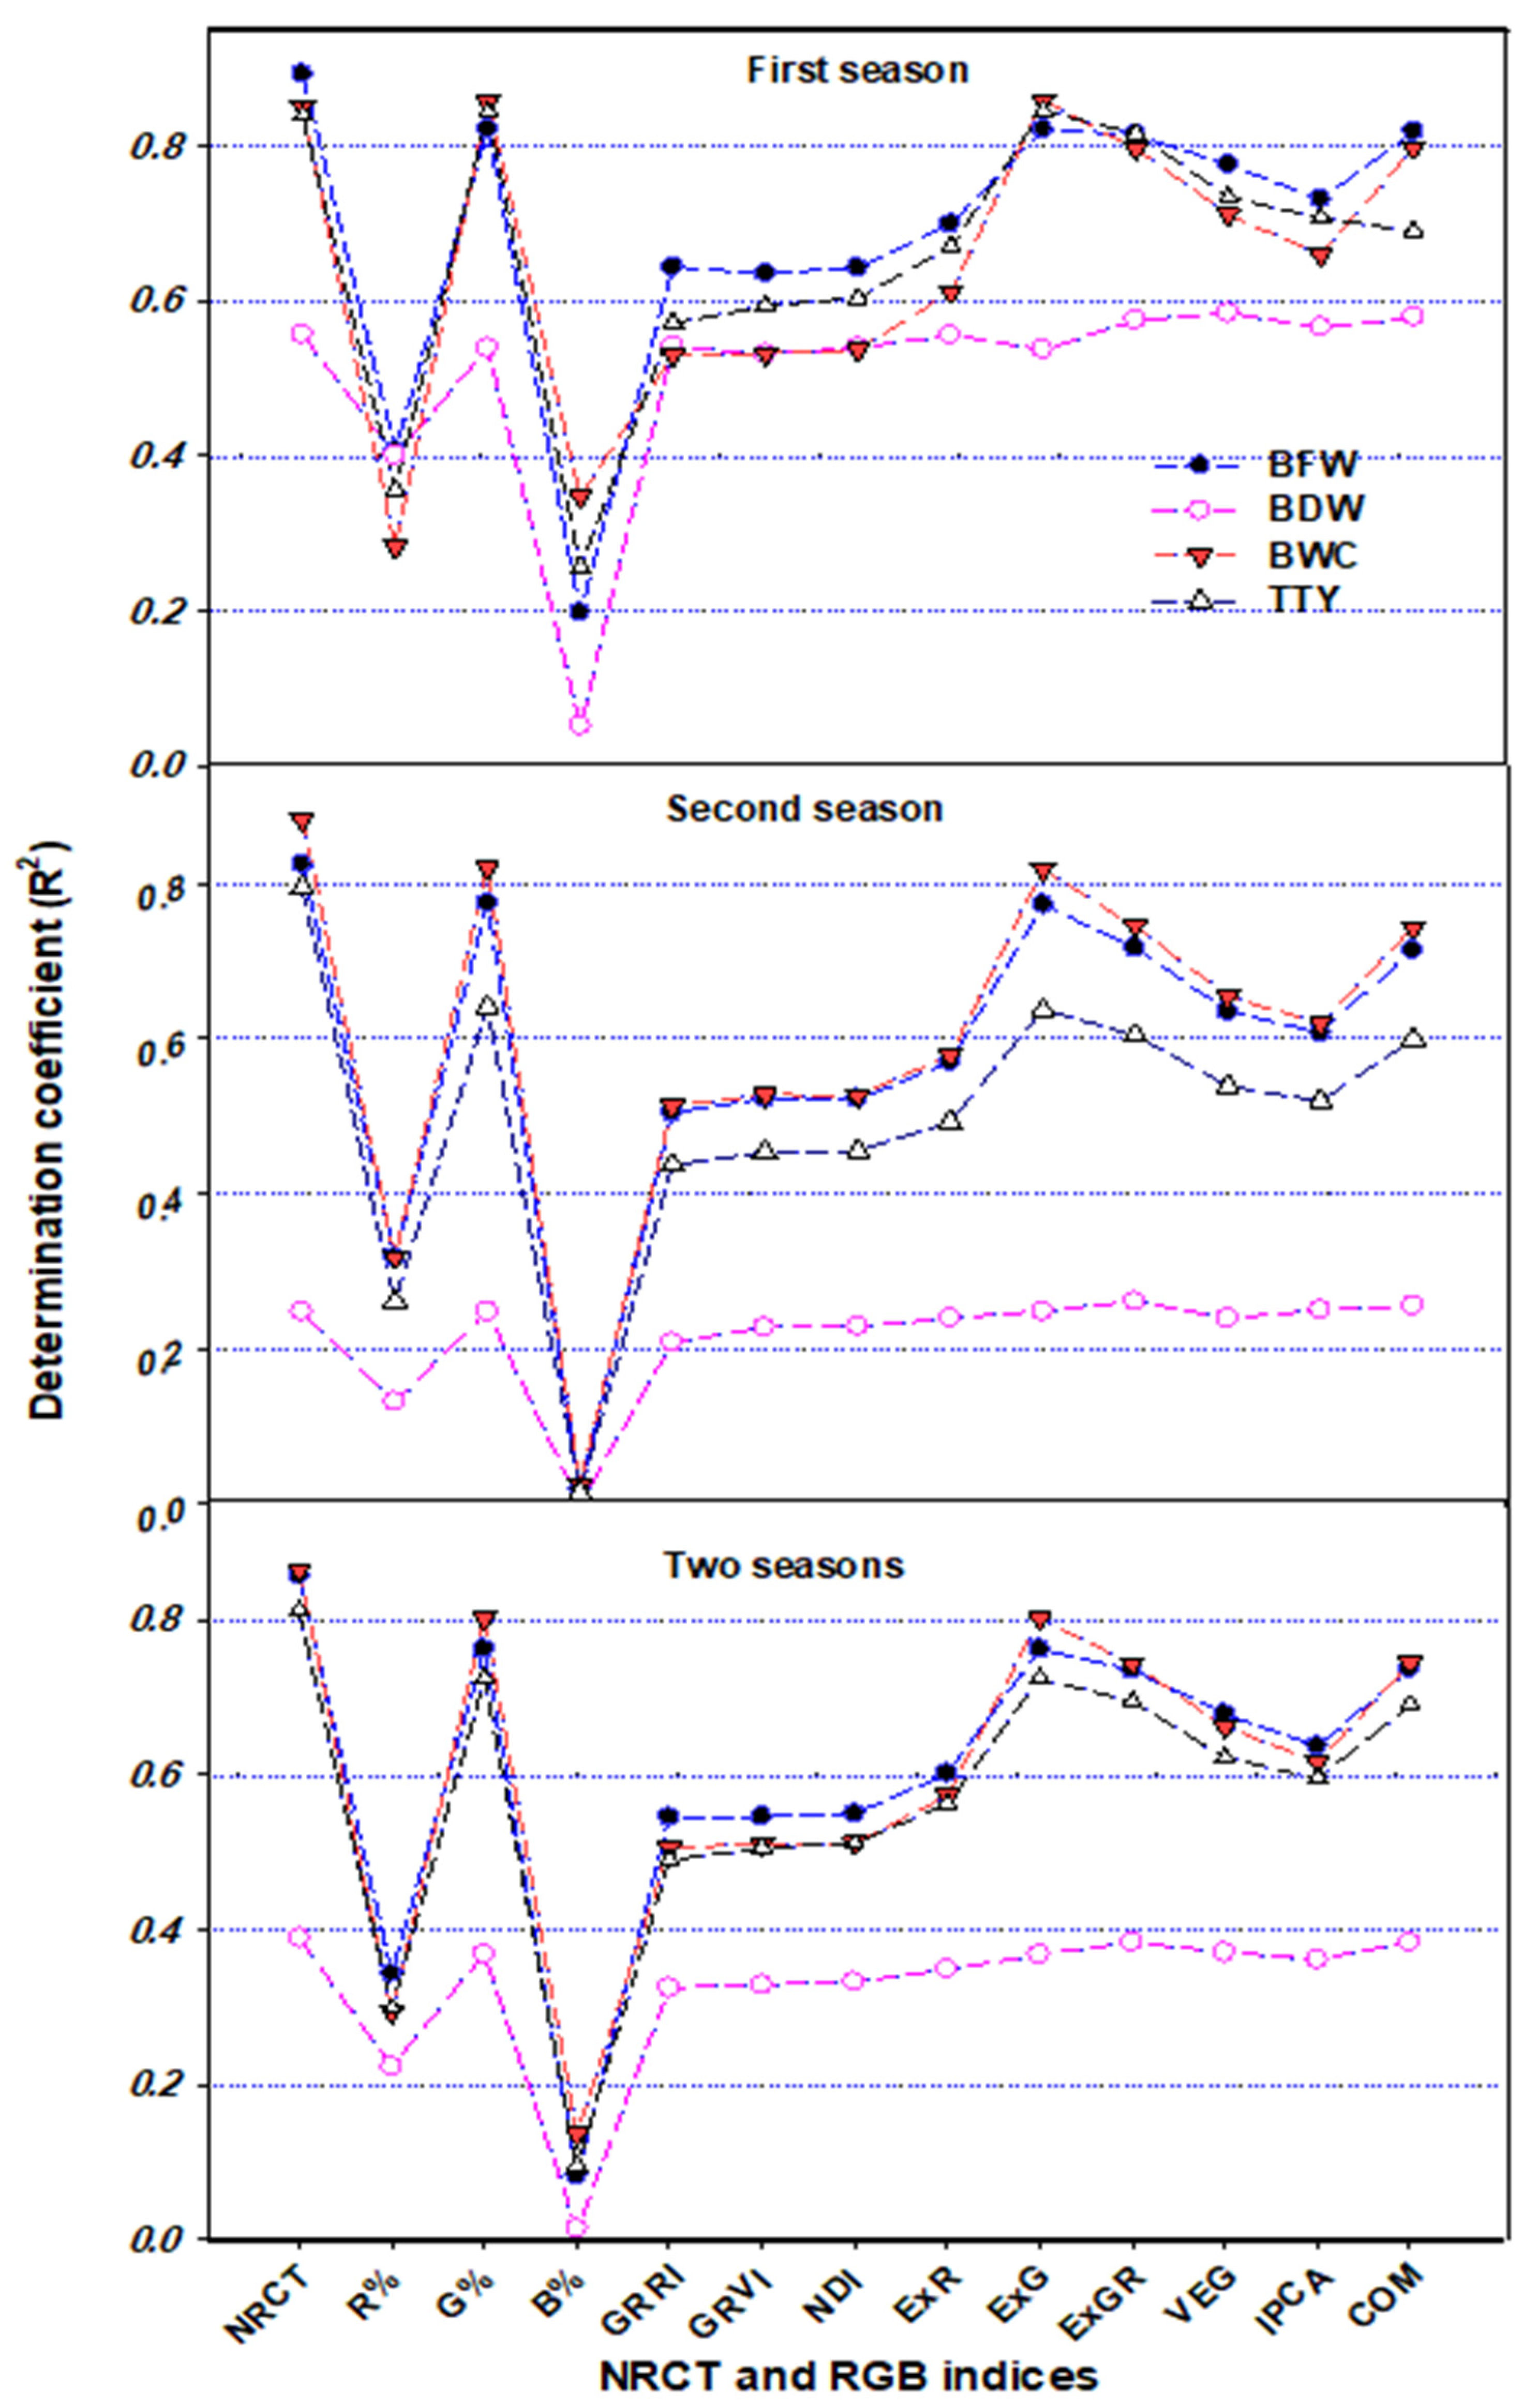
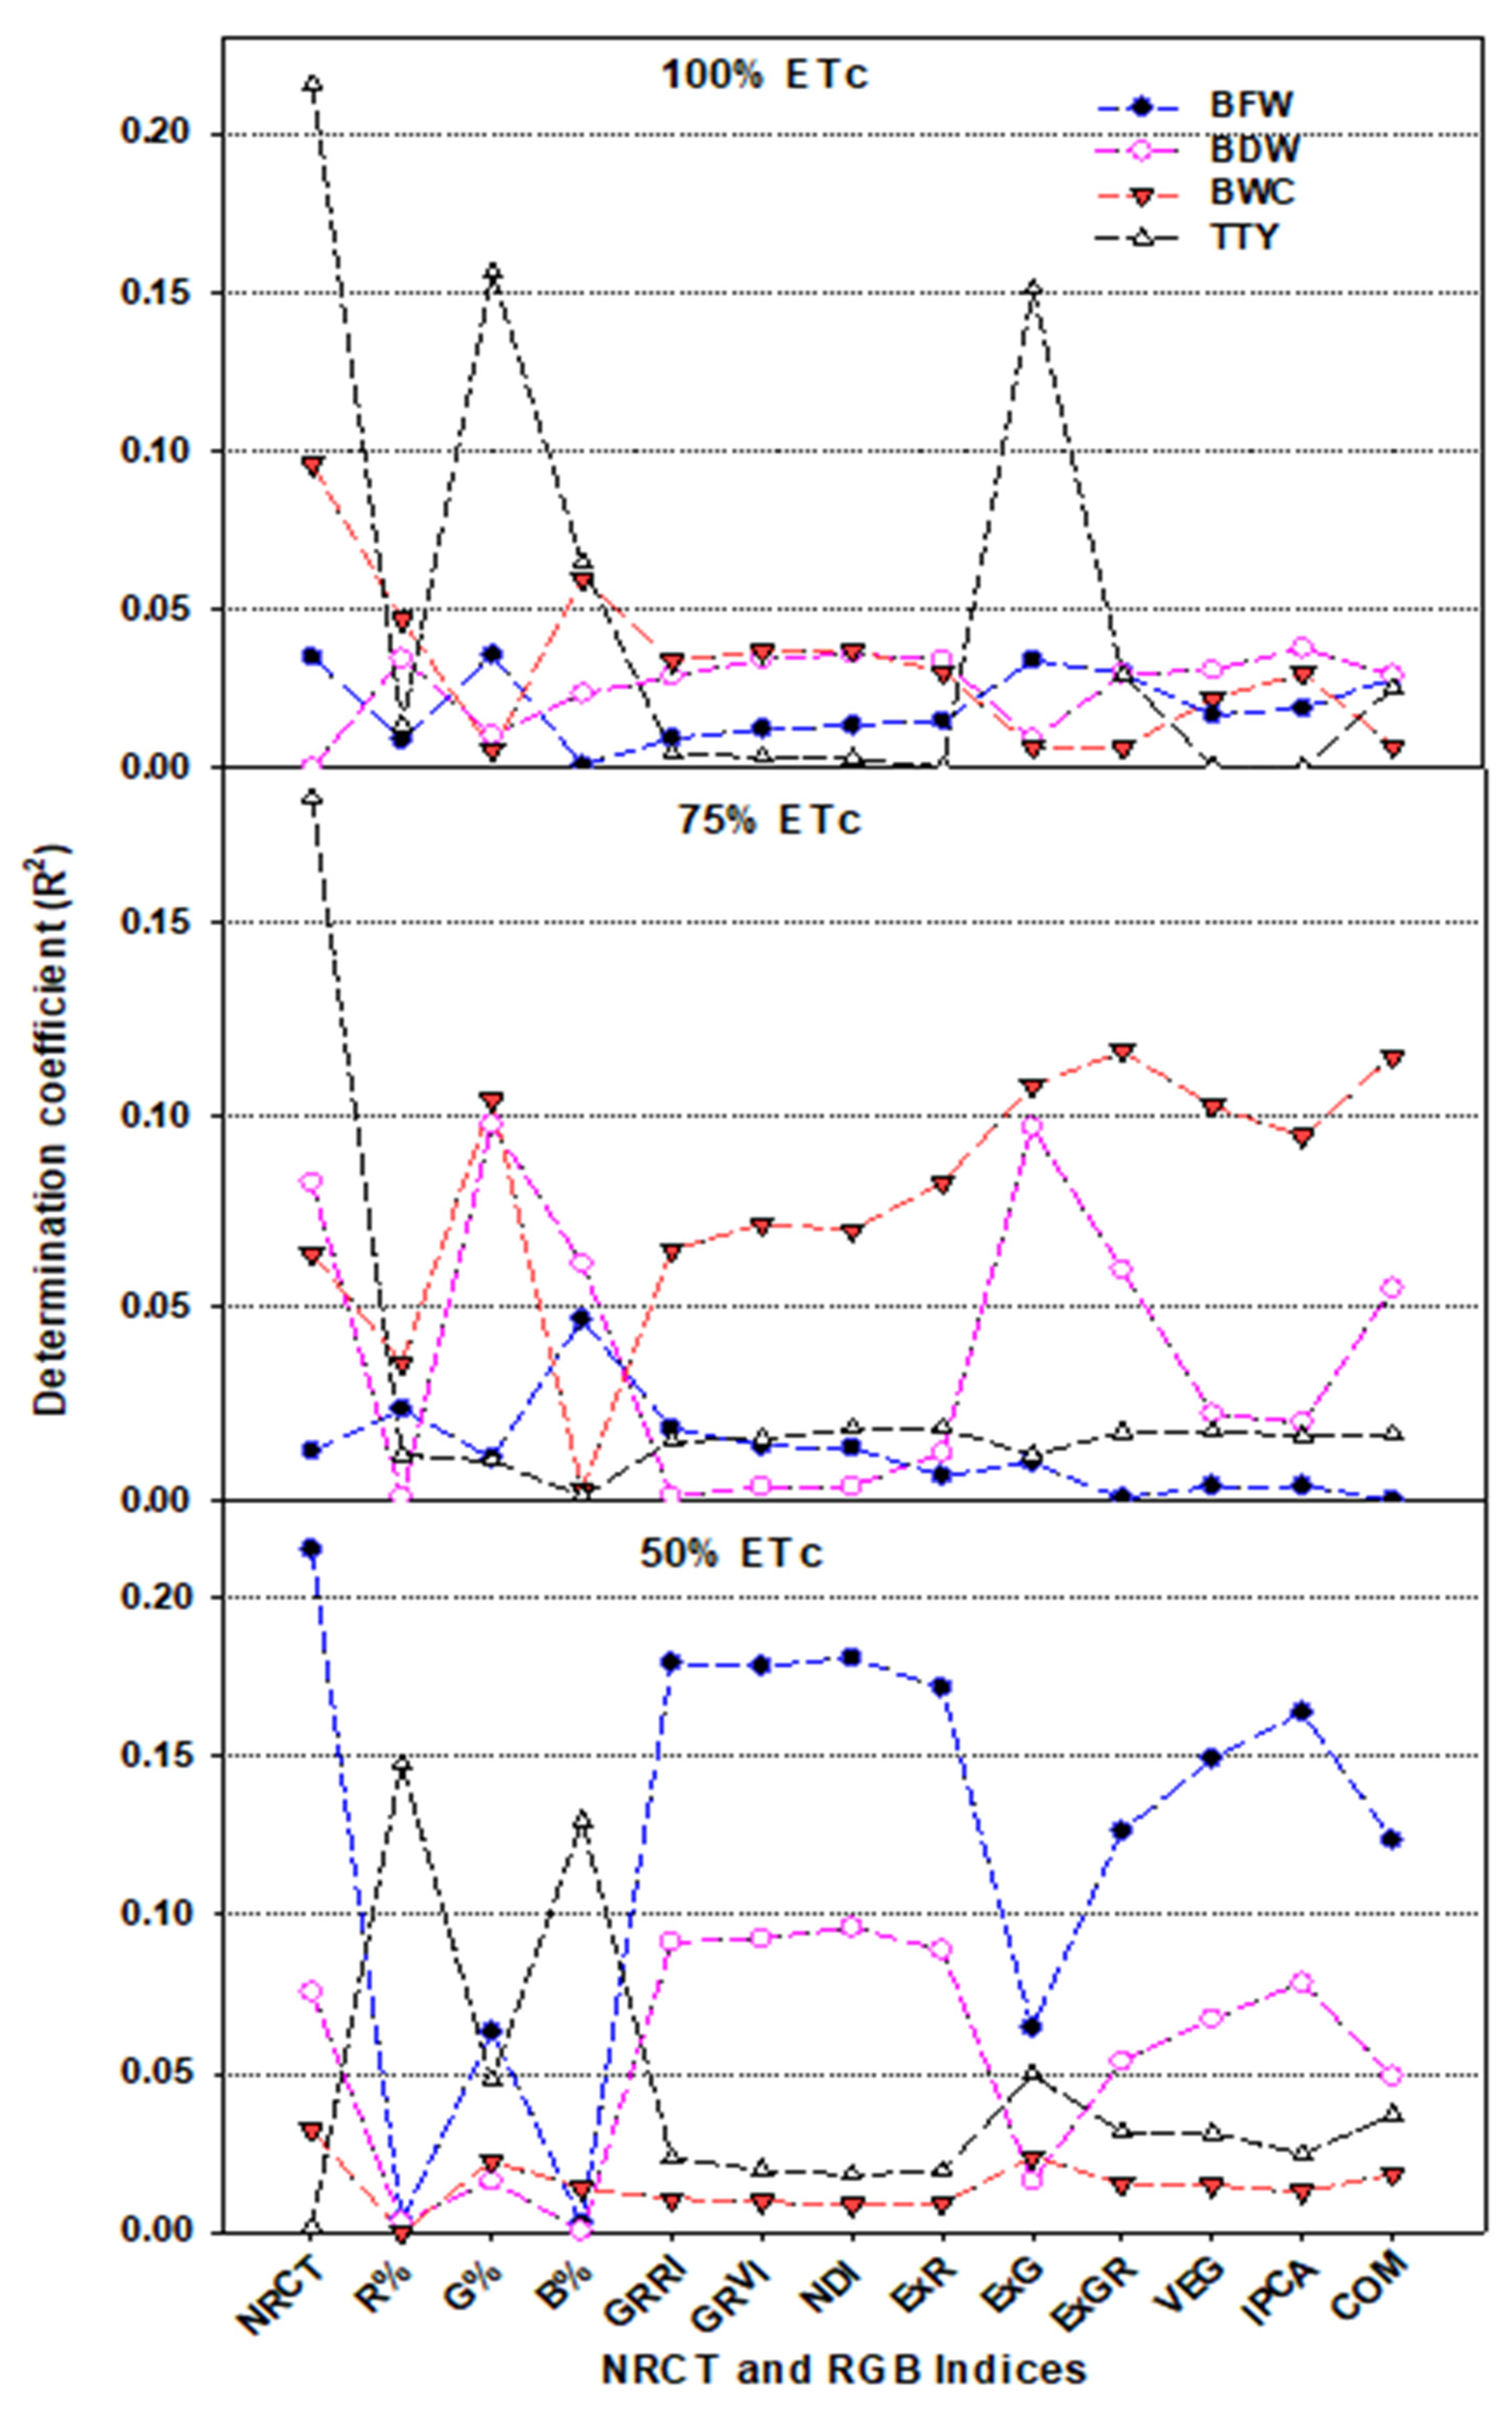
3.3. Performance of Remote Sensing Indices for Assessing the Measured Plant Traits

Several morpho-physiological plant traits are closely associated with available soil water, so their accurate detection could help determine irrigation thresholds and suitable scheduling, and play an important role in improving irrigation water management and saving irrigation water. For instance, Board and Kahlon [89] reported that the levels of soil moisture stress that cause significant reductions in the seed yield of soybean crops can be predicted through indirect assessment of the total dry matter accumulation in the early growth stage. Thus, the simultaneous and regular assessment of such plant traits using quick, simple, and non-destructive tools could play a vital role in saving irrigation water while achieving the target yield through the proper management of deficit irrigation, as explained in the following sections.

3.3.1. Performance of Thermal Index

Stomatal conductance plays an important role in regulating the plant water status and balance, particularly under deficit irrigation stress. Therefore, the first response of most plants to deficit water stress is closure of the stomata to decrease the amount of water lost through transpiration. However, stomatal closure also reduces the growth rate, cell elongation and expansion, and photosynthesis and transpiration rates of plants, which ultimately leads to a substantial reduction in the biomass and final yield [32,90]. Since the transpiration rate is strongly related to plant cooling, stomatal closure for an extended period under deficit water stress leads to a considerable increase in the canopy temperature [29,30,32]. Therefore, a thermal imaging tool that measures changes in the canopy temperature non-invasively by detecting radiation in the infrared region (800–1300 nm) could be successfully used to monitor the growth and water status of plants under different irrigation regimes in a quick, easy, and non-destructive manner. Previous studies have proposed that indices based on the thermal canopy temperature should be used to exploit thermal imaging data for detecting plant traits. In particular, NRCT, which is based on the actual infrared temperature of the plant canopy, has been found to be a useful indicator for water stress monitoring in a range of crops, such as wheat, barley, and soybean, under arid and semiarid conditions [23,33,36].
In the present study, NRCT gradually increased with a decreasing amount of irrigation water (Table 2). Averaged over both seasons and varieties, NRCT was approximately 2.4 and 1.4 times higher under the 50% ETc regime than under the 100% and 75% ETc regimes, respectively, and approximately 1.8 times higher under the 75% ETc regime than under the 100% ETc regime (Table 2). Similarly, previous studies have found that a reduction in the amount of irrigation water applied increases NRCT values in wheat [36] and soybean [23] crops. These findings reflect the fact that the canopy temperature is closely associated with the balance between the amounts of water absorbed by the plant and lost via transpiration. Importantly, if deficit water stress causes the stomata to remain closed for an extended period to inhibit excessive water losses via transpiration, this will not only increase the temperature of the canopy but also effectively reduce the photosynthesis rate and nutrient uptake, ultimately leading to a substantial reduction in plant growth and productivity [32,91]. However, keeping the stomata closed under water deficit stress also allows the plant to avoid dehydration and enhances its water status [92,93]. This close relationship between soil moisture stress and stomata closure combined with the integrated response of several plant properties (e.g., canopy temperature, plant growth, and plant water status) to stomata closure suggest that thermal indices could be effectively used as rapid and non-destructive indirect indicators for the management of deficit irrigation by monitoring the response of different plant properties to soil moisture stress.
To test this hypothesis, the relationships between the thermal index NRCT and various plant traits related to plant growth, water status, and production were evaluated for each potato variety across the three irrigation regimes, for each irrigation regime across the both varieties, and for the pooled data across both varieties, all three irrigation regimes, and both seasons (Figure 8, Figure 9 and Figure 10). These relationships showed that NRCT was strongly related to BFW, BWC, and TTY (R2 = 0.79–0.92) and moderately related to BDW (R2 = 0.25–0.56) when the data for the three irrigation regimes were combined for each variety and when the data for both varieties and all three irrigation regimes were combined (Figure 8 and Figure 9) but was unrelated to BFW, BDW, and BWC (R2 < 0.1) and only weakly related to TTY (R2 ≥ 0.20) when the data for the two varieties were combined for each irrigation regime (Figure 10). These findings indicate that caution is required when thermal indices are used to monitor plant growth and water status under different irrigation regimes across different varieties. This may be because the mechanism of transpirational cooling of the canopy and the ability of the roots to uptake water may differ between varieties under different irrigation regimes, so combining NRCT data across varieties may blur the effectiveness of this index in tracking changes in the traits related to plant growth and water status under different irrigation regimes.

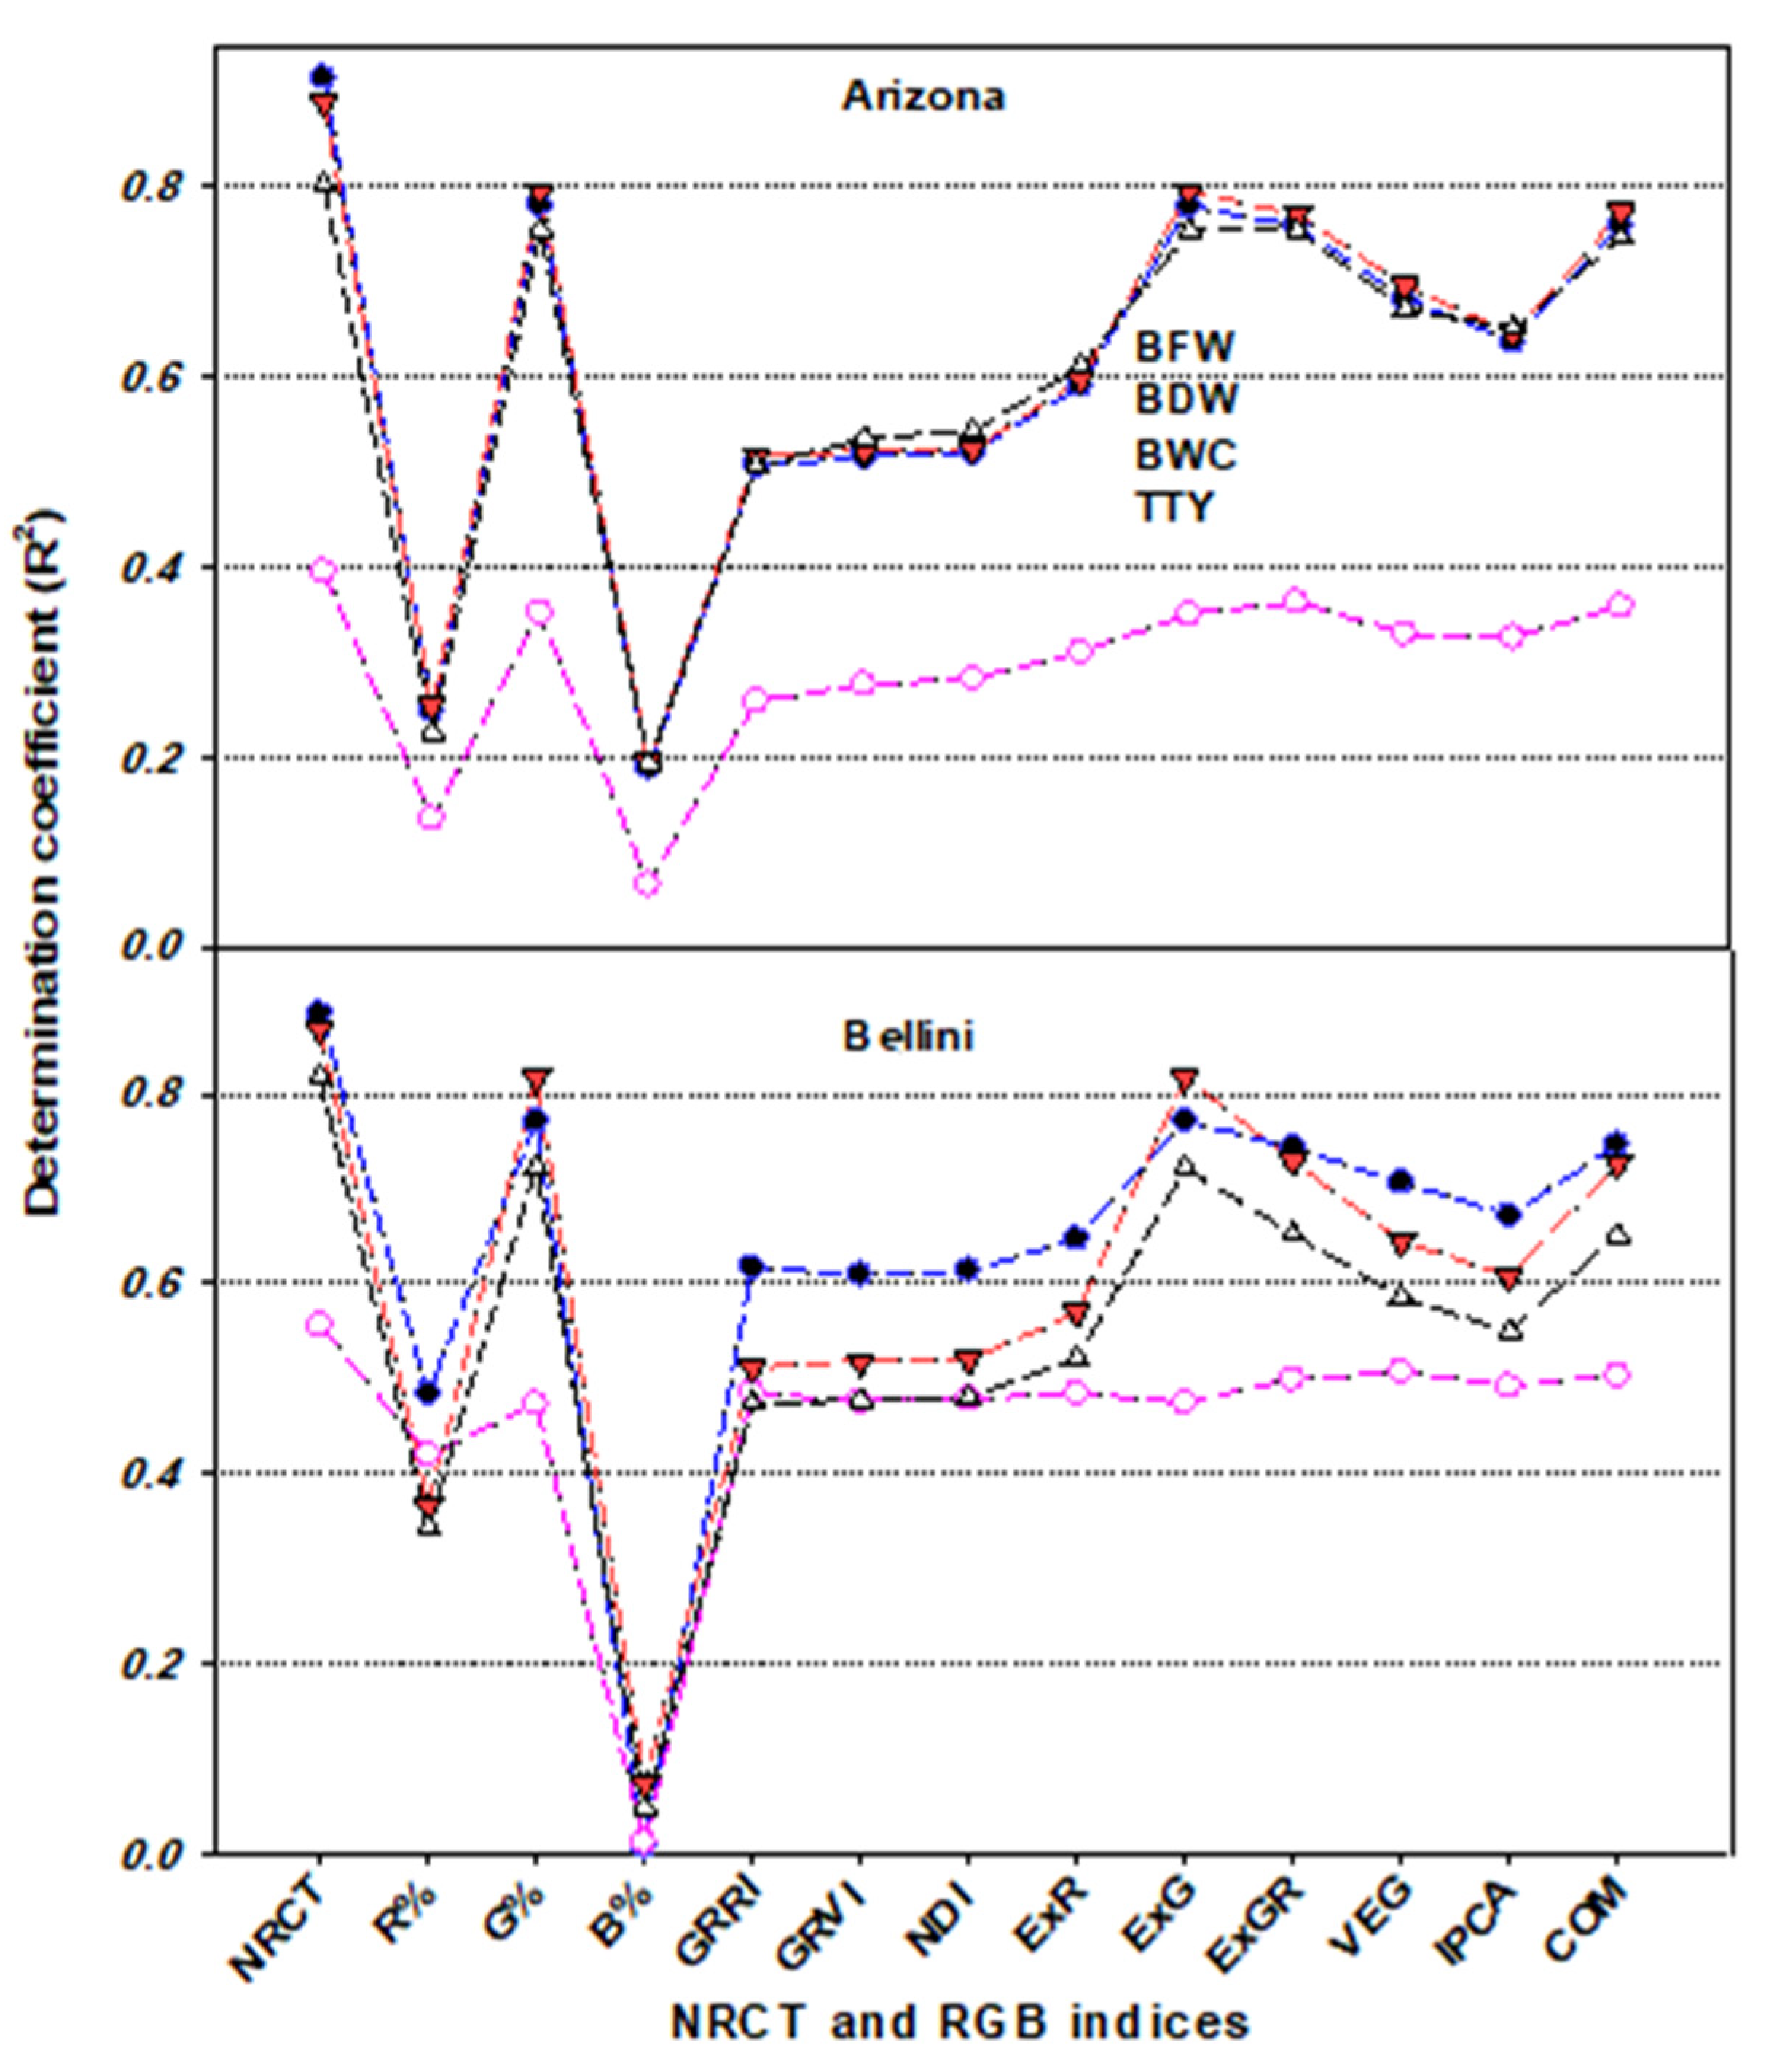
3.3.2. Performance of the RGB Indices

The values of the RGB channels [i.e., the red (R), green (G), and blue (B) band percentages] showed significant variation between the three irrigation regimes for each variety, with the exception of the B% for the Arizona variety. In general, the values of R% and B% increased as the amount of irrigation water applied decreased, while the opposite was true for G% (Table 2). This result indicates that the different irrigation water regimes had a noticeable effect on the color features of the potato crop, highlighting the feasibility of using RGB as a viable and economical monitoring tool for managing deficit irrigation. These color changes can be attributed to the fact that the exposure of plants to water deficit causes noticeable alternations in several anatomical and biophysical plant properties, such as stomatal conductance, guard cell chloroplasts, leaf pigment concentrations, leaf photosynthesis, and leaf water status, which eventually induce substantial changes in their responses to visible light. For instance, the activity of guard cell chloroplasts has been shown to be sensitive to both blue and red light [94,95], and several studies have reported a close relationship between plant water status and the light spectrum in the visible region (400–700 nm) [40,96,97]. In addition, Schlemmer et al. [96] found an inverse linear relationship between the relative water content (RWC) and the blue and red spectral region, while Carter [97] reported that RWC is sensitive to the blue and red visible region centered at 480–690 nm. Thus, it appears that the three channels of visible light (RGB) could be effectively used to monitor several plant traits relating to growth and water status.
In the present study, investigation of the relationship between four plant traits and the R, G, and B percentages showed that the G band was superior to the R and B bands for estimating plant traits, exhibiting strong relationships with BFW, CWC, and TTY (R2 ≥ 0.75) and a weak to moderate relationship with BDW (R2 ≥ 0.35) when analyzed for each variety across all three irrigation regimes (Figure 8), and for each season across varieties and irrigation regimes as well as for the pooled data (Figure 9). However, these three bands failed to exhibit a relationship with any of the plant traits when the data for the two varieties were combined for each irrigation regime (Figure 10). These findings indicate that leaf color was responsive to water deficit stress mostly in the G band, suggesting that this image band could be useful for reflecting the growth, water content, and production status of different varieties of potato crops. Several previous studies on potato have similarly reported a trend for increased leaf greenness under water deficit stress conditions and have indicated the usefulness of this trait as an important indicator of drought tolerance in potato [98,99,100]. Fleisher et al. [98] also reported that leaf growth of potato crops is reduced by the same amount under short-term and long-term water deficit stress, which could explain the stability of the greenness trait as an indicator of drought tolerance under different water deficit stress scenarios, as well as the failure of the three bands to assess the four plant traits when the data were analyzed for each irrigation regime (Figure 10). However, the stability of leaf greenness under deficit water stress may be genotype-dependent, which could also explain why the G band was effective for assessing the measured plant traits when the data were analyzed for each variety (Figure 9).
Indices based on RGB bands could also be used to assess plant growth and water status, as well as crop production [101,102,103]. In the present study, the various RGB indices obtained by the digital camera showed significant differences between the three irrigation regimes, with significantly lower values under deficit irrigation (50% ETc) than under full irrigation (100% ETc) (Table 2). In addition, the majority of the RGB indices obtained exhibited a moderate to strong relationship with BFW, CWC, and TTY and a moderate relationship with BDW when the data were analyzed for each season across varieties and irrigation regimes (Figure 9), under all conditions combined (Figure 9), and for each variety across all three irrigation regimes (Figure 8). However, all of the indices failed to exhibit a relationship with any of the plant traits when the data for the two varieties were combined for each irrigation regime (Figure 10). These findings may partly be explained by the different canopy structure, canopy architecture, and leaf angle distribution of the two potato varieties examined, which resulted in different image-derived indices being calculated. However, these differences did not result in any differences in the response of these varieties to the different irrigation regimes in terms of growth or water content, which may explain why there were strong relationships between the measured plant traits and most of the RGB imagery indices for both varieties and across the entire dataset, whereas no such relationships existed for each irrigation regime.
Together, these results show that the RGB imagery indices provided information on the growth, water, and production statuses of the two potato varieties. Similarly, Marín et al. [103] found that the majority of digital camera vegetation indices significantly varied between different turfgrass mixtures growing under different irrigation water regimes, highlighting the value of these indices as a tool for identifying genotypic variation under different growing conditions. In addition, other studies have reported that the vegetation indices obtained from RGB images can provide important information for assessing the performance of different plant traits related to the growth, water content, and production statuses under different growing conditions and that these are somewhat superior to spectral reflectance indices for this purpose [42,101,104,105].

3.4. Integration of the Thermal and RGB Imagery Indices for the Assessment of the Measured Plant Traits Using Stepwise Multiple Linear Regression Models

The sensitivities of thermal and RGB imagery indices for estimating plant traits may be affected by several factors, such as the growth stage, growth conditions, plant characteristics, soil background conditions, and irrigation regime, making it difficult to generalize about which is best for a range of conditions–for instance, some indices may be highly sensitive to one plant trait and less sensitive to another. Therefore, in the present study, all of the thermal and RGB imagery indices were included as independent variables in SMLR models to identify which indices explained the most variability in each of the measured plant traits across all conditions (i.e., varieties, irrigation regimes, and seasons). The results showed that NRCT in combination with COM, NRCT together with the R, G, and B band percentages, NRCT alone, and VEG alone explained most of the variation in BFW (89%), BWC (92%), TTY (84%), and BDW (47%), respectively (Table 3). It is also interesting to note that the SMLR models based on the most influential indices showed the best prediction of BFW (R2val = 0.84), BWC (R2val = 0.89), and TTY (R2val = 0.73) but failed to predict BDW (Table 4). This result indicates that SMLR models can also be used to estimate plant traits and that the resulting estimates are better than those obtained from most individual digital camera vegetation indices (see Figure 8, Figure 9 and Figure 10). Furthermore, it is clear that the SMLR models have sufficient predicitivity, particularly for traits related to plant water status and production. This may be because SMLR models are always constructed based on the most influential variables. Similarly, Yue et al. [106] also reported that a new comprehensive growth index estimation model, which combined six plant traits (plant height, aboveground biomass, leaf area index, plant water content, plant chlorophyll content, and plant nitrogen content) and was constructed by SMLR, was better than a model based on a single spectral reflectance index (SRI) or a single RGB imagery index. In general, multivariate regression analyses, which include PLSR, SMLR, support vector machine regression (SVMR), ridge regression, random forest, and ANNs, have yielded better prediction models than SRIs for various plant traits in a range of crops and growing conditions [24,107,108,109].

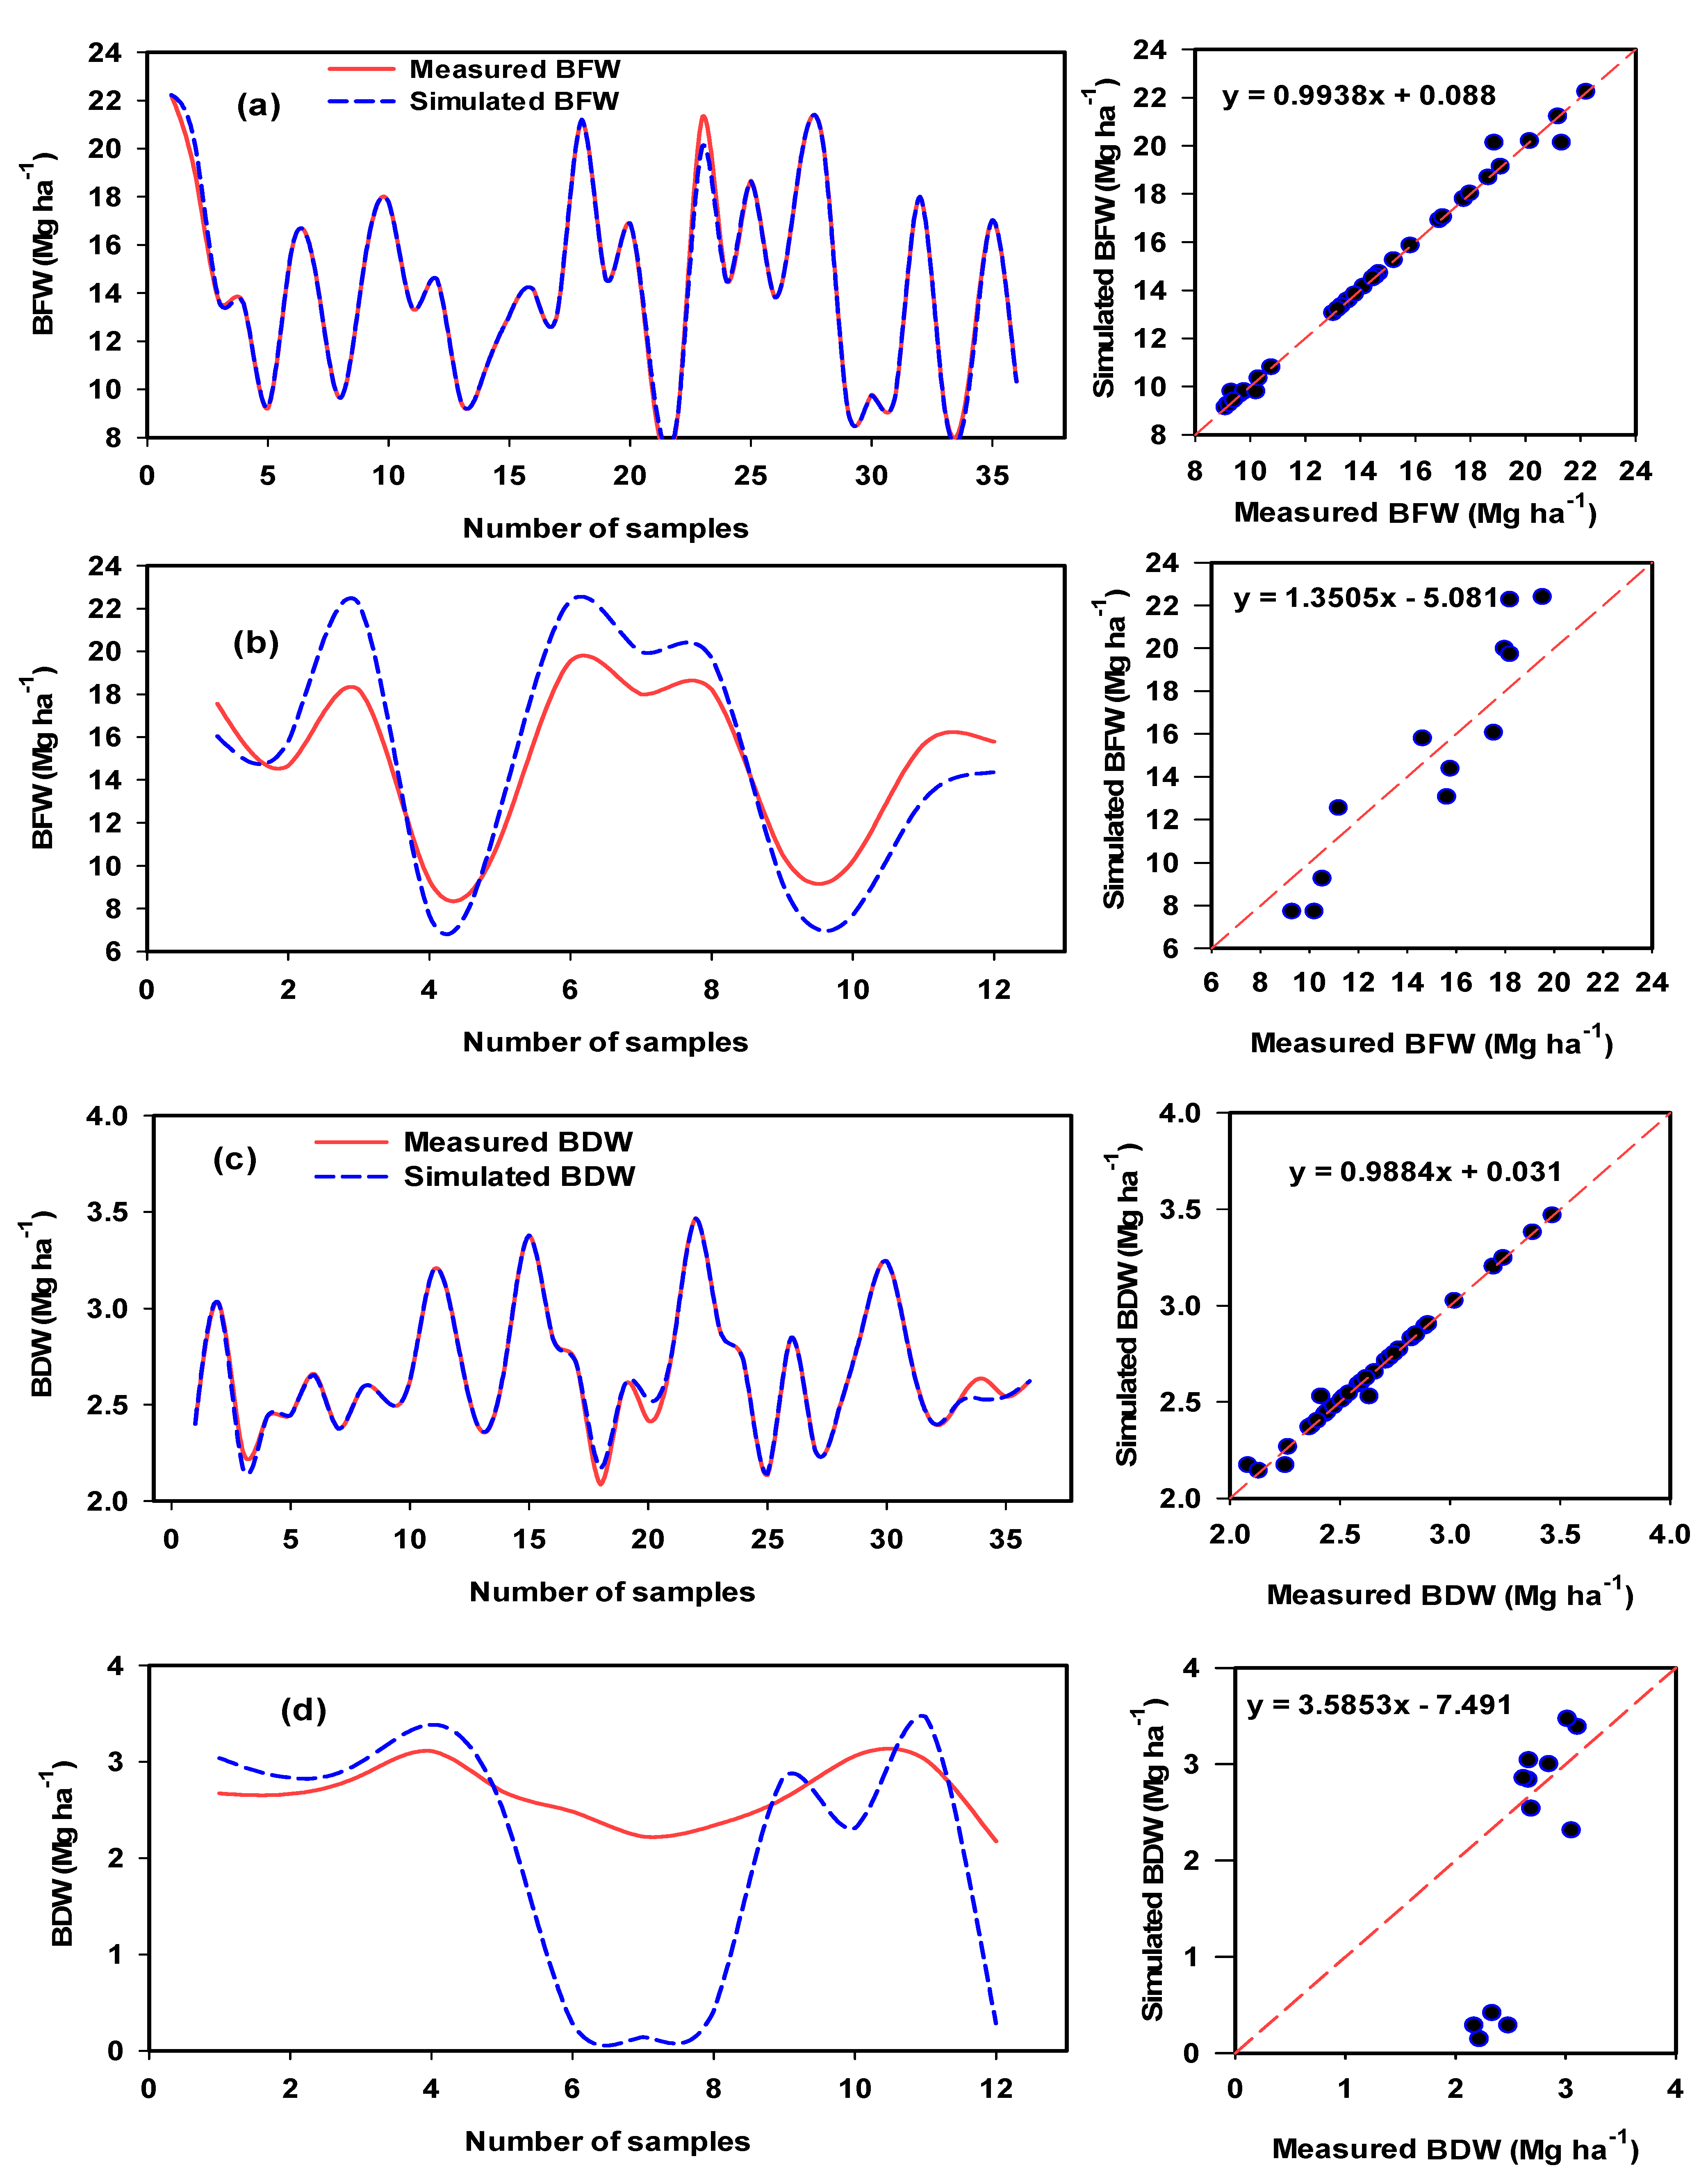
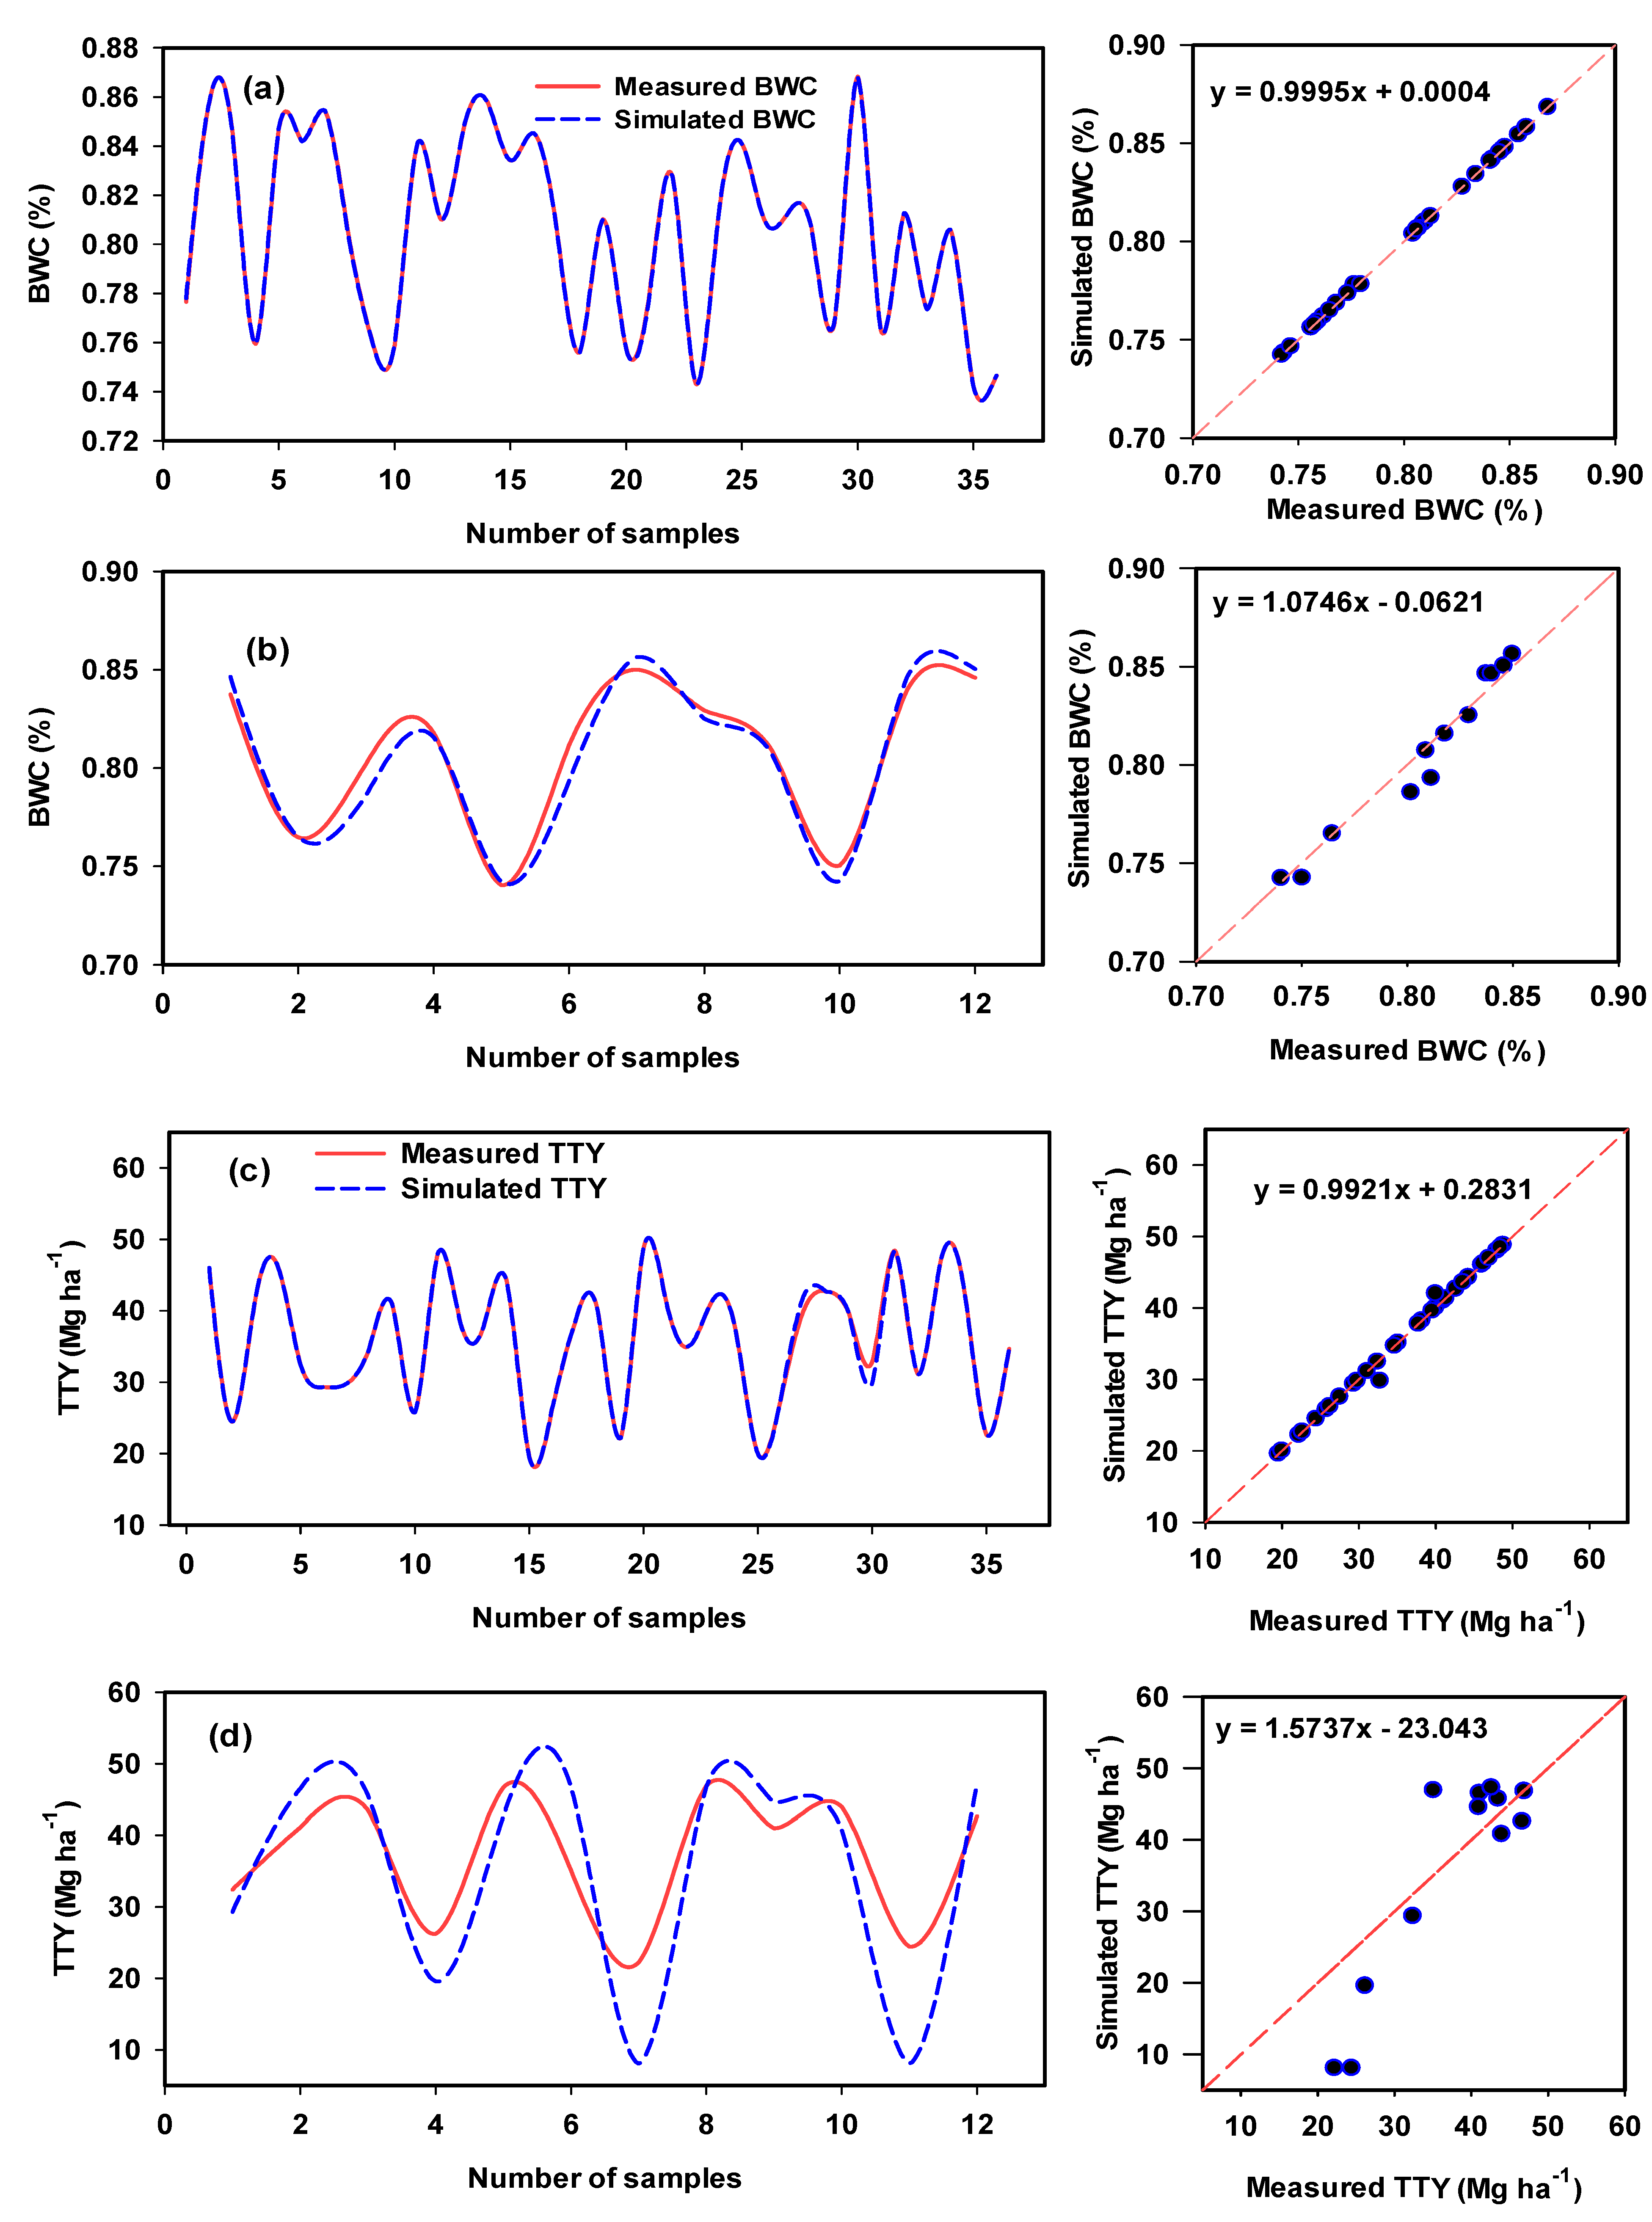
3.5. Performance of ANFIS-GA Models Based on All Thermal and RGB Imagery Indices for Predicting the Measured Plant Traits

ANFIS is already recognized as a prospective research field of great potential due to its ease of implementation and easy formulation. ANFIS models combine the transparent and linguistic representation of a fuzzy system with the learning ability of an ANN, allowing them to be trained to perform input/output mapping in the same way that an ANN can but with the added advantage of being able to provide the model’s rules, which offers greater insight into the modeling process [110,111].
Data-driven modeling has commonly been used to estimate and predict various crop traits, and ANN and SVMR have been used to predict the plant water status, growth, and chlorophyll, nitrogen, phosphorus, and potassium contents [104,112]. However, the integration of various approaches, such as GA, ANN, and FIS, for estimating plant traits based on a combination of thermal and RGB imagery indices has not previously been tested.
In the present study, all 13 thermal and RGB imagery indices were used as inputs for training the ANFIS-GA model to allow the accurate estimation of the measured plant traits. The main purpose of using GA was to find the RMSE value for each output. Once the best performing ANFIS model had been selected through training, the expected values of the chosen output could be determined and compared with the actual observed values. The results showed that the ANFIS-GA models obtained from the thermal and digital imaging data could be used to predict all four measured potato traits, and the use of ANFIS-GA increased the accuracy of the estimates of these parameters (Table 5 and Figure 11 and Figure 12) compared with the use of the NRCT and RGB imagery indices (Figure 8, Figure 9 and Figure 10).
The performance of the proposed ANFIS-GA model was very high based on the calculated performance criteria, which included R2 (0.99–1.00), RMSE (0–0.66), MAD (0–0.25), and E (0.99–1.00) (Table 5), indicating the accurate results of this model. It is also interesting to note that the ANFIS-GA model showed the best testing for BFW (R2 = 0.88), BDW (R2 = 0.71), BWC (R2 = 1.00), and TTY (R2 = 0.80). The ANFIS-GA model exhibited a very small drop in the quality of the performance measures (R2, RMSE, MAD, and E) when moving from the training stage to the testing stage in the case of
BWC also had an appropriate performance for BFW, BDW, and TTY. However, there was a significant drop in performance for BDW in terms of E, which became negative in the testing stage (Table 5).

4. Conclusions

Thermal and RGB imaging indices were combined with multivariate and data-driven modeling in this study in an attempt to non-destructively estimate the growth, water status, and yield of potato crops exposed to different drip irrigation regimes. The results supported the hypothesis that thermal and RGB imaging indices can be considered as an alternative approach to efficient management of deficit irrigation and maximizing the water productivity through indirect assessment of different plant traits in a rapid, easy, and cost effective manner. However, the efficiency of these indices for estimating the plant traits of potato crops depended on whether the data were analyzed specifically for each variety and irrigation regime or were combined across all conditions. Specifically, the thermal index and most of the RGB imagery indices were strongly to moderately related to the measured plant traits when the data were analyzed for each variety across irrigation regimes or for both varieties and all three irrigation regimes combined, but failed to assess the plant traits for each irrigation regime across the two varieties. The results also indicate that the combination of thermal and RGB imagery indices with the ANFIS-GA model can predict the measured plant traits more accurately. This model provided an accurate prediction of the measured plant traits in both the training and testing models (R2 = 0.71–1.00). In conclusion, the results of this study provide critical insights into the importance of continuously monitoring the growth, water status, and production of potato crops under deficit irrigation regimes using the simple and low-cost approaches of thermal and/or RGB imaging. This type of study has rarely been conducted in irrigated arid and semiarid areas, so the information obtained will be important for supporting the on-going efforts to use drones carrying thermal and RGB devices for undertaking precision agriculture irrigation practices and improving water use efficiency in regions with water scarcity.

Supplementary Materials

The following are available online at https://0-www-mdpi-com.brum.beds.ac.uk/article/10.3390/rs13091679/s1. Figure S1. Thermal images for (a) 100%, (b) 75% and (c) 50% ETc treatments. Supplementary File S1. The pseudo-code that was used to train each algorithm to extract the RGB color space.

Author Contributions

Conceptualization, S.E., O.E., W.D. and S.E.-H.; methodology, M.K., W.D., S.E. and S.E.-H.; software, M.K., M.A., N.A.-S., M.U.T. and S.E.-H.; validation, S.E.-H., S.E., M.K., W.D., O.E. and N.A.-S.; formal analysis, S.E.-H., M.K., S.E., O.E., M.A., W.D. and M.U.T.; investigation, S.E.-H., S.E., M.K. and W.D.; resources, S.E.-H., S.E., M.A. and N.A.-S.; data curation, S.E.-H., W.D., S.E. and M.K.; writing—original draft preparation, S.E.-H., S.E. and M.K.; writing—review and editing, S.E.-H.; visualization, S.E., M.K., S.E.-H. and W.D.; supervision, S.E-H. and S.E.; project administration, S.E. and S.E.-H; funding acquisition, S.E.-H., M.A. and N.A.-S. All authors have read and agreed to the published version of the manuscript.

Funding

This research was funded by Deanship of Scientific Research at the King Saud University, Saudi Arabia, grant number RG-1435-032.

Institutional Review Board Statement

Not applicable.

Informed Consent Statement

Not applicable.

Data Availability Statement

The data presented in this study are fully available in this article and Supplementary File S1.

Acknowledgments

The authors extend their appreciation to the Deanship of Scientific Research at the King Saud University, Saudi Arabia for funding this work through Research Group No. (RG-1435-032), and the Researchers Support & Services Unit (RSSU) for their technical support.

Conflicts of Interest

The authors declare no conflict of interest.

References

  1. Perry, C.; Steduto, P.; Allen, R.G.; Burt, C.M. Increasing productivity in irrigated agriculture: Agronomic constraints and hydrological realities. Agric. Water Manag. 2009, 96, 1517–1524. [Google Scholar] [CrossRef] [Green Version]
  2. FAOSTAT. FAO Statistics Division: Quebec City, QC, Canada, October 2017. Available online: http://www.fao.org/faostat/en/#data/QC (accessed on 15 March 2021).
  3. FAOSTAT. Food and Agriculture Organization of the United Nations Statistics Database. 2020. Available online: http://www.fao.org/faostat/en/#data/QC (accessed on 21 June 2020).
  4. Fereres, F.; Soriano, M.A. Deficit irrigation for reducing agricultural water use. J. Exp. Bot. 2007, 58, 147–159. [Google Scholar] [CrossRef] [Green Version]
  5. El-Hendawy, S.; Hassan, W.; Al-Suhaibani, N.; Schmidhalter, U. Spectral assessment of drought toleranceindices and grain yield in advanced spring wheat lines grown under full and limited water irrigation. Agric. Water Manag. 2017, 182, 1–12. [Google Scholar] [CrossRef]
  6. Vreugdenhil, D.; Bradshaw, J.; Gebhardt, C.; Govers, F.; Mackerron, D.K.L.; Taylor, M.A.; Ross, H.A. Potato Biology and Biotechnology: Advances and Perspectives; Elsevier: Oxford, UK, 2011. [Google Scholar]
  7. Ahmadi, S.H.; Plauborg, F.; Andersen, M.N.; Sepaskhah, A.R.; Jensen, C.R.; Hansen, S. Effects of irrigation strategies and soils on field grown potatoes: Root distribution. Agric. Water Manag. 2011, 98, 1280–1290. [Google Scholar] [CrossRef]
  8. Matovic, G.; Brocic, Z.; Djuricin, S.; Gregoric, E.; Bodroza, D. Profitability assessment of potato production applying different irrigation methods. Irrig. Drain. 2016, 65, 502–513. [Google Scholar] [CrossRef] [Green Version]
  9. Ierna, A.; Mauromicale, G. Potato growth, yield and water productivity response todifferent irrigation and fertilization regimes. Agric. Water Manag. 2018, 201, 21–26. [Google Scholar] [CrossRef]
  10. Soltys-Kalina, D.; Plich, J.; Strzelczyk-Żyta, D.; Sliwka, J.; Marczewski, W. The effect of drought stress on the leaf relative water content and tuber yield of a half-sib family of ‘Katahdin’-derived potato cultivars. Breed. Sci. 2016, 66, 328–331. [Google Scholar] [CrossRef] [Green Version]
  11. Romero, A.P.; Alarcon, A.; Galeano, C. Physiological assessment of water stress in potato using spectral information. Front. Plant Sci. 2017, 8, 1608. [Google Scholar] [CrossRef] [PubMed]
  12. Shock, C.C.; Pereira, A.B.; Eldredge, E.P. Irrigation best management practices for potato. Am. J. Potato Res. 2007, 84, 29–37. [Google Scholar] [CrossRef]
  13. Brocic, Z.; Jovanovic, Z.; Stikic, R.; Radovic, B.V.; Mojevic, M. Partial root drying: New approach for potato irrigation. Cereal Res. Commun. 2009, 37, 229–232. [Google Scholar]
  14. Byrd, S.A.; Rowland, D.L.; Bennett, J.; Zotarelli, L.; Wright, D.; Alva, A.; Nordgaard, J. Reductions in a commercial potato irrigation schedule during tuberbulking in Florida: Physiological, yield, and quality effects. J. Crop Improv. 2014, 28, 660–679. [Google Scholar] [CrossRef]
  15. Karam, F.; Amacha, N.; Fahed, S.; El Asmar, T.; Domínguez, A. Response of potato to full and deficit irrigation under semiaridclimate: Agronomic and economic implications. Agric. Water Manag. 2014, 142, 144–151. [Google Scholar] [CrossRef]
  16. El-Abedin, T.K.Z.; Mattar, M.A.; Alazba, A.A.; Al-Ghobari, H.M. Comparative effects of two water-saving irrigation techniqueson soil water status, yield, and water use efficiency in potato. Sci. Hortic. 2017, 225, 525–532. [Google Scholar] [CrossRef]
  17. Wang, X.; Guo, T.; Wang, Y.; Xing, Y.; Wang, Y.; He, X. Exploring the optimization of water and fertilizer management practices forpotato production in the sandy loam soils of Northwest China based on PCA. Agric. Water Manag. 2020, 237, 106180. [Google Scholar] [CrossRef]
  18. Djaman, K.; Irmak, S.; Koudahe, K.; Allen, S. Irrigation management in potato (Solanum tuberosum L.) production: A review. Sustainability 2021, 13, 1504. [Google Scholar] [CrossRef]
  19. Gutierrez, M.; Reynolds, M.P.; Klatt, A.R. Association of Water spectral indices with plant and soil water relations in contrasting wheat genotypes. J. Exp. Bot. 2010, 61, 3291–3303. [Google Scholar] [CrossRef] [Green Version]
  20. Wang, B.; Liu, D.L.; Asseng, S.; Macadam, I.; Yu, Q. Impact of Climate Change on Wheat Flowering Time in Eastern Australia. Agric. For. Meteorol. 2015, 209, 11–21. [Google Scholar] [CrossRef]
  21. El-Hendawy, S.E.; Al-Suhaibani, N.; Dewir, Y.H.; El-Sayed, S.; Alotaibi, M.; Hassan, W.M.; Refay, Y.; Tahir, M.U. Ability of modified spectral reflectance indices for estimating growth and photosynthetic efficiency of wheat under saline field conditions. Agronomy 2019, 9, 35. [Google Scholar] [CrossRef] [Green Version]
  22. Zhang, F.; Zhou, G. Estimation of vegetation water content using hyperspectral vegetation indices: A comparison of crop water indicators in response to water stress treatments for summer maize. BMC Ecol. 2019, 19, 18. [Google Scholar] [CrossRef] [PubMed] [Green Version]
  23. Elmetwalli, A.H.; El-Hendawy, S.E.; Al-Suhaibani, N.; Alotaibi, M.; Tahir, M.U.; Mubushar, M.; Hassan, W.M.; Elsayed, S. Potential of hyperspectral and thermal proximal sensing for estimating growth performance and yield of soybean exposed to different drip irrigation regimes under arid conditions. Sensors 2020, 20, 6569. [Google Scholar] [CrossRef]
  24. Garriga, M.; Romero-Bravo, S.; Estrada, F.; Méndez-Espinoza, A.M.; González-Martínez, L.; Matus, I.A.; Castillo, D.; Lobos, G.A.; Del Pozo, A. Estimating carbon isotope discrimination and grain yield of bread wheat grown under water-limited and full irrigation conditions by hyperspectral canopy reflectance and multilinear regression analysis. Int. J. Remote Sens. 2021, 42, 2848–2871. [Google Scholar] [CrossRef]
  25. Jackson, R.D.; Idso, S.B.; Reginato, R.J.; Pinter, P.J., Jr. Canopy temperature as acrop water stress indicator. Water Resour. Res. 1981, 17, 1133–1138. [Google Scholar] [CrossRef]
  26. Dejonge, K.C.; Taghvaeian, S.; Trout, T.J.; Comas, L.H. Comparison of canopy temperature-based water stress indices for maize. Agric. Water Manag. 2015, 156, 51–62. [Google Scholar] [CrossRef]
  27. Masseroni, D.; Addin, J.; Tyrrell, R.; Mareels, I.; Gandolfi, C.; Facchi, A. Towards a smart automated surface irrigation management in rice-growing areas in Italy. Agric. Eng. 2017, 48, 42–48. [Google Scholar] [CrossRef] [Green Version]
  28. Medrano, H.; Escalona, J.M.; Bota, J.; Gulías, J.; Flexas, J. Regulation of photosynthesis of C3 plants in response to progressive drought: Stomatal conductance as a reference parameter. Ann. Bot. 2002, 89, 895–905. [Google Scholar] [CrossRef]
  29. Hura, T.; Hura, K.; Grzesiak, M.; Rzepka, A. Effect of long-term drought stress on leaf gas exchange and fluorescence parameters in C3 and C4 plants. Acta Physiol. Plant. 2007, 29, 103–113. [Google Scholar] [CrossRef]
  30. Jones, H.G. Application of thermal imaging and infrared sensing in plant physiology and eco-physiology. In Advances in Botanical Research; Academic Press: Cambridge, MA, USA, 2004; pp. 107–163. [Google Scholar]
  31. Lapidot, O.; Ignat, T.; Rud, R.; Rog, I.; Alchanati, V.; Klein, T. Use of thermal imaging to detect evaporative cooling in coniferous and broadleaved tree species of the Mediterranean maquis. Agric. For. Meteorol. 2019, 271, 285–294. [Google Scholar] [CrossRef]
  32. Pirasteh-Anosheh, H.; Saed-Moucheshi, A.; Pakniyat, H.; Pessarakli, M. Stomatal responses to drought stress. In Water Stress and Crop Plants: A Sustainable Approach, 1st ed.; Ahmad, P., Ed.; John Wiley & Sons, Ltd.: Hoboken, NJ, USA, 2016; Volume 1. [Google Scholar]
  33. Elsayed, S.; Rischbeck, P.; Schmidhalter, U. Comparing the performance of active and passive reflectance sensors to assess the normalized relative canopy temperature and grain yield of drought-stressed barley cultivars. Field Crops Res. 2015, 177, 148–160. [Google Scholar] [CrossRef]
  34. Irmak, S.; Haman, D.Z.; Bastug, R. Determination of crop water stress index for irrigation timing and yield estimation of corn. Agron. J. 2002, 92, 1221–1227. [Google Scholar] [CrossRef]
  35. O’Shaughnessy, S.A.; Evett, S.R.; Colaizzi, P.D.; Howell, T.A. Using radiation thermography and thermometry to evaluate crop water stress in soybean and cotton. Agric. Water Manag. 2011, 98, 1523–1535. [Google Scholar] [CrossRef]
  36. Elsayed, S.; Elhoweity, M.; Ibrahim, H.H.; Dewir, Y.H.; Migdadic, H.M.; Schmidhalter, U. Thermal imaging and passive reflectance sensing to estimate the water status and grain yield of wheat under different irrigation regimes. Agric. Water Manag. 2017, 189, 98–110. [Google Scholar] [CrossRef]
  37. Sakamoto, T.; Gitelson, A.A.; Nguyrobertson, A.L.; Arkebauer, T.J.; Wardlow, B.D. An alternative method using digital cameras for continuous monitoring of crop status. Agric. For. Meteorol. 2012, 154, 113–126. [Google Scholar] [CrossRef] [Green Version]
  38. Wang, W.; Yao, X.; Yao, X.F.; Tian, Y.C.; Liu, X.J.; Ni, J.; Cao, W.X.; Zhu, Y. Estimating leaf nitrogen concentration with three-band vegetation indices in rice and wheat. Field Crop. Res. 2012, 129, 90–98. [Google Scholar] [CrossRef]
  39. Sulistyo, S.B.; Woo, W.L.; Dlay, S.S. Regularized neural networks fusion and genetic algorithm based on-field nitrogen status estimation of wheat plants. IEEE Trans. Ind. Inform. 2017, 13, 103–114. [Google Scholar] [CrossRef] [Green Version]
  40. Wenting, H.; Yu, S.; Tengfei, X.; Xiangwei, C.; Ooi, S.K. Detecting maize leaf water status by using digital RGB images. Int. J. Agr. Biol. Eng. 2014, 7, 45–53. [Google Scholar]
  41. Petrozza, A.; Santaniello, A.; Summerer, S.; Di Tommaso, G.; Di Tommaso, D.; Paparelli, E.; Piaggesic, A.; Peratab, P.; Cellini, F. Physiological responses to Megafol treatments in tomato plants under drought stress: A phenomic and molecular approach. Sci. Hortic. 2014, 174, 185–192. [Google Scholar] [CrossRef]
  42. Elsayed, S.; Barmeier, G.; Schmidhalter, U. Passive reflectance sensing and digital image analysis allows for assessing the biomass and nitrogen status of wheat in early and late tillering stages. Front. Plant Sci. 2018, 9, 1478. [Google Scholar] [CrossRef] [PubMed]
  43. Paruelo, J.M.; Lauenroth, W.K.; Roset, P.A. Estimating aboveground plant biomass using a photographic technique. J. Range Manag. 2000, 53, 190–193. [Google Scholar] [CrossRef]
  44. Lee, J.K.; Lee, W.B. Estimation of rice growth and nitrogen nutrition status using color digital camera image analysis. Eur. J. Agron. 2013, 48, 57–65. [Google Scholar] [CrossRef]
  45. Kipp, S.; Mistele, B.; Baresel, P.; Schmidhalter, U. High-throughput phenotyping early plant vigour of winter wheat. Eur. J. Agron. 2014, 52, 271–278. [Google Scholar] [CrossRef]
  46. Baresel, J.P.; Rischbeck, P.; Hu, Y.; Kipp, S.; Hu, Y.; Barmeier, G.; Mistele, B.; Schmidhalter, U. Use of a digital camera as alternative method for non-destructive detection of the leaf chlorophyll content and the nitrogen nutrition status in wheat. Comput. Electron. Agric. 2017, 140, 25–33. [Google Scholar] [CrossRef]
  47. Li, B.; Xu, X.; Zhang, L.; Han, J.; Bian, C.; Li, G.; Liu, J.; Jin, L. Above-ground biomass estimation and yield prediction in potato by using UAV-based RGB and hyperspectral imaging. ISPRS J. Photogramm. Remote Sens. 2020, 162, 161–172. [Google Scholar] [CrossRef]
  48. Arakawa, M.; Yamashita, Y.; Funatsu, K. Genetic algorithm-based wavelength selection method for spectral calibration. J. Chemom. 2011, 25, 10–19. [Google Scholar] [CrossRef]
  49. Yao, X.; Huang, Y.; Shang, G.; Zhou, C.; Cheng, T.; Tian, Y.; Cao, W.; Zhu, Y. Evaluation of six algorithms to monitor wheat leaf nitrogen concentration. Remote Sens. 2015, 7, 14939–14966. [Google Scholar] [CrossRef] [Green Version]
  50. Zheng, H.; Li, W.; Jiang, J.; Liu, Y.; Cheng, T.; Tian, Y.; Zhu, Y.; Cao, W.; Zhang, Y.; Yao, X. A Comparative assessment of different modeling algorithms for estimating leaf nitrogen content in winter wheat using multispectral images from an unmanned aerial vehicle. Remote Sens. 2018, 10, 2026. [Google Scholar] [CrossRef] [Green Version]
  51. Coast, O.; Shah, S.; Ivakov, A.; Gaju, O.; Wilson, P.B.; Posch, B.C.; Callum, J.B.; Negrini, A.C.A.; Evans, J.R.; Condon, A.G.; et al. Predicting dark respiration rates of wheat leaves from hyperspectral reflectance. Plant Cell Environ. 2019, 42, 2133–2150. [Google Scholar] [CrossRef] [Green Version]
  52. Khademi, F.; Akbari, M.; Jamal, S.M.; Nikoo, M. Multiple linear regression, artificial neural network, and fuzzy logic prediction of 28 days compressive strength of concrete. Front. Struct. Civ. Eng. 2017, 11, 90–99. [Google Scholar] [CrossRef]
  53. Bui, D.T.; Bui, Q.T.; Nguyen, Q.P.; Pradhan, B.; Nampak, H.; Trinh, P.T. A hybrid artificial intelligence approach using GIS-based neural-fuzzy inference system and particle swarm optimization for forest firesusceptibility modeling at a tropical area. Agric. For. Meteorol. 2017, 233, 32–44. [Google Scholar]
  54. Bui, Q.T.; Pham, M.V.; Nguyen, Q.H.; Nguyen, L.X.; Pham, H.M. Whale optimization algorithm and adaptive neuro-fuzzy inference system: A hybrid method for feature selection and land pattern classification. Int. J. Remote Sens. 2019, 40, 5078–5093. [Google Scholar] [CrossRef]
  55. Jang, J.S.R. ANFIS: Adaptive network-based fuzzy inference system. IEEE Trans. Syst. Man Cybern. 1993, 23, 665–685. [Google Scholar] [CrossRef]
  56. Chau, K. A review on integration of artificial intelligence into water quality modelling. Mar. Pollut. Bull. 2006, 52, 726–733. [Google Scholar] [CrossRef] [Green Version]
  57. Kodogiannis, V.S.; Lolis, A. Forecasting financial time series using neural network and fuzzy System based techniques. Neural Comput. Appl. 2002, 11, 90–102. [Google Scholar] [CrossRef]
  58. Sheta, A.; Turabieh, H. A comparison between genetic algorithms and sequential quadratic programming in solving constrained optimization problems. ICGST Int. J. Artif. Intell. Mach. Learn. 2006, 6, 67–74. [Google Scholar]
  59. Smith, M. CROPWATA Computer Program for Irrigation Planning and Management; Irrigation and Drainage Paper No. 46; FAO: Rome, Italy, 1992; 125p. [Google Scholar]
  60. Allen, R.G.; Pereira, L.S.; Raes, D.; Smith, M. Crop Evapotranspiration Guidelines for Computing Crop Water Requirements; Irrigation and Drainage Paper 56; FAO: Rome, Italy, 1998. [Google Scholar]
  61. Gonzalez-Dugo, M.P.; Moran, M.S.; Mateos, L.; Bryant, R. Canopy temperature variability as an indicator of crop water stress severity. Irrig. Sci. 2006, 24, 233–240. [Google Scholar] [CrossRef]
  62. Fauzi, J.F.; Tolle, H.; Dewi, R.K. Implementasi metode RGB To HSV pada aplikasi pengenalan mata uang kertas berbasis Android untuk tuna netra. J. Pengemb. Teknol. Inf. Ilmu Komput. 2018, 2, 2319–2325. [Google Scholar]
  63. Yossya, E.H.; Pranata, J.; Wijaya, T.; Hermawan, H.; Budiharto, W. Mango Fruit Sortation System using Neural Network and Computer Vision. Procedia Comput. Sci. 2017, 116, 569–603. [Google Scholar] [CrossRef]
  64. Kumaseh, M.R.; Luther, L.; Nainggolan, N. Segmentasi Citra Digital Ikan Menggunakan Metode Thresholding. J. Ilm. Sains 2013, 74–79. [Google Scholar] [CrossRef] [Green Version]
  65. Verrelst, J.; Schaepman, M.E.; Koetz, B.; Kneubuhler, M. Angular sensitivity analysis of vegetation indices derived from 726 CHRIS/PROBA data. Remote Sens. Environ. 2008, 112, 2341–2353. [Google Scholar] [CrossRef]
  66. Tucker, C.J. Red and photographic infrared linear combinations for monitoring vegetation. Remote Sens. Environ. 1979, 8, 127–150. [Google Scholar] [CrossRef] [Green Version]
  67. Woebbecke, D.; Meyer, G.; von Bargen, K.; Mortensen, D. Plant species identification, size, and enumeration using machine vision techniques on near-binary images. Int. Soc. Opt. Photonics 1993, 1836, 208–219. [Google Scholar]
  68. Mao, W.; Wang, Y.; Wang, Y. Real-time detection of between-row weeds using machine vision. In Proceedings of the ASAE Annual Meeting, Las Vegas, NV, USA, 27–30 July 2003; American Society of Agricultural and Biological Engineers: St. Joseph, MI, USA, 2003; p. 1. [Google Scholar]
  69. Hague, T.; Tillett, N.; Wheeler, H. Automated crop and weed monitoring in widely spaced cereals. Precis. Agric. 2006, 7, 21–32. [Google Scholar] [CrossRef]
  70. Saberioon, M.M.; Amin, M.S.M.; Anuar, A.R.; Gholizadeh, A.; Wayayok, A.; Khairunniza- Bejo, S. Assessment of rice leaf chlorophyll content using visible bands at different growth stages at both the leaf and canopy scale. Int. J. Appl. Earth Obs. Geoinf. 2014, 32, 35–45. [Google Scholar] [CrossRef]
  71. Guijarro, M.; Pajares, G.; Riomoros, I.; Herrera, P.J.; Burgos-Artizzu, X.P.; Ribeiro, A. Automatic segmentation of relevant textures in agricultural images. Comput. Electron. Agric. 2011, 75, 75–83. [Google Scholar] [CrossRef] [Green Version]
  72. Vasques, G.M.; Grunwald, S.; Sickman, J.O. Comparison of multivariate methods for inferential modeling of soil carbon using visible/near-infrared spectra. Geoderma 2008, 146, 14–25. [Google Scholar] [CrossRef]
  73. Prasad, K.; Gorai, A.K.; Goyal, P. Development of ANFIS models for air quality forecasting and input optimization for reducing the computational cost and time. Atmos. Environ. 2016, 128, 246–262. [Google Scholar] [CrossRef]
  74. Sahin, M.; Erol, R. A Comparative Study of Neural Networks and ANFIS for Forecasting Attendance Rate of Soccer Games. Math. Comput. Appl. 2017, 22, 43. [Google Scholar]
  75. Haznedar, B.; Kalinli, A. Training ANFIS using genetic algorithm for dynamic systems identification. Int. J. Intell. Syst. Appl. Eng. 2016, 4, 44–47. [Google Scholar] [CrossRef] [Green Version]
  76. Raj, R.; Mohan, B.M. Modeling and analysis of the simplest fuzzy PID controller of Takagi–Sugeno type with modified rule base. Soft Comput. 2018, 22, 5147–5161. [Google Scholar] [CrossRef]
  77. Khadr, M.; Gad, M.; El-Hendawy, S.; Al-Suhaibani, N.; Dewir, Y.H.; Tahir, M.U.; Mubushar, M.; Elsayed, S. The integration of multivariate statistical approaches, hyperspectral reflectance, and data-driven modeling for assessing the quality and suitability of groundwater for irrigation. Water 2021, 13, 35. [Google Scholar] [CrossRef]
  78. Eseye, A.T.; Lehtonen, M.; Tukia, T.; Uimonen, S.; Millar, R.J. Machine learning based integrated feature selection approach for improved electricity demand forecasting in decentralized energy systems. IEEE Access 2019, 7, 91463–91475. [Google Scholar] [CrossRef]
  79. Camargo, D.C.; Montoya, F.; Córcoles, J.I.; Ortega, J.F. Modeling the impacts of irrigation treatments on potato growth and development. Agric. Water Manag. 2015, 150, 119–128. [Google Scholar] [CrossRef]
  80. Foti, S.; Mauromicale, G.; Ierna, A. Influence of irrigation levels on growth and yield of potato cv. Spunta. Potato Res. 1995, 38, 307–318. [Google Scholar] [CrossRef]
  81. Kashyap, P.S.; Panda, R.K. Effect of irrigation scheduling on potato crop parameters under water stressed conditions. Agric. Water Manag. 2003, 59, 49–66. [Google Scholar] [CrossRef]
  82. Yuan, B.-Z.; Nishiyama, S.; Kang, Y. Effect different irrigation regimes on the growth and yield of drip-irrigated potato. Agric. Water Manag. 2003, 63, 153–167. [Google Scholar] [CrossRef]
  83. Lahlou, O.; Ledent, J.-F. Root mass and depth, stolons and roots formed on stolons in four cultivars of potato under water stress. Eur. J. Agron. 2005, 22, 159–173. [Google Scholar] [CrossRef]
  84. Fleisher, D.H.; Timlin, D.J.; Reddy, V.R. Elevated carbon dioxide and waterstress effects on potato canopy gas exchange, wateruse, and productivity. Agric. For. Meteorol. 2008, 148, 1109–1122. [Google Scholar] [CrossRef]
  85. Cantore, V.; Yamaç, S.S.; Albrizio, R.; Stellacci, A.M.; Todorovic, M. Yield and water use efficiency of early potato grown under different irrigation regimes. Int. J. Plant Prod. 2014, 8, 409–428. [Google Scholar]
  86. Deblonde, P.M.K.; Ledent, J.F. Effects of moderate drought conditions on green leaf number, stem height, leaf length and tuber yield of potato cultivars. Eur. J. Agron. 2001, 14, 31–41. [Google Scholar] [CrossRef]
  87. Fandika, I.R.; Kemp, P.D.; Millner, J.P.; Horne, D.; Roskruge, N. Irrigation and nitrogen effects on tuber yield and water use efficiency of heritage and modern potato cultivars. Agric. Water Manag. 2016, 170, 148–157. [Google Scholar] [CrossRef]
  88. Ferreira, T.C.; Carr, M.K.V. Responses of potatoes (Solanum tuberosum L.) to irrigation and nitrogen in a hot dry climate: I. Water use. Field Crops Res. 2002, 78, 51–64. [Google Scholar] [CrossRef]
  89. Board, J.; Kahlon, C.S. Soybean yield formation: What controls it and How it can be improved. In Soybean Physiology and Biochemistry; Louisiana State University Agricultural Center: Baton Rouge, LA, USA, 2011. [Google Scholar] [CrossRef] [Green Version]
  90. Rauf, S.; Al-Khayri, J.M.; Zaharieva, M.; Monneveux, P.; Khalil, F. Breeding strategies to enhance drought tolerance in crops. In Advances in Plant Breeding Strategies; Agronomic, Abiotic and Biotic Stress Traits; Al-Khayri, J.M., Jain, S.M., Johnson, D.V., Eds.; Springer: Berlin/Heidelberg, Germany, 2016; pp. 1–70. [Google Scholar]
  91. Anjum, S.A.; Xie, X.Y.; Wang, L.C.; Saleem, M.F.; Man, C.; Lei, W. Morphological, physiological and biochemical responses of plants to drought stress. Afr. J. Agric. Res. 2011, 6, 2026–2032. [Google Scholar]
  92. Osakabe, Y.; Osakabe, K.; Shinozaki, K.; Tran, L.S.P. Response of plants to water stress. Front. Plant Sci. 2014, 5, 1–8. [Google Scholar] [CrossRef] [Green Version]
  93. Clauw, P.; Coppens, F.; de Beuf, K.; Dhondt, S.; van Daele, T.; Maleux, K.; Inze, D. Leaf responses to mild drought stress in natural variants of Arabidopsis thaliana. Plant Physiol. 2015, 167, 800–816. [Google Scholar] [CrossRef] [Green Version]
  94. Olsen, R.L.; Pratt, B.P.; Gump, P.; Kemper, A.; Tallman, G. Red light activates a chloroplast-dependent ion uptake mechanism for stomatal opening under reduced CO2 concentrations in Vicia spp. New Phytol. 2002, 153, 497–508. [Google Scholar] [CrossRef] [Green Version]
  95. Zeiger, E.; Talbott, L.D.; Frechilla, S.; Srivastava, A.; Zhu, J. The guard cell chloroplast: A perspective for the twenty-first century. New Phytol. 2002, 153, 415–424. [Google Scholar] [CrossRef]
  96. Schlemmer, M.R.; Francis, D.D.; Shanahan, J.F.; Schepers, J.S. Remotely measuring chlorophyll content in corn leaves with differing nitrogen levels and relative water content. Agron. J. 2005, 97, 106–112. [Google Scholar] [CrossRef] [Green Version]
  97. Carter, G.A. Primary and secondary effects of the water content on the spectral reflectance of leaves. Am. J. Bot. 1991, 78, 916–924. [Google Scholar] [CrossRef]
  98. Fleisher, D.H.; Barnaby, J.; Sicher, R.; Resop, J.P.; Timlin, D.J.; Reddy, V.R. Effects of elevated CO2 and cyclic drought on potato under varying radiation regimes. Agric. For. Meteorol. 2013, 171, 270–280. [Google Scholar] [CrossRef]
  99. Rolando, J.L.; Ramírez, D.A.; Yactayo, W.; Monneveux, P.; Quiroz, R. Leaf greenness as a drought tolerance related trait in potato (Solanum tuberosum L.). Environ. Exp. Bot. 2015, 110, 27–35. [Google Scholar] [CrossRef]
  100. Ramírez, D.A.; Kreuze, J.; Amoros, W.; Valdivia-Silva, J.E.; Ranck, J.; Garcia, S.; Salas, E.; Yactayo, W. Extreme salinity as a challenge to grow potatoes under mars-like soil conditions: Targeting promising genotypes. Int. J. Astrobiol. 2019, 18, 18–24. [Google Scholar] [CrossRef] [Green Version]
  101. Casadesus, J.; Kaya, Y.; Bort, J.; Nachit, M.M.; Araus, J.L.; Amor, S.; Ferrazzano, G.; Maalouf, F.; Maccaferri, M.; Martos, V.; et al. Using vegetation indices derived from conventional digital cameras as selection criteria for wheat breeding in water-limited environments. Ann. Appl. Bot. 2007, 150, 227–236. [Google Scholar] [CrossRef]
  102. Casadesús, J.; Villegas, D. Conventional digital cameras as a tool for assessingleaf area index and biomass for cereal breeding. J. Integr. Plant. Biol. 2014, 56, 7–14. [Google Scholar] [CrossRef]
  103. Marín, J.; Yousfi, S.; Mauri, P.V.; Parra, L.; Lloret, J.; Masaguer, A. RGB Vegetation Indices, NDVI, and Biomass as Indicators to Evaluate C3 and C4 Turfgrass under Different Water Conditions. Sustainability 2020, 12, 2160. [Google Scholar] [CrossRef] [Green Version]
  104. Zakaluk, R.; Ranjan, R.S. Artificial neural network modelling of leaf water potential for potatoes using RGB digital images: A greenhouse study. Potato Res. 2007, 49, 255–272. [Google Scholar] [CrossRef]
  105. Taghvaeian, S.; Chávez, J.L.; Mary, J.; Hattendorf, M.J.; Crookston, M.A. Optical and thermal remote sensing of turfgrass quality, water stress, and water use under different soil and irrigation treatments. Remote Sens. 2013, 5, 2327–2347. [Google Scholar] [CrossRef] [Green Version]
  106. Yue, J.; Feng, H.; Jin, X.; Yuan, H.; Li, Z.; Zhou, C.; Yang, G.; Tian, Q. A comparison of crop parameters estimation using images from UAV-mounted snapshot hyperspectral sensor and high-definition digital camera. Remote Sens. 2018, 10, 1138. [Google Scholar] [CrossRef] [Green Version]
  107. Pimstein, A.; Karnieli, A.; Bansal, S.K.; Bonfil, D.J. Exploring remotely sensed technologies for monitoring wheat potassium and phosphorus using field spectroscopy. Field Crops Res. 2011, 121, 125–135. [Google Scholar] [CrossRef]
  108. Silva-Perez, V.; Molero, G.; Serbin, S.P.; Condon, A.G.; Reynolds, M.P.; Furbank, R.T.; Evans, J.R. Hyperspectral reflectance as a tool to measure biochemical and physiological traits in wheat. J. Exp. Bot. 2018, 69, 483–496. [Google Scholar] [CrossRef] [PubMed] [Green Version]
  109. Lobos, G.A.; Escobar-Opazo, A.; Estrada, F.; Romero-Bravo, S.; Garriga, M.; del Pozo, A.; Poblete-Ecghevarría, C.; González-Talice, J.; González-Martinez, L.; Caligari, P. Spectral reflectance modeling by wavelength selection: Studying the scope for blueberry physiological breeding under contrasting water supply and heat conditions. Remote Sens. 2019, 11, 329. [Google Scholar] [CrossRef] [Green Version]
  110. Sayed, T.; Tavakolie, A.; Razavi, A. Comparison of adaptive network based fuzzy inference systems and Bspline neuro-fuzzy mode choice models. J. Comput. Civ. Eng. 2003, 17, 123–130. [Google Scholar] [CrossRef]
  111. Kisi, O. Suspended sediment estimation using neuro-fuzzy and neural network approaches. Hydrol. Sci. J. 2005, 50, 683–696. [Google Scholar] [CrossRef]
  112. El-Hendawy, S.E.; Al-Suhaibani, N.; Elsayed, S.; Refay, Y.; Alotaibi, M.; Dewir, Y.H.; Hassan, W.M.; Schmidhalter, U. Combining biophysical parameters, spectral indices and multivariate hyperspectral models for estimating yield and water productivity of spring wheat across different agronomic practices. PLoS ONE 2019, 14, e0212294. [Google Scholar]
Figure 1. Location of the study field.
Remotesensing 13 01679 g001
Figure 2. Original photos for (a) 100%, (b) 75% and (c) 50% ETc as well as segmentation photos for (d) 100%, (e) 75% & (f) 50% ETc.
Remotesensing 13 01679 g002
Figure 3. Schematic diagram of the methodology of adaptive neuro-fuzzy inference system (ANFIS) used in this study to predict the biomass fresh weight (BFW), biomass dry weight (BDW), biomass water content (BWC) and total tuber yield (TTY) of both potato varieties based on the selected thermal and RGB indices.
Remotesensing 13 01679 g003
Figure 4. Basic structure of ANFIS with two rule Sugeno system.
Remotesensing 13 01679 g004
Figure 5. A schematic diagram of the five layers that incorporate ANFIS.
Remotesensing 13 01679 g005
Figure 6. A schematic diagram of basic genetic algorithm (GA).
Remotesensing 13 01679 g006
Figure 7. Varation in the biomass fresh weight (BFW), biomass dry weight (BDW), biomass water content (BWC) and total tuber yield (TTY) of both potato varieties under three irrigation regimes (100%, 75% & 50% ETc). The same letter are not significantly different from one another based on Duncan’s multiple range test at a p ≤ 0.05 significance level. Error bars represents standard error of the mean.
Remotesensing 13 01679 g007
Figure 8. The determination coefficients of relationships between the NRCT and twelve RGB imagery indices with biomass fresh weight (BFW), biomass dry weight (BDW), biomass water content (BWC) and total tuber yield (TTY) of two potato varieties subjected to different irrigation regimes across two years. R2 values ≥ 0.48 are significant at p ≤ 0.05. The full names of the abbreviations of RGB imagery indices are listed in Table 1.
Remotesensing 13 01679 g008
Figure 9. The determination coefficients of relationships between the NRCT and twelve RGB imagery indices with biomass fresh weight (BFW), biomass dry weight (BDW), biomass water content (BWC), and total tuber yield (TTY) of two potato varieties subjected to different irrigation regimes for each season and across two seasons. R2 values ≥ 0.48 are significant at p ≤ 0.05. The full names of the abbreviations of RGB imagery indices are listed in Table 1.
Remotesensing 13 01679 g009
Figure 10. The determination coefficients of relationships between the NRCT and twelve RGB imagery indices with biomass fresh weight (BFW), biomass dry weight (BDW), biomass water content (BWC), and total tuber yield (TTY) of two potato varieties under 100%, 75%, and 50% ETc. R2 values ≥ 0.12 are significant at p ≤ 0.05. The full names of the abbreviations of RGB imagery indices are listed in Table 1.
Remotesensing 13 01679 g010
Figure 11. Comparison between training series (a,c) and testing series (b,d) for biomass fresh weight (BFW) and biomass dry weight (BDW) of potato varieties using the developed ANFIS model.
Remotesensing 13 01679 g011
Figure 12. Comparison between training series (a,c) and testing series (b,d) for biomass water content (BWC) and total tuber yield (TTY) of potato varieties using the developed ANFIS model.
Remotesensing 13 01679 g012
Table 1. Description of Different RGB Imagery Indices Tested in This Study.
RGB IndicesFormulaReferences
Red pixel precentage (R %)R/(R + G + B)[64]
Green pixel precentage (G %)G/(R + G + B)[64]
Blue pixel precentage (B %)B/(R + G + B)[64]
Green red ratio index (GRRI)G/R[65]
Green-red vegetation index (GRVI)(G − R)/(G + R)[66]
Normalized difference index (NDI)(R − G)/(R + G + 0.01)[67]
Excess red vegetation index (ExR)1.4 × R − G[68]
Excess green vegetation index (ExG)2 × G − R − B[68]
Excess green minus Excess red index (ExGR)ExG − ExR[68]
Vegetative index (VEG)G/(Ra × B(1 − a)), a = 0.667[69]
Principal component analysis index (IPCA)0.994 × (R − B) + 0.961 × (G − B) + 0.914 × (G − R)[70]
Combination (COM)0.25 × ExG + 0.3 × ExGR + 0.33 × CIVE + 0.12 × VEG[71]
CIVE is mean color index of vegetation.
Table 2. Combined Analysis of Variance (Level of Significance for F-Value) and Comparison the Mean Values for Thermal and RGB Imagery Indices Among Three Irrigation Regimes for Each Potato Variety Across TWO seasons.
VarietiesIrrigation RegimesNRCTR %G %B %GRRIGRVINDIExRExGExGRVEGIPCACOM
Arizona100% ETc0.259c0.187c0.449a0.364a2.418a0.413a−0.406b−0.187b0.347a0.534a1.930a49.718a6.678a
75% ETc0.486b0.194ab0.436b0.370a2.260a0.385b−0.379b−0.165b0.309b0.474b1.819b46.043b6.637b
50% ETc0.682a0.207a0.413c0.380a1.970b0.325c−0.320a−0.118a0.240c0.359c1.621c38.525c6.562c
Bellini100% ETc0.329c0.185b0.448a0.367a2.431a0.415a−0.409c−0.189c0.343a0.531a1.931a49.855a6.676a
75% ETc0.540b0.203a0.432b0.364a2.132b0.360b−0.354b−0.147b0.296b0.443b1.753b43.414b6.617b
50% ETc0.710a0.214a0.414c0.373b1.947c0.319c−0.314a−0.114a0.241c0.356c1.614c37.980c6.560c
ANOVA (F-test)
Season (S)NSNSNSNSNSNSNSNSNSNSNSNSNS
Irrigation (I)***************************************
Variety (V)**NSNSNSNSNSNSNSNSNSNSNSNS
I × SNSNSNSNSNSNSNSNSNSNSNSNSNS
V × SNSNSNSNSNSNSNSNSNSNSNSNSNS
V × INSNSNSNSNSNSNSNSNSNSNSNSNS
V× I × SNSNSNSNSNSNSNSNSNSNSNSNSNS
Means followed by the same letter are not significantly different from one another based on Duncan’s multiple range test at a p ≤ 0.05 significance level. NS, **, and *** indicate non-significant, significant at p ≤ 0.01, and highly significant p ≤ 0.001 probability level, respectively. The full names of the abbreviations of RGB imagery indices are listed in Table 1.
Table 3. Extraction of the Most Influential Thermal and RGB Imaging Indices ACCOUNTING for the Major Variation for Biomass Fresh Weight (BFW) Biomass Dry Weight (BDW), Biomass Water Content (BWC), and Total Tuber Yield (TTY) Using Stepwise Multiple Linear Regression (SMLR) Analysis and Based on 75% of Dataset (n = 36).
Measured TraitsInfluential
Indices
Best Fitted EquationModel R2
BFWNRCT, COMBFW = −95.77 − 17.14(NRCT) + 17.98 (COM)0.89 ***
BDWVEGBDW = − 0.038 + 1.518 (VEG)0.47 *
BWCNRCT, G%, B%, R%CWC = 20.53 − 0.151 (NRCT) − 19.13 (G%) − 20.23 (B%) − 19.68 (R%)0.92 ***
TTYNRCT TTY = 54.67 − 37.89 (NRCT)0.84 ***
Levels of significance: *, p < 0.05; ***, p < 0.001. The full names of the abbreviations of RGB imagery indices are listed in Table 1.
Table 4. Function of Linear Validations between the Observed and Predicted Values, Coefficient of Determination (R2), and Root Mean Square Error (RMSE) of Linear Regression Models Based on Thermal and RGB Imaging Indices. The Best Fitted Equations of Calibration of Distinct Models (Table 3) Were Used to Predict Biomass Fresh Weight (BFW) Biomass Dry Weight (BDW), Biomass Water Content (BWC), and Total Tuber Yield (TTY) Based on 25% of Dataset (n = 12).
Measured Traits
Tttratraits
Variables
EquationR2RMSE
BFWy = 1.05x − 0.0400.84 ***1.594
BDWy = 0.179x + 2.1970.04 ns0.288
BWCy = 0.881x + 0.0940.89 ***0.013
TTYy = 0.760x + 8.7360.73 ***3.673
Levels of significance: ***, p < 0.001; ns, not significant. The full names of the abbreviations of RGB imagery indices are listed in Table 1.
Table 5. Performance Criteria of Adaptive Neuro-Fuzzy Inference System (ANFIS) models for measured parameters including Biomass Fresh Weight (BFW), Biomass DRY Weight (BDW), biomass Water Content (CWC), and Total Tuber YIELD (TTY) Across All Data (n = 48).
ParametersPerformance Criteria
R2RMSEMADE
Training SeriesBFW0.99 ***0.310.100.99
BDW0.99 ***0.070.030.99
BWC1.00 ***0.000.001.00
TTY1.00 ***0.660.251.00
Testing SeriesBFW0.88 ***2.141.970.63
BDW0.71 ***1.20.886−14.95
BWC1.00 ***0.010.010.99
TTY0.80 ***8.547.020.19
R2, RMSE, MAD, and E indicate coefficient of determination, root mean square error, mean absolute deviations, and Nash-Sutcliffe coefficient, respectively. Levels of significance: ***, p < 0.001.
Publisher’s Note: MDPI stays neutral with regard to jurisdictional claims in published maps and institutional affiliations.

