
Monitoring Terrestrial Water Storage Changes with the Tongji-Grace2018 Model in the Nine Major River Basins of the Chinese Mainland


Abstract
:1. Introduction
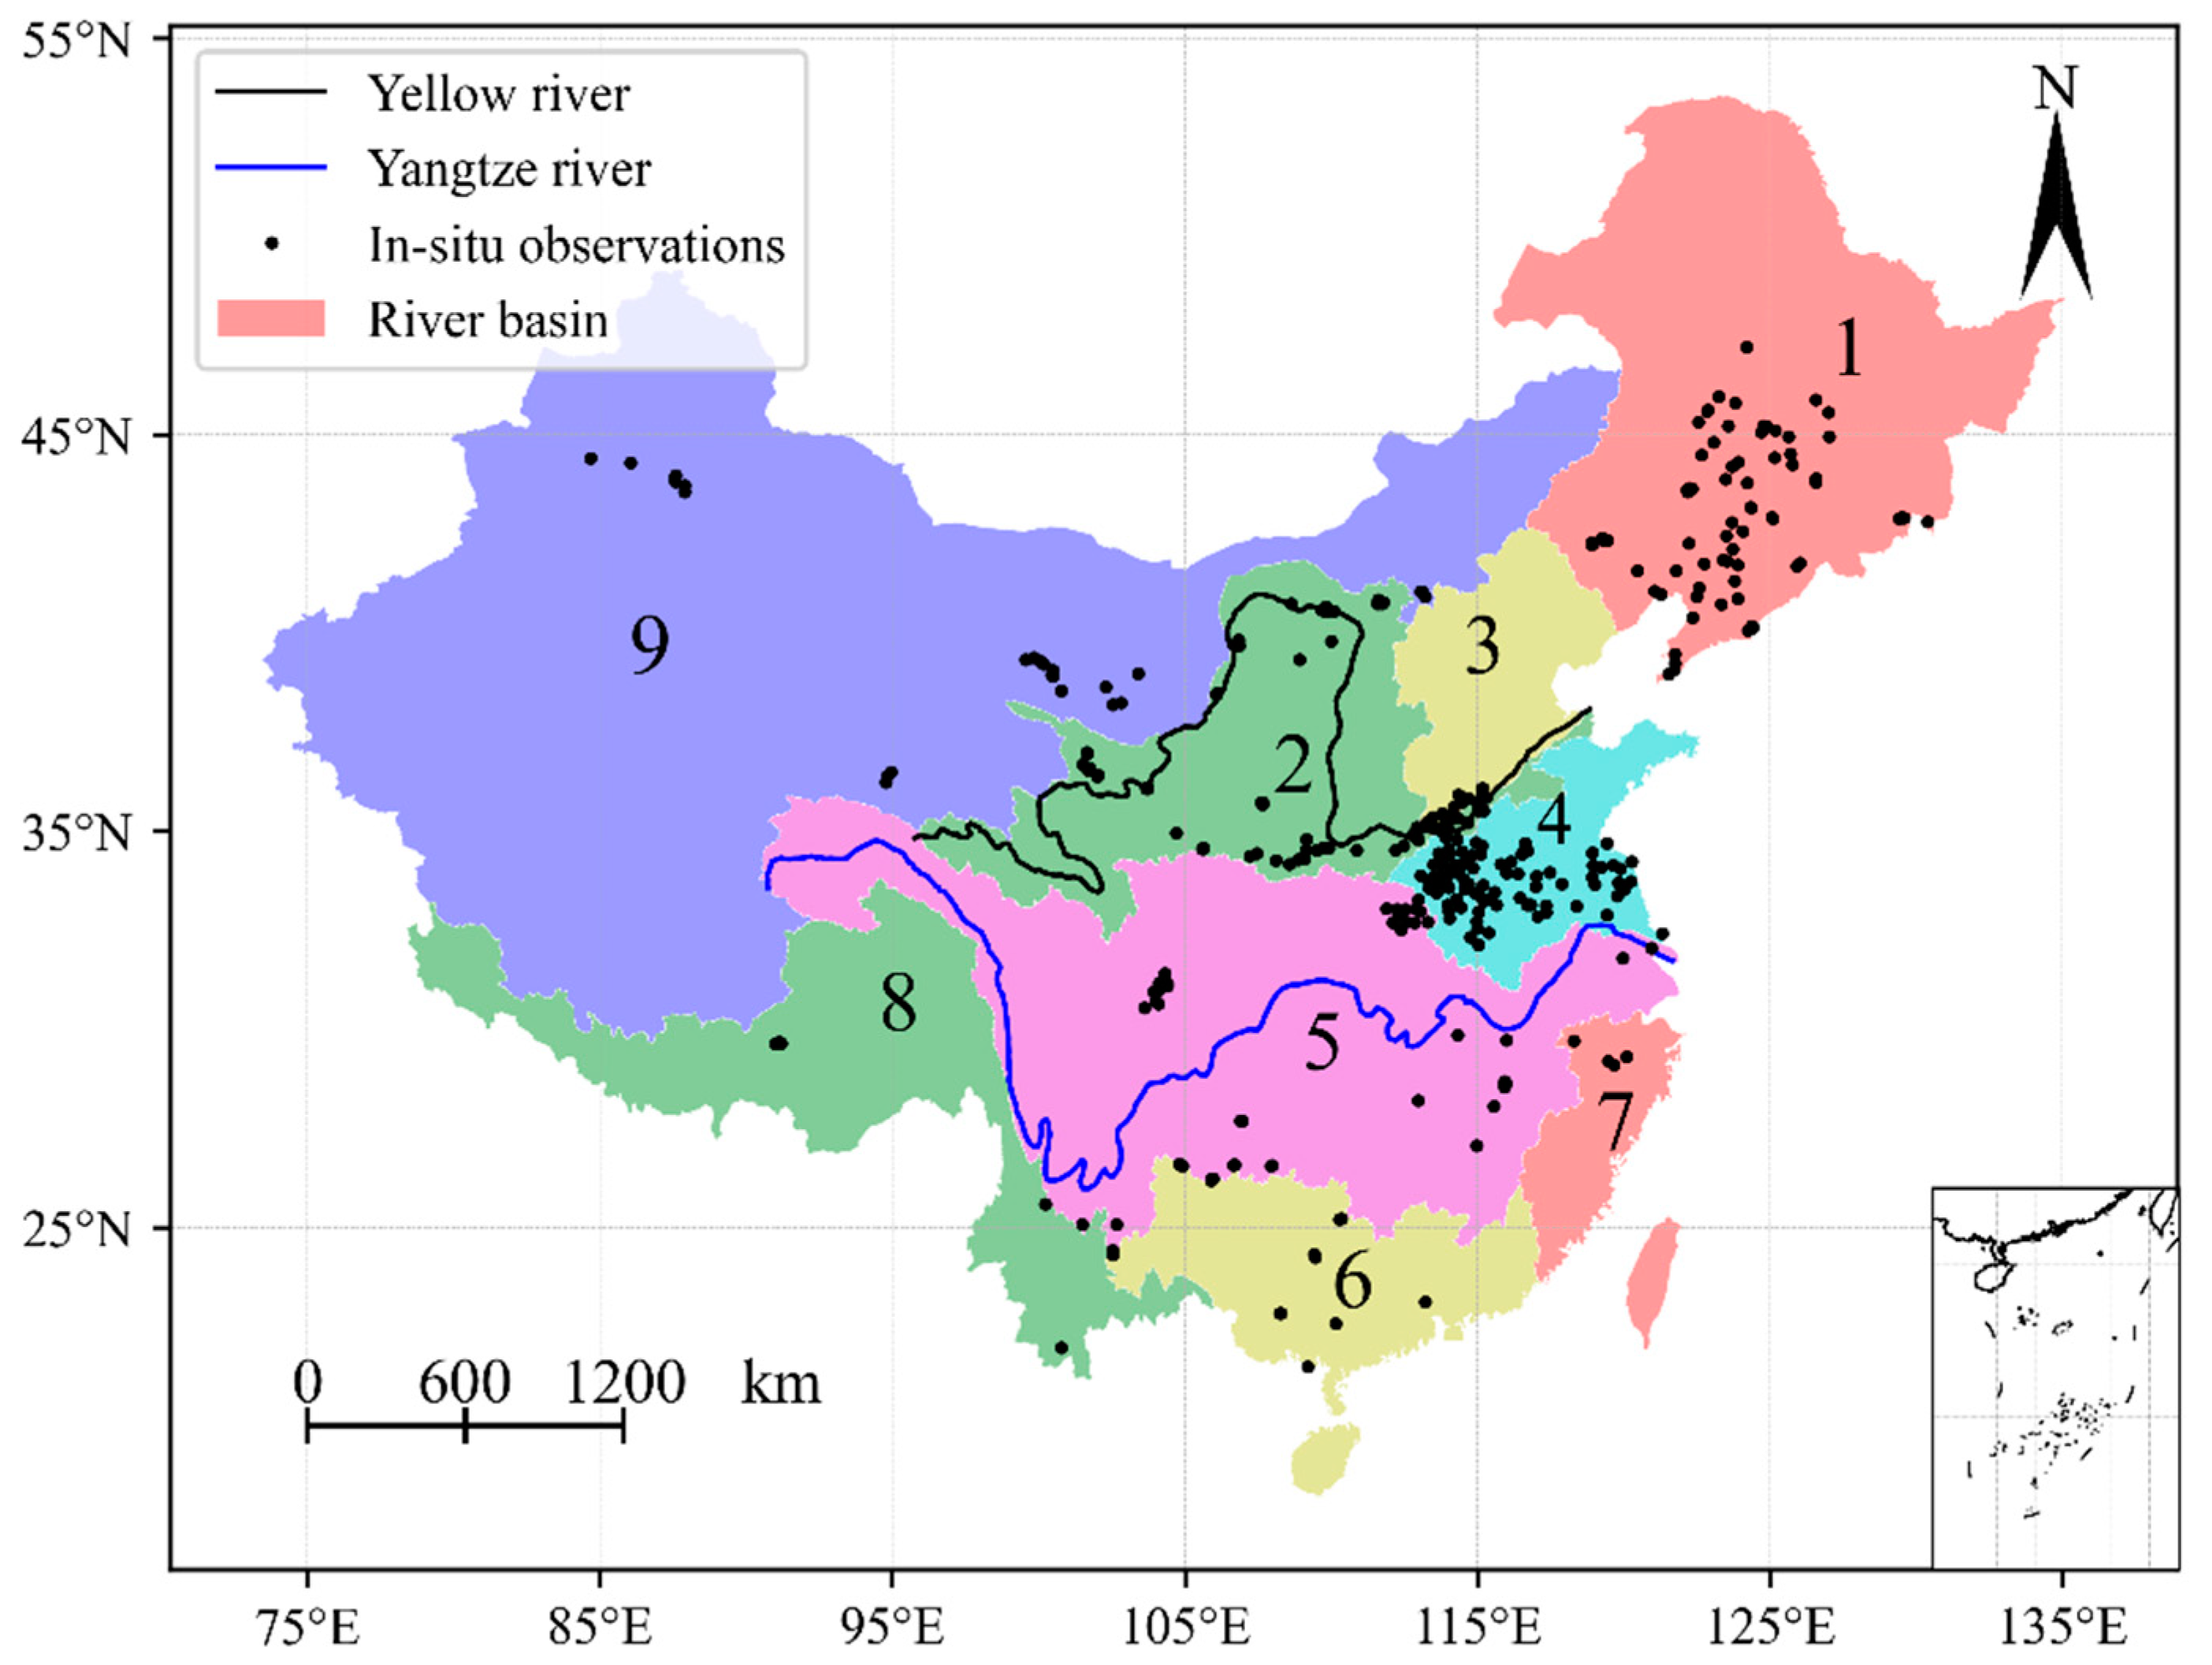
2. Study Area
3. Data and Methodology
3.1. Terrestrial Water Storage Estimates Using the GRACE Model
3.2. Surface Water Storage Estimates with the GLDAS Model
3.3. Groundwater Storage Estimates with the GRACE and GLDAS Models
3.4. Groundwater Storage Estimates from In Situ Observations
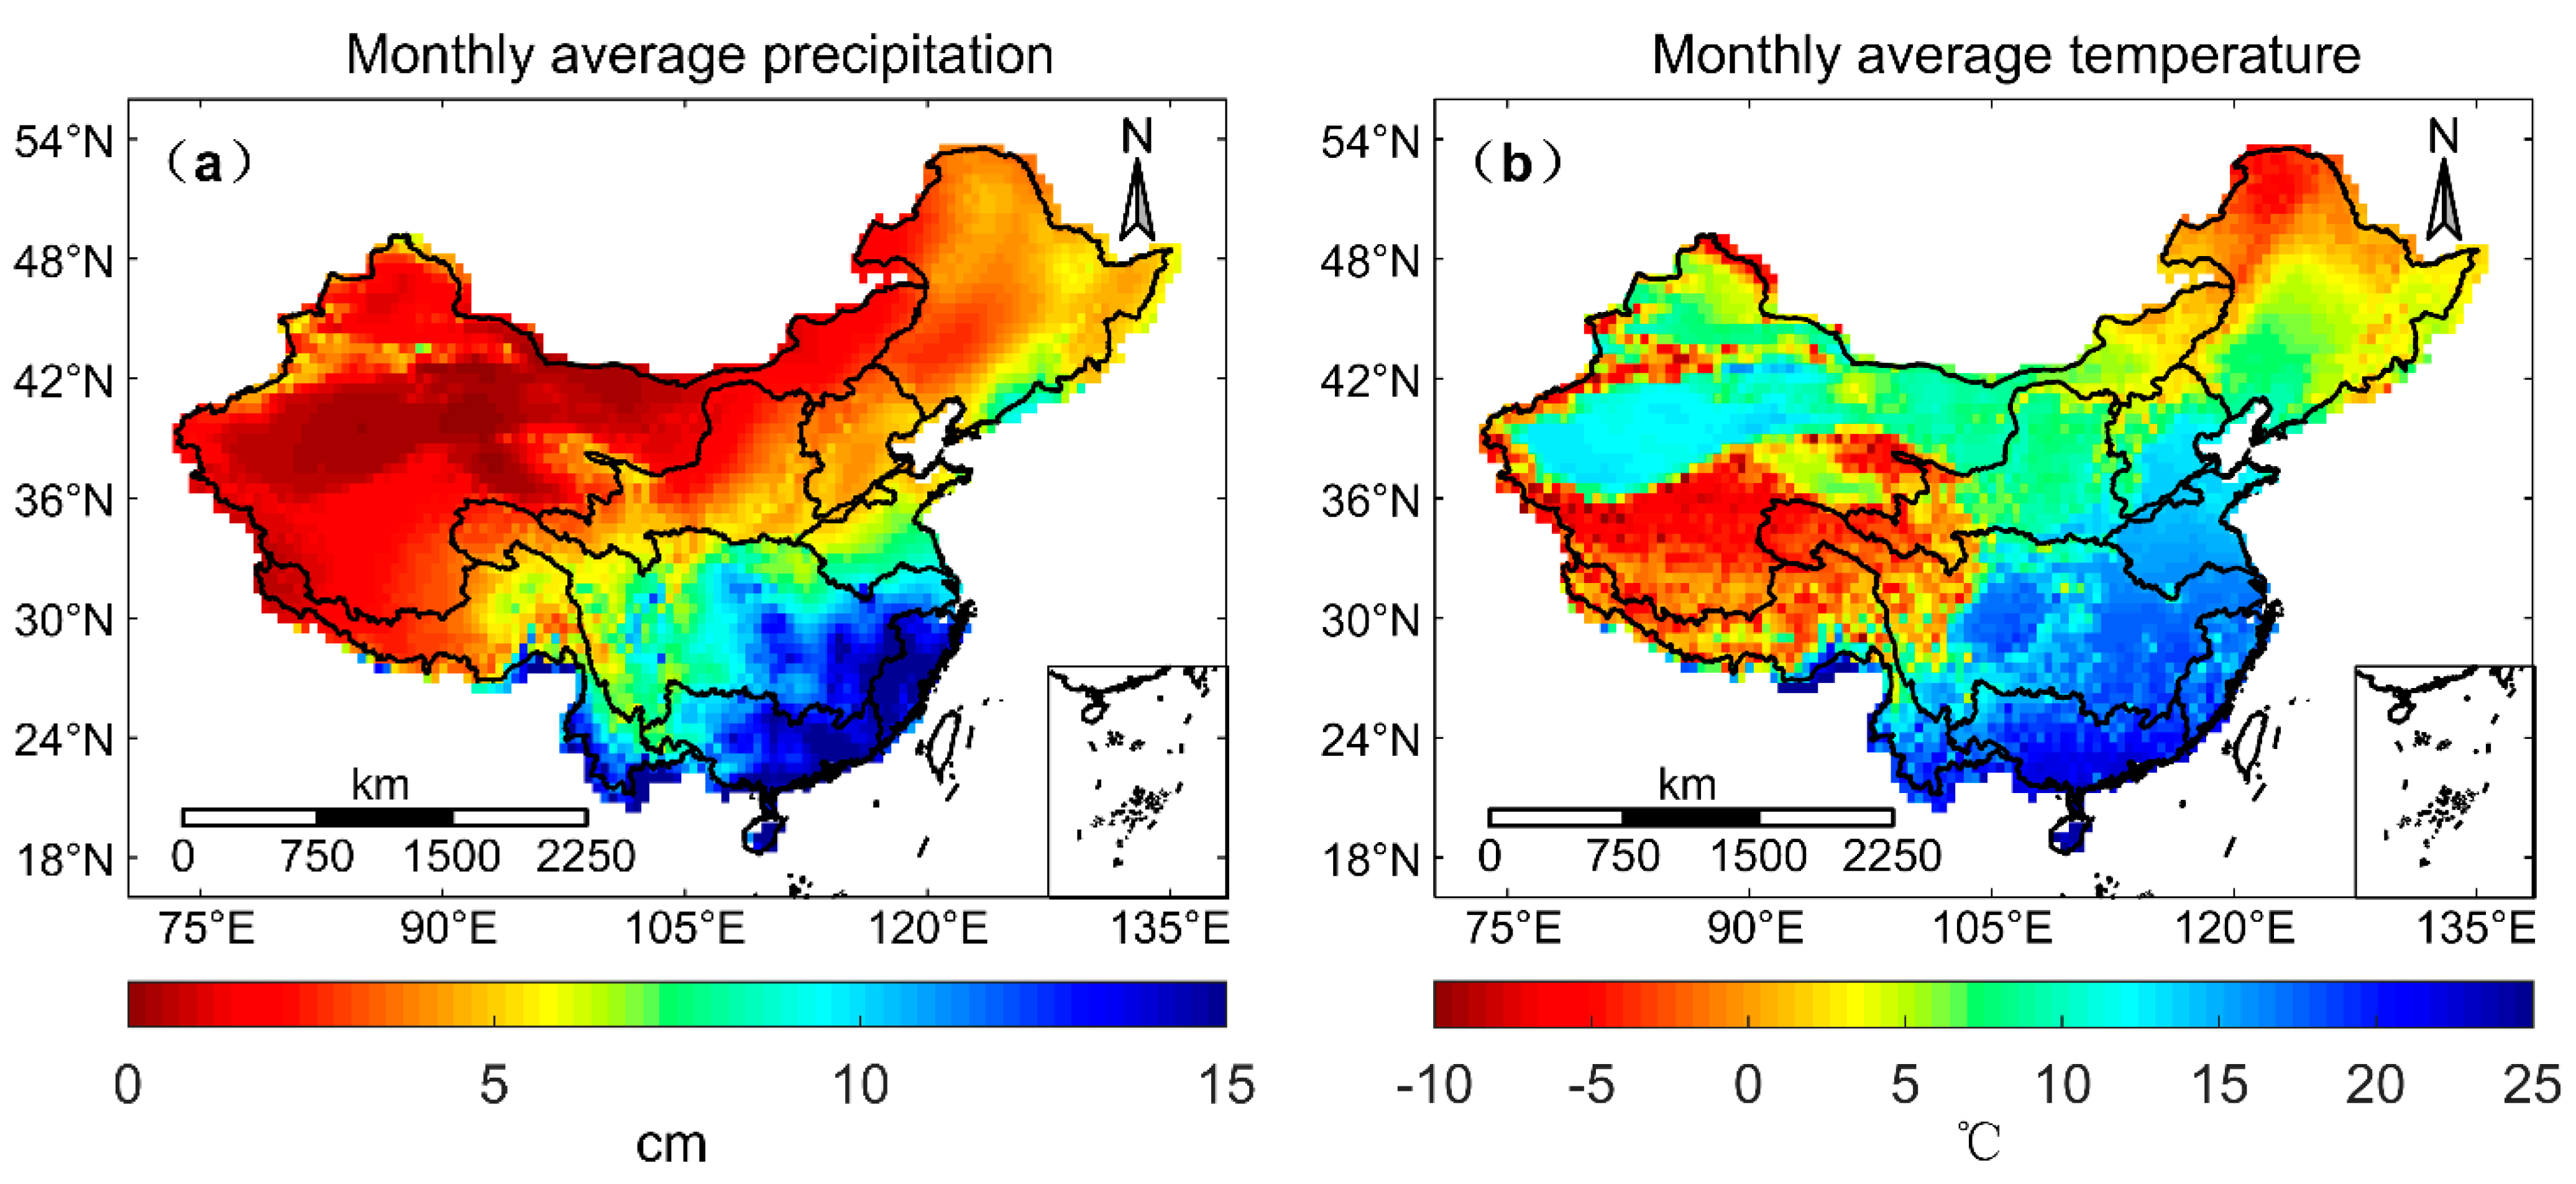
3.5. Precipitation and Temperature
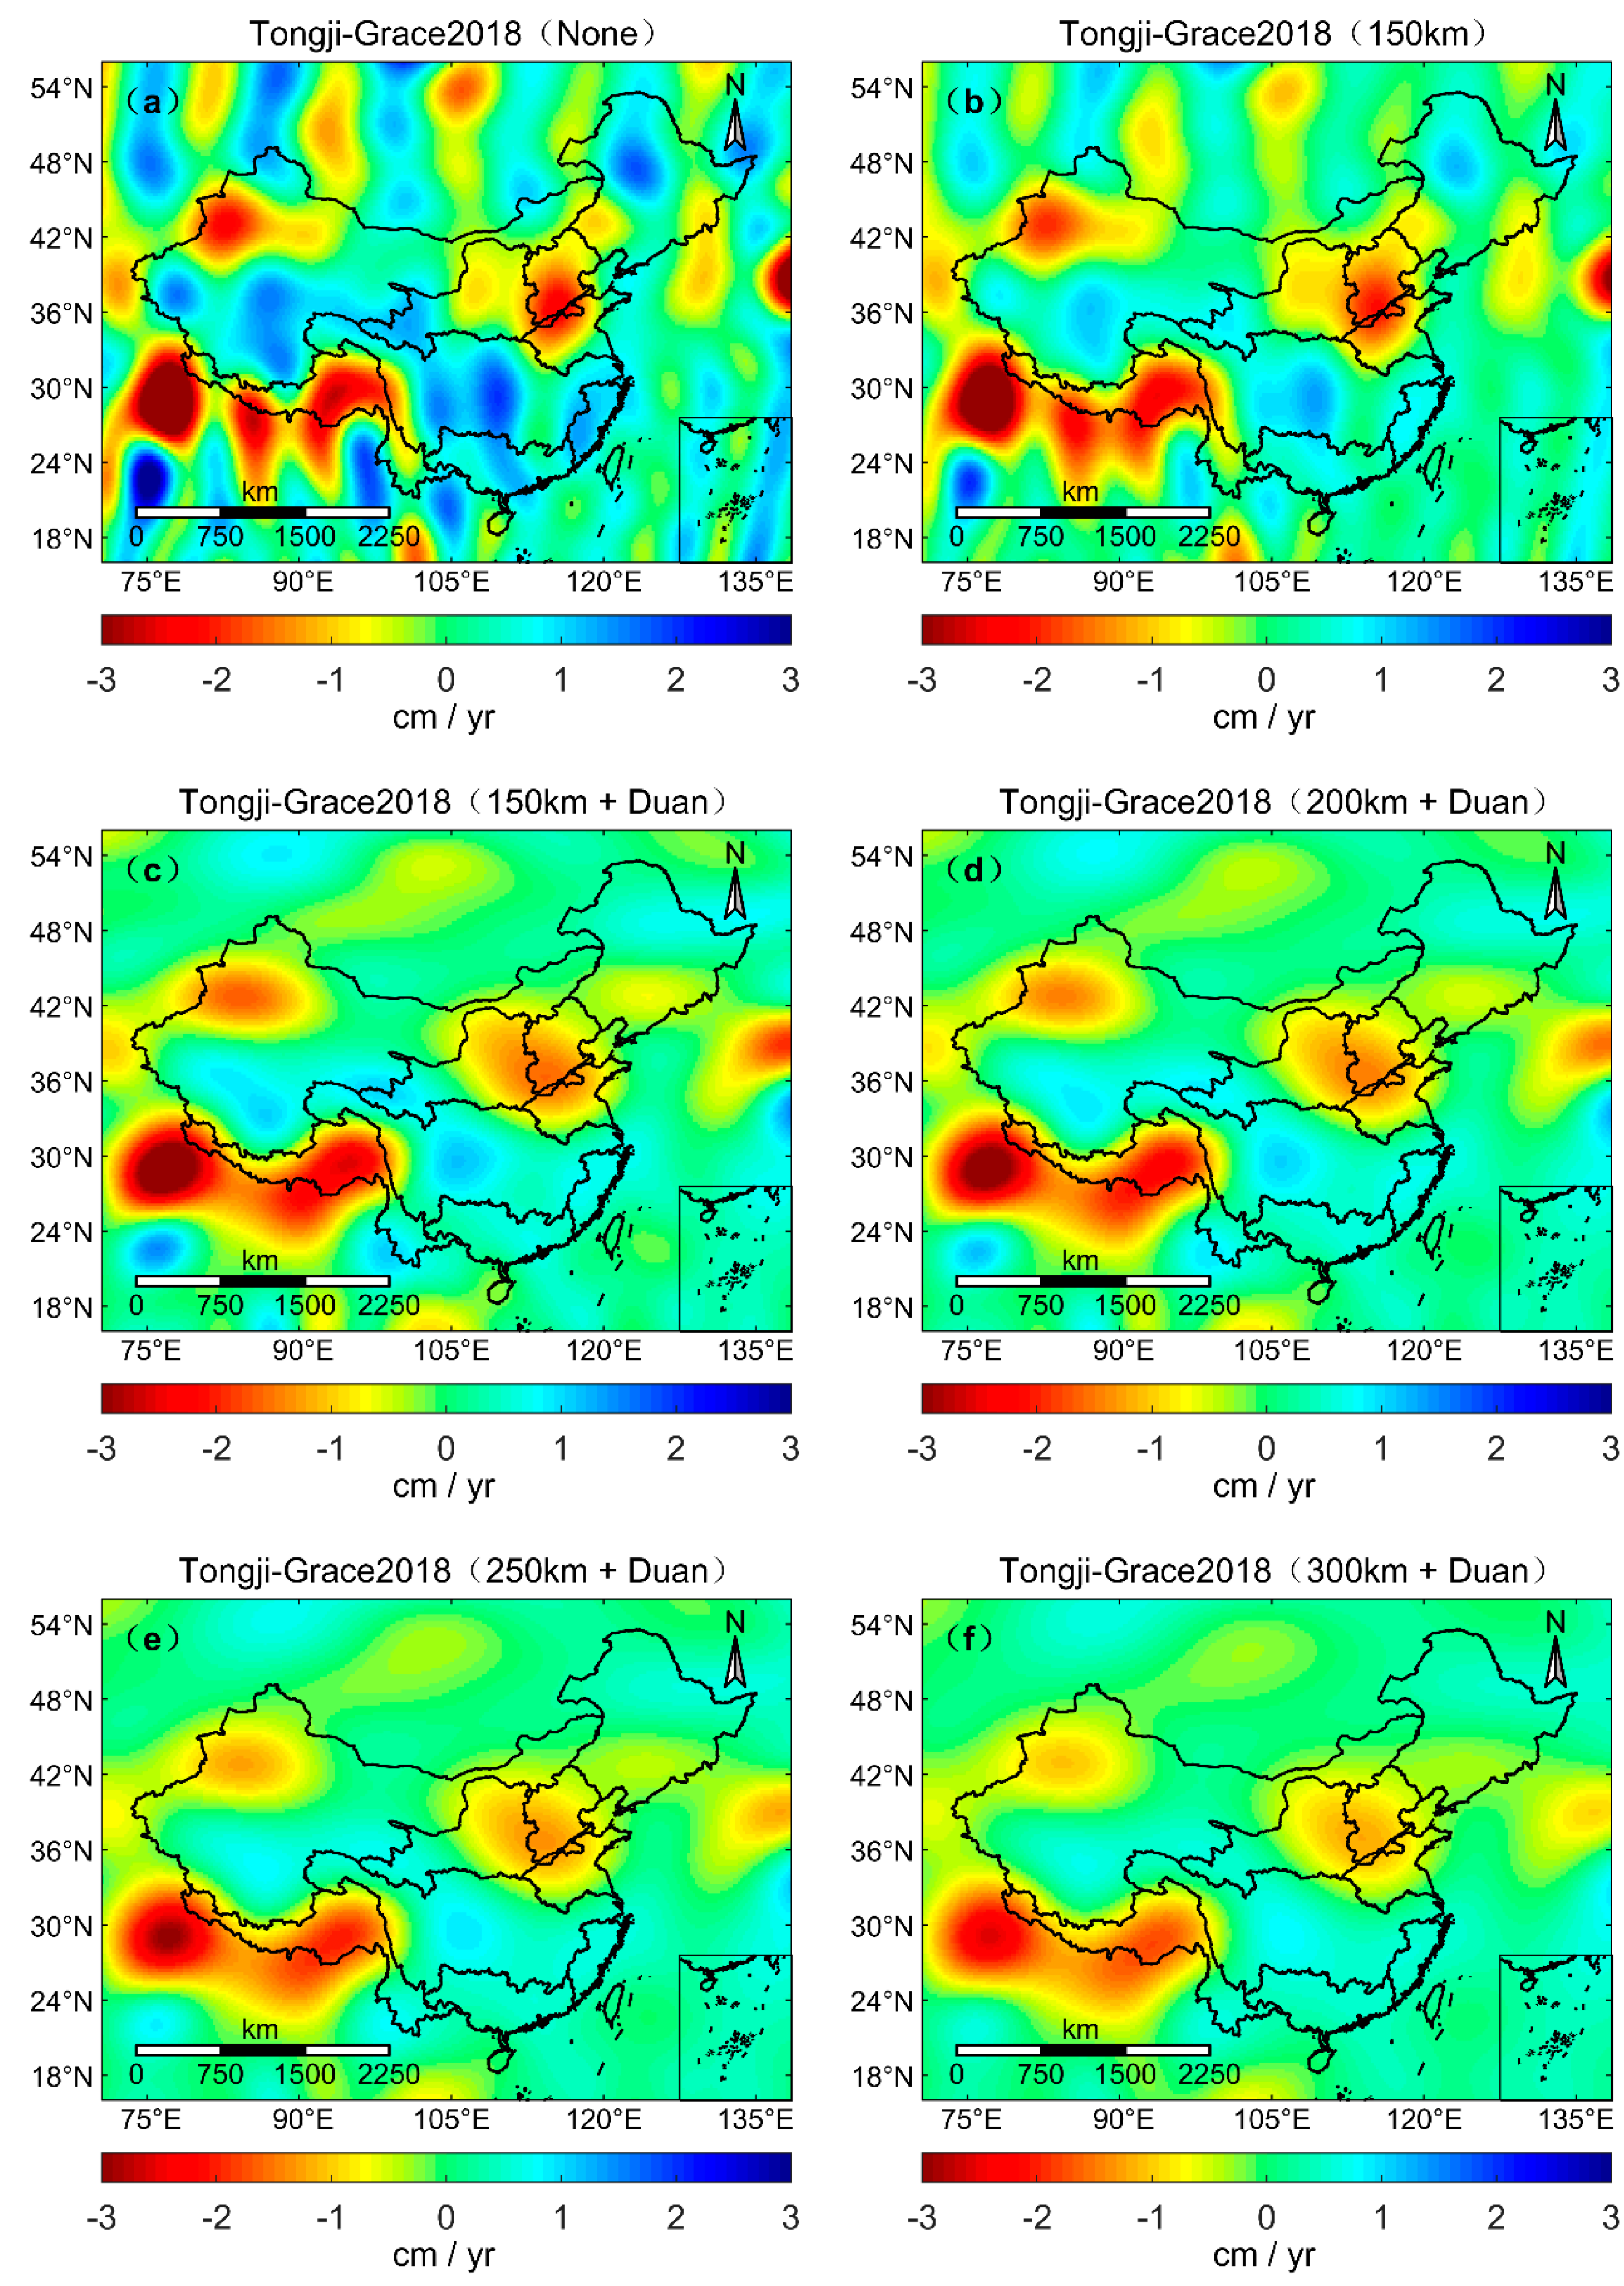
3.6. The Scaling Factor
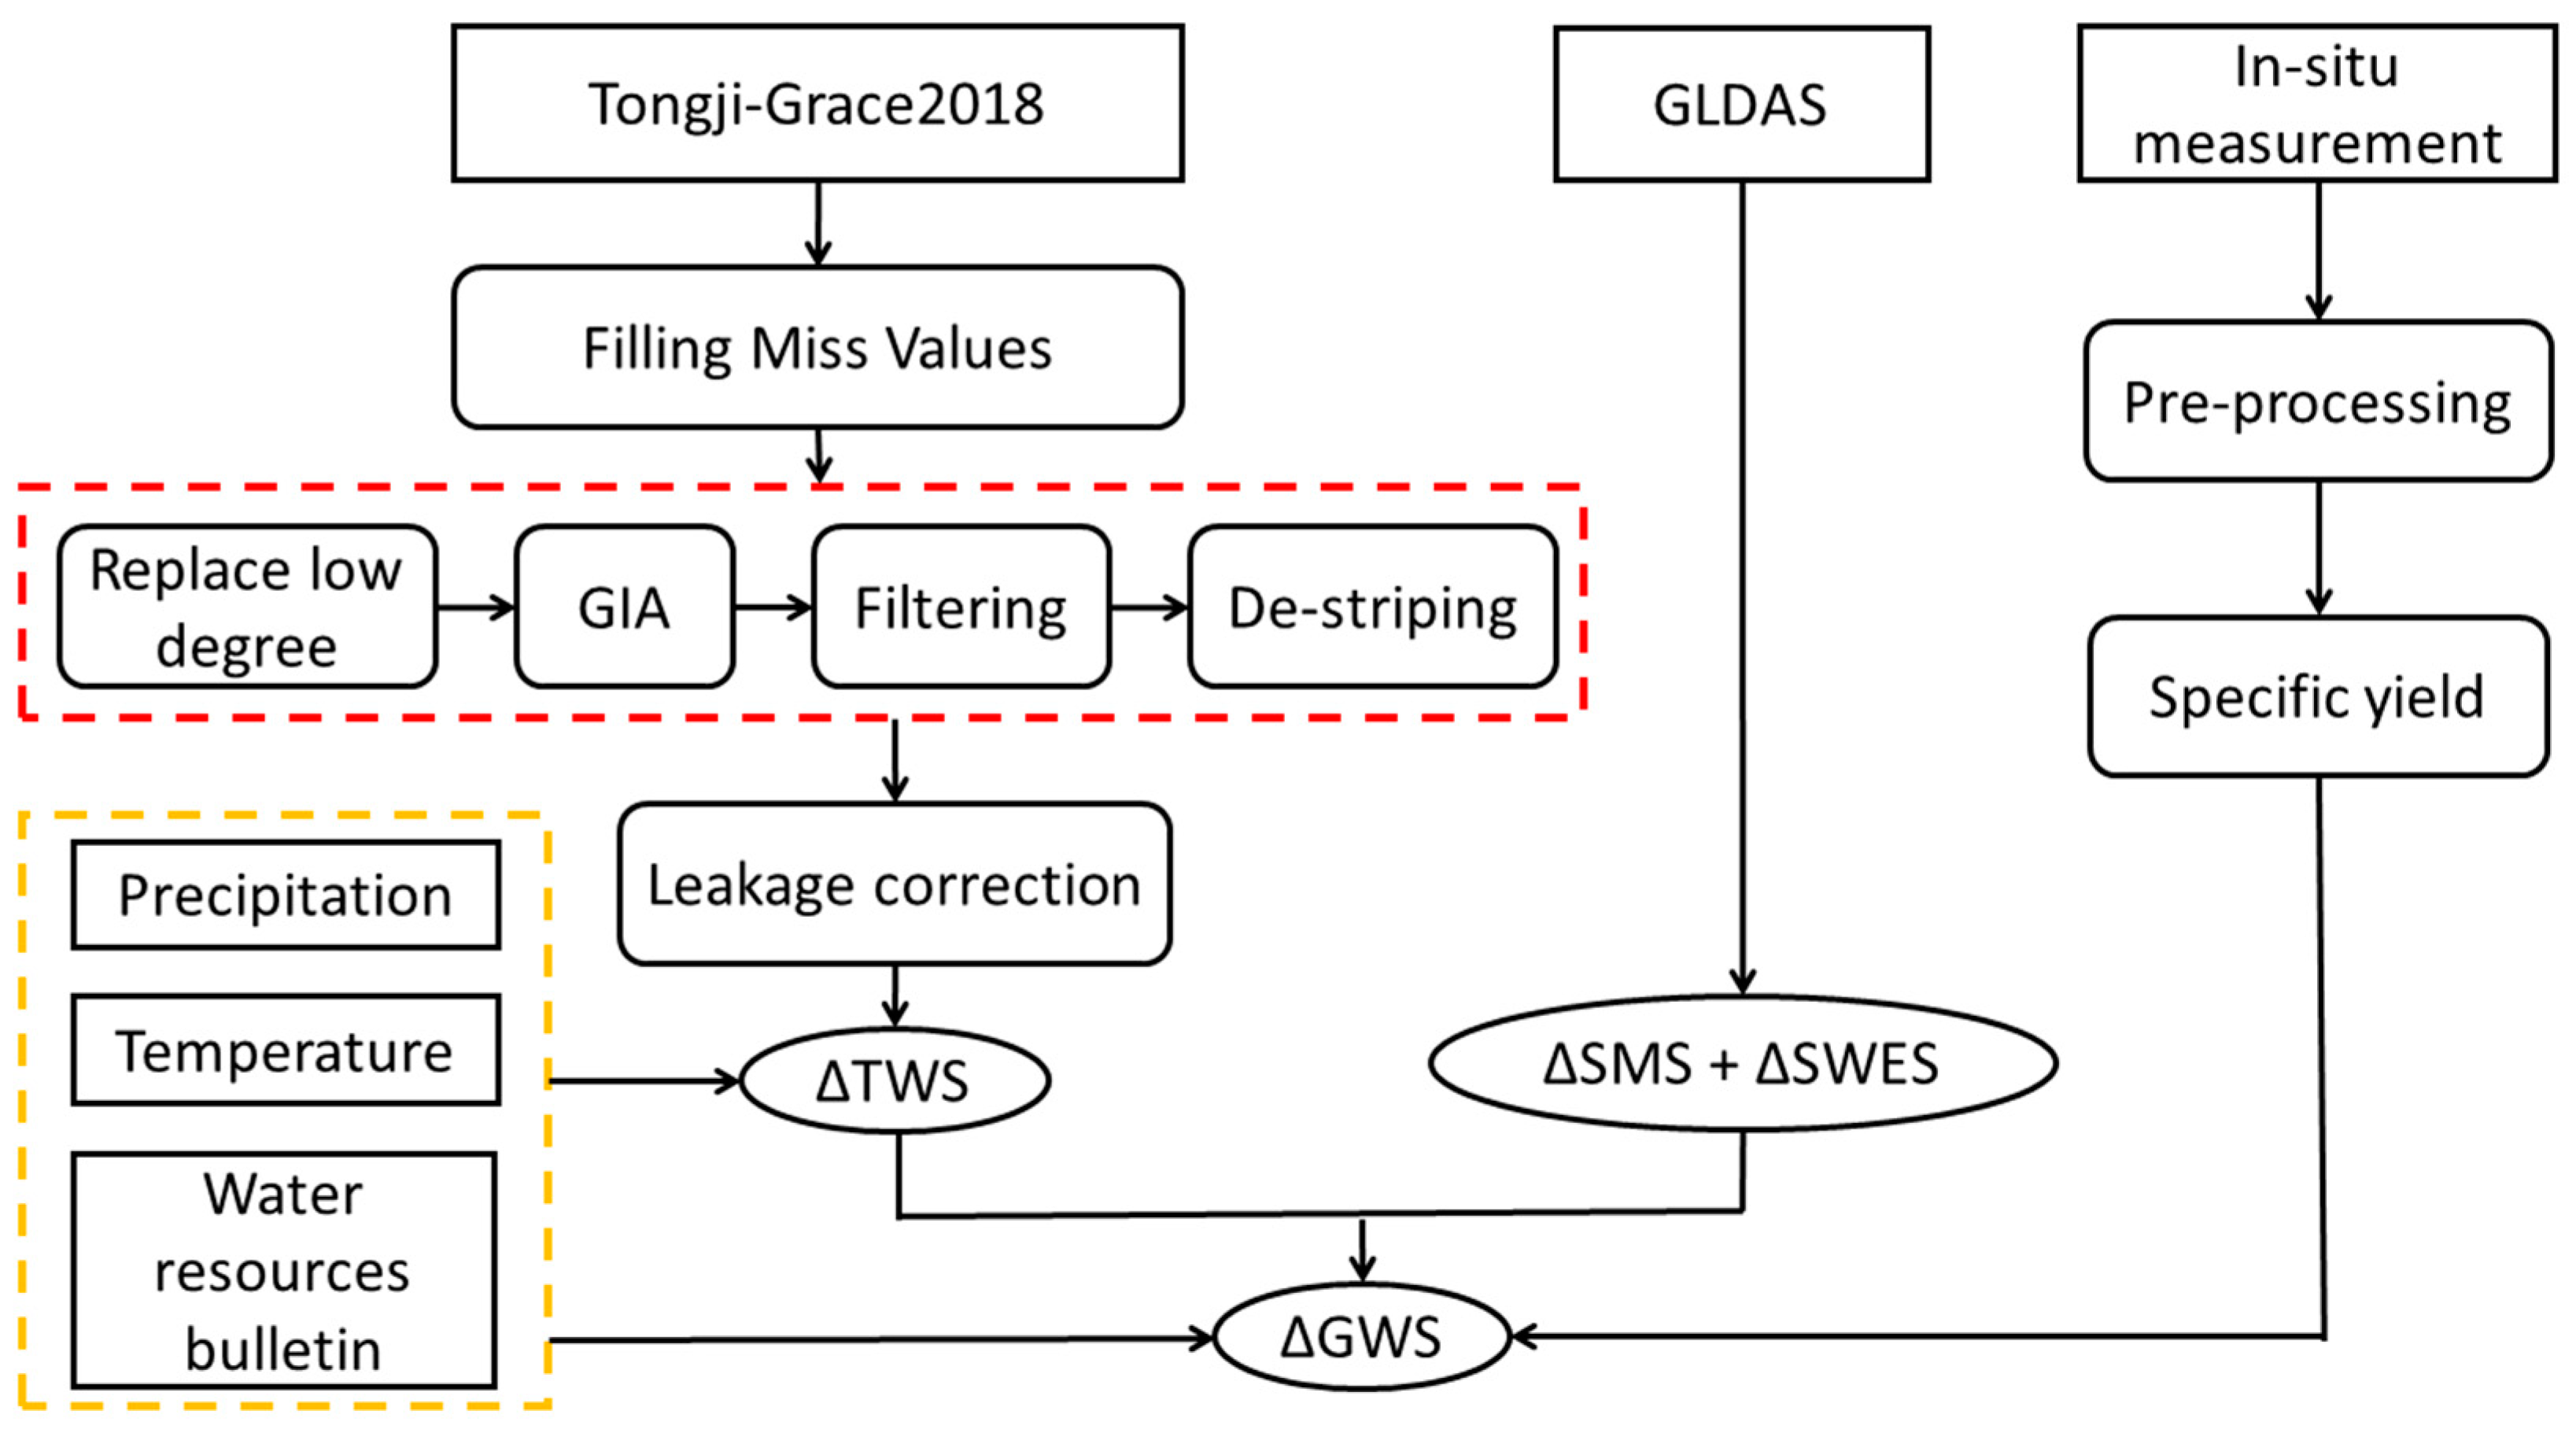
3.7. Workflow
4. Results and Discussion
4.1. Data Processing
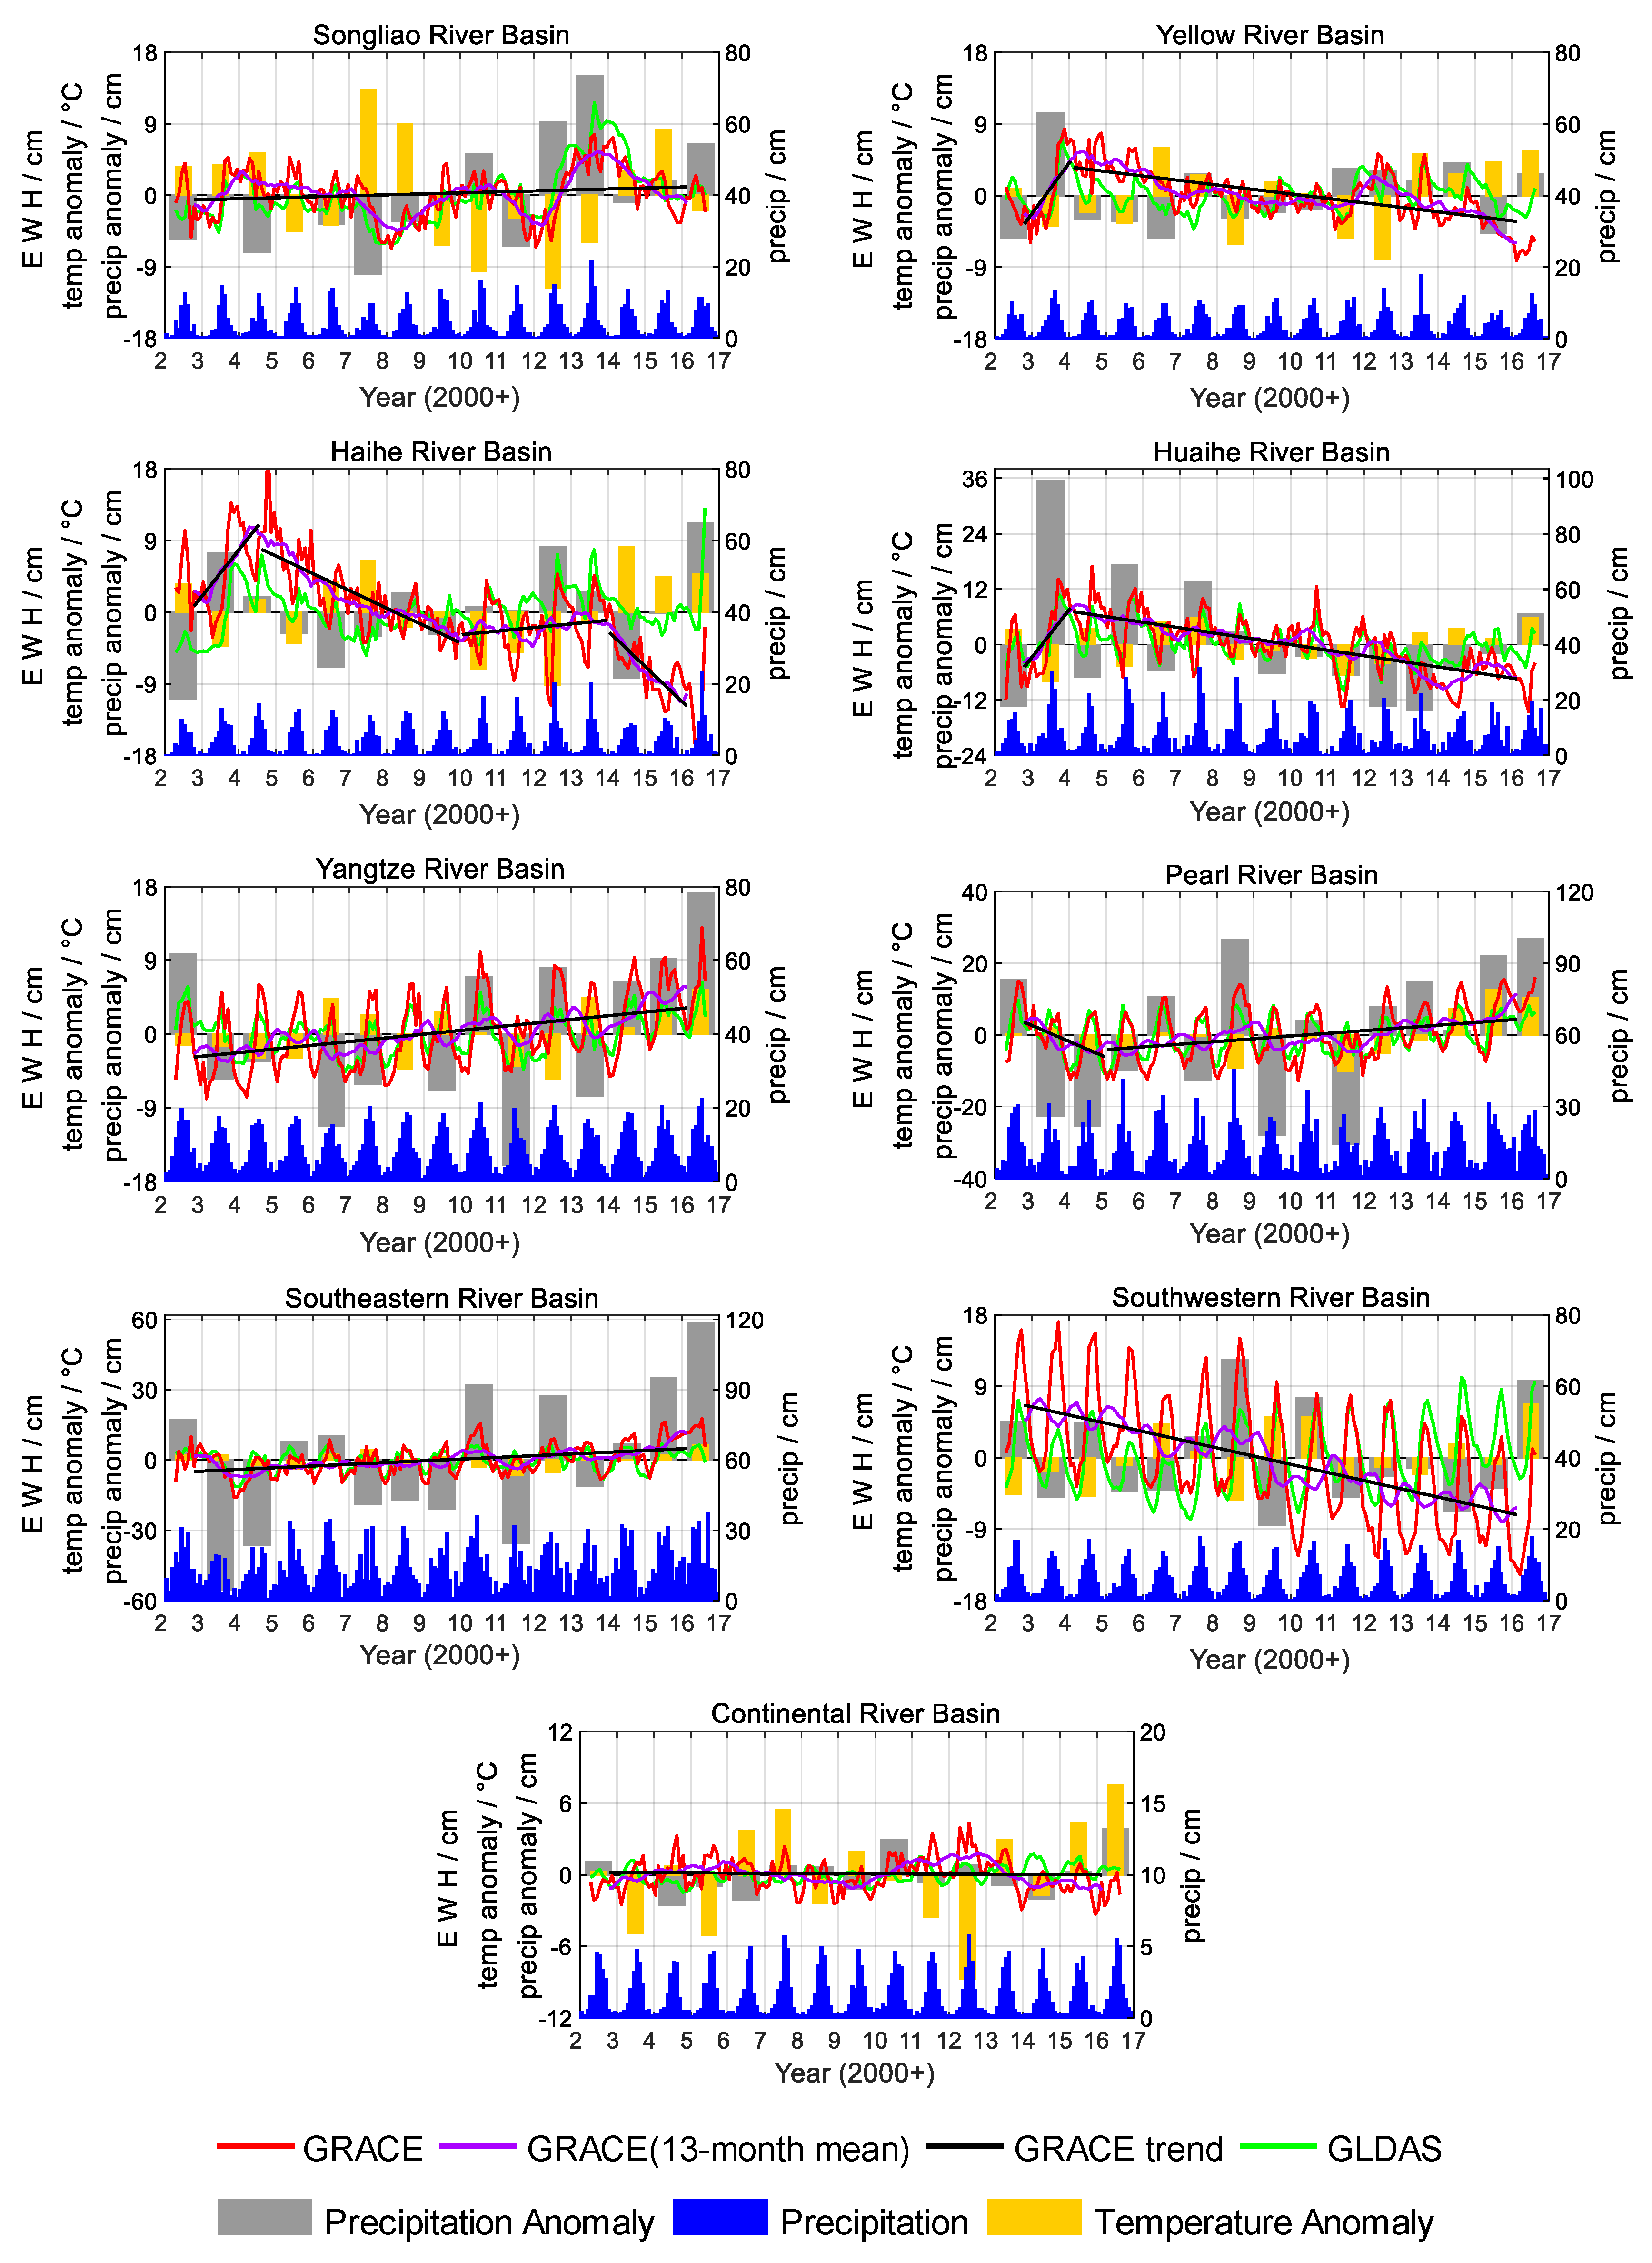
4.2. The Relationship between Precipitation and the GRACE and GLDAS Models
4.3. Terrestrial Water Storage in the Nine Major River Basins
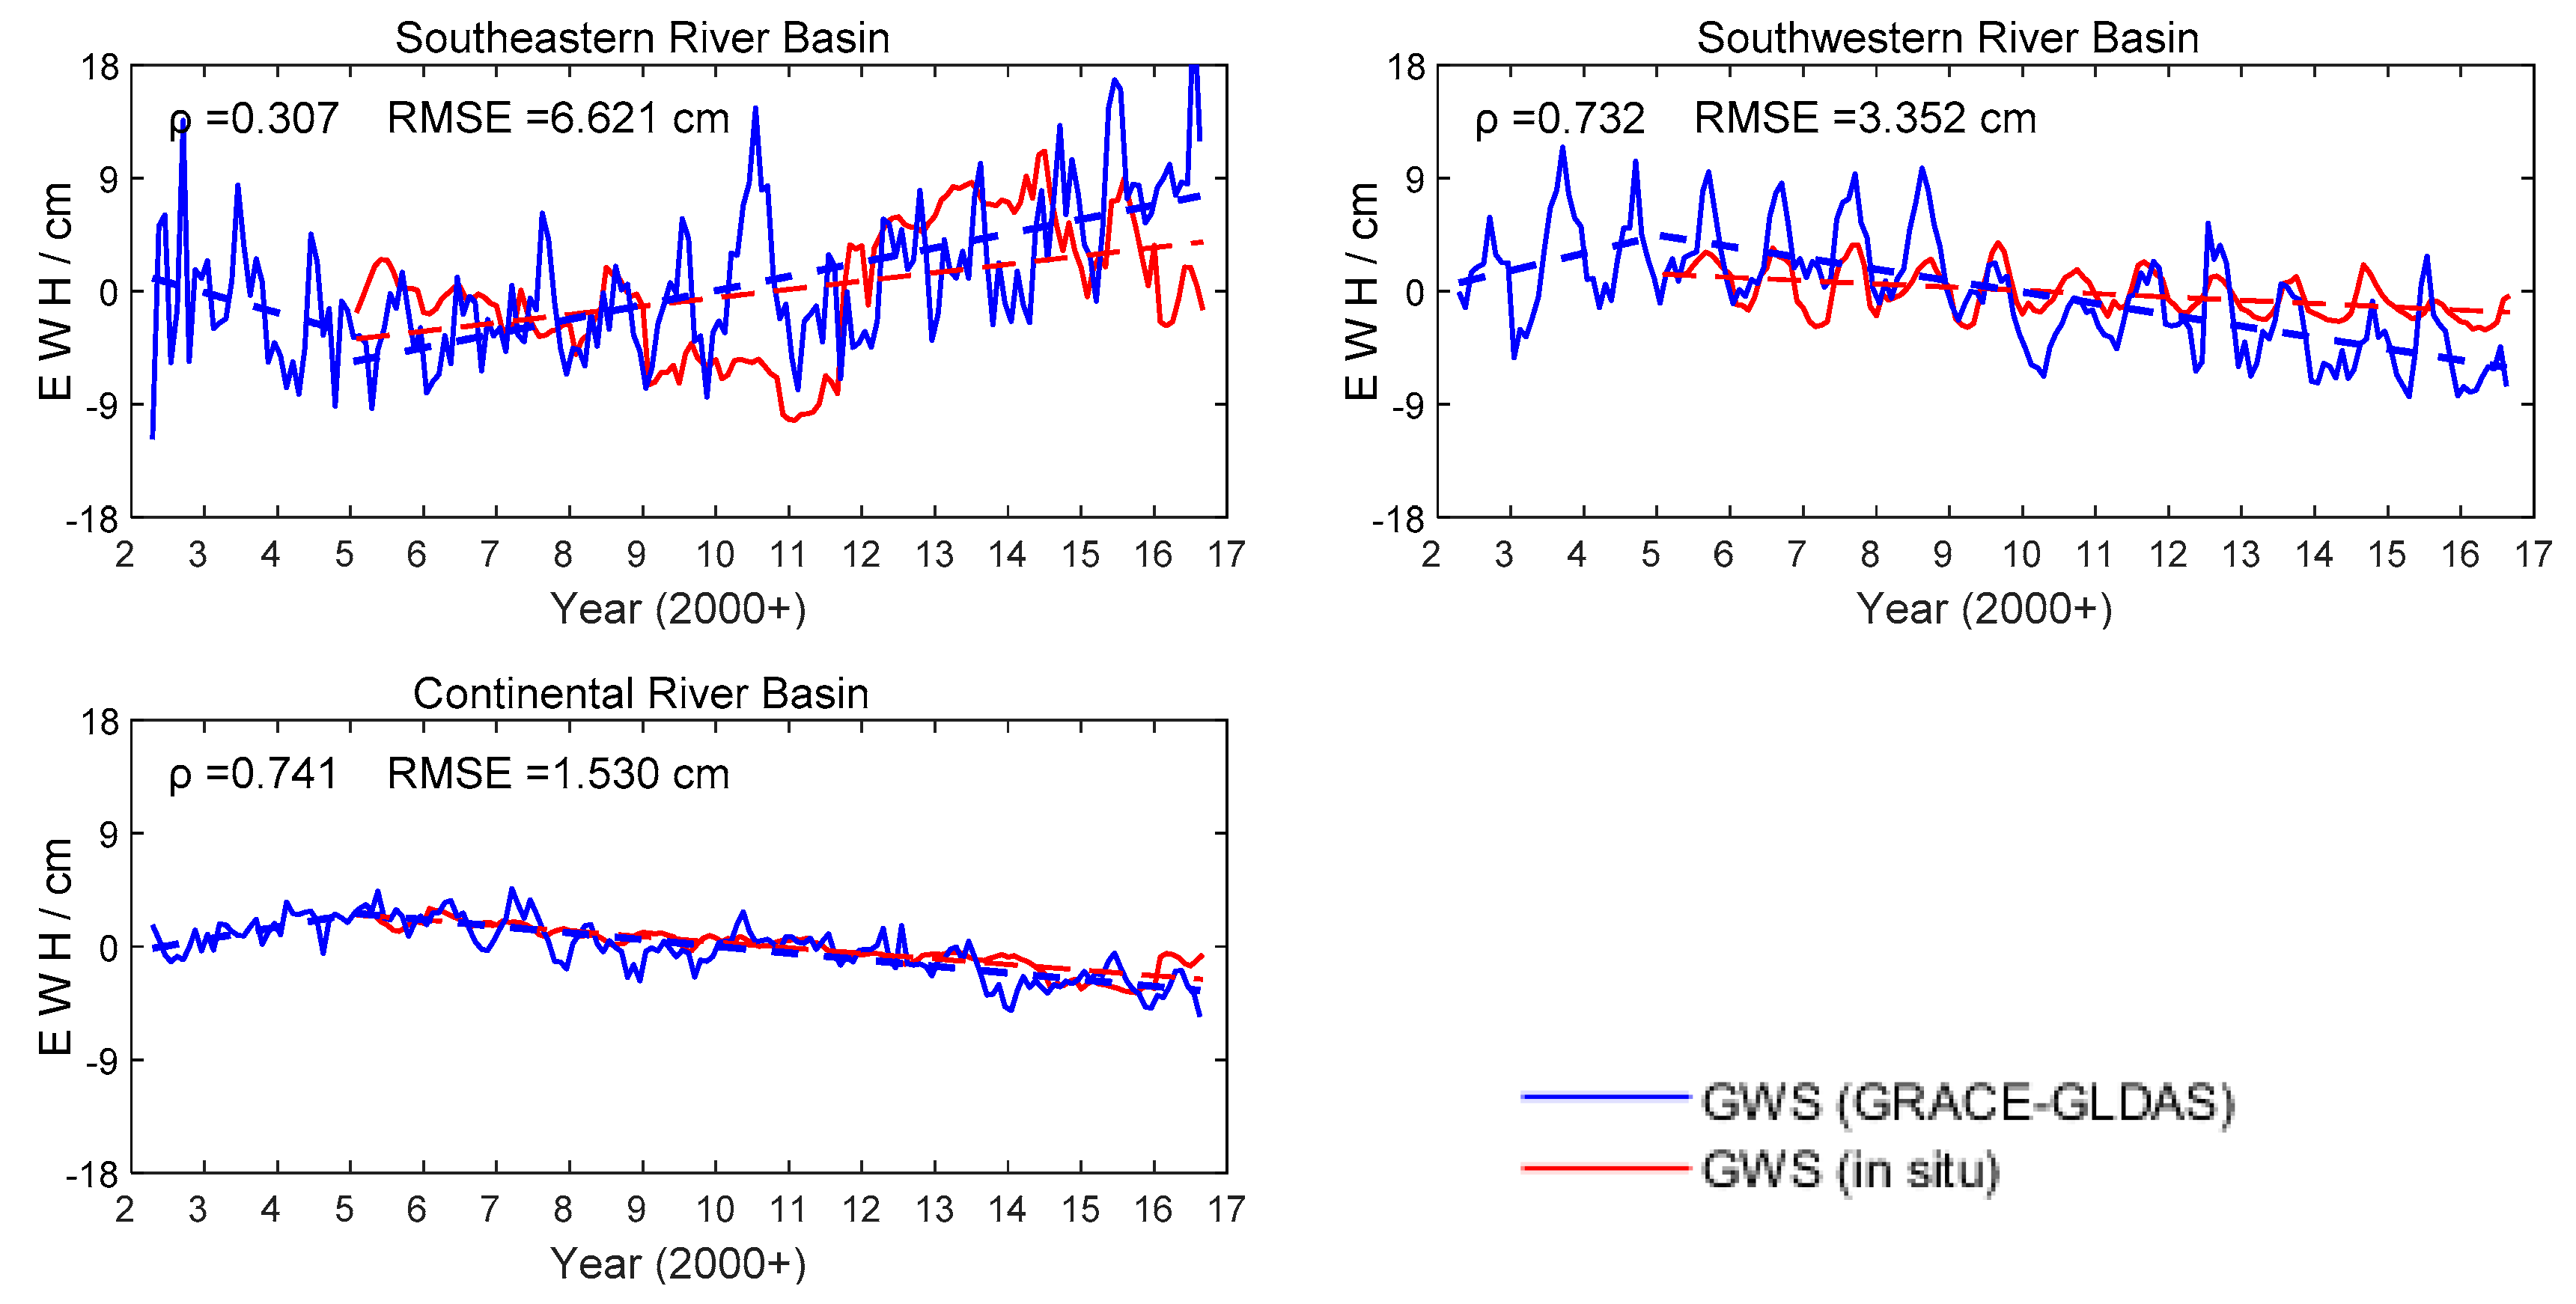
4.4. GWS Results from the GRACE Models and In-Situ Well Observations
5. Conclusions
Author Contributions
Funding
Institutional Review Board Statement
Informed Consent Statement
Data Availability Statement
Acknowledgments
Conflicts of Interest
References
- Tapley, B.D.; Bettadpur, S.; Watkins, M.; Reigber, C. The gravity recovery and climate experiment: Mission overview and early results. Geophys. Res. Lett. 2004, 31, L09607. [Google Scholar] [CrossRef] [Green Version]
- Mayer-Gürr, T.; Eicker, A.; Kurtenbach, E.; Ilk, K.-H. ITG-GRACE: Global Static and Temporal Gravity Field Models from GRACE Data. In System Earth via Geodetic-Geophysical Space Techniques; Flechtner, F.M., Gruber, T., Güntner, A., Mandea, M., Rothacher, M., Schöne, T., Wickert, J., Eds.; Springer: Berlin/Heidelberg, Germany, 2010; pp. 159–168. [Google Scholar]
- Kvas, A.; Behzadpour, S.; Ellmer, M.; Klinger, B.; Strasser, S.; Zehentner, N.; Mayer-Gürr, T. ITSG-Grace2018: Overview and Evaluation of a New GRACE-Only Gravity Field Time Series. J. Geophys. Res. Solid Earth 2019, 124, 9332–9344. [Google Scholar] [CrossRef] [Green Version]
- Chen, Q.; Shen, Y.; Chen, W.; Zhang, X.; Hsu, H.; Ju, X. A modified acceleration-based monthly gravity field solution from GRACE data. Geophys. J. Int. 2015, 202, 1190–1206. [Google Scholar] [CrossRef]
- Chen, Q.; Shen, Y.; Zhang, X.; Hsu, H.; Chen, W.; Ju, X.; Lou, L. Monthly gravity field models derived from GRACE Level 1B data using a modified short-arc approach. J. Geophys. Res. Solid Earth 2015, 120, 1804–1819. [Google Scholar] [CrossRef]
- Chen, Q.; Shen, Y.; Chen, W.; Francis, O.; Zhang, X.; Chen, Q.; Li, W.; Chen, T. An Optimized Short-Arc Approach: Methodology and Application to Develop Refined Time Series of Tongji-Grace2018 GRACE Monthly Solutions. J. Geophys. Res. Solid Earth 2019, 124, 6010–6038. [Google Scholar] [CrossRef]
- Zhou, H.; Luo, Z.; Li, Q.; Zhong, B. A new monthly gravity field model based on GRACE observations computed by the modified dynamic approach. In Proceedings of the AGU Fall Meeting, San Francisco, CA, USA, 12–16 December 2016. [Google Scholar]
- International Centre for Global Earth Models (ICGEM). Available online: http://icgem.gfz-potsdam.de/series (accessed on 20 April 2021).
- Save, H.; Bettadpur, S.; Tapley, B.D. High-resolution CSR GRACE RL05 mascons. J. Geophys. Res. Solid Earth 2016, 121, 7547–7569. [Google Scholar] [CrossRef]
- Wiese, D.N.; Landerer, F.W.; Watkins, M.M. Quantifying and reducing leakage errors in the JPL RL05M GRACE mascon solution. Water Resour. Res. 2016, 52, 7490–7502. [Google Scholar] [CrossRef]
- Ramillien, G.; Frappart, F.; Cazenave, A.; Güntner, A. Time variations of land water storage from an inversion of 2 years of GRACE geoids. Earth Planet. Sci. Lett. 2005, 235, 283–301. [Google Scholar] [CrossRef] [Green Version]
- Cazenave, A.; Nerem, R.S.; Johnson, K. Geophysics: Redistributing Earth’s Mass. Science 2002, 297, 783–784. [Google Scholar] [CrossRef]
- Cox, C.M.; Chao, B.F. Detection of a Large-Scale Mass Redistribution in the Terrestrial System Since 1998. Science 2002, 297, 831–833. [Google Scholar] [CrossRef] [Green Version]
- Rodell, M.; Velicogna, I.; Famiglietti, J.S. Satellite-based estimates of groundwater depletion in India. Nature 2009, 460, 999–1002. [Google Scholar] [CrossRef] [PubMed] [Green Version]
- Tiwari, V.M.; Wahr, J.; Swenson, S. Dwindling groundwater resources in northern India, from satellite gravity observations. Geophys. Res. Lett. 2009, 36. [Google Scholar] [CrossRef] [Green Version]
- Famiglietti, J.S.; Lo, M.; Ho, S.L.; Bethune, J.; Anderson, K.J.; Syed, T.H.; Swenson, S.C.; de Linage, C.R.; Rodell, M. Satellites measure recent rates of groundwater depletion in California’s Central Valley. Geophys. Res. Lett. 2011, 38. [Google Scholar] [CrossRef] [Green Version]
- Scanlon, B.R.; Longuevergne, L.; Long, D. Ground referencing GRACE satellite estimates of groundwater storage changes in the California Central Valley, USA. Water Resour. Res. 2012, 48. [Google Scholar] [CrossRef] [Green Version]
- Xiao, R.; He, X.; Zhang, Y.; Ferreira, V.; Chang, L. Monitoring Groundwater Variations from Satellite Gravimetry and Hydrological Models: A Comparison with in-situ Measurements in the Mid-Atlantic Region of the United States. Remote Sens. 2015, 7, 686–703. [Google Scholar] [CrossRef] [Green Version]
- Feng, W.; Wang, C.; Mu, D.; Zhong, M.; Zhong, Y.; Xu, H. Groundwater storage variations in the North China Plain from GRACE with spatial constraints. Chin. J. Geophys. 2017, 60, 1630–1642. [Google Scholar] [CrossRef]
- Feng, W.; Zhong, M.; Lemoine, J.-M.; Biancale, R.; Hsu, H.-T.; Xia, J. Evaluation of groundwater depletion in North China using the Gravity Recovery and Climate Experiment (GRACE) data and ground-based measurements. Water Resour. Res. 2013, 49, 2110–2118. [Google Scholar] [CrossRef]
- Gong, H.; Pan, Y.; Zheng, L.; Li, X.; Zhu, L.; Zhang, C.; Huang, Z.; Li, Z.; Wang, H.; Zhou, C. Long-term groundwater storage changes and land subsidence development in the North China Plain (1971–2015). Hydrogeol. J. 2018, 26, 1417–1427. [Google Scholar] [CrossRef] [Green Version]
- Tangdamrongsub, N.; Han, S.-C.; Tian, S.; Schmied, H.M.; Sutanudjaja, E.H.; Ran, J.; Feng, W. Evaluation of Groundwater Storage Variations Estimated from GRACE Data Assimilation and State-of-the-Art Land Surface Models in Australia and the North China Plain. Remote Sens. 2018, 10, 483. [Google Scholar] [CrossRef] [Green Version]
- The Resource and Environmental Science and Data Center. Available online: http://www.resdc.cn/ (accessed on 20 April 2021).
- Wahr, J.; Molenaar, M.; Bryan, F. Time variability of the Earth’s gravity field: Hydrological and oceanic effects and their possible detection using GRACE. J. Geophys. Res. Space Phys. 1998, 103, 30205–30229. [Google Scholar] [CrossRef]
- Rodell, M.; Houser, P.R.; Jambor, U.; Gottschalck, J.; Mitchell, K.; Meng, C.-J.; Arsenault, K.; Cosgrove, B.; Radakovich, J.; Bosilovich, M.; et al. The Global Land Data Assimilation System. Bull. Am. Meteorol. Soc. 2004, 85, 381–394. [Google Scholar] [CrossRef] [Green Version]
- Rodell, M.; Chen, J.; Kato, H.; Famiglietti, J.S.; Nigro, J.; Wilson, C.R. Estimating groundwater storage changes in the Mississippi River basin (USA) using GRACE. Hydrogeol. J. 2006, 15, 159–166. [Google Scholar] [CrossRef] [Green Version]
- Voss, K.A.; Famiglietti, J.S.; Lo, M.; de Linage, C.; Rodell, M.; Swenson, S.C. Groundwater depletion in the Middle East from GRACE with implications for transboundary water management in the Tigris-Euphrates-Western Iran region. Water Resour. Res. 2013, 49, 904–914. [Google Scholar] [CrossRef] [Green Version]
- China Institute of Geological Environment Monitoring (CIGEM). China Geological Environment Monitoring: Groundwater Yearbook; China Land Press: Beijing, China, 2016. [Google Scholar]
- Sun, A.Y.; Green, R.T.; Rodell, M.; Swenson, S.C. Inferring Aquifer Storage Parameters Using GRACE and In-Situ Measure-ment: Estimation Under Data Uncertainty (Invited). In Proceedings of the Agu Fall Meeting, San Francisco, CA, USA, 13–17 December 2010. [Google Scholar]
- Zhong, Y.; Zhong, M.; Feng, W.; Zhang, Z.; Shen, Y.; Wu, D. Groundwater Depletion in the West Liaohe River Basin, China and Its Implications Revealed by GRACE and In Situ Measurements. Remote Sens. 2018, 10, 493. [Google Scholar] [CrossRef] [Green Version]
- Xie, X.; Xu, C.; Wen, Y.; Li, W. Monitoring Groundwater Storage Changes in the Loess Plateau Using GRACE Satellite Gravity Data, Hydrological Models and Coal Mining Data. Remote Sens. 2018, 10, 605. [Google Scholar] [CrossRef] [Green Version]
- Zhang, T.; Zheng, G.; Zhang, Q. Analysis of water supply of groundwater parameters in Huaibei area of Anhui Province. Harnessing Huaihe River 2008, 10, 8. [Google Scholar]
- Chen, Z.; Zhang, X.; Ran, J.; Hu, B.; Zhou, B. Terrestrial Water Storage Changes in Pearl River Region Derived from the Latest Release Temporal Gravity Field Models. J. Geod. Geodyn. 2020, 40, 305–310. [Google Scholar]
- China Meteorological Data Network. Available online: http://data.cma.cn/ (accessed on 20 April 2021).
- Hao, Z.; Zhao, H.; Zhang, C.; Zhou, H.; Zhao, H.; Wang, H. Correlation Analysis Between Groundwater Decline Trend and Human-Induced Factors in Bashang Region. Water 2019, 11, 473. [Google Scholar] [CrossRef] [Green Version]
- Zhao, Y.; Zhu, J.; Yan, X.U.; Center, N.M. Establishment and assessment of the grid precipitation datasets in China for recent 50 years. J. Meteorol. Sci. 2014, 34, 414–420. [Google Scholar]
- Jekeli, C. Alternative Methods to Smooth the Earth’s Gravity Field; Ohio State University: Columbus, OH, USA, 1981. [Google Scholar]
- Duan, X.J.; Guo, J.Y.; Shum, C.K.; van der Wal, W. On the postprocessing removal of correlated errors in GRACE temporal gravity field solutions. J. Geod. 2009, 83, 1095–1106. [Google Scholar] [CrossRef] [Green Version]
- Swenson, S.; Wahr, J. Post-processing removal of correlated errors in GRACE data. Geophys. Res. Lett. 2006, 33. [Google Scholar] [CrossRef]
- Chen, J.L.; Wilson, C.R.; Li, J.; Zhang, Z. Reducing leakage error in GRACE-observed long-term ice mass change: A case study in West Antarctica. J. Geod. 2015, 89, 925–940. [Google Scholar] [CrossRef]
- Landerer, F.W.; Swenson, S.C. Accuracy of scaled GRACE terrestrial water storage estimates. Water Resour. Res. 2012, 48. [Google Scholar] [CrossRef]
- Nanteza, J.; de Linage, C.R.; Thomas, B.F.; Famiglietti, J.S. Monitoring groundwater storage changes in complex basement aquifers: An evaluation of the GRACE satellites over East Africa. Water Resour. Res. 2016, 52, 9542–9564. [Google Scholar] [CrossRef]
- Shamsudduha, M.; Taylor, R.G.; Longuevergne, L. Monitoring groundwater storage changes in the highly seasonal humid tropics: Validation of GRACE measurements in the Bengal Basin. Water Resour. Res. 2012, 48. [Google Scholar] [CrossRef] [Green Version]
- Bonsor, H.C.; Shamsudduha, M.; Marchant, B.P.; MacDonald, A.M.; Taylor, R.G. Seasonal and Decadal Groundwater Changes in African Sedimentary Aquifers Estimated Using GRACE Products and LSMs. Remote Sens. 2018, 10, 904. [Google Scholar] [CrossRef] [Green Version]
- Wu, Q.; Si, B.; He, H.; Wu, P. Determining Regional-Scale Groundwater Recharge with GRACE and GLDAS. Remote Sens. 2019, 11, 154. [Google Scholar] [CrossRef] [Green Version]
- Swenson, S.; Chambers, D.P.; Wahr, J. Estimating geocenter variations from a combination of GRACE and ocean model output. J. Geophys. Res. Solid Earth 2008, 113, 08410. [Google Scholar] [CrossRef] [Green Version]
- Cheng, M.; Ries, J.C.; Tapley, B.D. Variations of the Earth’s figure axis from satellite laser ranging and GRACE. J. Geophys. Res. Space Phys. 2011, 116. [Google Scholar] [CrossRef] [Green Version]
- Cheng, M.; Ries, J. The unexpected signal in GRACE estimates of C20C20. J. Geod. 2017, 91, 897–914. [Google Scholar] [CrossRef]
- Paulson, A.; Zhong, S.; Wahr, J. Inference of mantle viscosity from GRACE and relative sea level data. Geophys. J. Int. 2007, 171, 497–508. [Google Scholar] [CrossRef] [Green Version]
- Chen, J.L.; Wilson, C.R.; Famiglietti, J.S.; Rodell, M.; Rodell, M. Attenuation effect on seasonal basin-scale water storage changes from GRACE time-variable gravity. J. Geod. 2006, 81, 237–245. [Google Scholar] [CrossRef] [Green Version]
- Tang, Q.; Zhang, X.; Tang, Y. Anthropogenic impacts on mass change in North China. Geophys. Res. Lett. 2013, 40, 3924–3928. [Google Scholar] [CrossRef]
- Ding, Y.; Huang, X.; Wang, Z.; Li, Y. Situation of water resources development and utilization in Songliao basin in recent ten years. Water Resour. Hydropower Northeast 2014, 32, 32–34. [Google Scholar]
- Ministry of Water Resources of the People’s Republic of China. Available online: http://www.mwr.gov.cn/sj/#tjgb (accessed on 20 April 2021).
- Zhao, J.; Liu, C.; Wang, G.; Jin, J.; Liu, Y.; Bao, Z. Evolution of Stream Flow in the Yellow River during the Past 60 Years and Its Response to Climate Change. J. N. China Univ. Water Resour. Electr. Power (Nat. Sci. Ed.) 2018, 39, 01–05. [Google Scholar]
- Luo, Z.; Yao, C.; Li, Q.; Huang, Z. Terrestrial water storage changes over the Pearl River Basin from GRACE and connections with Pacific climate variability. Geod. Geodyn. 2016, 7, 171–179. [Google Scholar] [CrossRef] [Green Version]
- Gao, G.; Xu, C. Characteristics of water surplus and deficit change in 10 major river basins in China during 1961–2010. Acta Geogr. Sin. 2015, 70, 380–391. [Google Scholar]
- Huang, T.; Pang, Z.; Edmunds, W.M. Soil profile evolution following land-use change: Implications for groundwater quantity and quality. Hydrol. Process. 2013, 27, 1238–1252. [Google Scholar] [CrossRef]
- Feng, W. GRAMAT: A comprehensive Matlab toolbox for estimating global mass variations from GRACE satellite data. Earth Sci. Inform. 2018, 12, 389–404. [Google Scholar] [CrossRef]


| River Basin | Area\104 km2 | Vegetation | Climate |
|---|---|---|---|
| SLRB | ~123.76 | farmland, forest | Temperate monsoon climate |
| YERB | ~80.89 | farmland, grassland | Temperate monsoon climate, Temperate continental climate |
| HARB | ~31.69 | farmland, forest | Temperate monsoon climate, Temperate continental climate |
| HURB | ~32.38 | farmland | Temperate monsoon climate |
| YARB | ~179.81 | farmland, forest | Subtropical monsoon climate |
| PERB | ~56.90 | forest | Subtropical monsoon climate |
| SERB | ~23.72 | farmland, forest | Subtropical monsoon climate |
| SWRB | ~85.26 | forest, grassland | Subtropical monsoon climate, Highland climate |
| CORB | ~333.89 | grassland, desert | Highland Climate, Temperate continental climate |
| River Basin | Number | S | River Basin | Number | S | River Basin | Number | S |
|---|---|---|---|---|---|---|---|---|
| SLRB | 76 | 0.04 | HURB | 81 | 0.03 | SERB | 4 | 0.03 |
| YERB | 72 | 0.03 | YARB | 51 | 0.03 | SWRB | 10 | 0.03 |
| HARB | 15 | 0.06 | PERB | 13 | 0.03 | CORB | 27 | 0.01 |
| River Basin | Scale Factor | |||
|---|---|---|---|---|
| 150 km | 200 km | 250 km | 300 km | |
| SLRB | 1.048 | 1.081 | 1.121 | 1.166 |
| YERB | 1.036 | 1.060 | 1.087 | 1.116 |
| HARB | 1.073 | 1.120 | 1.173 | 1.230 |
| HURB | 1.144 | 1.247 | 1.371 | 1.506 |
| YARB | 1.014 | 1.022 | 1.030 | 1.034 |
| PERB | 1.082 | 1.136 | 1.195 | 1.257 |
| SERB | 1.101 | 1.171 | 1.253 | 1.345 |
| SWRB | 0.961 | 0.939 | 0.920 | 0.906 |
| CORB | 0.981 | 0.972 | 0.966 | 0.963 |
| River Basin | Tongji-Grace2018 | GLDAS | Precipitation | ||||||
|---|---|---|---|---|---|---|---|---|---|
| Annual Amplitude/mm | Annual Phase/° | Annual Amplitude/mm | Annual Phase/° | Tongji- Grace2018 & GLDAS 1 | Annual Amplitude/mm | Annual Phase/° | Tongji- Grace2018 & Precipitation 1 | Time Lag/Month 2 | |
| SLRB | 9.0 | 151.9 | 1.3 | 268.0 | 0.79 | 53.7 | 195.3 | 0.24 | +1.5 |
| YERB | 10.2 | 283.7 | 12.8 | 308.5 | 0.55 | 47.1 | 203.8 | 0.07 | 2.6 |
| HARB | 29.5 | 311.9 | 13.2 | 299.7 | 0.35 | 55.0 | 201.5 | −0.08 | 3.7 |
| HURB | 31.1 | 298.1 | 24.3 | 284.4 | 0.81 | 74.0 | 197.4 | 0.17 | 3.2 |
| YARB | 44.8 | 222.4 | 19.5 | 208.2 | 0.78 | 74.3 | 183.5 | 0.62 | 1.3 |
| PERB | 74.8 | 230.5 | 53.9 | 200.6 | 0.85 | 113.4 | 178.6 | 0.49 | 1.7 |
| SERB | 48.1 | 176.9 | 41.4 | 154.1 | 0.76 | 93.3 | 163.9 | 0.62 | 0.5 |
| SWRB | 80.1 | 243.0 | 48.9 | 254.6 | 0.61 | 65.1 | 197.9 | 0.54 | 1.5 |
| CORB | 10.0 | 186.6 | 6.4 | 125.0 | 0.19 | 19.5 | 197.5 | 0.51 | +0.4 |
Publisher’s Note: MDPI stays neutral with regard to jurisdictional claims in published maps and institutional affiliations. |
© 2021 by the authors. Licensee MDPI, Basel, Switzerland. This article is an open access article distributed under the terms and conditions of the Creative Commons Attribution (CC BY) license (https://creativecommons.org/licenses/by/4.0/).
Share and Cite
Chen, Z.; Zhang, X.; Chen, J. Monitoring Terrestrial Water Storage Changes with the Tongji-Grace2018 Model in the Nine Major River Basins of the Chinese Mainland. Remote Sens. 2021, 13, 1851. https://0-doi-org.brum.beds.ac.uk/10.3390/rs13091851
Chen Z, Zhang X, Chen J. Monitoring Terrestrial Water Storage Changes with the Tongji-Grace2018 Model in the Nine Major River Basins of the Chinese Mainland. Remote Sensing. 2021; 13(9):1851. https://0-doi-org.brum.beds.ac.uk/10.3390/rs13091851
Chicago/Turabian StyleChen, Zhiwei, Xingfu Zhang, and Jianhua Chen. 2021. "Monitoring Terrestrial Water Storage Changes with the Tongji-Grace2018 Model in the Nine Major River Basins of the Chinese Mainland" Remote Sensing 13, no. 9: 1851. https://0-doi-org.brum.beds.ac.uk/10.3390/rs13091851