Multi-Scale Fused SAR Image Registration Based on Deep Forest


1
Key Laboratory of Intelligent Perception and Image Understanding of Ministry of Education, International Research Center for Intelligent Perception and Computation, Joint International Research Laboratory of Intelligent Perception and Computation, School of Artificial Intelligence, Xidian University, Xi’an 710071, China
2
JD Finance America Corporation, 675 E Middlefield Rd, Mountain View, CA 94043, USA
*
Author to whom correspondence should be addressed.
Remote Sens. 2021, 13(11), 2227; https://0-doi-org.brum.beds.ac.uk/10.3390/rs13112227
Submission received: 9 April 2021
/
Revised: 19 May 2021
/
Accepted: 28 May 2021
/
Published: 7 June 2021
Abstract
:SAR image registration is a crucial problem in SAR image processing since the registration results with high precision are conducive to improving the quality of other problems, such as change detection of SAR images. Recently, for most DL-based SAR image registration methods, the problem of SAR image registration has been regarded as a binary classification problem with matching and non-matching categories to construct the training model, where a fixed scale is generally set to capture pair image blocks corresponding to key points to generate the training set, whereas it is known that image blocks with different scales contain different information, which affects the performance of registration. Moreover, the number of key points is not enough to generate a mass of class-balance training samples. Hence, we proposed a new method of SAR image registration that meanwhile utilizes the information of multiple scales to construct the matching models. Specifically, considering that the number of training samples is small, deep forest was employed to train multiple matching models. Moreover, a multi-scale fusion strategy is proposed to integrate the multiple predictions and obtain the best pair matching points between the reference image and the sensed image. Finally, experimental results on four datasets illustrate that the proposed method is better than the compared state-of-the-art methods, and the analyses for different scales also indicate that the fusion of multiple scales is more effective and more robust for SAR image registration than one single fixed scale.
1. Introduction
Synthetic Aperture Radar (SAR) [1,2] is of the characteristics of all-day, all-weather, high-resolution imaging, compared with infrared imaging and optical imaging. Based on these characteristics, SAR image processing has drawn much attention in military and civilian fields [3,4]. In particular, it is necessary to simultaneously analyze and process two or more SAR images in some problems of SAR image processing, such as SAR image change detection [5,6,7], SAR image fusion [8,9], object detection of SAR image [10,11], etc. However, the analyzed multiple SAR images are generally captured under different conditions, such as different SAR sensors, different viewpoints, different times, etc., which causes the captured multiple SAR images to be diverse, even for the same scene. Moreover, different imaging algorithms also result in diverse SAR images, such as BP [12], RD [13], compressive sensing based approach [14], etc., and SAR imagery may be unfocused by the motion errors [15,16]. Therefore, SAR image registrations are significant for some problems that need to process two SAR images at the same time. For example, the registration accuracy of the unchanged SAR image and the changed SAR image directly affect the performance of SAR image change detection.
SAR image registration [17,18] is to geometrically align two different SAR images based on the geometric transformation model determined by exploring the correspondence between two images, where two SAR images are captured for one same scene under different conditions. For these two images, one is regarded as the reference image, and the other is regarded as the sensed image. In general, the classical geometric transformation models include rigid transformation, affine transformation, projective transformation and non-linear transformation [19], where different transformation models have different transformation formulas. In this paper, we will focus on SAR image registration based on the affine transformation model.
In recent decades, many registration methods [20,21,22,23] have been proposed and have greatly promoted the development of registration technology. In view of the popularity of deep learning, we roughly divide existing methods of SAR image registration into two kinds: Traditional SAR image registration methods and deep learning-based SAR image registration methods. Traditional SAR image registration methods [21,24] mainly include area-based methods and feature-based methods. The area-based image registration methods focus on searching the best parameters of geometric transformation by employing the gray information of the image, such as the normalized intercorrelation method [25], the mutual information method [26], the Fourier transform domain method [27], etc. Chen et al. [28] proposed the mutual information method which uses information entropy as a measure of the matching criterion of two images and the image block with the largest mutual information value was regarded as the best matched image pair. Wang et al. [29] proposed a registration method by improving the normalized cross-correlation method for homologous SAR images. In short, the area-based methods are easily implemented and the computational process is simple since it directly uses the grayscale information of the image.
Compared with the area-based strategy, the feature-based strategy is more widely used in SAR image registration, which focuses on finding the geometric correspondence by utilizing stable features in two images to match them, such as points, lines, edges, or regions. Commonly, there are alignment algorithms based on Harris [30], scale-invariant feature transform (SIFT) [31], etc. SIFT has been widely employed in image registration since the SIFT feature descriptor has the advantages of invariance to grayscale changes, rotation, scaling and even affine transformation. Ke et al. [32] proposed PCA-SIFT to solve the problem of high dimensionality of SIFT feature descriptors. For the characteristics of SAR coherent speckle noise, Dellinger et al. [33] proposed SAR-SIFT by combining the advantages of SIFT and Harris key point detection algorithm to improve the performance of SAR image registration. Since the feature-based methods utilize distinctive features, they are more effective than the area-based methods. However, due to the specificity of the SAR imaging mechanism, its speckle noise has an impact on the performance of the area-based and feature-based methods. This indicates that the traditional image registration techniques are insufficient to provide preciser auxiliary for other problems of SAR image processing.
Recently, Deep Learning (DL) [34] has made great progress in the field of image processing. Considering that its excellent performance in computer vision [35], deep learning also has been used in SAR image classification [36,37], object recognition of SAR images [38], SAR image segmentation [39], change detection of SAR images [5,6,7], SAR image registration [40], etc. For the SAR image registration, many proposed methods [40,41,42] have demonstrated the availability of deep features. In most existing methods, the problem of image registration is converted to a classification problem with two categories (matching image patches and mismatching image patches), where deep network is trained based on given matching and mismatching image patches. Han et al. [43] proposed the Siamese network which extracted features from two identical CNN convolutional networks to obtain the matching relationship of image patches. Wang et al. [42] proposed a self-learning convolutional neural network-based alignment method with high registration accuracy. As we know, the excellent performance of deep learning is achieved based on a mountain of training samples in general, which means a lot of pair image patches should be given as the training samples for DL-based SAR image registration. However, compared to natural images, it is tough to obtain a mass of annotated training samples in SAR image registration, since manually annotating pair image patches (especially matching image patches) is very time consuming for SAR images, and noisy labels are easily produced in the processing of manual annotations.
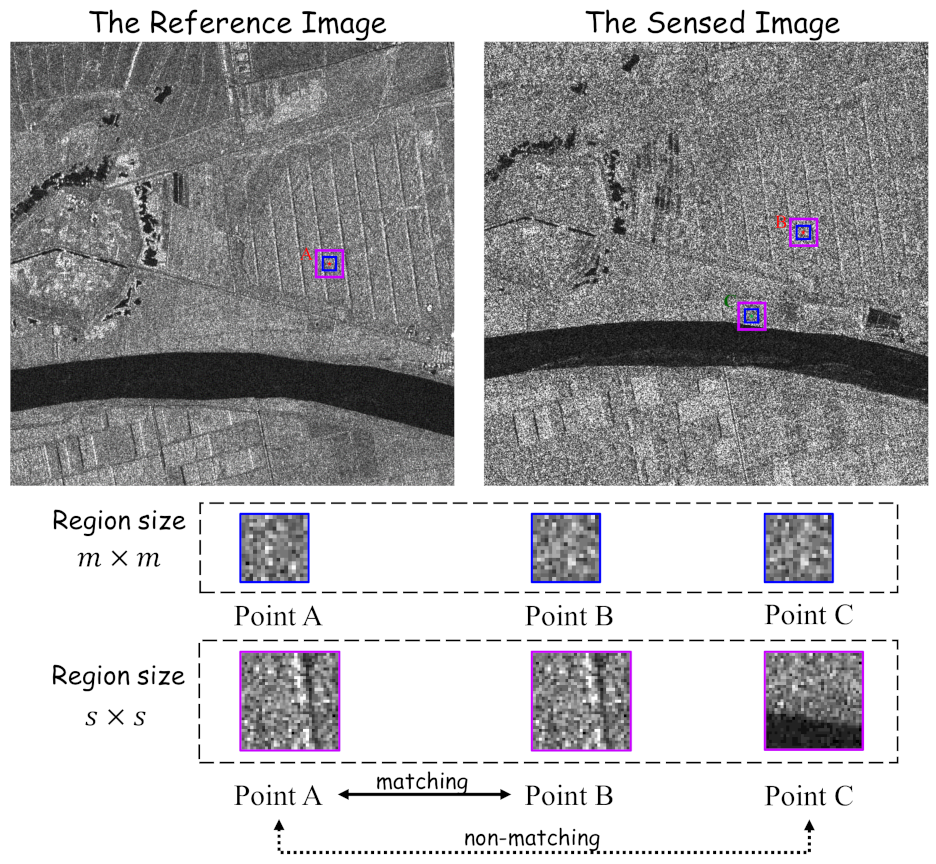
Moreover, most studies of DL-based SAR image registration regard image patches with a fixed size as one sample to represent a matching point in general, whereas the information contained in patches with different sizes may be diverse in practice; an illustration is shown in Figure 1, where the left image is the reference image and the right is the sensed image. In two SAR images, we give three points: The point A is in the reference image, and the points B and C are in the sensed image. Noticeably, point B (labeled in red) is matched with point A (labeled in red), but point C (labeled in green) is not matched with A. For each point, region patches with two different sizes (m and s) are given to represent the corresponding points, respectively, where the region in the blue box corresponds to the size and the region in the purple box corresponds to the size . Obviously, it is seen that patches with different sizes contain diverse information. If the patch with is used to represent one point, the patch of A is similar to both patches of B and C. If using the size s, the patch of A is similar to B but different from C. Actually, point A is actually matched with point B and not matched with point C. This indicates that the size of image patches may directly affect the confidence level of matching prediction and one fixed size is insufficient for DL-based SAR image registration, whereas, in practice, it is tough to determine which size is more suitable for improving the accuracy of SAR image registration because of the complexity of SAR images.
Based on the analyses mentioned above, we propose a new method—a multi-scale fusion SAR image registration framework based on deep forest—in this paper. In the proposed method, the self-learning method is firstly utilized to generate pair matching and non-matching image blocks with multiple scales based on the key points of the reference image and its transformed image, and the generated pair image blocks are used to construct multi-scale training sets. Then, the diversity map between pair image blocks is obtained as the input sample to train multiple binary classification models via deep forest. Finally, a multi-scale fusion strategy is proposed to integrate the multiple predictions and obtain the best pair matching points between the reference image and the sensed image. Experimental results indicate the proposed method can obtain better registration performance compared with the state-of-the-art methods. The analyses for the performance corresponding to different scales of image blocks also illustrate that the fusion of multiple scales is more effective and robust for SAR image registration than the single fixed scale.
2. The Proposed Method
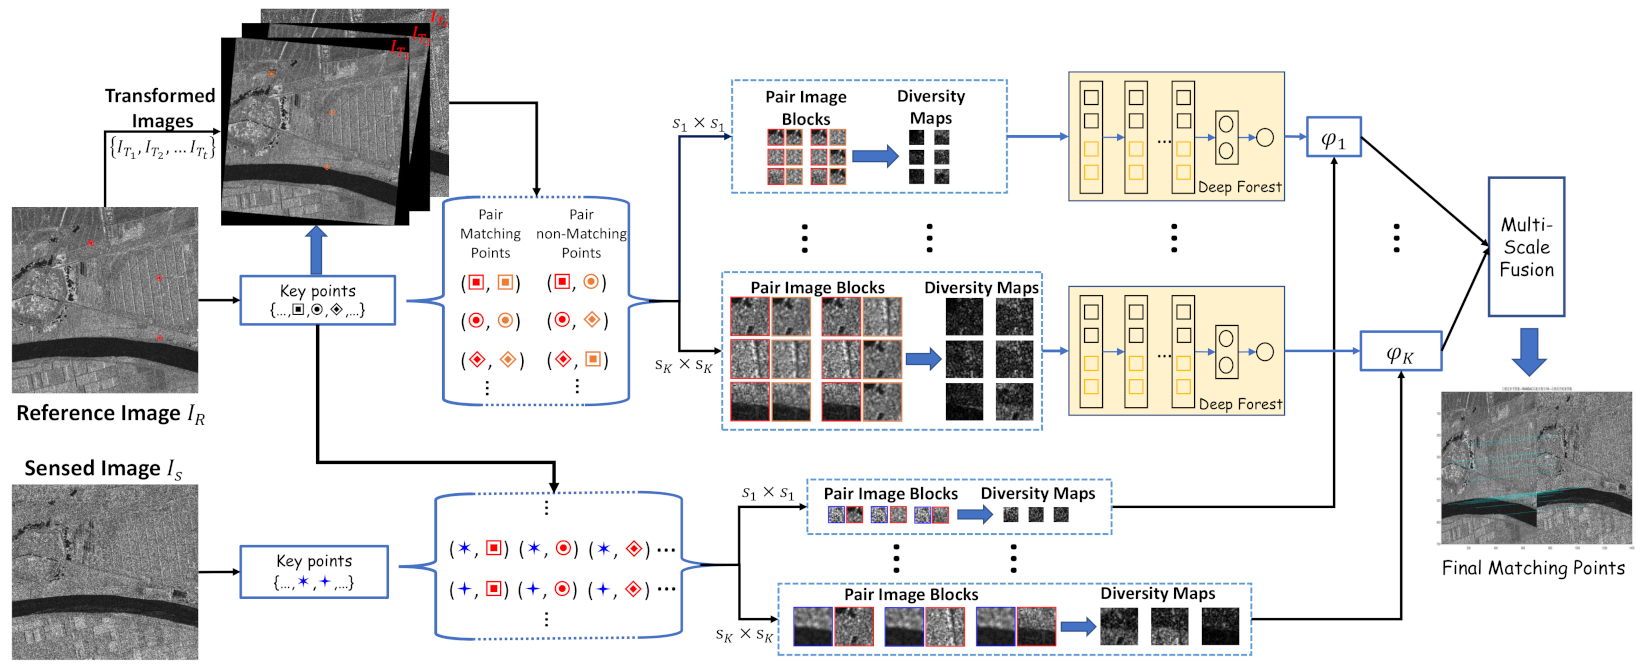
In this paper, we propose a multi-scale fused SAR image registration method based on deep forest; the framework of the proposed method is shown in Figure 2. As shown in Figure 2, the proposed method is mainly composed of three parts: Constructing multi-scale training sets, training the matching model, and multi-scale fusion. First, the part of constructing multi-scale training sets focuses on generating training samples based on the obtained key points between the reference image and its transformed image with different sizes of image blocks corresponding to key points. Second, the image registration is considered as a binary classification problem, and multiple matching models are trained by deep forest based on the constructed multi-scale training sets. Meanwhile, multiple different predictions are obtained by multiple matching models. Finally, a multi-scale fusion strategy is proposed to combine the obtained multiple predictions for SAR image registration. As follows, the details of three parts will be introduced, respectively. Before introducing the proposed method, we show some descriptions for deep forest in the first sub-section.
2.1. Deep Forest
Deep Forest [44] was proposed by Zhou et al. in 2018, and is a new deep model based on random forest [45] and is different from deep neural network. Random forest is a classical method of ensemble learning [46,47,48,49] where multiple decision trees are constructed and combined, and where the training samples and features are randomly selected to generate each decision tree. Deep forest is mainly composed of two parts: Multi-granularity scanning and cascaded forest structure. The most critical part is the cascade forest structure, where each layer of the cascade forest structure includes two completely random tree forests and two random forests and then each forest generates a class vector. A performance test is done at the end of one level, and if there is a significant performance improvement, then the next level is generated, otherwise the training is terminated. Since the number of layers of cascaded forest structure is self-adjusting, deep forest works well on small sample tasks. When training the model, there is no need to set hyperparameters and just adjust a few parameters. We use the difference feature vector of the image pair as the input feature, whose size is . The output of the network is the corresponding matching labels. We consider that if centroids of two image blocks are corresponding, then their matching labels are given as 1, otherwise the labels are given as 0.
In recent years, random forest has been applied in the field of remote sensing image processing [50,51]. For example, Pierce et al. [52] used a random forest algorithm to prevent forest fires, which reduced the occurrence of fires to a certain extent. Zou et al. [53] proposed a random clustered forest algorithm which solved the problem of terrain classification of polarimetric SAR. Ma et al. [54] proposed a SAR image change detection method based on deep forest, which adequately obtained useful information from the local image blocks and significantly improved the detection accuracy. However, to the best of our knowledge, random forest is not used on the SAR image registration task. In this paper, we utilize deep forest to improve the registration performance of SAR images.
2.2. Constructing Multi-Scale Training Sets
At present, most methods of DL-based image registration utilize the obtained key points in the reference image to construct the training set, where an image block with a fixed scale is captured to represent a key point. The classical strategy of setting the size of the image block is to select a size corresponding to the best registration performance from several different sizes as the final fixed size. As shown in Figure 1, it illustrates that the information contained in image blocks of different sizes corresponding to one key point is diversity, which indicates only using the image block with a fixed size is insufficient to characterize the neighborhood information of one key point. Moreover, it is tough to find a suitable size for different remote sensing images, and the robustness of the SAR image registration method is reduced.
Based on this, we utilize multi-scale information of image blocks corresponding to key points to construct training sets with multiple scales. In this part, the self-learning strategy [42] is employed to produce the pair image blocks from the reference image and its transformed images, considering that it is a benefit to obtain sufficient pair image blocks with accurate labels. Differently from [42], we construct a pair of training samples based on multiple scales. Note that multiple transformation strategies are employed to obtain invariant transformed images of the reference image in terms of rotation, scale, and translation.
Given a reference SAR image and the multiple scales . First, the reference image is transformed by the given t transformation matrices , respectively, and the transformed images are obtained. Second, a traditional local feature point extraction method (Scale-Invariant Feature Transform, SIFT [27]) is used to find m key points in the reference image , . For each key point (), it is of one and only matching points and gains non-matching points in each transformed image .
Then, based on a scale , image blocks and with are captured from and , corresponding to the key point , respectively. Combining with the obtained pair matching points in and , a pair of matching image blocks are obtained corresponding to , denoted as . Similarly, a pair of non-matching image blocks are obtained corresponding to , denoted as where and . Thus, for a scale , matching pair image blocks are obtained while non-matching pair image blocks are given. Noticeably, in order to construct a class-balanced training set, the non-matching image blocks are given by randomly selecting one point from non-matching points, and only non-matching pair image blocks are used to construct the training sets. Finally, all matching pair image blocks and non-matching pair image blocks are used as the training set , corresponding to one scale , where the pair matching image blocks are regarded as the positive instances and the pair non-matching image blocks are regarded as the negative instances.
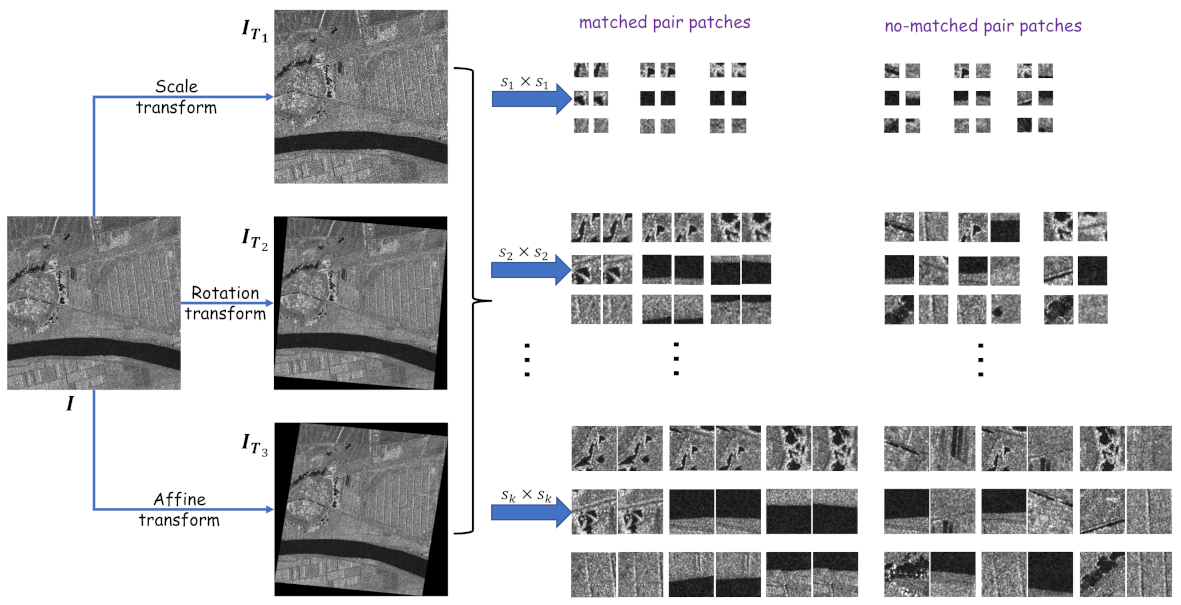
A simple example is shown in Figure 3. In Figure 3, the reference SAR image is firstly transformed based on three affine transformation strategies: The scale transformation , the rotation transformation and the affine transformation , respectively, and three transformed SAR images (, and ) are obtained. Then, nine key points are obtained by SIFT for the reference image . According to nine key points, a pair of matching image blocks and a pair of non-matching image blocks are captured with the scale from and , respectively, where the centre of the image block is located in their corresponding key point. As shown in Figure 3, nine pairs of matching image blocks and nine pairs of non-matching image blocks are obtained for each scale.
From the above, it is known that the training set is constructed based on the reference image and its transformed image. Differently from the training set, the testing set of SAR image registration is constructed based on the sensed image and the reference image. Similarly to the reference image , N key points are firstly obtained from the sensed image by SIFT. Then, based on M key points of and N key points of , each key point of is paired with all key points of , and pair image blocks with each scale are obtained. Finally, diversity maps with the size are given as the testing set with the scale , without given labels.
2.3. Training Matching Model
In general, the problem of SAR image registration is converted into a binary classification problem in learning-based SAR image registration, where the pair of matching image blocks are regarded as the positive instances and the pair of non-matching image blocks are regards as the negative instances. According to the part of constructing multi-scale training sets, we can obtain m pair matching image blocks as the positive instances and pair non-matching image blocks as the negative instances in each scale. Noticeably, in order to construct a class-balanced training set, we set . However, it is known that the number m of key points obtained by SIFT is limited, which means a mass of pairs image blocks are not competently generated, especially pair matching image blocks. Based on this, we apply deep forest [44] as the basic classification model to training multiple matching models, considering that deep forest is more effective for the training set with a small size compared with deep neural network.
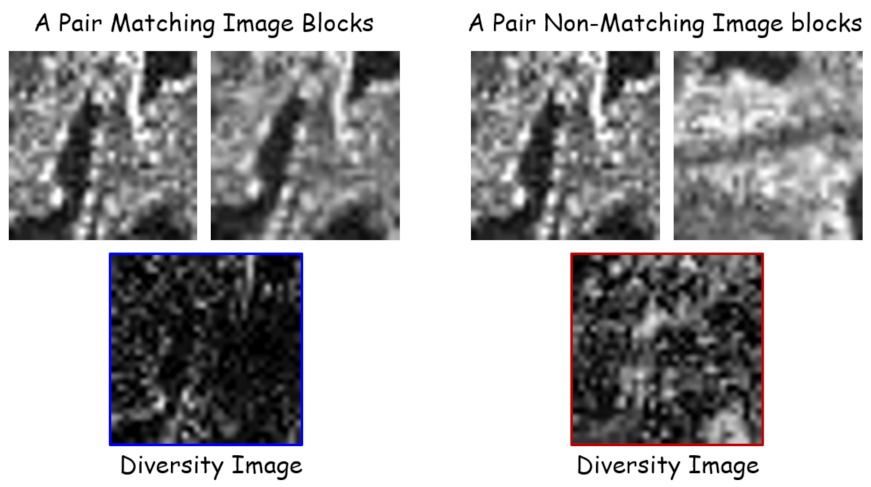
According to the constructed multi-scale training sets, we utilizes the diversity map between a pair of image blocks to represent the input corresponding to one pair image blocks, and all pixel values of the diversity map are cascaded as a sample of training the classification model. For instance, a pair of matching image blocks with were obtained, and then the diversity map is given by subtracting the pixel value of from the pixel value of . In particular, the diversity map is vectorized as a vector with the size , and the vector is regarded as a training sample belonging to the positive category and its label is . Similarly, for a pair of non-matching image blocks , their diversity map is obtained and vectorized as the vector belonging to the negative category, and its label is . Figure 3 shows an example of diversity maps corresponding to a pair matching image blocks and a pair non-matching image blocks from YellowR1 data, respectively. From Figure 4, it is seen that the diversity map is darker since the similarity between pair matched image blocks is higher. In contrast, the difference maps of the non-matched image pairs are a bit brighter.
In the training process of deep forest, the key is to train the cascade forest structure, where each layer includes two completely random tree forests and two random forests. Therefore, for the training set with , a two-dimensional class vector is obtained by four random forests, respectively, where and express the probability that the sample is classified into the positive category and the negative category, respectively, . Finally, the output class vector is obtained by averaging these four class vectors, and the prediction label is the category with the largest class distribution on the final class vector, shown as the following formulas:
and
By the above formulas, it is known that if a sample is classified into the positive category (), its corresponding pair image blocks are matched. Otherwise, the corresponding pair image blocks are not matched.
According to parts of constructing multi-scale training sets, K training sets with multiple scales are constructed and trained, respectively. Based on K training sets with different scales, K classification models are trained and denoted as . Then, the prediction of a diversity image is obtained by each model (). Algorithm 1 shows the procedure of training matching models based on multi-scale training sets.
| Algorithm 1 The Procedure of Traing Matching Models. |
| Input: The constructed multi-scale training sets: where . belongs to the positive category and belongs to the negative category, where and . Initial predictive vector for each sample is the null set ∅, where . Output: K training models corresponding to multiple scales: .
|
2.4. Multi-Scale Fusion
For the generated K training models with multiple scales, we propose a multi-scale fusion strategy for SAR image registration to fuse the predictions corresponding to multiple scales, to more effectively utilize the complementation of multiple scales. By K training models, a set of predictions is gained for K testing sets with different scales .
Due to the remote sensing imaging mechanism and the use of image block matching, for each point of the sensed image , more than one pair key points may be classified as 1. However, theoretically, only one point (or zero) of is matched with each point of . This means that some pseudo-matching predictions are given by , , and the pseudo-matching predictions are not conducive to the calculation of the final transformation matrix. Therefore, our fusion strategy is composed of local constraint, multiple scales union and global constraint to delete pseudo-matching points, and the details are shown as follows.
Local Constraint: Normalized Cross Correlation (NCC) [55] refers to the similarity between two image blocks by calculating the pixel intensity. In our method, the image block with the largest NCC value is regarded as the final matched image pair, and the value c of NCC is calculated by the following formula:
where is the image block with the scale corresponding to the key point of the sensed image , and is the image block with the scale corresponding to the key point of the sensed image . and express the gray values of the image block and located at , respectively. and are average gray values of image blocks and , respectively.
Multiple Scales Union: By the part of local constraint, we obtain sets of matched image pairs for each scale , and then all sets of pair matching points corresponding to all scales are integrated and the final matching points are given by
where K is the number of scales.
Global Constraint: We use RANdom SAmple Consensus Algorithm (RANSAC) [56] to remove the imprecise matched points by iteratively selecting a random subset of matched points to estimate the performance of the current model. Finally, w pair matched points are obtained from G. Based on w pair matched points, the transformation matrix between the reference SAR image and the sensed SAR image is calculated [19] by the following formula:
where is the coordinate of a key point from , is the coordinate of the point by affine transformation, and its transformation matrix is given by
3. Experimental Results and Analyses
In this section, we will validate the performance of the proposed method from several items: (1) The comparison performance of our method with the state-of-the-art methods on four datasets of SAR image registration; (2) the visualization on the chessboard diagram of SAR image registration; (3) the analysis on the performance obtained based on different scales. As follows, we will firstly introduce experimental datasets and settings.
3.1. Experimental Data and Settings
In our experiments, four data of SAR images are used to test the performance, captured by Radarsat-2 and ALOS-PALSAR, respectively. Four datasets are Wuhan Data, YellowR1 Data, Australia-Yama Data and YellowR2 Data, and their detailed descriptions are given as:
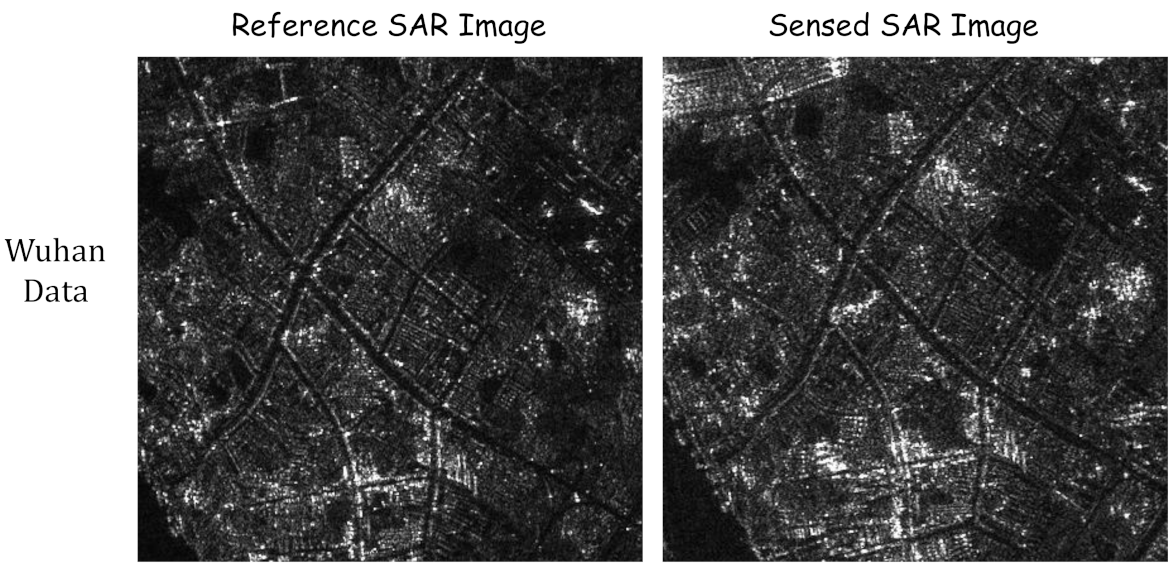
- Two SAR images of Wuhan Data were collected by the ALOS-PALSAR satellite on 4 June 2006 and 7 March 2009 in Wuhan, China, respectively, shown in Figure 5. The size of two images is and the resolution is 10 m.
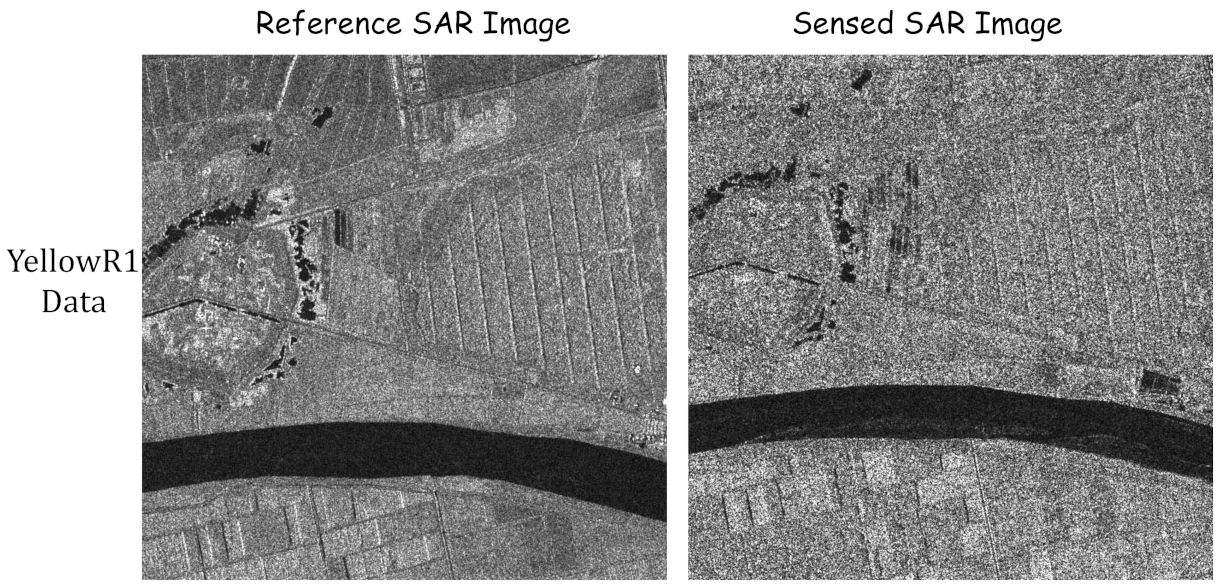
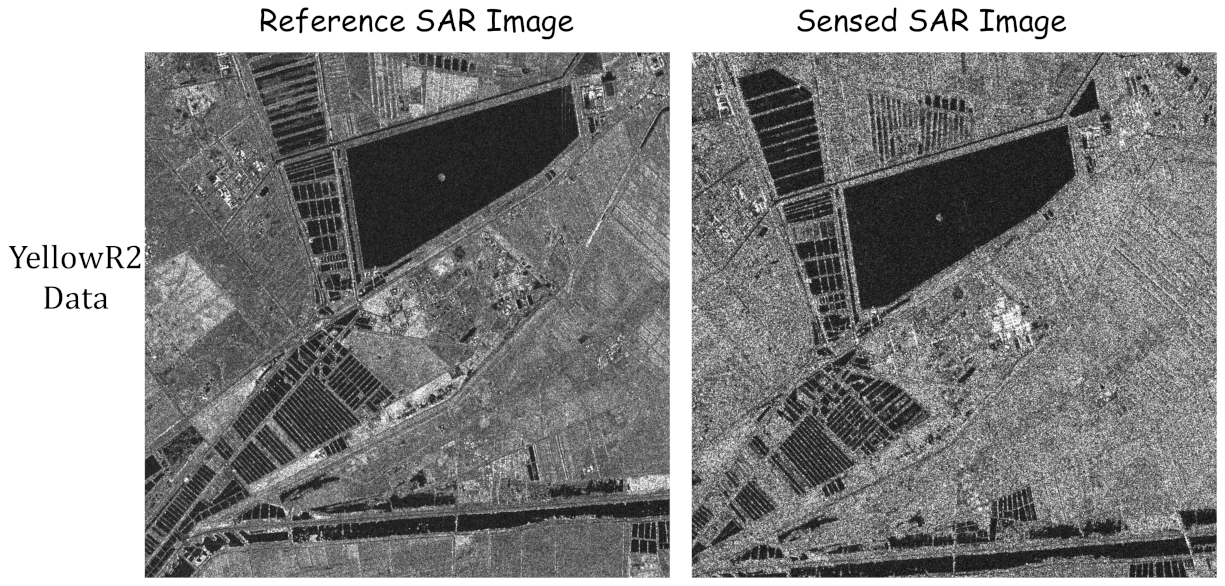
- Both YellowR1 Data and YellowR2 Data were obtained by the Radarsat-2 satellite at Yellow River of China, and their two SAR images were obtained on 18 June 2008 and 19 June 2009, respectively. In YellowR1 data, the size of two SAR images is pixels and the resolution is 8 m, shown as in Figure 6. In YellowR2 data, the size of two SAR images is pixels and the resolution is 8 meters, shown as in Figure 7. Note that YellowR1 and YellowR2 data are cropped from the SAR images of Yellow River Data with . Moreover, the sensed SAR image obtained in 2009 has more multiplicative speckle noise than the reference SAR image obtained in 2008.
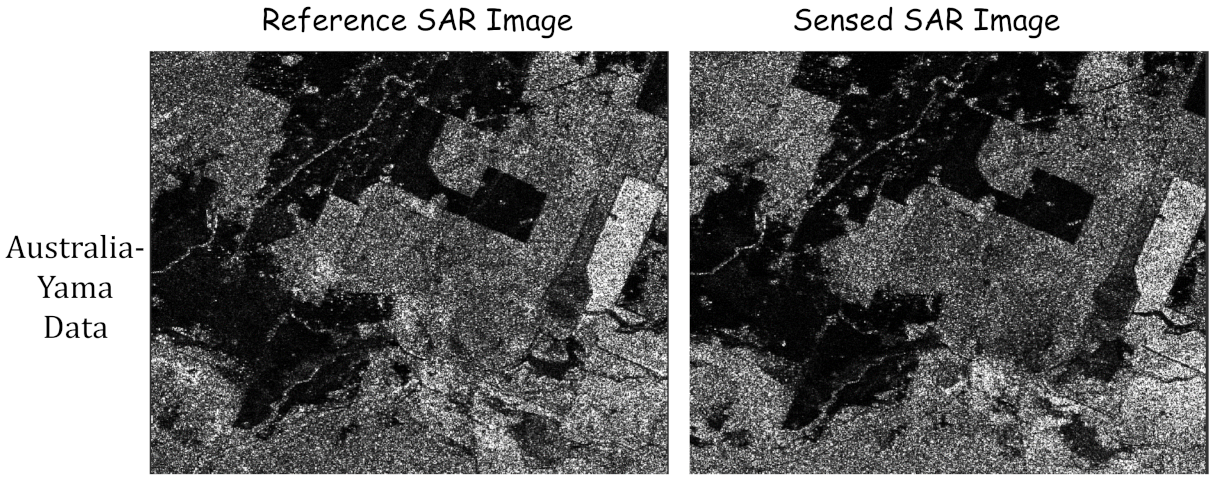
- Two SAR images of Australia-Yama Data was collected by the ALOS-PALSAR satellite in the Yamba region of Australia in 2018 and 2019, respectively. The size of two images is pixels, and they are shown in Figure 8.
According to Section 2.2, it is known that the training samples are constructed based on the reference image and the transformed image corresponding to the reference image. In our experiments, the used affine transformations are scale transformation and rotation transformation, respectively. The parameters of scale transformation are transformed in the range of [0.5, 1.5], and the parameters of the rotation transformation are randomly selected from 1 to 90 degrees. The parameters of deep forest are referred to [44].
Moreover, to validate the registration performance of the proposed method better, we apply seven evaluation criteria [57] to evaluate the accuracy of SAR image registration, shown as follows:
- 1.
- represents the root mean square error calculated by the following formula:where . Note that means that the performance reaches sub-pixel accuracy.
- 2.
- is the number of matching pairs. For the transformation matrix, a bigger value may result in a better performance of image registration.
- 3.
- expresses the error obtained based on the Leave-One-Out strategy and the root mean square error. For each feature point in , we calculate the of feature points, and then their average value is equal to .
- 4.
- is used to detect whether the retained feature points are evenly distributed in the quadrant, and its value should be less than . First, we calculate the residuals between key points from the reference image and the transformed points in the sensed image obtained by the transformation matrix.Then, the number of residual distances is calculated in each quadrant. Finally, the cardinality distribution () of the goodness-of-fit is used to detect the distribution of feature points. In particular, this index is not suitable for the case of .
- 5.
- is the abbreviation of Bad Point Proportion. A point with a residual value lie above a certain threshold(r) is called Bad Point, and thus represents the ratio of Bad Point to the number of detected matching pairs.
- 6.
- is defined as the absolute value of the calculated correlation coefficient, which is about the statistical evaluation of the preference axis on the residual scatter plot and should be less than 0.4. As stated in [57], a more robust method of identifying the presence of a preference axis on the residual distribution is the correlation coefficient. When , the Spearman correlation coefficient is used; otherwise, the Pearson correlation coefficient is adequate.
- 7.
- is a statistical evaluation of the entire image feature point distribution, which should be less than . The calculation of is referred to [57].
- 8.
- is the linear combination of the above seven calculation indicators, the calculation formula is as follows:When , is not used, and thus the above formula is simplified asand the value should be less than 0.605.
3.2. The Comparison Performance
In this part, we compare the proposed method with five classical and effective methods: SIFT [31], SAR-SIFT [33], PSO-SIFT [58], DNN+RANSAC [42] and SNCNet+RANSAC [59]. The compared methods are introduced as follows:
- SIFT detects the key points by constructing the difference-of-Gaussian scale-space, and then uses the 128-dimensional features of the key points to obtain matching pairs, and finally filters the matching pairs with the RANSAC algorithm to find the transformation parameters.
- Differently from SIFT, SAR-SIFT uses SAR-Harris space instead of difference-of-Gaussian scale-space to find keypoints.
- PSO-SIFT introduces an enhanced feature matching method that combines the position, scale and orientation of each key point based on the SIFT algorithm, greatly increasing the number of correctly corresponding point pairs.
- DNN+RANSAC constructs training sample sets using self-learning methods, and then it uses DNN networks to obtain matched image pairs.
- SNCNet+RANSAC uses the Sparse Neighborhood Consensus Network (SNCNet) to get the matching points (the network has public code), and then it uses the RANSAC algorithm to calculate the transformation matrix parameters.
In five compared methods, SIFT, SAR-SIFT and PSO-SIFT belong to traditional methods of SAR image registration, and DNN+RANSAC and SNCNet+RANSAC are two DL-based methods. Table 1, Table 2, Table 3 and Table 4 show the experimental results obtained by six methods on four datas, respectively, where the best performance corresponding to each index is bolded.
From the four tables, it is obviously seen that the performance of the proposed method is superior to five compared methods on and , and the performances of our method reached to the sub-pixel level ( and are less than 1.0) for four datasets of SAR image registration. is the total weighted measure of the above seven metrics, and a smaller value implies a better combined measure. The proposed method obtains the best values on Wuhan, YellowR1 and Yamba datasets. In addition, the proposed method obtains a better point space distribution ( and ) and a lower bad point ratio ().
3.3. The Visualization on SAR Image Registration
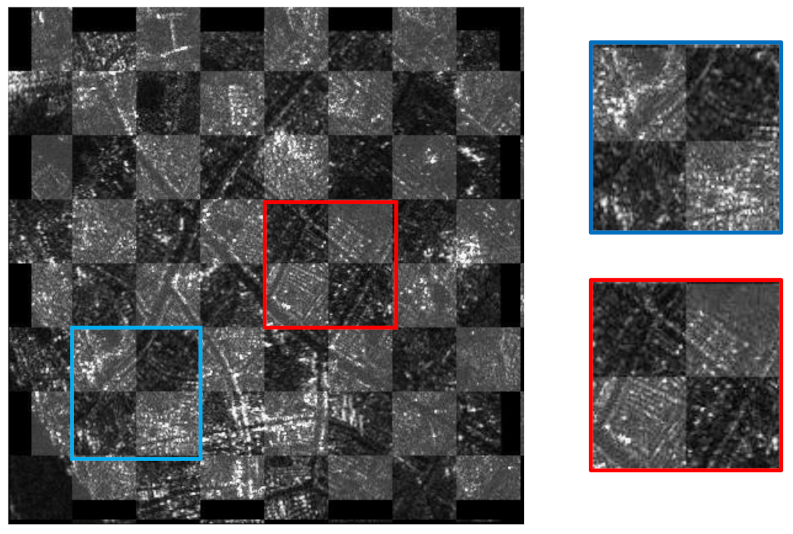
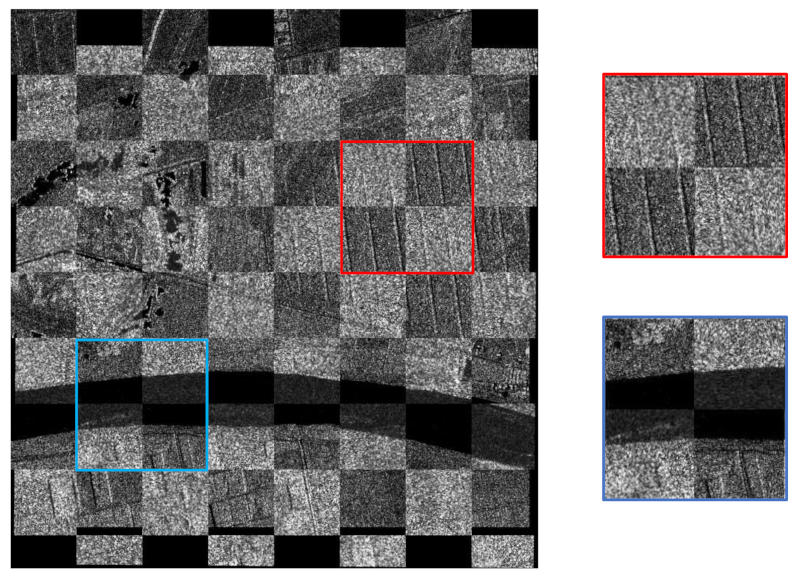
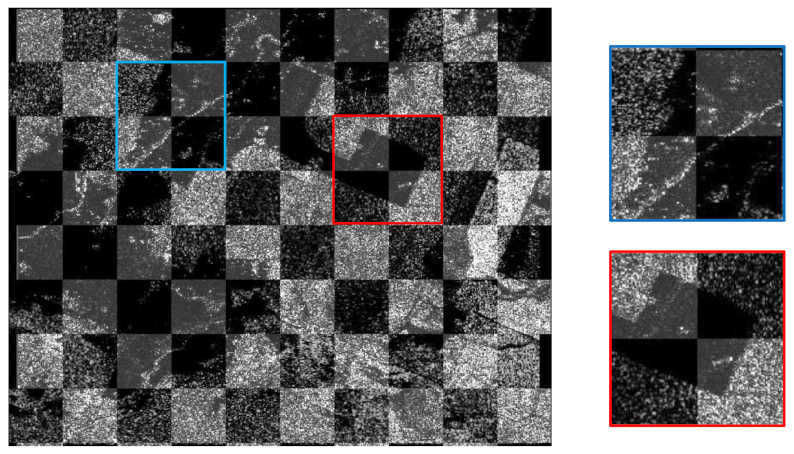
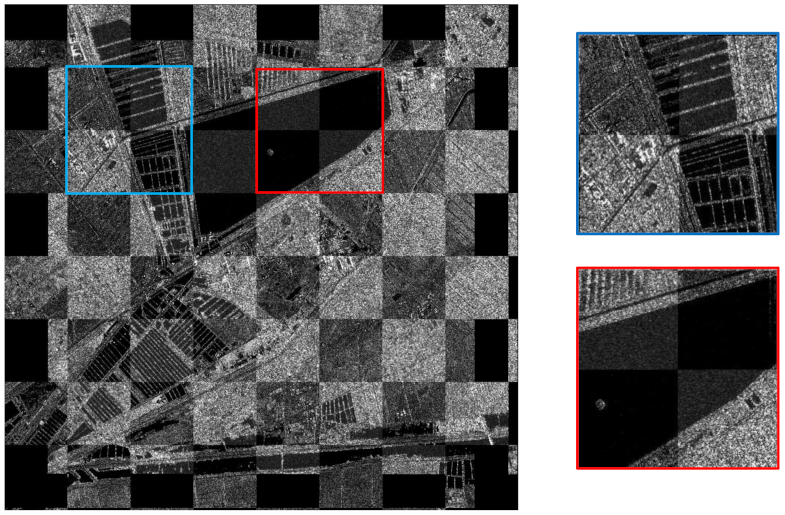
In order to visually validate the registration effectiveness of the proposed method, the chessboard mosaicked image of registrations on four datasets are shown in Figure 9, Figure 10, Figure 11 and Figure 12, respectively. In the chessboard mosaicked image, the continuity of edges and overlapping regions illustrate the registration performance. In particular, in order to make the checkerboard chart look more obvious, the reference image was darkened overall during making the chessboard mosaicked image.
Figure 9, Figure 10, Figure 11 and Figure 12 show the chessboard mosaicked images given by the proposed method for Wuhan Data, YellowR1 Data, Yamba Data and YellowR2 Data, respectively. Moreover, in order to better visual the details of registration results between the reference image and the sensed image, chessboard mosaicked results of two local regions are enlarged for each data, and they are shown in blue and red boxs, respectively. From four figures, it is visually seen that the foreground and the background are well overlapped in each chessboard mosaicked image, where the foreground is corresponding to the registration image aligned by the proposed method. Moreover, by the enlarged images (in blue and red boxes), it is obviously observed that the lines are continuous and regions are well overlapped in Figure 9, Figure 11 and Figure 12, and the rivers is well aligned together and edges are smooth in Figure 10. In short, the results of chessboard mosaicked images demonstrate that the proposed method is able to obtain the higher registration accuracy.
3.4. Analyses on Registration Performance with Different Scales
Considering that our method is proposed based on multiple scales fusion, we make an analysis on the registration performance with different scales to validate the effectiveness of the multi-scale fusion. In this experiment, we test five different scales of image blocks: , , , , and . Table 5 shows the performance obtained based on five scales, respectively, where the best performance corresponding to each data is bolded.
From Table 5, it is obviously seen that the performance of our method is better than each single scale for four datas, which illustrates the fusion of multi scales is more effective for SAR image registration. Note that the registration is ineffectual for the test images when the scale of image blocks is set as , and the reason is that the scale is too small to contain useful information in each image block. Moreover, it is also found that the scale corresponding to the best performance is different for different SAR images. For example, for Wuhan data, the scale obtains the best performance in four different scales, while the scale obtains the best performance for YellowR1 data. It also indicates the bigger scale is not better for SAR image registration. With increasing the scale of image blocks, the neighborhood information of the key point is not necessarily positive feedback to image registration. For our method, we apply three different scales (, and ) in our experiments to validate the performance of registration. is not used to fuse, since this scale is big which increases the computation complexity. In short, the analysis on multiple scales illustrates that the fusion of multiple scales is more benefit and robustness for SAR image registration than using a single fixed scale.
4. Discussion
According to experimental results shown in Section 3, it illustrates that the proposed method achieves better registration performance for SAR images than compared state-of-the art methods. The reasons include three points mainly: First, deep forest is employed as the basic training model, which is more benefit for the training samples with a small size. Second, the multiple scale strategy is proposed to construct multiple training models based on image blocks with different scales corresponding to each keypoint, since image blocks with different scales are of more information for each keypoint. Third, multi-scale fusion based global and local constraints are constructed to seek for the most precise matched points between reference and sensed SAR images. While the comparison performance, the visualization of registration results and the analyses on the parameter setting have been given and discussed, the running time of SAR image registration is worth observing. Thus, we analyze the running time of SAR image registration implemented by the proposed method and five compared methods in this part. Additionally, we also make an analysis about the application of SAR images registration to validate the significance of the registration performance of two images.
4.1. Running Time
In this part, we observe the running time of the proposed method in comparison with the existing approaches, where all experimental settings are the same as previous experiments in Section 3, and experimental results are shown in Table 6.
From Table 6, it is seen that the running time of the proposed method (‘Ours’) is longer than other compared methods. According to our analyses, the main reason is that our method uses the multi-scale strategy and constructs the whole training model based on samples with multiple scales. While the multi-scale training model has a longer running time, the previous experimental results illustrate that multiple scales improve the performance of SAR image registration. Compared with our method, SNCNet+RANSAC has a shorter running time because it is a trained model and is directly used to test, and DNN+RANSAC also has a shorter time since it fixes the size of image patches and only one model is trained. In further works, we consider to speed up the running time by designing the training model of registration methods.
4.2. An Application on Change Detection
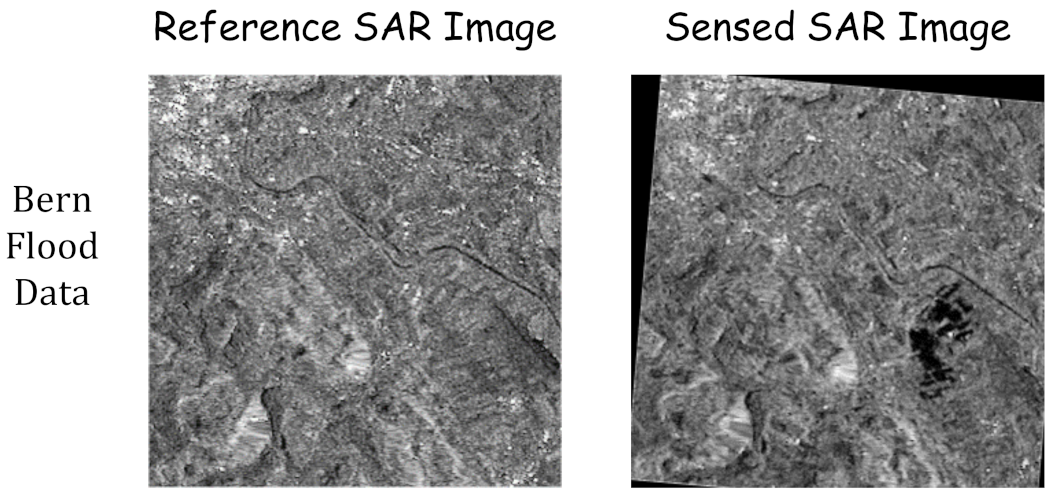
Generally, it is necessary to simultaneously analyze two SAR images in some problems of SAR image processing, such as change detection of SAR images, SAR image fusion, object detection of SAR images, etc., where two SAR images are diverse and captured under different conditions. Hence, SAR image registration is helpful and crucial for enhancing the performance of these problems. In order to validate the significance of SAR image registration in some applications, we make a simple analysis that the registration result is applied to the task of SAR image change detection, where the project related to change detection is from Github https://github.com/summitgao/SAR_Change_Detection_CWNN (accessed on 3 August 2019). In the project, the used dataset is called as Bern Flood Data. Two SAR images of Bern Flood Data were collected by the ERS-2 SAR sensor on April 1999 and May 1999 in the city of Bern, respectively, and the size of two images is . Figure 13 shows reference and sensed SAR images of Bern Flood Data.
In this experiment, two SAR images of Bern Flood Data are firstly matched by our proposed method and five compared methods, and then the change detection is achieved based on the results obtained by six registration methods, respectively, where the PCA-Kmeans method [60] is used as the basic change detection method. Table 7 shows the experimental results, where ‘Methods’ expresses the registration methods, ‘’ expresses the result of SAR image registration and ‘’ expresses the Kappa coefficients of SAR change detection [61], and the best performance corresponding to each index is bolded.
From Table 7, it is obviously seen that the registration performance of the proposed method (‘Ours’) is superior to five compared methods, and meanwhile its corresponding Kappa value is higher than others, which illustrates that the higher registration result is a benefit of obtaining the better result for change detection of different SAR images.
5. Conclusions
In this paper, we propose a multi-scale fused SAR image registration method, where deep forest is employed as the basic learning model to construct the matching model. Considering that the information contained in image blocks with difference scales is different, multi-scale training sets are constructed to train a matching model based on multiple scales. Specifically, a multi-scale fusion strategy is proposed to integrate the predictive pair matching points from local and global views. Experimental results demonstrate the proposed method can obtain better registration performance for four datasets than for other compared methods. Meanwhile, the performance of different scales illustrates the fusion of multiple scales is superior to single fixed scale, which validates the effectiveness of the multi-scale fusion for SAR image registration. Furthermore, from experimental results, it is also observed that the number of pair matching points is small, and thus we will focus on how to obtain more and stricter pair matching points between the reference and sensed images in further works.
Author Contributions
Conceptualization, S.M.; methodology, S.M. and J.Y.; software, J.Y.; validation, J.Y. and S.M.; investigation, T.X.; writing—original draft preparation, S.M. and J.Y.; writing—review and editing, S.M. and S.G.; supervision and suggestions, L.J., S.G. and L.X. All authors have read and agreed to the published version of the manuscript.
Funding
This research was funded by the National Natural Science Foundation of China (No. 61806154 and 61801345), the Natural Science Basic Research Program in Shaanxi Province of China (No. 2020JQ-307), the Fundamental Research Funds for the Central Universities (No. JBF211903), the China Postdoctoral Science Foundation Funded Project (No. 2019M653565).
Data Availability Statement
The public datasets used in experiments can be accessed at the following addresses: Bern Flood Data: https://github.com/summitgao/SAR_Change_Detection_CWNN (accessed on 3 August 2019).
Acknowledgments
Authors would like to show their gratitude to the editors and the anonymous reviewers for their insightful comments.
Conflicts of Interest
The authors declare no conflict of interest.
References
- Bao, Z.; Xing, M.D.; Wang, T. Radar Imaging Technology; Publishing House of Electronics Industry: Beijing, China, 2005; pp. 24–30. [Google Scholar]
- Maitre, H. Processing of Synthetic Aperture Radar Images; ISTE: Orange, NJ, USA, 2013. [Google Scholar]
- Quartulli, M.; Olaizola, I.G. A review of eo image information mining. ISPRS J. Photogramm. Remote Sens. 2013, 75, 11–28. [Google Scholar] [CrossRef] [Green Version]
- Yang, Z.Q.; Dan, T.; Yang, Y. Multi-temporal remote sensing image registration using deep convolutional features. IEEE Access 2018, 6, 38544–38555. [Google Scholar] [CrossRef]
- Moser, G.; Serpico, S.B. Unsupervised change detection from multichannel sar data by markovian data fusion. IEEE Trans. Geosci. Remote Sens. 2009, 47, 2114–2128. [Google Scholar] [CrossRef]
- Bruzzone, L.; Bovolo, F. A novel framework for the design of change-detection systems for very-high-resolution remote sensing images. Proc. IEEE 2013, 101, 609–630. [Google Scholar] [CrossRef]
- Wang, Y.; Du, L.; Dai, H. Unsupervised sar image change detection based on sift keypoints and region information. IEEE Geosci. Remote Sens. Lett. 2016, 13, 931–935. [Google Scholar] [CrossRef]
- Poulain, V.; Inglada, J.; Spigai, M.; Tourneret, J.Y.; Marthon, P. High-resolution optical and sar image fusion for building database updating. IEEE Trans. Geosci. Remote Sens. 2011, 49, 2900–2910. [Google Scholar] [CrossRef] [Green Version]
- Byun, Y.; Choi, J.; Han, Y. An area-based image fusion scheme for the integration of sar and optical satellite imagery. IEEE J. Sel. Top. Appl. Earth Obs. Remote Sens. 2013, 6, 2212–2220. [Google Scholar] [CrossRef]
- Tu, S.; Su, Y. Fast and accurate target detection based on multiscale saliency and active contour model for high-resolution sar images. IEEE Trans. Geosci. Remote Sens. 2016, 54, 5729–5744. [Google Scholar] [CrossRef]
- Dai, H.; Du, L.; Wang, Y.; Wang, Z. A modified cfar algorithm based on object proposals for ship target detection in sar images. IEEE Geosci. Remote Sens. Lett. 2016, 13, 1925–1929. [Google Scholar] [CrossRef]
- Luo, Y.; Zhao, F.; Li, N.; Zhang, H. A modified cartesian factorized back-projection algorithm for highly squint spotlight synthetic aperture radar imaging. IEEE Geosci. Remote Sens. Lett. 2019, 16, 902–906. [Google Scholar] [CrossRef]
- Huang, L.; Qiu, X.; Hu, D.; Han, B.; Ding, C. Medium-earth-orbit sar focusing using range doppler algorithm with integrated two-step azimuth perturbation. IEEE Geosci. Remote Sens. Lett. 2015, 12, 626–630. [Google Scholar] [CrossRef]
- Pu, W.; Wang, X.; Wu, J.; Huang, Y.; Yang, J. Video sar imaging based on low-rank tensor recovery. IEEE Trans. Neural Netw. Learn. Syst. 2021, 32, 188–202. [Google Scholar] [CrossRef] [PubMed]
- Chen, J.; Xing, M.; Sun, G.C.; Li, Z. A 2-d space-variant motion estimation and compensation method for ultrahigh-resolution airborne stepped-frequency sar with long integration time. IEEE Trans. Geosci. Remote Sens. 2017, 55, 6390–6401. [Google Scholar] [CrossRef]
- Wei, P. Deep sar imaging and motion compensation. IEEE Trans. Image Process. 2021, 30, 2232–2247. [Google Scholar]
- Schwind, P.; Suri, S.; Reinartz, P.; Siebert, A. Applicability of the si ft operator to geometric sar image registration. Int. J. Remote Sens. 2010, 31, 1959–1980. [Google Scholar] [CrossRef]
- Wang, S.H.; You, H.J.; Fu, K. Bfsift: A novel method to find feature matches for sar image registration. IEEE Geosci. Remote Sens. Lett. 2012, 9, 649–653. [Google Scholar] [CrossRef]
- Liang, Y.; Cheng, H.; Sun, W.B.; Wang, Z.Q. Research on methods of image registration. Image Technol. 2010, 46, 15–17. [Google Scholar]
- Xu, Y.; Zhou, Y. Review of SAR image registration methods. Geospat. Inf. 2013, 5, 63–66. [Google Scholar]
- Kun, Y.; Anning, P.; Yang, Y.; Su, Z.; Sim, O.; Haolin, T. Remote sensing image registration using multiple image features. Remote Sens. 2017, 9, 581. [Google Scholar]
- Zhang, Z.X.; Li, J.Z.; Li, D.D. Research of automated image registration technique for infrared images based on optical flow field analysis. J. Infrared Millim. Waves. 2003, 22, 307–312. [Google Scholar]
- Ma, J.; Jiang, J.; Zhou, H.; Zhao, J.; Guo, X. Guided locality preserving feature matching for remote sensing image registration. IEEE Trans. Geosci. Remote Sens. 2018, 5, 1–13. [Google Scholar] [CrossRef]
- Li, D.; Zhang, Y. A fast offset estimation approach for insar image subpixel registration. IEEE Geosci. Remote Sens. Lett. 2012, 9, 267–271. [Google Scholar] [CrossRef]
- Sarvaiya, J.N.; Patnaik, S.; Bombaywala, S. Image Registration by Template Matching Using Normalized Cross-Correlation. In Proceedings of the 2009 International Conference on Advances in Computing, Control, and Telecommunication Technologies, Bangalore, India, 28–29 December 2009; pp. 819–822. [Google Scholar]
- Johnson, K.; Cole-Rhodes, A.; Zavorin, I.; Moigne, J.L. Mutual information as a similarity measure for remote sensing image registration. Proc. SPIE Int. Soc. Opt. Eng. 2001, 4383, 51–61. [Google Scholar]
- Averbuch, A.; Keller, Y. FFT based image registration. In Proceedings of the IEEE International Conference on Acoustics, Dubrovnik, Croatia, 15–18 September 2002. [Google Scholar]
- Chen, H.M.; Varshney, P.K.; Arora, M.K. Performance of mutual information similarity measure for registration of multitemporal remote sensing images. IEEE Trans. Geosci. Remote Sens. 2003, 41, 2445–2454. [Google Scholar] [CrossRef]
- Wang, Y.; Yu, Q.; Yu, W. An improved Normalized Cross Correlation algorithm for SAR image registration. In Proceedings of the Geoscience and Remote Sensing Symposium, Munich, Germany, 22–27 July 2012. [Google Scholar]
- Harris, C.; Stephens, M. A combined corner and edge detector. In Proceedings of the Alvey Vision Conference, Manchester, UK, 31 August–2 September 1988; pp. 147–151. [Google Scholar]
- Lowe, G. Sift—The scale invariant feature transform. Int. J. Comput. Vis. 2004, 2, 91–110. [Google Scholar] [CrossRef]
- Ke, Y.; Sukthankar, R. PCA-SIFT: A more distinctive representation for local image descriptors. In Proceedings of the 2004 IEEE Computer Society Conference on Computer Vision and Pattern Recognition—CVPR 2004, Washington, DC, USA, 27 June–2 July 2004. [Google Scholar]
- Dellinger, F.; Delon, J.; Gousseau, Y.; Michel, J.; Tupin, F. Sar-sift: A sift-like algorithm for sar images. IEEE Trans. Geosci. Remote Sens. 2013, 53, 453–466. [Google Scholar] [CrossRef] [Green Version]
- Watanabe, C.; Hiramatsu, K.; Kashino, K. Modular representation of layered neural networks. Neural Netw. 2017, 13, 62–73. [Google Scholar] [CrossRef] [PubMed] [Green Version]
- Thomas, B.; Moeslund, E.G. A survey of computer vision-based human motion capture. Comput. Vis. Image Underst. 2001, 16, 472. [Google Scholar]
- Guo, Y.; Sun, Z.; Qu, R.; Jiao, L.; Zhang, X. Fuzzy superpixels based semi-supervised similarity-constrained cnn for polsar image classification. Remote Sens. 2020, 12, 1694. [Google Scholar] [CrossRef]
- Rostami, M.; Kolouri, S.; Eaton, E.; Kim, K. Deep transfer learning for few-shot sar image classification. Remote Sens. 2019, 11, 1374. [Google Scholar] [CrossRef] [Green Version]
- Krestenitis, M.; Orfanidis, G.; Ioannidis, K.; Avgerinakis, K.; Kompatsiaris, I. Oil spill identification from satellite images using deep neural networks. Remote Sens. 2019, 11, 1762. [Google Scholar] [CrossRef] [Green Version]
- Haas, J.; Rabus, B. Uncertainty Estimation for Deep Learning-Based Segmentation of Roads in Synthetic Aperture Radar Imagery. Remote Sens. 2021, 13, 1472. [Google Scholar] [CrossRef]
- Zhang, H.; Ni, W.; Yan, W.; Xiang, D.; Bian, H. Registration of multimodal remote sensing image based on deep fully convolutional neural network. IEEE J. Sel. Top. Appl. Earth Obs. Remote Sens. 2019, 12, 3028–3042. [Google Scholar] [CrossRef]
- Zagoruyko, S.; Komodakis, N. Learning to Compare Image Patches Via Convolutional Neural Networks. In Proceedings of the 2015 IEEE Conference on Computer Vision and Pattern Recognition (CVPR), Boston, MA, USA, 7–12 June 2015. [Google Scholar]
- Wang, S.; Quan, D.; Liang, X.; Ning, M.; Guo, Y.; Jiao, L. A deep learning framework for remote sensing image registration. ISPRS J. Photogramm. Remote Sens. 2018, 145, 148–164. [Google Scholar] [CrossRef]
- Han, X.; Leung, T.; Jia, Y.; Sukthankar, R.; Berg, A.C. MatchNet: Unifying feature and metric learning for patch-based matching. Comput. Vis. Pattern Recognit. 2015, 3325–3337. [Google Scholar]
- Zhou, Z.H.; Feng, J. Deep Forest: Towards an Alternative to Deep Neural Networks. arXiv 2017, arXiv:1702.08835. [Google Scholar]
- Breiman, L. Random forests. Mach. Learn. 2001, 45, 5–32. [Google Scholar] [CrossRef] [Green Version]
- Dong, X.; Yu, Z.; Cao, W.; Shi, Y.; Ma, Q. A survey on ensemble learning. Front. Comput. Sci. 2020, 14, 241–258. [Google Scholar] [CrossRef]
- Zhou, Z.H. Ensemble Methods: Foundations and Algorithms; Taylor Francis: Boca Raton, FL, USA, 2012; p. 236. [Google Scholar]
- Mao, S.; Lin, W.S.; Jiao, L.; Gou, S.; Chen, J.W. End-to-end ensemble learning by exploiting the correlation between individuals and weights. IEEE Trans. Cybern. 2019, 51, 1–12. [Google Scholar] [CrossRef] [PubMed]
- Mao, S.; Chen, J.W.; Jiao, L.; Gou, S.; Wang, R. Maximizing diversity by transformed ensemble learning. Appl. Soft Comput. 2019, 82, 105580. [Google Scholar] [CrossRef]
- Miao, X.; Heaton, J.S.; Zheng, S.; Charlet, D.A.; Liu, H. Applying tree-based ensemble algorithms to the classification of ecological zones using multi-temporal multi-source remote-sensing data. Int. J. Remote Sens. 2012, 33, 1823–1849. [Google Scholar] [CrossRef]
- Rodriguez-Galiano, V.F.; Chica-Olmo, M. Random forest classification of mediterranean land cover using multi-seasonal imagery and multi-seasonal texture. Remote Sens. Environ. 2012, 121, 93–107. [Google Scholar] [CrossRef]
- Pierce, A.D.; Farris, C.A.; Taylor, A.H. Use of random forests for modeling and mapping forest canopy fuels for fire behavior analysis in Lassen Volcanic National Park, California, USA-ScienceDirect. For. Ecol. Manag. 2012, 279, 77–89. [Google Scholar] [CrossRef]
- Zou, T.; Yang, W.; Dai, D. Polarimetric SAR image classification using multi-features combination and extremely randomized clustering forests. Eurasip J. Adv. Signal Process. 2010, 2010, 1. [Google Scholar]
- Ma, W.P.; Yang, H.; Wu, Y.; Jiao, L.C.; Chen, X.B. A SAR Image Change Detection Method Based on Deep Forest. Master’s Thesis, Xidian University, Xi’an, China, 2018. [Google Scholar]
- Ranjan, A. Normalized cross correlation. Image Process. 1995, 28, 819. [Google Scholar]
- Fischler, M.A.; Bolles, R.C. Random sample consensus. Commun. ACM 1981, 6, 381–395. [Google Scholar] [CrossRef]
- Goncalves, H.; Goncalves, J.A.; Corte-Real, L. Measures for an objective evaluation of the geometric correction process quality. IEEE Geosci. Remote Sens. Lett. 2009, 6, 292–296. [Google Scholar] [CrossRef]
- Ma, W.; Wen, Z.; Wu, Y.; Jiao, L.; Gong, M.; Zheng, Y. Remote sensing image registration with modified sift and enhanced feature matching. IEEE Geosci. Remote Sens. Lett. 2016, 14, 3–7. [Google Scholar] [CrossRef]
- Rocco, I.; Arandjelović, R.; Sivic, J. Efficient neighbourhood consensus networks via submanifold sparse convolutions. In Proceedings of the European Conference on Computer Vision, Glasgow, UK, 23–28 August 2020; pp. 605–621. [Google Scholar]
- Celik, T. Unsupervised change detection in satellite images using principal component analysis and k-means clustering. IEEE Geosci. Remote Sens. Lett. 2009, 6, 772–776. [Google Scholar] [CrossRef]
- Thompson, W.D.; Walter, S.D. A reappraisal of the kappa coefficient. J. Clin. Epidemiol. 1988, 41, 949–958. [Google Scholar] [CrossRef]
Figure 1.
Patches with different sizes.

Figure 2.
The framework of the proposed method.

Figure 3.
An example of constructing training sets with multiple scales.

Figure 4.
Diversity maps corresponding to a pair of matching image blocks and a pair of non-matching image blocks.
Figure 4.
Diversity maps corresponding to a pair of matching image blocks and a pair of non-matching image blocks.

Figure 5.
Reference and Sensed Images of Wuhan Data.

Figure 6.
Reference and Sensed Images of YellowR1 Data.

Figure 7.
Reference and Sensed Images of YellowR2 Data.

Figure 8.
Reference and Sensed Images of Australia-Yama Data.

Figure 9.
The Chessboard Diagram for Wuhan Image.

Figure 10.
The Chessboard Mosaicked Image for YellowR1 Image.

Figure 11.
The Chessboard Diagram for Yamba Image.

Figure 12.
The Chessboard Diagram for YellowR2 Image.

Figure 13.
Reference and Sensed Images of Bern Flood Data.


Table 1.
The quantitative comparison among six methods on Wuhan images.
| Methods | Nred | RMSall | RMSLOO | Pquad | BPP(1.0) | Sknew | Scat | |
|---|---|---|---|---|---|---|---|---|
| SIFT | 17 | 1.2076 | 1.2139 | – | 0.6471 | 0.1367 | 0.9991 | 0.7048 |
| SAR-SIFT | 66 | 1.2455 | 1.2491 | 0.6300 | 0.6212 | 0.1251 | 0.9961 | 0.6784 |
| PSO-SIFT | 18 | 0.6975 | 0.7104 | – | 0.5556 | 0.0859 | 1.0000 | 0.5209 |
| DNN+RANSAC | 8 | 0.6471 | 0.6766 | – | 0.1818 | 0.0943 | 0.9766 | 0.4484 |
| SNCNet+RANSAC | 44 | 0.6565 | 0.6777 | 0.6665 | 0.3330 | 0.1410 | 1.0000 | 0.4946 |
| Ours | 39 | 0.4345 | 0.4893 | 0.6101 | 0.3124 | 0.1072 | 1.0000 | 0.4304 |
Table 2.
The quantitative comparison among six methods on YellowR1 images.
| Methods | Nred | RMSall | RMSLOO | Pquad | BPP(1.0) | Sknew | Scat | |
|---|---|---|---|---|---|---|---|---|
| SIFT | 11 | 0.9105 | 0.9436 | – | 0.5455 | 0.1055 | 0.9873 | 0.5908 |
| SAR-SIFT | 31 | 1.0998 | 1.1424 | 0.5910 | 0.7419 | 0.0962 | 1.0000 | 0.6636 |
| PSO-SIFT | 19 | 0.7191 | 0.7246 | – | 0.4211 | 0.0616 | 1.0000 | 0.4960 |
| DNN+RANSAC | 10 | 0.8024 | 0.8518 | – | 0.6000 | 0.1381 | 0.9996 | 0.5821 |
| SNCNet+RANSAC | 17 | 0.6043 | 0.6126 | – | 0.5839 | 0.1266 | 1.0000 | 0.5052 |
| Ours | 11 | 0.5923 | 0.6114 | – | 0.4351 | 0.0834 | 0.9990 | 0.4753 |
Table 3.
The quantitative comparison among six methods on Yamba images.
| Methods | Nred | RMSall | RMSLOO | Pquad | BPP(1.0) | Sknew | Scat | |
|---|---|---|---|---|---|---|---|---|
| SIFT | 69 | 1.1768 | 1.1806 | 0.9013 | 0.6812 | 0.0975 | 0.9922 | 0.7010 |
| SAR-SIFT | 151 | 1.2487 | 1.2948 | 0.6016 | 0.6755 | 0.1274 | 0.9980 | 0.6910 |
| PSO-SIFT | 132 | 0.6663 | 0.6685 | 0.6050 | 0.4621 | 0.1071 | 1.0000 | 0.5009 |
| DNN+RANSAC | 8 | 0.7293 | 0.7582 | – | 0.5000 | 0.1227 | 0.9766 | 0.5365 |
| SNCNet+RANSAC | 17 | 0.6484 | 0.6591 | – | 0.3529 | 0.1205 | 1.0000 | 0.4734 |
| Ours | 12 | 0.4645 | 0.4835 | – | 0.4000 | 0.1175 | 0.9999 | 0.4356 |
Table 4.
The quantitative comparison among six methods on YellowR2 images.
| Methods | Nred | RMSall | RMSLOO | Pquad | BPP(1.0) | Sknew | Scat | |
|---|---|---|---|---|---|---|---|---|
| SIFT | 88 | 1.1696 | 1.1711 | 0.6399 | 0.7841 | 0.1138 | 0.9375 | 0.6757 |
| SAR-SIFT | 301 | 1.1903 | 1.1973 | 0.8961 | 0.8671 | 0.1318 | 1.0000 | 0.7390 |
| PSO-SIFT | 54 | 0.6480 | 0.6527 | 0.5804 | 0.2778 | 0.1077 | 1.0000 | 0.4648 |
| DNN+RANSAC | 10 | 0.5784 | 0.5906 | – | 0.0000 | 0.1308 | 0.9999 | 0.3946 |
| SNCNet+RANSAC | 67 | 0.6468 | 0.6595 | 0.6097 | 0.4925 | 0.1381 | 1.0000 | 0.5085 |
| Ours | 52 | 0.5051 | 0.5220 | 0.6112 | 0.7692 | 0.1434 | 1.0000 | 0.5215 |
Table 5.
Registration results (RMSE) of image blocks of different sizes.
| Scales | Wuhan Data | YellowR1 Data | Yamba Data | YellowR2 Data |
|---|---|---|---|---|
| – | – | – | – | |
| 1.0418 | 1.0648 | 0.9127 | 0.8311 | |
| 0.9507 | 0.6821 | 0.6660 | 0.7647 | |
| 0.9700 | 1.0128 | 0.7720 | 0.5864 | |
| 0.7305 | 0.7944 | 0.9000 | 1.2858 | |
| Our Method | 0.4345 | 0.5923 | 0.5051 | 0.4645 |
Table 6.
Running times of our method and five compared methods on the four data.
| Datasets | SIFT | SAR-SIFT | PSO-SIFT | SNCNet- RANSAC | DNN- RANSAC | Ours |
|---|---|---|---|---|---|---|
| Wuhan | 15.133 | 34.089 | 12.508 | 42.224 | 117.420 | 173.472 |
| Yamba | 18.056 | 86.283 | 34.637 | 51.006 | 218.278 | 430.245 |
| YellowR1 | 51.645 | 72.093 | 37.213 | 79.093 | 491.596 | 711.874 |
| YellowR2 | 79.907 | 133.519 | 366.939 | 96.919 | 952.297 | 1160.083 |
Table 7.
Results of Change detection based on six registration methods for Bern Flood Data, where is the result of SAR image registration and is the result of SAR change detection.
Table 7.
Results of Change detection based on six registration methods for Bern Flood Data, where is the result of SAR image registration and is the result of SAR change detection.
| Methods | SIFT | SAR-SIFT | PSO-SIFT | DNN+RANSAC | SNANet+RANSAC | Ours |
|---|---|---|---|---|---|---|
| RMSall | 1.2651 | 1.2271 | 0.6676 | 0.6454 | 0.5144 | 0.4970 |
| Kappa | 0.4796 | 0.4865 | 0.5259 | 0.5305 | 0.5376 | 0.5594 |
Publisher’s Note: MDPI stays neutral with regard to jurisdictional claims in published maps and institutional affiliations. |
© 2021 by the authors. Licensee MDPI, Basel, Switzerland. This article is an open access article distributed under the terms and conditions of the Creative Commons Attribution (CC BY) license (https://creativecommons.org/licenses/by/4.0/).
Share and Cite
MDPI and ACS Style
Mao, S.; Yang, J.; Gou, S.; Jiao, L.; Xiong, T.; Xiong, L. Multi-Scale Fused SAR Image Registration Based on Deep Forest. Remote Sens. 2021, 13, 2227. https://0-doi-org.brum.beds.ac.uk/10.3390/rs13112227
AMA Style
Mao S, Yang J, Gou S, Jiao L, Xiong T, Xiong L. Multi-Scale Fused SAR Image Registration Based on Deep Forest. Remote Sensing. 2021; 13(11):2227. https://0-doi-org.brum.beds.ac.uk/10.3390/rs13112227
Chicago/Turabian StyleMao, Shasha, Jinyuan Yang, Shuiping Gou, Licheng Jiao, Tao Xiong, and Lin Xiong. 2021. "Multi-Scale Fused SAR Image Registration Based on Deep Forest" Remote Sensing 13, no. 11: 2227. https://0-doi-org.brum.beds.ac.uk/10.3390/rs13112227
Note that from the first issue of 2016, this journal uses article numbers instead of page numbers. See further details here.