
Mapping and Evaluating Human Pressure Changes in the Qilian Mountains


1
Northwest Institute of Eco-Environment and Resources, Chinese Academy of Sciences, Lanzhou 730000, China
2
University of Chinese Academy of Sciences, Beijing 100049, China
3
Linze Inland River Basin Research Station, Northwest Institute of Eco-Environment and Resources, Chinese Academy of Sciences, Lanzhou 730000, China
*
Author to whom correspondence should be addressed.
Remote Sens. 2021, 13(12), 2400; https://0-doi-org.brum.beds.ac.uk/10.3390/rs13122400
Submission received: 29 April 2021
/
Revised: 5 June 2021
/
Accepted: 16 June 2021
/
Published: 19 June 2021
(This article belongs to the Section Environmental Remote Sensing)
Abstract
:Human activities have dramatically changed ecosystems. As an irreplaceable ecological barrier in western China, the Qilian Mountains (QLM) provide various ecosystem services for humans. To evaluate the changes in the intensity of human activities in the QLM and their impact on the ecosystem, the human footprint (HF) method was used to conduct a spatial dataset of human activity intensity. In our study, the NDVI was used to characterize the growth of vegetation, and six categories of human pressures were employed to create the HF map in the QLM for 2000–2015 at a 1-km scale. The results showed that the mean NDVI during the growing season showed a significant increasing trend over the entire QLM in the period 2000–2015, while the NDVI showed a significant declining trend of more than 70% concentrated in Qinghai. Human pressure throughout the QLM occurred at a low level during 2000–2015, being greater in the eastern region than the western region, while the Qinghai area had greater human pressure than the Gansu area. Due to the improvement in traffic facilities, tourism, overgrazing, and other illegal activities, grasslands, shrublands, forests, wetlands, and bare land were the vegetation types most affected by human activities (in decreasing order). As the core area of the QLM, the Qilian Mountains National Nature Reserve (NR) has effectively reduced the impact of human activities. However, due to the existence of many ecological historical debts caused by unreasonable management in the past, the national park established in 2017 is facing great challenges to achieve its goals. These data and results will provide reference and guidance for future protection and restoration of the QLM ecosystem.
1. Introduction
The Earth’s systems are driven by global climate change combined with human activities [1]. Especially over the past several hundred years, humans have dramatically changed ecosystems [2], and these changes have resulted in various global ecological and environmental problems, such as deforestation [3], loss of high-quality soils [4], ocean pollution [5], and loss of biodiversity [6], which have greatly decreased the value of ecosystem services (ES) [7], and pose a huge threat to human survival. In the context of global warming, understanding the extent of human activities and evaluating the effects on the ecosystem are essential for environmental protection and sustainable development.
Mapping is the way for us to easily understand and grasp human influence, but such a map was not designed until the end of the 1980s, due to prior technological limitations [8]. In 1989, McCloskey and Spalding [9] created the first global wilderness map of land areas based on a global navigation chart that included airports, roads, railways, settlements, buildings, major mines, and dams, showing the location and extent of land surface that was not affected by human activities. Since then, a number of methods have been created to quantify and map human effects on ecosystems [10], such as the Human footprint (HF) [8], Anthropogenic biomes [11], Low-impact areas (LIAs) [12], Human modification (HM) [13], and Temporal human pressure index (THPI) [14] (Table S1). Among them, the HF method proposed by Sanderson et al., which uses four categories of human pressures—including population, land transformation, access, and electrical power infrastructure—to map the influence of human activities, has been widely applied in various regions for biodiversity conservation [15,16,17], vegetation and habitat protection [18,19], and conservation of ecological service functions [20,21].
As an irreplaceable ecological barrier and hotspot of biodiversity conservation in western China [22], the Qilian Mountains (QLM) provide many types of ecosystem services for humans in Northwest China, including grassland and tourism resources for local residents [23] and water resources for oases in China’s Hexi Corridor [24]. In recent years, the ecological and environmental problems caused by human activities have attracted increasing attention [25], such as grassland degradation [26] and wildlife population decline [27]. Vegetation is an important indicator of environmental conditions, and plays a crucial role in conserving water and soil [28], providing habitats [29], and regulating climate [30]. The government has implemented various protection measures to protect vegetation, but in some local areas of the QLM, vegetation degradation is still prominent and shows a significant increasing trend [31,32]. Many studies have revealed the influence of climatic factors and human activities on vegetation in the QLM [33,34,35,36,37]. However, there is a lack of studies exploring the direct and indirect effects on vegetation from the perspective of temporal and spatial changes in the intensity of human activities related to ecosystem conservation in the QLM [38].
Based on the strategic needs of QLM ecological barrier protection, in order to explore the effects of human activities on the QLM ecosystem, in our study, an HF approach was adopted to assess and map the human influence in the QLM. Six categories of human pressures were selected to quantify and map the extent and intensity of human effects: land use/cover, population density, night-time light, grazing density, and road and railway distributions. We aimed to (1) map the HF at a 1-km scale for 2000, 2005, 2010, and 2015 in the QLM; (2) analyze the spatiotemporal variations in human pressures from 2000 to 2015; and (3) assess the effects of HF changes on vegetation in the QLM.
2. Study Area and Methods
2.1. Study Area
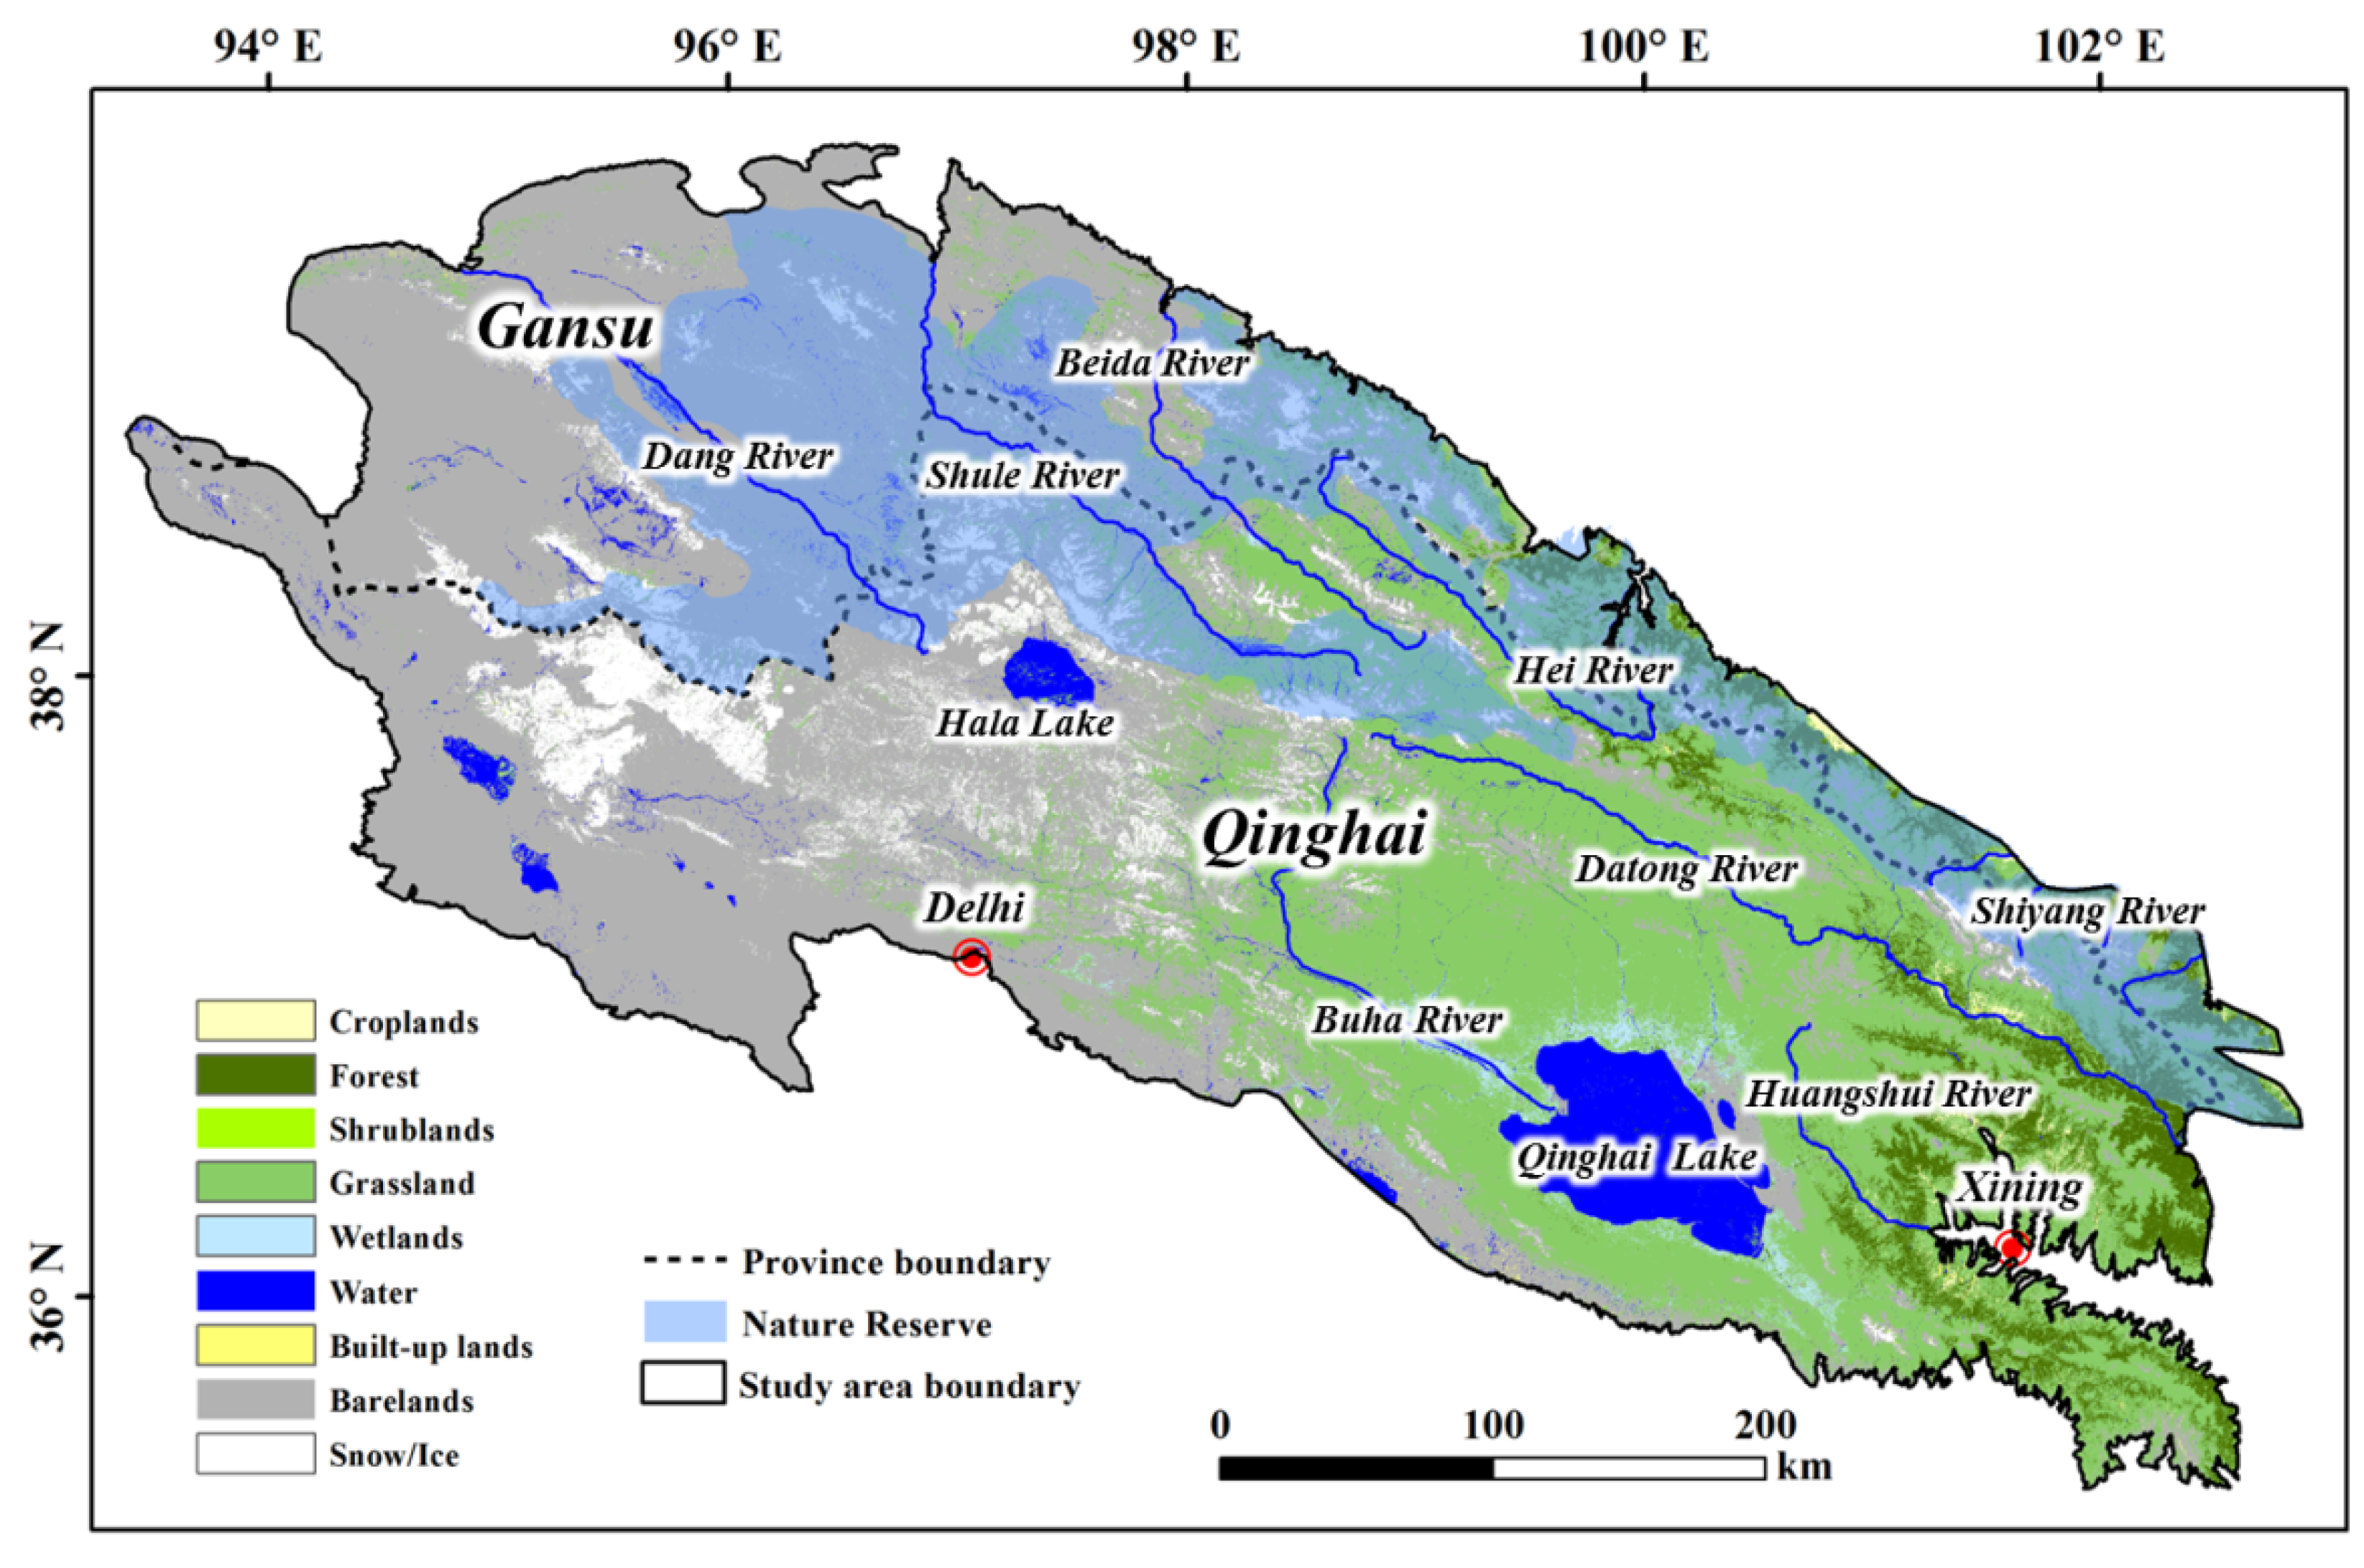
The QLM are located in the middle of the Eurasian continent and cover an area of over 1.8 × 10⁵ km², extending from 93.5°E to 103.5°E and 35.5°N to 40.0°N (Figure 1). As the largest mountain system in the marginal northeast of the Qinghai–Tibet Plateau, the QLM consist of a number of parallel mountains and wide valleys with a northwest–southeast orientation and an average elevation exceeding 3500 m. The QLM are connected to the Hexi Corridor in the north, the Tsaidam Basin in the south, the A-erh-chin Mountains in the west, and the Yellow River Valley in the east, which is connected to the Qinling and Liupan Mountains. Most areas of the QLM are located in the deserts of Central Asia, with typical continental climate characteristics and an annual average temperature of 0.6–2 °C. Affected by the southeast monsoon, precipitation occurs primarily from April to September. Precipitation decreases from southeast to northwest, and increases with altitude. From a spatial perspective, the precipitation in the western region is generally less than 100 mm, the precipitation in the central and eastern regions can exceed 400 mm, and in some areas, it can exceed 800 mm. In areas with higher altitudes, periglacial phenomena are widely distributed, with discontinuous permafrost and continuous permafrost found at an altitude of 3400 m. Rivers in the QLM are mainly supplied by glacial meltwater, and the QLM currently contain 2684 glaciers, containing an ice volume of ~84.48 km³. As the main water supply of the Hexi Corridor, the QLM play a decisive role in the formation and development of oasis agriculture in the Hexi Corridor; additionally, the QLM play an irreplaceable role in maintaining the ecological security of Northwest China [39].
The vegetation distribution in the QLM shows an obvious horizontal zonal characteristic (Figure 2). Grasslands, bare land, and forests dominate the vegetation cover in the QLM. Grasslands and forests are mainly distributed in the central and eastern regions of the QLM, and bare land and snow cover are mainly found in the western region. Qinghai Lake in the QLM is the largest inland lake and saltwater lake in China. Grassland is the main type of vegetation coverage in the Qinghai Lake Basin, accounting for approximately 70% of the basin area.
The QLM are located at the junction of Gansu and Qinghai provinces, which have relatively low levels of economic development and are dominated by agriculture and animal husbandry. In recent years, with the improvement in traffic infrastructure—such as the opening of the Qinghai–Tibet Railway in 2006—the local economy has entered a state of rapid development. Due to the unique natural and cultural landscape of the QLM, tourism in the region has developed rapidly. In addition, the QLM were once known as the “Urals of China”, with rich mineral resources, and the mining industry has gradually become the main industry in the region. Since its establishment in 1987, the Qilian Mountain National Nature Reserve (NR), which belongs to the most important category of protected areas in China and implements the strictest protection policies, has been subject to human disturbances. The interference was not weakened until 2017, when the government approved the establishment of Qilian Mountain National Park.
2.2. Data Sources
2.2.1. Human Pressure Data
Six categories of data were selected to characterize human pressure, i.e., land use/cover, road and railway distribution, population density, night-time light, and grazing density. Land use/cover data for the QLM were extracted from the land use dataset of China (1980–2015) for 2000, 2005, 2010, and 2015 [40] (http://data.tpdc.ac.cn/zh-hans/, accessed on 10 August 2020).
Road distribution data were acquired from Open Street Map (OSM, https://www.openstreetmap.org/, accessed on 14 August 2020) for 2000, 2005, 2010, and 2015 [41]. Railway distribution data for 2000, 2005, 2010, and 2015 were acquired from the National Geomatics Center of China (NGCC, http://www.ngcc.cn, accessed on 20 August 2020).
Population density data were derived from the 1-km Chinese population density dataset (http://www.resdc.cn, accessed on 21 August 2020) [42].
Night-time light data were derived from the Defense Meteorological Satellite Program Operational Linescan System (DMSP-OLS, https://www.ngdc.noaa.gov/, accessed on 3 July 2020) for the period from 2000 to 2013. In this study, intercalibration, saturation correction, and continuity correction procedures were used to build a series of consistent night-time light data from 2000 to 2013, with a 1-km spatial resolution [43]. There were no data for 2015; thus, we used 2013 data instead.
Grazing density data were characterized by the distribution density of cattle and sheep, and 2006 data were obtained from the Gridded Livestock of the World database (https://livestock.geo-wiki.org, accessed on 15 July 2020), with 1-km spatial resolution. The data for 2000, 2005, 2010, and 2015 were acquired based on the ratio of beef and mutton production in the yearbooks of Qinghai and Gansu provinces.
2.2.2. Vegetation Data
Vegetation classification data were derived from the land use dataset of China (1980–2015) (http://data.tpdc.ac.cn, accessed on 4 September 2020). As a good indicator of terrestrial vegetation productivity, the normalized difference vegetation index (NDVI) data (the maximum value in the growing season) were derived from the Terra and Aqua Moderate-Resolution Imaging Spectroradiometer NDVI products (MOD13A2, https://ldas.gsfc.nasa.gov, accessed on 5 September 2020), with 16-d and 1-km temporal and spatial resolutions, respectively, for the period from 2000 to 2015.
2.3. Methods
2.3.1. Human Footprint
As a broad methodological framework used to create maps of cumulative human pressures, the HF method has been applied and developed at various scales. In the QLM, taking the location, biophysical and cultural characteristics, and data accessibility into consideration, we selected land use/cover, road and railway distribution, population density, night-time light, and grazing density to map the HF in the QLM from 2000 to 2015. Because these pressures have different units and magnitudes, relative influence scores ranging from 0 (unpressured) to 10 (maximum pressure) were assigned to each pressure. Then, the six categories of pressure scores were summed as follows for 2000, 2005, 2010, and 2015, at the 1-km scale:
where HF represents the intensity of human activity; ILuc represents the influence score of land use/cover; IRoa represents the influence score of roads; IRai represents the influence score of railways; IPop represents the influence score of population density; ILig represents the influence score of night-time light; and IGra represents the influence score of grazing. The human pressure increased with higher HF values.
The specific assignment methods of each category of data were as follows (Table 1):
Land use/cover:
Built-up land that included urban areas, quarries, mines, and factories was assigned a maximum score of 10. Rural settlements were assigned a score of 9. Cropland was assigned a score of 5. Manmade reservoirs and plantations were assigned a score of 4. Considering that animal husbandry is an important industry in the QLM, all grasslands may be disturbed by potential human activities, and we assigned scores of 2, 1 and 0 to grasslands with coverage greater than 50%, 20–50%, and less than 20%, respectively. The other land use/cover types were assigned a score of 0.
Road distribution:
We set the influence scores based on road types that include expressways, national highways, provincial highways, county highways, and others, and set the maximum impact distance to 5.5 km. Taking the expressway as an example, we assigned a score of 10 for the 0.5 km buffer on either side; a score of 8 was assigned to a distance of 0.5–1.5 km; a score of 6 was assigned to a distance of 1.5–2.5 km; a score of 4 was assigned to a distance of 2.5–3.5 km; a score of 2 was assigned to a distance of 3.5–4.5 km; and a score of 1 was assigned to a distance of 4.5–5.5 km (Table S2).
Railway distribution:
Compared with roads, railways do not provide a means of accessing the local environment along their borders for passengers; thus, we assigned a score of 8 for a distance of 0.5 km on either side of a railway, and the score decreased with distance up to 3.5 km on either side.
Population density:
Based on related studies, and taking the QLM’s resources and environmental carrying capacity into consideration [20,44], we assigned grids with a population density greater than 50 people/km−2 a score of 10, and the remaining grids were assigned by the logarithmic method as follows:
Night-time light:
The mutually calibrated night-time light data of 2000 were divided into 10 equal sample bins based on the pixel values (except pixel values of 0) and then assigned scores of 1–10, starting with the lowest value bin. Pixel values of 0 were assigned a score of 0. The thresholds used to assign the 2000 data were then used to assign the 2005, 2010, and 2015 data with scores of 0–10.
Grazing density:
Based on the QLM resources and environmental carrying capacity, we assigned grids with a grazing density of greater than 1000 sheep units/km−2 a score of 10, and the remaining grids were assigned by the logarithmic method as follows:
2.3.2. Data Analyses
The Mann–Kendall test and Pearson correlation coefficients were used to identify temporal trends and spatial distributions of meteorological factors and the NDVI from 2000 to 2015. To analyze the change in local vegetation, the following equation was used to calculate the trend:
where NDVIi represents the NDVI in year i, and n represents the total number of years from 2000 to 2015. A positive trend indicates that the NDVI was increasing, while a negative value means that the NDVI was decreasing; zero indicates that there was no change [45].
To further analyze the HF and its change within important regions of the QLM, we reclassified the HF values into six classes: no pressure (0 ≤ HF < 1), slight pressure (1 ≤ HF < 3), low pressure (3 ≤ HF < 9), moderate pressure (9 ≤ HF < 20), high pressure (20 ≤ HF < 30), and very high pressure (30 ≤ HF).
2.4. Software
All statistical tests were performed using SPSS 24.0 software, and statistical graphs were drawn in Python 3.7. All spatial data processing was completed in ArcGIS 10.5 software.
3. Results
3.1. Human Pressure Changes
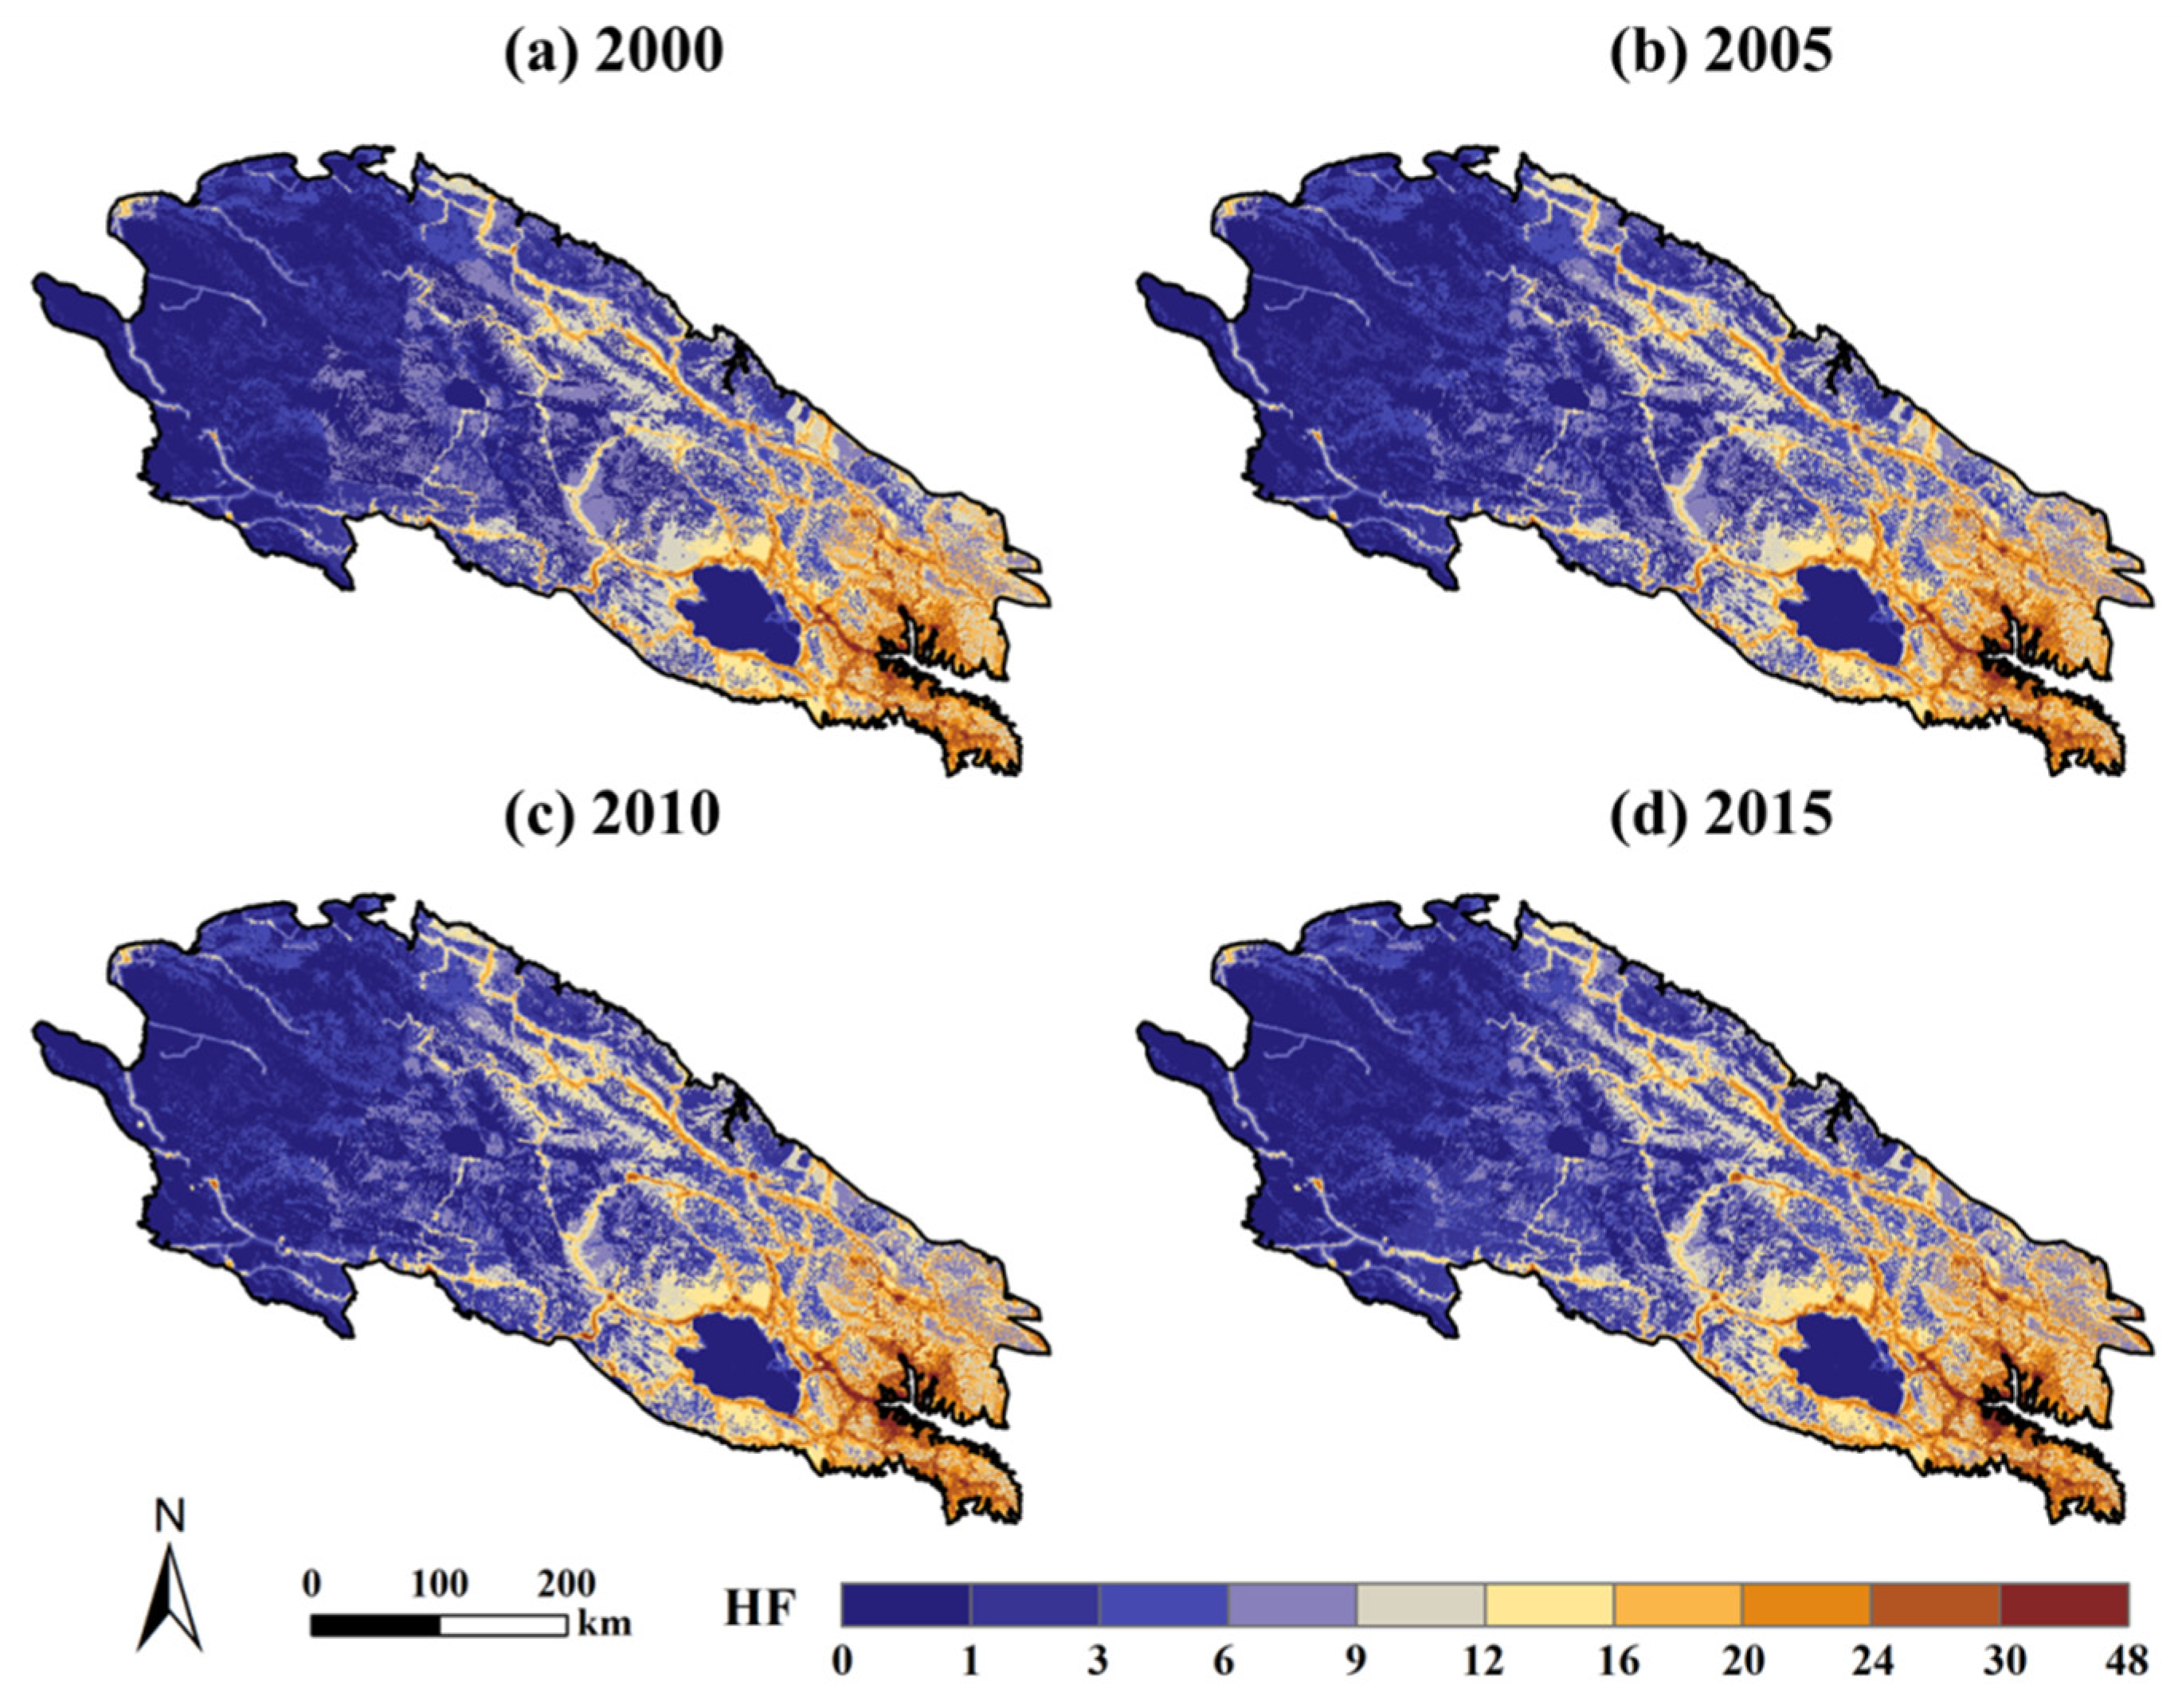
The QLM’s HF values ranged from 0 to 48, with mean values for the four measured years between 2000 and 2015 (i.e., 2000, 2005, 2010, and 2015) of 6.59, 6.81, 6.95, and 7.21, respectively. In the same above-mentioned years, the proportions of areas with HF values lower than the average were 57.41%, 58.77%, 58.90%, and 58.73%, respectively. In terms of the spatial distribution of human pressure (Figure 3), areas with high HF values were concentrated in the eastern QLM, particularly in the eastern part of Qinghai Lake. In the other regions, the HF values were low, especially the bare land areas in the western QLM. In the NR, the mean HF values for the aforementioned years between 2000 and 2015 were 4.77, 4.97, 5.05, and 5.22, respectively. It is worth noting that Gansu and Qinghai were at low levels, while the mean HF value in Qinghai was twice that in Gansu during the 2000–2015 period. Furthermore, croplands exhibited the highest human pressure in the four periods except for built-up land (Table S3), followed by shrublands, forests, grasslands, and wetlands. Bare land had the lowest pressure, and most of the bare land was classified as slight or no pressure.
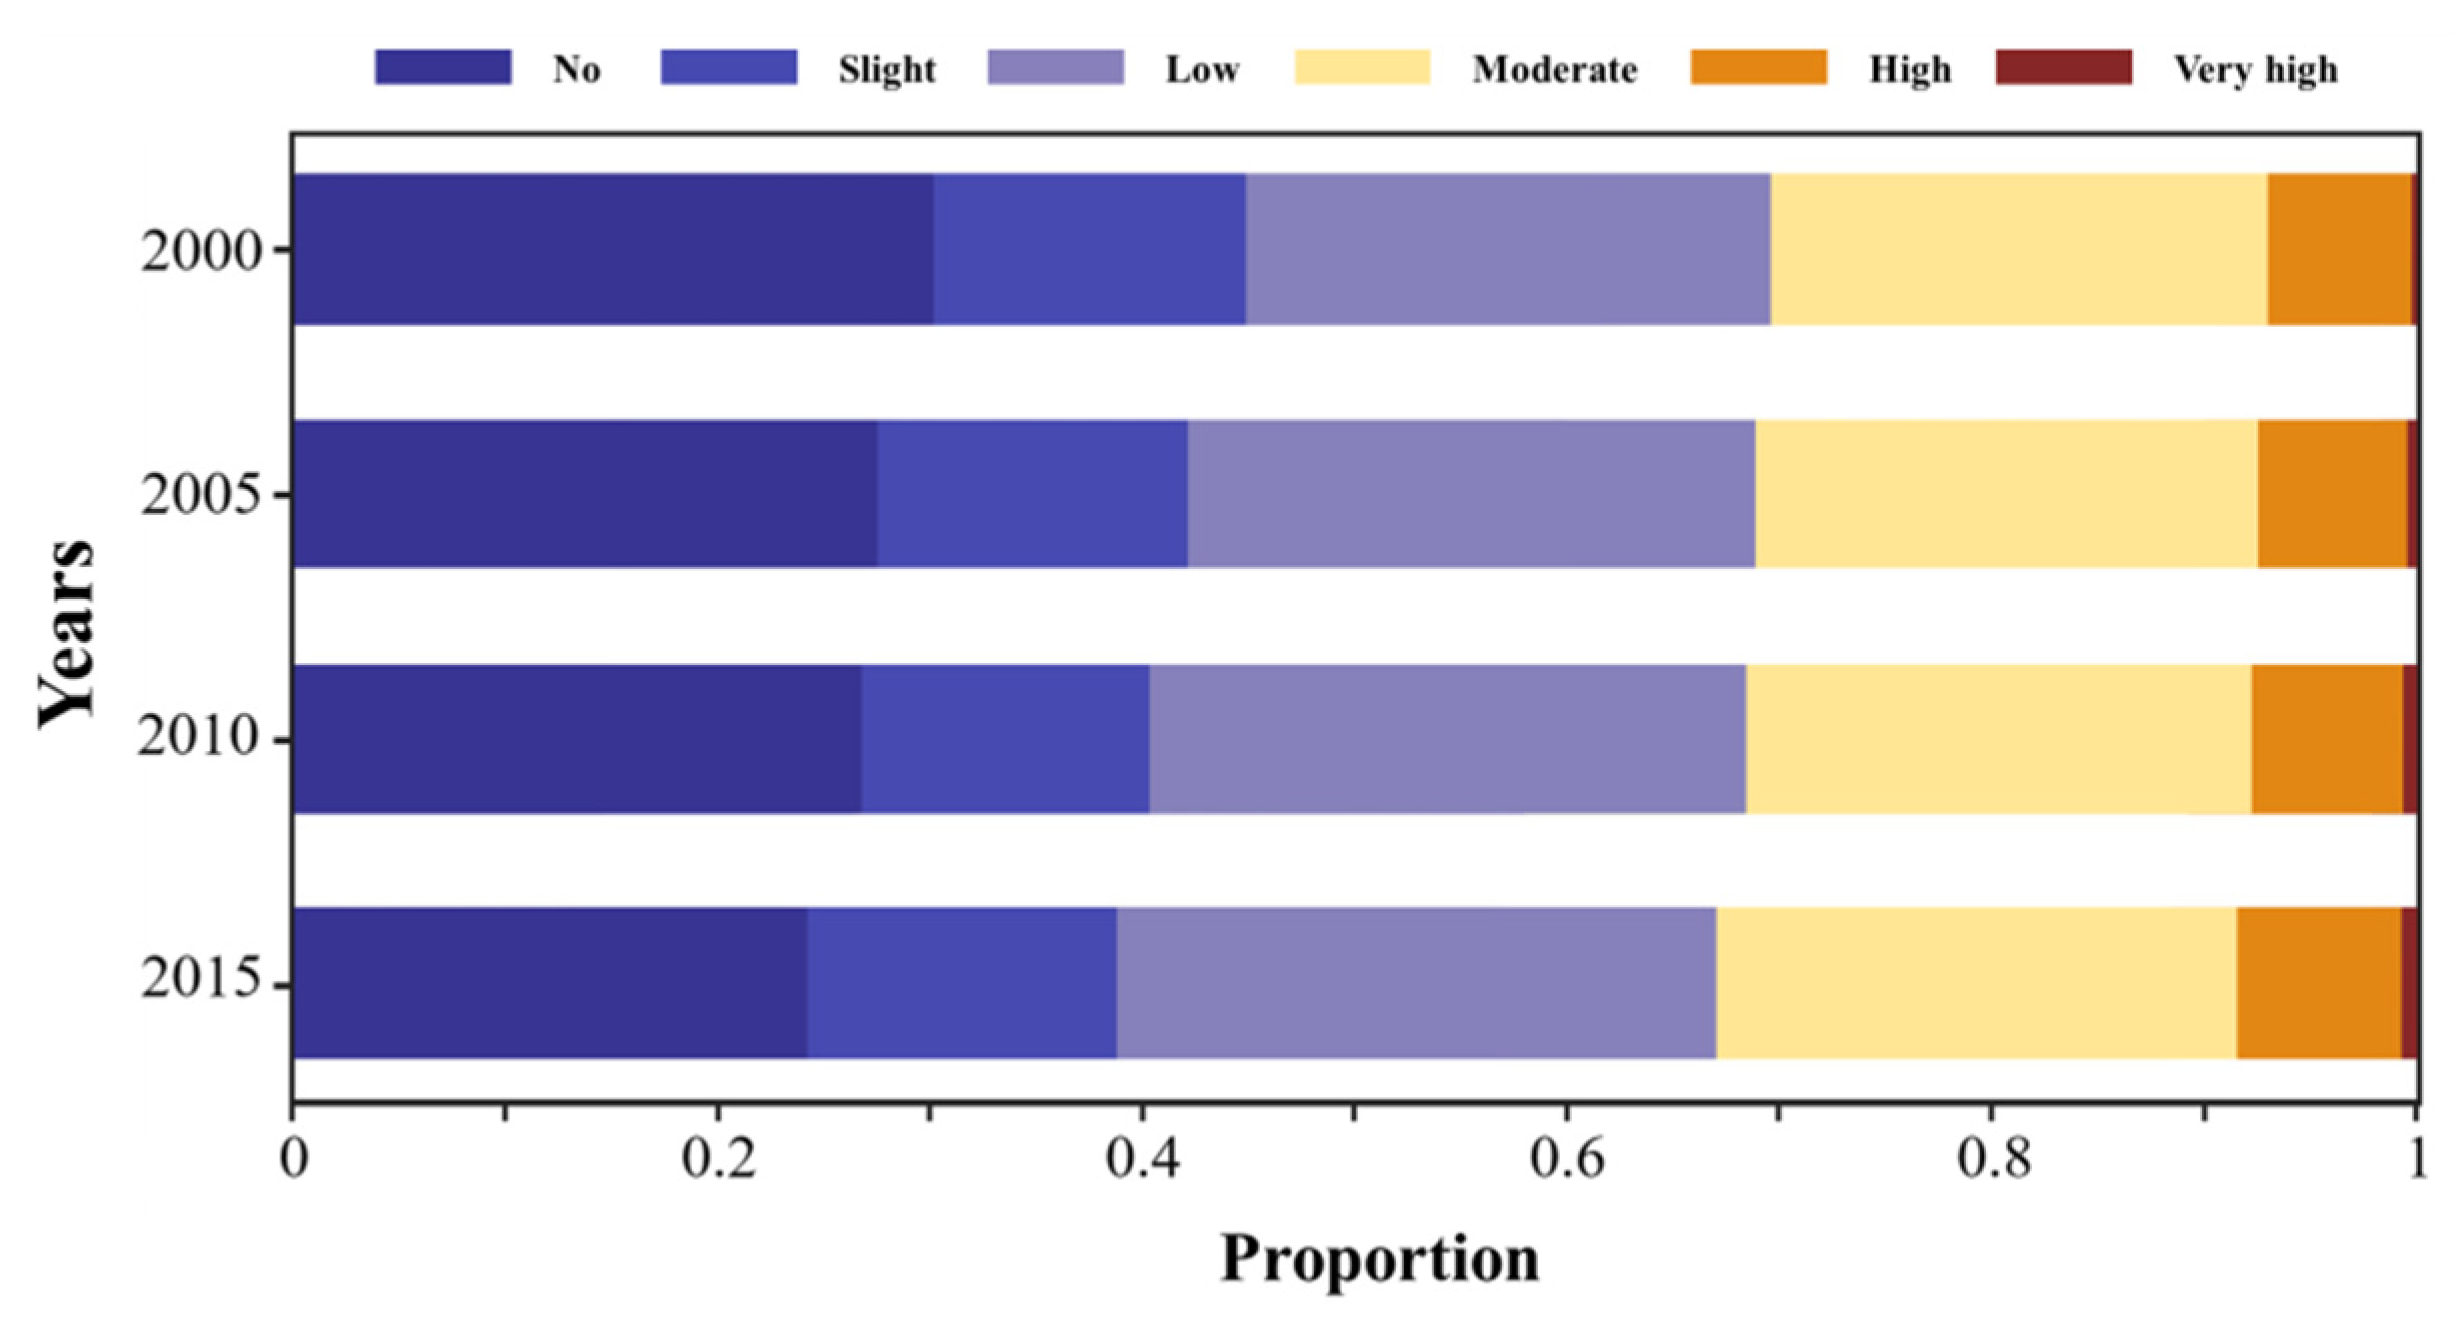
Over the past 16 years, the proportion of the QLM with low pressure and below showed a decreasing trend, from 77.9% in 2000 to 74.9% in 2015 (Figure 4). In contrast, the proportion of regions exceeding the moderate pressure level increased noticeably—especially the areas with very high pressure, which increased by 126% from 2000–2015.
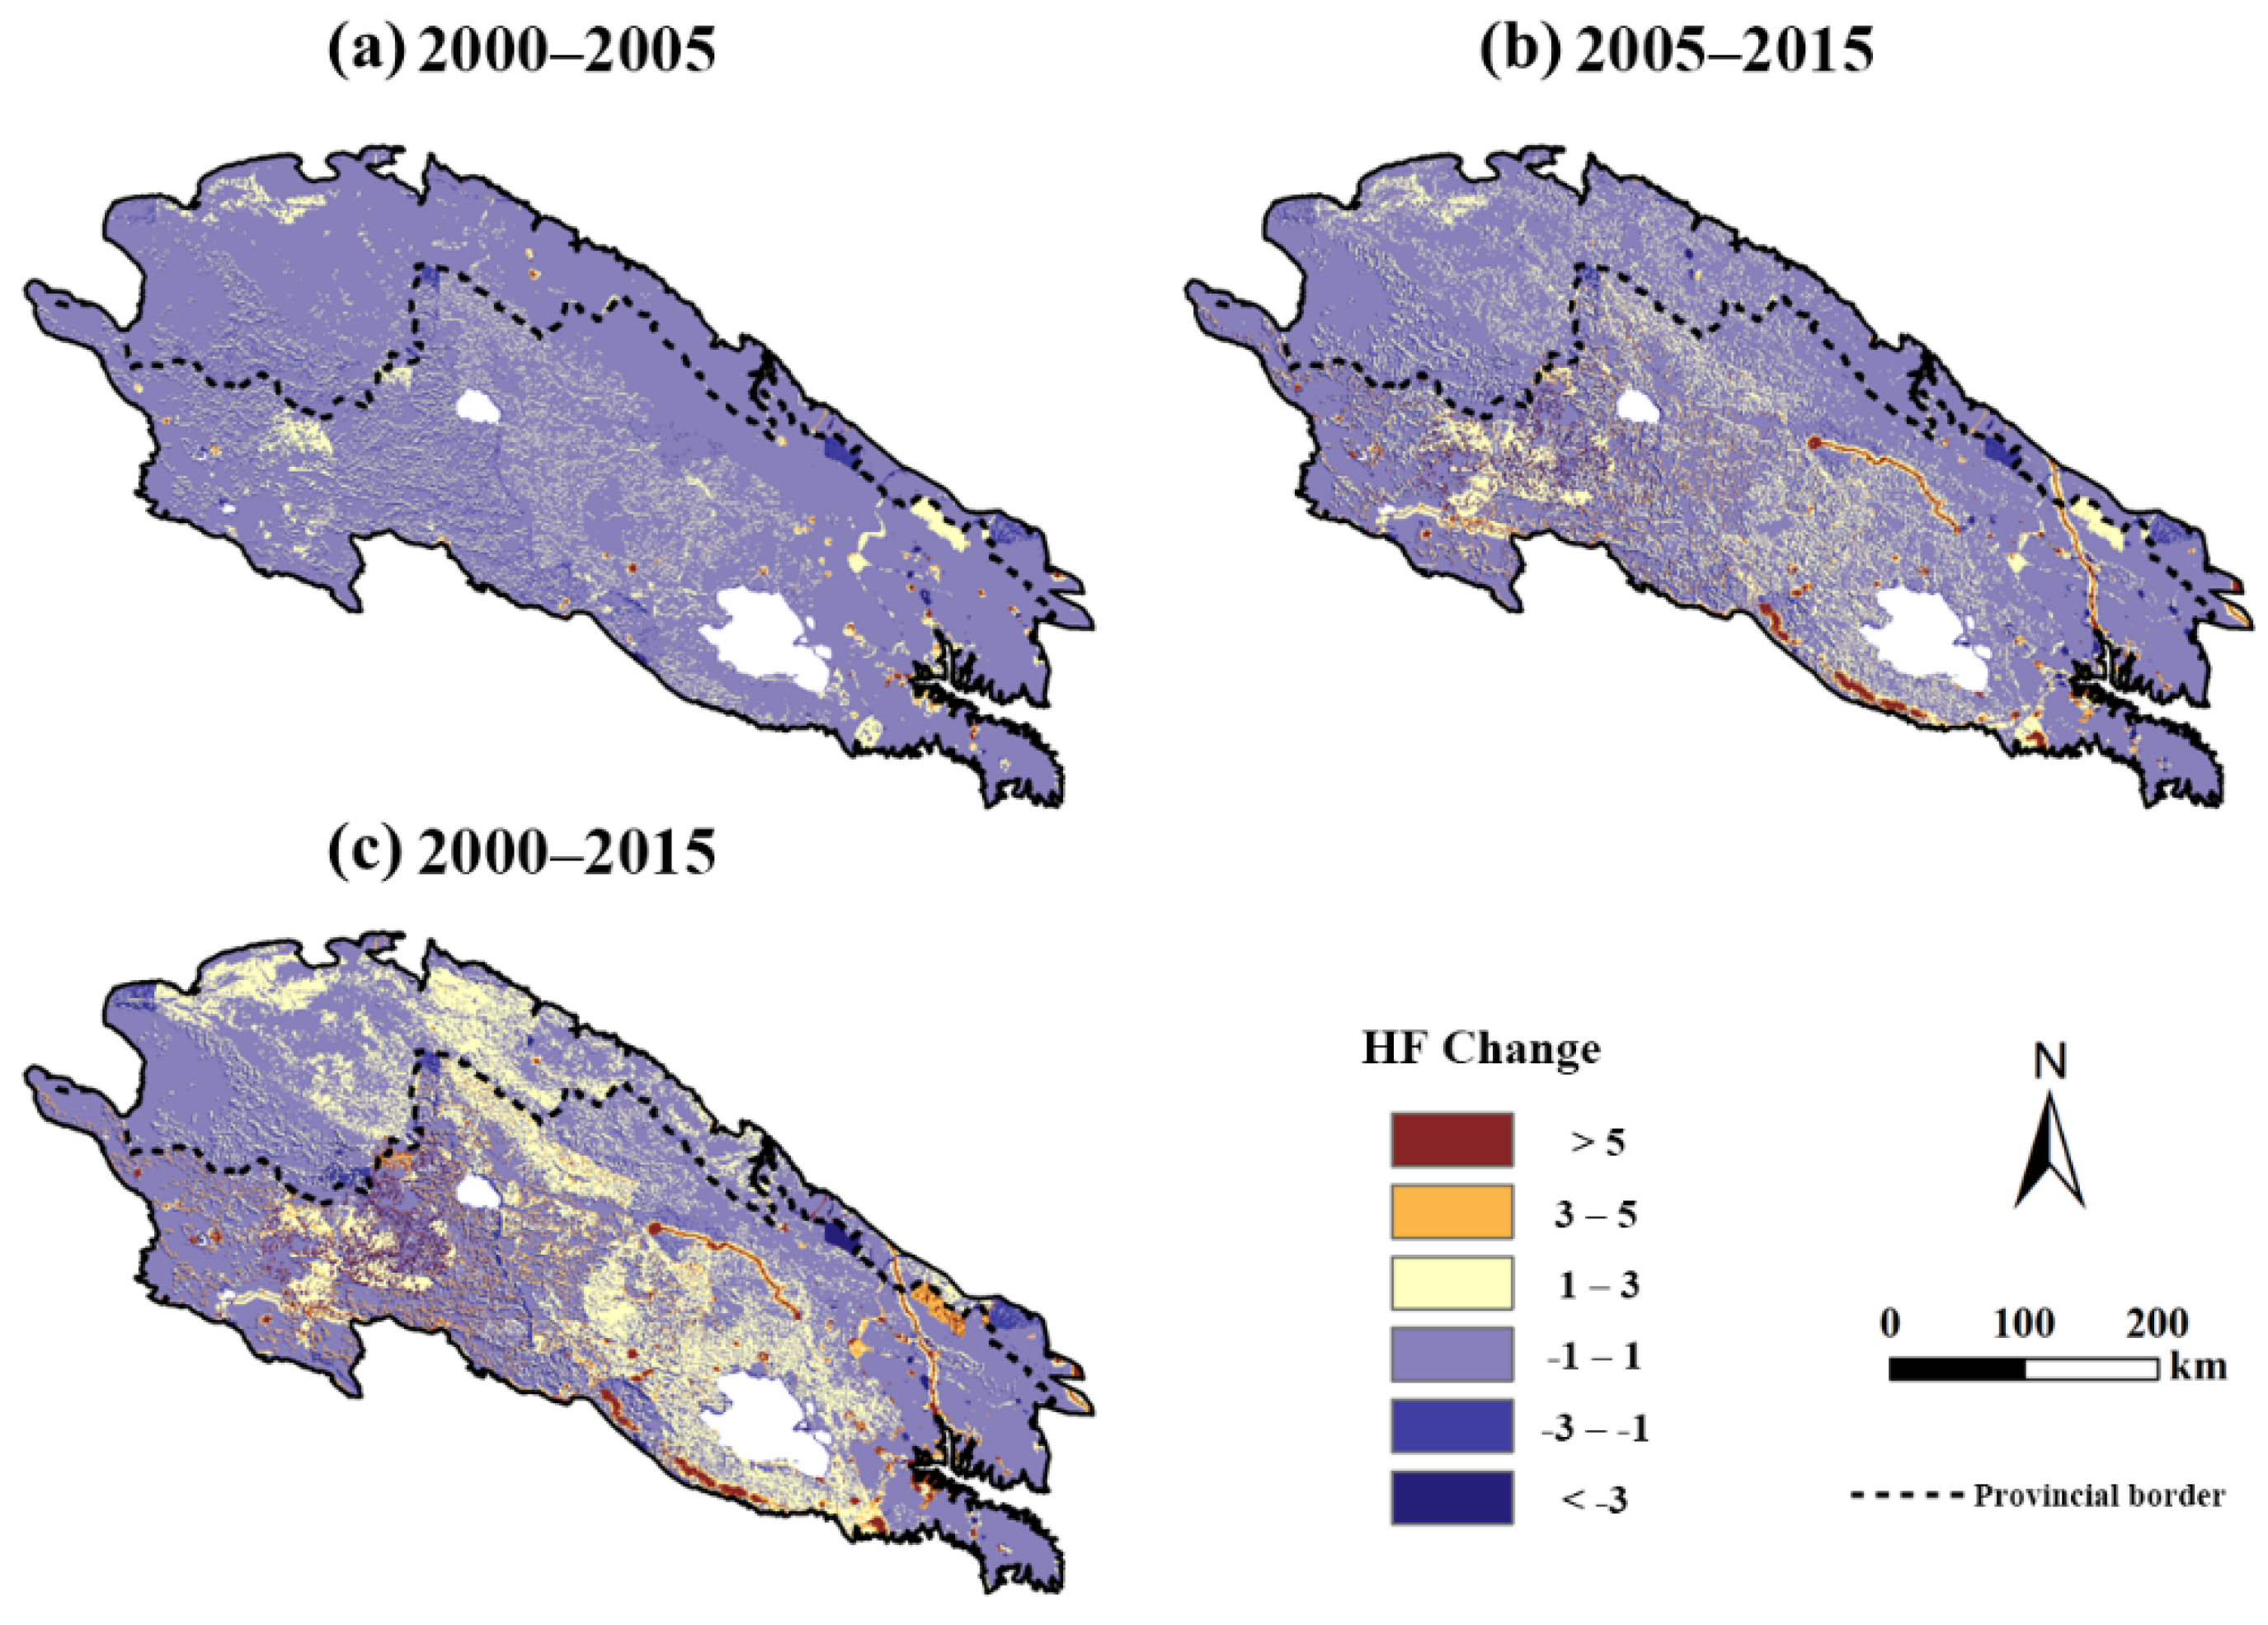
From the perspective of changes in the spatial pattern (Figure 5c), the main regions where the HF changed between 2000 and 2015 included the northwestern QLM and the area around Qinghai Lake. The areas with high-increase changes were concentrated in the eastern and central parts of the QLM, and showed linear or dotted characteristics that were mainly related to the construction of roads and railways, such as the Lanzhou–Xinjiang high-speed railway. There were some regions with a rapid decrease in the northeastern QLM during this period. In addition, the region with an increase in Qinghai was greater than that that in Gansu during the periods 2000–2005 and 2005–2015 (Figure 5a,b).
The HF values indicated that the mean human pressure on the QLM was at a low level during 2000–2015, and the distribution of human pressure showed a spatial pattern in which the eastern region was greater than the western region, while the pressure in Qinghai was higher than that in Gansu.
3.2. NDVI Changes
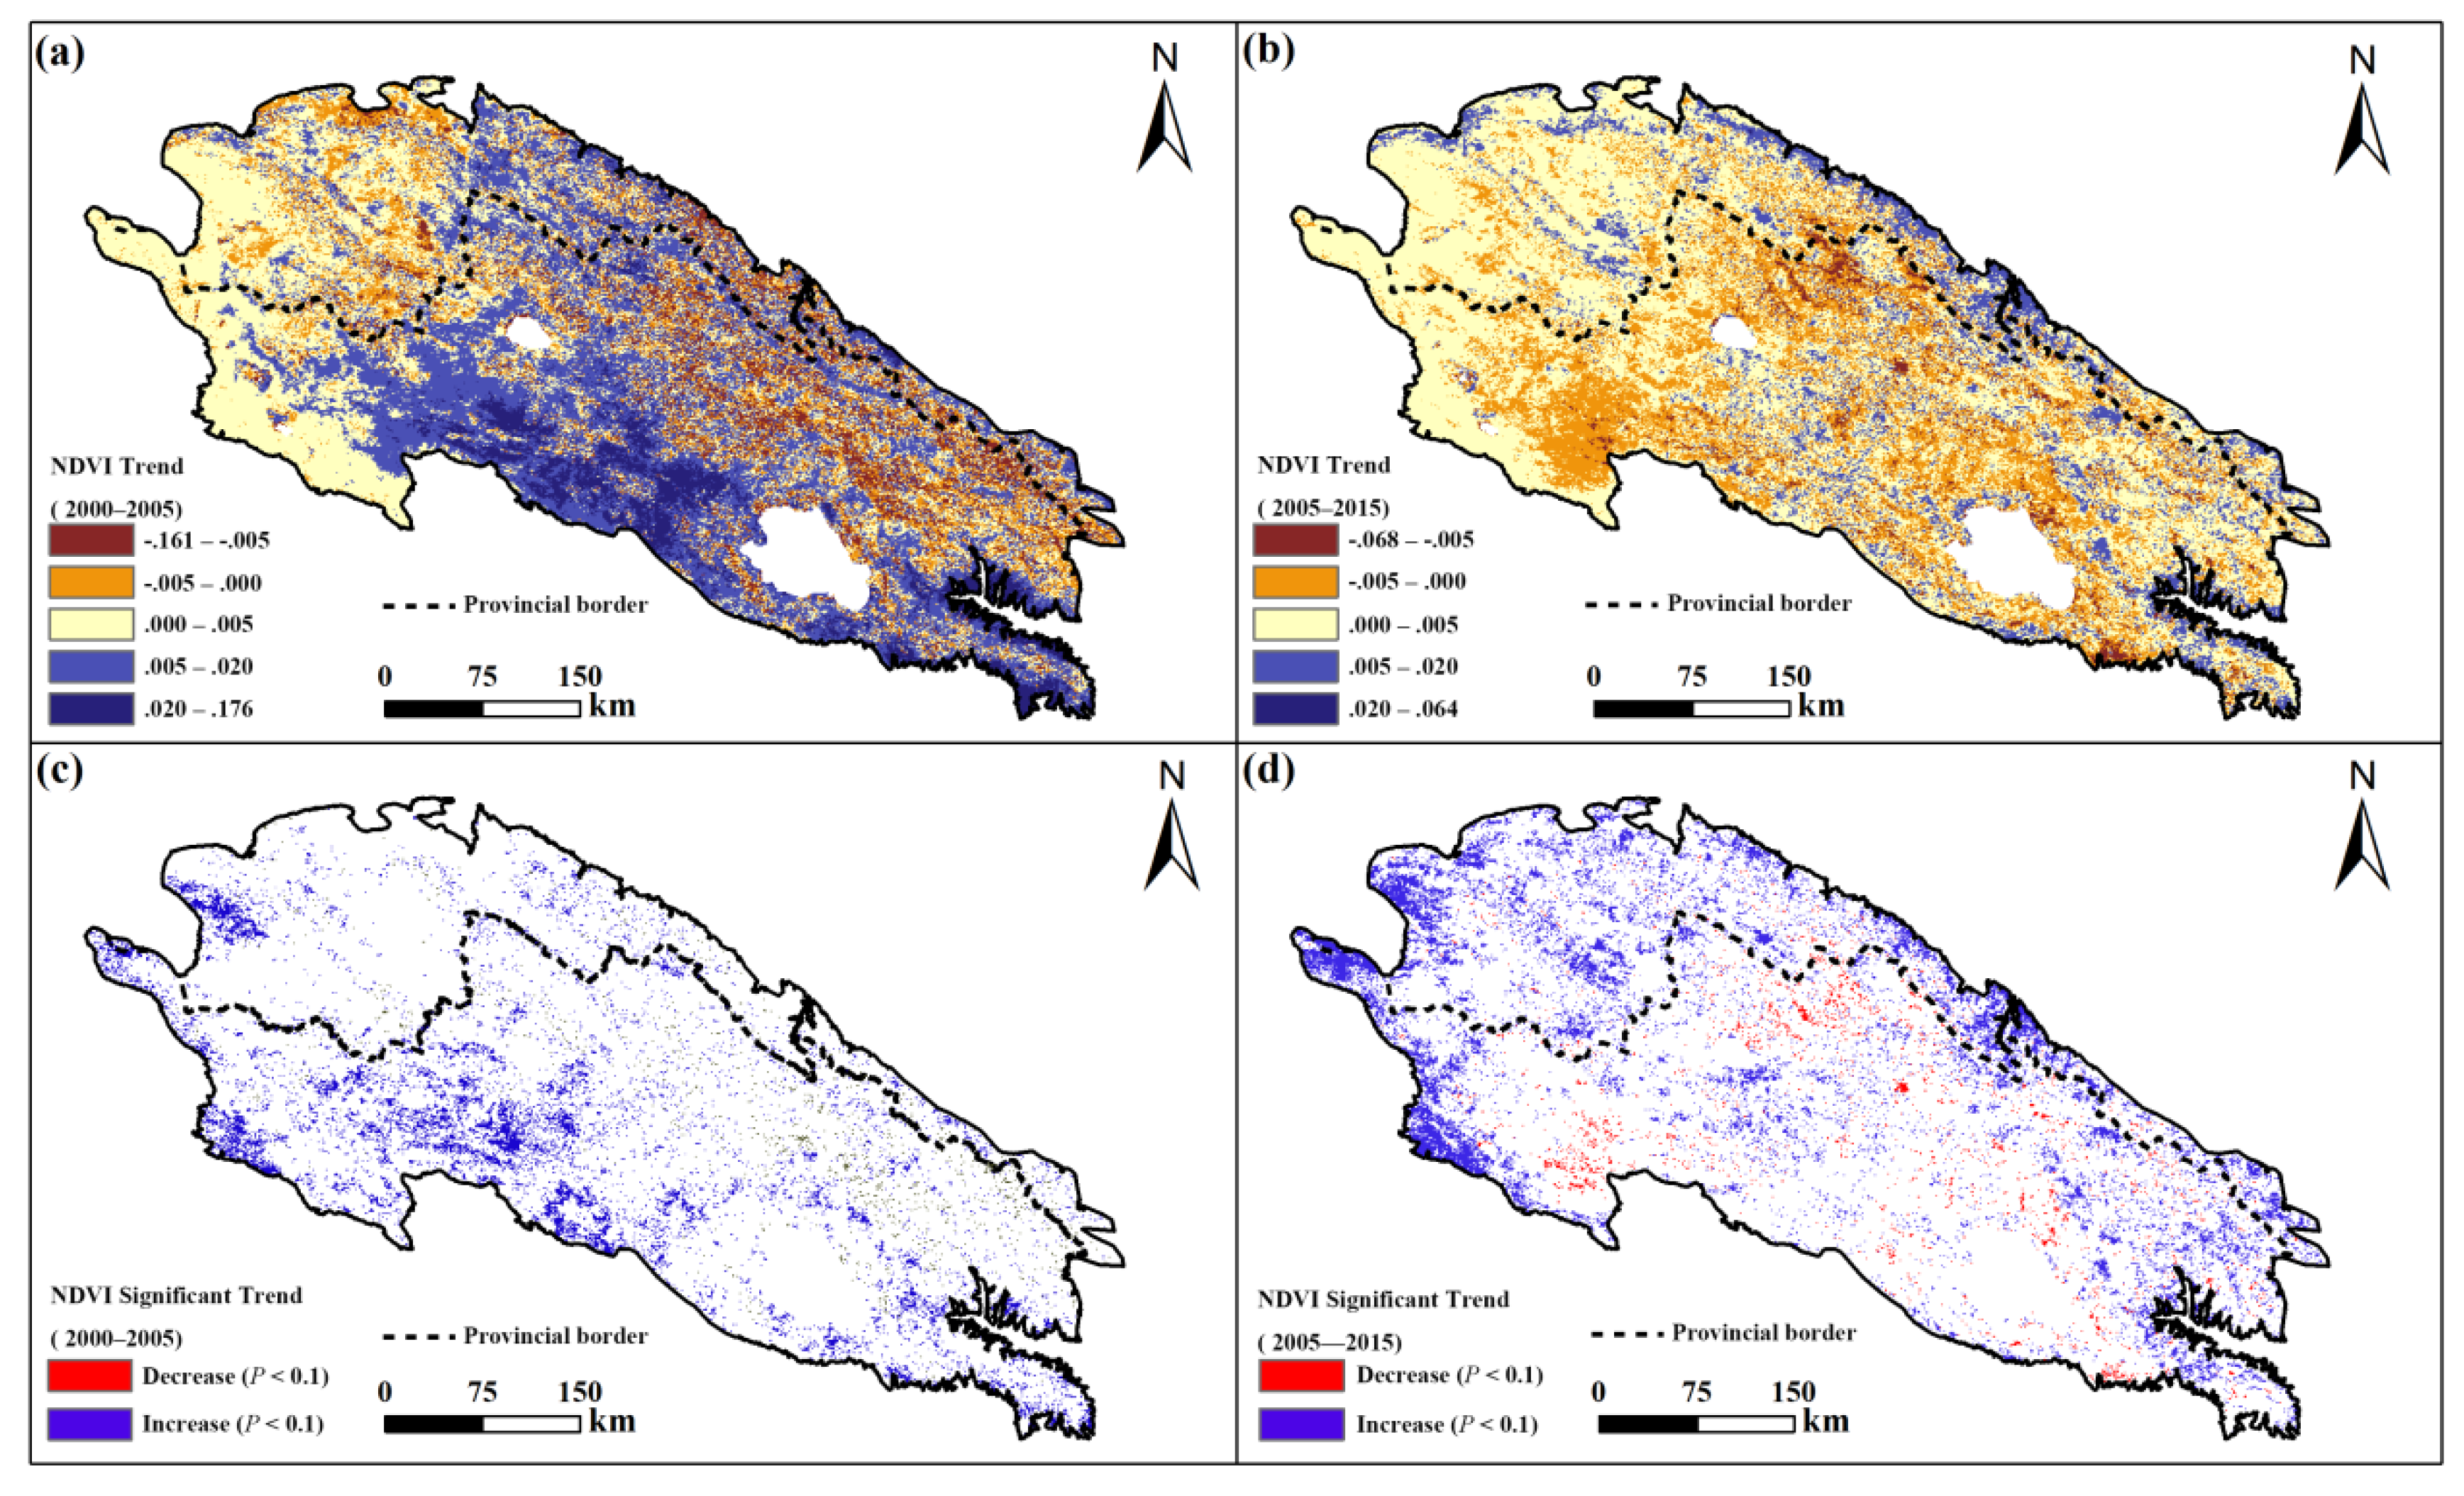
From 2000 to 2015, the average NDVI during the growing season showed a significant increasing trend in the QLM (p < 0.01) (Table S4). By analyzing the local NDVI trend from 2000 to 2005, we found that 21.68% of the areas showed a decreasing trend—8.10% of which appeared in Gansu, and 13.59% of which appeared in Qinghai (Figure 6a). The NDVI data for 2005–2015 accounted for 28.74% of the total area that showed decreases in QLM, including 5.00% in Gansu and 23.74% in Qinghai (Figure 6b). In the NR, the proportion of the NDVI exhibiting decreasing trends from 2000 to 2005 was 32.3%, and dropped to 25.56% in 2005–2015.
Furthermore, we analyzed the distribution of NDVI with a significant trend (p < 0.1) in the QLM (Figure 6c,d), and the area with a significant trend in the period 2005–2015 was larger than that in the period 2000–2005, with significant declines concentrated in the central QLM. For the different vegetation types, the results for 2005–2015 were similar to those for 2000–2005, and the significant trend was mostly observed in grasslands and bare land areas. Compared with Gansu, Qinghai accounted for a larger proportion of significant declines in the period 2000–2015, and the NR shared a smaller proportion of significant increase, but showed an increased trend, with an increase of 19%.
3.3. Human Effects on Vegetation
To explore the effects of human activities on vegetation, we investigated the relationship between the NDVI trends and the changes in the HF in the QLM (Figure 7). We found that the correlation coefficients in the Gansu and Qinghai regions for 2000–2005 were positive, but there was a negative correlation in Qinghai for 2005–2015.
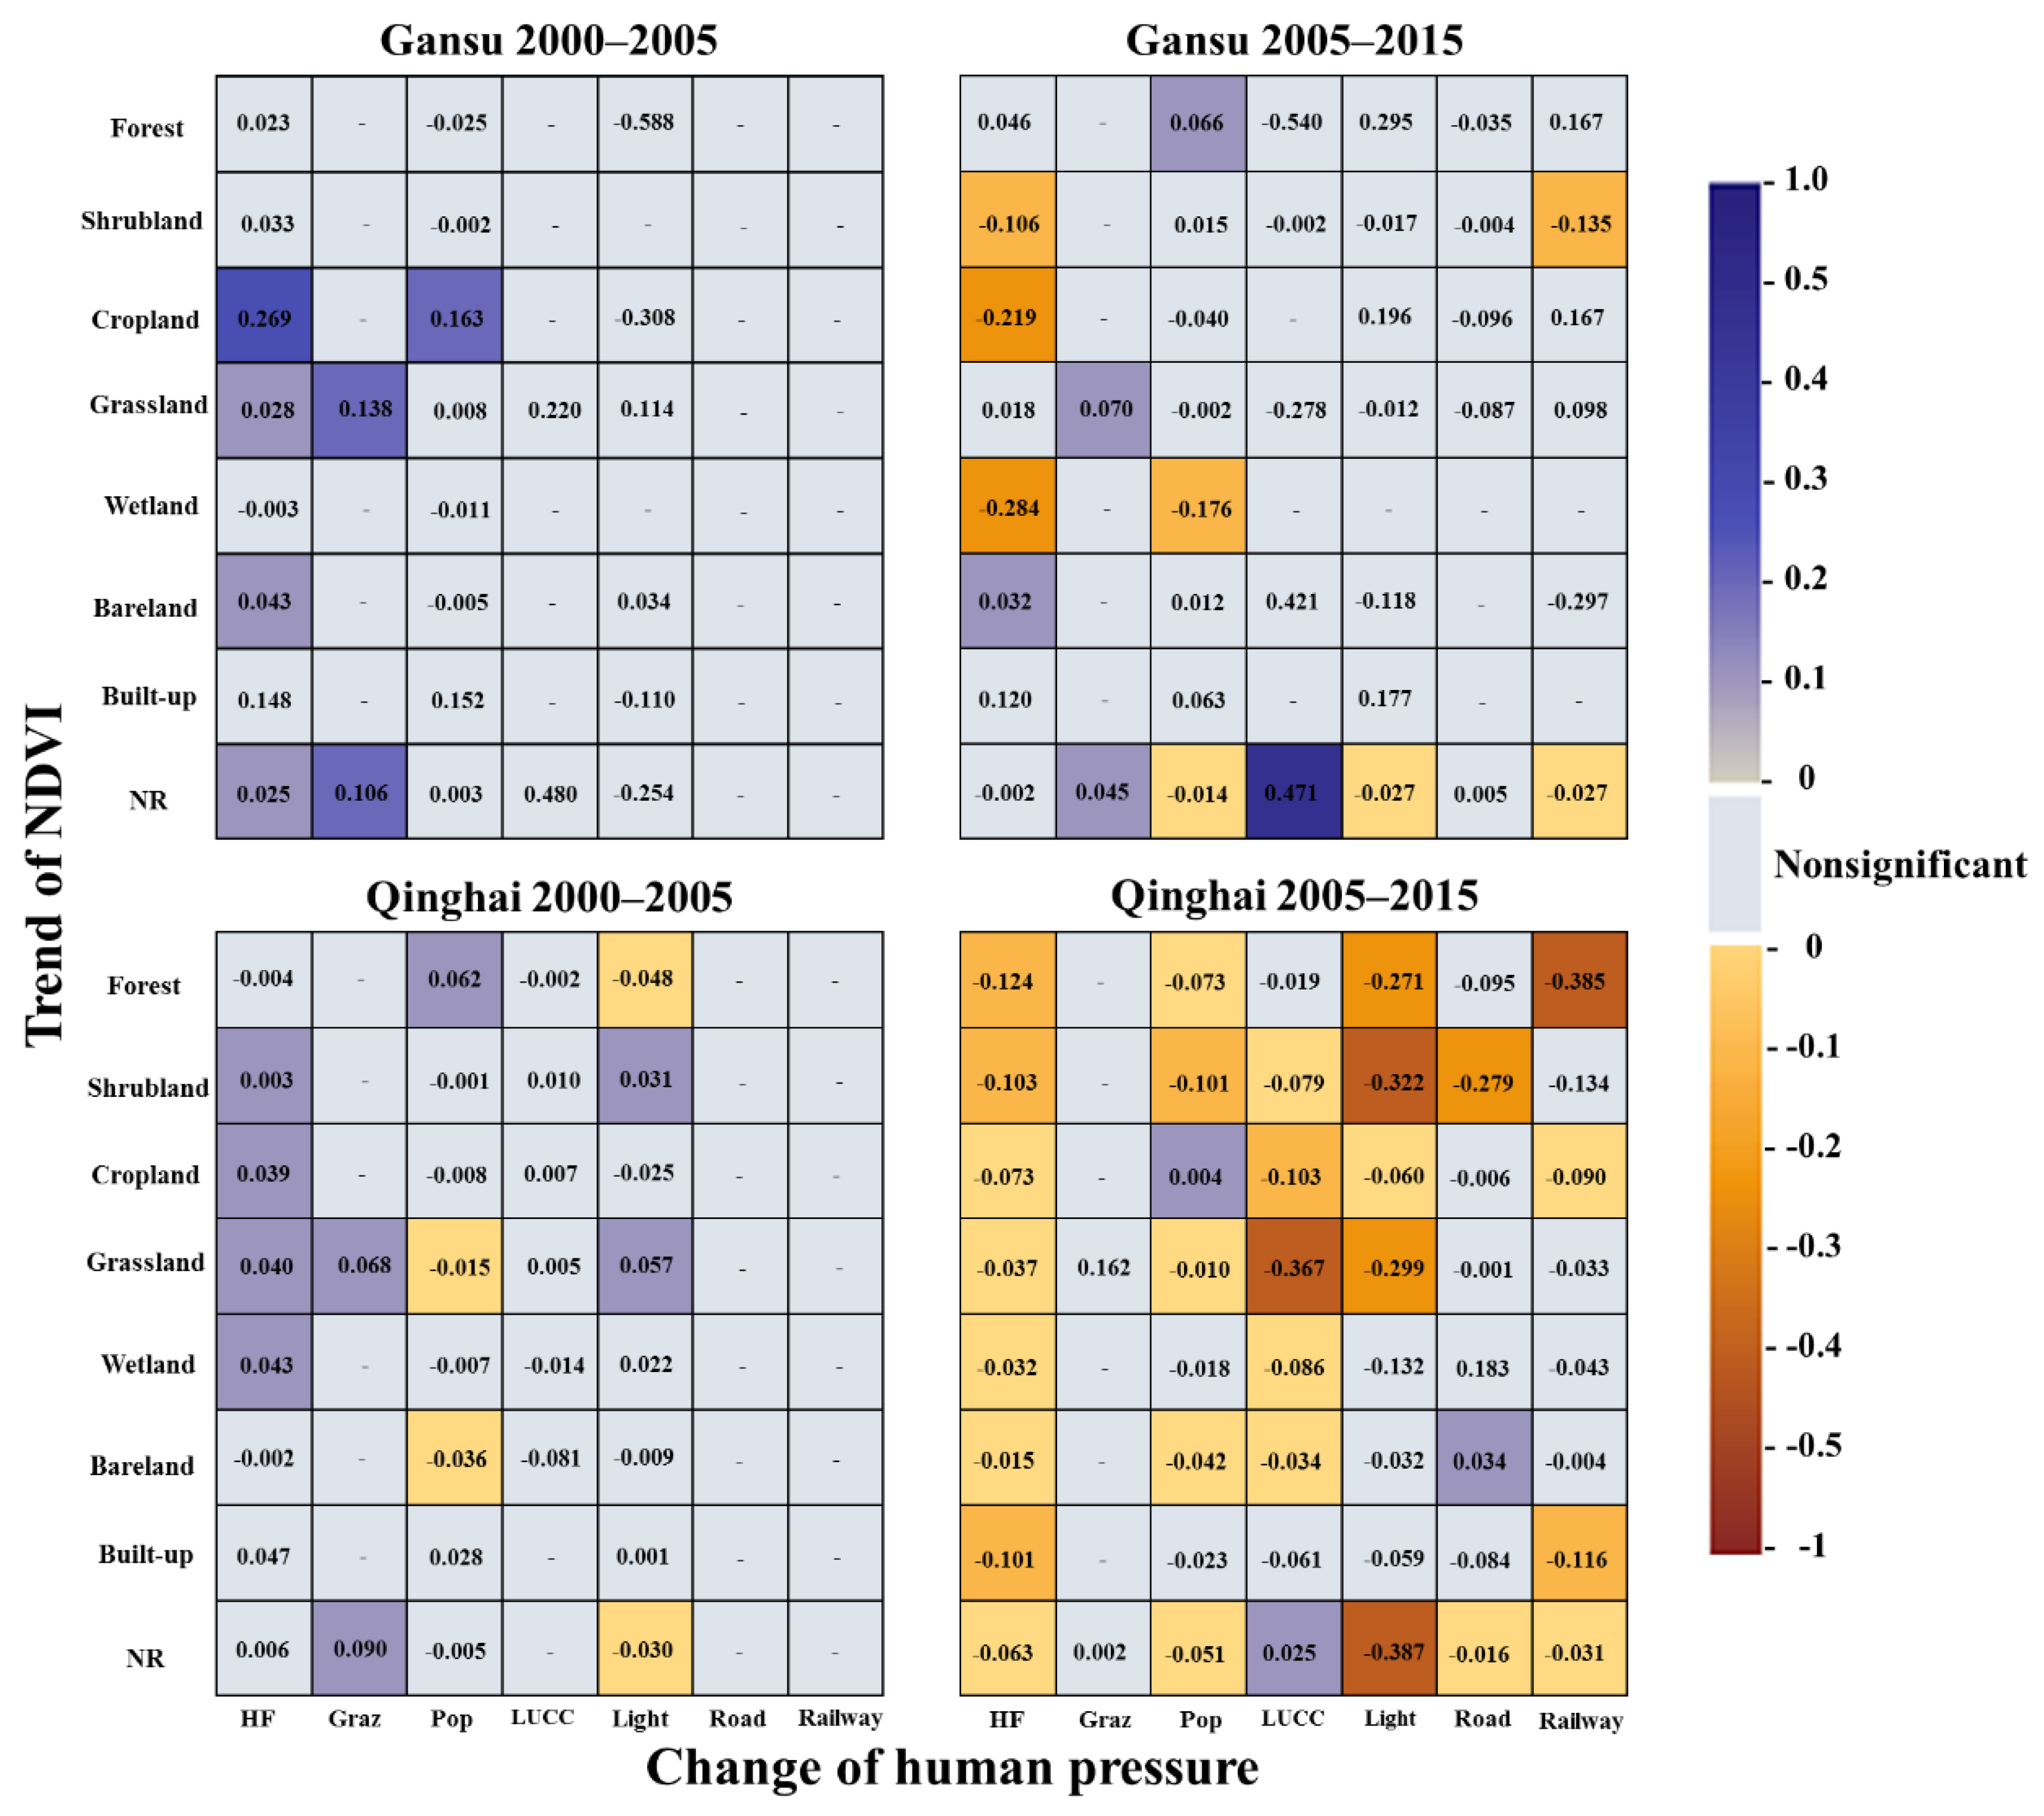
To further explore the impact of human activities on different vegetation types, the relationship between the NDVI trends of different vegetation types and the changes in human pressure—including the HF and six individual pressures—was investigated (Figure 8). In the period 2000–2005, the relationship in Gansu and Qinghai mainly showed a positive correlation, and a negative correlation appeared between the NDVI trends of forests and changes in human pressure related to changes in night-time light in Qinghai. In the period 2005–2015, most relationships showed a negative correlation. Especially in Qinghai, the HF change showed a negative correlation with most types of vegetation, which is closely related to the change in night-time light, land use/cover, and railways; grasslands, shrublands, and forests were the most affected (in decreasing order). For Gansu, during this period, the negative effects of human pressure changes also increased gradually, and wetlands, croplands, and shrublands were the most affected areas by population changes and railways. For the NR, the relationships between the NDVI trend and most of the different human pressure changes showed a negative correlation, but the human pressure caused by land use/cover changes showed a positive relationship at all times. The analysis indicated that vegetation in 2005–2015 experienced a greater impact from human activities, especially in Qinghai.
4. Discussion
4.1. Human Positive Effects
From 2000 to 2015, the NDVI in most areas of the QLM showed an increasing trend. In addition to the positive influence of climate factors, human activities also played a crucial role. Comparing the HF map with the NDVI trends across the QLM, there were some areas with high human pressure, but the NDVI trends still showed an increase, and were even greater in some areas with low pressure, such as the surrounding areas of Xining and the northern edge of the QLM, which was likely related to the government paying more attention to the protection of surrounding vegetation during urban development, and various protective measures, such as forest planting and vegetation restoration around artificial construction projects [46].
In addition, the government has implemented some national ecological projects—such as protecting natural forests [47], converting farmland to forests/grasslands [48], and constructing national reserves—and these efforts were shown to have a positive influence on vegetation in the QLM. Taking Minle County and Shandan County in the northern part of the QLM as examples, since the project of returning farmland to forests/grasslands was implemented in 2002, the areas of farmland returned to forests/grasslands now exceed 3.5 × 10⁴ hm² and 2.8 × 10⁴ hm², respectively. As a key biodiversity conservation area, the NR has also effectively promoted the protection of regional vegetation. The average HF values in the NR were smaller than the average value in the QLM, and the relationship between changes in land use and NDVI trends showed a positive correlation in the period 2000–2015. According to the statistics, the forest area of the reserve increased from 0.42 × 10⁷ hm² at the beginning of the establishment of the reserve to more than 0.93 × 10⁷ hm², and the comprehensive coverage of forests and grasslands increased from 40% to 60%. These findings indicate that the implementation of these projects has had a positive effect on the growth of vegetation in the QLM.
4.2. Human Negative Effects
Transportation is a key factor for economic and social development [49]. Since 2005, with the continuous improvement of traffic infrastructure, especially in Qinghai, the QLM have begun to develop rapidly, with an average annual GDP growth rate exceeding 10%. However, based on our results, the construction of facilities has also posed a huge threat to the surrounding vegetation, although protective measures have been taken [50,51]. In addition to the direct impact of facilities, the large number of tourists that comes with the improvement of traffic facilities has led to more threats to vegetation. Taking Qinghai Lake as an example, which is one of the most famous tourist spots in the QLM, since the opening of the Qinghai–Tibet Railway (Golmud–Lhasa) in 2006, the number of visitors has increased rapidly. In the Tibetan Autonomous Prefecture of Hainan, which is the location of Qinghai Lake, the number of tourists and tourism revenue increased by 328% and 779%, respectively, from 2006 to 2015, and the proportion of GDP generated through tourism rose from 2.9% in 2006 to 9.3% in 2015. The rapid increase in travelers and related facilities has led to the occupation of a large amount of grassland and wetland areas. According to statistics, as of 2017, the area illegally occupied by tourism in Haiyan County, Gangcha County, and Gonghe County—which are near Qinghai Lake—exceeded 140 hm². Moreover, illegal occupations also caused water pollution that could further lead to a series of ecological problems [52,53]. This suggests that economic development in the QLM, especially the development of tourism, needs to consider environmental protection more thoroughly.
For the grassland in the QLM, another important reason for the impact of human activities is overgrazing. On the one hand, due to grassland degradation and the implementation of conservation projects, the area of grassland suitable for grazing has decreased; on the other hand, with the development of animal husbandry, the total number of livestock has continued to increase, causing the intensity of grazing to increase and, thus, resulting in overgrazing in some areas [54]. Moderate grazing can help to maintain the biodiversity of grassland ecosystems [55], but the occurrence of overgrazing leads to local grassland degradation. Furthermore, rodent and insect pests that accompany grassland degradation further aggravate grassland degradation [56]. According to our results, the problem of overgrazing in the QLM has been greatly alleviated. However, as a region where animal husbandry is the main industry, only by strictly controlling the scale of industrial development and gradually transferring the industrial population will it be possible to fundamentally resolve the contradiction between grassland and grazing in the QLM.
The reasonable exploitation of natural resources not only drives the development of the economy, but also promotes the transformation of the economy and industry, which may be a good solution to ease the conflict between grassland and livestock. However, due to the pursuit of economic benefits, extensive illegal mining and hydropower construction have appeared in the QLM, causing the ecological environment to deteriorate rapidly in some areas [57]. Although the government implemented unprecedented actions in 2017 to address illegal mining and construction activities, illegal incidents have been consistently reported. Illegal activities that are difficult to prohibit also pose a severe challenge to the local ecological environment.
In the NR, due to the implementation of protection policies, land use changes have always shown a positive impact, but the negative impacts of local areas related to night-time light changes deserve special attention. Changes in night-time light are usually caused by intense human activity, such as the expansion of settlements and the emergence of mining, which indicates that there is intense activity in some areas of the NR, and reflects the existence of flaws in the management of reserves in the past. In 2017, to improve the environmental protection of the QLM, the government established Qilian Mountain National Park to replace the national reserve, and tried to solve the historical problems related to the management of protected areas. However, due to the wide area of the protected area, the protection management and supervision capabilities are still seriously insufficient [58]. Coupled with other issues of restoration, such as the lack of restoration funds and incomplete ecological compensation mechanisms [27], there are still many difficulties in achieving the goals of ecological protection and restoration in the QLM.
4.3. Data Uncertainties
While we used the six categories of data to map the human pressures in the QLM, our results still contain some uncertainties that need to be understood. First, the data employed to map human pressures are poor because the QLM are a remote area with no complete and continuous recorded dataset for 2000–2015. For example, the grazing density data for 2000–2015 were unavailable, so we used the density of cattle and sheep instead; these data were obtained via the extrapolation method, based on statistical yearbook data. Second, the six categories of data did not include all human activities in the QLM, such as tourism and poaching, which indicates that we may have underestimated the pressures in some local areas of the QLM. Third, human activities are interconnected and not isolated. In the HF method, we simply overlaid the pressures without considering the possible impact of the interaction of various activities, which may lead to underestimations of the pressures. Taking roads and forests as examples, the distribution of roads in forests not only has a direct impact, but also leads to the fragmentation of habitats, thereby affecting the entire ecosystem [59]. In addition, our results depict static cumulative human pressures in the QLM for 2000–2015, but human activities are constantly changing in reality, which also increases the data uncertainty.
Despite the above uncertainties, these are the most accurate HF maps currently obtainable for the QLM. To improve the accuracy of the analysis, future studies could expand the data sources of human activities and improve the method of assigning values to obtain more accurate spatial data. Furthermore, human pressure could combine shared socioeconomic pathways (SSPs) using dynamic models [60,61] to predict long-term trends for future natural reserve management.
5. Conclusions
Human activity played a key role in the ecosystem changes in the QLM in the period 2000–2015, with the greenness of vegetation being affected by humans to varying degrees. In our research, six categories of human activity pressures were employed to create temporally consistent HF maps in the QLM for 2000, 2005, 2010, and 2015, at a 1-km scale. Subsequently, further analysis of the relationship between the growing season NDVI trends and the changes in the HF and six separate pressures was performed. The NDVI trend analysis showed that the mean NDVI during the growing season exhibited a significant increasing trend over the entire QLM, while the local areas showed a significant declining trend in the NDVI, which was mainly concentrated in Qinghai. The human pressures across the QLM rapidly increased, and high human pressure appeared primarily in the eastern QLM, while the values were low in the western region. Our results demonstrated that due to the impact of the construction of traffic facilities, tourism, overgrazing, and other illegal activities, grasslands, shrublands, forests, wetlands, and bare land were the vegetation types most affected by human activities (in decreasing order). Furthermore, some ecological projects and the NR have played a crucial role in protecting vegetation. However, for the NR, due to unreasonable management measures, it is difficult to fully perform all functions, and the established national park is facing great difficulties and challenges to achieve its goals. By developing an accurate HF map, reference and guidance can be provided for future protection and restoration of the ecosystem in the QLM.
Supplementary Materials
The following are available online at https://0-www-mdpi-com.brum.beds.ac.uk/article/10.3390/rs13122400/s1: Table S1: Main methods of evaluating and mapping human pressures, Table S2: Influence scores for roads, Table S3: Mean value and changes of HF in different areas of the QLM, Table S4: Slope and significance of average NDVI in different regions during 2000–2015.
Author Contributions
Conceptualization, L.L. and Q.D.; methodology, L.L. and Q.D.; software, Q.D.; validation, Q.D. and L.L.; formal analysis, Q.D. and L.L.; writing—original draft preparation, Q.D.; writing—review and editing, L.L., W.Z., Y.Z. and F.L.; supervision, L.L.; funding acquisition, L.L. and W.Z. All authors have read and agreed to the published version of the manuscript.
Funding
This research was jointly supported by the National Key Research and Development Program of China (2019YFC0507405), the National Natural Science Foundation of China (41871065) and CAS “Light of West China” Program.
Data Availability Statement
The data presented in this study are available on request from the corresponding author. The data are not publicly available due to privacy.
Conflicts of Interest
The authors declare no conflict of interest.
References
- Malhi, Y.; Roberts, J.T.; Betts, R.A.; Killeen, T.J.; Li, W.; Nobre, C.A. Climate Change, Deforestation, and the Fate of the Amazon. Science 2008, 319, 169–172. [Google Scholar] [CrossRef] [Green Version]
- Crutzen, P.J. Geology of mankind. Nat. Cell Biol. 2002, 415, 23. [Google Scholar] [CrossRef]
- Fleskens, L.; Stringer, L.C. Land Management and Policy Responses to Mitigate Desertification and Land Degradation. Land Degrad. Dev. 2014, 25, 1–4. [Google Scholar] [CrossRef]
- Artmann, M. Institutional efficiency of urban soil sealing management–From raising awareness to better implementation of sustainable development in Germany. Landsc. Urban Plan. 2014, 131, 83–95. [Google Scholar] [CrossRef]
- Cózar, A.; Echevarría, F.; González-Gordillo, J.I.; Irigoien, X.; Úbeda, B.; Hernández-León, S.; Palma Álvaro, T.; Navarro, S.; García-De-Lomas, J.; Ruiz, A.; et al. Plastic debris in the open ocean. Proc. Natl. Acad. Sci. USA 2014, 111, 10239–10244. [Google Scholar] [CrossRef] [PubMed] [Green Version]
- Costelloe, B.; Collen, B.; Milner-Gulland, E.; Craigie, I.D.; McRae, L.; Rondinini, C.; Nicholson, E. Global Biodiversity Indicators Reflect the Modeled Impacts of Protected Area Policy Change. Conserv. Lett. 2015, 9, 14–20. [Google Scholar] [CrossRef]
- Sukhdev, P.; Kumar, P. The Economics of Ecosystems and Biodiversity (TEEB); European Communities: Wesseling, Germany, 2008. [Google Scholar]
- Sanderson, E.W.; Jaiteh, M.; Levy, M.A.; Redford, K.H.; Wannebo, A.V.; Woolmer, G. The Human Footprint and the Last of the Wild. BioScience 2002, 52, 891–904. [Google Scholar] [CrossRef]
- McCloskey, J.M.; Spalding, H. A Reconnaissance-Level Inventory of the Amount of Wilderness Remaining in the World. Ambio 1989, 18, 221–227. [Google Scholar]
- Alkemade, R.; Van Oorschot, M.; Miles, L.; Nellemann, C.; Bakkenes, M.; Brink, B.T. GLOBIO3: A Framework to Investigate Options for Reducing Global Terrestrial Biodiversity Loss. Ecosystem 2009, 12, 374–390. [Google Scholar] [CrossRef] [Green Version]
- Ellis, E.; Ramankutty, N. Putting people in the map: Anthropogenic biomes of the world. Front. Ecol. Environ. 2008, 6, 439–447. [Google Scholar] [CrossRef] [Green Version]
- Jacobson, A.P.; Riggio, J.; Tait, A.; Baillie, J.E.M. Global areas of low human impact (‘Low Impact Areas’) and fragmentation of the natural world. Sci. Rep. 2019, 9, 1–13. [Google Scholar] [CrossRef]
- Kennedy, C.M.; Oakleaf, J.R.; Theobald, D.M.; Baruch-Mordo, S.; Kiesecker, J. Managing the middle: A shift in conservation priorities based on the global human modification gradient. Glob. Chang. Biol. 2019, 25, 811–826. [Google Scholar] [CrossRef]
- Geldmann, J.; Manica, A.; Burgess, N.D.; Coad, L.; Balmford, A. A global-level assessment of the effectiveness of protected areas at resisting anthropogenic pressures. Proc. Natl. Acad. Sci. USA 2019, 116, 23209–23215. [Google Scholar] [CrossRef]
- Venter, O.; Sanderson, E.W.; Magrach, A.; Allan, J.R.; Beher, J.; Jones, K.R.; Possingham, H.P.; Laurance, W.F.; Wood, P.; Fekete, B.M.; et al. Sixteen years of change in the global terrestrial human footprint and implications for biodiversity conservation. Nat. Commun. 2016, 7, 12558. [Google Scholar] [CrossRef] [Green Version]
- Karimi, A.; Jones, K. Assessing national human footprint and implications for biodiversity conservation in Iran. Ambio 2020, 49, 1506–1518. [Google Scholar] [CrossRef]
- Verma, M.; Symes, W.S.; Watson, J.E.M.; Jones, K.R.; Allan, J.R.; Venter, O.; Rheindt, F.E.; Edwards, D.P.; Carrasco, L.R. Severe human pressures in the Sundaland biodiversity hotspot. Conserv. Sci. Pract. 2020, 2, 169. [Google Scholar] [CrossRef] [Green Version]
- Jones, K.R.; Venter, O.; Fuller, R.A.; Allan, J.R.; Maxwell, S.L.; Negret, P.J.; Watson, J.E.M. One-third of global protected land is under intense human pressure. Science 2018, 360, 788–791. [Google Scholar] [CrossRef] [PubMed] [Green Version]
- Luo, L.; Duan, Q.; Wang, L.; Zhao, W.; Zhuang, Y. Increased human pressures on the alpine ecosystem along the Qinghai-Tibet Railway. Reg. Environ. Chang. 2020, 20, 1–13. [Google Scholar] [CrossRef]
- Li, S.; Zhang, Y.; Wang, Z.; Li, L. Mapping human influence intensity in the Tibetan Plateau for conservation of ecological service functions. Ecosyst. Serv. 2018, 30, 276–286. [Google Scholar] [CrossRef]
- Riggio, J.; Baillie, J.E.M.; Brumby, S.; Ellis, E.; Kennedy, C.M.; Oakleaf, J.R.; Tait, A.; Tepe, T.; Theobald, D.M.; Venter, O.; et al. Global human influence maps reveal clear opportunities in conserving Earth’s remaining intact terrestrial ecosystems. Glob. Chang. Biol. 2020, 26, 4344–4356. [Google Scholar] [CrossRef]
- Qian, D.; Cao, G.; Du, Y.; Li, Q.; Guo, X. Impacts of climate change and human factors on land cover change in inland mountain protected areas: A case study of the Qilian Mountain National Nature Reserve in China. Environ. Monit. Assess. 2019, 191, 486. [Google Scholar] [CrossRef]
- Jiao, L.; Zhao, C.Z. The analysis and evaluation on grassland ecosystem service function value of Shandan Horse Field in Qilian Mountain National Nature Reserve. J. Arid Land Resour. Environ. 2013, 27, 47–52. [Google Scholar] [CrossRef]
- Song, X.; Yan, C.; Xie, J.; Li, S. Assessment of changes in the area of the water conservation forest in the Qilian Mountains of China’s Gansu province, and the effects on water conservation. Environ. Earth Sci. 2011, 66, 2441–2448. [Google Scholar] [CrossRef]
- Li, X.; Gou, X.H.; Wang, N.L.; Sheng, Y.; Jin, H.J.; Qi, Y.; Song, X.Y.; Hou, F.J.; Li, Y.; Zhao, C.M.; et al. Tightening ecological management facilitates green development in the Qilian Mountains. Chin. Sci. Bull. 2019, 64, 2928–2937. [Google Scholar] [CrossRef] [Green Version]
- Yao, Z.; Zhao, C.; Yang, K.; Liu, W.; Li, Y.; You, J.; Xiao, J. Alpine grassland degradation in the Qilian Mountains, China–A case study in Damaying Grassland. Catena 2016, 137, 494–500. [Google Scholar] [CrossRef]
- Wang, T.; Gao, F.; Wang, B.; Wang, P.; Wang, Q.; Song, H.; Yin, C. Status and suggestions on ecological protec-tion and restoration of Qilian Mountains. J. Glaciol. Geocryol. 2017, 39, 229–234. [Google Scholar] [CrossRef]
- Gobattoni, F.; Pelorosso, R.; Lauro, G.; Leone, A.; Monaco, R. A procedure for mathematical analysis of landscape evolution and equilibrium scenarios assessment. Landsc. Urban Plan. 2011, 103, 289–302. [Google Scholar] [CrossRef]
- Fischer, J.; Lindenmayer, D.B. Landscape modification and habitat fragmentation: A synthesis. Glob. Ecol. Biogeogr. 2007, 16, 265–280. [Google Scholar] [CrossRef]
- Guo, W.; Liu, H.; Anenkhonov, O.; Shangguan, H.; Sandanov, D.; Korolyuk, A.Y.; Hu, G.; Wu, X. Vegetation can strongly regulate permafrost degradation at its southern edge through changing surface freeze-thaw processes. Agric. For. Meteorol. 2018, 252, 10–17. [Google Scholar] [CrossRef]
- Baranova, A.; Schickhoff, U.; Wang, S.; Jin, M. Mountain pastures of Qilian Shan: Plant communities, grazing impact and degradation status (Gansu province, NW China). Hacquetia 2016, 15, 21–35. [Google Scholar] [CrossRef] [Green Version]
- Geng, L.; Che, T.; Wang, X.; Wang, H. Detecting Spatiotemporal Changes in Vegetation with the BFAST Model in the Qilian Mountain Region during 2000–2017. Remote. Sens. 2019, 11, 103. [Google Scholar] [CrossRef] [Green Version]
- Cheng, Y.; Xu, D.X.; Guo, N. Analysis on the Vegetation Change in the Qilian Mountains since Recent 22 Years. Arid Zone Res. 2008, 25, 772–777. [Google Scholar] [CrossRef]
- Deng, S.-F.; Yang, T.-B.; Zeng, B.; Zhu, X.-F.; Xu, H.-J. Vegetation cover variation in the Qilian Mountains and its response to climate change in 2000–2011. J. Mt. Sci. 2013, 10, 1050–1062. [Google Scholar] [CrossRef]
- Wang, L.; Song, W.; Zhang, J.; Ma, X.; Zhao, H.; Huang, X. Spatio-temporal evolution of vegetation net primary productivity in Qilian Mountain National Park and its driving factors. Pratacultural Sci. 2020, 37, 1458–1474. [Google Scholar] [CrossRef]
- Zhang, F.-G.; Zeng, B.; Yang, T.-B. Spatiotemporal distribution changes in alpine desert belt in Qilian Mountains under climate changes in past 30 years. Chin. J. Plant Ecol. 2019, 43, 305–319. [Google Scholar] [CrossRef]
- Gui, J.; Wang, X.F.; Li, Z.X.; Zou, H.M.; Li, A.J. Research on the response of vegetation change to human activi-ties in typical cryosphere areas: Taking the Qilian Mountains as an example. J. Glaciol. Geocryol. 2019, 41, 1235–1243. [Google Scholar]
- Wei, Y.; Lu, H.; Wang, J.; Sun, J.; Wang, X. Responses of vegetation zones, in the Qinghai-Tibetan Plateau, to climate change and anthropogenic influences over the last 35 years. Pratacultural Sci. 2019, 36, 1163–1176. [Google Scholar]
- Bao, C.; Fang, C.-L. Water resources constraint force on urbanization in water deficient regions: A case study of the Hexi Corridor, arid area of NW China. Ecol. Econ. 2007, 62, 508–517. [Google Scholar] [CrossRef]
- Chinese Academy of Sciences Resource and Environmental Science Data Center (http://www.resdc.cn/). Landuse dataset in China (1980–2015). National Tibetan Plateau Data Center. 2019. [Google Scholar]
- Coast, S. How OpenStreetMap is Changing the World[C]. In Proceedings of the 10th International Symposium on Web and Wireless Geographical Information Systems (W2GIS 2011), Kyoto University, Kyoto, Japan, 3–4 March 2011. [Google Scholar]
- Xu, X. The 1-km grid Chinese population density dataset. Res. Envi. Sci. Data Center 2017. [Google Scholar] [CrossRef]
- Cao, Z.; Wu, Z.; Kuang, Y.; Huang, N. Correction of DMSP/OLS Night-time Light Images and Its Application in China. J. Geo. Inf. Sci. 2015, 17, 1092–1102. [Google Scholar]
- Hui, C. Carrying capacity, population equilibrium, and environment’s maximal load. Ecol. Model. 2006, 192, 317–320. [Google Scholar] [CrossRef]
- Luo, L.; Zhang, Z.; Ma, W.; Yi, S.; Zhuang, Y. PIC v1.3: Comprehensive R package for computing permafrost indices with daily weather observations and atmospheric forcing over the Qinghai–Tibet Plateau. Geosci. Model Dev. 2018, 11, 2475–2491. [Google Scholar] [CrossRef] [Green Version]
- Peng, C.; Ouyang, H.; Gao, Q.; Jiang, Y.; Zhang, F.; Li, J.; Yu, Q. Environment: Building a “Green” Railway in China. Science 2007, 316, 546–547. [Google Scholar] [CrossRef] [PubMed]
- Wang, Y.; Zhou, L.; Yang, G.; Guo, R.; Xia, C.; Liu, Y. Performance and Obstacle Tracking to Natural Forest Resource Protection Project: A Rangers’ Case of Qilian Mountain, China. Int. J. Environ. Res. Public Health 2020, 17, 5672. [Google Scholar] [CrossRef]
- Li, Z.; Sun, X.; Huang, Z.; Zhang, X.; Wang, Z.; Li, S.; Zheng, W.; Zhai, B. Changes in nutrient balance, environmental effects, and green development after returning farmland to forests: A case study in Ningxia, China. Sci. Total Environ. 2020, 735, 139370. [Google Scholar] [CrossRef] [PubMed]
- Litman, T. Evaluating Transportation Economic Development Impacts. Victoria Transport Policy Institute. 2010. Available online: https://www.vtpi.org/documents/evaluation.php (accessed on 1 August 2018).
- Luo, L.; Ma, W.; Zhuang, Y.; Zhang, Y.; Yi, S.; Xu, J.; Long, Y.; Ma, D.; Zhang, Z. The impacts of climate change and human activities on alpine vegetation and permafrost in the Qinghai-Tibet Engineering Corridor. Ecol. Indic. 2018, 93, 24–35. [Google Scholar] [CrossRef]
- Zhang, K.-C.; Qu, J.-J.; Liao, K.-T.; Niu, Q.-H.; Han, Q.-J. Damage by wind-blown sand and its control along Qinghai-Tibet Railway in China. Aeolian Res. 2010, 1, 143–146. [Google Scholar] [CrossRef]
- Yin, F.; Deng, X.; Jin, Q.; Yuan, Y.; Zhao, C. The impacts of climate change and human activities on grassland productivity in Qinghai Province, China. Front. Earth Sci. 2014, 8, 93–103. [Google Scholar] [CrossRef]
- Liu, Y.; Zha, Y.; Gao, J.; Ni, S. Assessment of grassland degradation near Lake Qinghai, West China, using Landsat TM and in situ reflectance spectra data. Int. J. Remote Sens. 2004, 25, 4177–4189. [Google Scholar] [CrossRef]
- Wang, X.Y.; Yang, D.W.; Zhang, L.L.; Zhang, L.M.; Xie, F.; Guo, P. The Causes of Grassland Degradation and Restoration Strategies in Qilian Mountain National Park. J. Grassl. Forage Sci. 2020, 6, 81–86. [Google Scholar] [CrossRef]
- Zhang, X.W.; Li, G.; Dong, K.H.; Zhao, X. Effects of Grazing and Enclosure on Community Characteristics and Biodiversity in Leymus chinensis Grassland. J. Grassl. Forage Sci. 2019, 4, 22–27. [Google Scholar] [CrossRef]
- Fan, K.; Guo, S.; Yuan, H. Investigation and Protection of Grassland Resource in Qilianshan Nature Reserve of Gansu. J. Gansu For. Sci. Technol. 2015, 40, 42–45. [Google Scholar] [CrossRef]
- Qian, D.; Yan, C.; Xiu, L.; Feng, K. The impact of mining changes on surrounding lands and ecosystem service value in the Southern Slope of Qilian Mountains. Ecol. Complex. 2018, 36, 138–148. [Google Scholar] [CrossRef]
- Yeh, E. Green Governmentality and Pastoralism in Western China: Converting Pastures to Grasslands’. Nomadic Peoples 2005, 9, 9–30. [Google Scholar] [CrossRef]
- Newman, B.J.; Ladd, P.; Brundrett, M.; Dixon, K.W. Effects of habitat fragmentation on plant reproductive success and population viability at the landscape and habitat scale. Biol. Conserv. 2013, 159, 16–23. [Google Scholar] [CrossRef]
- Chu, L.; Sun, T.; Wang, T.; Li, Z.; Cai, C. Evolution and Prediction of Landscape Pattern and Habitat Quality Based on CA-Markov and InVEST Model in Hubei Section of Three Gorges Reservoir Area (TGRA). Sustainability 2018, 10, 3854. [Google Scholar] [CrossRef] [Green Version]
- Assumma, V.; Bottero, M.; Monaco, R.; Soares, A.J. An integrated evaluation methodology to measure ecological and economic landscape states for territorial transformation scenarios: An application in Piedmont (Italy). Ecol. Indic. 2019, 105, 156–165. [Google Scholar] [CrossRef]
Figure 1.
Location of the QLM.

Figure 2.
Land use/cover in the QLM.

Figure 3.
HF maps of the QLM from 2000 to 2015: (a) HF map for 2000; (b) HF map for 2005; (c) HF map for 2010; (d) HF map for 2015.
Figure 3.
HF maps of the QLM from 2000 to 2015: (a) HF map for 2000; (b) HF map for 2005; (c) HF map for 2010; (d) HF map for 2015.

Figure 4.
The proportion of different human pressure classes in 2000, 2005, 2010, and 2015.

Figure 5.
Change in the HF over the QLM: (a) change in the HF for 2000–2005; (b) change in the HF for 2005–2015; (c) change in the HF for 2000–2015.
Figure 5.
Change in the HF over the QLM: (a) change in the HF for 2000–2005; (b) change in the HF for 2005–2015; (c) change in the HF for 2000–2015.

Figure 6.
Growing season NDVI trends obtained by linear regression, and significance levels obtained by Mann–Kendall tests for the QLM from 2000 to 2015: (a) NDVI trend from 2000 to 2005; (b) NDVI trend from 2005 to 2015; (c) significance level for the NDVI from 2000 to 2005; (d) significance level for the NDVI from 2005 to 2015. The blank regions in the QLM in c and d indicate a nonsignificant change in NDVI (p > 0.1).

Figure 7.
Relationships between significant NDVI trends and changes in the HF for 2000–2005 and 2005–2015 in Gansu and Qinghai. The blue lines show the linear regression results.
Figure 7.
Relationships between significant NDVI trends and changes in the HF for 2000–2005 and 2005–2015 in Gansu and Qinghai. The blue lines show the linear regression results.

Figure 8.
Relationships between the trends of different vegetation types and changes in the HF and six categories of human pressures for 2000–2005 and 2005–2015 in Gansu and Qinghai. The blue regions indicate significant positive correlations (p < 0.05), and the correlation coefficient increases with darkening color; the red regions indicate significant positive correlations (p < 0.05), and the correlation coefficient increases with darkening color. Gray regions denote nonsignificant correlations (p > 0.05). The number in the bin is the correlation coefficient.


Table 1.
Influence scores for six individual pressures.
| Pressure | Scores | Details |
|---|---|---|
| Land use/cover | 0, 1, 2, 4, 5, 9, 10 | Built-up land, rural settlements, manmade reservoirs and plantations, cropland, grassland with coverage greater than 50%, 20–50%, and less than 20%, and other types were assigned scores of 10, 9, 5, 4, 2, 1, and 0, respectively |
| Road distribution | 0–10 | Assigned scores based on the road type and distance |
| Railway distribution | 0, 1, 2, 4, 8 | 0–0.5 km was assigned a score of 8; 0.5–1.5 km was assigned a score of 4; 1.5–2.5 km was assigned a score of 2; 2.5–3.5 km was assigned a score of 1 |
| Population density | 0–10 Continuous | |
| Night-time lights | 0–10 | Assigned scores based on the equal division threshold of 2000 data |
| Grazing density | 0–10 Continuous |
Publisher’s Note: MDPI stays neutral with regard to jurisdictional claims in published maps and institutional affiliations. |
© 2021 by the authors. Licensee MDPI, Basel, Switzerland. This article is an open access article distributed under the terms and conditions of the Creative Commons Attribution (CC BY) license (https://creativecommons.org/licenses/by/4.0/).
Share and Cite
MDPI and ACS Style
Duan, Q.; Luo, L.; Zhao, W.; Zhuang, Y.; Liu, F. Mapping and Evaluating Human Pressure Changes in the Qilian Mountains. Remote Sens. 2021, 13, 2400. https://0-doi-org.brum.beds.ac.uk/10.3390/rs13122400
AMA Style
Duan Q, Luo L, Zhao W, Zhuang Y, Liu F. Mapping and Evaluating Human Pressure Changes in the Qilian Mountains. Remote Sensing. 2021; 13(12):2400. https://0-doi-org.brum.beds.ac.uk/10.3390/rs13122400
Chicago/Turabian StyleDuan, Quntao, Lihui Luo, Wenzhi Zhao, Yanli Zhuang, and Fang Liu. 2021. "Mapping and Evaluating Human Pressure Changes in the Qilian Mountains" Remote Sensing 13, no. 12: 2400. https://0-doi-org.brum.beds.ac.uk/10.3390/rs13122400
Note that from the first issue of 2016, this journal uses article numbers instead of page numbers. See further details here.