Article

Application of Ground-Based Microwave Radiometer in Retrieving Meteorological Characteristics of Tibet Plateau

1
State Key Laboratory of Hydroscience and Engineering, Tsinghua University, Beijing 100084, China
2
State Key Laboratory of Plateau Ecology and Agriculture, Qinghai University, Xining 810016, China
3
School of Water Resources and Electric Engineering, Qinghai University, Xining 810016, China
*
Author to whom correspondence should be addressed.
Remote Sens. 2021, 13(13), 2527; https://0-doi-org.brum.beds.ac.uk/10.3390/rs13132527
Submission received: 7 May 2021 / Revised: 18 June 2021 / Accepted: 23 June 2021 / Published: 28 June 2021

Abstract

:
The characteristics of plateau precipitation and atmosphere, once accurately and comprehensively understood, can be used to inform sound air–water resource development practices. In this study, atmospheric exploration of the Tibet Plateau (TP) was conducted using ground-based microwave radiometer (MWR) data collected during the East Asian summer monsoon. Atmospheric temperature, pressure, humidity, and other variables were gathered under clear-sky, cloudy-sky, and rainy-sky conditions. Statistical characteristics of the air parcel height and stability/convection indices such as convective available potential energy (CAPE) and convective inhibition (CIN) were investigated, with a special focus on the rainy-sky condition. Two retrieval applications for characterizing precipitation, namely short-term precipitation forecast and quantitative precipitation estimation were presented. Results showed that CAPE values in the Darlag region reached extremes around 18:00–20:00 (UTC+8) for cloudy-sky and rainy-sky conditions with corresponding peaks of about 1046.56 J/kg and 703.02 J/kg, respectively. When stratiform or convective–mixed precipitation occurs, the precipitable water vapor (PWV) and CAPE values were generally greater than 1.7 cm and 1000 J/kg, respectively. CAPE values are likely to decrease before the occurrence of precipitation due to the release of the latent heat in the atmosphere.

Graphical Abstract

1. Introduction

Tibet Plateau (TP) is the largest, highest, and most complex plateau in the world. The TP is well known as the “Asian water tower”, and serves as headwaters for several major rivers in Asia, including the Yangtze, Yellow, Nu-Salween, and Lancang-Mekong Rivers [1]. It has an average altitude of more than 4000 m, and the dynamic and thermal effects generated by the high topography of the TP have an important influence on China’s weather, climate, atmospheric circulation, and water cycle [2]. Studies have shown that the TP is rich in both land and air–water resources. For instance, the annual summer precipitable water vapor from 1979–2016 was as high as 24.7 mm [3], making the cloud water resources over the TP have great developmental potential. By further bolstering the potential for air–water resources and increasing precipitation, the local water resources shortage in Northwest China could be effectively alleviated. The air–water resources depend on an accurate grasp of the plateau atmosphere [4]. Due to its complex terrain and harsh climate, meteorological stations in the TP region are sparse, especially in the central and western parts [5]. The scarcity of hydrometeorological data limits our understanding of the atmospheric characteristics of the TP.
Meteorological and atmospheric variables are obtained for the TP region through (i) radiosonde observation (RAOB), (ii) reanalysis data from the U.S. National Center Environmental Prediction (NCEP)/National Center for Atmospheric Research (NCAR), and (iii) remote sensing techniques such as global positioning system (GPS) or microwave radiometry (MWR) [6,7,8]. Although radiosonde measurement is a long-term and objective approach, however, its spatial and temporal resolutions are not sufficient to track the dynamic evolution of water vapor due to the low number of radiosonde stations [9,10]. Besides, a “true” vertical profile cannot be obtained from a radiosonde station due to drifting/deviation of sounding balloons from wind. NCEP/NCAR reanalysis data have satisfactory spatial coverage but suffer system error due to coarse spatial resolution [11]. Satellite sensors can monitor atmospheric water vapor using onboard infrared and microwave sensors on a global scale, but the water vapor content under clouds cannot be effectively retrieved from satellite-based measurements.
Ground-based observations have a high temporal resolution within the atmospheric boundary layer, which could effectively solve the poor detection problem in satellite remote sensing data at the bottom of the troposphere, caused by cloud occlusion and strong absorption. It is suitable for short- and long-term meteorological analysis and weather forecasting. The ground-based GPS can achieve uninterrupted observation; however, the quality of GPS-based retrieval data is somewhat dependent on satellite geometry and the number of satellites visible [8].
In recent years, ground-based microwave radiometers (MWRs) have been widely used in the field of meteorology as they can reliably retrieve atmospheric temperature, humidity, water vapor density, and cloud liquid water profiles with high temporal resolution and sounding accuracy. MWRs can also capture the fine thermal structures of small- and medium-scale systems [12,13,14]. Climate characteristics and nowcasting convective activity [15,16] have been widely monitored through continuous MWR measurements. Ware et al. [16] performed accurate upper air thermodynamic surveillance in rain, sleet, and snow conditions using MWR data to correlate liquid condensation with wind direction and thermodynamics data. Snider [17] studied the seasonal variations of integrated water vapor content in the atmosphere and clouds to determine their correlations with precipitation.
Previous studies have mainly focused on clear- and cloudy-sky conditions, while analyses of rainy-sky conditions have been generally uncommon [18]. Westwater [19] first proposed that the water vapor inversion under clear skies is 15% better than that under cloudy conditions when the integrated water path is greater than 10 mm. This defect was corrected by subsequent researchers [20,21] to be operable in all weather conditions [12,22]. Marzano et al. [23,24] have demonstrated the ability of surface radiometer to retrieve rainfall rate. Chen et al. [25] analyzed the variation of atmospheric water vapor content in the course of rainfall using a ground-based MWR. Until now, although the potential of MWR in retrieving rainfall rate, rain, and ice content has been studied widely, however, meteorological characteristics retrieved from ground-based MWR during rainy conditions have not yet been fully reported [26,27]. The MWRs used in previous studies were mostly stationed in low-altitude sites, and rarely in altitudes as high as the TP. Therefore, this study was conducted with a special focus on the hydrometeorological characteristics of the TP atmosphere during the East Asian summer monsoon.
The remainder of this paper is organized as follows. Section 2 and Section 3 discuss the experiments and data analysis method used in this study. Next, the retrievals of meteorological data (e.g., atmospheric temperature, water vapor density, relative humidity) from the MWR are verified by radiosonde soundings. Statistical characteristics of the air parcel height and stability/convection indices are then presented for clear-sky, cloudy-sky, and rainy-sky conditions. Two retrieval applications for characterizing precipitation using a ground-based MWR, namely short-term precipitation and quantitative precipitation estimation, are presented in Section 4. Section 5 provides a brief discussion of the results and Section 6 gives concluding remarks.

2. Experiments and Implementation

The experimental site is Darlag (33.55°E, 99.95°N), and is located in the Bayan Har mountainous area of the southeastern TP (black and white subgraph in Figure 1). The average altitude of Darlag is 4200 m and has a plateau continental climate, which is markedly affected by the southwest monsoon in the summer months. There are three independent basins within the Darlag region, namely: Jimai River, Darlag River, and Kequ River, all of which belong to the mainstream system of the Yellow River (color subgraph in Figure 1). To investigate the applicability of ground-based MWR in retrieving meteorological characteristics of the TP, especially on cloudy and rainy days, the operation site was selected in the area with abundant cloud water resources and sufficient water vapor during the Asian summer monsoon season (June–September), with an average annual precipitation of about 595 mm and average annual evaporation of around 1205.9 mm.
The cloud cover is relatively low during cloudy-sky and rainy-sky conditions, as the height of the cloud base is about 800–1500 m. The above environmental and geographical advantages provide objective and workable field conditions for continuous climate and precipitation observation in the area.
A ground-based MWR (manufactured by Radiometrics Corporation, model MP3000A) was used to measure atmospheric water vapor and temperature information during the summer monsoon within the TP. The MP-3000A MWR is a 35-channel piece of equipment, having two radio frequency (RF) subsystems: namely, temperature and water vapor profile subsystems, utilizing the same antenna. A total of 21 oxygen absorption bands with frequencies between 51 GHz and 59 GHz in the temperature profile subsystem and 14 water vapor absorption bands with frequencies between 22 GHz and 30 GHz in the water vapor profile subsystem were selected to observe the brightness temperatures (TBs). The TBs of the background atmospheric area were used to derive the water vapor profile from the horizontal level of the installation site to a height of 10 km [16,28]. A zenith infrared thermometer was then mounted on the setup to measure the cloud base temperature while met sensors were used to measure the temperature, relative humidity, and air pressure around the device.
The radiation transmission equation and neural network technology were used to determine the atmospheric temperature, humidity, water vapor density, and cloud liquid water content profile between 0 and 10 km. TBs were observed via MWR at three elevation angles that are 90° (i.e., zenith) and 15° elevation at azimuth angles corresponding to north and south direction. The temporal resolution of the atmospheric parameter profile retrieved by the MWR was about 3 min and grid spacing used for the retrieved profiles were 50 m, 100 m, and 250 m at a height of 0–500 m, 500–2000 m, and 2000–10,000 m, respectively [9].

3. Data and Methodology

3.1. Analytical Method

Microwave detection is an atmospheric remote sensing technology that depends on a detector measuring the emission, transmission, and scattered radiation from the atmosphere beyond a certain distance. It can be used to determine the physical characteristics and parameters of the atmosphere [29]. According to Kirchhoff’s law, a radiator has strong radiation when there is strong absorption in a certain band. In the microwave frequency range from 22.0 GHz to 100.0 GHz, there are strong absorption bands for water vapor and oxygen around 22.2 GHz and 60.0 GHz, respectively. The variations in microwave radiation within the frequency band corresponding to the absorption peaks of water vapor and oxygen (27–40 GHz) reflect the total amount of liquid water in the cloud under analysis [30,31].
The process of remotely sensing atmospheric parameters by MWR can be divided into forward modeling and inversion stages (Figure 2). The forward modeling stage involves calculating the corresponding radiant brightness temperature according to the radiative transfer equation with known information such as atmospheric temperature, water vapor density, pressure, and water content in the cloud. In this study, sounding data were acquired at the Darlag meteorological station from 2011 to 2018 to obtain sufficient training samples needed to develop the neural network. The data were entered into the radiative transfer model to simulate atmospheric downwelling radiance at the 35 spectral channels from 22.2 GHz to 60.0 GHz [32]. The radiative transfer model was then solved using MonoRTM (Atmospheric and Environmental Research, Inc., Kentucky, US; https://www.aer.com accessed on 18 June 2021) [33] with the same physics and continuum model as the line-by-line radiative transfer model. A set of back-propagation (BP) neural network-based models was trained to capture the complicated nonlinear relationship between the BT and retrieved atmospheric profiles such as atmospheric temperature, water vapor density, and relative humidity profiles [34]. BP neural network is a multilayer feedforward network trained by error backpropagation, which can fit high-dimensional functions. The basic idea of the BP algorithm is the gradient descent method, which uses the gradient search technique to minimize the mean square error between the actual output value and the expected one from the network.
Water vapor density and temperature profile information were gathered via an inversion algorithm of the radiation brightness temperature. The radiation transfer model used for the forward modeling is given as [35]:
T θ , f = T τ ( z 0 , ) + z 0 K a ( z ) T ( z ) τ ( z 0 , z ) sec ( θ ) d z
where Tθ,f denotes the downwelling brightness temperature, T is the cosmic background temperature, and τ(z0, ∞) and τ(z0,z) are the optical depth of the atmosphere from altitude z0 to the depths of the universe and that from altitude z0 to z, respectively. Ka(z) is the absorption coefficient at altitude z and frequency f, z0 is the surface altitude, and θ is the zenith angle receiving the brightness temperature at the ground.
For inversion algorithms of MWR for zenith and slant observations [36], the atmospheric parameters are retrieved by solving the Fredholm equation. In this study, the MWR deployed a proprietary BP neural network (NN) algorithm for estimating atmospheric state variables [37,38,39]. The BP neural network has a three-layer inversion structure with input and output layer of networks of about 38 and 58 neurons, respectively. Input neurons correspond to the brightness temperatures within the 35 sampling bands and three other atmospheric parameters: namely, atmospheric temperature, pressure, and relative humidity in the near-surface layer. The 58 neurons in the NN output layer correspond to 58 sampling heights for the ground-based MWR level-2 product. A hyperbolic S transfer function named Tansig is employed in the hidden NN layer as a transfer function. A Purelin linear transfer function was adopted in the output layer. The number of nodes in the hidden layer can be determined according to Mirchandani et al. [40,41].
For sounding observation used for instrumental calibration, water vapor density cannot be directly provided by a sounding balloon, but can be calculated as follows [42]:
e = 6.11 U exp ( 17.71 T 273.16 T + 29.33 )
V D = 2.167 e T
where e is the water vapor pressure (hPa), U denotes relative humidity, VD is the water vapor density (g·m−3), and T is the absolute temperature (K).
The stability/convection index obtained from upper air measurements relates to the thermodynamic evolution of the boundary layer, which reflects notable characteristics of the rainfall system and short-term weather processes [43]. The convective available potential energy (CAPE) and convective inhibition (CIN) were selected for instability analysis as they relate to the temperature and humidity in the whole troposphere [44]. The CAPE value represents the energy that the gas parcel can obtain from the ambient environment, namely, the positive work done by the upward buoyancy. This portion of the available energy positively affects the atmosphere and may be converted into kinetic energy of the air parcel. A larger CAPE indicates a less stable atmospheric state which is more conducive to the occurrence of convective weather. On the other hand, the CIN is the amount of energy that prevents the gas parcel from rising from the ground to the height of free convection.
The CAPE and CIN can be expressed as follows:
C A P E = R d P L F C P L E ( T v p T v e ) d ( ln 1000 P )
C I N = R d P 0 P L F C ( T v p T v e ) d ( ln 1000 P )
where Rd is the specific gas constant of dry air, 287.05 J/(kg∙K), and Tvp and Tve denote the virtual temperature of an air parcel and its ambient environmental temperature, respectively. PLFE, PLE, and P0 denote the pressure at the free convection level, equilibrium level, and near-ground level, respectively. P is the specific pressure at the sampling height. All these stability/convection indexes and height parameters are calculated through a skew T-log diagram [45,46].
Microwave radiometers may have detection errors due to (i) obtaining the inversion data (training data) from a set of radiosondes (RAOB) installed at the same or representative position as the monitoring area. Non-representative training data could potentially cause errors in the inversion products, especially for the vertical profile of water vapor and liquid water. In this study, the control data of RAOB were collected at the Darlag National Weather Station, Qinghai, China (33.45°E, 99.38°N). The straight-line distance between the Darlag National Weather Station and the field site of the rainfall monitoring is approximately 32 km and elevation differences are about 128 m. This study assumes that the meteorological and rainfall conditions of the Darlag National Weather Station and the experimental site are similar. (ii) Liquid water on the radome of MWR, causing the observed brightness temperature to be higher than the actual one. It is necessary to adopt a liquid isolation mitigation system including a waterproof cover and a blower to eliminate the liquid water accumulated on the water barrier during rainfall so that it can maintain normal observation capabilities. (iii) Radio frequency interference (RFI) spiking the detection data. Therefore, the MWR should be installed in isolation or far away from powerful radio transmitters, or the collected data should be averaged to reduce this effect. (iv) The occurrence of rainfall bringing uncertainty to the precision of retrieval products. This study removes obvious singularity data during the monitoring samples processing, without considering the effect of raindrop scattering on the MWR inversion method. Moreover, to reduce the detection deviation of MWR in precipitation, the zenith mode and oblique zenith mode were alternately adopted with a resolution of 3 min [47,48].
To evaluate the accuracy of the inversion mode, meteorological data such as atmospheric temperature, water vapor density, and relative humidity profiles retrieved from the MWR were verified using radiosonde observation (RAOB). A series of historical radiosonde data between July–November 2019 at the national weather station of Darlag was used for this purpose. The mean difference (MD), root mean square error (RMSE), and Pearson correlation coefficient (CC) were adopted to evaluate the accuracy of the inversion model over 58 height points.
M D = 1 N i = 1 N ( u i v i )
R M S E = 1 N i = 1 N ( u i v i ) 2
C C = 1 N n = 1 N ( u i u i ¯ ) ( v i v i ¯ ) n = 1 N ( u i u i ¯ ) 2 n = 1 N ( v i v i ¯ ) 2
where N is the total number of samples at a certain sampling height, and ui and vi denote radiosonde variables and MWR products, respectively.
The operational radiosonde launched by national and/or regional weather services was only available at 07:00 and 19:00 (UTC+8), and the MWR only provides data for 58 fixed-height layers. The average temperature, humidity, and water vapor density retrieved by the MWR from 06:30–07:30 and 18:30–19:30 were compared with the sounding data. Linear interpolations were conducted to ensure the proper meteorological sampling height between the MWR and RAOB.

3.2. Sounding Sample Classification

Meteorological parameters vary widely in different weather environments, so analyses were conducted separately for clear-sky, cloudy-sky, and rainy-sky conditions [49]. So far, there have been many reports on the use of MWR for clear/cloudy screening. For example, the TB standard deviation of 31 GHz over a defined time period (e.g., 1 h) was performed to indicate the presence of liquid clouds since MWR channels at 30–31 GHz are the most sensitive to clouds [50]. Marzano et al. [51] also used a BT-related atmospheric index based on radiometric measurements, namely status sky indicator (SSI), for selecting clear-sky days. In addition, the infrared radiometer is sensitive to cloud base temperature and can be adopted to identify the presence of thick clouds [52]. Ahn et al. [53] introduced a fast cloud detection algorithm based on the optical properties of cloud using infrared pyrometer observations. These studies mainly focus on cloud detection rather than rainy-sky detection.
In this study, relative humidity obtained from MWR retrievals was used to judge the clear/cloudy/rainy conditions. The “clear-sky” condition is defined as lack of clouds and relative humidity less than 85% from the ground to any sampling height in the sounding period. The “cloudy-sky” condition refers to a relative humidity of less than 85% if the sampling height is less than 600 m but larger than 84% for sampling heights larger than 600 m. The “rainy-sky” condition denotes a continuous 20-min rain sample collected by the raindrop spectrometer, where the relative humidity is invariably larger than 84% for the whole sampling height. A disdrometer (OTT, Parsivel2) was used to obtain near-surface precipitation data to further analyze the total water vapor content and the total liquid water content under these precipitation conditions.
It should be mentioned that the relative humidity of the corresponding height should theoretically reach 100% when a cloud layer is formed. However, due to the influence of condensation nuclei and other factors, the relative humidity of the cloud layer will be slightly lower than the theoretical value [54]. Therefore, the relative humidity of 85% was used as the threshold value. Since the base height of the low cloud is generally in the range of 600–999 m derived from long-term sounding observations [49], the characteristic height of 600 m was chosen to judge the cloudy sky. Long-term meteorological observation shows that the rainfall period on rainy days is shorter while the cloudy/clear-sky periods account for a large proportion in the Darlag region. Thus, even in rainy-sky conditions, the average RH value in the zenith observation may be less than 85%.

3.3. Rainfall Sample Classification

To investigate the characteristics of water vapor and liquid water in different precipitation environments, the standard deviation of rain rates collected by OTT are used to classify the precipitation [55]. The OTT sampling area and time are given as 54 cm2 and 1 min, respectively. A maximum value of rain rate greater than 0.5 mm/h and corresponding standard deviation of less than 1.5 mm/h for more than 20 min are classified as stratiform precipitation. A maximum value of rain rate greater than 5 mm/h with a standard deviation greater than 1.5 mm/h is classified as convective precipitation, while other rainfall samples are classified as mixed precipitation. Long-term precipitation monitoring data show that the Darlag area is dominated by stratified precipitation systems, with relatively few convective and mixed cloud systems. For convenience, convective precipitation and mixed cloud precipitation are collectively referred to as convective–mixed precipitation processes in this study.

4. Results

This section first presents the error analysis of retrieved and simulated values and then investigates the daily variation characteristics of atmospheric water vapor and convective instability indices. Moreover, retrieval applications of MWR in cloudy and rainy environments are further studied to support nowcasting and quantitative precipitation estimation.

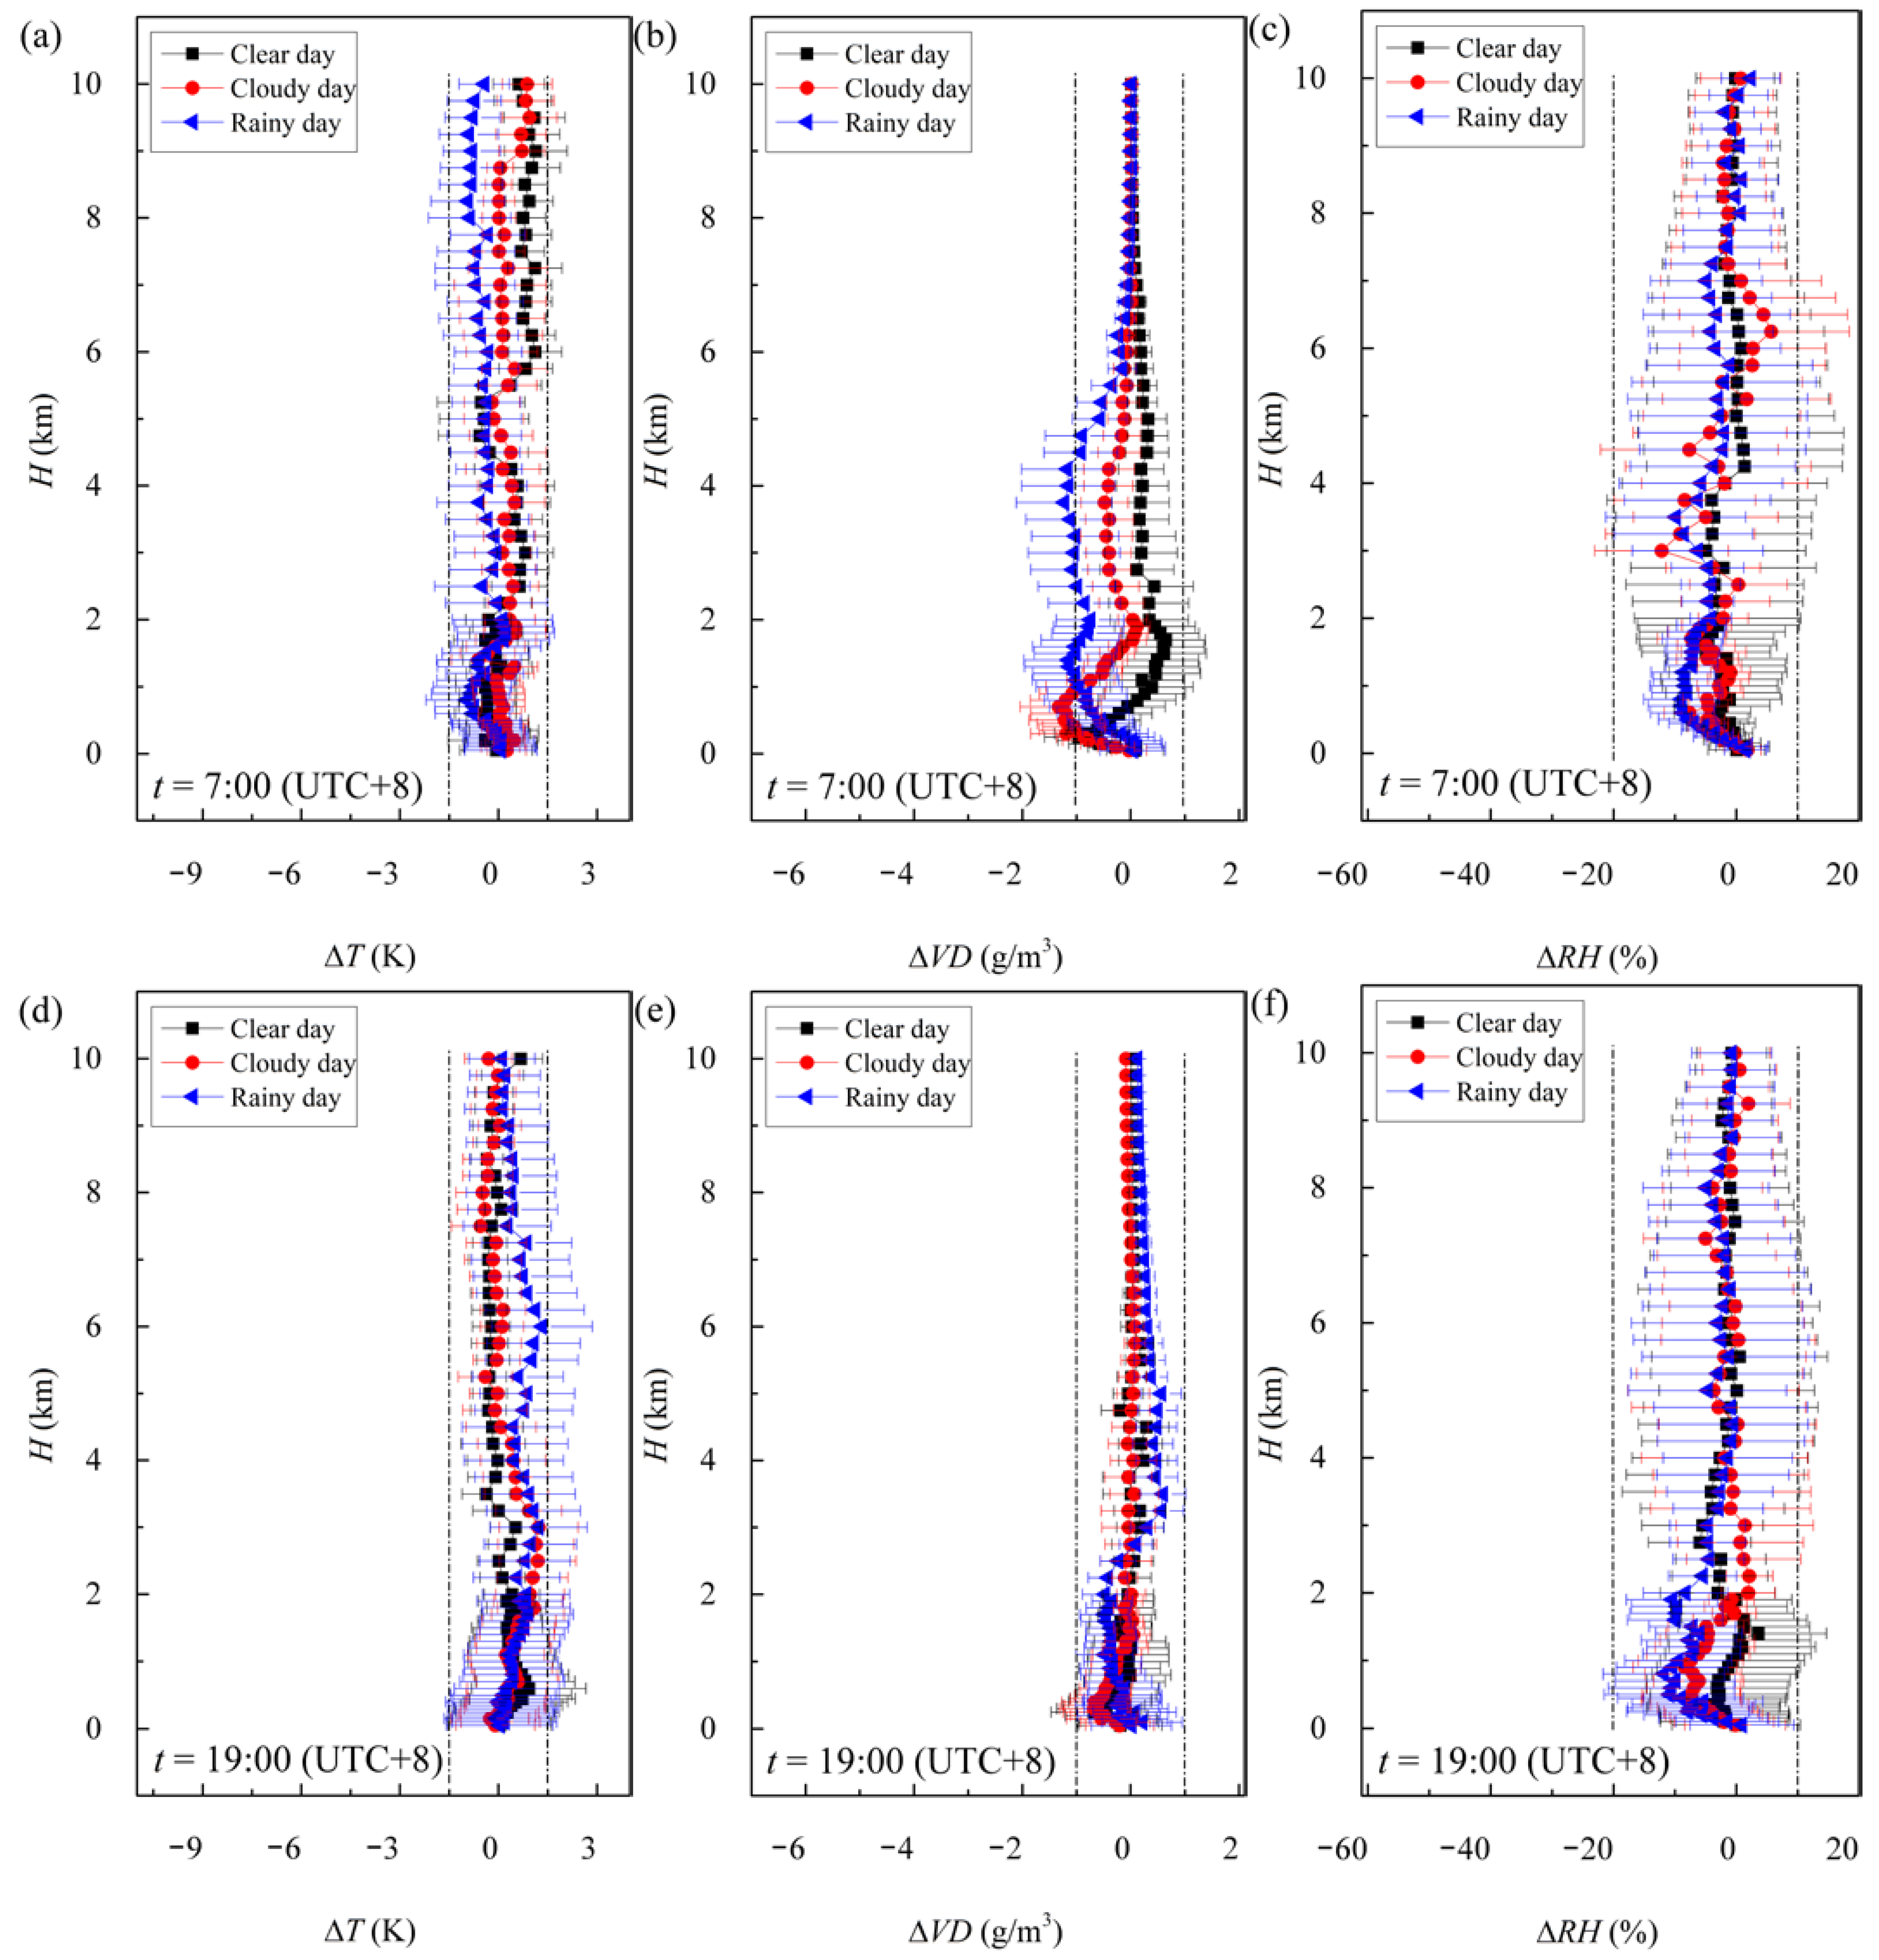
4.1. Retrieved and Simulated Value Error Analysis

Atmospheric temperature, water vapor density, and relative humidity profiles retrieved from the MWR were verified using radiosonde soundings. The radiosonde data were collected at the Darlag National Weather Station, Chinese Meteorological Administration (CMA), China (99°38′N, 33°45′E). The number of MWR-RAOB comparisons under clear-sky, cloudy-sky, and rainy-sky conditions were 13, 9, and 13 at 7:00 (UTC+8) and were 20, 13, and 20 at 19:00 (UTC+8). Figure 3 shows the vertical profiles of the temperature, vapor density, and relative humidity obtained from MWR and radiosonde observations under different weather conditions and sampling periods. Atmospheric temperatures appeared to be decreasing almost linearly as the detection height increased. At t = 07:00 and 19:00 (UTC+8), the correlation between MWR and RAOB was strong in terms of temperature and reached up to 0.99. The ambient temperature derived from the MWR was close to that obtained from the sounding observation. Relative to the radiosonde data, MD values between the MWR and RAOB on clear, cloudy, and rainy days in the early morning (t = 07:00, UTC+8) were 0.28 K, 0.22 K, and −0.41 K, respectively, with corresponding RMSE values of 0.92 K, 0.81 K, and 1.14 K. The corresponding MD (or RMSE) values for time t = 19:00 (UTC+8) were 0.12 K (0.93 K), 0.24 K (0.99 K), and 0.53 K (1.42 K). This indicated that the sensitivity of MD and RMSE values differs under different weather systems.
Figure 3 shows a parabolic decreasing trend of vapor density as the sampling height increases until the height is less than 5 km. The decreasing rate was faster at lower altitudes and slower at relatively higher altitudes, about 2 km. This was due to the smaller vapor density value and the weaker convective activity in the high-altitude regions. At 19:00 (UTC+8), water vapor value at the relatively lower sampling height (<2.5 km) during precipitation conditions was slightly less than that during cloudy days. The MD values between the MWR and RAOB were somewhat small for vapor density during early morning and evening measurement at sampling height above 5.75 km, having an absolute value of less than 0.35 g/m3. At sampling height below 5.75 km, the water vapor density obtained by MWR was higher than that from RAOB, especially for cloudy days. The average MD values of MWR for RAOB between sampling height 0 km and 5.75 km were −0.39 g/m3 and −0.12 g/m3 at t = 07:00 and 19:00 (UTC+8), respectively. Relative humidity first increased and then decreased as the sampling height increased. Since relative humidity to a certain extent reflects the liquid water content of the air, it can be observed in Figure 3 that liquid water was mainly distributed at 0.9–4.5 km during cloudy and rainy days while water vapor mainly accumulated within sampling height less than 2.5 km during the clear day. This indicated that the occurrence of precipitation requires not only sufficient water vapor but also dynamic conditions to lift water vapor to higher altitudes and condense it into clouds.
Compared to temperature and vapor density, relative humidity in the zenith direction of the field site from the MWR and RAOB to some extent differs. This was consistent with previous research by Xu et al. [47] and Araki et al. [56]. The vapor density and relative humidity retrieved by the MWR were larger than those observed by sounding at lower sampling height, which may be related to a delayed response in the humidity sensor. The sensor was located on the metal sheet of the sounding device, so the detected humidity may have been inherently lowered at a lower sampling altitude [47]. CC value between the MWR and RAOB was relatively strong at t = 07:00 (UTC+8) but comparatively poor near t = 19:00 (UTC+8) with a CC value of 0.97. Moreover, the appearance of clouds changed the absorption coefficient of the atmosphere, and cloud thickness, height, and density of liquid water in the clouds all affected the influence of clouds on the brightness temperature. The infrared sensor paired with the MWR cannot give the vertical structure and cloud parameters, resulting in a deviation in the vertical profile of the relative humidity.
Figure 4 shows the deviations in the MWR and RAOB at 58 sampling layers under three different weather conditions. Although absolute calibration was performed between MWR and RAOB, the author freely admits that the obtained temperature, water vapor, and liquid water profiles are generally satisfactory. The MWR retrieval accuracy against radiosondes in precipitation was not as good as that of non-precipitation, and MD values for the temperature, vapor density, and relative humidity were 0.16 K, −0.16 g/m3, and −2.81%, with corresponding RMSE values of 1.03 K, 0.39 g/m3 and 8.96%, respectively. The structure and value of the MWR and RAOB deviations at various sampling levels were similar but with noticeable differences. The different characteristics of atmospheric heat and cloud water over the TP at different sampling periods may be responsible for the differences. For example, the deviation of MWR and RAOB was relatively large in the sampling interval of 2–6 km, while the MD values for temperature, water vapor, and liquid water were relatively smaller at sampling height less than 500 m. The vertical profile of RMSE values of atmospheric temperature changes little along with the sampling height. However, the RMSE range for vapor density and relative humidity presented a spindle shape. That is, RMSE was narrowed at higher (>6 km) and lower altitudes (<1 km), close to zero, but it was wider in the middle altitude between 1 and 6 km. The atmospheric sampling errors in the early morning and evening showed different trends under different weather conditions. The sampling error of temperature and vapor density for rainy days was negative in the morning but positive in the evening for sampling height greater than 2 km. For clear and cloudy days, the sampling errors were roughly small without obvious deviation during early morning and evening. More details of MD and RMSE values between RAOB and MWR can be found in Supplementary Materials.

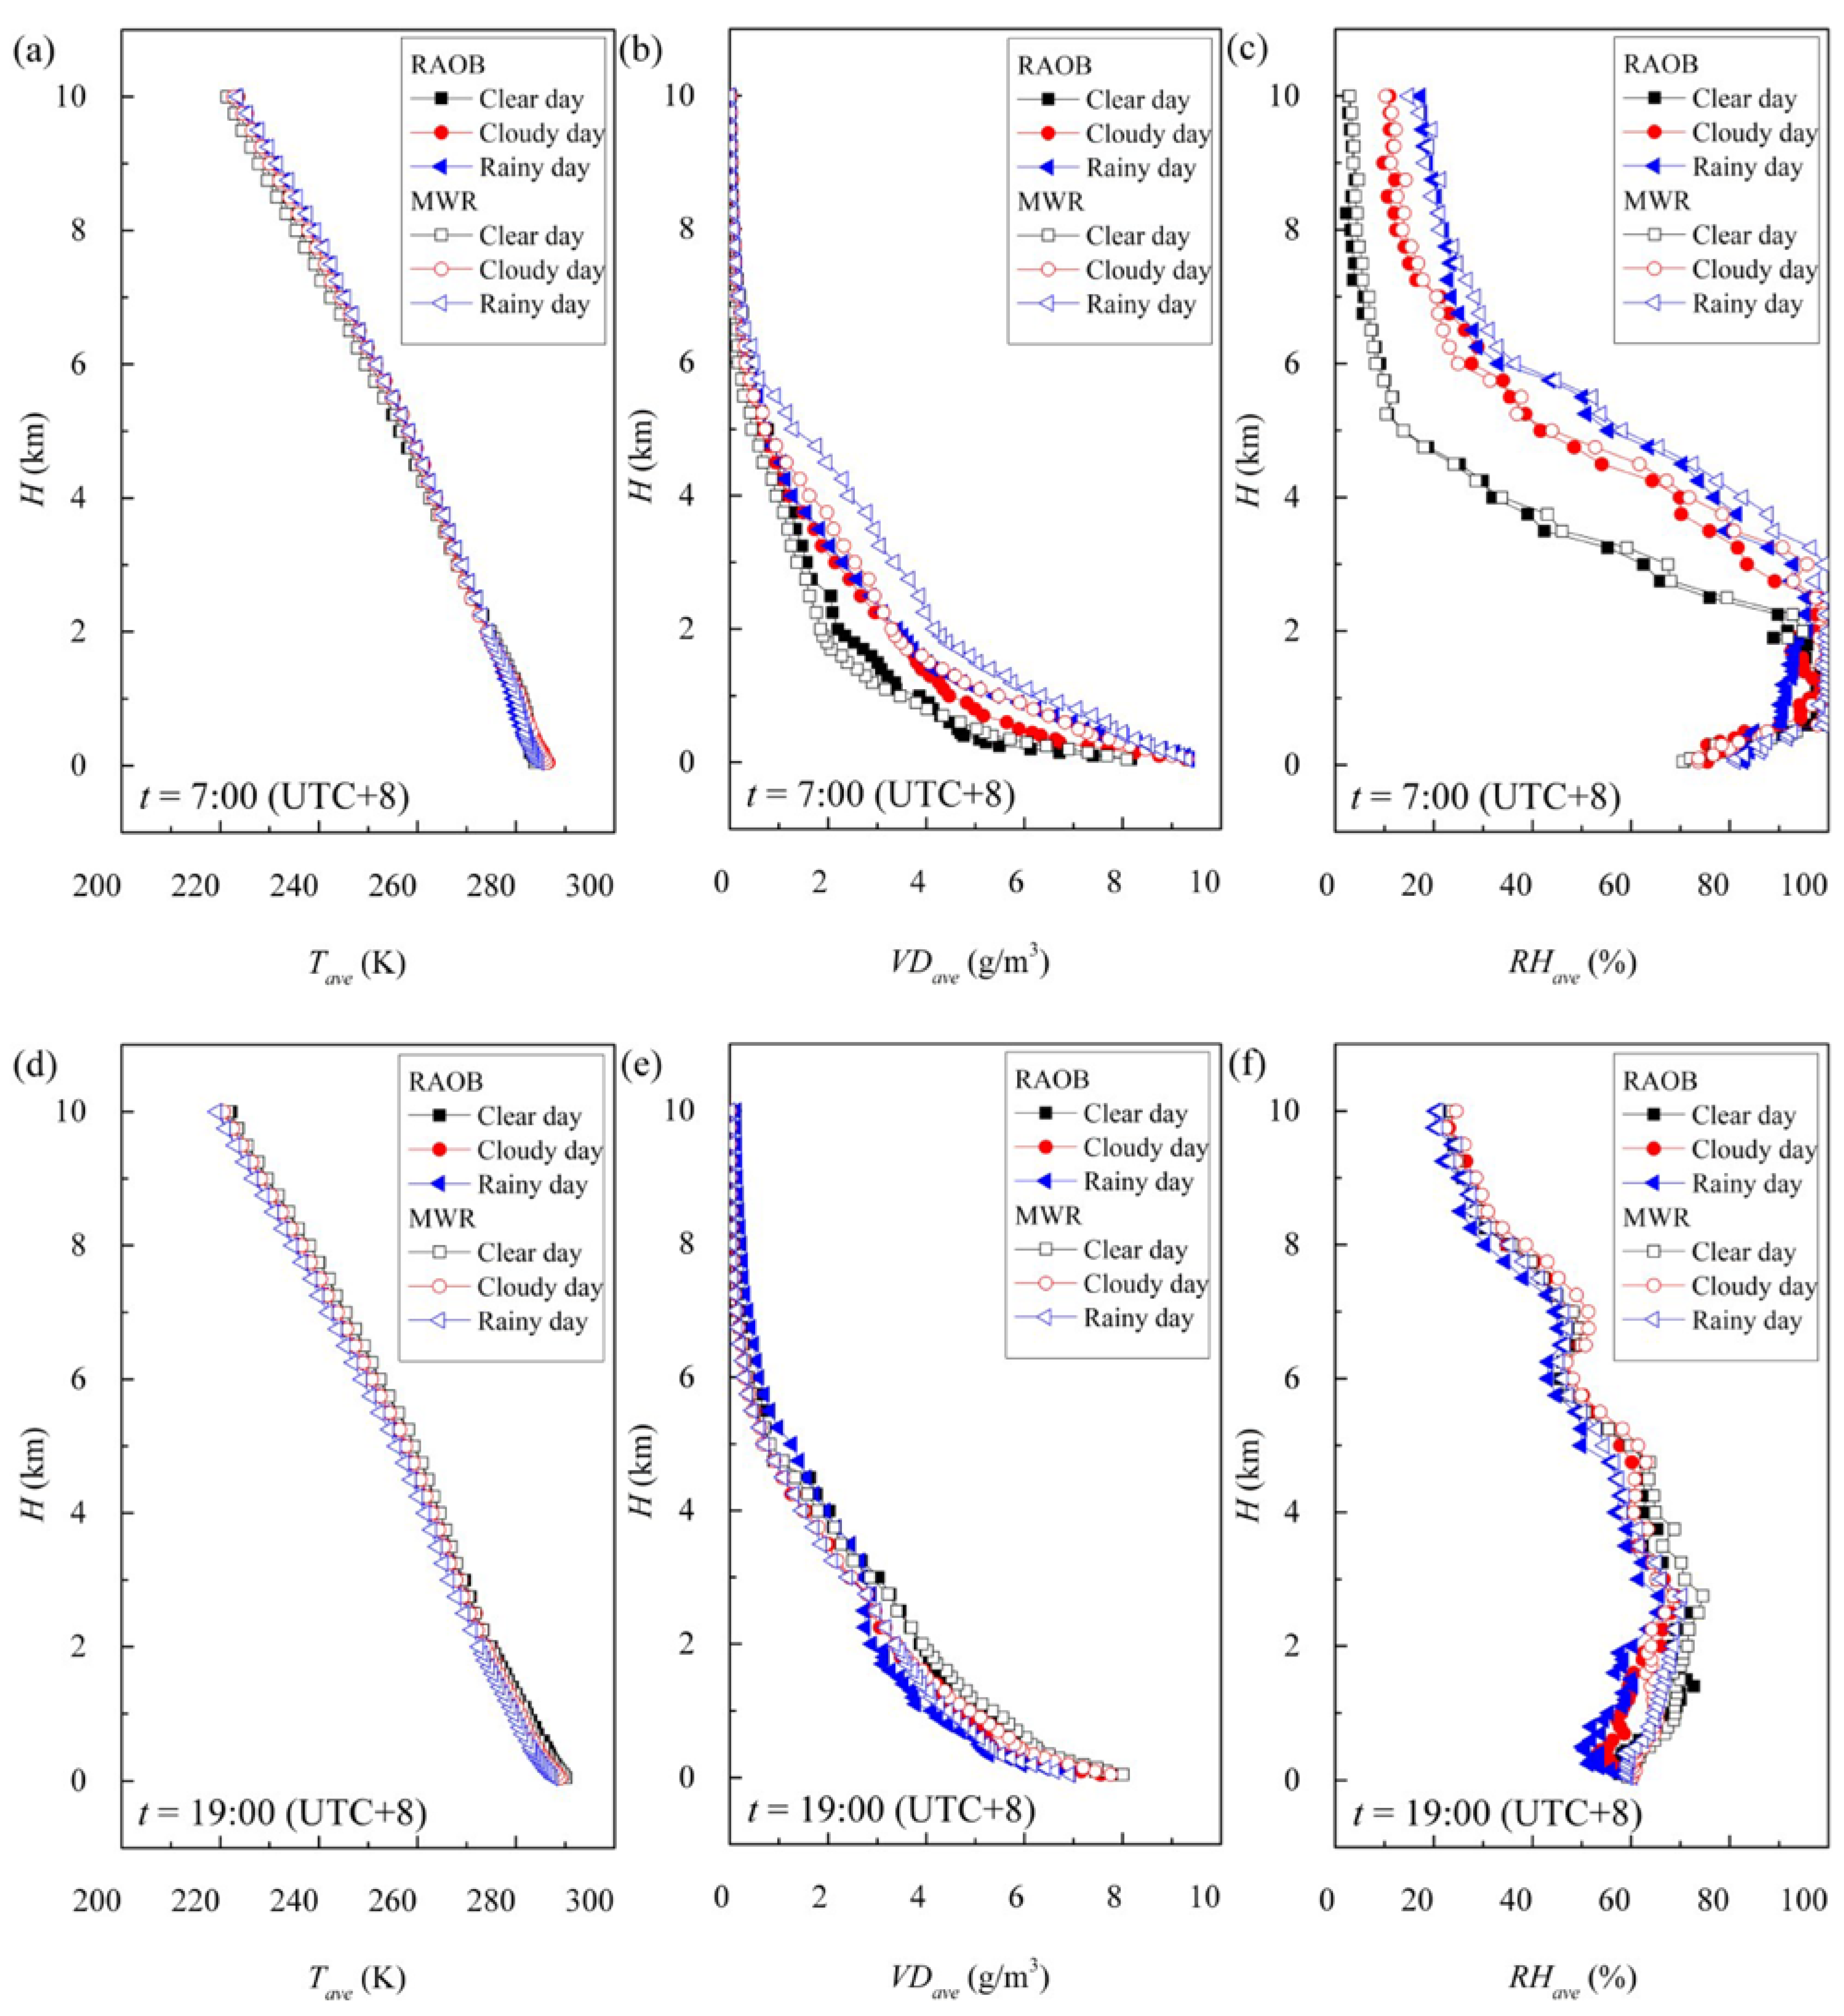
4.2. Meteorological Characteristics of the TP Region

In this section, meteorological parameters such as water vapor and atmospheric instability over the TP region during the East Asian summer monsoon are investigated. The observed data for 23 clear days, 25 cloudy days, and 30 rainy days were used to generate the statistical characteristics of the precipitable water vapor, liquid water content, parcel heights, and stability indices.

4.2.1. Water Vapor and Liquid Water Content

Abundant air vapor and cloud water are the basis of precipitation, and as an important medium for the physical process of cloud precipitation, they play an important role in forecasting clouds and precipitation which will invariably improve the efficiency of artificial weather modification. Previous studies have shown that ground-based MWR can detect precipitable water vapor (PWV) and integrated liquid water content (LWC) of clouds in real time [57,58]. Figure 5 presents the statistical characteristics of vertically integrated vapor density and liquid water content, namely PWV and LWC, under different weather conditions during the monsoon season. In general, the values of PWV and LWC were the smallest on clear days, followed by cloudy and rainy conditions. On a sunny day, water vapor condenses as the ground continuously emits long-wave radiation outwards and the temperature drops. Since the amount of water vapor condensation was small, it did not show the fluctuation trend like the rainy and cloudy days.
For the cloudy days, the high-altitude clouds around the experimental site fell and dissipated due to the low temperature and weakened convection at night. On the other hand, as the surface long-wave radiation became relatively large, an inversion layer formed easily, which made it difficult for water vapor in the surface layer to be transported upward and thereby collected under the inversion layer. Therefore, PWV and LWC values generally showed an increasing trend at night and reached the first peak before sunrise. As the sun rose, the near-surface temperature rose and convection strengthened; in particular, the solar radiation reached its strongest point within 2 to 3 h after 12:00 (UTC+8). During this period, water vapor and liquid water were transported to higher places. It can be seen that the PWV and LWC profile formed a V-shaped trough at noon on cloudy days. After the sunset in the evening, the air turned from dry and muggy to humid heat, and the water vapor and liquid water content in the entire atmospheric column gradually rose, reaching the second peak in a day at around 22:00 (UTC+8).

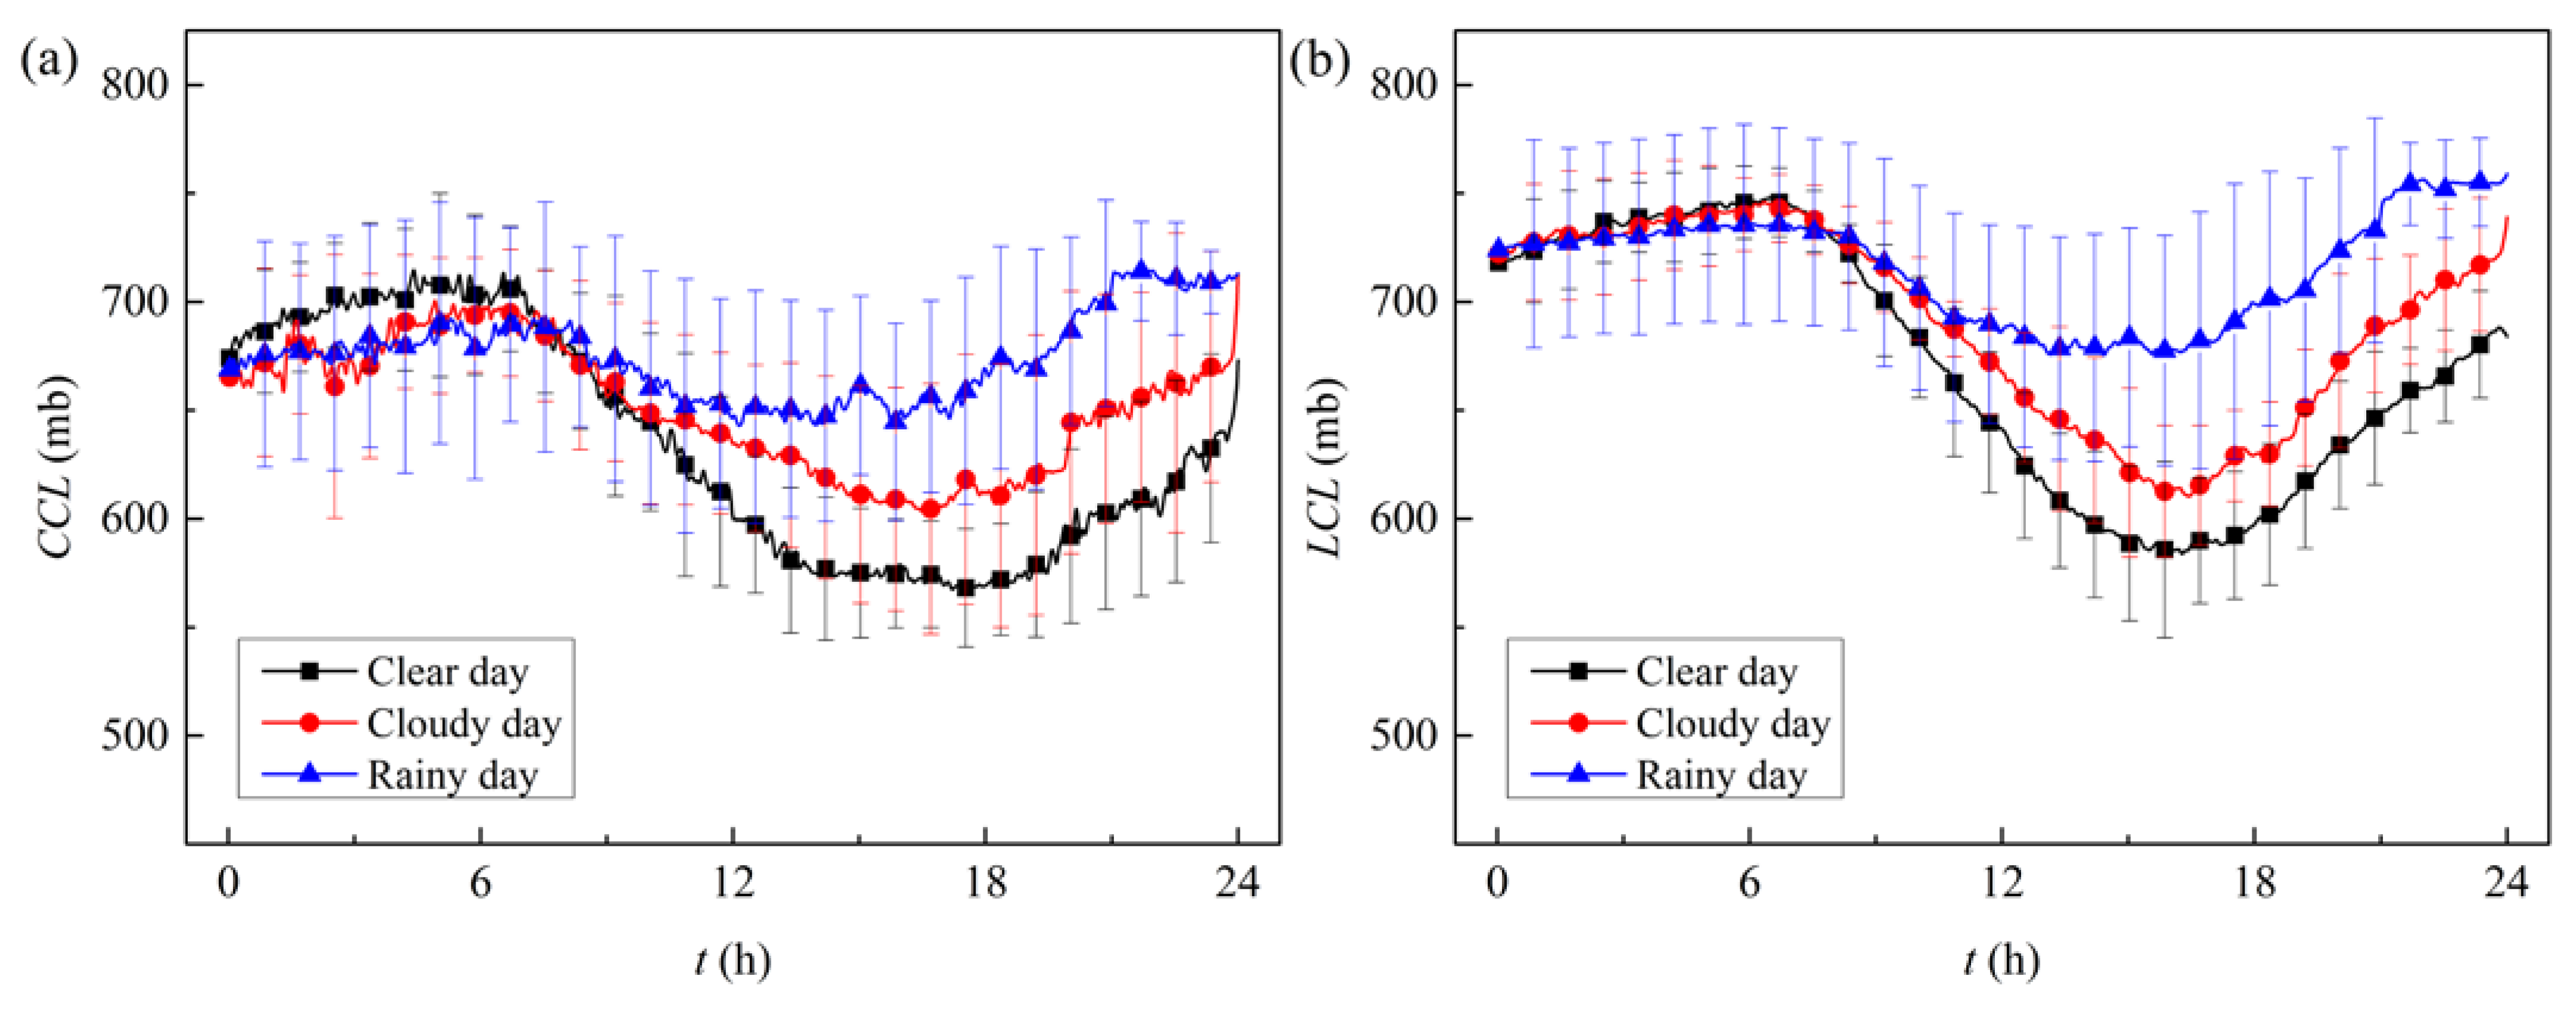
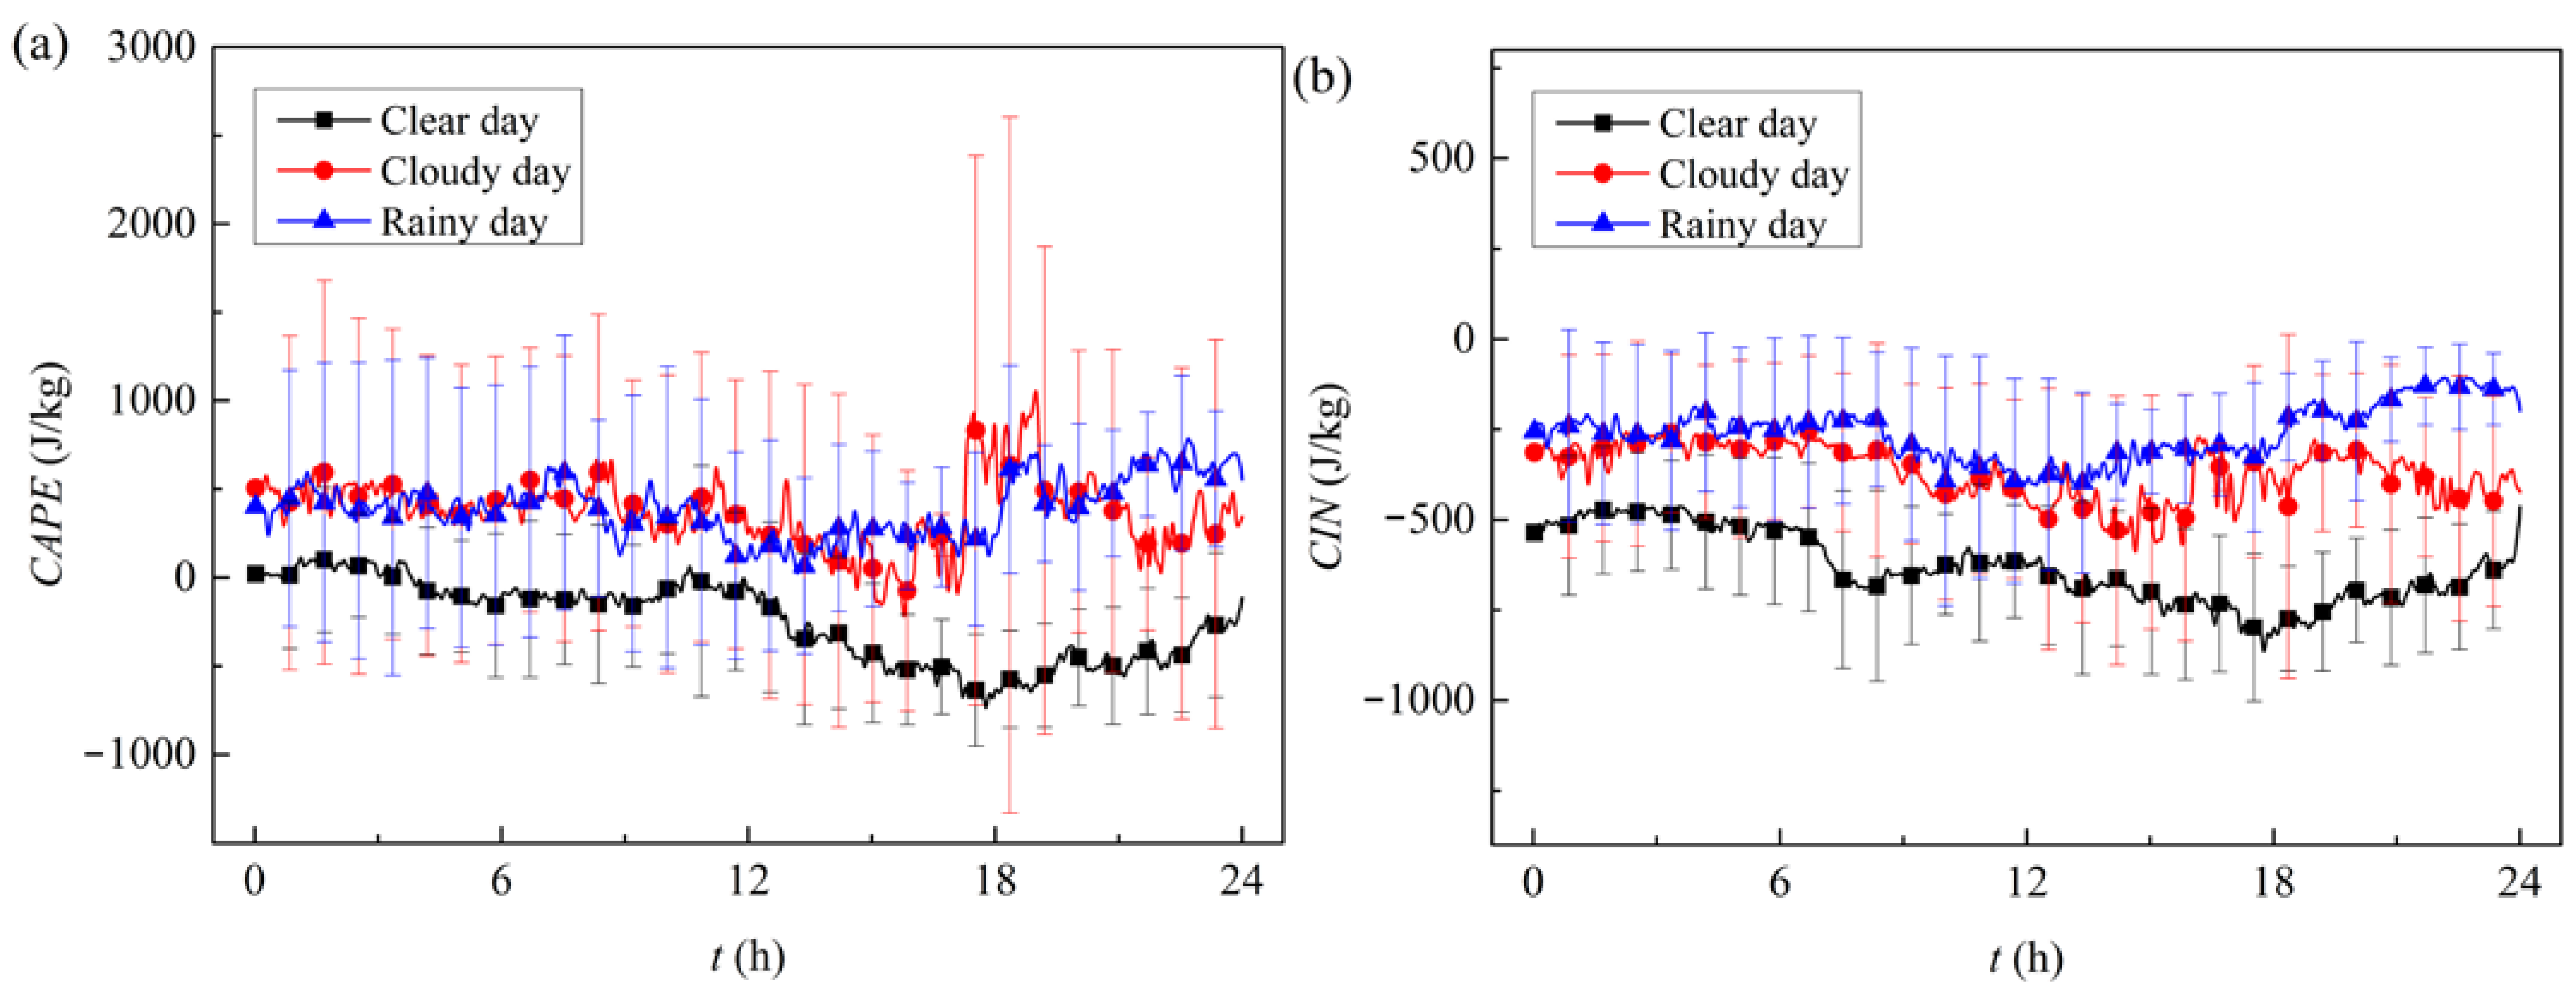
4.2.2. Stability and Convection Indices

To investigate the convective instability index, main parcel height characteristics were determined earlier. Four representative parcel heights, namely convective condensation level (CCL), lifting condensation level (LCL), level of free convection (LFC), and equilibrium level (EL) were presented. The CCL value indicated the height at which an air parcel is fully heated and lifted from the ground until it begins to agglomerate. As the CCL is generated from surface heating and thermal convection, it is typically used to identify the bottom layer of cumulus clouds. Figure 6a shows a periodic fluctuation of the CCL during the monsoon season with an increasing trend from 16:00 (previous day) to 7:00 (current day, UTC+8) and a decreasing trend from 7:00 (current day, UTC+8) to 16:00 (current day, UTC+8). This indicated that the overall cloud height increased during the period between 7:00–16:00 (current day, UTC+8), which was directly related to daytime heating of the atmosphere by the sun and air convection intensification. The CCL values observed here under different weather conditions were almost the same before 9:00 (UTC+8), though slightly higher on the clear-sky day. After 9:00 (UTC+8) on a given day, the CCL value was largest under rainy conditions, followed by cloudy conditions, and finally clear days. This was consistent with the actual expectations of the cloud base heights in different weather systems. The LCL value refers to the height at which a dry, adiabatic air mass is lifted to humidity saturation. Unlike driven lift with thermal convection, the lifting motion of LCL is usually forced—this includes frontal uplift, orographic lift, and the surface convergence caused by convection uplift. As shown in Figure 6b, the variation trend of LCL was stable under different weather conditions but the LCL values were consistently greater than the corresponding CCL values. This means that the near-surface temperature had not yet reached convective temperature [25]. The LFC represents the height at which the difference between the air parcel temperature and the ambient temperature changes from negative to positive. Above the LFC height, convection occurred in the air parcel under the action of buoyancy until the EL height was reached, at which point the air mass temperature rose again until becoming equal to (or colder than) the ambient temperature. Since lower LFC values always corresponded to a higher probability of precipitation events, LFC values of the air parcel during the monsoon period were relatively large for rainy days but small for clear days. In Figure 6d, EL values on clear and cloudy days are almost the same, and are slightly smaller than the corresponding values on rainy days. This is because the condensation process of water vapor can absorb the heat in the surrounding air during rainy conditions, resulting in lower day temperatures and thereby lower EL values.
As shown in Figure 7, the CAPE value was generally higher on cloudy and rainy days and was lowest on clear days. For cloudy-sky and rainy-sky conditions, CAPE values reached their extremes around 18:00–20:00 (UTC+8) with corresponding peaks of about 1046.56 J/kg and 703.02 J/kg, respectively. It appeared that convective rainfall was more likely to occur during this period than at other times of the day in the monsoon season. This was because after the sunset in the evening, the temperature dropped and the water vapor and liquid water content in the air reached their peak value with a state of super-saturation. It can also be confirmed from Figure 5 that both PWV and LWC values were relatively higher during the monsoon days. After the super-saturated water vapor condensed into water droplets, precipitation formed immediately as the weight of the water droplets exceeded the air buoyancy.
On the contrary, the absolute values of CIN were relatively higher under the clear-sky condition but lower under cloudy-sky and rainy-sky conditions. The arithmetic mean of CIN for clear-sky, cloudy-sky, and rainy-sky conditions was −633.99 J/kg, −368.98 J/kg, and −261.45 J/kg, respectively. There were relatively higher absolute values of CIN between 7:00 and 10:00 (UTC+8) under any weather condition with a V-shaped profile, but especially for clear days. This may be attributed to the dry air advection in the lower atmosphere and the cooling of the surface air, which enhanced the convective inhibition energy by reducing the virtual temperature of the near-surface air; the vertical virtual temperature distribution near the lower atmosphere was inverted, and air with higher virtual temperatures in the higher altitudes obstructed the upward movement of the air parcel below. The phenomenon of inverse temperature layer near the ground is common on summer mornings, and is not yet obvious at 7:00 (UTC+8) in Figure 3. This can be regarded as a typical state of conditional instability [46]. It should be stated that the CAPE and CIN values were sensitive to the temperature obtained from MWR. Although data retrieved by the radiosonde observation (RAOB) and by the MWR have a certain degree of error, the overall accuracy was satisfactory.

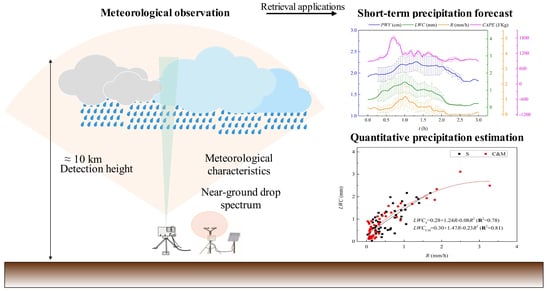
4.3. Retrieval Applications for Characterizing Precipitation

The targeted improvement of precipitation conversion rates in specific regions may allow for the successful utilization of air–water resources in the future, which will be necessary to mitigate local water resource shortages [59]. Thus, two retrieval applications for characterizing precipitation using a ground-based MWR are presented in this section.

4.3.1. Application for Short-Term Precipitation Forecast

The abundant water vapor content and cloud condensation nuclei in the atmosphere are prerequisites for precipitation. When there is sufficient water vapor to supplement from the surrounding environment and the uplift reaches super-saturation, the possibility of precipitation will greatly increase. In this section, a ground-based MWR was performed for nowcasting rain events. Previous studies have shown that PWV and LWC variations indicate the process of cloud formation and potential precipitation [60]. Indices such as CAPE and CIN calculated from the temperature and humidity profiles retrieved by radiosonde and MWR can be used for precipitation forecast [44]. Therefore, both atmospheric and liquid water parameters and CAPE values were adopted. For the near-ground precipitation information, the disdrometer (model OTT Parsivel2) was used for continuous rainfall observation due to its complete and reliable measurement of all types of precipitation [61]. Since the rainfall process in the Darlag area generally lasted between 0.5–1.5 h and the nowcasting accuracy of precipitation significantly decayed with time, the sampling period of the rainy day was set to 3 h with an interval of 2 min, covering the entire precipitation process.
Figure 8 shows that a rapid increase of water vapor and liquid water content can be used as an index to predict precipitation. In Figure 8, the time marked as t(h) = 1.0 h is the moment when the rainfall process was recorded by the disdrometer, namely R > 0.01 mm/h. Therefore, the time t(h) = 0 h represented one hour before the precipitation process. The PWV values necessary for the onset of stratiform or convective–mixed precipitation types were generally greater than 1.7 cm. There was a sharp increase in the LWC between 0.5 h and 1.0 h and a decrease after 1.0 h. The trend variation of LWC was in phase with the rain rate (R), which is expected since LWC and rain cannot be separated by this type of MWR (unpolarized, Battaglia et al. [62]). The variation tendency of PWV was consistent with the overall R, with a time delay of less than 20 min for stratiform precipitation and at least 30 min for convective–mixed precipitation. The duration of the peak value of PWV was longer than the precipitation period, especially for convective–mixed precipitation. The LWC and R values in the convective–mixed system were relatively transient compared to those of the stratiform precipitation system. The corresponding peak values of LWC and R for convective–mixed precipitation were 2.63 and 7.95 times higher than those obtained for stratiform precipitation. During the summer monsoon in the TP, CAPE values under stratiform and convective–mixed precipitations were generally greater than 1000 J/kg. The CAPE value under convective–mixed precipitation was a little higher than that of stratiform, with corresponding average values of 1167.11 J/kg and 1107.27 J/kg. In general, CAPE values were quick to decrease before the occurrence of precipitation. The CAPE index had a maximum value of 0.3 h before the stratiform precipitation, while this downward trend process lasted at least 1 h for convective–mixed rain. This can be attributed to the latent heat in the atmosphere released before rainfall. After the precipitation began, the CAPE values changed repeatedly, especially for convective clouds. The CAPE can reach a peak value of about 1400 J/kg. Subsequently, the CAPE values fell to a relatively lower level as the precipitation weakened. This to some extent proved that the occurrence of precipitation should be induced by dynamic and thermal conditions of the air. These characteristics could be used as quantitative and objective indicators in support of local short-term precipitation.

4.3.2. Application for Quantitative Precipitation Estimation

Figure 9a,b provides scattergrams of PWV and LWC against R for stratiform and convective–mixed precipitation. The PWV and LWC values in the zenith direction of the field site increased as R increased, but the correlation between PWV and R was not strong. For R < 0.5 mm/h conditions, the corresponding PWV values ranged widely from 1.06 to 2.81 cm. The PWV values under stratiform precipitation were generally higher than those under convective–mixed precipitation, while this was not the case for LWC. For scattergrams of LWC against PWV, it was indicated that LWC value increased in the form of a quadratic function with PWV increase. For the case with the same PWV value, the liquid water contained in the air under the convective–mixed precipitation system was relatively higher than that stratiform, which indicated that thermal or dynamic factors in the unstable atmosphere could accelerate the conversion of water vapor to liquid water.

5. Discussion

The analysis above reveals interesting and practical meteorological characteristics of the Darlag region within the TP, which can be summarized as follows.
  • In the TP region, there were relatively higher absolute values of CIN between 7:00 and 10:00 (UTC+8). Convective rainfall was more likely to occur around 18:00–20:00 (UTC+8) than at other times of the day in the monsoon season.
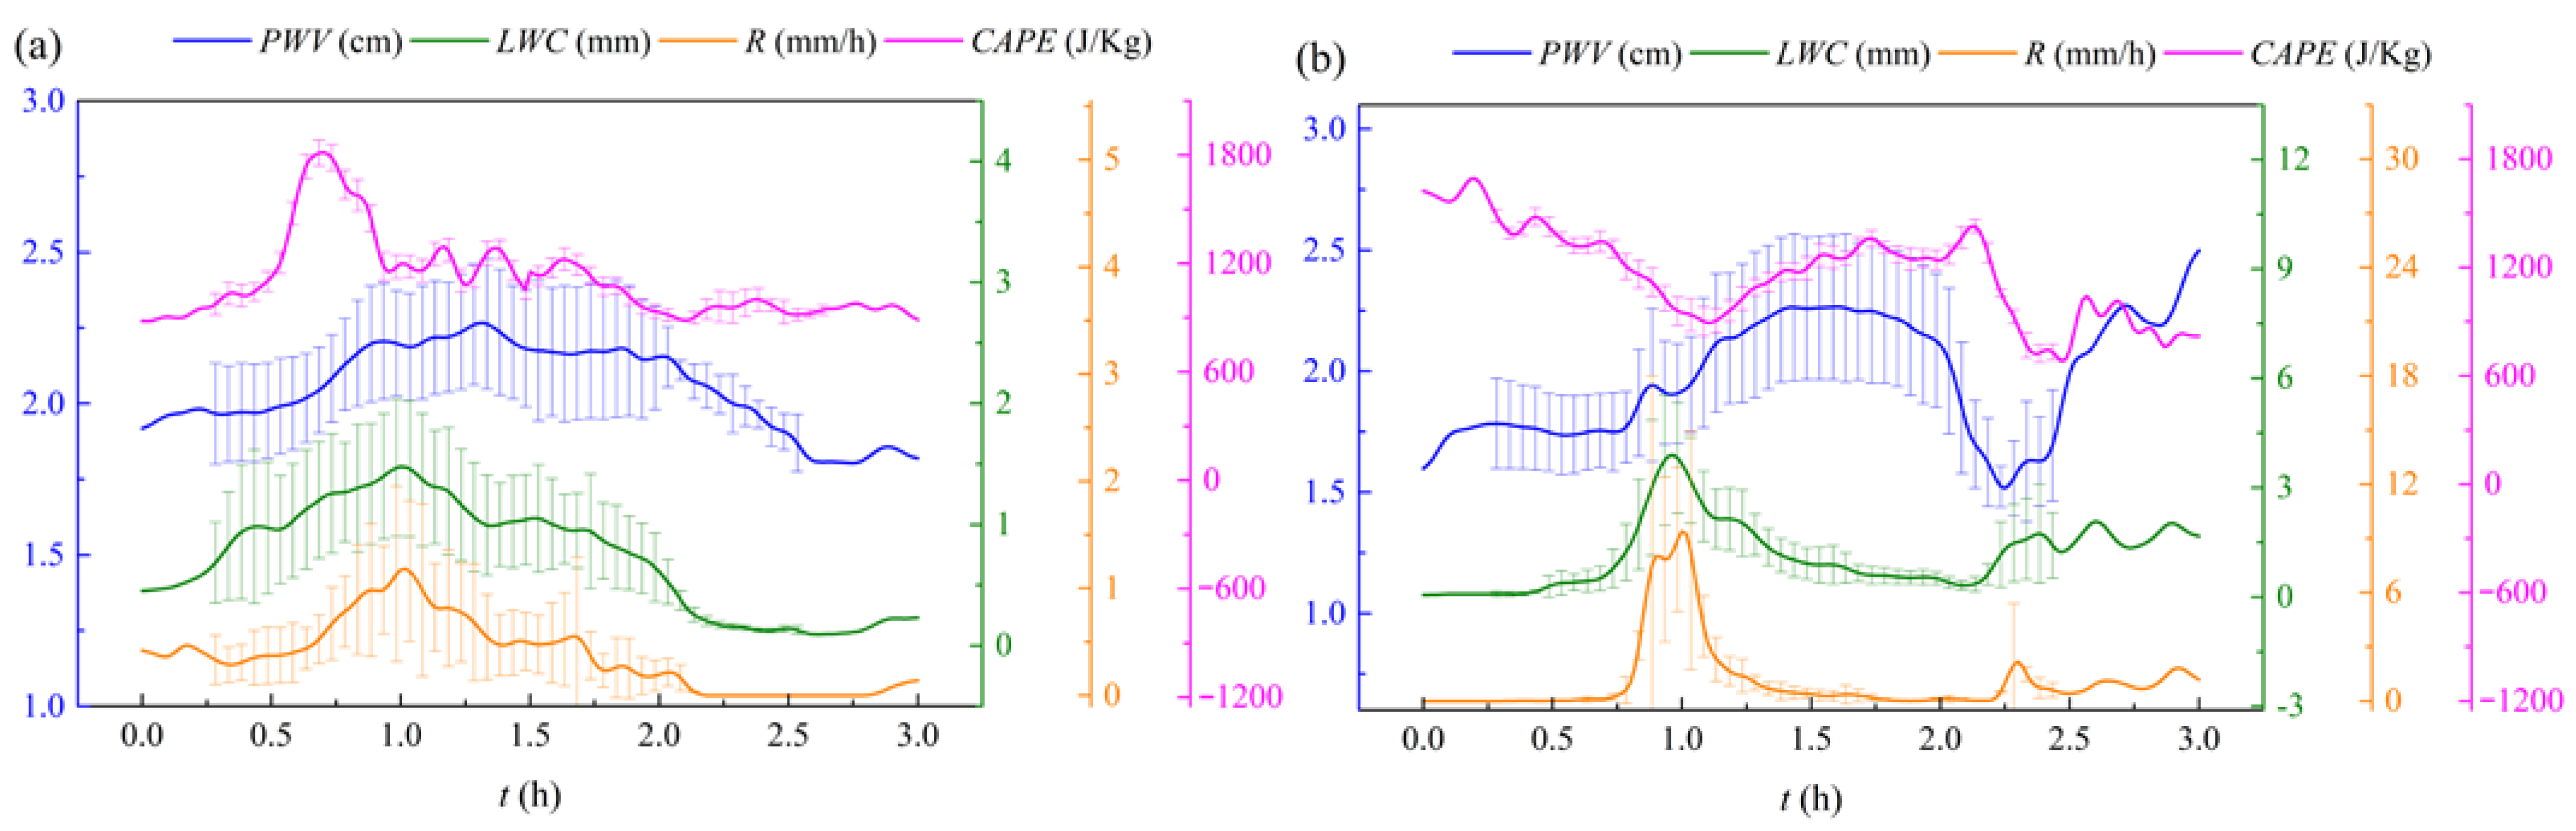
  • During the initial stage of precipitation, PWV values were generally greater than 1.7 cm. CAPE values were quick to decrease before the occurrence of precipitation and were generally larger than 1000 J/kg under convective–mixed precipitations. These values may serve as preliminary reference indicators for nowcasting.
These observations may be meaningful for characterizing meteorology and precipitation in the TP and similar regions during the summer monsoon. However, the effects of raindrop scattering on the inversion method of microwave radiometer have not been clearly delineated, which reduces the detection accuracy of the MWR during rainy conditions. Although retrieval algorithms and applications for separate rain droplets from cloud liquid water are challengeable, it is still necessary to quantitatively evaluate the influence of precipitation on the inversion of water vapor and liquid water, and to generally improve the reliability of precipitation observation.

6. Conclusions

The investigation of the atmospheric characteristics is of great significance in exploiting air water resources. A ground-based MWR was used in this study to conduct meteorological analysis over the TP region during the East Asian summer monsoon. The characteristic height of the adiabatic air parcel, atmospheric instability indicators, and potential cloud water resources were all considered. The MWR showed high detection accuracy in different weather systems, with MD values of temperature, vapor density, and relative humidity of 0.16 K, −0.16 g/m3, and −2.81% between the MWR and RAOB. The verified MWR measurements were used to define statistical stability indices (i.e., CAPE and CIN), and the main characteristics of parcel heights (i.e., CCL, LCL, LFC, and EL) for entire days of the monsoon under different weather conditions. The atmospheric and liquid water parameters and stability and convection indices during the precipitation process were fully investigated. This information revealed remarkable characteristics of the rainfall system and short-term weather processes at work over the TP region.
Precipitation occurrences are closely related to the nature of precipitation cloud systems, diurnal and seasonal changes, and thermal conditions. Thus, the meteorological characteristics retrieved from the ground-based MWR in this study are partial and preliminary. In the future, more detailed monitoring of the cloud–precipitation processes should be performed to comprehensively characterize short-term precipitation forecast and quantitative precipitation estimation.

Supplementary Materials

The following are available online at https://0-www-mdpi-com.brum.beds.ac.uk/article/10.3390/rs13132527/s1, The values of MD and RMSE of temperature, vapor density and relative humidity obtained from MWR and RAOB under clear-sky, cloudy-sky, and rainy-sky conditions.

Author Contributions

Conceptualization, J.W. and Y.S.; methodology, J.W.; formal analysis, Q.L., J.Y., and Y.S.; investigation, Y.R., Z.Q., and J.C.; data curation, J.W. and Y.S.; writing—original draft preparation, Y.S.; writing—review and editing, J.W., Y.S., and O.O.A.; supervision, J.W. and G.W.; project administration, J.W.; funding acquisition, J.W. and G.W. All authors have read and agreed to the published version of the manuscript.

Funding

This research was supported by the National Natural Science Foundation of China (Grant No. 52009059); the National Key Research and Development Program (Grant No. 2017YFC0403600, 2016YFE0201900); the China postdoctoral science foundation (Grant No. 2018M641372); the State Key Laboratory of Hydroscience and Engineering (2017-KY-04) at Tsinghua University; and the State Key Laboratory of Plateau Ecology and Agriculture at Qinghai University.

Institutional Review Board Statement

Not applicable.

Informed Consent Statement

Not applicable.

Data Availability Statement

The data presented in this study are available on request from the corresponding author.

Acknowledgments

We would like to thank Zhifeng Zhao, Peichong Pan, Wenwen Bai, Xiaomei Zhu, Beiming Kang, Shoukai Cao, Jie Zhao, Jiahua Wan, Jia Wang, Julong He, Weiwen Shen, and all other members of the Research Group from Tsinghua University and Qinghai University for contributions to the field experiment, without whom this work would not be possible.

Conflicts of Interest

The authors declare no conflict of interest.

References

  1. Immerzeel, W.W.; Beek, L.P.H.; Bierkens, M.F.P. Climate change will affect the Asian water towers. Science 2010, 328, 1382–1385. [Google Scholar] [CrossRef]
  2. Wu, G.; Duan, A.; Liu, Y.; Mao, J.; Ren, R.; Bao, Q.; He, B.; Liu, B.; Hu, W. Tibetan Plateau climate dynamics: Recent research progress and outlook. Nat. Sci. Rev. 2015, 2, 100–116. [Google Scholar] [CrossRef] [Green Version]
  3. He, X.; Song, M.; Zhou, Z. Temporal and spatial characteristics of water vapor and cloud water over the Qinghai-Xizang Plateau in summer. Plat. Meteorol. 2020, 39, 1339–1347. [Google Scholar] [CrossRef]
  4. Wang, G.Q.; Zhong, D.Y.; Li, T.J.; Zhang, Y.; Meng, C.Q.; Zhang, M.X.; Song, X.L.; Wei, J.H.; Huang, Y.F. Study on sky rivers: Concept, theory, and implications. J. Hydro Environ. Res. 2018, 21, 109–117. [Google Scholar] [CrossRef]
  5. Holtslag, A.A.M.; Svensson, G.; Baas, P.; Basu, S.; Beare, B.; Beljaars, A.C.M.; Bosveld, F.C.; Cuxart, J.; Lindvall, J.; Steeneveld, G.J.; et al. Stable atmospheric boundary layers and diurnal cycles: Challenges for weather and climate models. Bull. Am. Meteorol. Soc. 2013, 94, 1691–1706. [Google Scholar] [CrossRef]
  6. Ohtani, R. Detection of water vapor variations driven by thermally-induced local circulations using the Japanese continuous GPS array. Geophys. Res. Lett. 2001, 28, 151–154. [Google Scholar] [CrossRef]
  7. Renju, R.; Raju, C.S.; Mathew, N.; Antony, T.; Moorthy, K.K. Microwave radiometer observations of interannual water vapor variability and vertical structure over a tropical station. J. Geophys. Res. 2015, 120, 4585–4599. [Google Scholar] [CrossRef]
  8. Ha, J.; Park, K.D.; Kim, K.; Kim, Y.H. Comparison of atmospheric water vapor profiles obtained by GPS, MWR, and radiosonde. Asia-Pac. J. Atmos. Sci. 2010, 46, 233–241. [Google Scholar] [CrossRef]
  9. Xu, G.R.; Xi, B.K.; Zhang, W.G.; Cui, C.G.; Dong, X.Q.; Liu, Y.Y.; Yan, G.P. Comparison of atmospheric profiles between microwave radiometer retrievals and radiosonde soundings. J. Geophys. Res. 2015, 120, 10313–10323. [Google Scholar] [CrossRef]
  10. Zhao, Y.X.; Yan, H.L.; Wu, P.; Zhou, D. Linear correction method for improved atmospheric vertical profile retrieval based on ground-based microwave radiometer. Atmos. Res. 2020, 232, 1–10. [Google Scholar] [CrossRef]
  11. Li, Q.; Wei, M.; Wang, Z.; Chu, Y.; Ma, L. Evaluation and correction of ground-based microwave radiometer observations based on NCEP-FNL data. Atmos. Clim. Sci. 2019, 9, 229–242. [Google Scholar] [CrossRef] [Green Version]
  12. Chakraborty, R.; Maitra, A. Retrieval of atmospheric properties with radiometric measurements using neural network. Atmos. Res. 2016, 181, 124–132. [Google Scholar] [CrossRef]
  13. Cadeddu, M.P.; Liljegren, J.C.; Turner, D.D. The Atmospheric radiation measurement (ARM) program network of microwave radiometers: Instrumentation, data, and retrievals. Atmos. Meas. Tech. 2013, 6, 2359–2372. [Google Scholar] [CrossRef] [Green Version]
  14. Knupp, K.; Ware, R.; Cimini, D.; Vandenberghe, F.; Vivekanandan, J.; Westwater, E.; Coleman, T.; Phillips, D. Ground-based passive microwave profiling during dynamic weather conditions. J. Atmos. Ocean. Technol. 2009, 26, 1057–1073. [Google Scholar] [CrossRef]
  15. Madhulatha, A.; Rajeevan, M.; Venkat Ratnam, M.; Bhate, J.; Naidu, C.V. Nowcasting severe convective activity over southeast India using ground-based microwave radiometer observations. J. Geophys. Res. 2013, 118, 1–13. [Google Scholar] [CrossRef] [Green Version]
  16. Ware, R.; Cimini, D.; Campos, E.; Giuliani, G.; Albers, S.; Nelson, M.; Koch, S.E.; Joe, P.; Cober, S. Thermodynamic and liquid profiling during the 2010 Winter Olympics. Atmos. Res. 2013, 132, 278–290. [Google Scholar] [CrossRef]
  17. Snider, J.B. Long-term observations of cloud liquid, water vapor, and cloud-base temperature in the North Atlantic Ocean. J. Atmos. Ocean. Technol. 2000, 17, 928–939. [Google Scholar] [CrossRef]
  18. Iassamen, A.; Sauvageot, H.; Jeannin, N.; Ameur, S. Distribution of tropospheric water vapor in clear and cloudy conditions from microwave radiometric profiling. J. Appl. Meteorol. Clim. 2009, 48, 600–615. [Google Scholar] [CrossRef]
  19. Westwater, E.R. Accuracy of water-vapor and cloud liquid determination by dual-frequency ground-based microwave radiometry. Radio Sci. 1978, 13, 677–685. [Google Scholar] [CrossRef]
  20. Westwater, E.R.; Guiraud, F.O. Ground-based microwave radiometric retrieval of precipitable water-vapor in the presence of clouds with high liquid content. Radio Sci. 1980, 15, 947–957. [Google Scholar] [CrossRef]
  21. Wei, C.; Leighton, H.; Rogers, R. A comparison of several radiometric methods of deducing path-integrated cloud liquid water. J. Atmos. Ocean. Technol. 1989, 6, 1001–1012. [Google Scholar] [CrossRef] [Green Version]
  22. Cimini, D.; Hewison, T.; Martin, L.; Güldner, J.; Gaffard, C.; Marzano, F. Temperature and humidity profile retrievals from ground-based microwave radiometers during TUC. Meteorol. Z. 2006, 15, 45–56. [Google Scholar] [CrossRef]
  23. Marzano, F.S.; Cimini, D.; Ciotti, P.; Ware, R. Modeling and measurement of rainfall by ground-based multispectral microwave radiometry. Trans. Geosci. Remote Sens. 2005, 43, 1000–1011. [Google Scholar] [CrossRef]
  24. Marzano, F.S.; Cimini, D.; Montopoli, M. Investigating precipitation microphysics using ground-based microwave remote sensors and disdrometer data. Atmos. Res. 2010, 97, 583–600. [Google Scholar] [CrossRef]
  25. Chen, T.; Chen, Q.; Ding, R. Relationship between atmospheric vapor content monitored by ground-based microwave radiometer and rain intensity in Zhangye Prefecture. Arid Land Geog. 2007, 30, 501–506. [Google Scholar] [CrossRef]
  26. Karavaev, D.M.; Shchukin, G.G. Status and prospects of application of microwave radiometry of the atmosphere. Atmos. Ocean. Opt. 2016, 29, 308–313. [Google Scholar] [CrossRef]
  27. Cadeddu, M.P.; Marchand, R.; Orlandi, E.; Turner, D.D.; Mech, M. Microwave passive ground-based retrievals of cloud and rain liquid water path in drizzling clouds: Challenges and possibilities. IEEE Trans. Geosci. Remote Sens. 2017, 55, 6468–6481. [Google Scholar] [CrossRef]
  28. Cimini, D.; Campos, E.; Ware, R.; Albers, S.; Giuliani, G.; Oreamuno, J.; Joe, P.; Koch, S.E.; Cober, S.; Westwater, E. Thermodynamic atmospheric profiling during the 2010 winter Olympics using ground-based microwave radiometry. Trans. Geosci. Remote Sens. 2011, 49, 4959–4969. [Google Scholar] [CrossRef]
  29. Radiometrics Corporation. MP3000A Profiler Operator’s Manual; Radiometrics Corporation: Boulder, CO, USA, 2008. [Google Scholar]
  30. Ming, H.; Wei, M.; Wang, M.; Gao, L.; Chen, L.; Wang, X. Analysis of fog at Xianyang airport based on multi-source ground-based detection data. Atmos. Res. 2019, 220, 34–45. [Google Scholar] [CrossRef]
  31. Bennartz, R.; Bauer, P. Sensitivity of microwave radiances at 85–183 GHz to precipitating ice particles. Radio Sci. 2003, 38, 1–8. [Google Scholar] [CrossRef]
  32. Liu, Y.; Mao, J.; Liu, J.; Li, F. Research of BP neural network for microwave radiometer remote sensing retrieval of temperature, relative humidity, cloud liquid water profiles. Plat. Meteorol. 2010, 29, 1514–1523. [Google Scholar]
  33. Clough, S.A.; Shephard, M.W.; Mlawer, E.J.; Delamere, J.S.; Iacono, M.J.; Cady-Pereira, K.; Boukabara, S.; Brown, P.D. Atmospheric radiative transfer modeling: A summary of the AER codes. J. Quant. Spectrosc. Radiat. Transf. 2005, 91, 233–244. [Google Scholar] [CrossRef]
  34. Wang, Z.H.; Li, Q.; Hu, F.C.; Cao, X.F.; Chu, Y.L. Remote sensing of lightning by a ground-based microwave radiometer. Atmos. Res. 2014, 150, 143–150. [Google Scholar] [CrossRef]
  35. Westwater, E.R.; Crewell, S.; Matzler, C.; Cimini, D. Principles of surface-based microwave and millimeter wave radiometric remote sensing of the troposphere. Quad. Soc. Ital. Elettr. 2005, 1, 50–90. [Google Scholar]
  36. Solheim, F.; Godwin, J.R.; Westwater, E.R.; Han, Y.; Keihm, S.J.; Marsh, K.; Ware, R. Radiometric profiling of temperature, water vapor and cloud liquid water using various inversion methods. Radio Sci. 1998, 33, 393–404. [Google Scholar] [CrossRef] [Green Version]
  37. Rumelhart, D.E.; Hinton, G.E.; Williams, R.J. Learning representations by back-propagating errors. Nature 1986, 323, 533–536. [Google Scholar] [CrossRef]
  38. Cimini, D.; Caumont, O.; Löhnert, U.; Alados-Arboledast, L.; Huet, T.; Ferrario, M.; Madonna, F.; Haefele, A.; Nasir, F.; Pace, G.; et al. A data assimilation experiment of temperature and humidity profiles from an international network of ground-based microwave radiometers. In Proceedings of the 13th Specialist Meeting on Microwave Radiometry and Remote Sensing of the Environment (MicroRad), Pasadena, CA, USA, 24–27 March 2014. [Google Scholar] [CrossRef]
  39. Caumont, O.; Cimini, D.; Löhnert, U.; Alados-Arboledas, L.; Bleisch, R.; Buffa, F.; Ferrario, M.E.; Haefele, A.; Huet, T.; Madonna, F.; et al. Assimilation of humidity and temperature observations retrieved from ground-based microwave radiometers into a convective-scale NWP model. Q. J. R. Meteorol. Soc. 2016, 142, 2692–2704. [Google Scholar] [CrossRef] [Green Version]
  40. Mirchandani, G.; Cao, W. On hidden nodes for neural nets. Trans. Circuits Syst. 1989, 36, 661–664. [Google Scholar] [CrossRef]
  41. Che, Y.; Ma, S.; Xing, F.; Li, S.; Dai, Y. Research on retrieval of atmospheric temperature and humidity profiles from combined ground-based microwave radiometer and cloud radar observations. Atmos. Meas. Tech. Discuss. 2016, 2016, 1–24. [Google Scholar] [CrossRef] [Green Version]
  42. Busen, R. Dropsondes and radiosondes for atmospheric measurements. In Atmospheric Physics: Background–Methods–Trends, 1st ed.; Schumann, U., Ed.; Springer: Berlin/Heidelberg, Germany, 2012; pp. 317–329. [Google Scholar] [CrossRef]
  43. Feltz, W.F.; Smith, W.L.; Howell, H.B.; Knuteson, R.O.; Woolf, H.; Revercomb, H.E. Near-continuous profiling of temperature, moisture, and atmospheric stability using the atmospheric emitted radiance interferometer (AERI). J. Appl. Meteorol. 2003, 42, 584–597. [Google Scholar] [CrossRef]
  44. Cimini, D.; Nelson, M.; Güldner, J.; Ware, R. Forecast indices from a ground-based microwave radiometer for operational meteorology. Atmos. Meas. Tech. 2015, 8, 315–333. [Google Scholar] [CrossRef] [Green Version]
  45. Wanbiao, L. Atmospheric Physics: Basics of Thermodynamics and Radiation, 1st ed.; Peking University Press: Beijing, China, 2010. [Google Scholar]
  46. Iribarne, J.V.; Godson, W.L. Atmospheric thermodynamics, 2nd ed.; Springer Science & Business Media: Toronto, ON, Canada, 2012. [Google Scholar]
  47. Xu, G.; Ware, R.; Zhang, W.; Feng, G.; Liao, K.; Liu, Y. Effect of off-zenith observations on reducing the impact of precipitation on ground-based microwave radiometer measurement accuracy. Atmos. Res. 2014, 140–141, 85–94. [Google Scholar] [CrossRef]
  48. Zhang, W.; Xu, G.; Liu, Y.; Yan, G.; Wang, S. Uncertainties of ground-based microwave radiometer retrievals in zenith and off-zenith methods under snow conditions. Atmos. Meas. Tech. Discuss. 2016, 1–27. [Google Scholar] [CrossRef]
  49. Wang, J.; Rossow, W.B. Determination of cloud vertical structure from upper-air observations. J. Appl. Meteorol. 1995, 34, 2243–2258. [Google Scholar] [CrossRef] [Green Version]
  50. De Angelis, F.; Cimini, D.; Lohnert, U.; Caumont, O.; Haefele, A.; Pospichal, B.; Martinet, P.; Navas-Guzman, F.; Klein-Baltink, H.; Dupont, J.C.; et al. Long-term observations minus background monitoring of ground-based brightness temperatures from a microwave radiometer network. Atmos. Meas. Tech. 2017, 10, 3947–3961. [Google Scholar] [CrossRef] [Green Version]
  51. Marzano, F.S.; Mattioli, V.; Milani, L.; Magde, K.M.; Brost, G.A. Sun-tracking microwave radiometry: All-weather estimation of atmospheric path attenuation at Ka-, V-, and W-band. IEEE Trans. Antennas Propag. 2016, 64, 4815–4827. [Google Scholar] [CrossRef]
  52. Martinet, P.; Dabas, A.; Donier, J.M.; Douffet, T.; Garrouste, O.; Guillot, R. 1D-Var temperature retrievals from microwave radiometer and convective scale model. Tellus Ser. A Dyn. Meteorol. Oceanogr. 2015, 67. [Google Scholar] [CrossRef] [Green Version]
  53. Ahn, M.H.; Han, D.; Won, H.Y.; Morris, V. A cloud detection algorithm using the downwelling infrared radiance measured by an infrared pyrometer of the ground-based microwave radiometer. Atmos. Meas. Tech. 2015, 8, 553–566. [Google Scholar] [CrossRef] [Green Version]
  54. Poore, K.D.; Wang, J.; Rossow, W.B. Cloud layer thicknesses from a combination of surface and upper-air observations. J. Clim. 1995, 8, 550–568. [Google Scholar] [CrossRef] [Green Version]
  55. Bringi, V.; Chandrasekar, V.; Hubbert, J.; Gorgucci, E.; Randeu, W.; Schoenhuber, M. Raindrop size distribution in different climatic regimes from disdrometer and dual-polarized radar analysis. J. Atmos. Sci. 2003, 60, 354–365. [Google Scholar] [CrossRef]
  56. Araki, K.; Murakami, M.; Ishimoto, H.; Tajiri, T. Ground-based microwave radiometer variational analysis during no-rain and rain conditions. Sola 2015, 11, 108–112. [Google Scholar] [CrossRef] [Green Version]
  57. Chan, P.W. Performance and application of a multi-wavelength, ground-based microwave radiometer in intense convective weather. Meteorol. Z. 2009, 18, 253–265. [Google Scholar] [CrossRef]
  58. Guldner, J.; Spankuch, D. Results of year-round remotely sensed integrated water vapor by ground-based microwave radiometry. J. Appl. Meteorol. 1999, 38, 981–988. [Google Scholar] [CrossRef] [Green Version]
  59. Miao, C. Cloud Water Resources and Precipitation Efficiency Evaluation over China. Ph.D. Thesis, Chinese Academy of Meteorological Sciences, Beijing, China, 2013. [Google Scholar]
  60. Chakraborty, R.; Das, S.; Jana, S.; Maitra, A. Nowcasting of rain events using multi-frequency radiometric observations. J. Hydrol. 2014, 513, 467–474. [Google Scholar] [CrossRef]
  61. Park, S.G.; Kim, H.L.; Ham, Y.W.; Jung, S.H. Comparative evaluation of the OTT PARSIVEL2 using a collocated two-dimensional video disdrometer. J. Atmos. Ocean. Technol. 2017, 34, 2059–2082. [Google Scholar] [CrossRef]
  62. Battaglia, A.; Saavedra, P.; Simmer, C.; Rose, T. Rain observations by a multifrequency dual-polarized radiometer. IEEE Geosci. Remote Sens. Lett. 2009, 6, 354–358. [Google Scholar] [CrossRef]
Figure 1. TP meteorological observation operation base: Yellow River mainstream (1) and corresponding tributaries of Kequ River (2), Darlag River (3), Jimai River (4). The black and white subgraph denotes the location of the source of the Yellow River in the TP. The color subgraph denotes the location of the operation site in the source region of the Yellow River.
Remotesensing 13 02527 g001
Figure 2. Forward and inversion algorithms.
Remotesensing 13 02527 g002
Figure 3. Comparison of temperature (a,d), vapor density (b,e), and relative humidity (c,f) profiles obtained from MWR and radiosonde observations under clear-sky, cloudy-sky, and rainy-sky conditions. Panels (ac) and (df) denote retrieval parameters at 7:00 and 19:00, respectively.
Remotesensing 13 02527 g003
Figure 4. Comparison of temperature bias (a,d), vapor density bias (b,e), and relative humidity bias (c,f) profiles obtained from MWR and radiosonde observations under clear-sky, cloudy-sky, and rainy-sky conditions. Panels (ac) and (df) denote retrieval parameters at 7:00 and 19:00, respectively. RMSEs are marked by error bars in (af).
Remotesensing 13 02527 g004
Figure 5. Statistical characteristics of vapor density and liquid water content (whole day, monsoon season) under different weather conditions. (a) Precipitable water vapor (PWV), (b) integrated liquid water content (LWC). The t(h) is expressed in UTC+8.
Remotesensing 13 02527 g005
Figure 6. Statistical characteristics of parcel heights (whole day, monsoon season) under different weather conditions. (a) CCL, (b) LCL, (c) LFC, (d) EL. The t(h) is expressed in UTC+8.
Remotesensing 13 02527 g006aRemotesensing 13 02527 g006b
Figure 7. Statistical characteristics of stability indices (whole day, monsoon) season under different weather conditions. (a) CAPE, (b) CIN. The t(h) is expressed in UTC+8.
Remotesensing 13 02527 g007
Figure 8. Temporal evolution of PWV, LWC, CAPE, and R for (a) stratiform precipitation and (b) convective–mixed precipitation.
Remotesensing 13 02527 g008
Figure 9. Scattergrams of PWV against R (a), LWC against R (b), and LWC against PWV (c) for stratiform and convective–mixed precipitations. S and C&M denote stratiform and convective–mixed precipitations, respectively.
Remotesensing 13 02527 g009
Publisher’s Note: MDPI stays neutral with regard to jurisdictional claims in published maps and institutional affiliations.

