Article

The Potential of Mapping Grassland Plant Diversity with the Links among Spectral Diversity, Functional Trait Diversity, and Species Diversity

1
State Key Laboratory of Vegetation and Environmental Change, Institute of Botany, Chinese Academy of Sciences, 20 Nanxincun, Xiangshan, Beijing 100093, China
2
Key Laboratory of Ecosystem Network Observation and Modeling, Institute of Geographic Sciences and Natural Resources Research, Chinese Academy of Sciences, Beijing 100049, China
3
State Key Laboratory of Resources and Environmental Information System, Institute of Geographic Sciences and Natural Resources Research, Chinese Academy of Sciences, Beijing 100101, China
4
College of Resources and Environment, University of Chinese Academy of Sciences, Beijing 100049, China
*
Author to whom correspondence should be addressed.
Remote Sens. 2021, 13(15), 3034; https://0-doi-org.brum.beds.ac.uk/10.3390/rs13153034
Submission received: 1 July 2021 / Revised: 28 July 2021 / Accepted: 29 July 2021 / Published: 2 August 2021
(This article belongs to the Special Issue Remote Sensing of Ecosystems)

Abstract

:
Mapping biodiversity is essential for assessing conservation and ecosystem services in global terrestrial ecosystems. Compared with remotely sensed mapping of forest biodiversity, that of grassland plant diversity has been less studied, because of the small size of individual grass species and the inherent difficulty in identifying these species. The technological advances in unmanned aerial vehicle (UAV)-based or proximal imaging spectroscopy with high spatial resolution provide new approaches for mapping and assessing grassland plant diversity based on spectral diversity and functional trait diversity. However, relatively few studies have explored the relationships among spectral diversity, remote-sensing-estimated functional trait diversity, and species diversity in grassland ecosystems. In this study, we examined the links among spectral diversity, functional trait diversity, and species diversity in a semi-arid grassland monoculture experimental site. The results showed that (1) different grassland plant species harbored different functional traits or trait combinations (functional trait diversity), leading to different spectral patterns (spectral diversity). (2) The spectral diversity of grassland plant species increased gradually from the visible (VIR, 400–700 nm) to the near-infrared (NIR, 700–1100 nm) region, and to the short-wave infrared (SWIR, 1100–2400 nm) region. (3) As the species richness increased, the functional traits and spectral diversity increased in a nonlinear manner, finally tending to saturate. (4) Grassland plant species diversity could be accurately predicted using hyperspectral data (R2 = 0.73, p < 0.001) and remotely sensed functional traits (R2 = 0.66, p < 0.001) using cluster algorithms. This will enhance our understanding of the effect of biodiversity on ecosystem functions and support regional grassland biodiversity conservation.

Graphical Abstract

1. Introduction

Grasslands, which cover a total area of 52.5 million km2 and account for approximately 40.5% of the terrestrial area excluding Greenland and Antarctica, are the largest terrestrial ecosystems in the world [1]. However, serious losses in grassland plant diversity have been observed in the past decades owing to the combined effects of climate change and human activities, especially because of overgrazing, the conversion of grassland to crop agriculture, and habitat fragmentation [2,3]. Grassland plant diversity monitoring is a key issue for ecology and remote sensing sciences [4,5,6]. Traditional grassland plant diversity monitoring is largely based on the in situ surveying of sample plots [7]; however, this is time-consuming, labor-intensive, and results in poor spatial representation and temporal continuity for applications in regional assessments. Satellite remote sensing technology has the advantages of a wide detection range and a short data acquisition cycle [8]. It enables the environmental context and the climatic and anthropogenic drivers of large-scale biodiversity loss to be rapidly tracked and elucidated, along with continuous, borderless, and repeatable biodiversity observations [5]. Many innovative remote sensing methods or tools have been proposed and developed to monitor plant biodiversity, especially for forest ecosystems [9,10,11]. Compared to biodiversity monitoring in forests, few grassland biodiversity monitoring exercises have been performed successfully using the remote sensing approach [12,13,14].
To date, studies have focused mainly on the habitat/landscape-based classification of grassland types [15,16] or C3/C4 functional types [17,18,19], and the direct regional mapping of grass plant diversity [20,21]. Direct grass plant diversity mapping has tended to associate habitat heterogeneity or spectral heterogeneity to alpha diversity using coarse-resolution multispectral (e.g., MODIS, Landsat TM, or Sentinel-2) or hyperspectral satellites (e.g., EO-1 Hyperion hyperspectral sensor) [20,21] based on the spectral variability hypothesis (SVH) [22,23]. The SVH relates the spectral heterogeneity of neighboring pixels in optical remote sensing against the spatial ecosystem or environmental heterogeneity as surrogates for biodiversity, which is commonly used on coarse scales (several to hundreds of meters) [13,24,25]. However, the accuracy of plant diversity predictions using the SVH is highly scale-dependent [26], as high or low spectral variability could not still hold high or low species richness, depending on the composition of the vegetation community, season, and the extent of research [26]. Recent evidence indicates that both spectral and spatial resolution can affect the spectral diversity–biodiversity relationship [14]. First, the apparently homogeneous image pixels may conceal real heterogeneity at sub-pixel levels. The small size of individual herbaceous species and highly mixed species occurrence increases the difficulty of monitoring grassland biodiversity by means of remote sensing due to the coarse resolution [27]. Second, the low number of bands for multispectral sensors fails to adequately capture the biochemical or physiological traits that cause the spectral variability of canopy species [28]. Airborne or UAV-based imaging spectrometers with high spatial and spectral resolution provide continuous data across environmental gradients to monitor grassland biodiversity efficiently [27].
Detecting grassland plant diversity could be directly linked to spectral diversity. Spectral diversity can usually be expressed as information in content-based metrics derived from the spectral space [29]. These metrics include variance or standard deviation [28], the coefficient of variation (CV) [30], convex hull volume (CHV) [31], convex hull area (CHA) [13], spectral information divergence (SID) [32], and the spectral angle mapper (SAM) [33]. The estimated accuracy of grass biodiversity determined by the spectral diversity depends, to some extent, on the spectral resolution, spectral region, and the species richness within a given area [27,34]. In addition, the spectra of closely related species may be too similar to be separated [19,35]. Spectrally similar species tend to be classified into a single cluster as ‘‘spectral species” [36]. In contrast to the actual species, spectral species can be regarded as taxonomic species with a similar evolution history or phylogenetic relationship [14,37].
Plant functional traits may reflect the response of plants to changing climate and environmental conditions individually or jointly and provide information on plant evolution [38,39]. Considering that spectral absorption and scattering features of plants can be controlled by many specific functional traits, widely used biochemical or physiological traits, such as leaf mass per area (LMA), nitrogen (N), non-structural carbohydrates (NSC), chlorophyll, carotenoids, leaf dry matter content (LDMC), and lignin, have been successfully retrieved from hyperspectral data at the leaf or canopy level [7]. Empirical multivariate methods such as partial least squares regression (PLSR) and gaussian process regression (GPR) link the target variable with the full spectral information and these have been widely used in predicting functional traits in grassland ecosystems [40,41]. One advantage of plant functional trait mapping is the capturing of variation (volume, shape, and boundaries) in functional trait space, which enables the detection of species diversity or functional diversity without a priori species discrimination [10,34,35,42]. Analogously to spectral species, some species often exhibit covarying structural and physiological traits, driven by resource and environmental limitations based on the ‘functional convergence hypothesis’ [43], and are therefore usually grouped or clustered as plant functional types (PFTs) [35]. Compared to the classification of plant life/growth forms and actual species, the capability of imaging spectroscopy to causally link biochemical and structural traits to PFT with higher prediction accuracy and greater consistency has been validated in forest ecosystems [41,42]. However, few studies have explored functional trait-based grassland plant diversity monitoring [11].
The relationships among species diversity, spectral diversity, and functional trait diversity (or biochemical diversity) have been explored in tropical forests (e.g., in the Amazon and Hawaii) [42,44] and in the subtropical forest of Shennongjia [10,45]. However, the suitability of these links for grassland ecosystems needs to be further determined. In this study, we attempted to evaluate the relationships among species diversity, functional trait diversity, and spectral diversity in a semi-arid grassland monoculture experimental site with 17 grass species using in situ trait measurements and spectral monitoring from field spectrometers, and UAV-based imaging spectrometers. Our specific objectives are to: (1) test the spectral diversity between 17 grass species; (2) test the functional trait diversity between 17 grass species; (3) explore the changes in functional trait diversity and spectral diversity with an increase in species richness; (4) compare the performance of spectral-based and functional trait-based grassland plant diversity measurements.

2. Materials and Methods

2.1. Study Site

The study site was selected at a semi-arid grassland monoculture experimental site (Figure 1) at the Inner Mongolia Grassland Ecosystem Research Station (IMGERS, 116°42′E, 43°38′N), located in the Xilin River Basin, Inner Mongolia Autonomous Region, China. This site is characterized by a semi-arid climate with an annual average precipitation of 301 mm and an annual average temperature of 0.9 °C (2000–2016). The grassland monoculture experimental site consists of 20 dominant and common grassland species in a semi-arid steppe (see Table S1 for details). The 20 species include 1 perennial rhizome grass (Leymus chinensis), 5 perennial bunch grasses (Stipa grandis, Agropyron cristatum, Achnatherum sibiricum, Cleistogenes squarrosa, and Koeleria cristata), 4 perennial forbs (Carex korshinskyi, Allium ramosum, Allium chysanthum, Allium tenuissimum), 9 annual forbs (Artemisia sieversiana, Artemisia scoparia, Axyris amaranthoides, Chenopodium acuminatum, Chenopodium aristatum, Silene aprica, Salsola collina, Lappula myosotis, and Dontostemon dentatus) and 1 biennial forb (Thalictrum petaloideum) (see Table S1 for details). Eighty experimental plots of 1.2 m × 1.2 m with an interval of about 1 m, were established in June 2014, and divided into four blocks (Figure 1). Each of the 20 species was randomly assigned to one plot within each block, respectively. Seventeen species were finally selected because the leaves of the other three species were withered.

2.2. Spectral and Funtional Trait Measurements

Our previous study in the grassland monoculture experimental site demonstrated that 10 leaf functional traits, namely, chlorophyll a (Chl_a), chlorophyll b (Chl_b), carotenoid (Car), leaf mass per area (LMA), leaf dry matter content (LDMC), leaf total carbon (C), leaf total nitrogen (N), leaf total phosphorus (P), lignin (Lig), and cellulose (Cel) content could be retrieved from leaf spectra (R2 = 0.21–0.94 for 400–2450 nm) and canopy spectra (R2 = 0.26–0.90 for 400–2450 nm) using the PLSR method [46]. Moreover, the area-based functional traits could be better retrieved using leaf and canopy spectra rather than on a mass basis, especially for the physiological traits. Therefore, these leaf functional traits were selected and measured as area-based content (μg cm−2). For each of the 17 species, we selected 3 subplots of 0.3 m × 0.3 m with more than 20% cover from their corresponding monoculture experimental plots for leaf spectral and functional trait measurements in August, 2019.

2.2.1. Leaf-Level Spectroscopy

For each of the 17 species, we randomly collected 4, 3, and 3 fully matured leaves from the top, middle, and bottom layer for individuals with height > 30 cm, respectively, as well as 5 fully matured leaves from the top and middle canopy for individuals with height ≤ 30 cm at their monoculture experimental plots. Within 4 h after collection, each leaf spectrum, covering the 350–2500 nm region, was measured 10 times using a portable ASD spectrometer (Analytical Spectral Devices, FieldSpec 4 Std-Res, Inc., Boulder, CO, USA) attached to a leaf clip assembly with an inbuilt stable illuminator. The ASD spectrometer obtains spectral information with a spectral sampling interval of 1.4 nm in the 350–1000 nm region and 1.1 nm in the 1001–2500 nm region. For small leaves or leaflets, we arranged multiple leaves or leaflets into the field of view (FOV) of a leaf clip, fully filled without gaps or excessive overlap if necessary. The 350–400 nm and 2450–2500 nm spectral regions were excluded because of unexpected noise. A moving Savitzky–Golay filter [47] was finally applied to further smooth the spectra (Figure S1). In total, 298 leaf spectra for 17 species were measured. All measured leaf spectra for each selected subplot were also averaged as one repeat of its representative species (n = 51).

2.2.2. Leaf Functional Trait Measurements

For each selected monoculture experimental subplot, we randomly collected 30–400 fully expanded leaves to store in a portable cooler box for transport to the nearest laboratory within 1 km. Ten to fifty leaves were randomly selected for scanning to record leaf area using a portable area meter (LI-3000C, Li-COR, Inc., Lincoln, NE, USA). These fresh leaf samples were then stored in a −80 °C freezer until their pigments (Chl_a, Chl_b and Car) were analyzed using the UV-VIS spectrophotometer (PerkinElmer Lambda 25, Waltham, MA, USA). The average leaf area and fresh weight of the remaining samples were first measured within 2 h after collection. These leaf samples were then oven-dried at 65 °C for at least 72 h and weighed to obtain LMA (dry mass/fresh leaf area), specific leaf area (SLA,1/LMA), and leaf water concentration ((fresh mass − dry mass)/dry mass). Based on all samples of these dried leaves, leaf total C and N were measured using an elemental analyzer (vario MACRO cube, Frankfurt, German), P using a Mo-Sb colorimetric method, and Lig and Cel using standard spectrophotometric methods [48]. All measured leaf functional traits for each selected subplot were averaged as one repeat of its representative species (n = 51).

2.3. UAV-Based Hyperspectral Image Acquisition and Pre-Processing

Upscaling to the canopy scale, the Cubert UHD 185 hyperspectral spectrometer (HySpex, Oslo, Norway) was mounted on a six-rotor unmanned helicopter (DJI M600 PRO, Dajiang, Shenzhen, China) to acquire the hyperspectral image over the grassland monoculture experimental site between 11:30 and 12:00 on sunny and cloudless days in August 2018. One hundred and twenty-five spectral bands from 450–950 nm with a 4-nm sampling interval were recommended by the camera’s manufacturer [49]. The UAV flew over 30 m above the ground with a side and front overlap rate of both 80%, yielding a spatial resolution of about 0.03 m. Before take-off, the spectrometer was first field calibrated based on a white reference panel and a black plastic lens cap for dark measurements [50]. Furthermore, the radiometric correction was performed to convert the resulting imagery to apparent surface reflectance during the flight. All required hyperspectral imagery was fused with corresponding panchromatic imagery using the Cubert-Pilot software (Cubert GmbH, Ulm, Baden-Württemberg, Germany), and these were automatically mosaicked into the entire image across the study site using Agisoft PhotoScan software (Agisoft, St. Petersburg, Russia). To decrease the within-crown spectral variability and to match the size of the subplots, the mosaicked image was resampled into 0.30 m using a nearest-neighbor resampling method.

2.4. Leaf Functional Trait Mapping

Our previous study in this field site also showed that canopy traits, including Chl_a, Chl_b, Car, LMA, LDMC, C, N, and P, can be retrieved by the UAV-based UHD 185 hyperspectral spectrometer with acceptable accuracy (R2 = 0.34–0.89, p ≤ 0.001) [46]. Continuum removal was performed for the UAV-acquired hyperspectral image to improve the prediction accuracy of Cel and Lig (R2 = 0.53, RMSE = 1.03 mg·cm–2 for Cel; R2 = 0.54, RMSE = 0.92 mg·cm–2 for Lig; p ≤ 0.001, data not shown). These canopy traits were firstly mapped and then downscaled to the leaf level by pixel values of each retrieved canopy trait divided by the corresponding LAI (R2 = 0.87, RMSE = 0.34, p < 0.001).

2.5. Statistical Analysis

All the leaf functional traits or spectral values were standardized for subsequent analysis based on the Z-score normalization method: (t − T)/SD, where t is the leaf functional trait value or spectral reflectance, and T and SD are the mean value and standard deviation for each of the 17 species.
To estimate the spectral diversity, the average coefficient of variation (CV) was calculated from the leaf spectral data set (n = 298) for each wavelength (n = 2000) with different species richness (SR), which was simulated by randomly selecting different numbers of species out of the 17 species 5000 times. To analyze the spectral diversity, principal component analysis (PCA) and hierarchical cluster analysis with the Ward’s minimum variance method were applied based on the average spectra of each species [45,51], respectively. Through clustering, species with similar spectral signatures were grouped by visual assessment into ‘spectral species’.
To determine the functional trait diversity, PCA was first performed to determine the variation in leaf functional traits among the 17 species based on in situ average trait values. The hyperspectrally retrieved functional traits were also analyzed to incorporate individual variation for more sufficient observations of intraspecific and intraspecific differences of functional traits. Hierarchical clustering analysis was then applied to determine the PFT group. Furthermore, a phylogenetic tree of 17 grassland plant species was also built based on evolution history using Phylomatic V3.0 (http://phylodiversity.net/phylomatic/, access on 7 November 2020) for comparisons with the clustering results of leaf functional traits or spectra.
To determine the relationships among the species diversity, functional trait diversity, and spectral diversity, the Monte-Carlo technique was applied to simulate the average variations in functional traits and spectral values with increasing species diversity [44,45]. Firstly, one species was randomly selected from the total population of 17 species (n = 51). Different numbers of functional trait combinations (1–10) were then randomly selected out of 10 traits, and their average trait variation (the maximum Euclidean distance of multidimensional functional traits) between species was recorded, respectively. Other species were next randomly selected to track the change in the functional diversity with the combination of previously selected species, until all 17 species were populated. The above simulation was carried out 1000 times. We also repeated the operation to analyze the taxonomic variation in spectral diversity for different species richness.
To determine the prediction accuracy of grassland plant species diversity based on the functional trait diversity or spectral diversity, the self-adaptive fuzzy C-means (FCM) clustering algorithm was used to predict the species richness [10]. The optimal number of clusters was regarded as the predicted species richness. Firstly, the UAV-based hyperspectral data and hyperspectrally retrieved leaf functional traits were filtered with the normalized difference vegetation index (NDVI) > 0.2 [46] to obtain the pure vegetation pixels (n = 1098 for 0.3 m × 0.3 m), respectively. We then randomly selected different numbers of monoculture experimental plots out of all the 68 plots, covering the 17 species included in the study. The species richness was next predicted based on the spectral or functional trait data in the selected plots using the self-adaptive FCM clustering algorithm. The simulation was carried out 1000 times until all monoculture plots were incorporated. Finally, a linear regression method was applied to validate the predicted species richness with all the simulation results based on the actual species numbers (i.e., species richness). The coefficient of determination (R2), the root mean squared error (RMSE), residual error (Resid), and standard errors (SE) were calculated to assess the model fit and predictive relationship strength.

3. Results

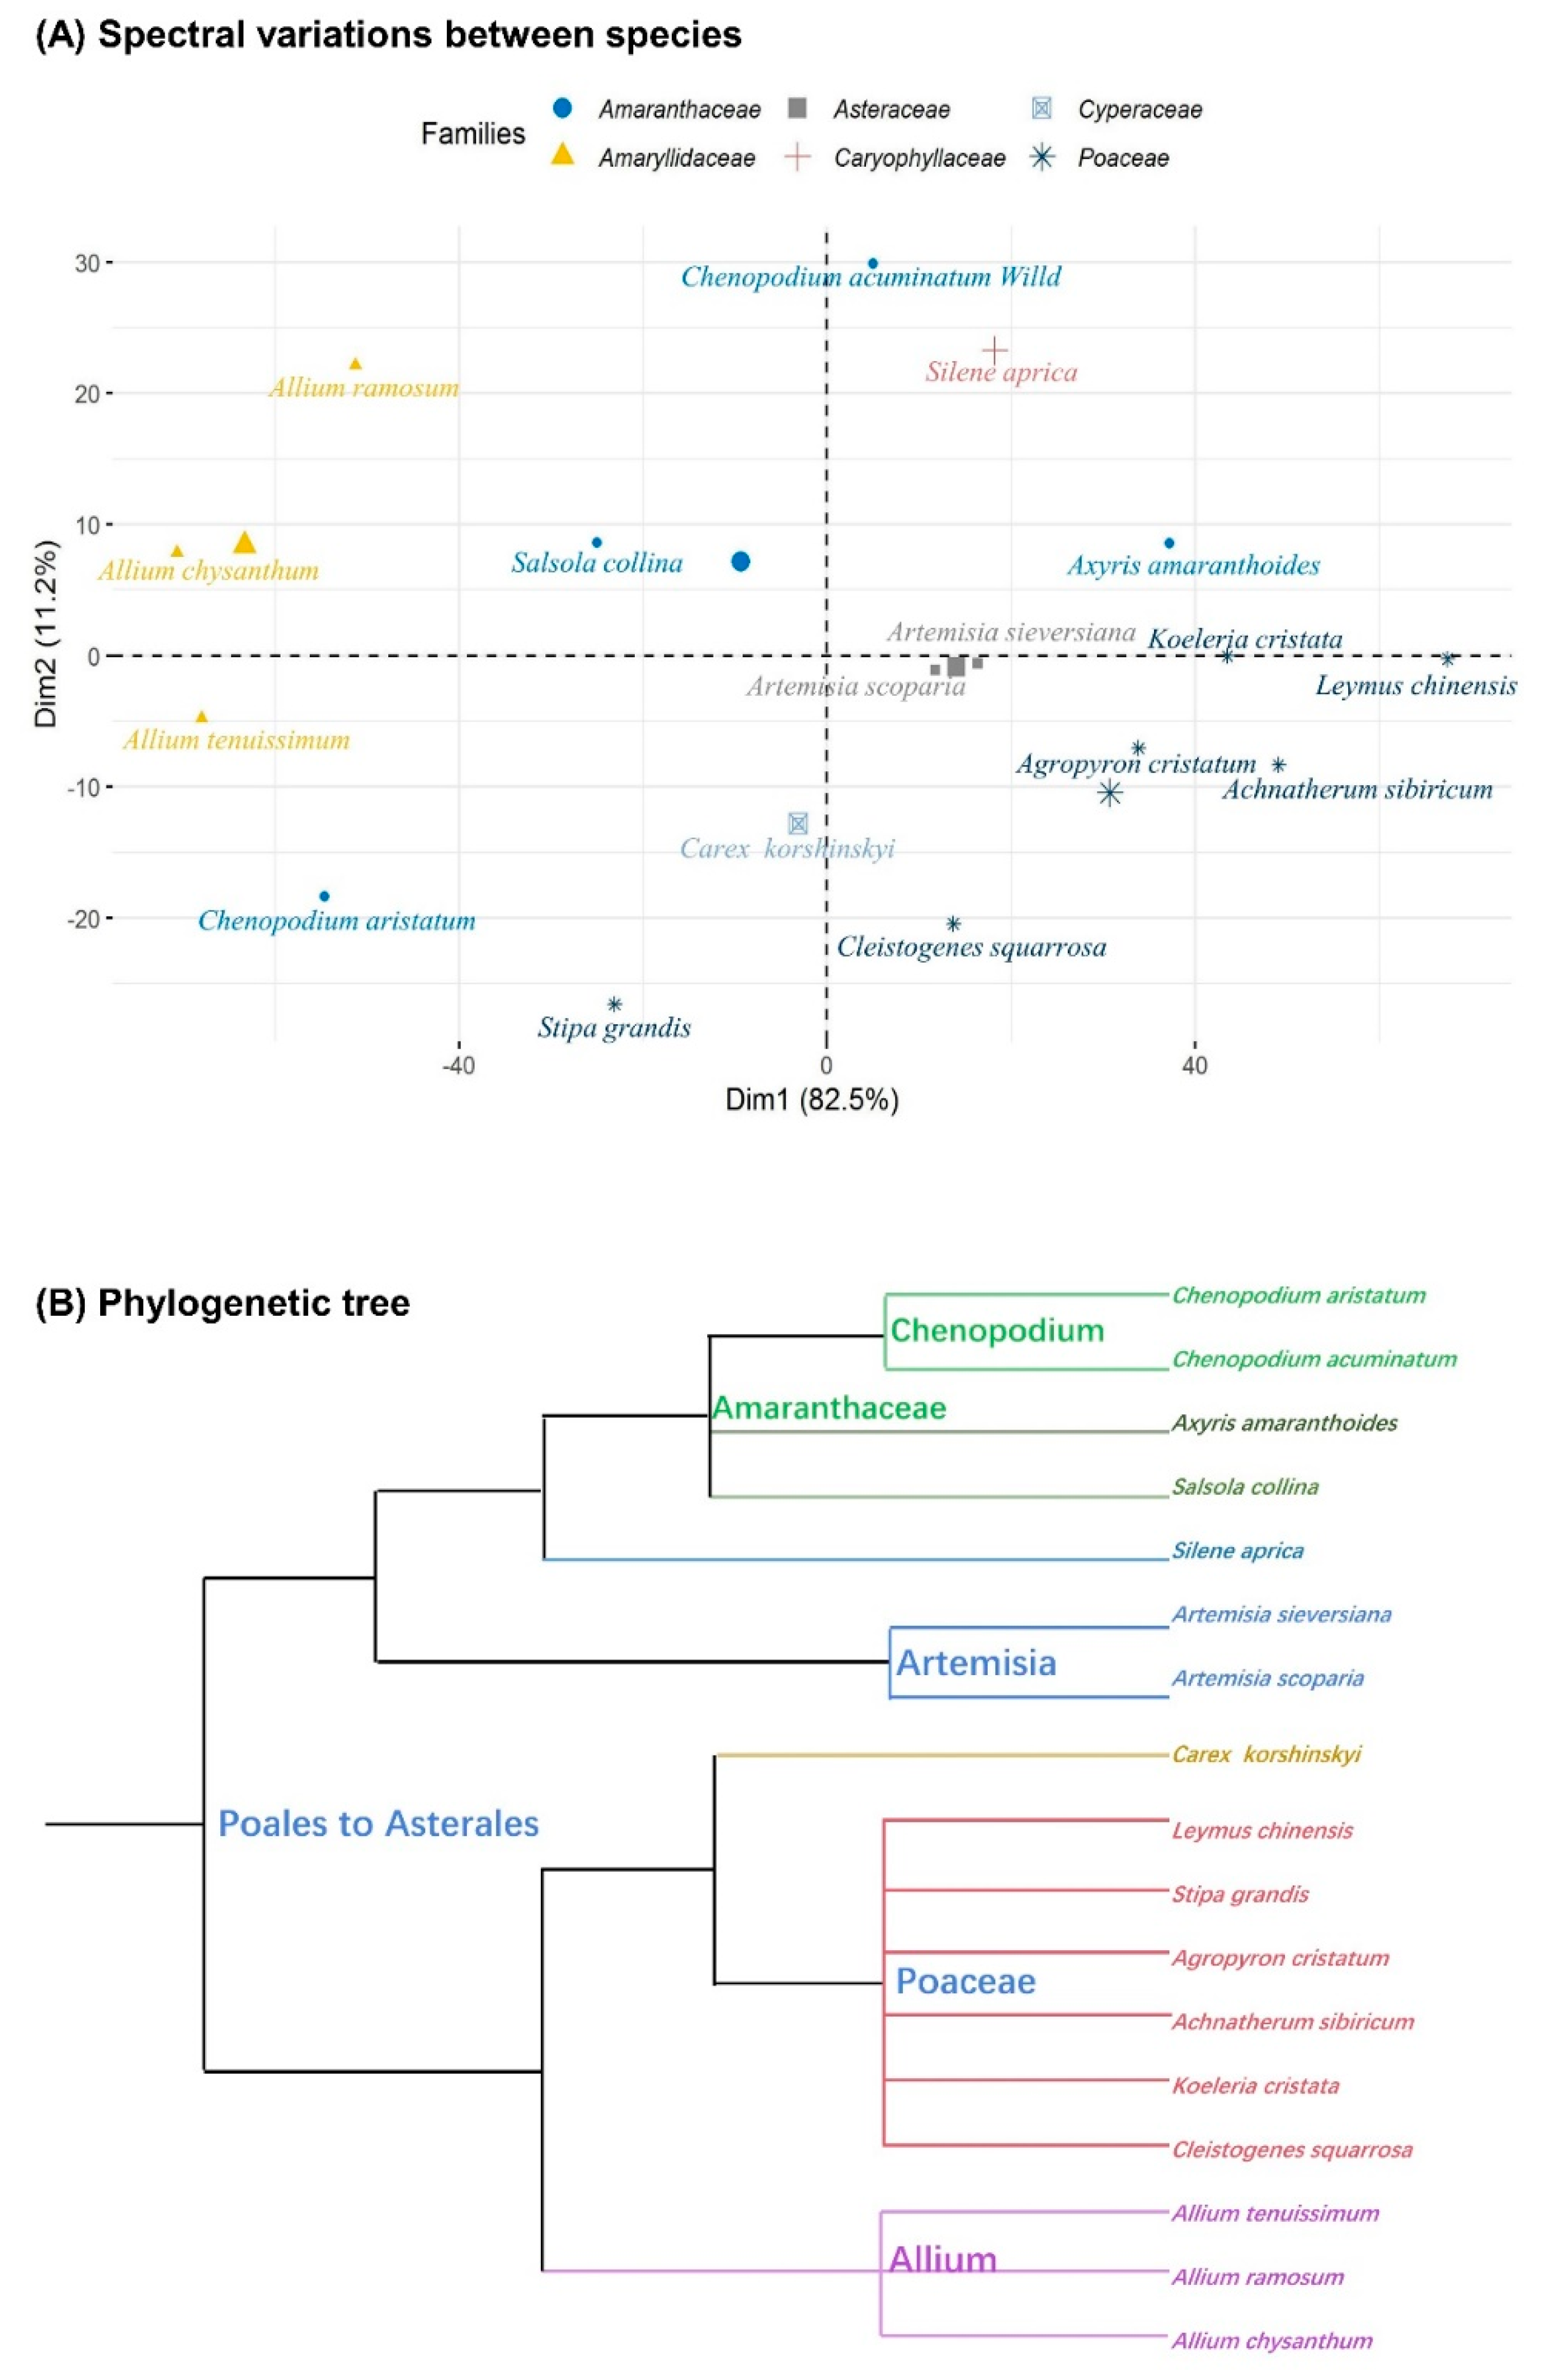
3.1. Spectral Diversity

Figure 2A shows the spectral ranges of all 17 species (green region) and the average coefficient of variation (CV) for each wavelength with different species richness. The spectral diversity increased gradually from the visible (VIR, 400–700 nm) to the near-infrared (NIR, 700–1100 nm) region, and to the short-wave infrared (SWIR, 1100–2400 nm) region. Moreover, the 10 local maxima of the CV (at 483, 541, 660, 767, 979, 1202, 1450, 1881, 2030, and 2366 nm) were closely related to the absorption wavelength of leaf functional traits, e.g., chlorophylls and carotenoids (at 483, 541, 660, and 767 nm), water (at 979, 1202, 1450, and 1881 nm), cellulose and lignin content (at 2030 and 2366 nm). However, the spectral diversity approach was limited by spectral convergence when the species richness exceeded about 14. Both the PCA and hierarchical cluster analysis further showed that species with similar spectral signatures were generally sorted into the same group, i.e., spectral species (Figure 2B). The cluster species mostly belonged to the same family or genus, which was highly close to the phylogenetic tree (Figure 3).

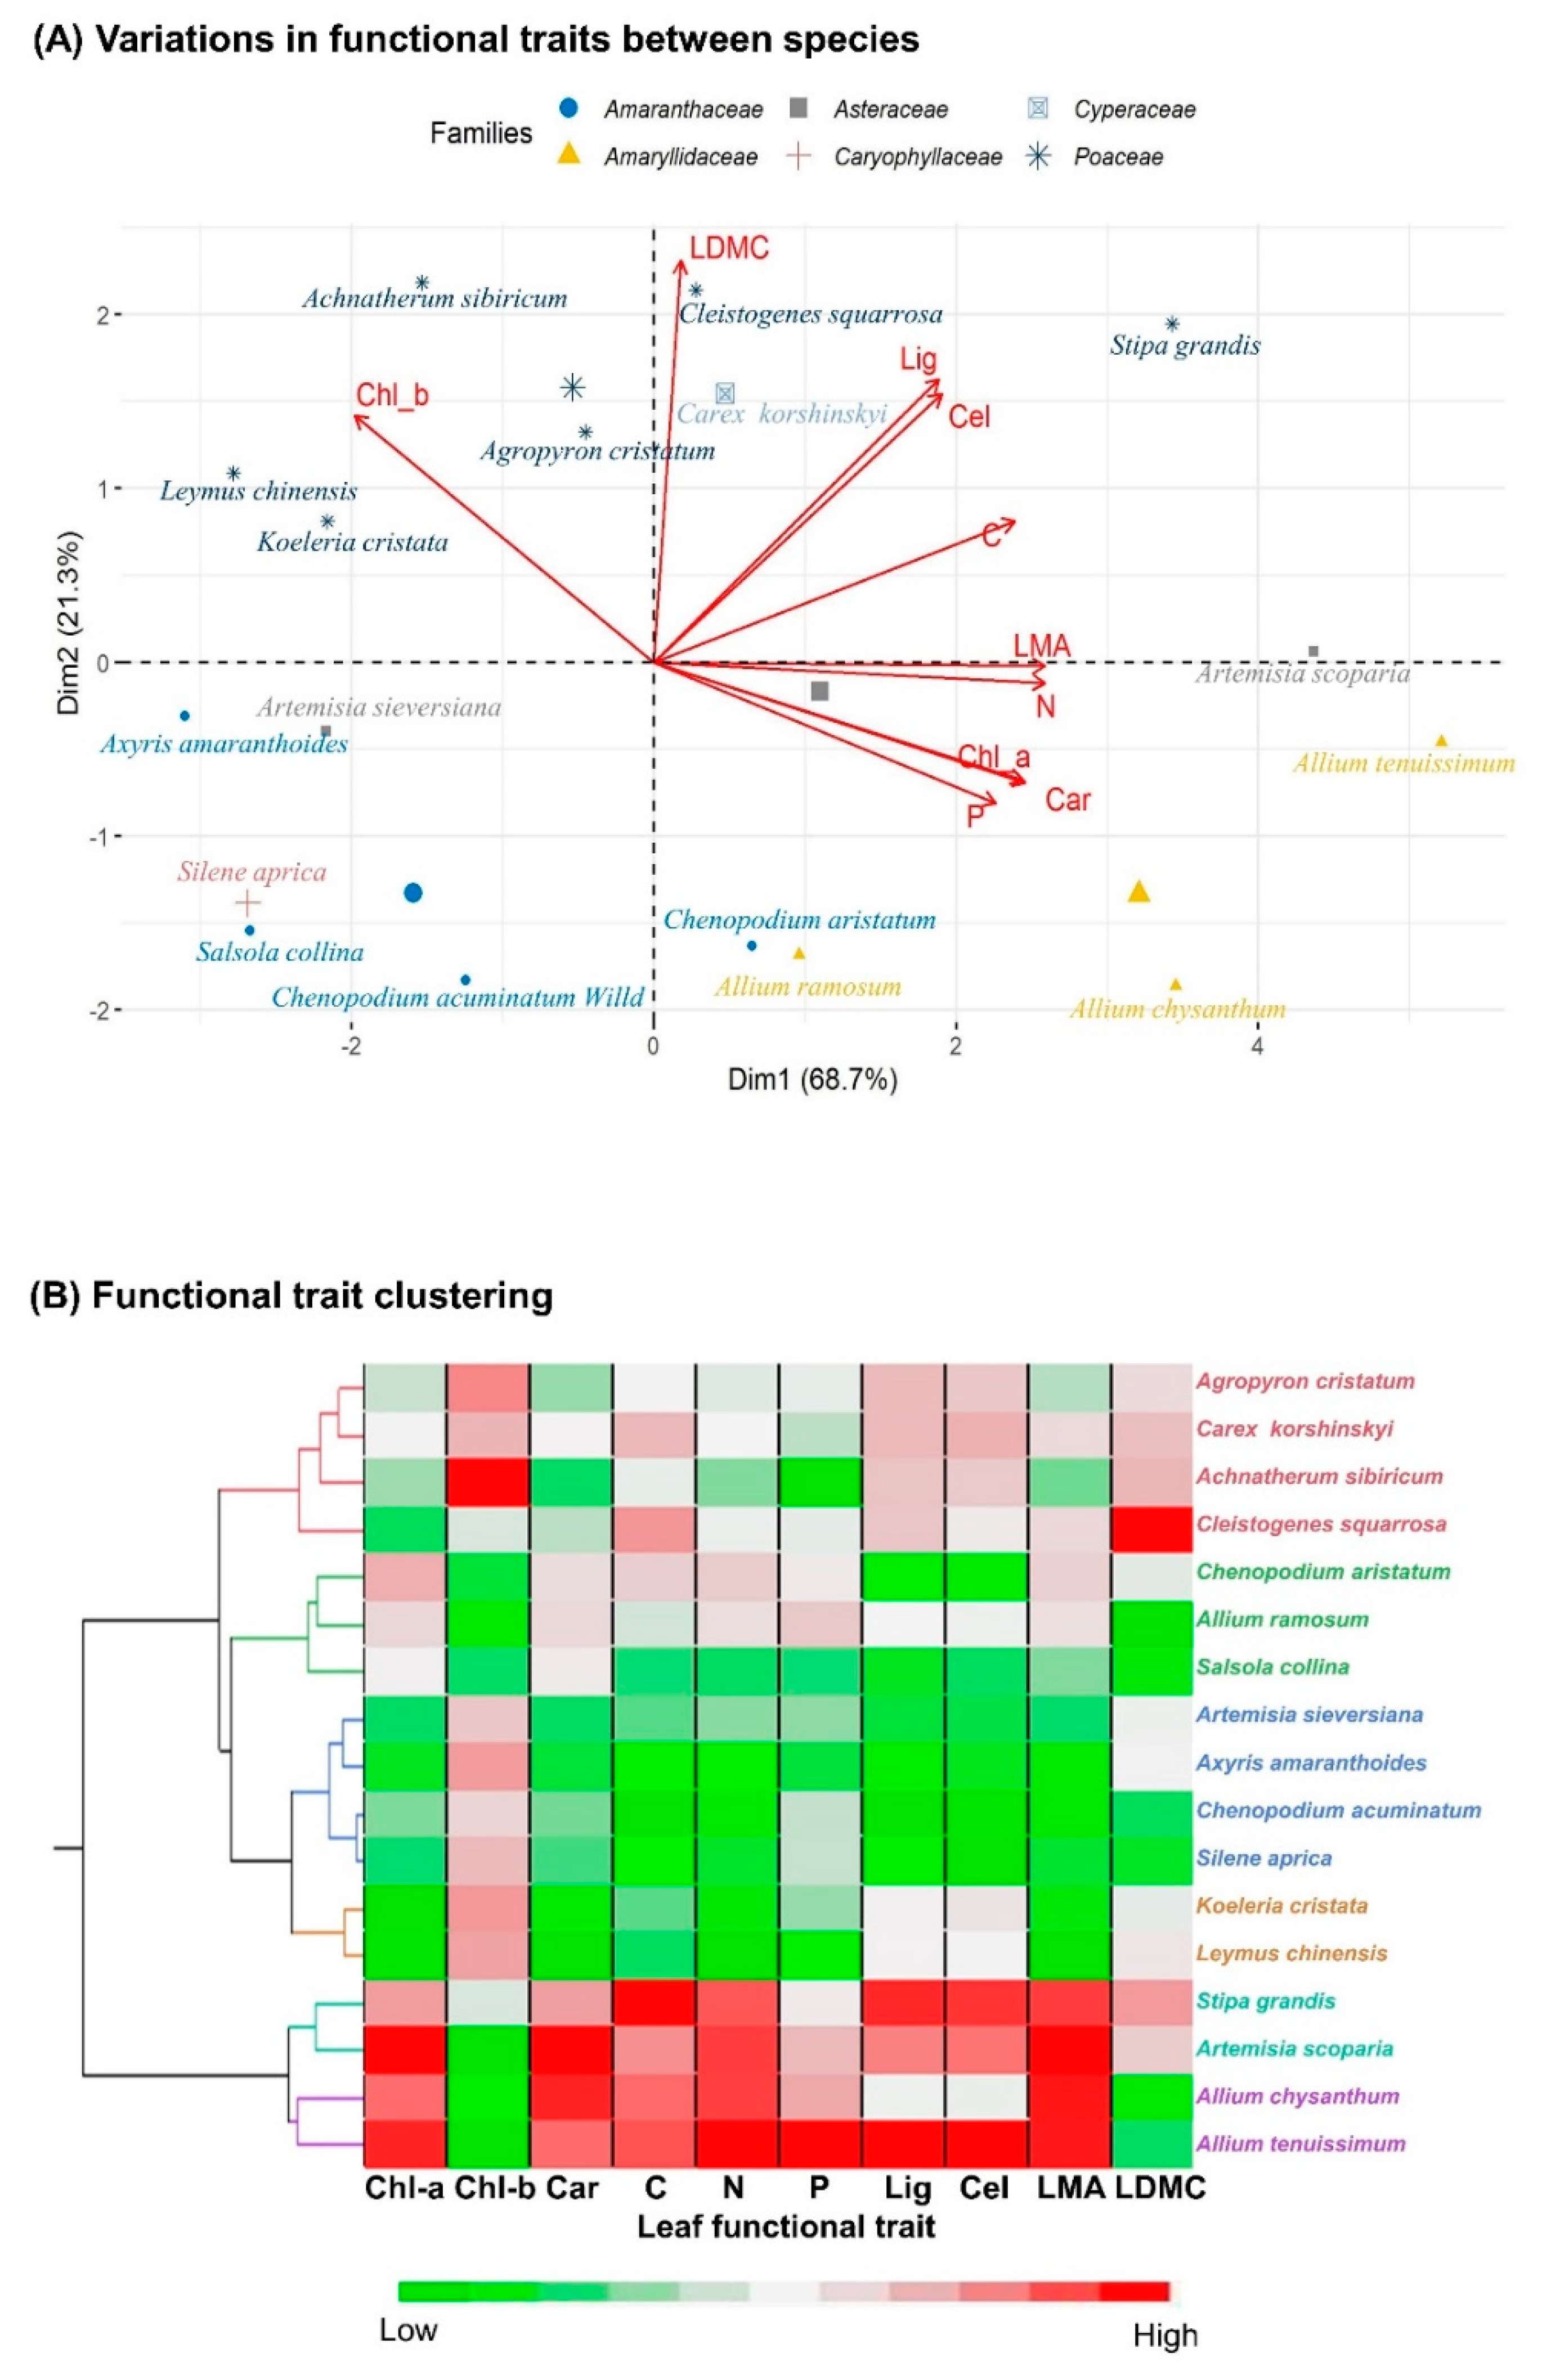
3.2. Functional Trait Diversity

The results of the PCA indicate that different species harbored different trait combinations (Figure 4A, Figure S2), yet the large intraspecific variation in the functional traits of some species confounded the functional trait diversity–biodiversity relationship here (Figure S3). In parallel with spectral diversity, species with similar functional trait combinations were mostly clustered in the same genera or families (Figure 4A), which was identical to the spectral-based PCA analysis. The clustering analysis also showed a similar result (Figure 4B). However, the functional trait-based clustering result was slightly inferior to the spectral clusters compared to the phylogenetic tree.
The Monte-Carlo simulation results show that the functional trait and spectral diversity increased in a nonlinear manner with increasing species diversity, finally tending to saturation (Figure 5). The saturation point of functional trait diversity or spectral diversity can be regarded as the maximum species richness recognized by the variations in the different numbers of combinations of functional traits or spectral bands. The more functional traits involved, the greater the functional trait diversity, but with a smaller contribution for distinguishing species (Figure 5). As expected, the spectral differences between species were greater than the differences of all the different numbers of combinations of functional traits, because of the greater number of leaf biochemical and structural properties involved in the spectral information.

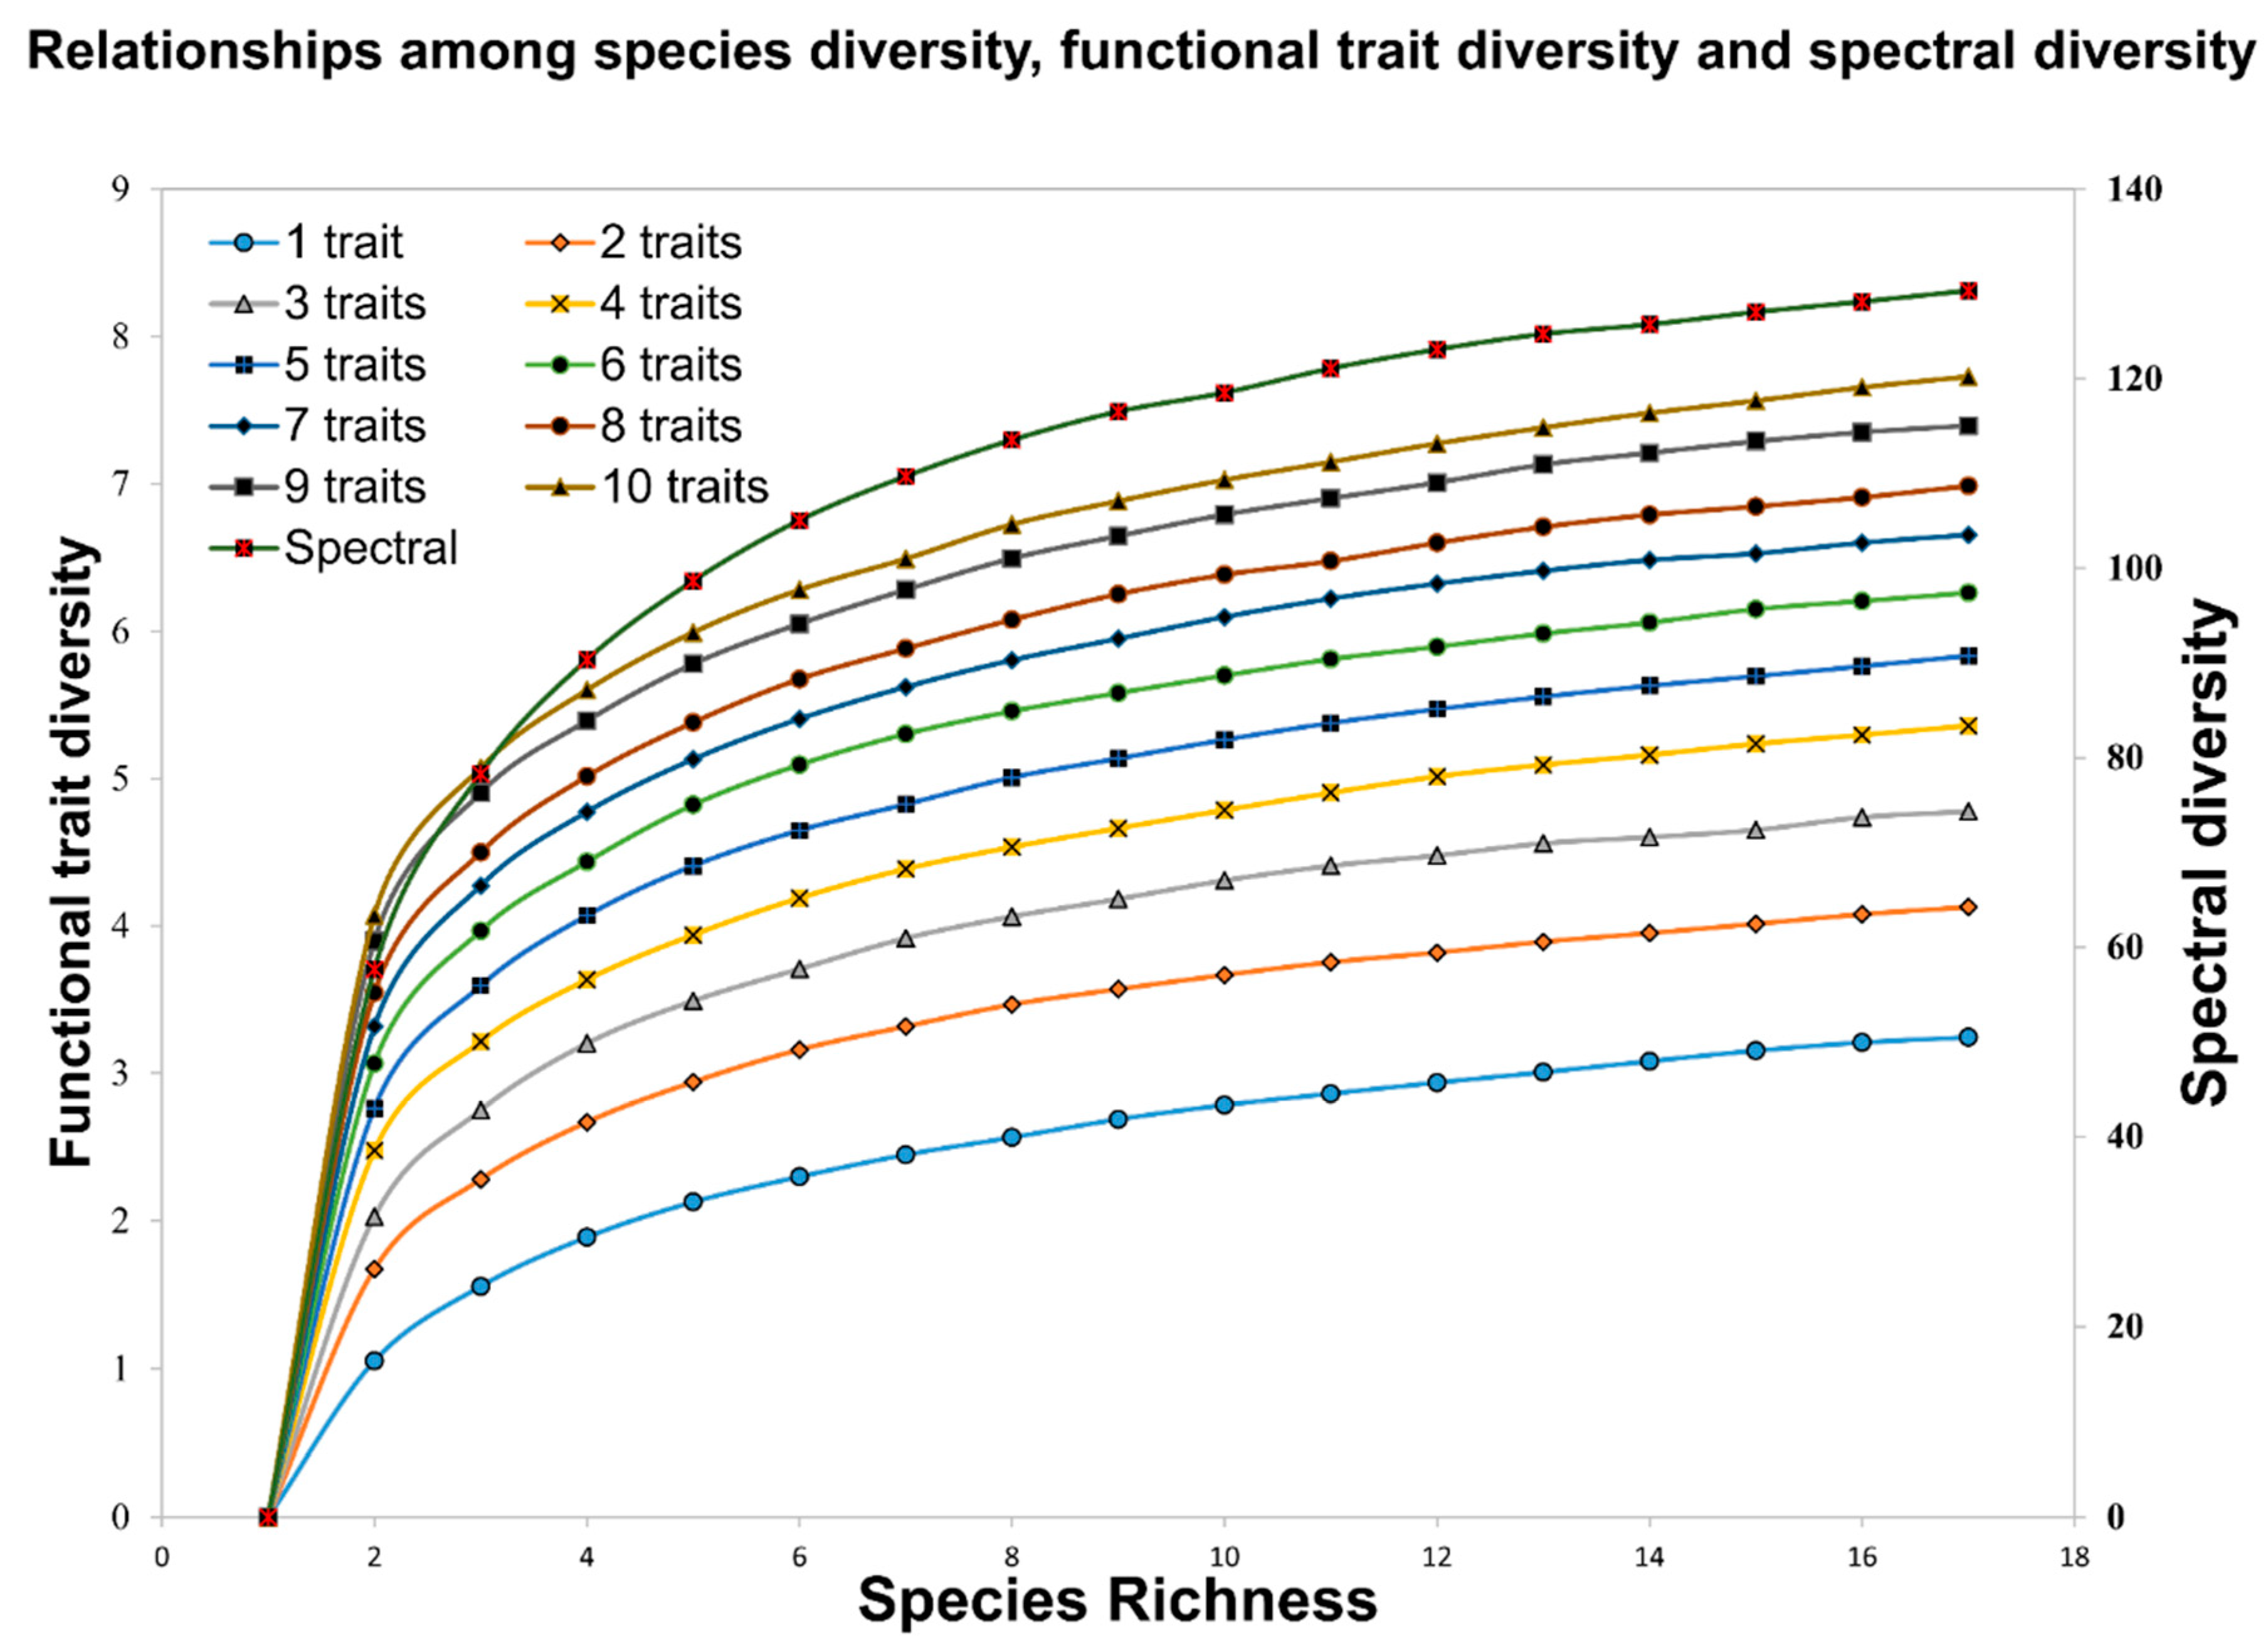
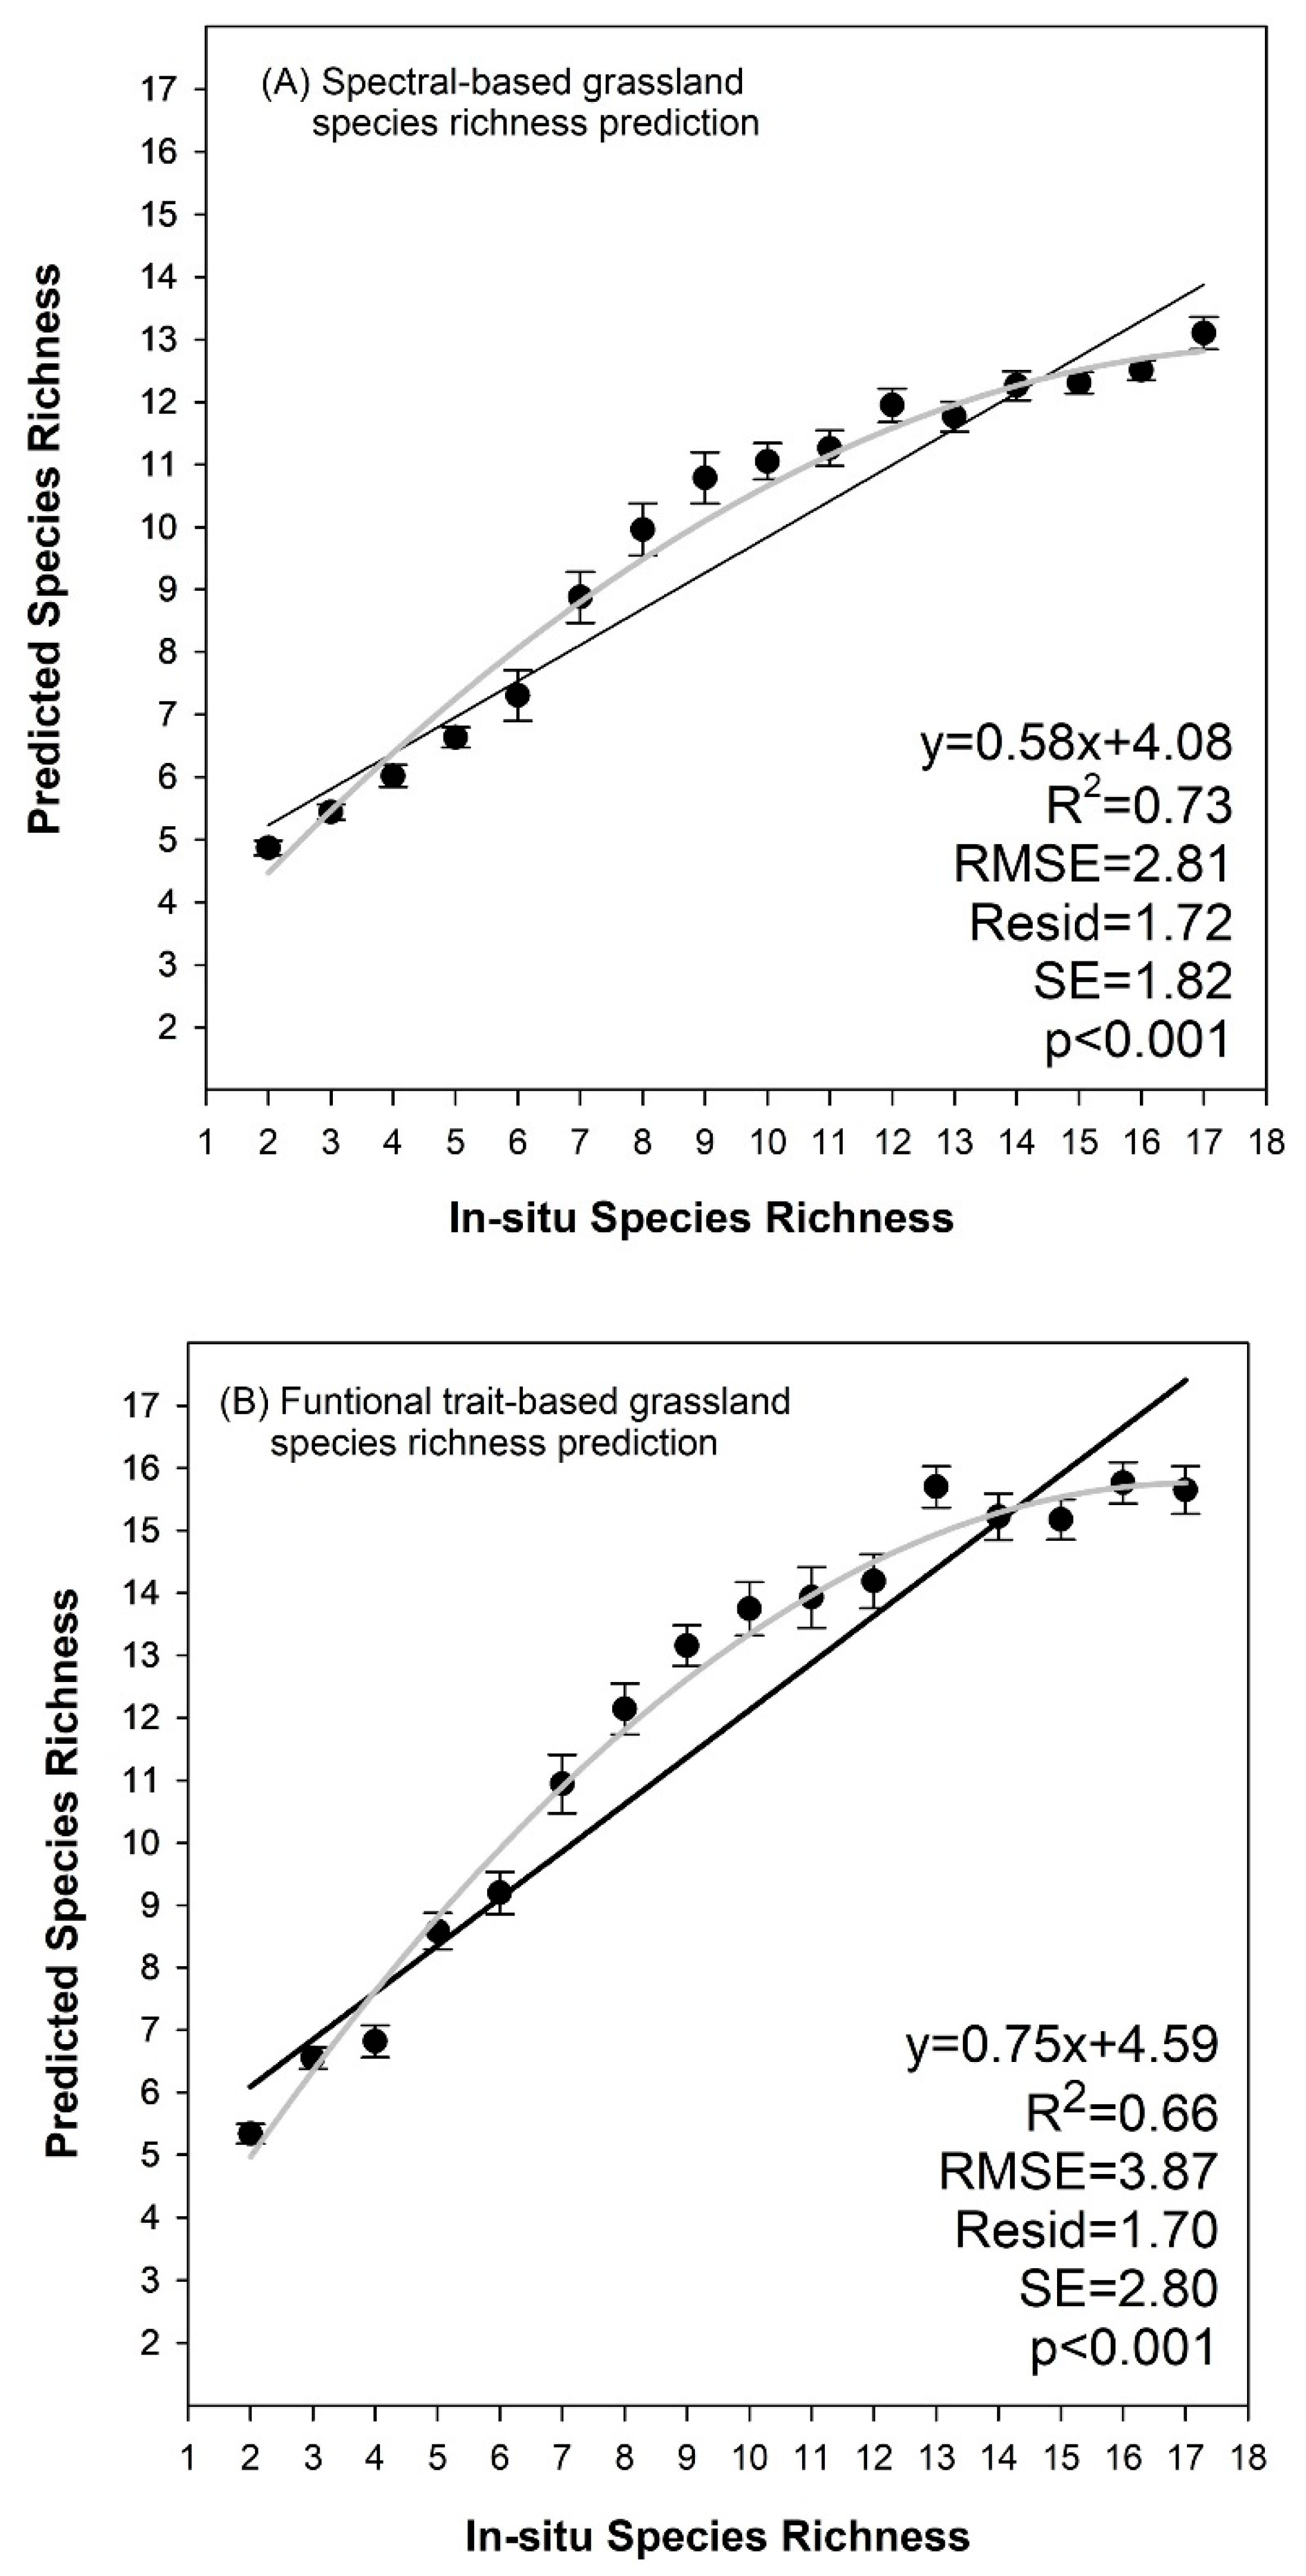
3.3. Species Richness Prediction Based on Cluster Algorithms

The results of the prediction of grassland plant species richness (Figure 6) show that species richness can be accurately predicted using hyperspectral data (R2 = 0.73, p < 0.001) and functional traits (R2 = 0.66, p < 0.001). Moreover, the former slightly outperformed the latter. However, similarly to the Monte-Carlo simulation results (Figure 5), the predicted richness tended towards saturation when the in situ species richness exceeded about 14. Moreover, low species richness was easily overestimated, whereas high species richness was easily underestimated.

4. Discussion

4.1. Spectral Diversity

Our study, conducted in a semi-arid grassland monoculture experimental site, indicated that the different grassland plant species harbored different functional traits or trait combinations (functional trait diversity), resulting in variations in spectral patterns (spectral diversity). Moreover, the spectral diversity of grassland plant species increased gradually from the visible region to the near-infrared region and to the short-wave infrared region. The local maxima of spectral diversity were mostly concentrated in the absorption wavelengths of specific functional traits, e.g., chlorophylls, carotenoids, water, cellulose, and lignin. However, previous studies of a prairie BioDIV experiment, conducted at Cedar Creek Ecosystem Science Reserve in the USA [13,34], indicated that the contribution of visible regions (~427–700 nm) was relatively greater than that of the near-infrared (NIR, ~700–914 nm) region. This may be because the proximal canopy spectra or biomass-weighted leaf spectra, with different levels of diversity at natural plots, involved the canopy structural information, further concealing the real spectral dissimilarity among species caused by leaf structure, especially in the NIR region.
Our study showed that the spectral dissimilarity between species exceeded the differences of all the functional trait combinations. The spectral differences between species not only captured the functional differences in physiological functional traits, but also captured morphological functional traits that influenced the spectral reflectance. The increase in functional differences further increases the spectral dissimilarity. Spectral diversity shows great potential for assessing biodiversity or functional diversity that involves intraspecific and interspecific trait variations, even in the absence of phylogenetic, functional trait, or abundance information [34].
Notably, our simulation results also show that spectral diversity may be limited by spectral convergence when the species richness exceeds a certain number (e.g., 14), such as in forest ecosystems [44,45], because the spectral features of the same genera or families are often similar. Furthermore, spectral convergence resulted in underestimations in cases of a high species richness, whereas overestimations in cases of a low species richness may have been a result of large intraspecific spectral variations. Significantly, the grassland plant species richness prediction in our study did not take into account the effects of soil background and complex species distribution patterns or environmental context.
In addition, the spectral diversity–grassland plant diversity relationship can be affected by both spatial and spectral resolution or spectral range [14]. First, the spectral diversity may be scale-dependent [27]. Fine-scale exploration in a prairie ecosystem experiment indicated that the optimal spatial resolution for describing spectral diversity was about the size of a leaf or of a single canopy [14]. Furthermore, the high spectral resolution or spectral range succeeded in detecting more spectral variability among species, especially for the absorption wavelengths of specific biochemical or physiological traits. In our study, the UAV-based imaging spectrometer supported observations on a sufficiently fine scale of 30 cm, providing the possibility of direct grassland plant diversity monitoring. Several field experiments have explored the direct monitoring of grassland plant species diversity based mainly on spectral diversity using a field spectrometer and proximal or airborne imaging spectroscopy over prairie grasslands and lowland native grassland communities in the USA, Canada, and the Tasmanian Midlands in Australia [13,14,27,34,52,53]. In addition, more attention should be paid to multi-temporal variations in spectral space, which will help to improve spectral diversity and the resulting prediction accuracy of grass plant species diversity [12].

4.2. Funtional Trait Diversity

Different types of plants or plant functional types (PFTs) may harbor different leaf traits, canopy structures, growth density, and ecological niches, leading to different spectral and texture patterns [28,29,30,31]. Functional trait-based species diversity monitoring frequently assumes that interspecific trait variations generally exceed intraspecific trait variations [54]. However, intraspecific variation in functional traits for some species can be sufficiently large as a result of different climatic, topographic, and edaphic conditions influencing the true prediction of grassland plant diversity [14,55]. Similar to spectral clustering, our study further demonstrates that different grass plant species occupy different functional trait combinations, but are mostly grouped into the same genera, families, or PFTs. Consequently, the PFT-based method has been applied globally by collapsing all the interesting trait variations of a PFT into a single average value [56,57,58,59]. In addition, compared to the prediction of species richness using the full spectra of the hyperspectral images, the functional trait-based prediction accuracy is slightly reduced by only about 6% as shown in our study, whereas its calculation speed would be faster, which may be more suitable for satellite-based multi-spectral grassland plant species diversity mapping.
Trait-based methods have increasingly been used in theoretical and applied biodiversity research. To date, ecologists have identified hundreds of plant traits, and built the largest global open source database (the TRY database; www.try-db.org), including approximately 12 million trait records, covering 280,000 species, since its foundation in 2007. However, owing to the temporal and spatial limitations of in situ measurements, as well as the cost expenditure, the key functional traits have only been measured in 2% of globally known vascular plant species [7], and most of these data tend to be easily measurable without taxonomic information. The regional and even global mapping of these key functional traits using remote sensing could complement or aid in filling the gaps and upscaling the field-measured data [60]. The commonly used physiological traits—for example, pigment, LMA, N, water, lignin, and cellulose—have been successfully retrieved from the leaf or canopy spectra based on the vegetation index, statistical method, and physical model (e.g., radiative transfer models, RTMs) [7,44,45]. Focusing on three key foliar traits related to photosynthesis and respiration, SLA, leaf N, and P, a global trait map with a 0.5° spatial resolution was generated based on the TRY database and Bayesian modelling [61]. Global remote sensing mapping of these leaf traits with additional leaf dry matter content (LDMC) was then successfully performed at a higher spatial resolution (500 m) using the combination of MODIS/Landsat and climate data [62]. In this study, 10 key foliar physiological traits (Chl_b, Car, LMA, LDMC, C, N, P, Cel, and Lig), related to photosynthesis, respiration, defense, and ecosystem productivity, were successfully mapped with a high spatial resolution (30 cm). This would be conducive in linking inter- and intra-specific trait variations to functional diversity, directly delivering biodiversity to ecosystem functions and services [34,63].
Recently, functional diversity measurements have moved from taxonomy-based classifications of functional groups to taxonomy-independent multivariate functional diversity (FD) indices, such as functional richness (FRic), functional divergence (FDiv), and functional evenness (FEve) [64]. These indices have been spatially estimated using the pixel-based method based on remotely sensed functional traits or specific vegetation indices in forest ecosystems [9]. Considering intraspecific trait variations, as shown in our study, it may be more accurate to calculate functional diversity by clustering individual species or PFTs in advance for high spatial resolution on the leaf or individual canopy scale. The good relationship between leaf or canopy spectra and functional traits also promotes the direct spectral prediction of functional diversity using PLSR methods [65]. More importantly, the degree of explanation of the functional diversity of the ecosystem in relation to the consequences of biodiversity depends largely on the functional traits included. The functional traits involved in the calculation of functional diversity can consider both the ecological meaning (e.g., survival strategies and ecosystem processes or functioning) and the accuracy of remotely sensed retrieval, which may reflect the quantified content of functional traits or the corresponding vegetation indices and feature bands as surrogates [7,9]. The ‘worldwide leaf economics spectrum’ indicates that the functional convergence of 2548 worldwide species could be associated with six physiological and structural traits [38]. Global studies suggest the coordination of only six viable functional trait combinations related to growth, survival, and reproduction, as a trade off with the major worldwide variation in plant form and function [66]. However, trait-based methods should consider which and how many traits are optimal to mirror the major variations in ecological strategy or functions for different numbers of species and composition types in various environmental gradients.

4.3. Future Outlook

In this study, we explored the relationships among species diversity, spectral diversity, and functional trait diversity (or biochemical diversity) using in situ spectral monitoring and trait measurements. As the technological development of high-resolution airborne-based imaging spectroscopy or space-borne multispectral images (e.g., worldview 3/4) supports the identification of small individual plants [67,68], direct species or diversity mapping and functional diversity mapping in grassland will be possible in the near future. Some supervised and unsupervised classification methods used in forest ecosystems, such as artificial intelligence (machine- or deep-learning) algorithms, could be used for species discrimination in grasslands based on SVH, or by directly estimating species diversity with the fusion of fine-grained image textures and spectral information. Cluster-based algorithms (e.g., k-means clustering) could also be used to distinguish the functional classes or groups, or to directly predict functional diversity (e.g., FRic, FEve, and FDiv) based on functional traits determined by remote sensing. However, high-resolution satellites often sacrifice high temporal resolution, making it difficult to monitor changes in global biodiversity because of the effects of cloud coverage. Fortunately, ecological studies have proposed some well-documented hypotheses or EBVs, such as the habit amount hypothesis, habitat heterogeneity hypothesis, species-area relationship hypothesis, productivity hypothesis, and environmental parameters [16,69,70,71,72,73]. The progress of satellite remote sensing and modeling methods will further improve the monitoring accuracy of habitat quality, temperature, water, or energy variables, which will help to achieve large-scale and multi-temporal diversity monitoring. Since 1990, biodiversity-ecosystem functioning (BEF) relationships have been an ecological issue of increasingly global concern [74,75]. Positive and saturated relationships of biodiversity and ecosystem productivity have been reported on different time and space scales [76,77,78]. Furthermore, remotely sensed spectral diversity and single- and multi-trait functional diversity can be critical indicators of ecosystem productivity [34,63]. Consequently, multi-scale modeling approaches would be feasible to up-scale in situ or UAV-based biodiversity measurements to a regional or global scale by combining these ecological knowledge and Earth observations (e.g., satellite or airborne imagery) [79].

5. Conclusions

Here, we examined the links among spectral diversity, functional trait diversity, and species diversity based on a semi-arid grassland monoculture experimental site, facilitating an in-depth integration of ecological knowledge and remote sensing principles. We found that different grassland plant species harbored different functional trait combinations (functional trait diversity), and the involvement of more functional traits could increase the functional trait diversity, but with a smaller contribution because of functional convergence. Our leaf-spectra-based analysis also indicated that the spectral diversity of grassland plant species increased gradually from the visible region to the near-infrared region and to the short-wave infrared region. The Monte-Carlo simulation results also showed that as the species richness increased, the leaf functional trait diversity and spectral diversity increased nonlinearly but with a smaller contribution for distinguishing species. Upscaled to the UAV-based canopy scale, grassland plant diversity can be directly predicted based on spectral diversity and functional trait diversity, calculated via remotely sensed functional traits, especially those with a species richness of less than 14. Our findings will provide a necessary reference for the spatially continuous mapping of grassland biodiversity from a proximal or UAV platform with accurate field measurements in natural grassland communities. This will advance our understanding of the effects of biodiversity on ecosystem functioning over different spatial scales and support science-driven biodiversity conservation and ecosystem management.

Supplementary Materials

The following are available online at https://0-www-mdpi-com.brum.beds.ac.uk/article/10.3390/rs13153034/s1. Table S1: Plant species in the grassland monoculture platform; Figure S1: The average leaf reflectance of the 17 species included in the study; Figure S2: The 10 normalized functional traits of the 17 species included in the study; Figure S3: Multivariate leaf functional trait covariation of 17 different species based on 0.3 m × 0.3 m pixels.

Author Contributions

Conceptualization, Y.Z. (Yujin Zhao) and Y.B.; methodology, Y.Z. (Yujin Zhao); writing—original draft preparation, Y.Z. (Yujin Zhao); analysis, Y.Z. (Yujin Zhao); investigation, Y.S., Y.Z. (Yanping Zhao) and X.L.; writing—review and editing, Y.B; visualization, Y.Z. (Yujin Zhao) and W.C.; funding acquisition, Y.B. and Y.Z. (Yujin Zhao); supervision, Y.B. All authors have read and agreed to the published version of the manuscript.

Funding

This research was supported by grants from the Strategic Priority Research Program of the Chinese Academy of Sciences (XDA23080303) and National Natural Science Foundation of China (41801230).

Institutional Review Board Statement

Not applicable.

Informed Consent Statement

Not applicable.

Acknowledgments

We appreciate the anonymous reviewers for constructive comments on our manuscript.

Conflicts of Interest

The authors declare no conflict of interest.

References

  1. White, R.P.; Murray, S.; Rohweder, M. Pilot Analysis of Global Ecosystems: Grassland Ecosystems; World Resources Institute: Washington, DC, USA, 2000; p. 275. [Google Scholar]
  2. Bai, Y.; Wu, J.; Pan, Q.; Huang, J.; Wang, Q.; Li, F.; Buyantuyev, A.; Han, X. Positive linear relationship between productivity and diversity: Evidence from the Eurasian Steppe. J. Appl. Ecol. 2007, 44, 1023–1034. [Google Scholar] [CrossRef]
  3. Clark, C.M.; Tilman, D. Loss of plant species after chronic low-level nitrogen deposition to prairie grasslands. Nature 2008, 451, 712–715. [Google Scholar] [CrossRef]
  4. Pereira, H.M.; Ferrier, S.; Walters, M.; Geller, G.N.; Jongman, R.H.G.; Scholes, R.J.; Bruford, M.W.; Brummitt, N.; Butchart, S.H.M.; Cardoso, A.C.; et al. Essential Biodiversity Variables. Science 2013, 339, 277–278. [Google Scholar] [CrossRef] [Green Version]
  5. Turner, W. Sensing biodiversity. Science 2014, 346, 301–302. [Google Scholar] [CrossRef]
  6. Skidmore, A.; Pettorelli, N.; Coops, N.C.; Geller, G.N.; Hansen, M.; Lucas, R.; Mucher, S.; O’Connor, B.; Paganini, M.; Pereira, H.; et al. Environmental science: Agree on biodiversity metrics to track from space. Nat. News 2015, 523, 403–405. [Google Scholar] [CrossRef] [PubMed] [Green Version]
  7. Jetz, W.; Cavender-Bares, J.; Pavlick, R.; Schimel, D.; Davis, F.; Asner, G.P.; Guralnick, R.; Kattge, J.; Latimer, A.; Moorcroft, P.; et al. Monitoring plant functional diversity from space. Nat. Plants 2016, 2, 16024. [Google Scholar] [CrossRef] [PubMed] [Green Version]
  8. Turner, W.; Spector, S.; Gardiner, N.; Fladeland, M.; Sterling, E.; Steininger, M. Remote sensing for biodiversity science and conservation. Trends Ecol. Evol. 2003, 18, 306–314. [Google Scholar] [CrossRef]
  9. Schneider, F.D.; Morsdorf, F.; Schmid, B.; Petchey, O.L.; Hueni, A.; Schimel, D.S.; Schaepman, M.E. Mapping functional diversity from remotely sensed morphological and physiological forest traits. Nat. Commun. 2017, 8, 1–12. [Google Scholar] [CrossRef] [Green Version]
  10. Zhao, Y.; Zeng, Y.; Zheng, Z.; Dong, W.; Zhao, D.; Wu, B.; Zhao, Q. Forest species diversity mapping using airborne LiDAR and hyperspectral data in a subtropical forest in China. Remote Sens. Environ. 2018, 213, 104–114. [Google Scholar] [CrossRef]
  11. Zheng, Z.; Zeng, Y.; Schneider, F.D.; Zhao, Y.; Zhao, D.; Schmid, B.; Schaepman, M.E.; Morsdorf, F. Mapping functional diversity using individual tree-based morphological and physiological traits in a subtropical forest. Remote Sens. Environ. 2021, 252, 112170. [Google Scholar] [CrossRef]
  12. Gholizadeh, H.; Gamon, J.A.; Helzer, C.J.; Cavender-Bares, J. Multi-temporal assessment of grassland α- and β-diversity using hyperspectral imaging. Ecol. Appl. 2020, 30, 13. [Google Scholar] [CrossRef]
  13. Gholizadeh, H.; Gamon, J.A.; Zygielbaum, A.I.; Wang, R.; Schweiger, A.K.; Cavender-Bares, J. Remote sensing of biodiversity: Soil correction and data dimension reduction methods improve assessment of α-diversity (species richness) in prairie ecosystems. Remote Sens. Environ. 2018, 206, 240–253. [Google Scholar] [CrossRef]
  14. Wang, R.; Gamon, J.A.; Cavender-Bares, J.; Townsend, P.A.; Zygielbaum, A.I. The spatial sensitivity of the spectral diversity–biodiversity relationship: An experimental test in a prairie grassland. Ecol. Appl. 2018, 28, 541–556. [Google Scholar] [CrossRef] [PubMed] [Green Version]
  15. Debinski, D.M.; Kindscher, K.; Jakubauskas, M.E. A remote sensing and GIS-based model of habitats and biodiversity in the Greater Yellowstone Ecosystem. Int. J. Remote Sens. 1999, 20, 3281–3291. [Google Scholar] [CrossRef]
  16. Nagendra, H.; Gadgil, M. Satellite imagery as a tool for monitoring species diversity: An assessment. J. Appl. Ecol. 1999, 36, 388–397. [Google Scholar] [CrossRef]
  17. Liu, L.; Cheng, Z. Mapping C3 and C4 plant functional types using separated solar-induced chlorophyll fluorescence from hyperspectral data. Int. J. Remote Sens. 2011, 32, 9171–9183. [Google Scholar] [CrossRef]
  18. Otunga, C.; Odindi, J.; Mutanga, O.; Adjorlolo, C. Evaluating the potential of the red edge channel for C3 (Festuca spp.) grass discrimination using Sentinel-2 and Rapid Eye satellite image data. Geocarto Int. 2018, 34, 1123–1143. [Google Scholar] [CrossRef]
  19. Shoko, C.; Mutanga, O.; Dube, T. Optimal season for discriminating C3 and C4 grass functional types using multi-date Sentinel 2 data. GIScience Remote Sens. 2019, 57, 127–139. [Google Scholar] [CrossRef]
  20. Ward, D.P.; Kutt, A.S. Rangeland biodiversity assessment using fine scale on-ground survey, time series of remotely sensed ground cover and climate data: An Australian savanna case study. Landsc. Ecol. 2009, 24, 495–507. [Google Scholar] [CrossRef]
  21. Alofs, K.M.; González, A.V.; Fowler, N.L. Local native plant diversity responds to habitat loss and fragmentation over different time spans and spatial scales. Plant Ecol. 2014, 215, 1139–1151. [Google Scholar] [CrossRef]
  22. Palmer, M.W.; Earls, P.G.; Hoagland, B.W.; White, P.S.; Wohlgemuth, T. Quantitative tools for perfecting species lists. Environmetrics 2002, 13, 121–137. [Google Scholar] [CrossRef]
  23. Rocchini, D.; Chiarucci, A.; Loiselle, S. Testing the spectral variation hypothesis by using satellite multispectral images. Acta Oecologica 2004, 26, 117–120. [Google Scholar] [CrossRef]
  24. Rocchini, D.; He, K.S.; Oldeland, J.; Wesuls, D.; Neteler, M. Spectral variation versus species β-diversity at different spatial scales: A test in African highland savannas. J. Environ. Monit. 2010, 12, 825–831. [Google Scholar] [CrossRef] [PubMed]
  25. Rocchini, D.; Hernandez-Stefanoni, J.L.; He, K.S. Advancing species diversity estimate by remotely sensed proxies: A conceptual review. Ecol. Informatics 2015, 25, 22–28. [Google Scholar] [CrossRef]
  26. Schmidtlein, S.; Fassnacht, F. The spectral variability hypothesis does not hold across landscapes. Remote Sens. Environ. 2017, 192, 114–125. [Google Scholar] [CrossRef] [Green Version]
  27. Gholizadeh, H.; Gamon, J.A.; Townsend, P.A.; Zygielbaum, A.I.; Helzer, C.J.; Hmimina, G.Y.; Yu, R.; Moore, R.M.; Schweiger, A.K.; Cavender-Bares, J. Detecting prairie biodiversity with airborne remote sensing. Remote Sens. Environ. 2019, 221, 38–49. [Google Scholar] [CrossRef]
  28. Carlson, K.; Asner, G.P.; Hughes, R.F.; Ostertag, R.; Martin, R.E. Hyperspectral Remote Sensing of Canopy Biodiversity in Hawaiian Lowland Rainforests. Ecosystems 2007, 10, 536–549. [Google Scholar] [CrossRef]
  29. Wang, R.; Gamon, J. Remote sensing of terrestrial plant biodiversity. Remote Sens. Environ. 2019, 231, 111218. [Google Scholar] [CrossRef]
  30. Wang, R.; Gamon, J.A.; Emmerton, C.A.; Li, H.; Nestola, E.; Pastorello, G.Z.; Menzer, O. Integrated Analysis of Productivity and Biodiversity in a Southern Alberta Prairie. Remote Sens. 2016, 8, 214. [Google Scholar] [CrossRef] [Green Version]
  31. Dahlin, K.M. Spectral diversity area relationships for assessing biodiversity in a wildland-agriculture matrix. Ecol. Appl. 2016, 26, 2758–2768. [Google Scholar] [CrossRef]
  32. Chang, C.-I. An information-theoretic approach to spectral variability, similarity, and discrimination for hyperspectral image analysis. IEEE Trans. Inf. Theory 2000, 46, 1927–1932. [Google Scholar] [CrossRef] [Green Version]
  33. Kruse, F.; Lefkoff, A.; Boardman, J.; Heidebrecht, K.; Shapiro, A.; Barloon, P.; Goetz, A. The spectral image processing system (SIPS)—interactive visualization and analysis of imaging spectrometer data. Remote Sens. Environ. 1993, 44, 145–163. [Google Scholar] [CrossRef]
  34. Schweiger, A.K.; Cavender-Bares, J.; Townsend, P.A.; Hobbie, S.E.; Madritch, M.D.; Wang, R.; Tilman, D.; Gamon, J.A. Plant spectral diversity integrates functional and phylogenetic components of biodiversity and predicts ecosystem function. Nat. Ecol. Evol. 2018, 2, 976–982. [Google Scholar] [CrossRef]
  35. Ustin, S.L.; Gamon, J. Remote sensing of plant functional types. New Phytol. 2010, 186, 795–816. [Google Scholar] [CrossRef] [PubMed]
  36. Féret, J.-B.; Asner, G. Mapping tropical forest canopy diversity using high-fidelity imaging spectroscopy. Ecol. Appl. 2014, 24, 1289–1296. [Google Scholar] [CrossRef] [PubMed]
  37. Schäfer, E.; Heiskanen, J.; Heikinheimo, V.; Pellikka, P. Mapping tree species diversity of a tropical montane forest by unsupervised clustering of airborne imaging spectroscopy data. Ecol. Indic. 2016, 64, 49–58. [Google Scholar] [CrossRef]
  38. Wright, I.J.; Reich, P.B.; Westoby, M.; Ackerly, D.D.; Baruch, Z.; Bongers, F.; Cavender-Bares, J.; Chapin, T.; Cornelissen, J.H.C.; Diemer, M.; et al. The worldwide leaf economics spectrum. Nature 2004, 428, 821–827. [Google Scholar] [CrossRef]
  39. Wright, I.J.; Reich, P.; Cornelissen, J.H.C.; Falster, D.; Garnier, E.; Hikosaka, K.; Lamont, B.; Lee, W.; Oleksyn, J.; Osada, N.; et al. Assessing the generality of global leaf trait relationships. New Phytol. 2005, 166, 485–496. [Google Scholar] [CrossRef]
  40. Wang, Z.; Townsend, P.A.; Schweiger, A.K.; Couture, J.J.; Singh, A.; Hobbie, S.E.; Cavender-Bares, J. Mapping foliar functional traits and their uncertainties across three years in a grassland experiment. Remote Sens. Environ. 2019, 221, 405–416. [Google Scholar] [CrossRef]
  41. Schweiger, A.K.; Schütz, M.; Risch, A.; Kneubühler, M.; Haller, R.; Schaepman, M. How to predict plant functional types using imaging spectroscopy: Linking vegetation community traits, plant functional types and spectral response. Methods Ecol. Evol. 2017, 8, 86–95. [Google Scholar] [CrossRef]
  42. Asner, G.P.; Martin, R.E.; Knapp, D.E.; Tupayachi, R.; Anderson, C.B.; Sinca, F.; Vaughn, N.R.; Llactayo, W. Airborne laser-guided imaging spectroscopy to map forest trait diversity and guide conservation. Science 2017, 355, 385–389. [Google Scholar] [CrossRef]
  43. Field, C.B. Ecological scaling of carbon gain to stress and resource availability. In Integrated Responses of Plants to Stress; Mooney, H.A., Winner, W.E., Pell, E.J., Eds.; Academic Press: New York, NY, USA, 1991; pp. 35–65. [Google Scholar]
  44. Asner, G.; E Martin, R. Airborne spectranomics: Mapping canopy chemical and taxonomic diversity in tropical forests. Front. Ecol. Environ. 2009, 7, 269–276. [Google Scholar] [CrossRef] [Green Version]
  45. Zhao, Y.; Zeng, Y.; Zhao, D.; Wu, B.; Zhao, Q. The Optimal Leaf Biochemical Selection for Mapping Species Diversity Based on Imaging Spectroscopy. Remote Sens. 2016, 8, 216. [Google Scholar] [CrossRef] [Green Version]
  46. Zhao, Y.; Sun, Y.; Lu, X.; Zhao, X.; Yang, L.; Sun, Z.; Bai, Y. Hyperspectral retrieval of leaf physiological traits and their links to ecosystem productivity in grassland monocultures. Ecol. Indic. 2021, 122, 107267. [Google Scholar] [CrossRef]
  47. Savitzky, A.; Golay, M.J.E. Smoothing and Differentiation of Data by Simplified Least Squares Procedures. Anal. Chem. 1964, 36, 1627–1639. [Google Scholar] [CrossRef]
  48. Talbot, J.M.; Treseder, K. Interactions among lignin, cellulose, and nitrogen drive litter chemistry–decay relationships. Ecology 2012, 93, 345–354. [Google Scholar] [CrossRef] [Green Version]
  49. Aasen, H.; Burkart, A.; Bolten, A.; Bareth, G. Generating 3D hyperspectral information with lightweight UAV snapshot cameras for vegetation monitoring: From camera calibration to quality assurance. ISPRS J. Photogramm. Remote Sens. 2015, 108, 245–259. [Google Scholar] [CrossRef]
  50. Deng, L.; Mao, Z.; Li, X.; Hu, Z.; Duan, F.; Yan, Y. UAV-based multispectral remote sensing for precision agriculture: A comparison between different cameras. ISPRS J. Photogramm. Remote Sens. 2018, 146, 124–136. [Google Scholar] [CrossRef]
  51. Ward, J.H. Hierarchical Grouping to Optimize an Objective Function. J. Am. Stat. Assoc. 1963, 58, 236–244. [Google Scholar] [CrossRef]
  52. Bethany, M.; Arko, L.; Jagannath, A. Assessing the Impact of Spectral Resolution on Classification of Lowland Native Grassland Communities Based on Field Spectroscopy in Tasmania, Australia. Remote Sens. 2018, 10, 308. [Google Scholar]
  53. Melville, B.; Lucieer, A.; Aryal, J. Classification of Lowland Native Grassland Communities Using Hyperspectral Unmanned Aircraft System (UAS) Imagery in the Tasmanian Midlands. Drones 2019, 3, 5. [Google Scholar] [CrossRef] [Green Version]
  54. Violle, C.; Enquist, B.; McGill, B.; Jiang, L.; Albert, C.; Hulshof, C.; Jung, V.; Messier, J. The return of the variance: Intraspecific variability in community ecology. Trends Ecol. Evol. 2012, 27, 244–252. [Google Scholar] [CrossRef] [PubMed]
  55. Roth, K.L.; Roberts, D.A.; Dennison, P.; Alonzo, M.; Peterson, S.H.; Beland, M. Differentiating plant species within and across diverse ecosystems with imaging spectroscopy. Remote Sens. Environ. 2015, 167, 135–151. [Google Scholar] [CrossRef]
  56. Hartley, A.; MacBean, N.; Georgievski, G.; Bontemps, S. Uncertainty in plant functional type distributions and its impact on land surface models. Remote Sens. Environ. 2017, 203, 71–89. [Google Scholar] [CrossRef]
  57. Ibrahim, S.; Balzter, H.; Tansey, K.; Tsutsumida, N.; Mathieu, R. Estimating fractional cover of plant functional types in African savannah from harmonic analysis of MODIS time-series data. Int. J. Remote Sens. 2018, 39, 2718–2745. [Google Scholar] [CrossRef]
  58. Langford, Z.; Kumar, J.; Hoffman, F.M.; Norby, R.J.; Wullschleger, S.D.; Sloan, V.L.; Iversen, C.M. Mapping Arctic Plant Functional Type Distributions in the Barrow Environmental Observatory Using WorldView-2 and LiDAR Datasets. Remote Sens. 2016, 8, 733. [Google Scholar] [CrossRef] [Green Version]
  59. Roth, K.L.; Roberts, D.A.; Dennison, P.E.; Peterson, S.H.; Alonzo, M. The impact of spatial resolution on the classification of plant species and functional types within imaging spectrometer data. Remote Sens. Environ. 2015, 171, 45–57. [Google Scholar] [CrossRef]
  60. Homolová, L.; Malenovský, Z.; Clevers, J.G.; García-Santos, G.; Schaepman, M.E. Review of optical-based remote sensing for plant trait mapping. Ecol. Complex. 2013, 15, 1–16. [Google Scholar] [CrossRef] [Green Version]
  61. Butler, E.E.; Datta, A.; Flores-Moreno, H.; Chen, M.; Wythers, K.R.; Fazayeli, F.; Banerjee, A.; Atkin, O.; Kattge, J.; Amiaud, B.; et al. Mapping local and global variability in plant trait distributions. Proc. Natl. Acad. Sci. USA 2017, 114, E10937–E10946. [Google Scholar] [CrossRef] [Green Version]
  62. Moreno-Martínez, Á.; Camps-Valls, G.; Kattge, J.; Robinson, N.; Reichstein, M.; van Bodegom, P.; Kramer, K.; Cornelissen, J.H.C.; Reich, P.; Bahn, M.; et al. A methodology to derive global maps of leaf traits using remote sensing and climate data. Remote Sens. Environ. 2018, 218, 69–88. [Google Scholar] [CrossRef] [Green Version]
  63. Durán, S.M.; Martin, R.E.; Díaz, S.; Maitner, B.S.; Malhi, Y.; Salinas, N.; Shenkin, A.; Silman, M.R.; Wieczynski, D.J.; Asner, G.P.; et al. Informing trait-based ecology by assessing remotely sensed functional diversity across a broad tropical temperature gradient. Sci. Adv. 2019, 5, eaaw8114. [Google Scholar] [CrossRef] [Green Version]
  64. Villéger, S.; Mason, N.W.H.; Mouillot, D. New multidimensional functional diversity indices for a multifaceted framework in functional ecology. Ecology 2008, 89, 2290–2301. [Google Scholar] [CrossRef] [PubMed] [Green Version]
  65. Laliberté, E.; Legendre, P. A distance-based framework for measuring functional diversity from multiple traits. Ecology 2010, 91, 299–305. [Google Scholar] [CrossRef]
  66. Díaz, S.; Kattge, J.; Cornelissen, J.H.C.; Wright, I.; Lavorel, S.; Dray, S.; Reu, B.; Kleyer, M.; Wirth, C.; Prentice, I.C.; et al. The global spectrum of plant form and function. Nature 2016, 529, 167–171. [Google Scholar] [CrossRef] [PubMed]
  67. Fassnacht, F.; Latifi, H.; Stereńczak, K.; Modzelewska, A.; Lefsky, M.; Waser, L.; Straub, C.; Ghosh, A. Review of studies on tree species classification from remotely sensed data. Remote Sens. Environ. 2016, 186, 64–87. [Google Scholar] [CrossRef]
  68. Dalponte, M.; Bruzzone, L.; Gianelle, D. Tree species classification in the Southern Alps based on the fusion of very high geometrical resolution multispectral/hyperspectral images and LiDAR data. Remote Sens. Environ. 2012, 123, 258–270. [Google Scholar] [CrossRef]
  69. Drakare, S.; Lennon, J.J.; Hillebrand, H. The imprint of the geographical, evolutionary and ecological context on species-area relationships. Ecol. Lett. 2005, 9, 215–227. [Google Scholar] [CrossRef]
  70. Hawkins, B.A.; Field, R.; Cornell, H.V.; Currie, D.J.; Guégan, J.-F.; Kaufman, D.M.; Kerr, J.T.; Mittelbach, G.G.; Oberdorff, T.; O’Brien, E.M.; et al. Energy, water, and broad-scale geographic patterns of species richness. Ecology 2003, 84, 3105–3117. [Google Scholar] [CrossRef] [Green Version]
  71. Kerr, J.T.; Ostrovsky, M. From space to species: Ecological applications for remote sensing. Trends Ecol. Evol. 2003, 18, 299–305. [Google Scholar] [CrossRef]
  72. Tittensor, D.P.; Micheli, F.; Nyström, M.; Worm, B. Human impacts on the species-area relationship in reef fish assemblages. Ecol. Lett. 2007, 10, 760–772. [Google Scholar] [CrossRef]
  73. Watling, J.I.; Arroyo-Rodríguez, V.; Pfeifer, M.; Baeten, L.; Banks-Leite, C.; Cisneros, L.M.; Fang, R.; Hamel-Leigue, A.C.; Lachat, T.; Leal, I.R.; et al. Support for the habitat amount hypothesis from a global synthesis of species density studies. Ecol. Lett. 2020, 23, 674–681. [Google Scholar] [CrossRef] [PubMed]
  74. Iii, F.S.C.; Zavaleta, E.S.; Eviner, V.; Naylor, R.L.; Vitousek, P.M.; Reynolds, H.L.; Hooper, D.U.; Lavorel, S.; Sala, O.E.; Hobbie, S.; et al. Consequences of changing biodiversity. Nature 2000, 405, 234–242. [Google Scholar] [CrossRef]
  75. Tilman, D. Causes, consequences and ethics of biodiversity. Nature 2000, 405, 208–211. [Google Scholar] [CrossRef]
  76. Naeem, S.; Thompson, L.J.; Lawler, S.P.; Lawton, J.H.; Woodfin, R.M. Declining biodiversity can alter the performance of ecosystems. Nature 1994, 368, 734–737. [Google Scholar] [CrossRef]
  77. Tilman, D.; Wedin, D.; Knops, J. Productivity and sustainability influenced by biodiversity in grassland ecosystems. Nature 1996, 379, 718–720. [Google Scholar] [CrossRef]
  78. Cardinale, B. Impacts of Biodiversity Loss. Science 2012, 336, 552–553. [Google Scholar] [CrossRef] [PubMed]
  79. Anderson, C.B. Biodiversity monitoring, earth observations and the ecology of scale. Ecol. Lett. 2018, 21, 1572–1585. [Google Scholar] [CrossRef] [PubMed]
Figure 1. Visual images of species diversity, spectral diversity, and functional trait diversity in a semi-arid grassland monoculture experimental site at the Inner Mongolia Grassland Ecosystem Research Station (IMGERS, 116°42′E, 43°38′N). The false color image and trait composite images were acquired by means of a UHD 185 imaging spectroscopy device and remotely sensed predicted functional traits. LMA denotes leaf mass per area, Chl denotes leaf chlorophyll, and C denotes leaf carbon. A total of 80 monoculture plots were divided into four blocks (dotted lines), in which 20 species were randomly assigned to one plot, respectively.
Remotesensing 13 03034 g001
Figure 2. (A) Spectral profile, average coefficient of variation (CV) curves with different species richness (SR = 2, 4, 6, 8, 10, 12, 14, and 17 species), and local maximum CV. The green region shows the spectral ranges of all 17 species. The average CV curves for different species richness are shown as the legend for each spectral band (n = 2000). (B) Spectral clustering (i.e., spectral species) determined by means of hierarchical cluster analysis.
Remotesensing 13 03034 g002
Figure 3. (A) Spectral variation between species calculated by principal component analysis (PCA). (B) Phylogenetic tree, built based on evolution history using Phylomatic V3.0 (http://phylodiversity.net/phylomatic/, accessed on 7 November 2020) based on 17 grassland plant species in a semi-arid grassland monoculture experimental site at the Inner Mongolia Grassland Ecosystem Research Station (IMGERS, 116°42′E, 43°38′N).
Remotesensing 13 03034 g003
Figure 4. (A) Functional trait diversity (variation) between species calculated by means of principal component analysis (PCA). (B) Functional trait clustering determined by means of hierarchical cluster analysis.
Remotesensing 13 03034 g004
Figure 5. Relationships among species diversity, functional diversity, and spectral diversity determined using Monte-Carlo simulations.
Remotesensing 13 03034 g005
Figure 6. Cluster-based species richness prediction based on the UHD 185 hyperspectral image (A) and the spectral-retrieved functional traits (B), respectively. Black lines denote linear regression fits, black filled circles denote the mean values of predicted species richness, and error bars are ±SE (standard error).
Remotesensing 13 03034 g006
Publisher’s Note: MDPI stays neutral with regard to jurisdictional claims in published maps and institutional affiliations.

