Article

Assessment of Sentinel-2 Images, Support Vector Machines and Change Detection Algorithms for Bark Beetle Outbreaks Mapping in the Tatra Mountains

by
Robert Migas-Mazur
1,
Marlena Kycko
1,*,
Tomasz Zwijacz-Kozica
2 and
Bogdan Zagajewski
1
1
Department of Geoinformatics Cartography and Remote Sensing, Faculty of Geography and Regional Studies, University of Warsaw, 00-927 Warszawa, Poland
2
Tatra National Park, Kuźnice 1, 34-500 Zakopane, Poland
*
Author to whom correspondence should be addressed.
Remote Sens. 2021, 13(16), 3314; https://0-doi-org.brum.beds.ac.uk/10.3390/rs13163314
Submission received: 15 July 2021 / Revised: 18 August 2021 / Accepted: 20 August 2021 / Published: 21 August 2021
(This article belongs to the Special Issue Remote Sensing for Mountain Ecosystems)

Abstract

:
Cambiophagous insects, fires and windthrow cause significant forest disturbances, generating ecological changes and economical losses. The bark beetle (Ips typographus L.), inhabiting coniferous forests and eliminating weakened trees, plays a key role in posing a threat to tree stands, which are dominated by Norway spruce (Picea abies) and covers a large part of mountain areas, as well as the lowlands of Northern, Central and Eastern Europe. Due to the dynamics of the phenomena taking place, the EU recommends constant monitoring of forests in terms of large-area disturbances and factors affecting tree stands’ susceptibility to destruction. The right tools for this are multispectral satellite images, which regularly and free of charge provide up-to-date information on changes in the environment. The aim of this study was to develop a method of identifying disturbances of spruce stands, including the identification of bark beetle outbreaks. Sentinel 2 images from 2015–2018 were used for this purpose; the reference data were high-resolution aerial images, satellite WorldView 2, as well as field verification data. Support Vector Machines (SVM) distinguished six classes: deciduous forests, coniferous forests, grasslands, rocks, snags (dieback of standing trees) and cuts/windthrow. Remote sensing vegetation indices, Multivariate Alteration Detection (MAD), Multivariate Alteration Detection/Maximum Autocorrelation Factor (MAD/MAF), iteratively re-weighted Multivariate Alteration Detection (iMAD) and trained SVM signatures from another year, stacked band rasters allowed us to identify: (1) no changes; (2) dieback of standing trees; (3) logging or falling down of trees. The overall accuracy of the SVM classification oscillated between 97–99%; it was observed that in 2015–2018, as a result of the windthrow and bark beetle outbreaks and the consequences of those natural disturbances (e.g., sanitary cuts), approximately 62.5 km2 of coniferous stands (29%) died in the studied area of the Tatra Mountains.

Graphical Abstract

1. Introduction

Due to the rapid growth of biomass and low requirements of a habitat, Norway spruce (Picea abies) has played a leading role in forestry in the European mountain areas since the 18th century; for this reason, it was often planted in places inconsistent with its habitat, i.e., where deciduous and mixed forests previously grew [1,2]. The flat and horizontally developed root system of Picea abies prefers a cool and humid climate, not tolerating soil dryness and overheating [1]. However, with the aging of the stand, Picea abies becomes susceptible to attacks by insects (mainly spruce bark beetle Ips typhographus) and fungi [3,4]. In addition, progressive climate changes, manifested by higher air temperatures and reduced rainfall, allows Ips typographus to start reproducing earlier, reaching more generations annually [5]. In the years of 1958–2001, when the climate warmed by 0.13 °C per decade, the growth of forests covered by bark beetle gradations grew on average by 5.31% per year. The most intense dieback of Picea abies trees occurred in the years with low rainfall in spring and summer and high average annual temperature [6]. All these factors indicate that much more frequent and severe outbreaks of cambiophagous insects can be found in spruce forests. Nevertheless, it should be emphasized that the insects are naturally occurring to eliminate weakening spruce trees from their stands [4], and the outbreaks are a natural process that inhibits the expansion of spruce beyond its optimal climatic range [3].
The spruce bark beetle (Ips typographus) is an insect of the Scolytinae subfamily in the Curculionidae family. Adult beetles are 4–6 mm long and 2 mm wide, and are brown–black in color. It can be found all over Europe, in Russia from Siberia to Kamchatka, as well as in China, Korea and Japan. Its distribution is correlated with the range of its main host plant—Norway spruce (Picea abies) and closely related species, because Norway spruce grows only in Europe, and Ips typographus can be found in Asia on other spruce species, e.g., P. obovata, P. orientalis, P. yezoensis [7]. A large number of bark beetles are able to effectively stop the transport of water and nutrients in the spruce, and also introduce fungi that would not otherwise be able to attack trees [3]. For several months (often until winter), infested spruce trees have green needles and show no clear signs of attack [8]; in the next season, most of the needles are lost and the tree is dead, the so-called snags [9].
A forest regeneration capacity is significant; an example can be the Bavarian Forest National Park, where a spruce bark beetle outbreak began in 1993, and in 2005 the inventory indicated the regeneration index oscillated around 4500 20-cm-high trees per hectare, with 89 percent of Picea abies and 7.9% of rowan (Sorbus aucuparia). This shows that montane zones reproduce well and their continuity is not endangered, while the dynamics of the spruce forests in the foothill zone is more complicated [10].
Inventory of dynamically changing stands is a demanding, labor-intensive and costly task due to the irregular network of forest roads. Additionally, standard grids of sampling plots (from 200 × 200 m to 1000 × 1000 m) and the subjectivity of the observed changes reduce monitoring quality [11,12]. This is the reason behind the enormous popularity of remote sensing data, which plays a primary role in inventory species composition [13,14,15]; vegetation parameters, e.g., Leaf Area Index (LAI), Leaf Chlorophyll Content (LCC) [16]; plant water stress [17], leaf defoliation [18] or dieback of trees as a result of insect attack [19]. An example of such research is the analysis of Landsat images to assess mountain pine beetle (Dendroctonus ponderosae) invasions on various pine species in the Rocky Mountain area [20]. The course of the invasion was similar to that of Ips typographus in the stands of Picea abies. The Maximum Likelihood classification of Landsat images and Tasseled Cap transform derivatives (Brightness, Wetness, Greeness) and methods have classified the affected pines with a producer accuracy (PA) of 88.3% and 97.3% user accuracy (UA). The overall accuracy of this classification was 91% and the Kappa coefficient oscillated around 0.90. Meddens et al. [21] also showed that the Sentinel-2 MSI was optimal for assessing the effectiveness of the classification of attacked lodgepole pine (Pinus contorta) and ponderosa pine (P. ponderosa) based on a multi-period analysis of changes, as the classification of attacked pines (over 70% of damaged trees on the studied plot) achieved 92.9% user accuracy and 87.4% produce accuracy, overall accuracy—89.6% and Kappa coefficient—0.86. Considering mixed pixels in which the classes have at least 50% of the pixel share, user accuracy was 81.3%, producer accuracy: 85.3%, overall accuracy: 83.2% and the Kappa coefficient—0.78 [21]. Similar studies were carried out in the Tatra Mountains to detect spruce bark beetle outbreaks [22]; based on the images of Landsat-5 and Landsat-7 (2006–2011), the researchers calculated the vegetation indexes: Normalized Difference Vegetation Index (NDVI), Moisture Stress Index (MSI), Normalized Difference Moisture Index (NDMI), Vegetation Condition Index (VCI) and Tasseled Cap (TC) indicators. It was shown that at the maximum points of gradation, the classification accuracy reached 94% (overall accuracy, and Kappa coefficient—0.70), confirming the usefulness of the MSI [22].
In 2018, Abdullah et al. [8], based on Sentinel-2 and Landsat-8 images, showed that affected tree needles have less chlorophyll and water, a similar amount of nitrogen and more dry matter than those from the undisturbed trees. Then, based on satellite images, chlorophyll indices (e.g., Normalized Green–Red Difference Index) confirmed the changes allowing to identify bark beetle outbreaks with 67% accuracy on Sentinel-2 images [8].
Sentinel-2 images were processed with change detection methods Multivariate Alteration Detection (MAD) and Maximum Autocorrelation Factor (MAF) and with Support Vector Machines (SVM) classification, allowing us to identify bark beetle outbreak in Białowieża Forest (NE Poland) with an overall accuracy of 97% (Kappa coefficient: 0.93; producer accuracy: 92.5%; and user accuracy: 92.0% for attacked trees [23]). Eight World-View-2 spectral bands presenting mountain forests of Austrian Styria and Random Forest classifiers identified bark beetle damages of Norway spruce in different conditions: healthy trees, or even still green, but attacked trees (green attack) and snags. The best results achieved snags (producer accuracy scored 99%, and user accuracy—100%), undisturbed forest and the attacked trees oscillated around 60–70% [24].
Remote-sensing detection of freshly/green-attacked spruce trees by the bark beetle insects is a challenge, but it allows us to react at the beginning of a new outbreak by setting pheromone traps and sanitation, protecting the rest of the area [3,8].
The current paper focuses on methodical and application objectives; in the first case, it is an assessment of the multitemporal Sentinel-2 images (2015–2018) for the identification of coniferous and deciduous forests, grasslands, rocks, snags and cuts or windthrows. For this purpose, the Support Vector Machines (SVM) algorithm was used as an optimal classifier for stand mapping. The studies based on accuracy metrics of Sentinel-2 bands, spectral signatures of individual land cover forms derived from different years and remote-sensing indices; the classification accuracy was compared between changes taking place in coniferous forests, focusing on areas with dieback of trees; cuts or windthrows; or no changes in individual years. The condition of coniferous stands was carried out on the basis of the analysis of the values of spectral features (raster stacking), trained spectral signatures, remote-sensing indices, as well as correlation analyses: Multivariate Alteration Detection (MAD), Multivariate Alteration Detection/Maximum Autocorrelation Factor (MAD/MAF), and iteratively re-weighted Multivariate Alteration Detection (iMAD). The application objectives are to assess the dynamics of changes taking place within coniferous stands, including the outbreak of the spruce bark beetle in coniferous forests for the years 2015–2018 for the whole Tatra Mountains (Polish and Slovak parts). These changes were determined by statistics and cartographic presentations. An important element of the study is reference data based on high-resolution image data (airborne orthophotomaps and multispectral WorldView 2 images), which allowed us to identify analyzed targets on detailed maps, which were field verified by employees of the Tatra National Park [25]. Having such detailed reference maps for the whole area of the Polish Park, the current study allowed us to evaluate the proposed methods. The achievements are not only maps and statistical data about the dynamics of the environmental changes, but above all an assessment of different methods, constituting a signpost for people planning to conduct long-term monitoring of mountain forest areas.

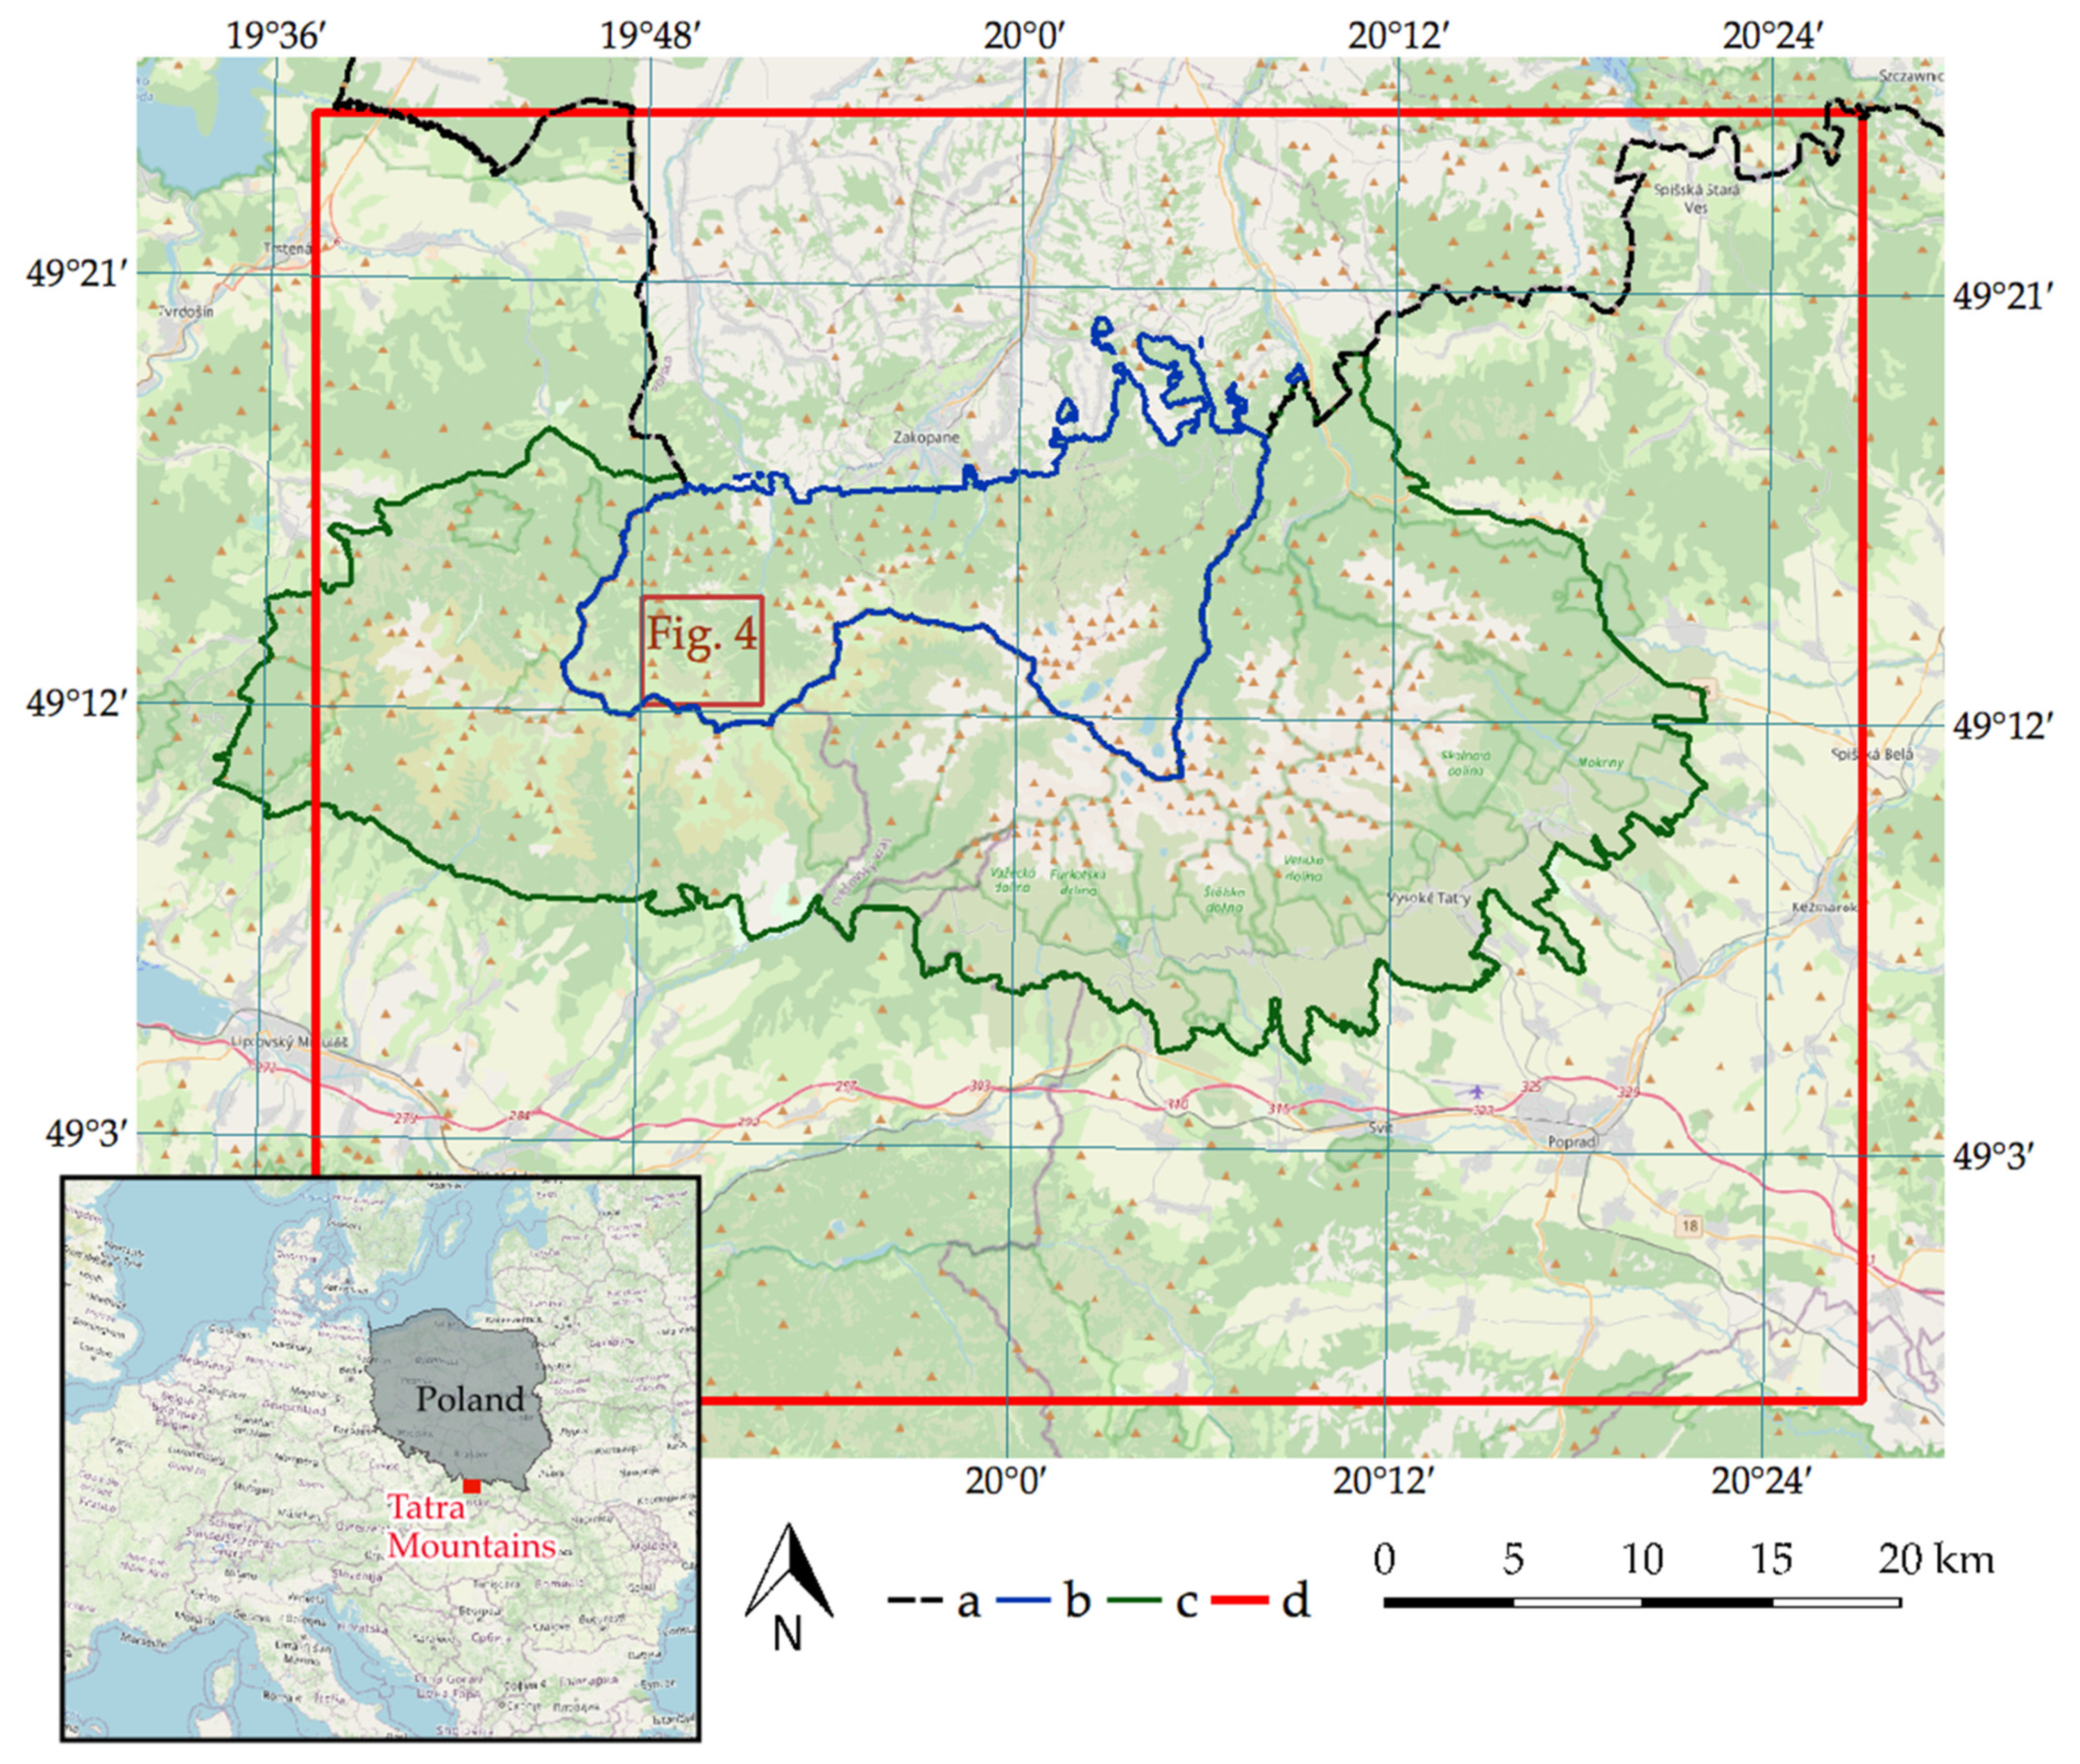
2. Research Area and Targets

The Tatra Mountains are the highest part of the Carpathian range; it covers an area of 785 km2, 22.3% in Poland (with the highest peak at 2499 m a.s.l.) and 77.7% in Slovakia (highest point, 2655 m a.s.l.). Natural vegetation shows specific patterns of altitudinal belts: lower and higher montane, subalpine and alpine. In the case of this analysis the research target was located in lower and higher montane zones (770–1600 m a.s.l.). In the upper montane belt natural Picea abies forest stands are dominating, sometimes of primeval character. The Tatra climate is also showing diversification in the vertical profile with high amounts of annual precipitation reaching 1850 mm at 1987 m a.s.l. This area is protected by bilateral national parks Polish (Tatrzański Park Narodowy—TPN) and Slovak (Tatranský národný park—TANAP). UNESCO Tatra Transboundary Biosphere Reserve was created in 1992, covering the whole Tatras and large adhering areas (Figure 1).
Picea abies is a coniferous tree species belonging to the Pinaceae family. It can reach a height of 50–60 m and 200–300 years of age (very rarely more). The range of Picea abies covers a large area of Northern Europe, from sea level till 2400 m a.s.l. in the Alps, where it grows as a krumholtz tree. It is shade- and cold-tolerant, so may persist where deciduous trees cannot withstand frost. Due to its flat root system, Picea abies do not tolerate droughts; therefore, they do not grow in central Poland, where precipitation is low. The most important habitat for this tree in the Tatras is the upper montane zone stretching at an altitude of approx. 1250–1550 m a.s.l., where it naturally forms extensive pure stands.
In the nineteenth century, most of the mixed forests in the lower montane zone of the Tatras (below 1200 m a.s.l.) were cut down for needs of mining and metallurgy, and herding caused another part of destruction. In the deforested areas, spruce was often planted as a fast-growing tree, a valuable resource. Spruce, as a pioneering species, also spontaneously enters open areas in lower zones, where higher air and soil temperatures prevail, which allow the bark beetle to limit the occurrence of spruce [7]; for this reason, increasing temperatures in the mountain environment leads to the dieback of mountain spruce forests [26].
Over the past two hundred years, the Tatra Mountains have experienced huge windthrow many times [27]. In 2004, there was heavy windthrow on the Slovak side, and a strong increase in the number of trees infested by the spruce bark beetle has been observed since 2005 [17,22,28]. At the end of 2013, heavy windthrow occurred in the Polish side, mostly in the western part of the National Park.

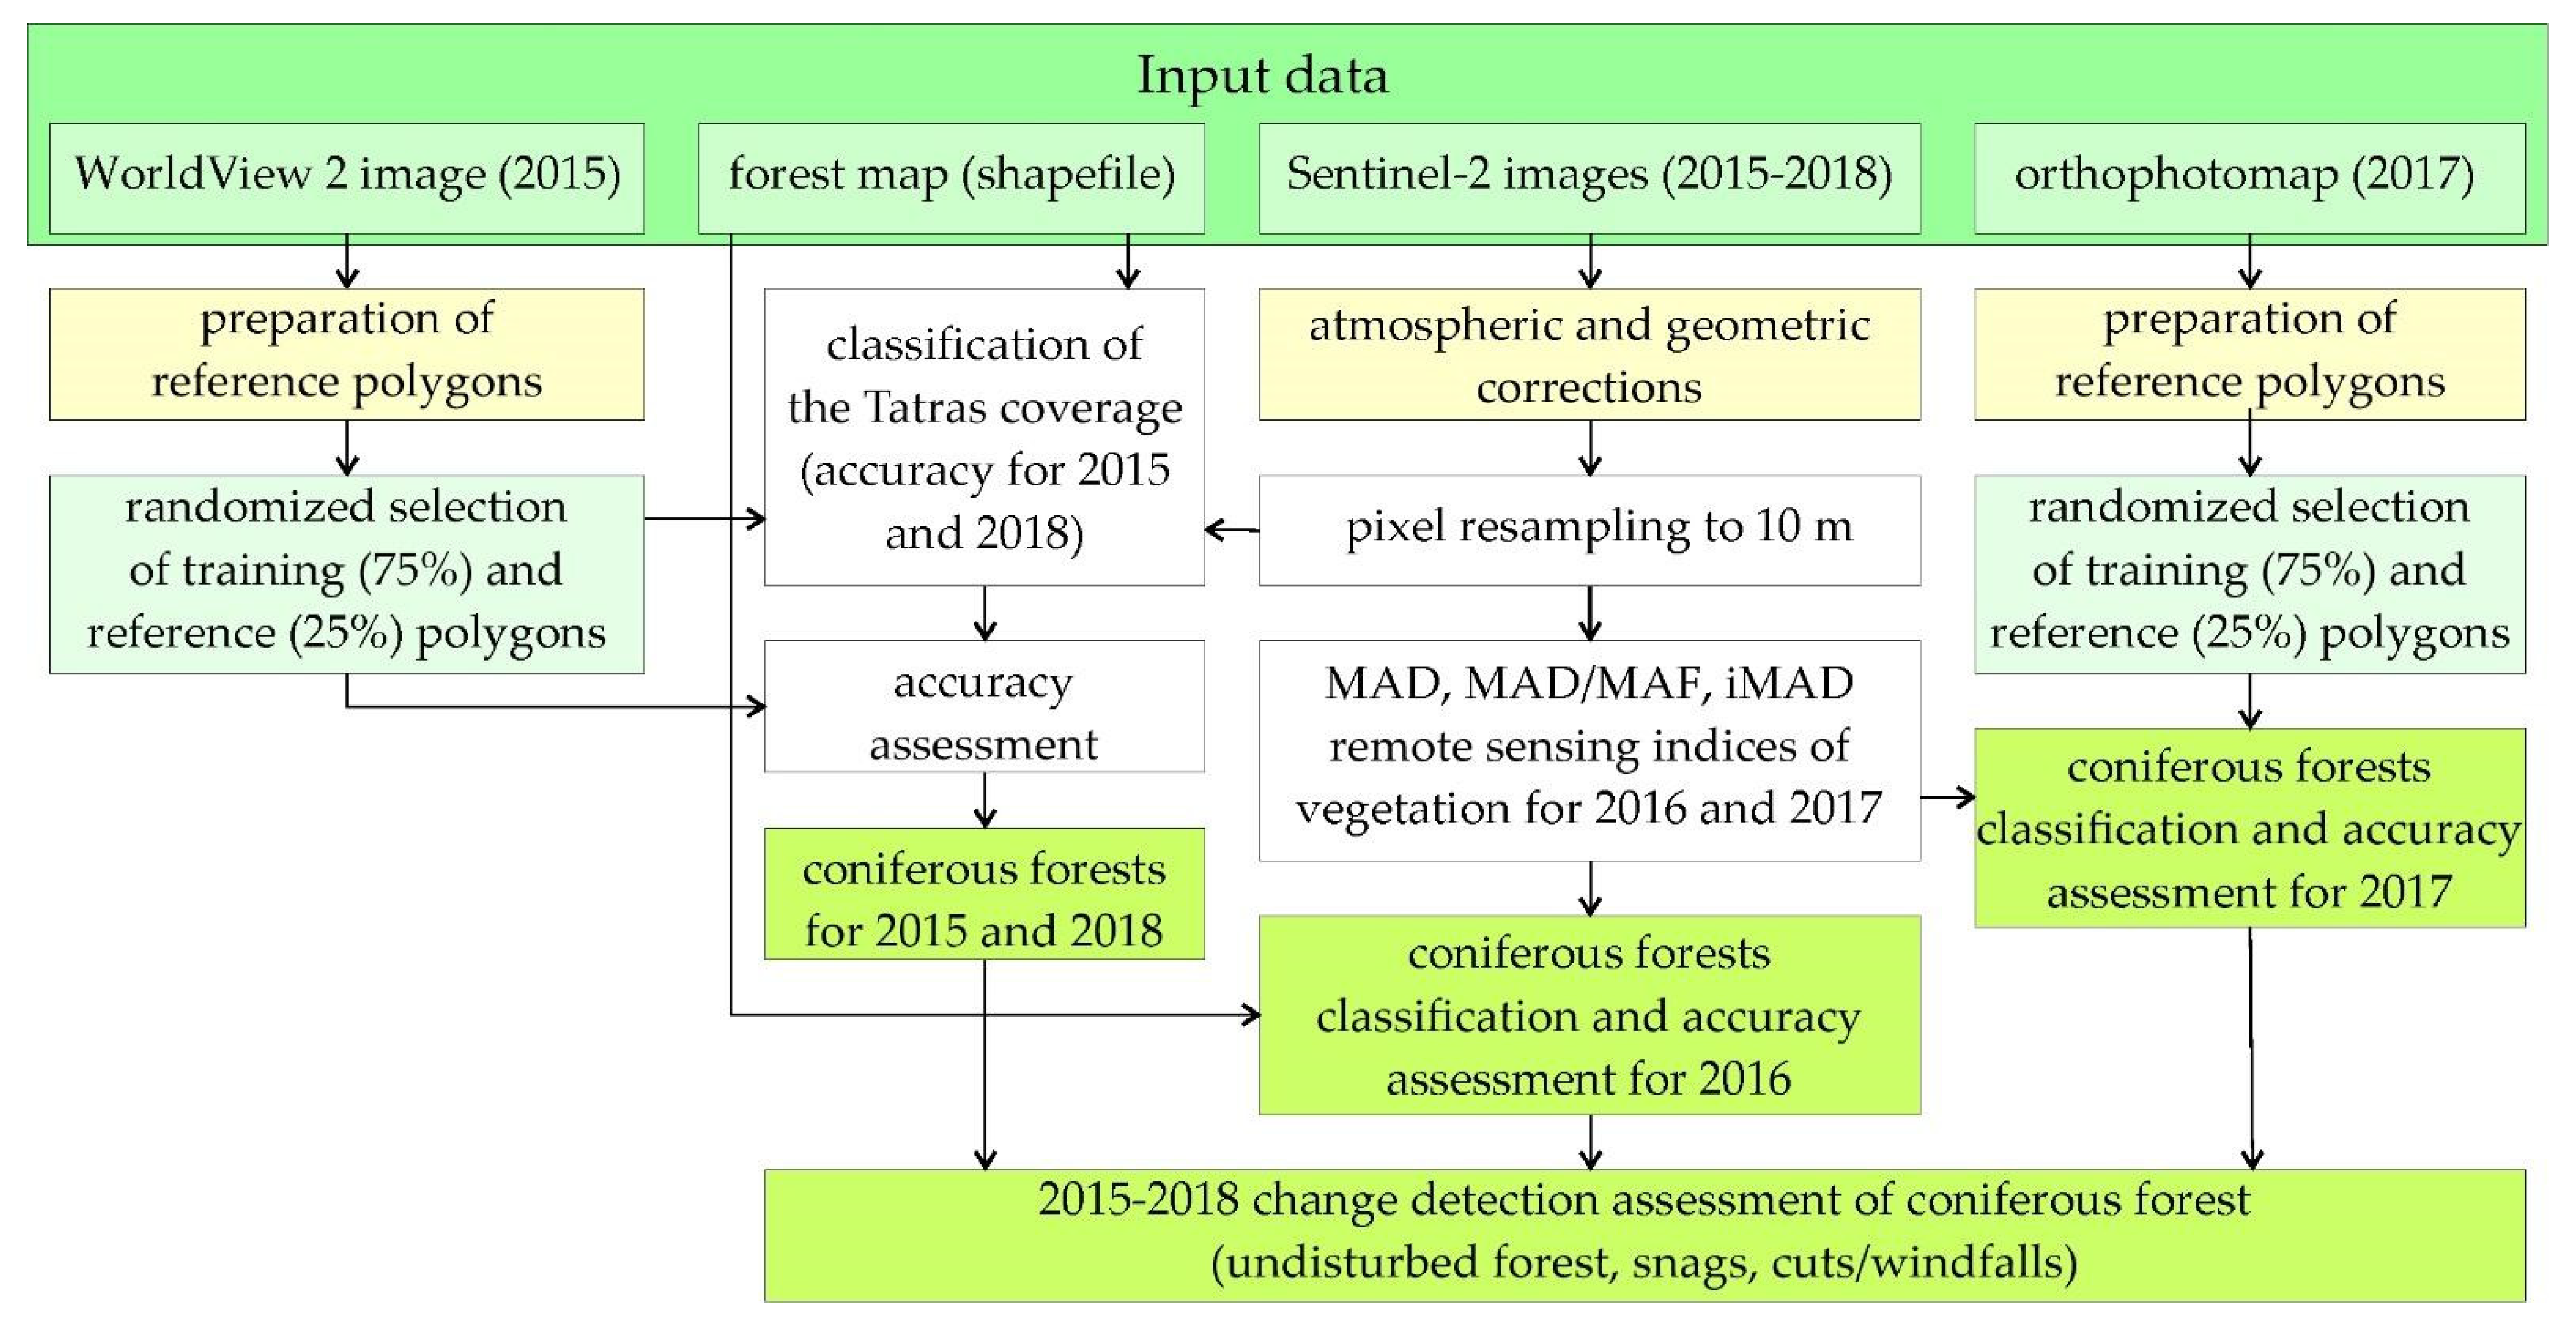
3. Materials and Methods

The basis of this research was the Sentinel-2 satellite images (13 spectral bands; four ten-meter, six twenty-meter, and three sixty-meter bands were used for atmospheric corrections only). Images were acquired on 3 October 2015, 30 September 2016, 2 October 2017 and 15 October 2018. The reference materials were provided by the Tatra National Park (TPN):
  • WorldView-2 satellite image with a resolution of 0.5–2 m acquired on 7 September 2015;
  • airborne orthophotomap (0.25 m; 2 October 2017);
  • shapefiles of damaged forest stands by bark beetles (update for 2017), sanitary cuttings carried out in the park (updated for 2017), boundaries of protection zones, forest areas, windthrow and a forest map of the TPN area.
The first step was the atmospheric and topographic correction of the Sentinel-2 images; for this purpose, the Sen2Cor software (ESA) was used. Some areas were manually masked out due to clouds and their shadows. Twenty-meter bands were resampled to ten-meter resolution based on the nearest neighbor method (Figure 2).
The preparation of reference polygons based on a selection of six land cover classes: coniferous and deciduous forests, snags, sanitary cuts or overturned by windthrow, grasslands, and rocks (Table 1). In the first stage, the analyses were conducted on:
  • a high-resolution WorldView-2 image;
  • a vector layer updated for 2015: snags, sanitary cuts and windthrow and other forest parameters of TPN (all vector data were field verified).
Selected polygons were used to classify Sentinel-2 images from 2015. In the second stage of the work, reference polygons were created for the state for 2017:
  • an actual airborne orthophotomap (acquired on 2 October 2017 with an accuracy of 0.25 m);
  • an updated vector layer of snags, sanitary cuts and windthrow, which allowed us to assess changes between 2015 and 2017 (Table 2).
It allowed us to prepare reference polygons to analyze:
  • no changes between 2015 and 2017 (an undisturbed coniferous forest in 2015 remains undisturbed in 2017);
  • dieback of trees—undisturbed coniferous forest in 2015, and dying in 2017;
  • deforestation (sanitary cuts) or windthrow, undisturbed coniferous forest in 2015, and nonexistent in 2017 (this class may also include gaps in the stand, e.g., due to old age).
The spectral patterns acquired in 2015 and 2017, allowed to conduct analyses for 2016 and 2018 as one of the research scenarios.

3.1. Classification

Support Vector Machine (SVM) was used as the classifier based on the EnMap-Box 3.3 (QGIS 3.4) and R Studio software; all kernel functions (linear, polynomial, sigmoid and Radial Basis Function) were tested, but for the final classification, RBF function was applied. The sklearn library was applied and a tuning of SVM parameters allowed us to select the optimal parameters: gamma coefficient 0.01 was selected from the tested values: 0.001, 0.01, 0.1, 1, 10, 100 and 1000, and penalties C 1000 (from the checked: 0.001, 0.01, 0.1, 1, 10, 100, 1000). The reference polygons were sampled 10 times for training and validation in the 75/25 ratio. In the final version of the map, each pixel was assigned to the most frequently occurring class in subsequent iterations, the so-called dominant. The verification polygons were also rasterized and were used for verification and assessment of classification accuracy. The final accuracy of the classifications was measured by overall accuracy, Kappa coefficient, user accuracy (UA) and producer accuracy (PA), as well as the F1-score and error matrices.
After obtaining the final map containing 6 classes (coniferous forests, deciduous forests, grasslands, rocks, sanitary cuts and windthrow and snags) for 2015, all classes, except undisturbed coniferous forest, created a mask removing non-coniferous forest from further investigations, because the main idea was to follow the changes on the references coniferous forest patterns (initial moment of the bark beetle outbreak). On this basis, all satellite images were analyzed only on unmasked areas.

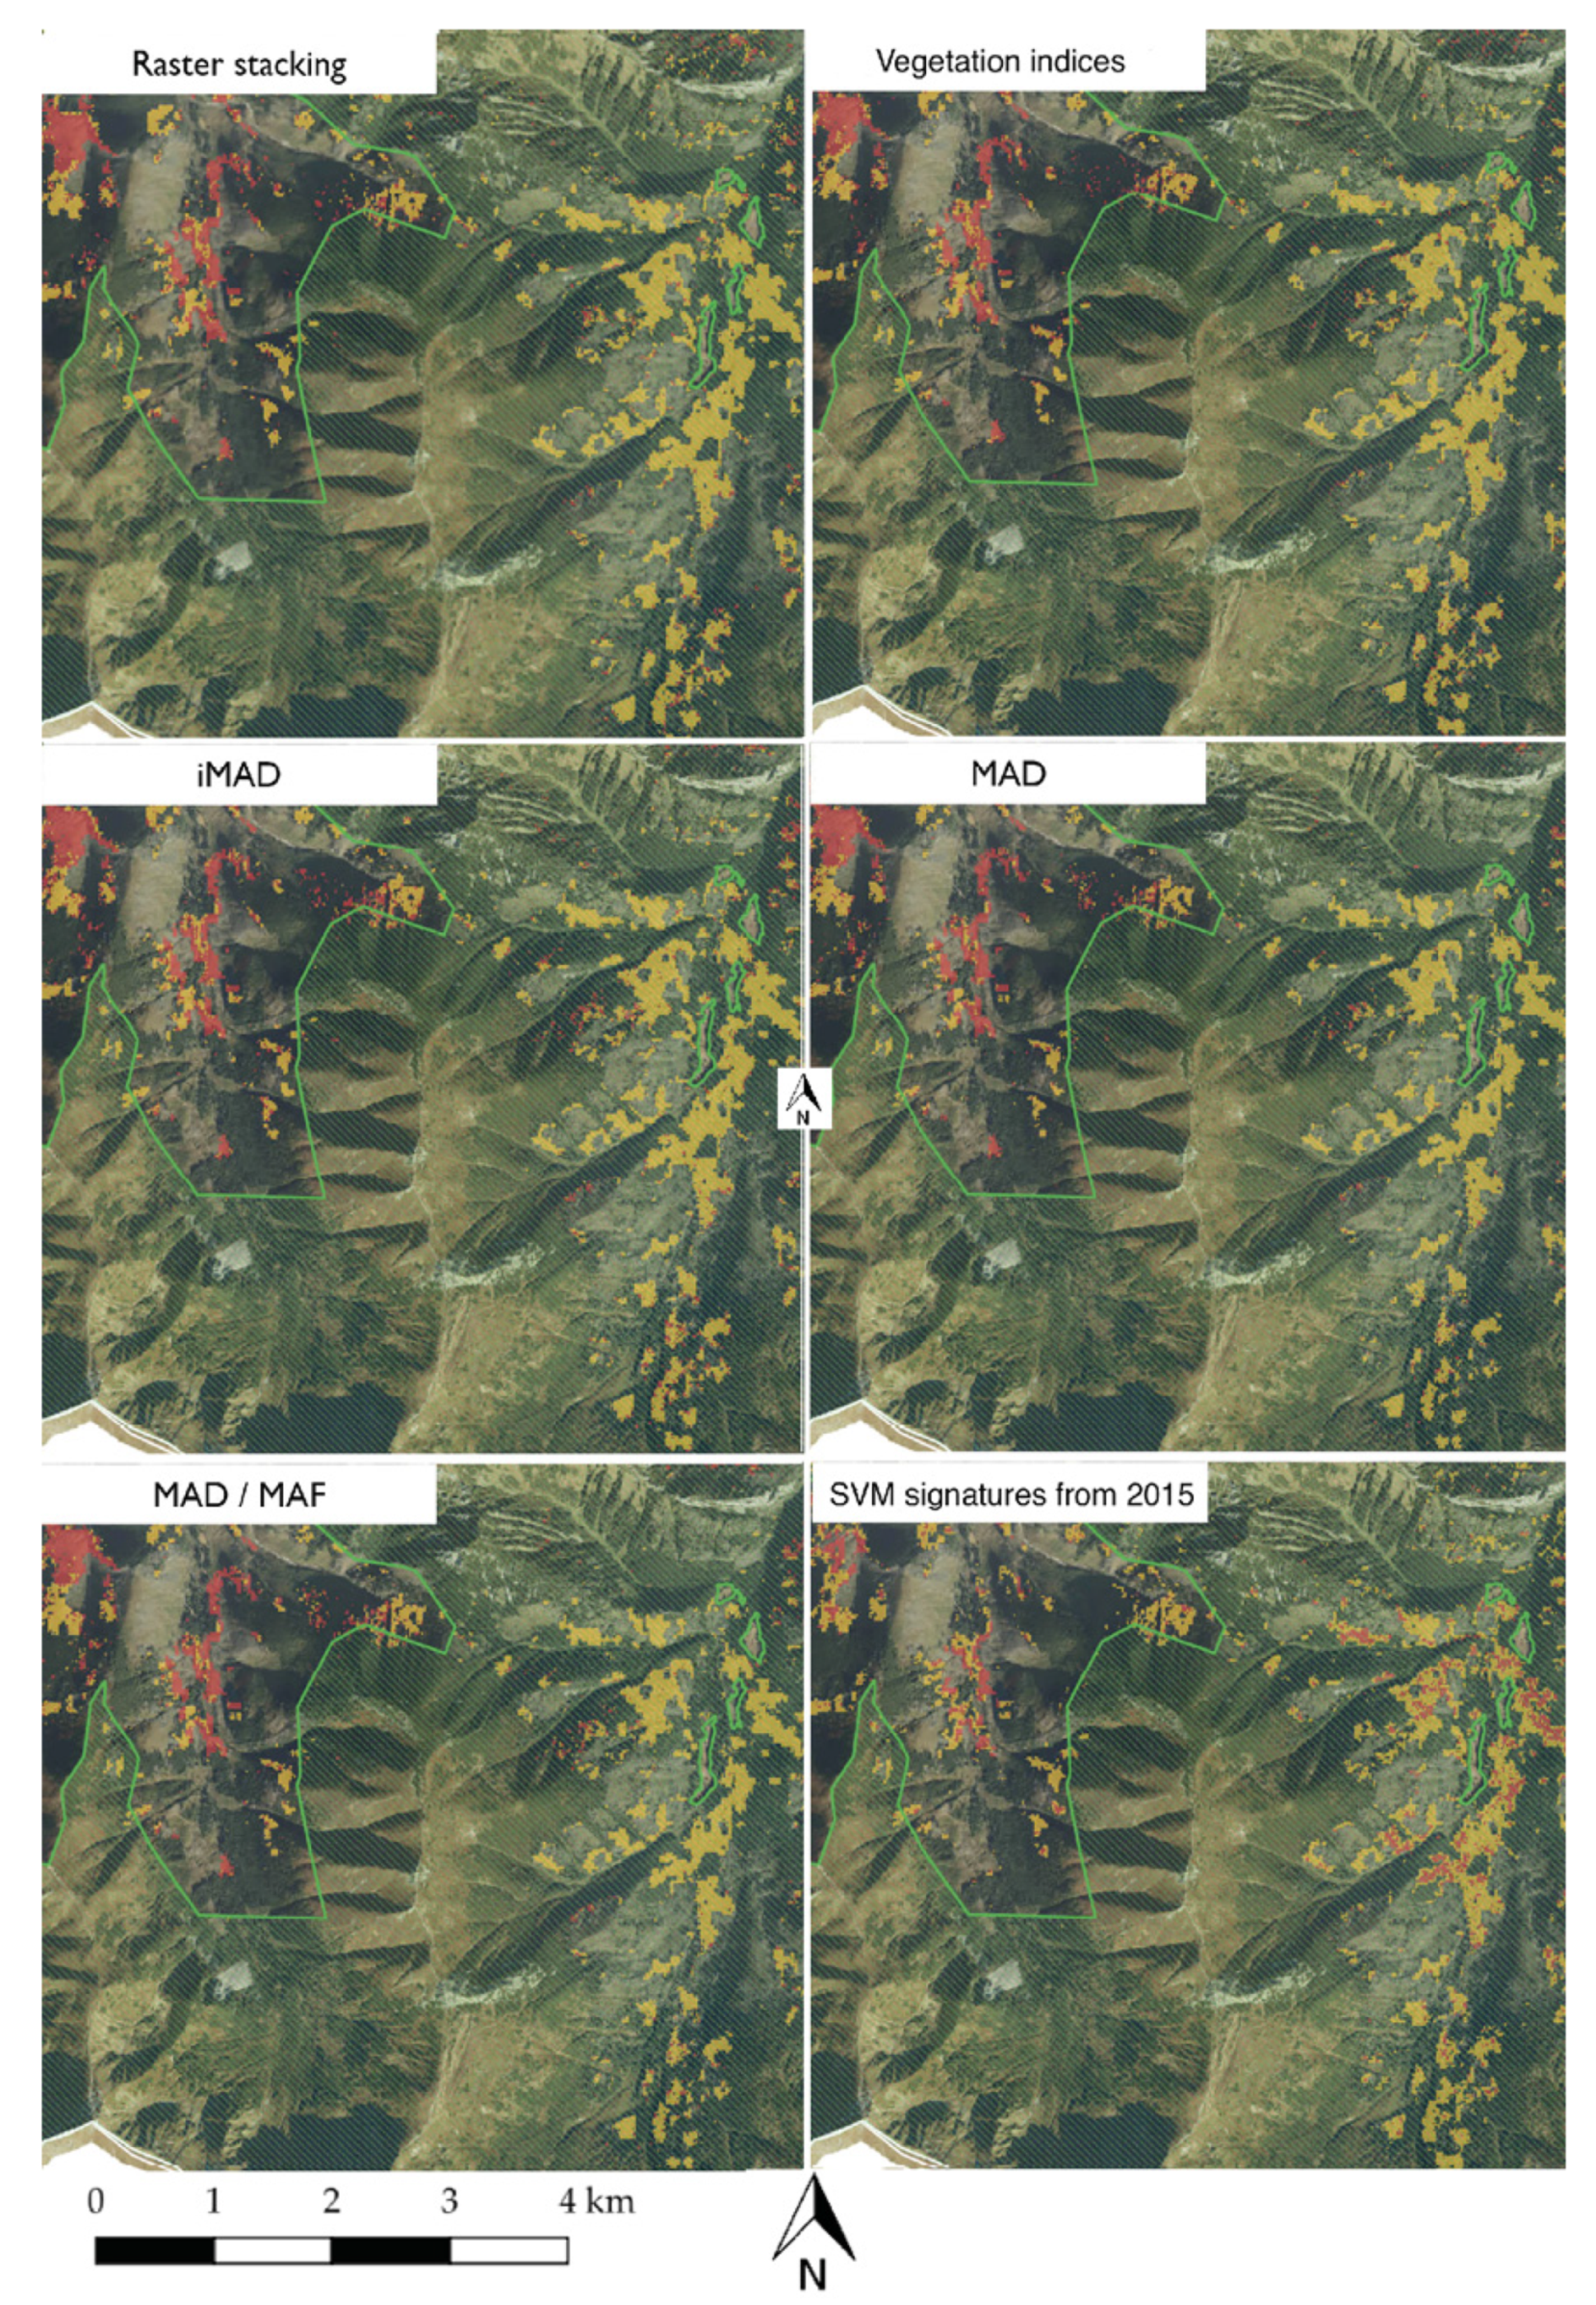
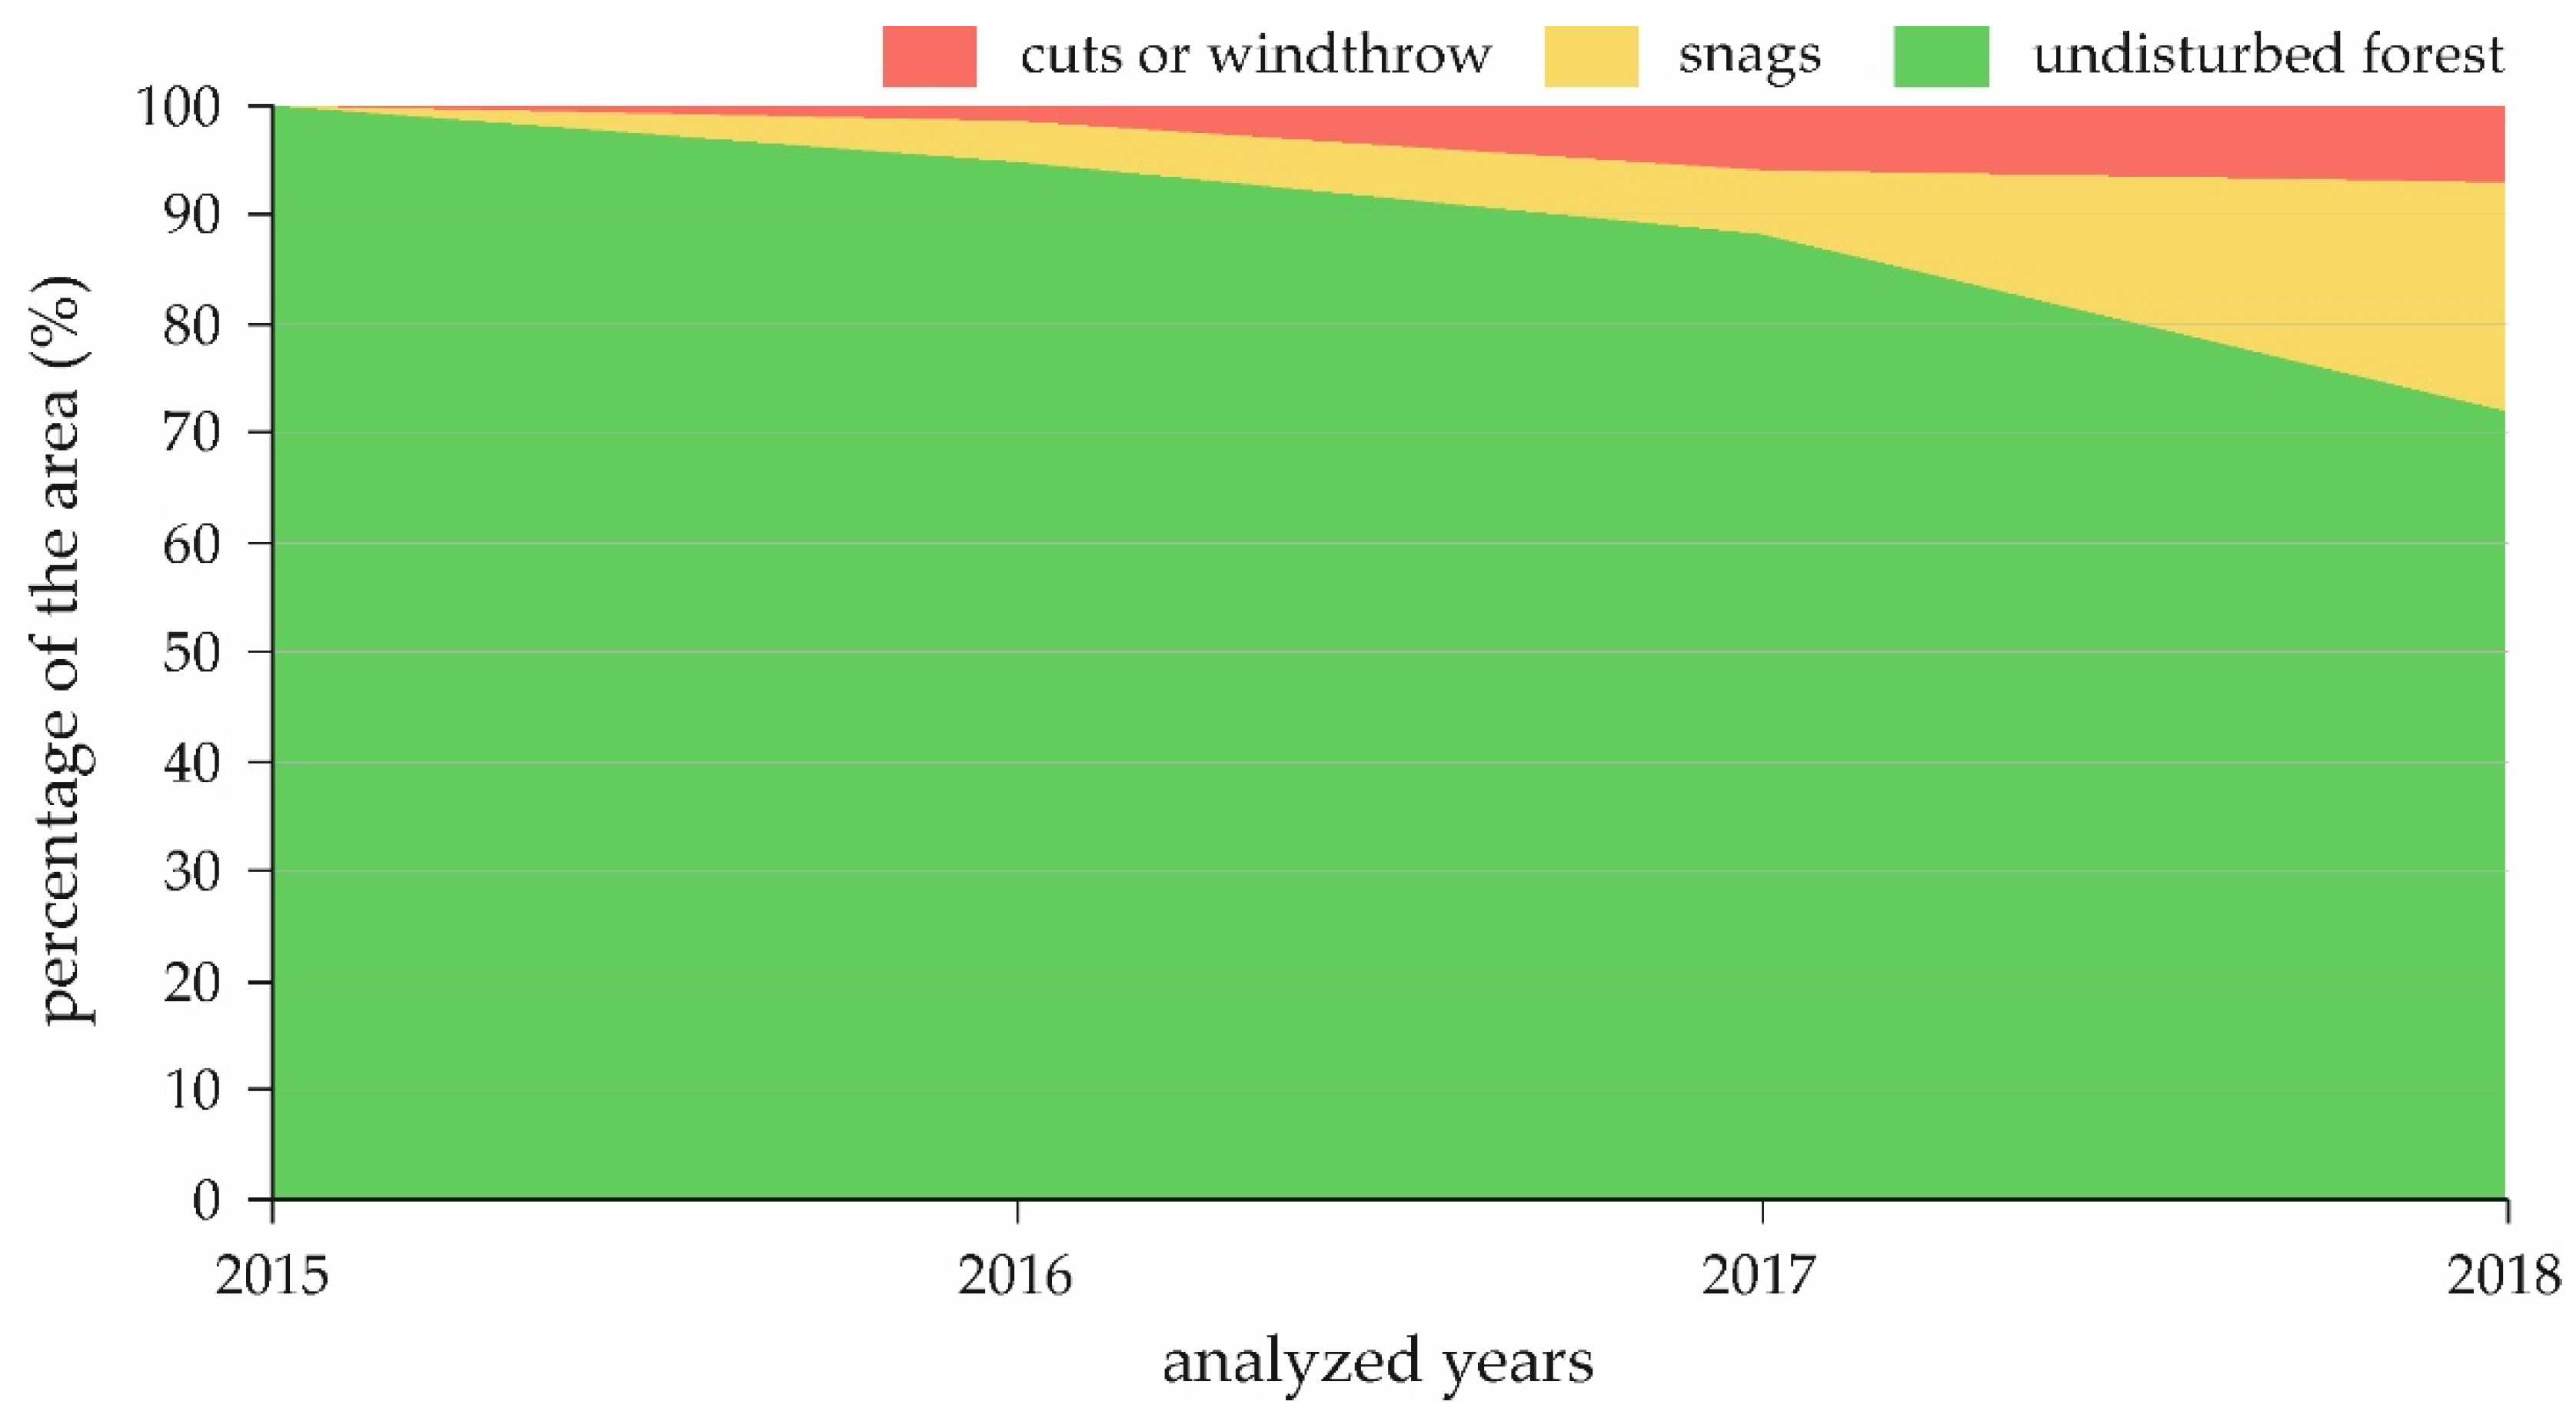
3.2. Multi-Temporal Analyses

The Sentinel-2 image from 2 October 2017, after pre-processing and masking undisturbed coniferous forest area from 2015, was compared with the image from 2015. Six methods were used to determine the changes in the state of coniferous forests from 2015–2017:
  • remote-sensing indices (Table 3);
  • Sentinel-2 spectral signatures used from 2015 SVM classification to analyze class changes in 2017;
  • Multivariate Alteration Detection (MAD);
  • Multivariate Alteration Detection/Maximum Autocorrelation Factor (MAD/MAF);
  • Iteratively Re-weighted Multivariate Alteration Detection (iMAD);
  • raster stacking method of combining the 2015 and 2017 periods into one 20-band raster; 10 spectral bands acquired in 2015 and an additional 10 bands from 2017. The following spectral bands were used: 2 (Blue), 3 (Green), 4 (Red), 5 (Red Edge 1), 6 (Red Edge 2), 7 (Red Edge 3), 8 (NIR), 8A (narrow NIR), 11 (SWIR), 12 (SWIR); twenty-meter bands were resampled using the nearest neighbor method to a ten-meter pixel size.
Based on the mask of polygons (defined as healthy coniferous forests in 2015), 23 remote sensing indices were calculated (Table 3). The indices describe photosynthetically active energy accumulation, water content, biomass and general quantity and vigor of green plants [8].
All these indices were saved as separate raster images, which were combined into a single file through the layer stacking function. This resulted in a reference dataset for healthy coniferous forests. It allowed us to distinguish differences in the values for tree cuttings and dying trees. All calculations were made in the R package using the raster library [50,51,52]. In the next step, the significance of remote sensing indices in the classifier learning process was checked; for this purpose, the Recursive Feature Elimination (RFE) method was used, based on the subtraction of successive indicators from the full dataset and data ranking (from the most to the least informative).
Multivariate Alteration Detection (MAD) allowed the analysis of multispectral data of the same area from 2015–2017 [53,54]. Due to the propagation of differences between individual spectral bands in different periods, a transformation of the input bands was applied, giving more weight to those bands, which had more significant changes; in addition, a canonical correlation was used (identifying linear coefficients for each band of both images); it made it possible to create canonical weights of successive degrees, being orthogonal to the first degree up to the k-degree canonical weights. The analyses were performed in Orfeo ToolBox, generating a new image consisting of 10 bands (corresponding to the number of input Sentinel-2 bands from the 2015 and 2017 images, sixty-meter atmospheric bands were removed). In the next step, the Maximum Autocorrelation Factor (MAF) [55] method was used to rank the MAD bands from the most to the least autocorrelated. It consists of finding a linear transformation (as in the case of PCA and MAD) of the input bands to a band space in which the correlation of pixels with its surroundings is the greatest one.
Simultaneously with the MAD/MAF methods, the Iteratively Re-weighted Multivariate Alteration Detection was tested (iMAD) [56]. The IMad.py script written in Python provided by Dr. Mort Canty on GitHub was used for this. In the iMAD algorithm, the MAD transformation was performed in the first step. Then, more weights were given to those pixels that did not change significantly and less to those that showed a change. Then, the MAD was recalculated, but considering the weights given to the pixels, i.e., those pixels that showed a large change in the first step, were taken into account less for the correlation computation than those that had a small change. As a result, from two Sentintel-2 images for 2015 and 2017, one raster file with 10 spectral bands was obtained, but ranked from the highest probability of changes between images to the smallest.
In the R Studio, the layer was combined using the stack function from the raster library coniferous forests (raster stacking) from Sentinel-2 image from 2015 and 2017. In this way, a raster file with 20 bands was classified.

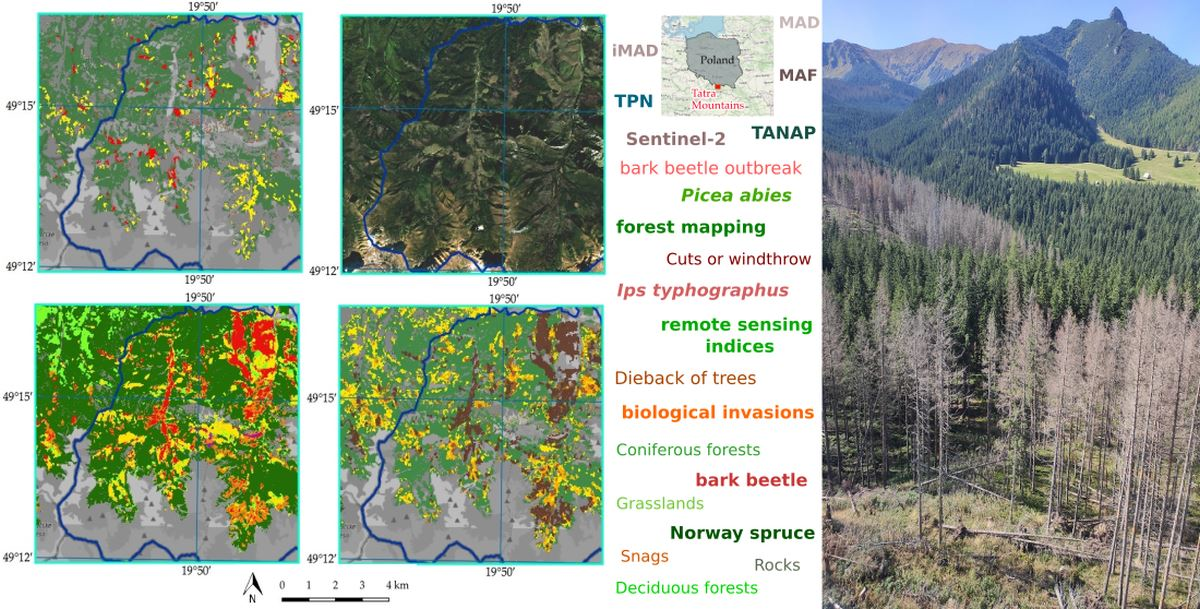
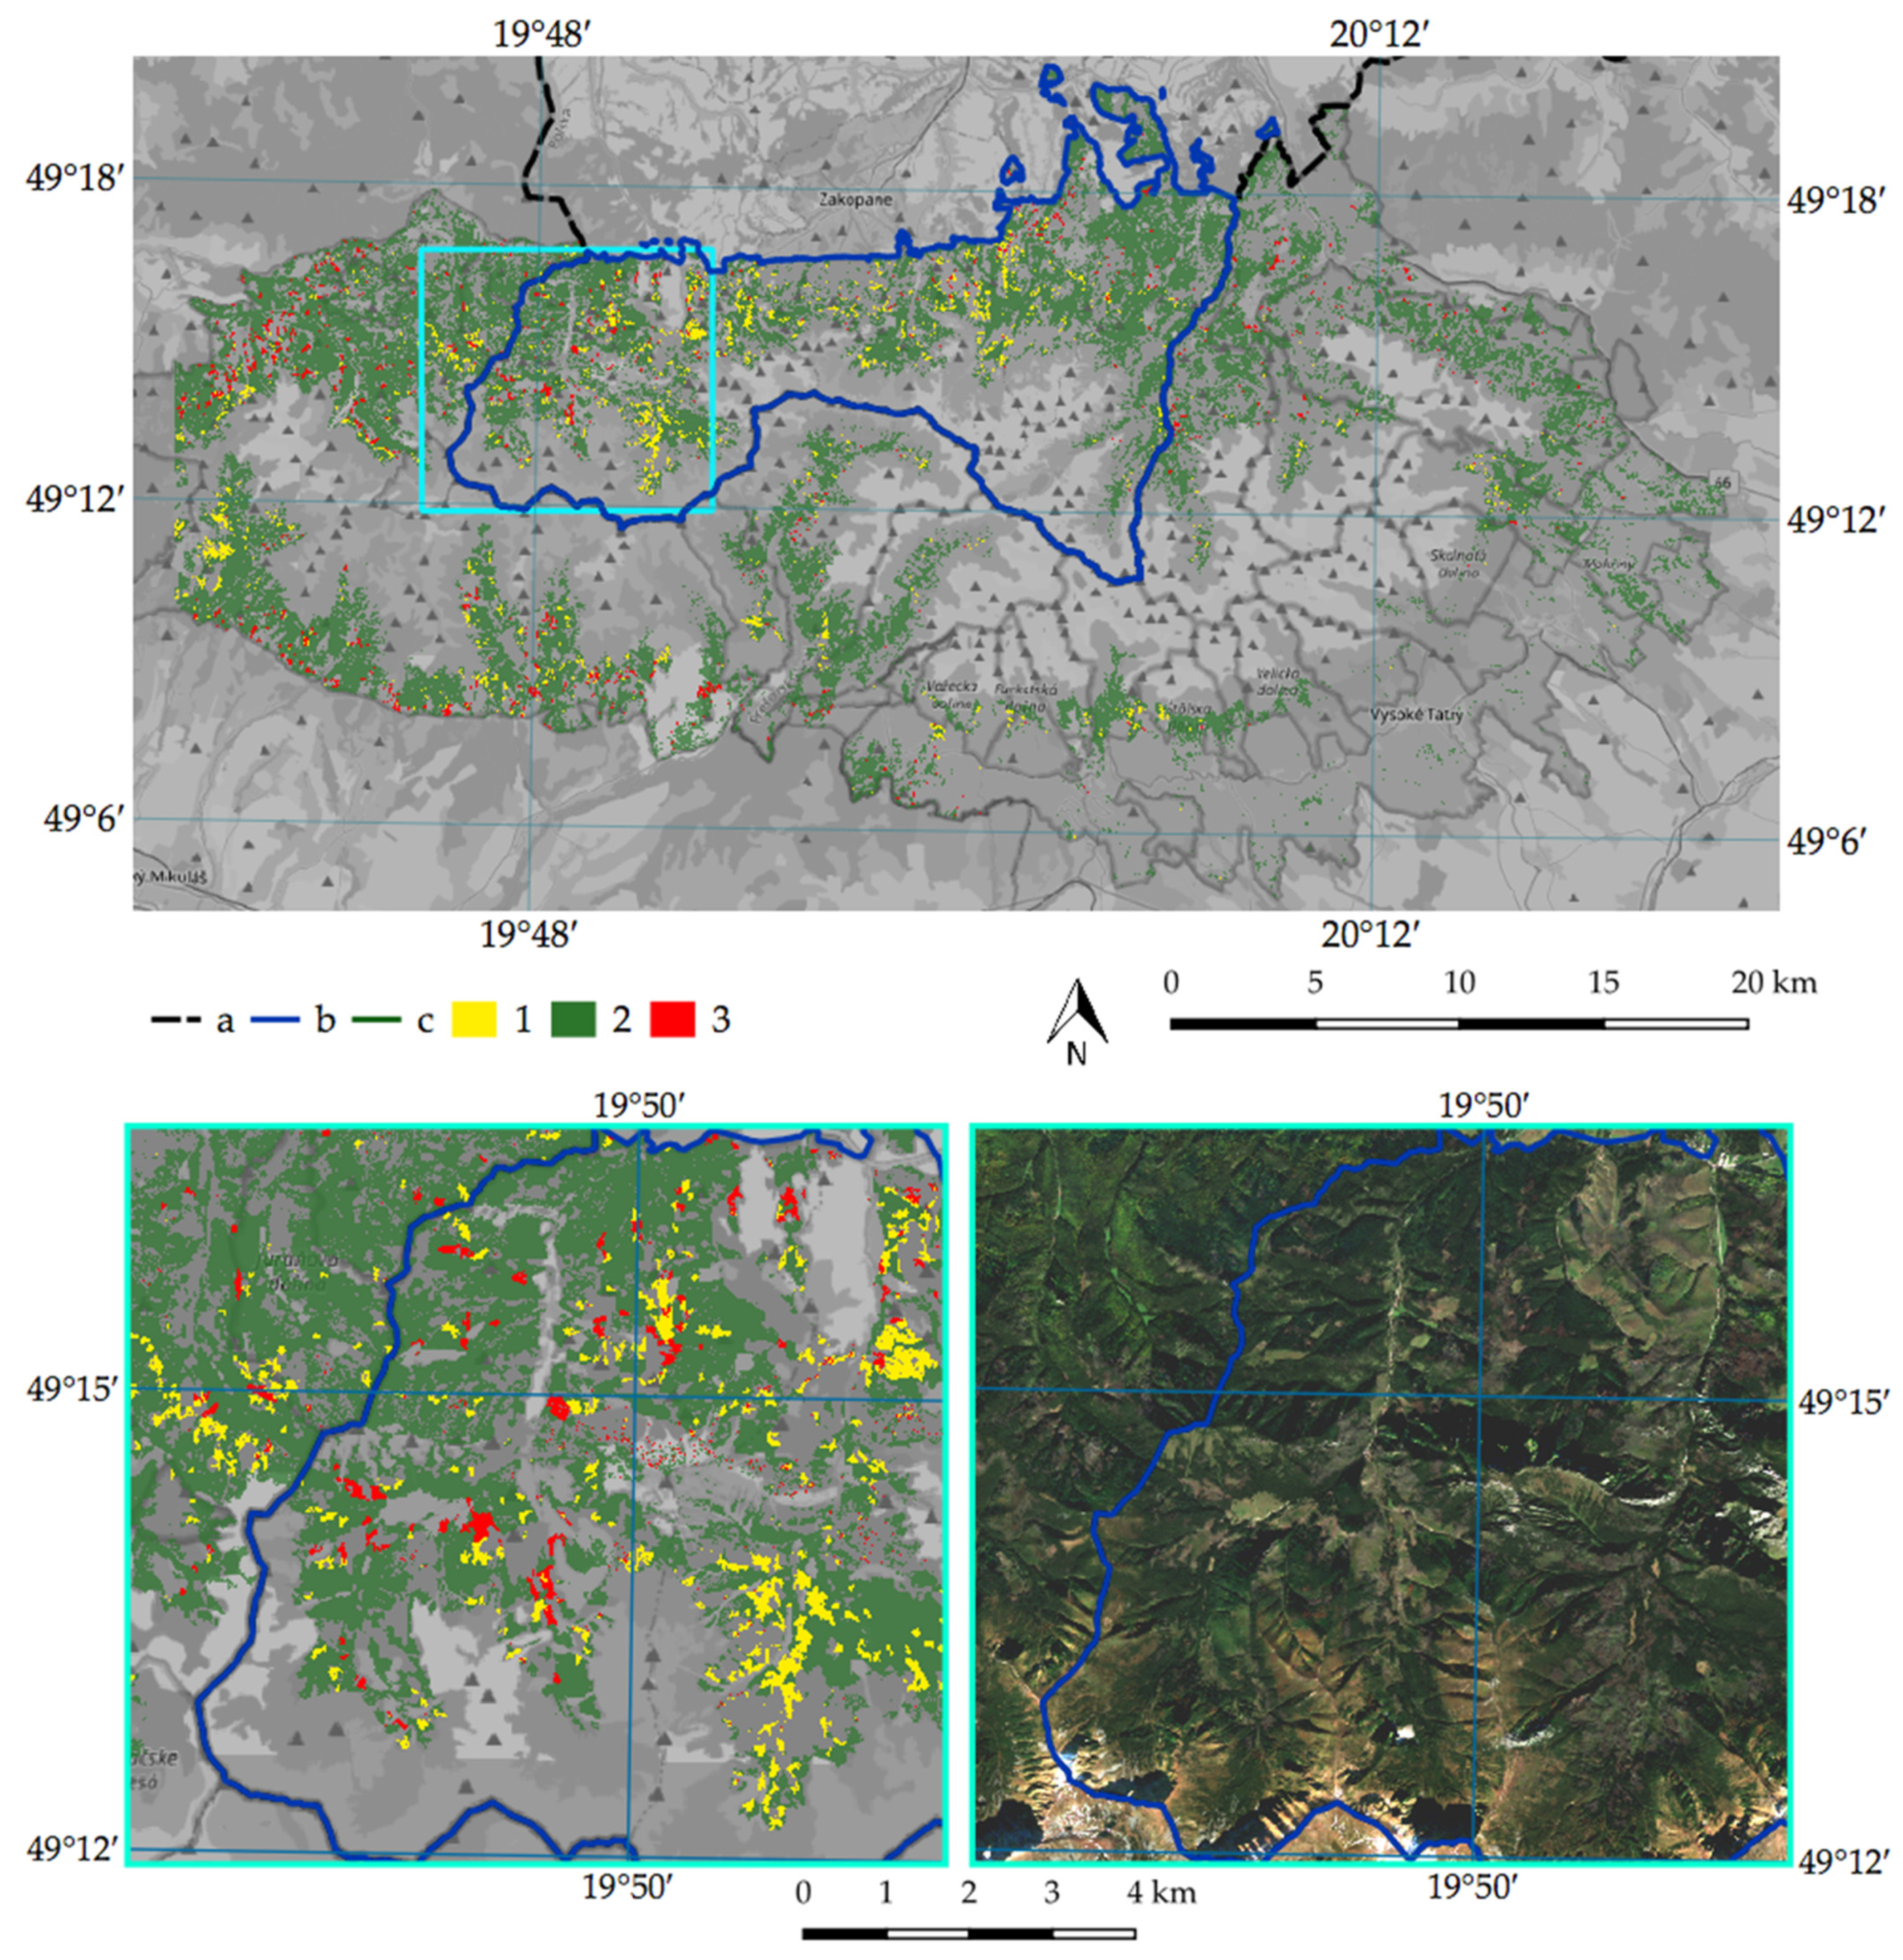
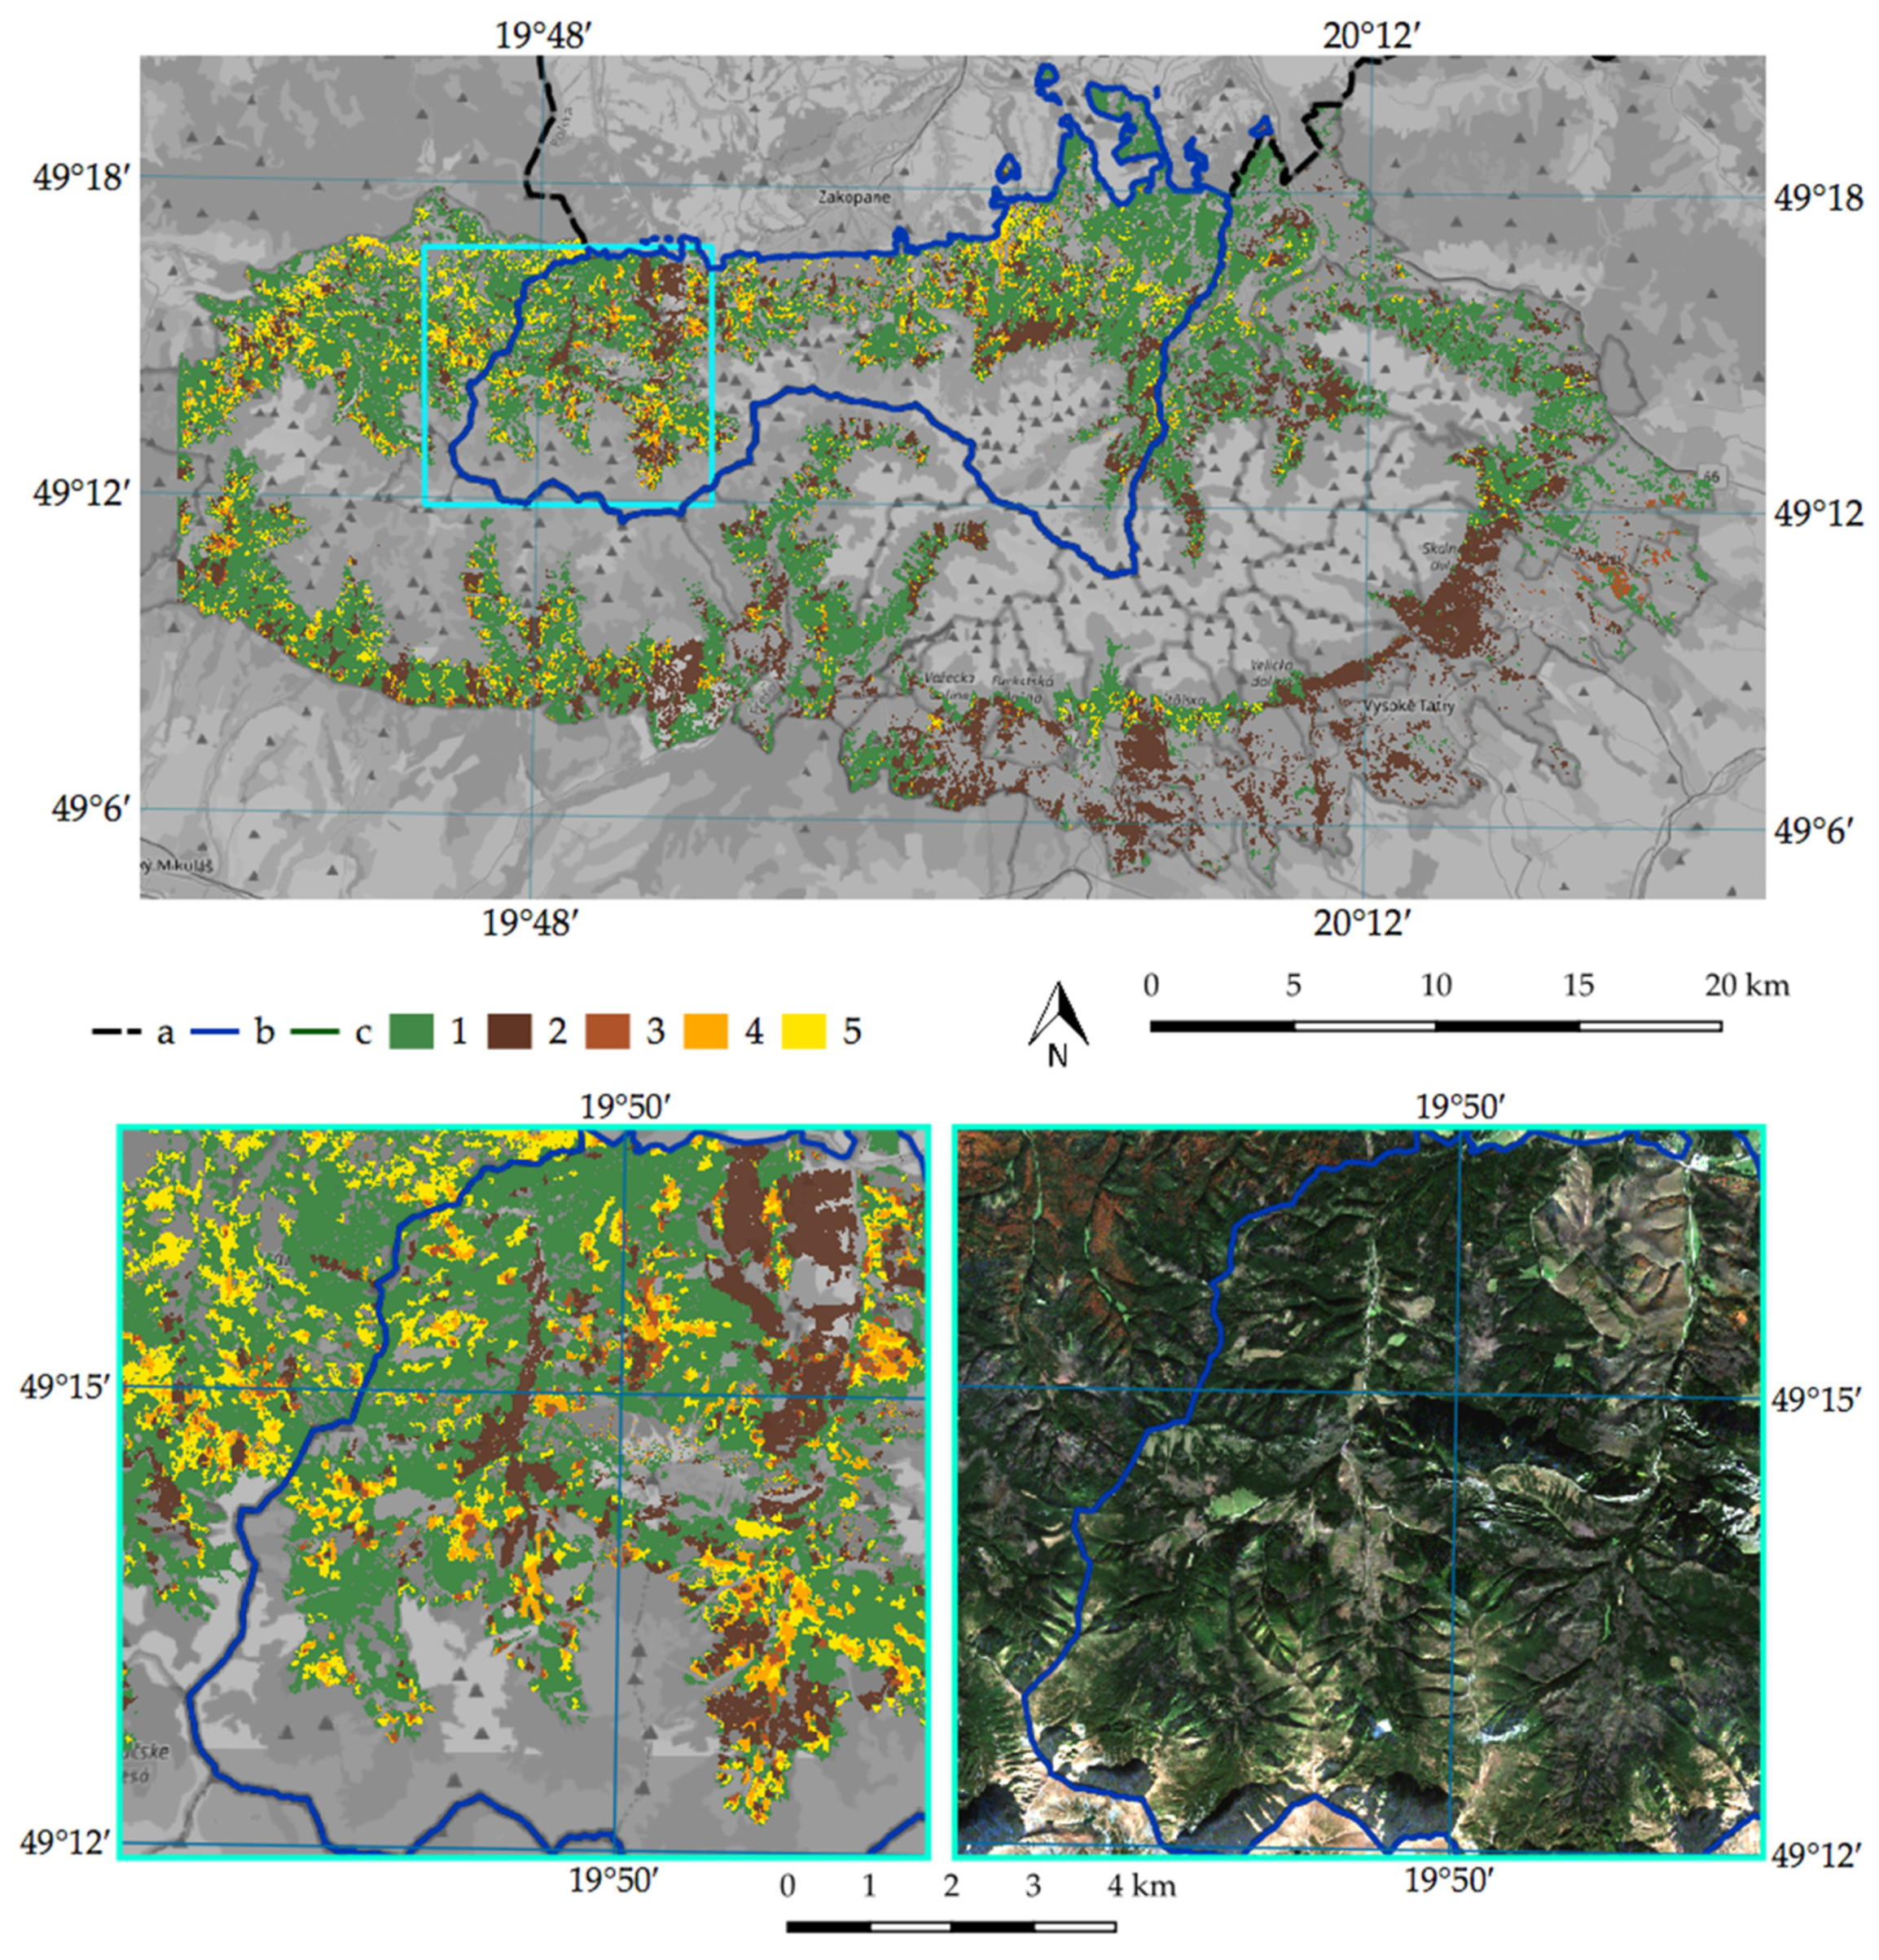
3.3. Map of Bark Beetle Outbreaks and Assessment of Classification Quality

As a result of the 10-fold randomized sampling of training and validation polygons, 10 maps of changes in the coniferous forests were obtained for all methods, then for each pixel from all maps, the modes were calculated, and on this basis, the maps of changes were prepared. This analysis was performed in the R program based on the e1071 library [57] and the one versus one method. These maps were generalized, i.e., eliminating less than 30 pixels for the whole Tatras. In the following step, a confusion matrix was created, presenting the number of pixels from the given reference classes and classified into individual classes on the diagonal of the matrix (reference classes were presented in columns, and the rows were classified according to the algorithm). An error matrix was calculated for each of the applied methods (remote sensing indices, Sentinel-2 spectral signatures, MAD, MAD/MAF, iMAD and raster stacking of the 20-bands file. In R Studio, a coniferous forest layer from a Sentinel-2 image from 2015 and 2017 was combined using the stack function from the raster library. Sentinel-2 satellite images from 3 October 2015 and 2 October 2017 after pre-processing and using healthy coniferous forest masks from 2015 and 2017 were merged into a 20-band raster file which was subjected to classification. Additionally, to evaluate the usefulness of the methods, the following metrics were calculated: overall accuracy of the classification (overall accuracy, OA, Aov), Kappa coefficient (κ), user accuracy (UA) and producer accuracy (PA) for each classification class and F-score.

4. Results

The result of the SVM RBF classification of Sentinel 2 images is the land-cover map for 2015 (3 October 2015; Figure 3). It allowed us to obtain a spatial distribution of coniferous forests, deciduous forests, grasslands, rocks, snags and sanitary cuts or windthrow. The coniferous forests layer served as a reference mask for the analyzes from the following years (2016–2018) and the assessment of the pace and extent of bark beetle outbreaks in the Tatra Mountains. The producer and user accuracies for individual classes is high (within the range of 90−100%; Table 4). The error matrix presents that the places in the forest where cuts or windthrow occurred were also classified as snags or grasslands. High user accuracy for coniferous forests—99.4%—means that the created coniferous forest mask contains a high-accuracy reference layer for change detection.
Analyzing the dominant land cover forms for 2015, which becomes the reference year of observations in the analyzed period (2015−2018), it is worth noting that the undisturbed coniferous forest covers 42.27% of the area, and the snags—9.21% (Table 5).
Analyzing changes that took place in coniferous forests between 2015 and 2017, it should be noted that all used methods allowed us to obtain very high and comparable results (Table 6); Figure 4 presents differences of algorithm outcomes, where large-scale changes can be easily visible, which allowed us to show the influence of algorithms on the identification of the analyzed phenomena. Nevertheless, the visual interpretation of the results confirms that the outcomes based on the raster stacking were characterized by a large number of individual pixels (salt and pepper effect), while this unfavorable phenomenon was not observed in the case of remote-sensing indices; hence, this method was used to present the obtained results.
The most informative remote-sensing indices were selected by the Recursive Feature Elimination method. The informational character of individual indices depended on the analyzed object (Figure 5), while the use of several indices allowed us to differentiate analyzed classes with an accuracy level over 90% (SAVI, which almost unambiguously allows us to distinguish undisturbed forests from cutting and dieback of trees (F1-score is 99.60%)). SAVI is based on red and infrared spectral bands (with 10 m spatial resolution). Adding additionally MCARI2, which was the second most informative in the ranking, which also contains information about the green band, significantly improved the identification of snags (F1-score was 93.19%) from the cuts and windthrow area class (F1 = 87.49%). The analyses showed the usefulness of the set of 15 remote sensing indices: SAVI, MCARI 2, NDII 2 (NBR), LCI, PPR, GSAVI, BNDVI, NDII, MSI, NGRDI, SR/SWIR, NDRE 2, NDVI, EVI and CVI (Figure 5), adding the information contained in the following indices: MCARI, TCARI, EVI 2, GNDVI, GLI, MSI 2, ARVI and DSWI did not improve the obtained results. These indicators allowed us to distinguish the state of the coniferous forest with a very high accuracy (Table 6), as well as to precisely identify the damage in 2017 (Figure 6, Table 6).
In 2018, the total forest degradation compared to 2015 exceeded around 30% for both Parks (Figure 7 and Figure 8), while the share of cuts/windthrow areas in TANAP is higher by two–three percentage points (Table 7).

5. Discussion

The achieved results allow us to assess the usefulness of Sentinel-2 satellite images and SVM-supervised classification for spruce bark beetle outbreak with high accuracies; in our case the worst results oscillated around 94% (overall accuracy). Different classifications of dying trees as a result of cambiophagous insects were analyzed in many parts of the world (Table 8), e.g., China [58,59], Europe [13,24,60,61], North America [21]; the authors based on different spatial and spectral resolution acquiring satellite or airborne images. The most similar analysis to this work, both in terms of geography and theused sensor (Sentinel-2) and methodology (SVM + MAD), is the work of G. Mikusiński and his team [23], who analyzed spruce bark beetle outbreaks and clearing cuts in the Białowieża Forest (NE Poland). A single-image Sentinel-2 classification for 2015 and a classification for 2018 change detection were performed; an overall accuracy oscillated at 97% (in our work—97.19%), and for the class of snags, the producer accuracy achieved 91.71%, and user accuracy—90.72% (we received 95.6% and 90.2%, respectively, which is a similar result to Mikusiński’s work [23]. In the multitemporal analysis (2015–2018), Mikusiński’s team achieved 97% (overall accuracy) and 92.2% (F1-score) for snags and 95.1% for the slice class [23]. In this paper, it is, respectively, 99.1% of overall accuracy, 95.7% (F1-score) for snags and 93.6% of F1-score for cuts/windthrow. The higher overall accuracy of this work resulted from correctly classified healthy forest, while the lower F1 score for cuts/clearing class, this is due to the fact that the Białowieża Forest is located in the lowland, where heavy equipment (e.g., harvester) can be used, which allows us to have homogenous large cuts/clearing areas. Moreover, the use of heavy equipment could have degraded the soil more, which could also have contributed to larger spectral differences between classes.
The team of A. Meddens [21] analyzed four classes: healthy forest, dead pines (over 70% in a 30-meter pixel), non-forest vegetation and masked areas (clouds, cloud shadows, topographic shadows) using the Maximum Likelihood, achieving 91% overall accuracy and 88.3% producer accuracy for snags and 93.7% user accuracy. The results are comparable to our work or slightly better; it may be a result of a lack of clear cuts, which were sometimes mixed up with the snags in our case.
M. Immitzer and C. Atzberger [24] applied the Random Forest and the WorldView-2 satellite images to classify individual trees during the outbreak of the spruce bark beetle in Austria. The authors focused on undisturbed forest areas, attacked green trees and dead trees. For the dead tree class, they achieved 100% for producer and user accuracies. This shows that the higher spatial resolution allows distinguishing snags and healthy trees. P. Rębiś [62] analyzed the bark beetle outbreaks in the Tatra Mountains; he used WorldView-2 images and Support Vector Machines to distinguish undisturbed forest, dwarf mountain pine (Pinus mugo), bark beetle nests and non-forest vegetation. The results oscillated at around 86.94% overall accuracy, 86.75% producer accuracy for snags and 100% user accuracy. The lower overall accuracy than in this study is due to the mixing of spectrally similar classes of dwarf mountain pine and healthy coniferous forests. This means that there were both green and dead trees in this class, which caused the mixing of the bark beetle nest classes with the healthy forest.
Z. Zhan’s team [58] analyzed a possibility of detecting dead Chinese pines among undisturbed forests in various shares of the species: 0% (undisturbed forest), 0–15% and 15–50%. For this purpose, authors used images of Sentinel-2 and Gaofen-2 (1–4 m pixel size); based on the CART (Classification and Regression Tree, which is a method of decision trees for the classification or regression of data), Random Forest and SVM methods, the authors obtained 59.5% overall accuracy for the three classes on Sentinel-2, but eliminating the class of 0–15%, overall accuracy increased to 81%. This shows moderate effectiveness in investigating snags in mixed pixels. The use of high-resolution Gaofen-2 images resulted in a 77.7% accuracy in distinguishing the three states of the attacked trees.
A similar level of multitemporal Sentinel-2 images and SVM RBF classification accuracies was observed for areas of Catalonia and the European Lowlands (near Warsaw, Poland), where coniferous forests were classified as the best (the median of the F1 score oscillated around 95%), deciduous (82–97%) and mixed forests (82–92%) [63]. Moreover, the values of the vegetation indices of stands in good condition were similar to those obtained for alpine grasslands [64], which were classified on a similar level of overall accuracy, reaching 84% for 22 vegetation communities based on airborne APEX hyperspectral images [65].
The second part of our study was focused on change detection between the reference year (2015) and the following years (2016–2018). Our results indicated very high accuracy between observed changes and reference patterns (oscillating between 93–99% of overall accuracy). Similar analyses were performed by the mentioned team of G. Mikusiński with the MAD/MAF algorithm [23]. Similar work was led by M. Havašová [22] on the bark beetle outbreak in the Tatra Mountains. Using the Landsat-5 and Landsat-7 satellite images and remote sensing indices, the threshold for the decline in indices between years, which would mean the occurrence of snags, was determined. For the years in which the gradation was the strongest, i.e., 2007 and 2011, 94% of the total accuracy was achieved, while this method fails in the remaining years. The aforementioned work by A. Meddens [21] investigated the deviation of remote sensing indices over the years. The highest overall accuracy was obtained for Tasseled Cap indices—91%. Landsat-5 and Landsat-7 images were analyzed, which presented a significant improvement in the overall accuracy of the multitemporal analyses based on the Sentinel-2 images due to higher spatial resolution (99.1% achieved).
Similar results on the same Landsat sensors were achieved by the team of L. Yu [59] in their study of Pinus yunnanensis pine and its defoliation by the lesser pineapple and the Tomicus yunannensis pineapple. Using the MSI remote-sensing index and grading based on the thresholding of the inter-year difference, they achieved 86.38% overall accuracy.

6. Conclusions

Among protective measures applied in both Tatra National Parks, the cutting and removal of infected spruces is quite common. Unfortunately, it is not easy to find infected trees from the ground survey, so it is usually performed when trees are dead, long after a new generation of beetles leave the tree trunk. This is totally ineffective. If it would be possible to distinguish infected trees in the early stage based on remote-sensing methods, protective measures could have been implemented sooner, and be more effective. So far, satellite images have not been implemented into protective measures in Tatra National Parks.
Sentinel-2 images, due to their spectral, radiometric and spatial resolutions, are a helpful source of information for the monitoring of large areas, including national parks, in assessing the course of the outbreak of cambiophagous insects. Most analyses are based on the spectral properties of research targets reflected in high resolution bands (10–20 m), which allows the identification of single or clumps of trees. Based on field polygons, it is possible to identify the first stages of bark beetle attacks (green attacks). Presented in the paper, accuracies (overall user and producer and F1-score) above 90% were obtained for snags and cuts/clearing patterns. Sentinel-2 satellite data is available every five days, so it is possible to monitor even mountain forests, which are clouded, but a high revisit time allows the masking of unexpected phenomena.
The conducted analyses identified optimal parameters of the SVM classifier (RBF, C = 1000, gamma = −0.01) for conifers, mixed forests, deadwood, clearings/windbreak and non-forest vegetation. Sentinel-2 images and the proposed methods allowed us to obtain very good results (overall accuracy 97%, and Kappa coefficient 0.96), which confirms the legitimacy of the proposed solutions; at the same time, the error matrix draws attention to misleading objects during classification, especially cuttings or fallen trees that at times had a spectral reflection very similar to insect-attacked trees.
It was noted that the most informative indices are SAVI, MCARI2, NDII 2 (NBR), LCI, GSAVI, BNDVI, NDII, MSI, NGRDI, SR/SWIR, NDVI, EVI and CVI; a further increase in the number of indices does not increase the accuracy of classified forests, cuttings and bark beetle outbreaks.
All analyzed transformations (MAD, iMAD, MAD/MAF) offer very high levels of accuracies, but the best results were obtained for iMAD (0.5–1% higher the others, but still lower than the raster stacking method). Subsequent change detection algorithms (MAD, iMAD, MAD/MAF, remote-sensing indices and raster stacking) did not bring significant changes in the results. The differences in the overall accuracy as well as the producer and user accuracies of each class were up by two percentage points, because all these algorithms are algebraic operations on spectral bands that are transformed by non-parametric algorithms, e.g., Support Vector Machines. A real qualitative change could already be brought by an improvement in the spectral or spatial resolution, as shown by the discussion of the results or the non-pixel but object-oriented approach, in which not only information from a given pixel is analyzed, but also the context in which it is located.
An interesting issue not addressed in this study was also the attempt to classify newly attacked spruce trees (green attacks). The high classification results in this work, as well as the promising results of H. Abdullah’s team [8], may indicate this direction of work on the course of the gradation as the most forward-looking.
The analysis showed that between 2015 and 2018, in the entire analyzed area of the Tatra Mountains, 30% of coniferous forests were damaged, of which approximately 5% were cuts and windthrow areas and 25% snags, probably mainly due to the bark beetle.

Author Contributions

Conceptualization, R.M.-M., T.Z.-K. and M.K.; methodology, R.M.-M., T.Z.-K., M.K. and B.Z.; software, R.M.-M.; validation, R.M.-M., T.Z.-K.; formal analysis, R.M.-M., T.Z.-K. and M.K.; investigation, R.M.-M., T.Z.-K., M.K. and B.Z.; resources, R.M.-M., T.Z.-K., M.K. and B.Z.; data curation, R.M.-M., M.K., T.Z.-K.; writing—original draft preparation, B.Z., R.M.-M., T.Z.-K. and M.K.; writing—review and editing, B.Z., R.M.-M., T.Z.-K. and M.K.; visualization, R.M.-M., B.Z.; supervision, T.Z.-K., M.K. and B.Z.; project administration, B.Z.; funding acquisition, B.Z., M.K. All authors have read and agreed to the published version of the manuscript.

Funding

Please add: This research received no external funding; the publishing costs were covered by Faculty of Geography and Regional Studies University of Warsaw sources, which comes from the Polish Ministry of Education and Science (Ministerstwo Edukacji i Nauki).

Institutional Review Board Statement

Not applicable.

Informed Consent Statement

Not applicable.

Data Availability Statement

Satellite data are publicly available online: Sentinel-2 images were acquired from the Copernicus Open Access Hub (https://scihub.copernicus.eu accessed on 15 April 2019). Reference WorldView 2, orthophotomap and polygons (field data) are owned by the Tatra National Park. In the background of the maps, free availably data from the OpenStreetMap service were used (https://www.openstreetmap.org/ accessed on 26 October 2019).

Acknowledgments

The authors are also very grateful to the Tatra National Park for providing reference data and permits to conduct field research in the park. The authors express their gratitude to the editors and anonymous reviewers who contributed to the improvement of the article through their experience, work and comments.

Conflicts of Interest

The authors declare no conflict of interest.

References

  1. Caudullo, G.; Tinner, W.; de Rigo, D. Picea abies in Europe: Distribution, habitat, usage and threats. In European Atlas of Forest Tree Species; San-Miguel-Ayanz, J., de Rigo, D., Caudullo, G., Houston Durrant, T., Mauri, A., Eds.; The Publications Office of the European Union: Luxembourg, 2016; p. e012300+. Available online: https://forest.jrc.ec.europa.eu/media/atlas/Picea_abies.pdf (accessed on 15 July 2021).
  2. Bjerreskov, K.; Nord-Larsen, T.; Fensholt, R. Classification of Nemoral Forests with Fusion of Multi-Temporal Sentinel-1 and 2 Data. Remote Sens. 2021, 13, 950. [Google Scholar] [CrossRef]
  3. Wermelinger, B. Ecology and management of the spruce bark beetle Ips typographus—A review of recent research. For. Ecol. Manag. 2004, 202, 67–82. [Google Scholar] [CrossRef]
  4. Grodzki, W.; Fronek, W.G. Occurrence of Ips typographus (L.) after wind damage in the Kościeliska Valley of the Tatra National Park. For. Res. Pap. 2017, 78, 113–119. [Google Scholar] [CrossRef] [Green Version]
  5. Seidl, R.; Thom, D.; Kautz, M.; Martin-Benito, D.; Peltoniemi, M.; Vacchiano, G.; Wild, J.; Ascoli, D.; Petr, M.; Honkaniemi, J.; et al. disturbances under climate change. Nat. Clim. Chang. 2017, 7, 395–402. [Google Scholar] [CrossRef] [Green Version]
  6. Seidl, R.; Schelhaas, M.-J.; Lexer, M.J. Unraveling the drivers of intensifying forest disturbance regimes in Europe. Glob. Chang. Biol. 2011, 17, 2842–2852. [Google Scholar] [CrossRef]
  7. Grodzki, W.; Turčáni, M.; Jakuš, R.; Hlásny, T.; Raši, R.; McManus, M.L. Bark beetles in the Tatra Mountains. International research 1998–2005—An overview. Folia For. Pol. Ser. A 2010, 52, 114–130. [Google Scholar] [CrossRef]
  8. Abdullah, H.; Skidmore, A.K.; Darvishzadeh, R.; Heurich, M. Sentinel-2 accurately maps green-attack stage of European spruce bark beetle (Ips typographus, L.) compared with Landsat-8. Remote Sens. Ecol. Conserv. 2019, 5, 87–106. [Google Scholar] [CrossRef] [Green Version]
  9. Lausch, A.; Heurich, M.; Fahse, L. Spatio-temporal infestation patterns of Ips typographus (L.) in the Bavarian Forest National Park, Germany. Ecol. Indic. 2013, 31, 73–81. [Google Scholar] [CrossRef]
  10. Heurich, M. Progress of forest regeneration after a large-scale Ips typographus outbreak in the subalpine Picea abies forests of the Bavarian Forest National Park. Silva Gabreta 2009, 15, 49–66. [Google Scholar]
  11. Przybylska, K.; Kucharczyk, S. Lasy górskich parków narodowych jako przedmiot ochrony i obiekt badań naturalnych procesów lasotwórczych. Rocz. Bieszcz. 2007, 15, 15–33. [Google Scholar]
  12. Zagajewski, B.; Kluczek, M.; Raczko, E.; Njegovec, A.; Dabija, A.; Kycko, M. Comparison of Random Forest, Support Vector Machines, and Neural Networks for Post-Disaster Forest Species Mapping of the Krkonoše/Karkonosze Transboundary Biosphere Reserve. Remote Sens. 2021, 13, 2581. [Google Scholar] [CrossRef]
  13. Immitzer, M.; Vuolo, F.; Atzberger, C. First Experience with Sentinel-2 Data for Crop and Tree Species Classifications in Central Europe. Remote Sens. 2016, 8, 166. [Google Scholar] [CrossRef]
  14. Raczko, E.; Zagajewski, B. Tree Species Classification of the UNESCO Man and the Biosphere Karkonoski National Park (Poland) Using Artificial Neural Networks and APEX Hyperspectral Images. Remote Sens. 2018, 10, 1111. [Google Scholar] [CrossRef] [Green Version]
  15. Wessel, M.; Brandmeier, M.; Tiede, D. Evaluation of Different Machine Learning Algorithms for Scalable Classification of Tree Types and Tree Species Based on Sentinel-2 Data. Remote Sens. 2018, 10, 1419. [Google Scholar] [CrossRef] [Green Version]
  16. Brown, L.A.; Ogutu, B.O.; Dash, J. Estimating Forest Leaf Area Index and Canopy Chlorophyll Content with Sentinel-2: An Evaluation of Two Hybrid Retrieval Algorithms. Remote Sens. 2019, 11, 1752. [Google Scholar] [CrossRef] [Green Version]
  17. Ochtyra, A. Forest Disturbances in Polish Tatra Mountains for 1985–2016 in Relation to Topography, Stand Features, and Protection Zone. Forests 2020, 11, 579. [Google Scholar] [CrossRef]
  18. Hawryło, P.; Bednarz, B.; Wężyk, P.; Szostak, M. Estimating defoliation of Scots pine stands using machine learning methods and vegetation indices of Sentinel-2. Eur. J. Remote Sens. 2018, 51, 194–204. [Google Scholar] [CrossRef] [Green Version]
  19. Senf, C.; Seidl, R.; Hostert, P. Remote sensing of forest insect disturbances: Current state and future directions. Int. J. Appl. Earth Obs. Geoinf. 2017, 60, 49–60. [Google Scholar] [CrossRef] [Green Version]
  20. Liang, L.; Hawbaker, T.J.; Zhu, Z.; Li, X.; Gong, P. Forest disturbance interactions and successional pathways in the Southern Rocky Mountains. For. Ecol. Manag. 2016, 375, 35–45. [Google Scholar] [CrossRef] [Green Version]
  21. Meddens, A.J.H.; Hicke, J.A.; Vierling, L.A.; Hudak, A.T. Evaluating methods to detect bark beetle-caused tree mortality using single-date and multi-date Landsat imagery. Remote Sens. Environ. 2013, 132, 49–58. [Google Scholar] [CrossRef]
  22. Havašová, M.; Bucha, T.; Ferenčík, J.; Jakuš, R. Applicability of a vegetation indices-based method to map bark beetle outbreaks in the High Tatra Mountains. Ann. For. Res. 2015, 58, 295–310. [Google Scholar] [CrossRef]
  23. Mikusiński, G.; Bubnicki, J.W.; Churski, M.; Czeszczewik, D.; Walankiewicz, W.; Kuijper, D.P.J. Is the impact of loggings in the last primeval lowland forest in Europe underestimated? The conservation issues of Białowieża Forest. Biol. Conserv. 2018, 227, 266–274. [Google Scholar] [CrossRef]
  24. Immitzer, M.; Atzberger, C. Early Detection of Bark Beetle Infestation in Norway Spruce (Picea abies, L.) using WorldView-2 Data; Frühzeitige Erkennung von Borkenkä ferbefall an Fichten mittels WorldView-2 Satellitendaten. Photogramm. Fernerkund. Geoinf. 2014, 5, 351–367. [Google Scholar] [CrossRef]
  25. Kycko, M.; Zagajewski, B.; Zwijacz-Kozica, M.; Cierniewski, J.; Romanowska, E.; Orłowska, K.; Ochtyra, A.; Jarocińska, A. Assessment of Hyperspectral Remote Sensing for Analyzing the Impact of Human Trampling on Alpine Swards. Mt. Res. Dev. 2017, 37, 66–74. [Google Scholar] [CrossRef] [Green Version]
  26. Sproull, G.J.; Bukowski, M.; Mcnutt, N.; Zwijacz-Kozica, T.; Szwagrzyk, J. Landscape-Level Spruce Mortality Patterns and Topographic Forecasters of Bark Beetle Outbreaks in Managed and Unmanaged Forests of the Tatra Mountains. Pol. J. Ecol. 2017, 65, 24–37. [Google Scholar] [CrossRef]
  27. Holeksa, J.; Jaloviar, P.; Kucbel, S.; Saniga, M.; Svoboda, M.; Szewczyk, J.; Szwagrzyk, J.; Zielonka, T.; Żywiec, M. Models of disturbance driven dynamics in the West Carpathian spruce forests. For. Ecol. Manag. 2017, 388, 79–89. [Google Scholar] [CrossRef]
  28. Nikolov, C.; Konôpka, B.; Kajba, M.; Galko, J.; Kunca, A.; Janský, L. Post-disaster Forest Management and Bark Beetle Outbreak in Tatra National Park, Slovakia. Mt. Res. Dev. 2014, 34, 326–335. [Google Scholar] [CrossRef]
  29. Kaufman, Y.J.; Tanre, D. Atmospherically resistant vegetation index (ARVI) for EOS-MODIS. IEEE Trans. Geosci. Remote Sens. 1992, 30, 261–270. [Google Scholar] [CrossRef]
  30. Yang, C.; Everitt, J.H.; Bradford, J.M.; Murden, D. Airborne Hyperspectral Imagery and Yield Monitor Data for Mapping Cotton Yield Variability. Precis. Agric. 2004, 5, 445–461. [Google Scholar] [CrossRef]
  31. Gitelson, A.A.; Kaufman, Y.J.; Merzlyak, M.N. Use of a green channel in remote sensing of global vegetation from EOS-MODIS. Remote Sens. Environ. 1996, 58, 289–298. [Google Scholar] [CrossRef]
  32. Huete, A.A.; Liu, H.Q.; Batchily, K.; van Leeuwen, W. A comparison of vegetation indices over a global set of TM images for EOS-MODIS. Remote Sens. Environ. 1997, 59, 440–451. [Google Scholar] [CrossRef]
  33. Miura, T.; Yoshioka, H.; Fujiwara, K.; Yamamoto, H. Inter-Comparison of ASTER and MODIS Surface Reflectance and Vegetation Index Products for Synergistic Applications to Natural Resource Monitoring. Sensors 2008, 8, 2480. [Google Scholar] [CrossRef] [PubMed] [Green Version]
  34. Sripada, R.P.; Heiniger, R.W.; White, J.G.; Meijer, A.D. Aerial Color Infrared Photography for Determining Early In-Season Nitrogen Requirements in Corn. Agron. J. 2006, 98, 968–977. [Google Scholar] [CrossRef]
  35. Rouse, W.; Haas, R.H.; Deering, D.W. Monitoring Vegetation Systems in the Great Plains with ERTS, NASA SP-351. Third ERTS-1 Symp. In NASA Special Publication; NASA: Washington, DC, USA, 1974; Volume 1, pp. 309–317. [Google Scholar]
  36. Hunt, E.R.; Cavigelli, M.; Daughtry, C.S.T.; Mcmurtrey, J.E.; Walthall, C.L. Evaluation of Digital Photography from Model Aircraft for Remote Sensing of Crop Biomass and Nitrogen Status. Precis. Agric. 2005, 6, 359–378. [Google Scholar] [CrossRef]
  37. Huete, A.R. A soil-adjusted vegetation index (SAVI). Remote Sens. Environ. 1988, 25, 295–309. [Google Scholar] [CrossRef]
  38. Gobron, N.; Pinty, B.; Verstraete, M.M.; Widlowski, J.-L. Advanced vegetation indices optimized for up-coming sensors: Design, performance, and applications. IEEE Trans. Geosci. Remote Sens. 2000, 38, 2489–2505. [Google Scholar] [CrossRef]
  39. Vincini, M.; Frazzi, E.; D’Alessio, P. A broad-band leaf chlorophyll vegetation index at the canopy scale. Precis. Agric. 2008, 9, 303–319. [Google Scholar] [CrossRef]
  40. Datt, B. A New Reflectance Index for Remote Sensing of Chlorophyll Content in Higher Plants: Tests using Eucalyptus Leaves. J. Plant Physiol. 1999, 154, 30–36. [Google Scholar] [CrossRef]
  41. Daughtry, C.S.T.; Walthall, C.L.; Kim, M.S.; de Colstoun, E.B.; McMurtrey III, J.E. Estimating Corn Leaf Chlorophyll Concentration from Leaf and Canopy Reflectance. Remote Sens. Environ. 2000, 74, 229–239. [Google Scholar] [CrossRef]
  42. Haboudane, D.; Miller, J.R.; Pattey, E.; Zarco-Tejada, P.J.; Strachan, I.B. Hyperspectral vegetation indices and novel algorithms for predicting green LAI of crop canopies: Modeling and validation in the context of precision agriculture. Remote Sens. Environ. 2004, 90, 337–352. [Google Scholar] [CrossRef]
  43. Zagajewski, B.; Kycko, M.; Tømmervik, H.; Bochenek, Z.; Wojtuń, B.; Bjerke, J.W.; Kłos, A. Feasibility of hyperspectral vegetation indices for the detection of chlorophyll concentration in three high Arctic plants: Salix polaris, Bistorta vivipara, and Dryas octopetala. Acta Soc. Bot. Pol. 2018, 87, 3604. [Google Scholar] [CrossRef]
  44. Metternicht, G. Vegetation indices derived from high-resolution airborne videography for precision crop management. Int. J. Remote Sens. 2003, 24, 2855–2877. [Google Scholar] [CrossRef]
  45. Galvão, L.S.; Formaggio, A.R.; Tisot, D.A. Discrimination of sugarcane varieties in Southeastern Brazil with EO-1 Hyperion data. Remote Sens. Environ. 2005, 94, 523–534. [Google Scholar] [CrossRef]
  46. Hunt Jr., E.; Rock, B. Detection of changes in leaf water content using Near- and Middle-Infrared reflectances☆. Remote Sens. Environ. 1989, 30, 43–54. [Google Scholar] [CrossRef]
  47. Trombetti, M.; Riano, D.; Rubio, M.; Cheng, Y.; Ustin, S. Multi-temporal vegetation canopy water content retrieval and interpretation using artificial neural networks for the continental USA. Remote Sens. Environ. 2008, 112, 203–215. [Google Scholar] [CrossRef]
  48. Hardisky, M.; Klemas, V.; Smart, R. The Influences of Soil Salinity, Growth Form, and Leaf Moisture on the Spectral Reflectance of Spartina Alterniflora Canopies. Photogramm. Eng. Remote Sens. 1983, 49, 77–83. [Google Scholar]
  49. Cocke, A.E.; Fulé, P.Z.; Crouse, J.E. Comparison of burn severity assessments using Differenced Normalized Burn Ratio and ground data. Int. J. Wildl. Fire 2005, 14, 189–198. [Google Scholar] [CrossRef] [Green Version]
  50. Caret: Classification and Regression Training; R Package Version 6.0-86. Available online: https://rdrr.io/cran/caret/ (accessed on 20 January 2020).
  51. Gaujoux, R. Rngtools: Utility Functions for Working with Random Number Generators; R Package Version 1.5. 2020. Available online: https://rdrr.io/rforge/rngtools/ (accessed on 20 January 2020).
  52. Wickham, H.; François, R.; Henry, L.; Müller, K. Dplyr: A Grammar of Data Manipulation; R Package Version 1.0.0. 2020. Available online: https://rdrr.io/cran/dplyr/ (accessed on 20 January 2020).
  53. Nielsen, A.A.; Conradsen, K.; Simpson, J.J. Multivariate Alteration Detection (MAD) and MAF Postprocessing in Multispectral, Bitemporal Image Data: New Approaches to Change Detection Studies. Remote Sens. Environ. 1998, 64, 1–19. [Google Scholar] [CrossRef] [Green Version]
  54. Yan, L.; Xia, W.; Zhao, Z.; Wang, Y. A Novel Approach to Unsupervised Change Detection Based on Hybrid Spectral Difference. Remote Sens. 2018, 10, 841. [Google Scholar] [CrossRef] [Green Version]
  55. Switzer, P.; Green, A.A. Min/Max Autocorrelation Factors for Multivariate Spatial Imagery; Technical Report SWI NSF 6; Stanford University: Stanford, CA, USA, 1984; p. 16. [Google Scholar]
  56. Nielsen, A.A. The Regularized Iteratively Reweighted MAD Method for Change Detection in Multi- and Hyperspectral Data. IEEE Trans. Image Process. 2007, 16, 463–478. [Google Scholar] [CrossRef] [Green Version]
  57. Meyer, D.; Dimitriadou, E.; Hornik, K.; Weingessel, A.; Leisch, F. e1071: Misc Functions of the Department of Statistics, Probability Theory Group (Formerly: E1071); R Package Version 1.7-3; TU: Wien, Austria, 2019; Available online: https://rdrr.io/rforge/e1071/ (accessed on 20 January 2020).
  58. Zhan, Z.; Yu, L.; Li, Z.; Ren, L.; Gao, B.; Wang, L.; Luo, Y. Combining GF-2 and Sentinel-2 Images to Detect Tree Mortality Caused by Red Turpentine Beetle during the Early Outbreak Stage in North China. Forests 2020, 11, 172. [Google Scholar] [CrossRef] [Green Version]
  59. Yu, L.; Huang, J.; Zong, S.; Huang, H.; Luo, Y. Detecting Shoot Beetle Damage on Yunnan Pine Using Landsat Time-Series Data. Forests 2018, 9, 39. [Google Scholar] [CrossRef] [Green Version]
  60. Marx, A.; Kleinschmit, B. Sensitivity analysis of RapidEye spectral bands and derived vegetation indices for insect defoliation detection in pure Scots pine stands. iForest-Biogeosci. For. 2017, 10, 659–668. [Google Scholar] [CrossRef] [Green Version]
  61. Näsi, R.; Honkavaara, E.; Blomqvist, M.; Lyytikäinen-Saarenmaa, P.; Hakala, T.; Viljanen, N.; Kantola, T.; Holopainen, M. Remote sensing of bark beetle damage in urban forests at individual tree level using a novel hyperspectral camera from UAV and aircraft. Urban For. Urban Green. 2018, 30, 72–83. [Google Scholar] [CrossRef]
  62. Rębiś, P. Assessment of Nonparametric Algorithms for Deadwood Identification on the HySpex Hyperspectral Aerial Image. Master’s Thesis, University of Warsaw, Faculty of Geography and Regional Studies, Warsaw, Poland, 16 July 2018; p. 73. [Google Scholar]
  63. Dabija, A.; Kluczek, M.; Zagajewski, B.; Raczko, E.; Kycko, M.; Al-Sulttani, A.H.; Tardà, A.; Pineda, L.; Corbera, J. Comparison of Support Vector Machines and Random Forests for Corine Land Cover Mapping. Remote Sens. 2021, 13, 777. [Google Scholar] [CrossRef]
  64. Kycko, M.; Zagajewski, B.; Lavender, S.; Dabija, A. In Situ Hyperspectral Remote Sensing for Monitoring of Alpine Trampled and Recultivated Species. Remote Sens. 2019, 11, 1296. [Google Scholar] [CrossRef] [Green Version]
  65. Marcinkowska-Ochtyra, A.; Zagajewski, B.; Raczko, E.; Ochtyra, A.; Jarocińska, A. Classification of High-Mountain Vegetation Communities within a Diverse Giant Mountains Ecosystem Using Airborne APEX Hyperspectral Imagery. Remote Sens. 2018, 10, 570. [Google Scholar] [CrossRef] [Green Version]
Figure 1. Location of the research area. Explanation: (a) the border between Poland and Slovakia; it also runs along the border between the Polish Tatra National Park and the Slovak TANAP; (b) the border of the Polish Tatra National Park; (c) border of the Slovak TANAP; (d) Sentinel-2 image range; brown polygon range of Figure 4. A map from OpenStreetMap was used in the background.
Remotesensing 13 03314 g001
Figure 2. Research schema.
Remotesensing 13 03314 g002
Figure 3. Sentinel-2 image-based map of the Tatra land cover: (a) country border; (b) border of the Polish TPN; (c) border of the Slovak TANAP; (1) snags; (2) coniferous forests; (3) deciduous forests; (4) grasslands; (5) rocks; (6) cuts or windthrow areas. A map from OpenStreetMap was used in the background and Sentinel-2 RGB 432 composition, 3 October 2015.
Remotesensing 13 03314 g003
Figure 4. A visual presentation of the results obtained from used algorithms on a fragment of the Sentinel-2 scene. Fresh snags are marked in yellow (mainly as a result of bark beetle outbreak), and the cuts/windthrow area class in red. The green line marks the area of strict protection of the Tatra National Park. The geographical range of the image is presented on Figure 1; background: orthophotomap from 2017.
Remotesensing 13 03314 g004
Figure 5. Increase of informationality of remote-sensing indices measured by OA and F1-score for analyzed classes (indices are presented in the order of informationality: from the most significant SAVI on the left, to the least significant DSWI). Red marked indices were not used for analyses.
Remotesensing 13 03314 g005
Figure 6. Map of the bark beetle outbreak in 2017 for the Tatras: (a) country border; (b) border of the Polish TPN; (c) border of the Slovak TANAP; (1) snags; (2) undisturbed coniferous forest; (3) cuts or windthrow areas. A map from OpenStreetMap was used in the background and Sentinel-2 RGB 432 composition acquired on 2 October 2017.
Remotesensing 13 03314 g006
Figure 7. Share of undisturbed forest, snags and cuts/windthrow in the following years for the entire analyzed area.
Remotesensing 13 03314 g007
Figure 8. Map of coniferous forest degradation in the period of 2015–2018: (a) country border; (b) border of the Polish TPN; (c) border of the Slovak TANAP; (1) undisturbed coniferous forests; (2) damages observed in 2015; (3) damages caused in 2016; (4) damages caused in 2017; (5) damages caused in 2018. A map from OpenStreetMap was used in the background and Sentinel-2 RGB 432 composition, 15 October 2018.
Remotesensing 13 03314 g008
Table 1. Number of reference polygons and pixels by a class for the 2015 Sentinel-2 image classification.
ClassNumber of Reference PolygonsNumber of Reference Pixels
Coniferous forests399892
Deciduous forests263114
Grasslands609291
Rocks409443
Snags402347
Cuts or windthrow325440
Table 2. Number of reference polygons and pixels between 2015 and 2017 used for change detection.
ClassNumber of Reference PolygonsNumber of Reference Pixels
No changes4021,301
Dieback of trees 481260
Cuts or windthrow521865
Table 3. Remote sensing indices used for forest analysis. Explanation: blue: Sentinel-2 band no. 2, green: 3, red: 4, Red Edge (RE1): 5, Red Edge (RE2): 6, REDEDGE: 7, NIR: 8, SWIR1: 11, SWIR2: 12.
IndexFormulaReference
Atmospherically Resistant Vegetation Index (ARVI)   N I R ( 2 R E D B L U E ) N I R + ( 2 R E D B L U E ) [29]
Blue Normalized Difference Vegetation Index (BNDVI) N I R B L U E N I R + B L U E [30]
Green Normalized Difference Vegetation Index (GNDVI) N I R G R E E N N I R + G R E E N [31]
Enhanced Vegetation Index (EVI)   2.5 ( N I R R E D N I R + 6 R E D 7.5 B L U E + 1 ) [32]
Enhanced Vegetation Index 2 (EVI 2) 2.4 ( N I R R E D N I R + R E D + 1 ) [33]
Green Soil Adjusted Vegetation Index (GSAVI) 1.725 ( N I R G R E E N N I R + G R E E N + 0.725 ) [34]
Normalized Difference Vegetation Index (NDVI)   N I R R E D N I R + R E D [35]
Normalized Green-Red Difference Index (NGRDI) G R E E N R E D G R E E N + R E D [36]
Soil Adjusted Vegetation Index (SAVI) 1.428 ( N I R R E D N I R + R E D + 0.428 ) [37]
Simple Ratio / Short Wave Infrared (SR/SWIR) S W I R 1 S W I R 2 [8]
Green Leaf Index (GLI) 2 ( G R E E N R E D B L U E G R E E N + R E D + B L U E ) [38]
Chlorophyll Vegetation Index (CVI)   N I R R E D G R E E N G R E E N [39]
Leaf Chlorophyll Index (LCI) N I R R E D E D G E N I R + R E D [40]
Modified Chlorophyll Absorption in Reflectance Index (MCARI) ( R E 1 R E D 0.2 ( R E 1 G R E E N ) ) ( R E 1 R E D ) [41]
Modified Chlorophyll Absorption in Reflectance Index 2 (MCARI 2) 1.2 ( 2.5 ( N I R R E D ) 1.3 ( N I R G R E E N ) ) [42,43]
Normalized Difference Red-Edge 2 (NDRE 2) N I R R E 2 N I R + R E 2 [8]
Transformed Chlorophyll Absorption Radio Index (TCARI) 3 ( R E 1 R E D 0.2 ( R E 1 G R E E N ) R E 1 R E D ) [42]
Plant Pigment Ratio (PPR) G R E E N B L U E G R E E N + B L U E [44]
Disease Water Stress Index (DSWI) N I R + G R E E N S W I R 1 R E D [45]
Moisture Stress Index (MSI)   S W I R 1 N I R [46]
Moisture Stress Index 2 (MSI 2) S W I R 2 N I R [47]
Normalized Difference Infrared Index (NDII) N I R S W I R 1 N I R + S W I R 1 [48]
Normalized Difference Infrared Index 2 (NDII 2)
Normalized Burn Ratio (NBR)
N I R S W I R 2 N I R + S W I R 2 [49]
Table 4. Error matrix for the Tatra land cover classification based on the Sentinel-2 image (3 October 2015); overall accuracy 97%, Kappa coefficient 0.96. Explanation: UA—user accuracy; PA—producer accuracy.
Reference DataUA (%)
SnagsConiferous ForestDeciduous ForestGrasslandsRocksCuts or Windthrow
Snags541011298047490.2
Coniferous forests224,95852197299.4
Deciduous forests0113687218103795.4
Grasslands12019120,0801849096.6
Rocks2300222,0544699.7
Cuts or windthrow2112159713111,79892.6
PA (%)95.699.596.696.198.591.8
Table 5. Share of individual forms of land cover of the Tatra Mountains (both national Parks: TPN, TANAP), source: Sentinel-2 3 October 2015.
ClassArea (km2)Percentage (%)
Snags48.659.21
Coniferous forests (c forest)223.3942.27
Deciduous forests66.5412.59
Grasslands120.9322.88
Rocks1.890.36
Cuts or windthrow67.0812.69
Table 6. Comparison of the accuracy of different methods of detecting changes between 2015 and 2017.
MethodOA (%)Kappa
Coefficient
Snags
F1-Score (%)
Coniferous Forests
F1-Score (%)
Cuts or Windthrow
F1-Score (%)
Raster stacking99.10.9796.999.895.2
Remote sensing indices99.00.9796.499.993.8
iMAD99.00.9796.399.993.6
MAD98.50.9695.299.493.8
MAD/MAF98.50.9695.199.493.7
Spectral features obtained from Sentinel-2 2015 and SVM classified on Sentinel-2 201793.80.7770.499.858.8
Table 7. Snags and cuts/windthrow class statistics of the Polish (TPN) and Slovak (TANAP) Tatra National Parks. Data presented in hectares. Acquired on the SVM classification based on the 15 remote sensing indices.
ClassTPN (ha)TANAP (ha)Sum (ha)
Undisturbed coniferous forest6014.4613,546.4319,560.89
Snags726.47822.001548.47
Cuts or windthrow236.18951.641187.82
Table 8. Classification of the gradation of cambiophagous insect’s assessment of results. Explanation: OA—Overall Accuracy; PA —Producer Accuracy; UA—User Accuracy.
ReferenceSensorResearch TargetClassification Method OA (%) Snags
PA (%)
Snags
UA (%)
[23] Sentinel-2 Ips tyhographus, snags SVM 97 91.71 90.72
[21] Landsat TM, ETM+ Dendroctonus ponderosae, snags ML 91 88.3 93.7
[24] WorldView-2 Ips tyhographus, green phase of the bark beetle attack and snags RF 76.2 100 100
[22] Landsat TM, ETM+ Ips typographus, snags. MSI, VCI, NDMI–threshold 94
[59] Landsat TM, ETM+, OLI Tomicus yunnanensis and Tomicus minor MSI 86.38
[62] WorldView-2 Ips tyhographus, snags, mountain pine. SVM 86.6 86.75 100
[58] Sentinel-2 Dendroctonus valens: three classes: 0%,
0–15%, 15–50% of dead trees
SVM 59.5 - -
[58] Sentinel-2 Dendroctonus valens: two classes: 0%,
15–50%
SVM 81 - -
[58] GaoFen-2 as above, additionally: alive, attacked and dead tree SVM 77.7 - -
the current study Sentinel-2 Ips tyhographus, snags, cuts and windthrow SVM 97.2 95.6 90.2
Publisher’s Note: MDPI stays neutral with regard to jurisdictional claims in published maps and institutional affiliations.

