Article

The Ongoing Greening in Southwest China despite Severe Droughts and Drying Trends

1
Collaborative Innovation Center on Forecast and Evaluation of Meteorological Disaster, School of Geographical Sciences, Nanjing University of Information Science & Technology, Nanjing 210044, China
2
School of Remote Sensing and Geomatics Engineering, Nanjing University of Information Science & Technology, Nanjing 210044, China
*
Author to whom correspondence should be addressed.
Remote Sens. 2021, 13(17), 3374; https://0-doi-org.brum.beds.ac.uk/10.3390/rs13173374
Submission received: 11 July 2021 / Revised: 21 August 2021 / Accepted: 22 August 2021 / Published: 25 August 2021

Abstract

:
Vegetation greening, which refers to the interannual increasing trends of vegetation greenness, has been widely found on the regional to global scale. Meanwhile, climate extremes, especially several drought, significantly damage vegetation. The Southwest China (SWC) region experienced massive drought from 2009 to 2012, which severely damaged vegetation and had a huge impact on agricultural systems and life. However, whether these extremes have significantly influenced long-term (multiple decades) vegetation change is unclear. Using the latest remote sensing-based records, including leaf area index (LAI) and gross primary productivity (GPP) for 1982–2016 and enhanced vegetation index (EVI) for 2001–2019, drought events of 2009–2012 only leveled off the greening (increasing in vegetation indices and GPP) temporally and long-term greening was maintained. Meanwhile, drying trends were found to unexpectedly coexist with greening.

Graphical Abstract

1. Introduction

As an important part of the terrestrial ecosystem, vegetation absorbs CO2 through photosynthesis and fixes it on organic matter, which slows the enhancement of global CO2 and plays an important role in the global carbon cycle and climate change [1,2,3]. In recent years, as indicated by remote sensing observations, the positive trends of vegetation indices over decades—known as greening—has been widely reported, from the regional to global scale [4,5,6]. The main driving factors of global greening are the effects of CO2 fertilization, nitrogen deposition, climate change, and land management [5,7].
Extreme climate events, especially drought, have adverse effects on the stability of terrestrial ecosystems, resulting in a decline in vegetation indices and productivity; they could even reverse the greening to browning in some cases [8,9,10]. The frequency and intensity of extreme drought events have exhibited generally increasing trends with global warming based on historical records and future projections [11,12,13]. Some previous studies have explored the impact of extreme drought events on vegetation. A very serious vegetation damage phenomenon was found in the entire tropical region of South America in 2010. Compared with 2008, the net primary productivity of the Amazon Forest area in 2010 dropped by an average of 7% [14]. Multiple carbon cycle models showed that during 2011–2012, the net ecosystem productivity was −0.24 PgC/year and −0.17 PgC/year in North America, that is, due to the impact of extreme drought, the area had become a carbon source during this period [15]. In southern China, due to the drought and high temperatures in the summer of 2013, the terrestrial carbon sink in July and August decreased by 101.54 Tg C, which accounted for about 50% of the net carbon sink in the terrestrial ecosystem in China [16].
However, the phenomenon of greening on a global scale has been widely reported. A rising question is that although the destructive effects of these drought events on vegetation in the short-term are obvious, do they have a significant impact on long-term changes?
In Southwest China (SWC), severe drought events that occurred between 2009 and 2012 had a very large impact on the region’s ecosystems [17,18,19]. Due to the severity of the drought, a numbers of studies investigated the meteorological mechanism, intensity, extent, and duration of the drought; and the destruction in vegetation, the economy and society. As far as the ecosystem is concerned, this damage is all-round, including cropland and natural vegetation.
At present, nearly 10 years have passed since the drought events, and long-term vegetation records can be used to describe the subsequent vegetation development in the area. Therefore, the objective of this study is to answer the rising question: will drought events affect long-term vegetation trends? If not, what are the factors dominating the trend of vegetation greening in the area? In the following context, we will identify the severity of drought events in different areas of SWC from 2009 to 2012 and the changes in dryness and wetness in SWC, compare the response of vegetation to drought events and the impact of drought events on long-term vegetation trends, and investigate the main driving factors that affect vegetation trends in SWC.

2. Materials and Methods
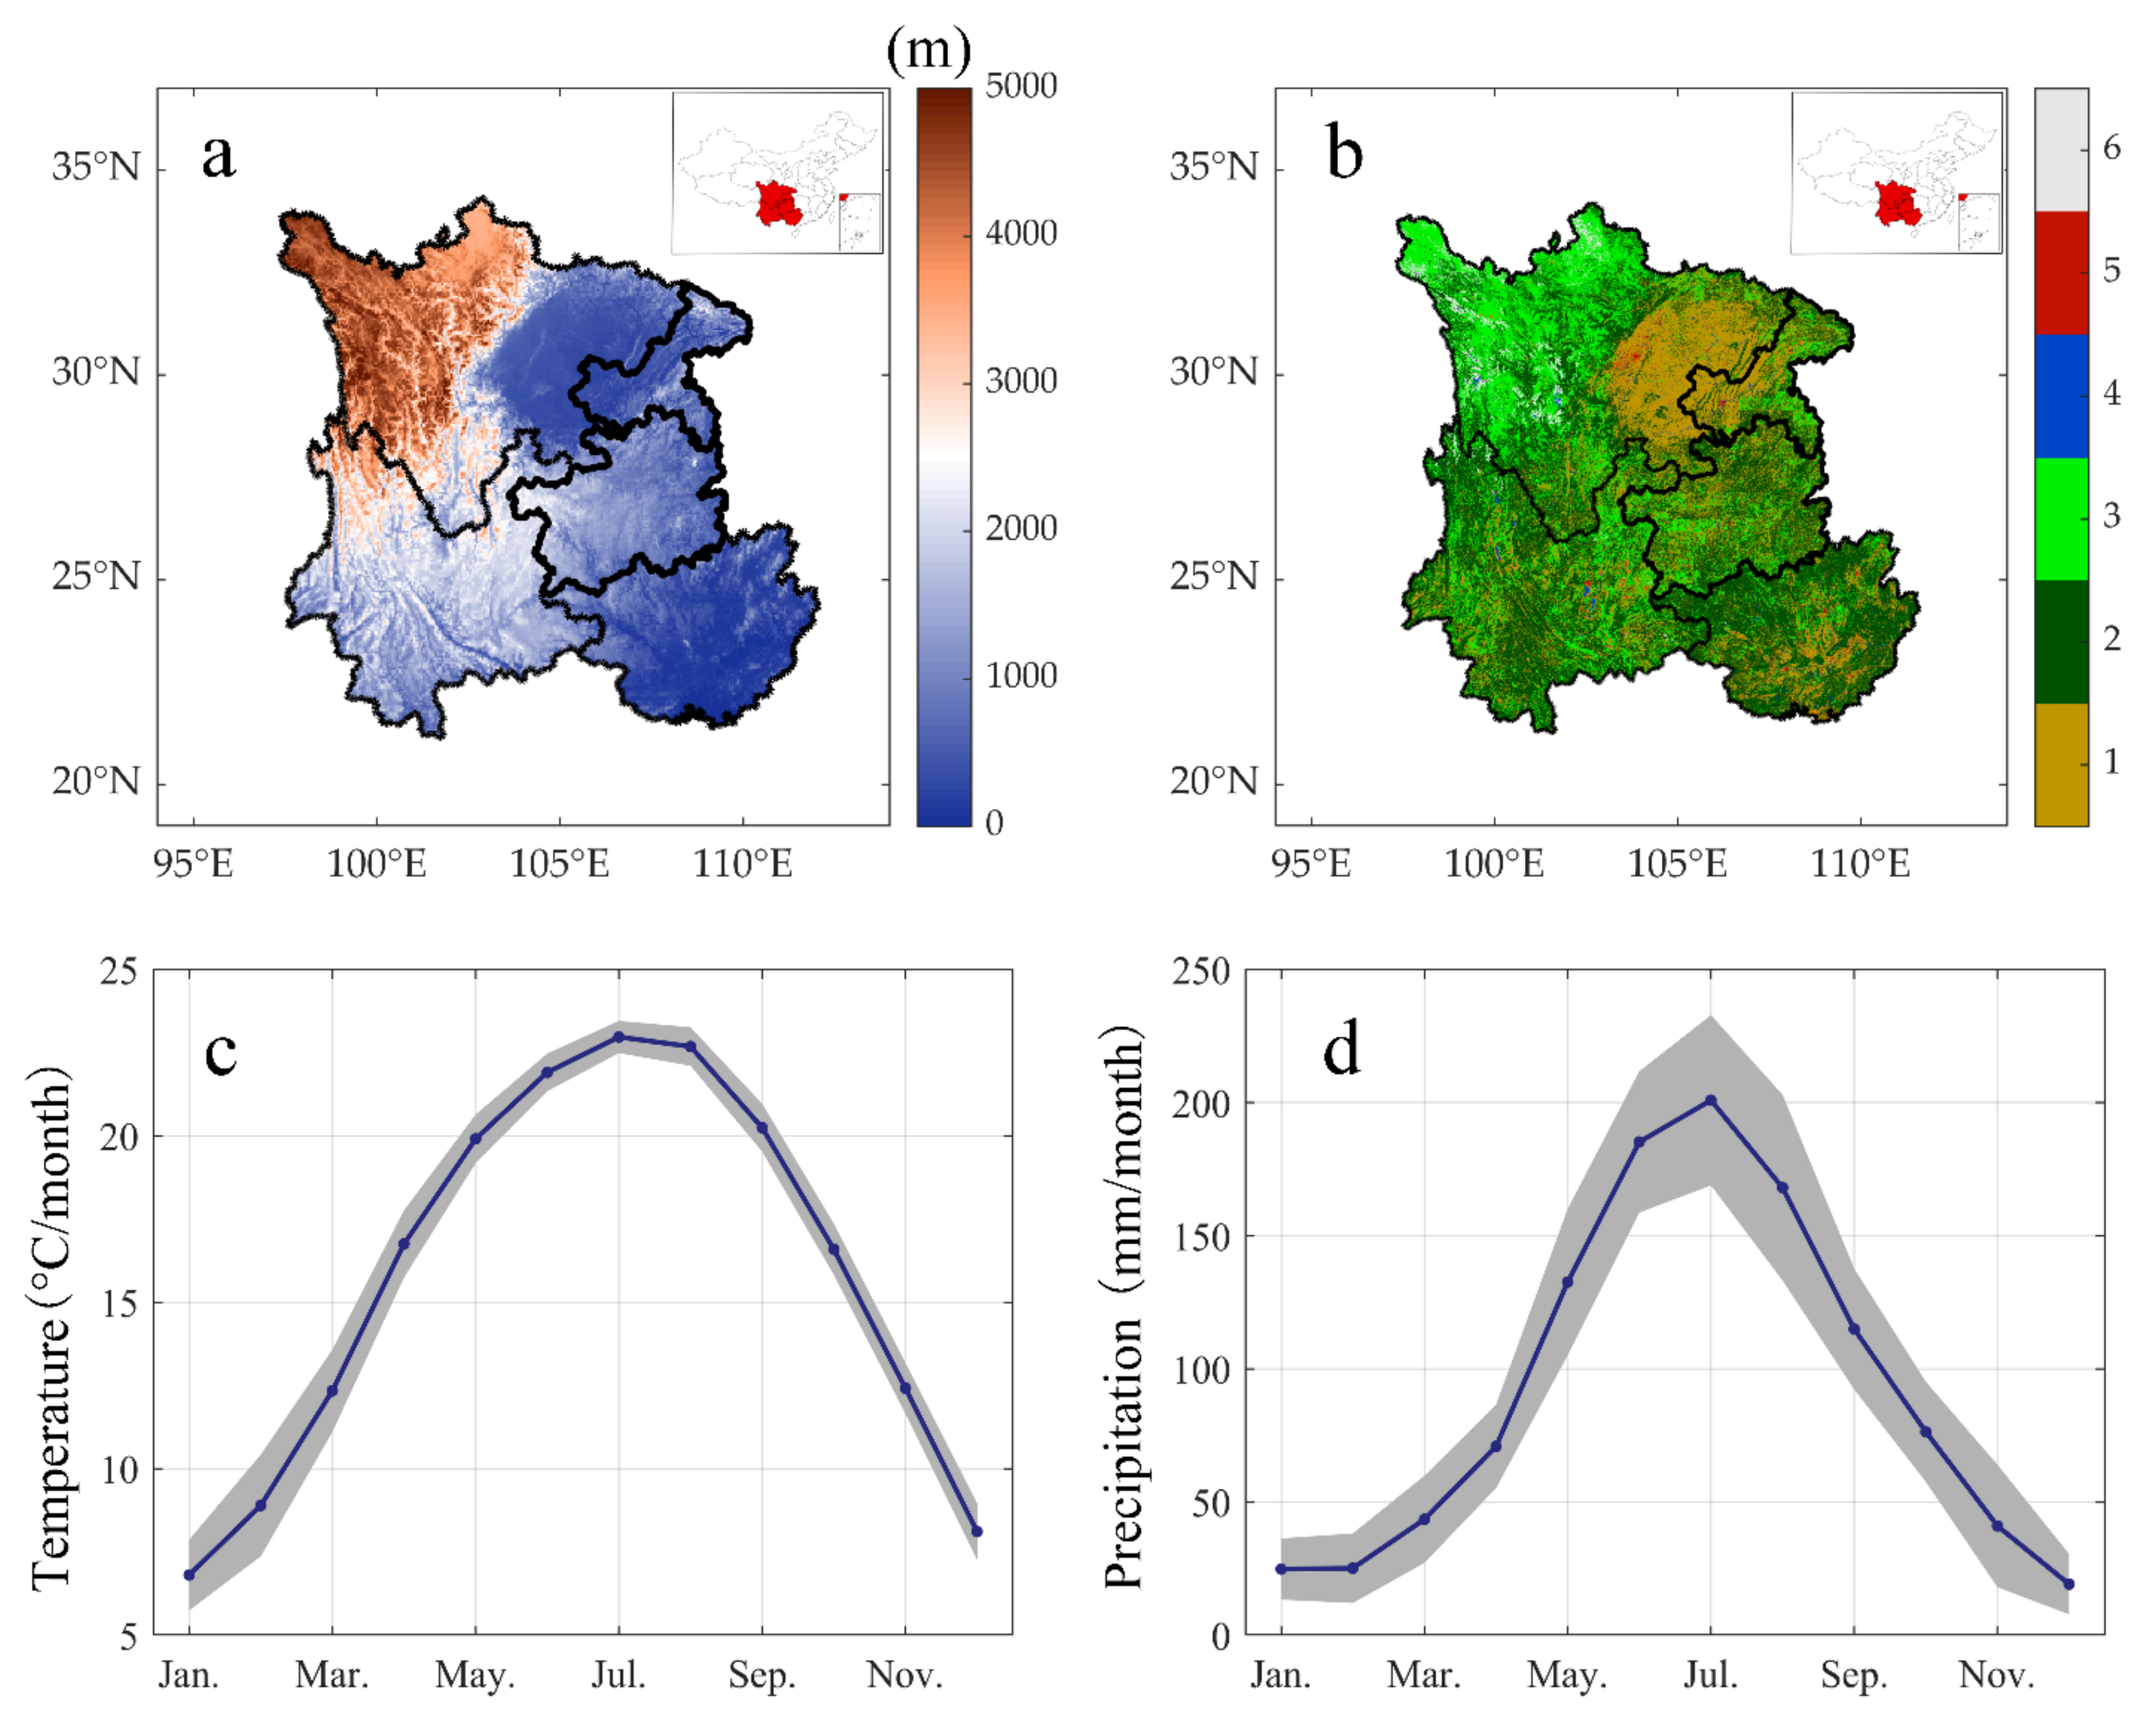
2.1. Study Area

Southwest China usually includes Sichuan, Yunnan, Guizhou, Guangxi, and Chongqing, covering an area of approximately 1.37 million km2, accounting for approximately 14.3% of the China’s land territory (Figure 1a). SWC is close to the Qinghai–Tibet Plateau, and the altitude gradually increases from southeast to northwest. The area is affected by the summer monsoon where rain and heat occur at the same time, the annual precipitation reaches about 1100 mm, and the peaks all appear in July (Figure 1c,d). The main vegetation types in this area are cropland, forest, and grassland. In order to reduce the influence of altitude on temperature and precipitation so as to better analyze the response of vegetation, we selected areas with an altitude of <3000 m as the study area [20].

2.2. Vegetation Data

Previous studies have proposed various indicators to characterize vegetation based on remote sensing data; these indicators have different ecological significance [21,22]. In this study, LAI, EVI, and GPP are used to characterize vegetation coverage, vegetation greenness, and vegetation productivity; detailed information of the original data is shown in Table 1. The LAI data came from the Global Agricultural Monitoring System (GIMMS) LAI3g, which was based on GIMMS NDVI3g and artificial neural network model inversion [23]. Due to its high accuracy and long coverage time, it is widely used in various research works. EVI was obtained from the Moderate Resolution Imaging Spectroradiometer (MODIS) Terra MOD13C2 product; the use of this data is mainly based on the following two considerations: (1) Compared with NDVI, EVI can solve the problem that NDVI may be saturated in densely-vegetated areas to a certain extent, the vegetation coverage in the study area is high, and saturation of NDVI may occur; (2) one of the purposes of this research is to explore the impact of drought events on long-term vegetation trends. A major drought in SWC occurred from 2009 to 2012. The vegetation change trend after drought events is particularly important, and EVI products continue to be updated, so that we can explore the changes in vegetation after 2012. The GPP came from the GPP product developed by Zheng et al. (2020) [24]; the dataset was based on the revised EC–LUE model, and took into account some environmental factors, such as the CO2 fertilization effect, the difference between sunlit leaves and shaded leaves.
The time ranges of vegetation datasets used in this study were LAI (1982–2016), EVI (2000–2019), and GPP (1982–2016). All vegetation data were resampled to 0.5 degrees and the time resolution was unified to a monthly scale to meet time and space consistency.

2.3. Meteorological Data

The main climatic factors that affect vegetation changes generally include temperature, precipitation, and radiation [7]. The focus of this study is to explore the impact of drought events on vegetation and radiation is usually highly correlated with temperature and precipitation. Therefore, this study chose hydrothermal conditions as the climate indicators. The temperature and precipitation data were derived from datasets developed by the China Meteorological Administration and the National Meteorological Information Center based on observational data (https://data.cma.cn, accessed on 23 March 2021); spatial resolution is 0.5 degrees, the time resolution is on a monthly scale, and the time range is 1982–2019.

2.4. Land Management and Land Use Data

In addition to the significant impact of climate change on vegetation, some previous studies have also explained the positive impact of land management on vegetation [25,26]. Land management involves many aspects, including ecological engineering, economic management of natural vegetation, as well as selection of seeds, irrigation, fertilization, and pesticides. At present, there is no high-quality dataset that characterizes land management with continuous time and space; therefore, we selected agricultural and forestry data released by the National Bureau of Statistics of China to express the impact of land management. These data include the sown area of crops, crop yield and output value, consumption of pesticide and fertilizer, total power of agricultural machinery, total afforestation area, artificial afforestation, and forest area in SWC. Among them, the agricultural data are from 2006 (or 2001) to 2019, and the forestry data are from 2004 to 2019. In addition to the data released by the National Bureau of Statistics of China, we also used the national 1 km multi-temporal land use status database developed by the Data Center for Resources and Environmental Sciences, Chinese Academy of Sciences (RESDC) (http://www.resdc.cn/, accessed on 22 March 2021), which includes 1980, 1990, 1995, 2000, 2005, 2010, and 2015. The main land cover types are cropland (paddy field and dry field), forest, grassland, water body, built–up land, and unused land (Figure 1b). This dataset was based on the visual interpretation of remote sensing satellite images and can be used to study the long-term change status of land use to better attribute the driving factors of vegetation change in SWC. We resampled the land use data to 0.5 degrees, and the value of each pixel represents the area (km2) of a certain cover type.

2.5. Standardized Precipitation Evapotranspiration Index (SPEI)

SPEI is an extension of the Standardized Precipitation Index (SPI). The design takes into account the impact of temperature on drought. Therefore, SPEI is calculated from precipitation and potential evapotranspiration in a certain period of time. A positive value means wet, and a negative value means dry; SPEI can be calculated in a time range of 1–48 months like SPI [27].
In this study, we calculated six-month scale SPEI (SPEI06) from 1982 to 2019, based on temperature and precipitation data to indicate the dry and wet conditions in SWC [28]. Two threshold methods were used to identify the severity of drought events in different regions from 2009 to 2012 [29]—the first was to divide the monthly drought situation into no drought (SPEI > −0.5), slight drought (−1.5 < SPEI < −0.5), and heavy drought (SPEI < −1.5), and then counted each pixel. The number of months of the three drought conditions indicates the severity of the drought. The second was to apply cumulations with threshold −0.5 on each pixel during these 48 months (SPEIcum), and then the region was categorized into three subregions: no drought region where SPEIcum < −24; slight drought region where −48 < SPEIcum < −24; heavy drought region where SPEIcum < −48.

2.6. Residual Trend Method

The residual trend analysis usually is used to distinguish the vegetation change caused by human activities and climate change [30,31]. First, through multiple correlation regression analysis, the fitted relationship between the vegetation indictors and climate factors were established. It is suggested that the changes in the residuals are caused by human activities. When the change trend of the residual is not significant, the vegetation change in the area is considered to be caused by climate change only. When the change trend of the residual is significant, it is considered that in addition to climate change, human activities may also have a greater impact on vegetation change in the area (a positive value indicates a positive impact, and a negative value indicates negative impact). It is worth noting that the residual trend method is only applicable to pixels where the climate factor is significantly correlated with vegetation indictors (R2 > 0.3, p < 0.05).

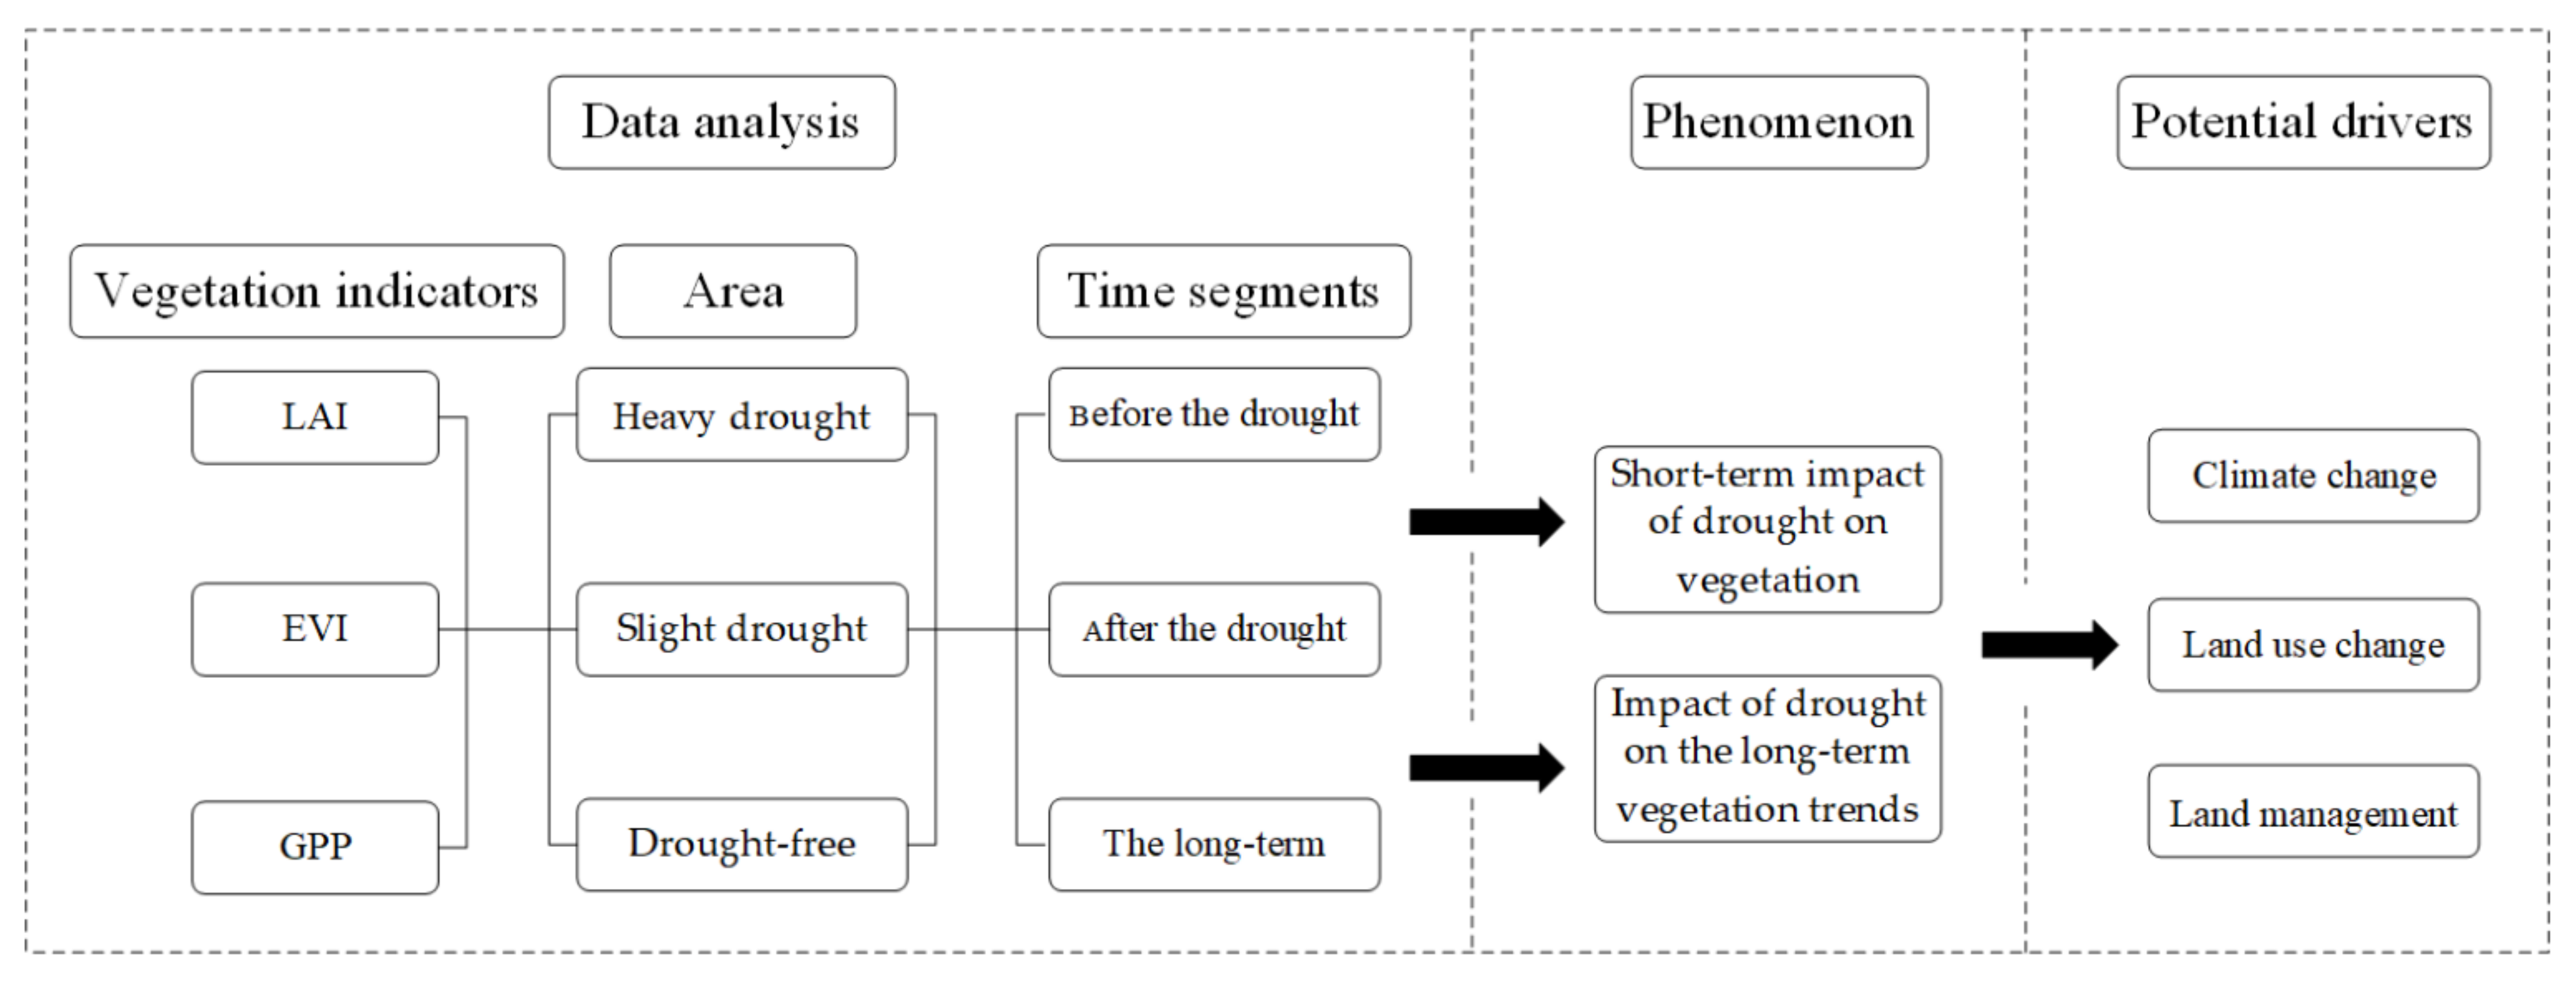
2.7. Analysis Process

In order to analyze the impact of drought events on long-term vegetation trends, four key points of the time series were set to perform segmentation analysis, including start (based on the data length), 2008 (before the drought), 2012 (end of the drought), and the final year of the time series. Therefore, the specific time is LAI (1982–2008, 1982–2012, 1982–2016), EVI (2000–2008, 2000–2012, 2000–2019), and GPP (1982–2008, 1982–2012, 1982–2016).
We calculated the trend before the drought (BDT), the trend after the drought (ADT), and the long-term trend (LTT) over the whole period, respectively. We used LTT minus BDT and ADT to represent the impact of drought on long-term vegetation trends, and ADT minus BDT to represent the short-term impact of drought on vegetation. If the drought in 2009–2012 had a serious impact on vegetation and even caused death, ADT-BDT should be a negative value, and the lower the negative value, the more serious the impact. Similarly, LTT-ADT expresses vegetation restoration after drought and LTT-BDT judges whether vegetation has recovered to the level before drought. The flowchart of this study is shown in Figure 2.

3. Results

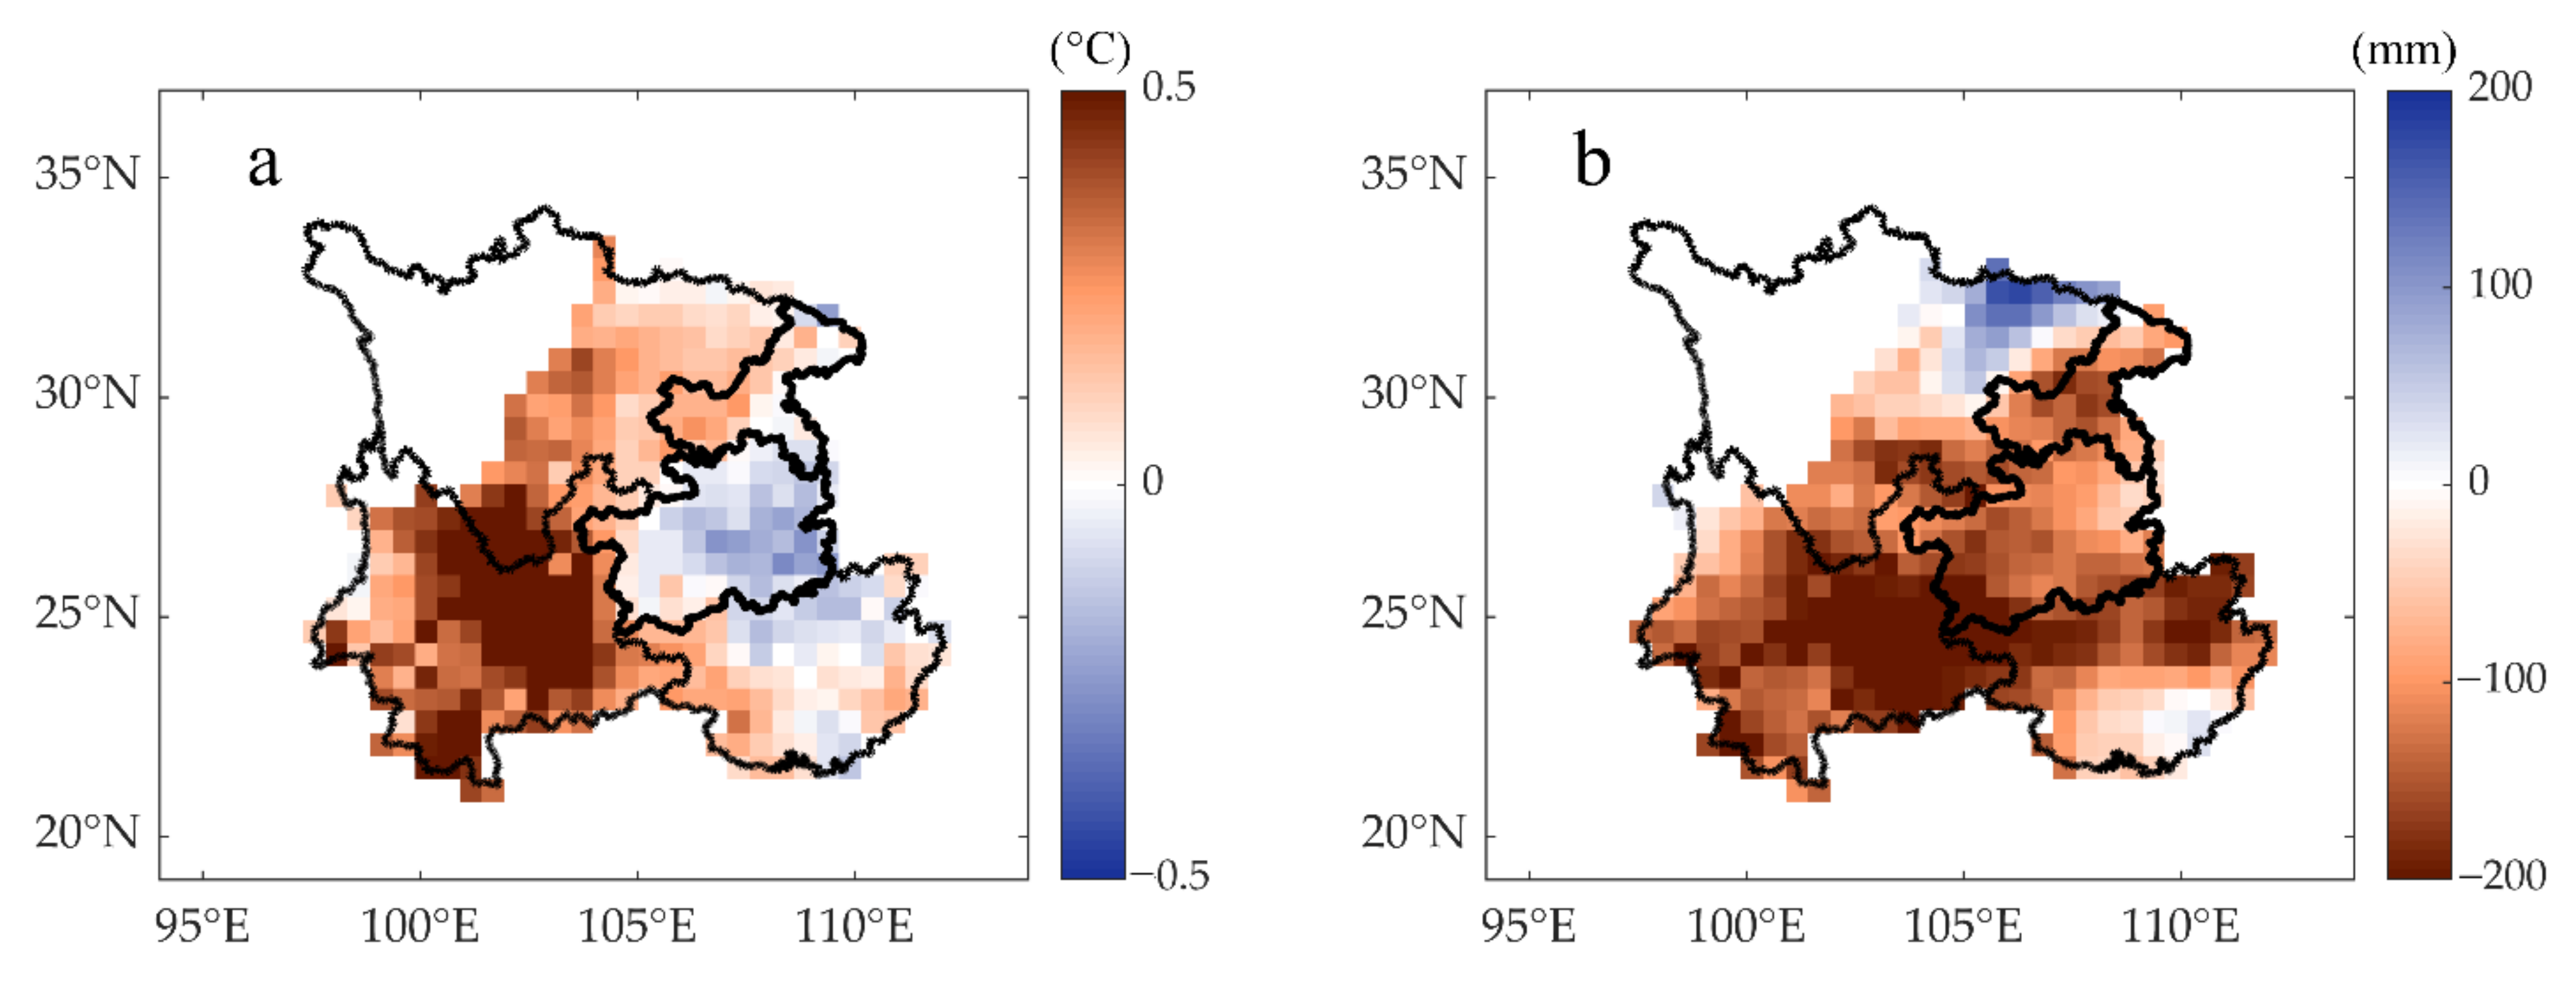
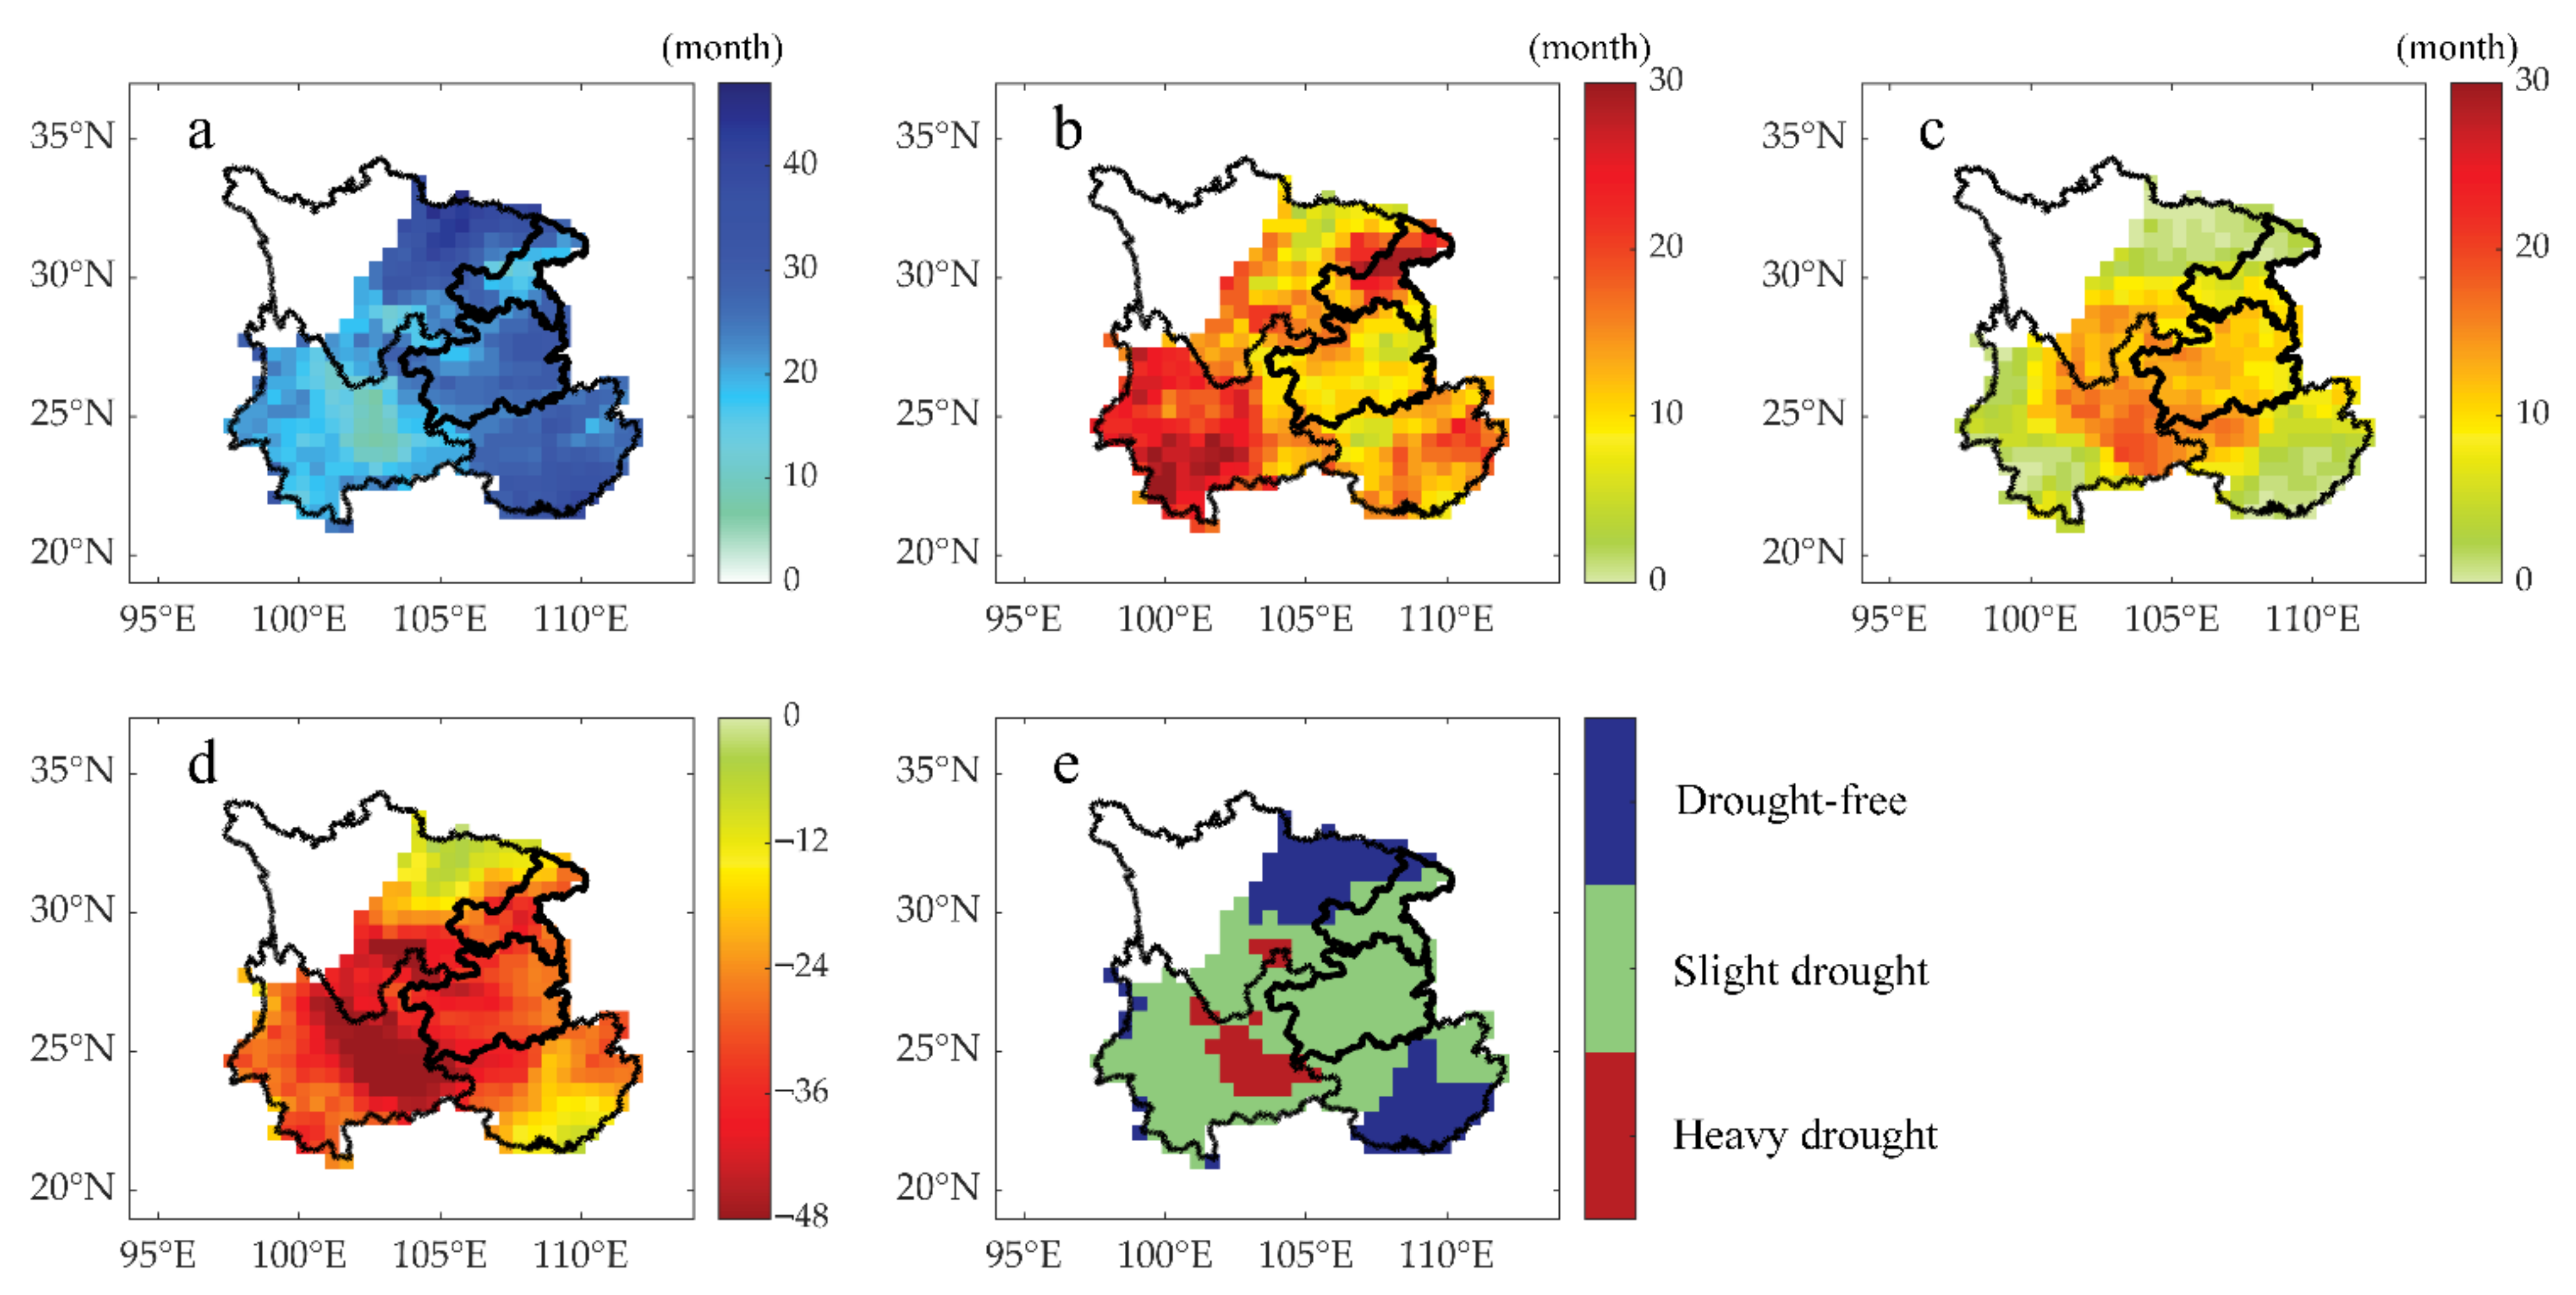
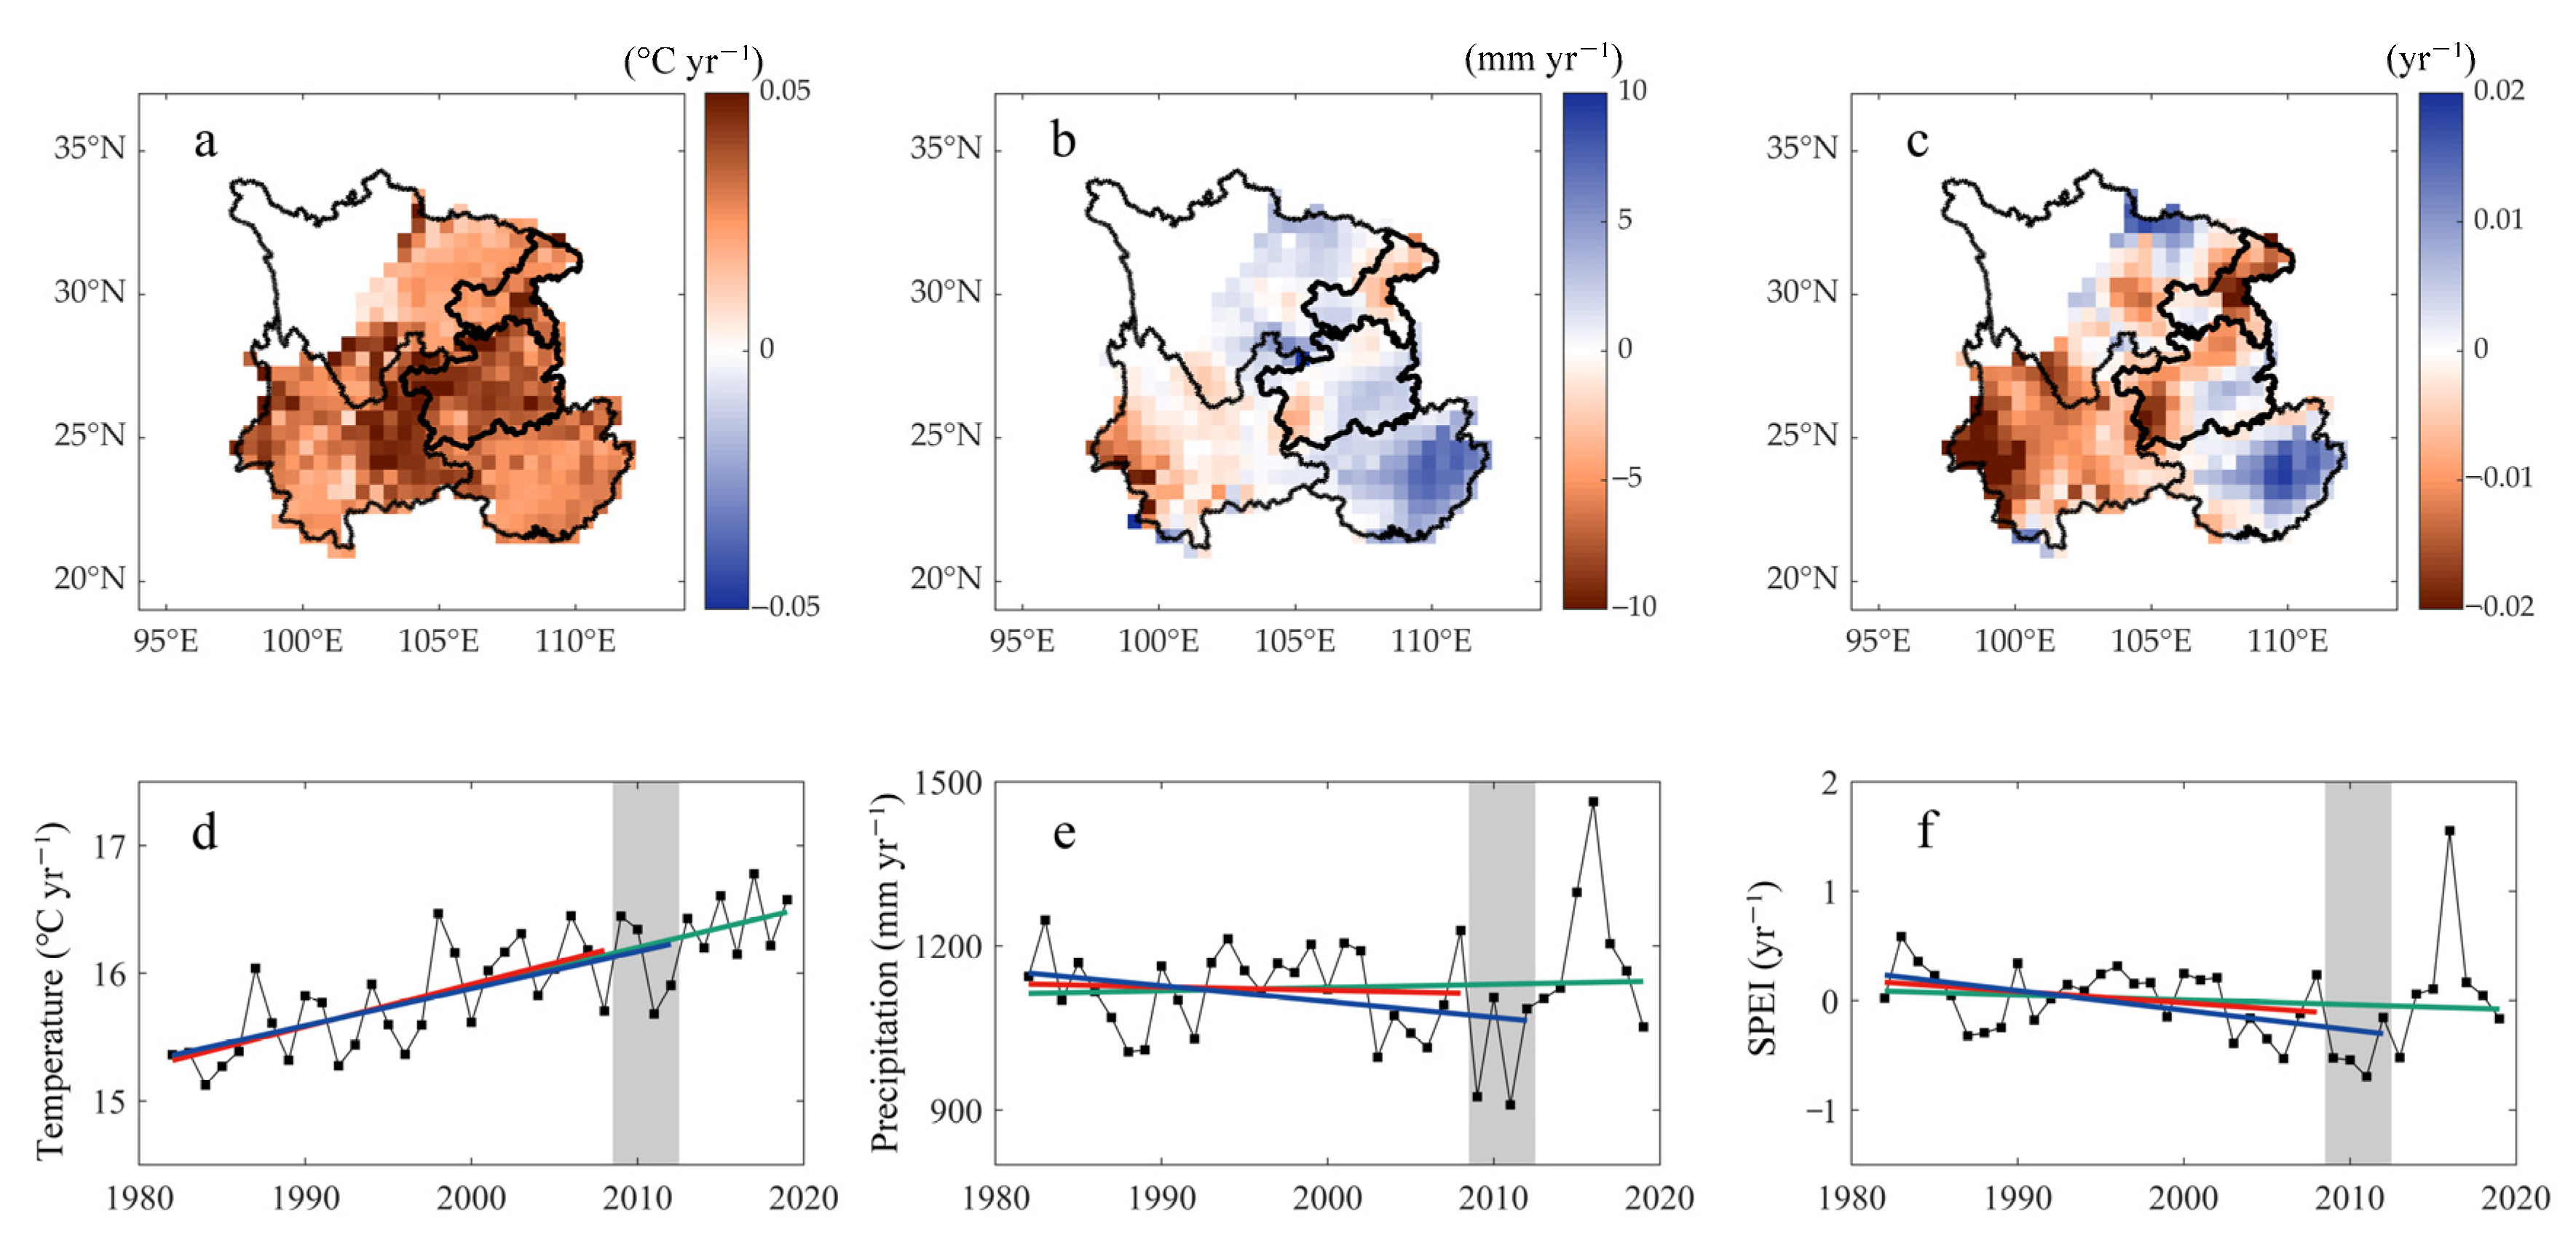
3.1. Drought Events and Changes in Dryness and Wetness in SWC

Figure 3 shows the temperature and precipitation anomalies in SWC from 2009 to 2012. During 2009–2012, except for parts of the southeast, temperature of SWC was significantly higher than the multi-year averages. Although the precipitation may have certain inter-annual fluctuations, during 2009–2012, almost all areas showed obvious negative anomalies, and the negative anomalies in some areas even reached less than −200 mm, which indicates that the entire study area might have suffered varying degrees of drought from 2009 to 2012. Therefore, the drought situation in the entire study area needs further evaluation; Figure 4 shows the results where SPEI identifies drought. The two threshold methods showed similar drought spatial patterns. The heaviest drought areas were concentrated in the central part; heavy drought occurred for more than 15 months in four years, which was mainly caused by a combination of low precipitation and high temperature. In some areas of the southwest and east, slight drought occurred for about half of the four years. The area where drought was not recognized were concentrated in the north and southeast; these areas had abundant precipitation during the four years of drought. At the same time, except for parts of the southeast, we also found a drying trend in most of SWC (Figure 5). The negative value of the SPEI trend accounted for 69.8% of the entire study area, which was mainly due to the increase in temperature and the decrease in precipitation in SWC in recent years.

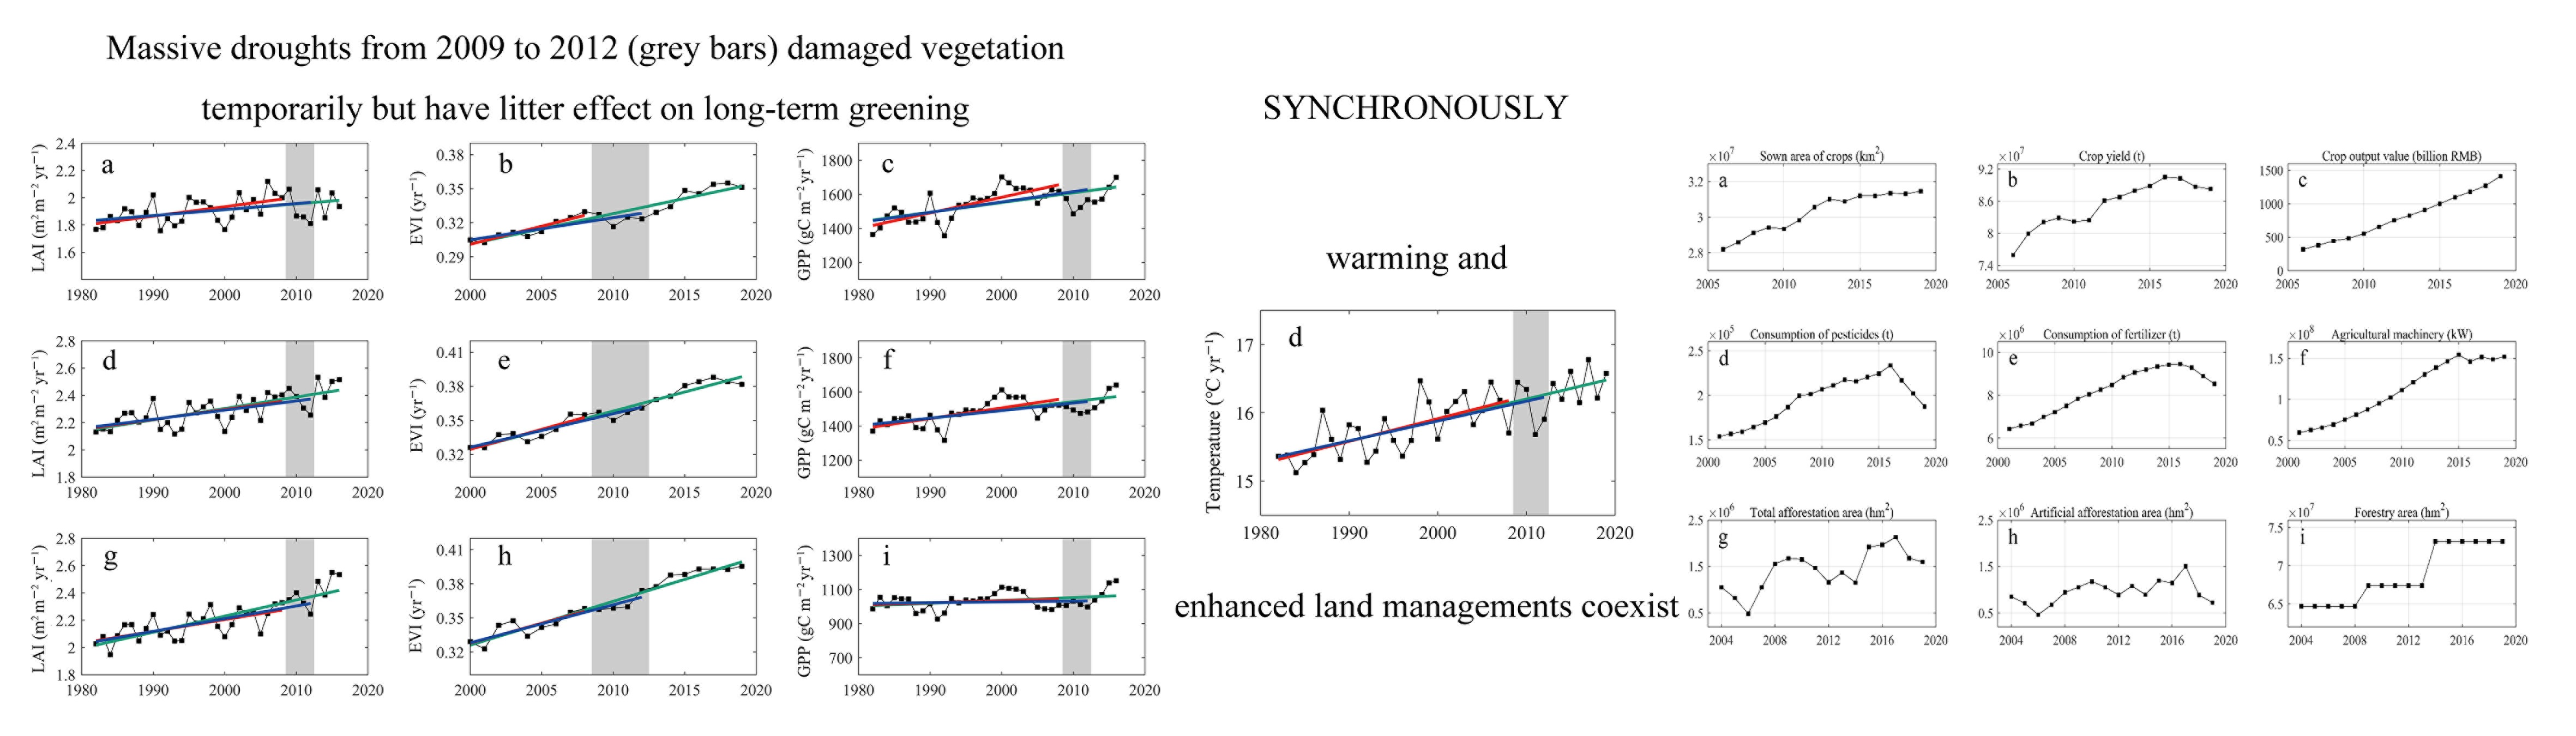
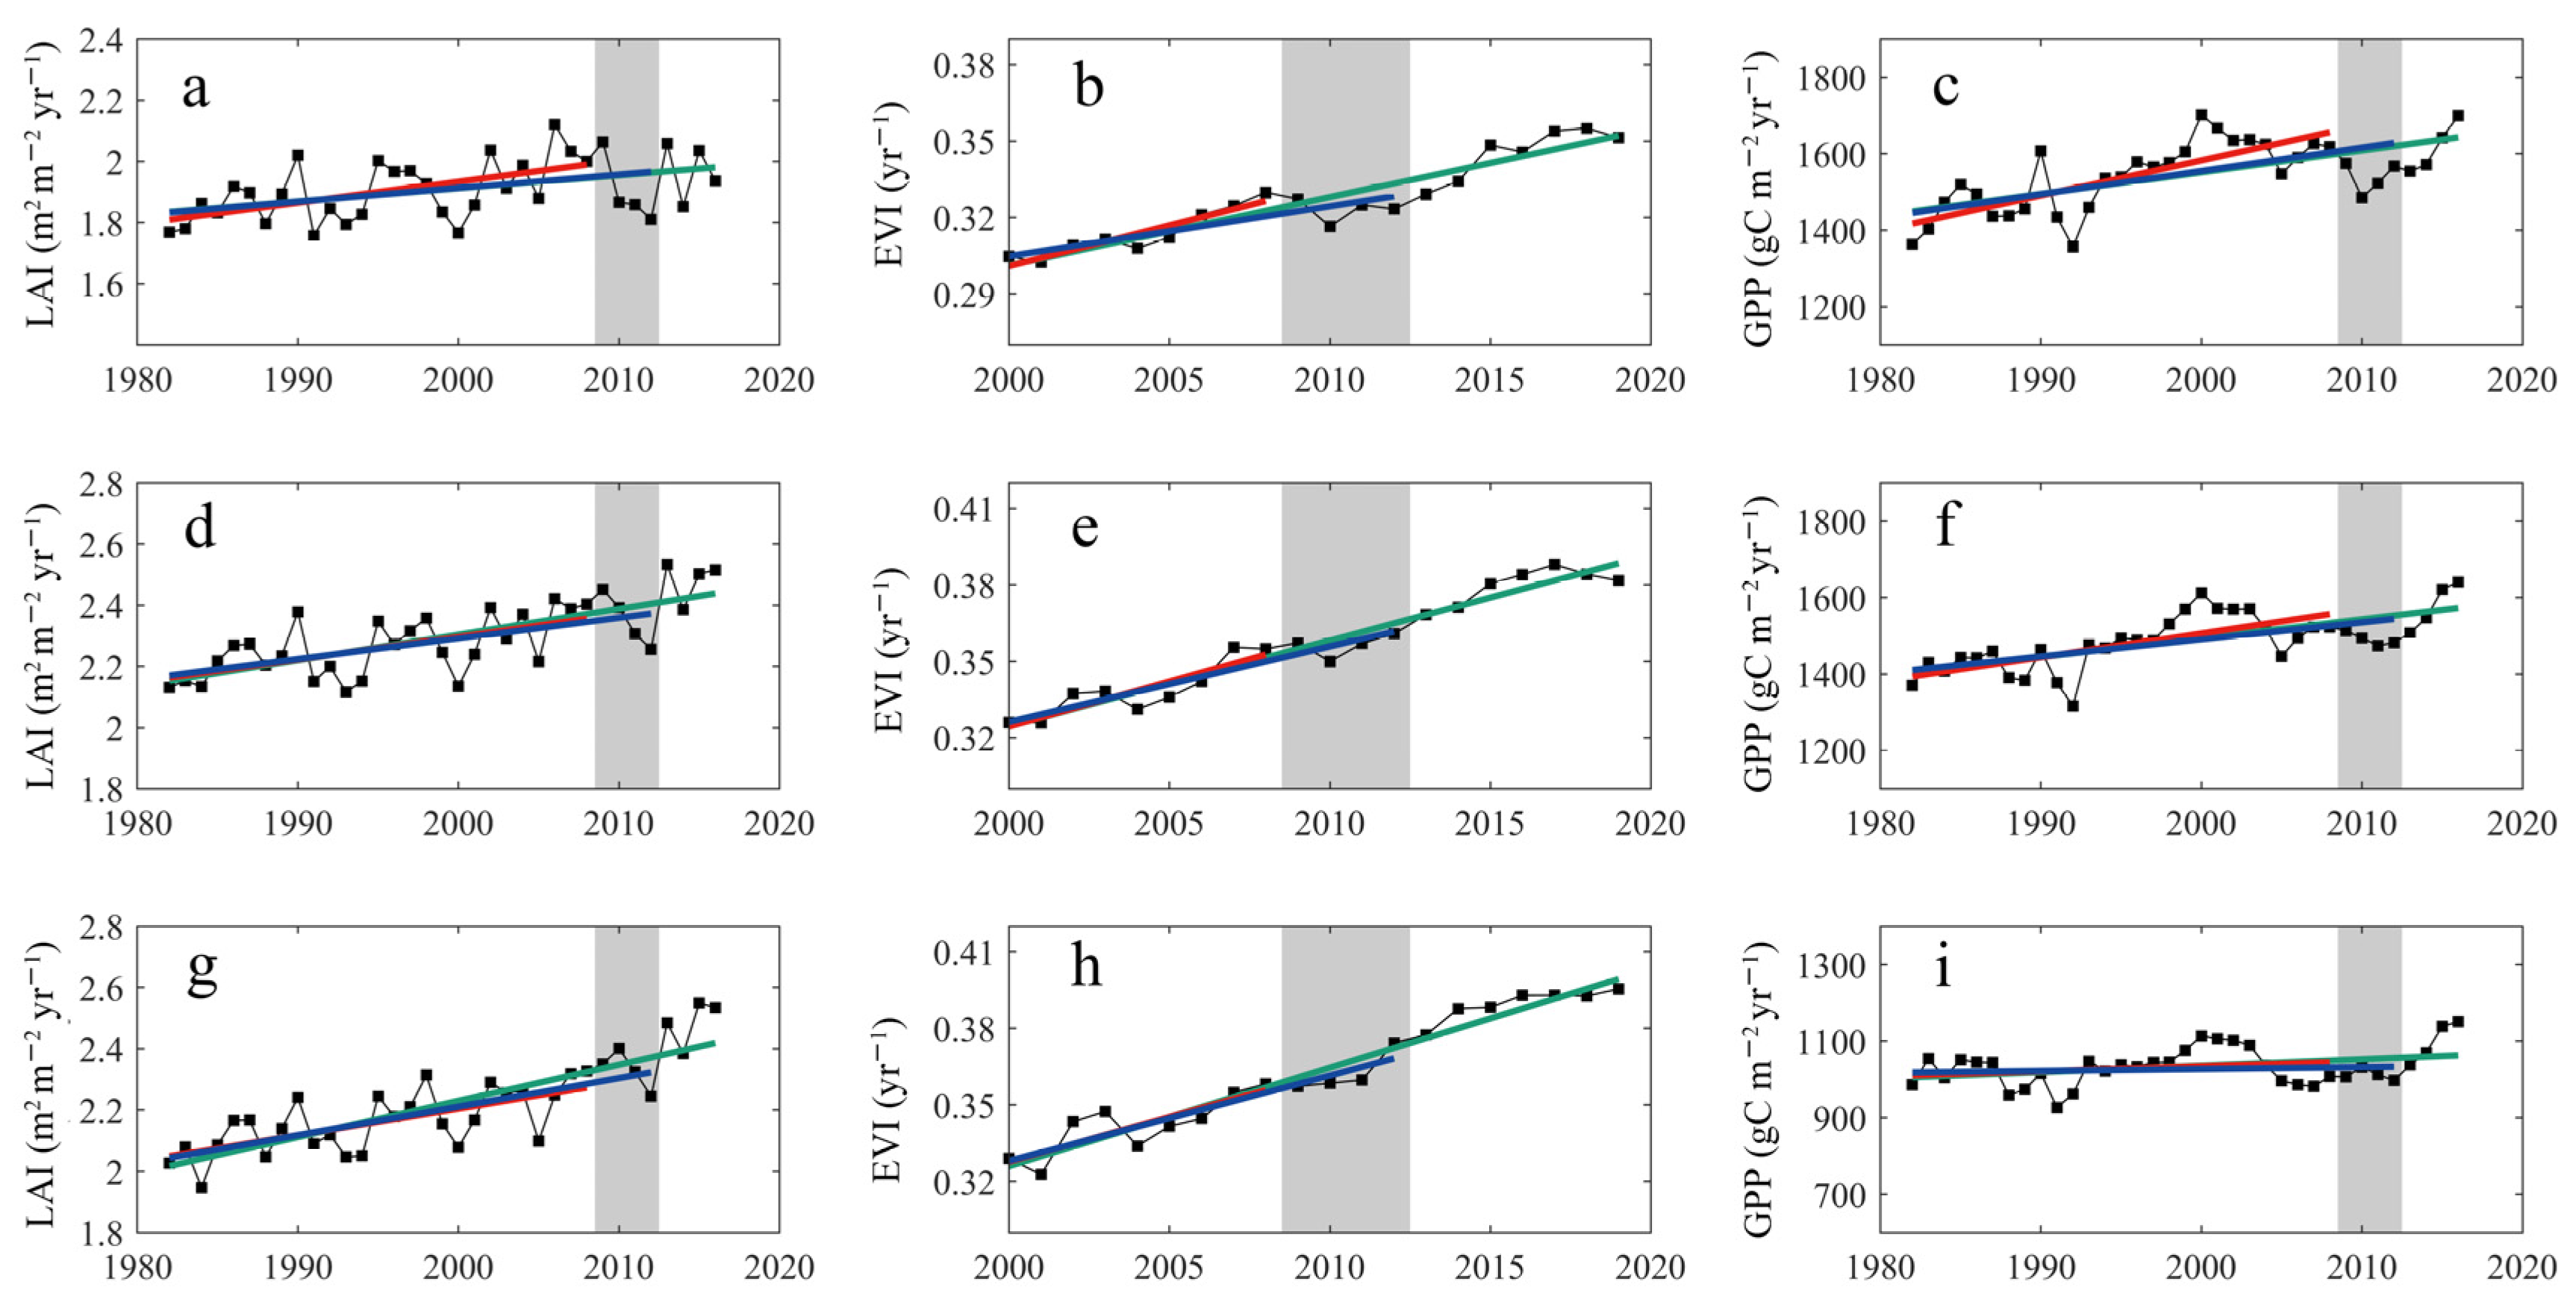
3.2. The Impact of Drought Events on Vegetation in SWC from 2009 to 2012

Different degrees of drought have obvious differences in the impact of vegetation. In heavy drought areas, ADT showed a different degree of decline, compared to BDT for the three vegetation indicators (Table 2 and Figure 6); and the change trends of LAI, EVI, and GPP decreased by 2.5 × 10⁻³ m2/m2, 1.2 × 10⁻³, 3.09 gC/m2, respectively. In terms of long-term trends, drought events had not changed the greening trend of vegetation. The anomalies of LAI, EVI, and GPP after 2012 were 0.0629 m2/m2, 0.0187, and 70.86 gC/m2, respectively. In other words, drought events in the SWC affected the growth of vegetation only during the drought period, but had little impact on the long-term trend. In slightly arid areas, for LAI and EVI, after a slight decrease in ADT, LTT quickly recovered to the pre-drought level. In contrast, the recovery of GPP is not obvious. This may be related to the changes in solar radiation in the area. In the GPP algorithm by Zheng et al., solar radiation as the dominant influence significantly affects GPP. For areas where drought had not occurred, vegetation greening was more obvious. The LTT of LAI and EVI was significantly higher than that of BDT, which indicates that the areas were experiencing continuous greening.
Figure 7 shows the spatial change trend of LAI, EVI, and GPP. Similar to the annual changes, vegetation greening was evident throughout SWC. There was a positive trend in 88.7% of pixels in LAI and 97.1% of pixels in EVI. In addition, GPP also showed an increase trend, with a positive value accounting for about 77.4%. During the drought period, the increase trends of LAI, EVI, and GPP decreased in a large area, which indicates that the growth of vegetation has been damaged to a certain extent, so that it affected the change trend of vegetation during this period. The increasing area was mainly concentrated in the southeast, where no obvious drought was found (Figure 4). By comparing LTT and BDT, it could be found that the effects of drought on the long-term vegetation trends in different regions were not consistent. There was a very obvious negative value for LAI in the west, but there was no impact in the east. EVI and GPP were more consistent, except for the southeast part; they all showed obvious negative values, and these areas had experienced different degrees of drought. After the drought, the vegetation quickly recovered. Except for some pixels in the southwest, the LTT in most areas was higher than the ADT in three vegetation indicators.
In summary, although the SWC has experienced four years of drought events, the long-term vegetation trends have not been significantly affected. Compared with BDT, the LTT of LAI, EVI, and GPP might drop slightly in different regions, but from the perspective of annual change trend, the vegetation was still greening.

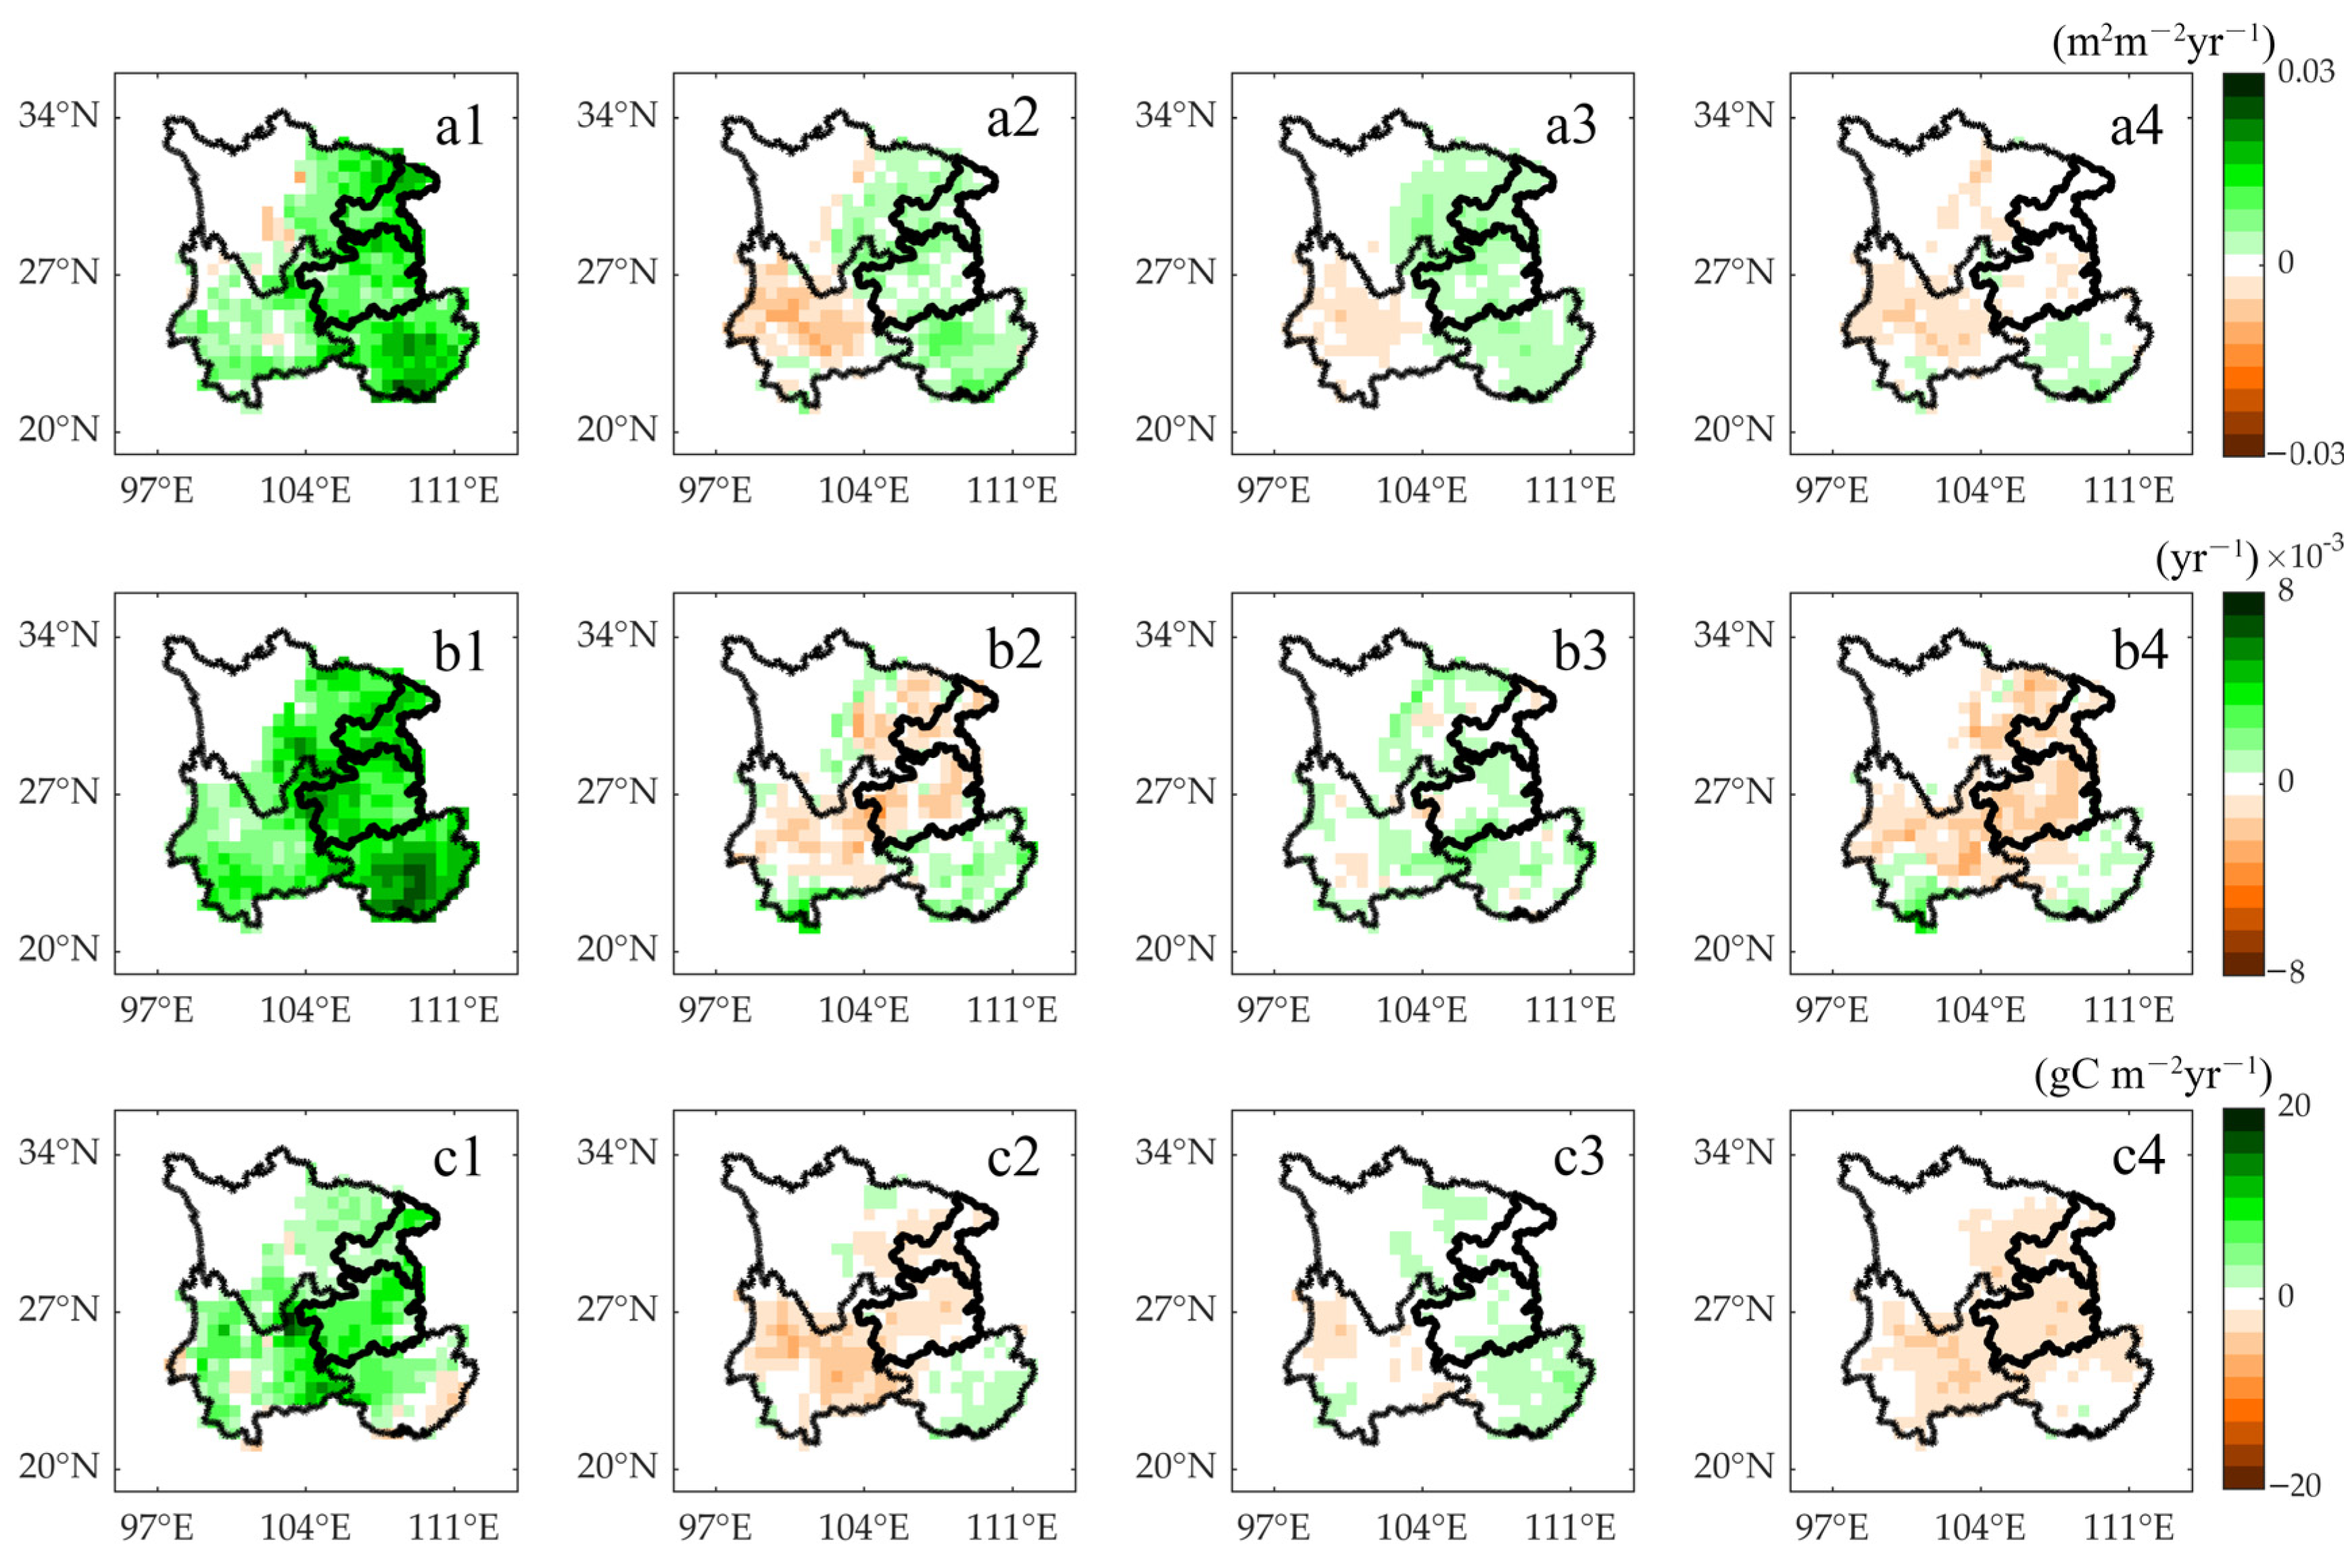
3.3. The Impact of Land Management on Vegetation in SWC

Since 2000, SWC has experienced highly obvious agricultural intensive production (Figure 8); this was mainly manifested in the massive use of pesticides and fertilizers and the rapid increase in the total power of agricultural machinery, which increased by 22%, 33%, and 154% from 2001 to 2019, respectively. At the same time, the sown area, crop yield, and crop output value increased by 11%, 16%, and 345% from 2006 to 2019, respectively. China has been implementing several ambitious plans in recent years to protect and expand forests and reduce soil erosion. It can also be clearly seen from the relevant statistical data that since 2004, the annual afforestation area in the SWC was between 0.5 and 2.5 million hm2, most of which were artificial forests. During the 15 years from 2004 to 2019, the forest area in SWC increased by nearly 1000 hm2.
In order to reduce the uncertainty caused by statistical data, RESDC was used to describe land-use changes in SWC. From 1980 to 2015, the land use of the entire study area was mainly divided into two stages (Figure 9). Before 2000, the main manifestations were the decrease in cropland and forest and the increase of grassland. Cropland and forest decreased by 1274 km2 and 2376 km2, respectively, and grassland increased by 3102 km2. From a spatial perspective, the increase in grassland was largely due to the decrease in forest. After 2000, forests increased, cropland and grassland decreased, cropland decreased by 6211 km2, grassland decreased by 2099 km2, forest increased by 1017 km2, and forest expansion mainly came from cropland and grassland. Although the area of cropland decreased significantly after 2000, the sown area of croplands showed an increasing trend, which may be due to the impact of multiple cropping [25].
In addition, we also identified the impact of human activities through the residual trend mothed (Figure 10). Be it for LAI, EVI, or GPP, there were positive trends in SWC, and positive pixel values accounted for 27%, 37%, and 19% of the entire study area, respectively, which indicates that the impact of human activities on vegetation in the entire study area is very significant, and the impact of human activities may be even greater after 2000 (the number of positive pixels in EVI is significantly more than that in LAI). In summary, be it statistical data, satellite data, or the statistical method, it is recognized that the entire study area has experienced a very wide range of human activities and the positive impact of land management on vegetation.

4. Discussion

Drought events in SWC from 2009 to 2012 have been widely reported in previous studies. Vegetation was damaged during this period, which is also reflected in our research. Some previous studies used different drought indices to quantify the severity of these drought events in different regions of SWC and also showed the same spatial pattern as this study, which emphasized the necessity of subregional research on the impact of drought events on vegetation [17,32].
When the temperature is higher than the optimal temperature for vegetation growth, it may reduce the photosynthesis and carbon sequestration capacity of the vegetation [33]. During drought events, LAI, EVI, and GPP all have a clear decrease trend in drought areas, but comparing LTT and ADT, it can be found that the greening of vegetation recovers quickly after drought events. Generally speaking, moisture and temperature conditions after drought are the key factors that affect the time of vegetation restoration. Humid conditions will further accelerate vegetation restoration, while drought conditions will prolong vegetation restoration [34,35]. In addition, some recent studies have shown that the global drying trend has affected the growth of vegetation. After 2000, most of the global vegetation has experienced a transition from greening to browning (greening slows down) [36,37]. However, we found an interesting phenomenon in our research; while experiencing drought events, a very obvious drying trend was found throughout SWC—vegetation continued to green and productivity also significantly increased. Long-term vegetation trends only had a slight impact in heavy drought areas, and basically no impact in slight drought areas. In other words, the vegetation quickly recovered to the pre-drought level after the drought event (Figure 11I). This may be the result of the joint effect of climate change and human activities. Partial correlation analysis shows that temperature is the main driving factor for vegetation greening in the SWC (Table 3), which means that although SWC is undergoing a drying process, precipitation still meets the vegetation’s growth needs. For areas where there is no limit of water, climate warming stimulates the growth of vegetation by extending the growing season and promoting photosynthesis in summer [38]; a similar study took place in the Amazon forest. Due to the increase in solar radiation, the extreme drought in 2015/2016 did not affect the greenness of the vegetation. There even was an increase in greening rate—21.6% of the forest experienced a rise [39].
The vegetation restoration time depends on the severity of the drought, the climatic conditions after the drought, and so on. Although climate change is an important driving factor for vegetation greening, only relying on the effects of climate change after experiencing severe drought events may not show vegetation restoration (Figure 11II or Figure 11III); thus, we believe that land management is another important factor in the rapid restoration of vegetation in this area after drought. The SWC has experienced extensive land-use changes, which will also cause changes in vegetation. A previous study showed that large-scale ecological projects in SWC have led to a broad increase in the leaf area index and above-ground biomass, which is in sharp contrast to the negative trends found in the ecosystem model simulation without human influence [40]. Similar studies have also shown that China and India contributed more than one-third of the observed net increase in global green leaf area through land management [25]. Similar to these studies, the role of land management in this area is very significant. Pesticides, fertilizers, and the total power of machinery has increased significantly, which has brought about a rapid increase in crop yields and crop output values. At the same time, the afforestation project in this area has continued for many years. The residual analysis also shows that human activities in SWC have a very significant positive impact on vegetation, which further shows the positive impact of land management on vegetation growth.
To sum up, despite the drought event and continuous drying, the greening of SWC continues. On the one hand, when the drought threshold is not reached, the precipitation in this region meets the growth needs of vegetation, and climate warming further promotes greening. On the other hand, land management has also contributed a lot to the vegetation greening in SWC. This has not been quantified in our research. This is mainly due to the lack of land management data sets, but related statistical data, remote sensing data, and residual trend methods all show the positive impact of land management.
Finally, it needs to be emphasized that the temperature of SWC has increased year by year (0.031 °C/year) in recent years. Although climate warming in semi-humid areas will still promote vegetation greening and productivity before reaching the drought threshold, it may also increase the saturated vapor pressure of the atmosphere, resulting in a decrease in relative humidity. It is worth noting whether the continued dryness of SWC in the future will lead to a change in the trend of vegetation greening.

5. Conclusions

In this paper, we conducted a study in Southwest China (SWC), which experienced severe drought events during 2009–2012, to investigate if drought events affect long-term vegetation trends. We used LAI, EVI, and GPP to characterize the growth of vegetation, and explored the impact of drought events on long-term vegetation trends. The drought events in 2009–2012 did cause synchronous obvious damage to vegetation. By the end of the drought events in 2012, the vegetation greening trend showed a certain degree of decline, compared to the period before the droughts. However, on studying the latest records, it was noted that the vegetation quickly recovered after the droughts, and the long-term trends of vegetation indicators have basically returned to the level before the droughts. In addition, an unexpected phenomenon was discovered—that drying trends coexist with greening.
Partial correlation analysis shows that climate warming is one of the driving factors for vegetation greening in SWC. In addition, human activities in this area are extensive, which act as another potential driver of greening. The consumption of pesticides, fertilizers, and agricultural machinery has gradually increased, followed by yield and output value. The rapid growth and continuous forestry projects have gradually increased forest area in SWC. Satellite-based land cover changes and residual trend methods have also been confirmed at this point. In other words, climate warming and human activities (especially land management) are the main drivers for the rapid restoration of vegetation after severe drought. As a consequence, there is ongoing greening in Southwest China, despite severe droughts in 2009–2012 and long-term drying trends. However, one thing to pay attention to is whether the vegetation in SWC will change from green to brown due to the continuous drying trend.

Author Contributions

Conceptualization, methodology, writing—original draft preparation, X.C. and T.C.; data curation, visualization, J.C., R.G., and M.G.; writing—review and editing, X.W. and Y.X. supervision, validation, Q.Y., S.Z., and C.L. All authors have read and agreed to the published version of the manuscript.

Funding

This research was funded by the National Key R&D Program of China (No. 2017YFB0504000) and the National Natural Science Foundation of China (No. 42130506, 31570464).

Institutional Review Board Statement

Not applicable.

Informed Consent Statement

Not applicable.

Data Availability Statement

LAI is available at https://www.researchgate.net/publication/320443340_Updated_GIMMS_LAI3gFPAR3g_data_sets_Version_4_19817_201612, accessed on 23 March 2021. EVI is available at https://search.earthdata.nasa.gov/search, accessed on 21 March 2021. GPP is available at https://0-doi-org.brum.beds.ac.uk/10.6084/m9.figshare.8942336, accessed on 22 March 2021. Meteorological data are available at https://data.cma.cn, accessed on 23 March 2021. RESDC is available at http://www.resdc.cn/, accessed on 22 March 2021. Agricultural and forestry data are available at http://www.stats.gov.cn/, accessed on 23 March 2021.

Acknowledgments

The authors thank three anonymous reviewers for their comments for making this article a great improvement.

Conflicts of Interest

The authors declare no conflict of interest.

References

  1. Anav, A.; Friedlingstein, P.; Beer, C.; Ciais, P.; Harper, A.; Jones, C.; Murray-Tortarolo, G.; Papale, D.; Parazoo, N.C.; Peylin, P.; et al. Spatiotemporal patterns of terrestrial gross primary production: A review. Rev. Geophys. 2015, 53, 785–818. [Google Scholar] [CrossRef] [Green Version]
  2. Ryu, Y.; Berry, J.A.; Baldocchi, D.D. What is global photosynthesis? History, uncertainties and opportunities. Remote Sens. Environ. 2019, 223, 95–114. [Google Scholar] [CrossRef]
  3. Xiao, J.; Chevallier, F.; Gomez, C.; Guanter, L.; Hicke, J.A.; Huete, A.R.; Ichii, K.; Ni, W.; Pang, Y.; Rahman, A.F.; et al. Remote sensing of the terrestrial carbon cycle: A review of advances over 50 years. Remote Sens. Environ. 2019, 233, 111383. [Google Scholar] [CrossRef]
  4. Chen, T.; Zhou, S.; Liang, C.; Hagan, D.F.T.; Zeng, N.; Wang, J.; Shi, T.; Chen, X.; Dolman, A.J. The greening and wetting of the sahel have leveled off since about 1999 in relation to SST. Remote Sens. 2020, 12, 2723. [Google Scholar] [CrossRef]
  5. Zhu, Z.; Piao, S.; Myneni, R.B.; Huang, M.; Zeng, Z.; Canadell, J.G.; Ciais, P.; Sitch, S.; Friedlingstein, P.; Arneth, A.; et al. Greening of the Earth and its drivers. Nat. Clim. Chang. 2016, 6, 791–795. [Google Scholar] [CrossRef]
  6. Forzieri, G.; Alkama, R.; Miralles, D.G.; Cescatti, A. Satellites reveal contrasting responses of regional climate to the widespread greening of Earth. Science 2017, 356, 1180–1184. [Google Scholar] [CrossRef] [Green Version]
  7. Piao, S.; Wang, X.; Park, T.; Chen, C.; Lian, X.; He, Y.; Jarle, W.B.; Chen, A.; Ciais, P.; Tømmervik, H.; et al. Characteristics, drivers and feedbacks of global greening. Nat. Rev. Earth Environ. 2020, 1, 14–27. [Google Scholar] [CrossRef]
  8. Ummenhofer, C.C.; Meehl, G.A. Extreme weather and climate events with ecological relevance: A review. Philos. Trans. R. Soc. Lond. B. Biol. Sci. 2017, 372. [Google Scholar] [CrossRef]
  9. Lian, X.; Piao, S.; Chen, A.; Huntingford, C.; Fu, B.; Li, L.Z.X.; Huang, J.; Sheffield, J.; Berg, A.M.; Keena, T.F.; et al. Multifaceted characteristics of dryland aridity changes in a warming world. Nat. Rev. Earth Environ. 2021, 2, 232–250. [Google Scholar] [CrossRef]
  10. Cunha, A.P.M.A.; Zeri, M.; Leal, K.D.; Costa, L.; Cuartas, L.A.; Marengo, J.A.; Tomasella, J.; Vieira, R.M.; Barbosa, A.A.; Cunningham, C.; et al. Extreme drought events over Brazil from 2011 to 2019. Atmosphere 2019, 10, 642. [Google Scholar] [CrossRef] [Green Version]
  11. Cook, B.I.; Smerdon, J.E.; Seager, R.; Coats, S.J. Global warming and 21st century drying. Clim. Dyn. 2014, 43, 2607–2627. [Google Scholar] [CrossRef] [Green Version]
  12. Sheffield, J.; Wood, E.F. Projected changes in drought occurrence under future global warming from multi-model, multi-scenario, IPCC AR4 simulations. Clim. Dyn. 2008, 31, 79–105. [Google Scholar] [CrossRef]
  13. Spinoni, J.; Vogt, J.V.; Naumann, G.; Barbosa, P.M.F.; Dosio, A. Will drought events become more frequent and severe in Europe. Int. J. Climatol. 2018, 38, 1718–1736. [Google Scholar] [CrossRef] [Green Version]
  14. Potter, C.; Klooster, S.; Hiatt, C.; Genovese, V.; Castilla-Rubio, J.C. Changes in the carbon cycle of Amazon ecosystems during the 2010 drought. Environ. Res. Lett. 2011, 6, 034024. [Google Scholar] [CrossRef] [Green Version]
  15. He, W.; Ju, W.; Schwalm, C.R.; Sippel, S.; Wu, X.; He, Q.; Song, L.; Zhang, C.; Li, J.; Sitch, S.; et al. Large-scale droughts responsible for dramatic reductions of terrestrial net carbon uptake over North America in 2011 and 2012. J. Geophys. Res. 2018, 123, 2053–2071. [Google Scholar] [CrossRef]
  16. Yuan, W.; Cai, W.; Chen, Y.; Liu, S.; Dong, W.; Zhang, H.; Yu, G.; Chen, Z.; He, H.; Guo, W.; et al. Severe summer heatwave and drought strongly reduced carbon uptake in southern China. Sci. Rep. 2016, 6, 18813. [Google Scholar] [CrossRef] [Green Version]
  17. Song, L.; Li, Y.; Ren, Y.; Wu, X.; Guo, B.; Tang, X.; Shi, W.; Ma, M.; Han, X.; Zhao, L. Divergent vegetation responses to extreme spring and summer droughts in Southwestern China. Agric. For. Meteorol. 2019, 279, 107703. [Google Scholar] [CrossRef]
  18. Lin, W.; Wen, C.; Wen, Z.; Gang, H. Drought in southwest China: A review. Atmos. Ocean Sci. Lett. 2015, 8, 339–344. [Google Scholar] [CrossRef]
  19. Hao, C.; Zhang, J.; Yao, F. Combination of multi-sensor remote sensing data for drought monitoring over Southwest China. Int. J. Appl. Earth Obs. Geoinf. 2015, 35, 270–283. [Google Scholar] [CrossRef]
  20. Tao, J.; Xu, T.; Dong, J.; Yu, X.; Jiang, Y.; Zhang, Y.; Huang, K.; Zhu, J.; Dong, J.; Xu, Y.; et al. Elevation-dependent effects of climate change on vegetation greenness in the high mountains of southwest China during 1982–2013. Int. J. Climatol. 2018, 38, 2029–2038. [Google Scholar] [CrossRef]
  21. Qiu, B.; Yan, X.; Chen, C.; Tang, Z.; Wu, W.; Xu, W.; Zhao, Z.; Yan, C.; Berry, J.; Huang, W.; et al. The impact of indicator selection on assessment of global greening. GIsci. Remote Sens. 2021, 58, 372–385. [Google Scholar] [CrossRef]
  22. Ding, Z.; Peng, J.; Qiu, S.; Zhao, Y. Nearly half of global vegetated area experienced inconsistent vegetation growth in terms of greenness, cover, and productivity. Earths Future 2020, 8, e2020EF001618. [Google Scholar] [CrossRef]
  23. Zhu, Z.; Bi, J.; Pan, Y.; Ganguly, S.; Anav, A.; Xu, L.; Samanta, A.; Piao, S.; Nemani, R.R.; Myneni, R.B. Global data sets of vegetation leaf area index (LAI)3g and fraction of photosynthetically active radiation (FPAR)3g derived from Global Inventory Modeling And Mapping Studies (GIMMS) normalized difference vegetation index (NDVI3g) for the period 1981 to 2011. Remote Sens. 2013, 5, 927–948. [Google Scholar] [CrossRef] [Green Version]
  24. Zheng, Y.; Shen, R.; Wang, Y.; Li, X.; Liu, S.; Liang, S.; Chen, J.M.; Ju, W.; Zhang, L.; Yuan, W. Improved estimate of global gross primary production for reproducing its long-term variation, 1982–2017. Earth Syst. Sci. Data 2020, 12, 2725–2746. [Google Scholar] [CrossRef]
  25. Chen, C.; Park, T.; Wang, X.; Piao, S.; Xu, B.; Chaturvedi, R.K.; Fuchs, R.; Brovkin, V.; Ciais, P.; Fensholt, R.; et al. China and India lead in greening of the world through land-use management. Nat. Sustain. 2019, 2, 122–129. [Google Scholar] [CrossRef] [PubMed]
  26. Tong, X.; Brandt, M.; Yue, Y.; Ciais, P.; Jepsen, M.R.; Penuelas, J.; Wigneron, J.P.; Xiao, X.; Song, X.P.; Horion, S.; et al. Forest management in southern China generates short term extensive carbon sequestration. Nat. Commun. 2020, 11, 129. [Google Scholar] [CrossRef]
  27. Vicente-Serrano, S.M.; Beguería, S.; López-Moreno, J.I. A Multiscalar Drought Index Sensitive to Global Warming: The Standardized Precipitation Evapotranspiration Index. J. Clim. 2010, 23, 1696–1718. [Google Scholar] [CrossRef] [Green Version]
  28. Chen, T.; van der Werf, G.R.; de Jeu, R.A.M.; Wang, G.; Dolman, A.J. A global analysis of the impact of drought on net primary productivity. Hydrol. Earth Syst. Sci. 2013, 17, 3885–3894. [Google Scholar] [CrossRef] [Green Version]
  29. Zhang, Y.; Feng, X.; Fu, B.; Chen, Y.; Wang, X. Satellite-observed global terrestrial vegetation production in response to water availability. Remote Sens. 2021, 13, 1289. [Google Scholar] [CrossRef]
  30. Burrell, A.L.; Evans, J.P.; Liu, Y. Detecting dryland degradation using time series segmentation and residual trend analysis (TSS-RESTREND). Remote Sens. Environ. 2017, 197, 43–57. [Google Scholar] [CrossRef]
  31. Evans, J.; Geerken, R. Discrimination between climate and human-induced dryland degradation. J. Arid. Environ. 2004, 57, 535–554. [Google Scholar] [CrossRef]
  32. Sun, S.; Li, Q.; Li, J.; Wang, G.; Zhou, S.; Chai, R.; Hua, W.; Deng, P.; Wang, J.; Lou, W. Revisiting the evolution of the 2009–2011 meteorological drought over Southwest China. J. Hydrol. 2019, 568, 385–402. [Google Scholar] [CrossRef]
  33. Huang, M.; Piao, S.; Ciais, P.; Peñuelas, J.; Wang, X.; Keenan, T.F.; Peng, S.; Berry, J.A.; Wang, K.; Mao, J.; et al. Air temperature optima of vegetation productivity across global biomes. Nat. Ecol. Evol. 2019, 3, 772–779. [Google Scholar] [CrossRef] [PubMed]
  34. Schwalm, C.R.; Anderegg, W.R.L.; Michalak, A.M.; Fisher, J.B.; Biondi, F.; Koch, G.; Litvak, M.; Ogle, K.; Shaw, J.D.; Wolf, A.; et al. Global patterns of drought recovery. Nature 2017, 548, 202–205. [Google Scholar] [CrossRef]
  35. Liu, L.; Gudmundsson, L.; Hauser, M.; Qin, D.; Li, S.; Seneviratne, S.I. Revisiting assessments of ecosystem drought recovery. Environ. Res. Lett. 2019, 14, 114028. [Google Scholar] [CrossRef]
  36. Yuan, W.; Zheng, Y.; Piao, S.; Ciais, P.; Lombardozzi, D.; Wang, Y.; Ryu, Y.; Chen, G.; Dong, W.; Hu, Z.; et al. Increased atmospheric vapor pressure deficit reduces global vegetation growth. Sci. Adv. 2019, 5, eaax1396. [Google Scholar] [CrossRef] [Green Version]
  37. Pan, N.; Feng, X.; Fu, B.; Wang, S.; Ji, F.; Pan, S. Increasing global vegetation browning hidden in overall vegetation greening: Insights from time-varying trends. Remote Sens. Environ. 2018, 214, 59–72. [Google Scholar] [CrossRef]
  38. Piao, S.; Friedlingstein, P.; Ciais, P.; Viovy, N.; Demarty, J. Growing season extension and its impact on terrestrial carbon cycle in the Northern Hemisphere over the past 2 decades. Glob. Biogeochem. Cycles 2007, 21. [Google Scholar] [CrossRef]
  39. Yang, J.; Tian, H.; Pan, S.; Chen, G.; Zhang, B.; Dangal, S. Amazon drought and forest response: Largely reduced forest photosynthesis but slightly increased canopy greenness during the extreme drought of 2015/2016. Glob. Chang. Biol. 2018, 24, 1919–1934. [Google Scholar] [CrossRef] [PubMed]
  40. Tong, X.; Brandt, M.; Yue, Y.; Horion, S.; Wang, K.; Keersmaecker, W.D.; Tian, F.; Schurgers, G.; Xiao, X.; Luo, Y.; et al. Increased vegetation growth and carbon stock in China karst via ecological engineering. Nat. Sustain. 2018, 1, 44–50. [Google Scholar] [CrossRef]
Figure 1. Altitude, land cover, and climatic conditions of SWC. (a) Altitude; (b) land cover types, 1–6 represent cropland, forest, grassland, water, built–up land, and unused land, respectively; (c,d) seasonal cycles of monthly temperature and precipitation during 1982–2019. The curved lines indicate the monthly averages, with standard deviations indicated by the shaded grey areas.
Remotesensing 13 03374 g001
Figure 2. The flow chart of this study.
Remotesensing 13 03374 g002
Figure 3. The temperature and precipitation anomalies from 2009 to 2012, compared to the average of 1982–2019, (a) the average temperature anomalies, (b) total precipitation anomalies.
Remotesensing 13 03374 g003
Figure 4. The drought situation identified by SPEI06 in SWC from 2009 to 2012; (ac) are the drought situations identified by the first threshold method, indicating the number of months with no drought, slight drought, and heavy drought, respectively; (d) is the SPEI06 value of the second threshold method; (e) is the severity of drought—red, green, and blue indicate heavy drought, slight drought, and no drought, respectively.
Remotesensing 13 03374 g004
Figure 5. Climate change, dry and wet changes in SWC from 1982 to 2019. (a,d) show temperature change, (b,e) show precipitation change, (c,f) show SPEI change. Red is the change trend before drought (BDT), blue is the change trend after drought (ADT), and green is the long-term trend (LTT).
Remotesensing 13 03374 g005
Figure 6. Annual change trend of vegetation indictors: the gray shaded part is the drought period, (ac) are the annual change trends in the heavy drought area, (df) are the annual change trends in the slight drought area, and (gi) are the annual change trends in the drought-free area; red is the change trend before drought (BDT), blue is the change trend after drought (ADT), and green is the long-term trend (LTT).
Remotesensing 13 03374 g006
Figure 7. The spatial change trend of LAI, EVI, and GPP in SWC. (a1a4), (b1b4), and (c1c4) represent the spatial change trend of LAI, EVI, and GPP, respectively; (a1,b1,c1) are LTT, (a2,b2,c2) are the difference between LTT and BDT; (a3,b3,c3) are the difference between LTT and ADT, and (a4,b4,c4) are the difference between ADT and BDT.
Remotesensing 13 03374 g007
Figure 8. Agricultural and forestry changes in SWC. (af) are agricultural changes, which are crop sown area, crop yield, crop output value, pesticide use, fertilizer use, total power of agricultural machinery, (gi) are forestry changes, which are total afforestation area, artificial afforestation area, and forest area, respectively.
Remotesensing 13 03374 g008
Figure 9. Land-use change in SWC, (a1a3) is land use change from 1980 to 2000, (b1b3) is land use change from 2000 to 2015. (a1,b1) are cropland, (a2,b2) are forest, and (a3,b3) are grassland.
Remotesensing 13 03374 g009
Figure 10. The annual trend regression residuals of vegetation indicators, temperature, and precipitation. (ac) represent LAI, EVI, and GPP respectively; all pixels that do not meet the prerequisites (R2 > 0.3, p < 0.05) and the residuals that are not significant have been removed.
Remotesensing 13 03374 g010
Figure 11. Recovery of vegetation after drought events: I—most of the vegetation was restored; II—only partial vegetation was restored; and III—very little vegetation was restored.
Remotesensing 13 03374 g011
Table 1. Detailed information of the original data representing vegetation indicators in this study.
DatasetSourceSpatial ResolutionTemporal ResolutionTemporal Coverage
LAIGIMMS-LAI3g1/12 degreehalf a month1982–2016
EVIMOD13C20.05 degreemonth2000–present
GPPRevised EC-LUE model0.05 degree8d1982–2017
Table 2. The trend before the drought (BDT), after the drought (ADT), and the long-term trend (LTT) of vegetation indicators.
AreaLAIAnnualEVIAnnualGPPAnnual
Heavy drought1982–20160.0043 **2000–20190.0027 **1982–20165.69 **
1982–20080.0069 **2000–20080.0032 **1982–20089.18 **
1982–20120.0044 **2000–20120.0020 **1982–20126.09 **
Slight drought1982–20160.0084 **2000–20190.0034 **1982–20164.92 **
1982–20080.0074 **2000–20080.0035 **1982–20086.26 **
1982–20120.0067 **2000–20120.0030 **1982–20124.45 **
Drought-free1982–20160.0118 **2000–20190.0039 **1982–20161.68 *
1982–20080.0086 **2000–20080.0035 **1982–20081.28
1982–20120.0093 **2000–20120.0033 **1982–20120.49
Note: ** indicates p < 0.01 and * indicates p < 0.05.
Table 3. Partial correlation between temperature, precipitation, and vegetation indicators in three periods.
LAI-TREVI-TRGPP-TR
1982–20160.72 **2000–20190.55 *1982–20160.69 **
1982–20080.58 **2000–20080.271982–20080.62 **
1982–20120.63 **2000–20120.041982–20120.61 **
LAI-PREVI-PRGPP-PR
1982–20160.212000–20190.411982–20160.56 **
1982–2008−0.022000–20080.161982–20080.46 *
1982–2012−0.132000–2012−0.31982–20120.41 *
Note: ** indicates significant correlation (p < 0.01), * indicates significant correlation (p < 0.05).
Publisher’s Note: MDPI stays neutral with regard to jurisdictional claims in published maps and institutional affiliations.

